Broad-Range Hydrogel-Based pH Sensor with Capacitive Readout Manufactured on a Flexible Substrate

 , , , and
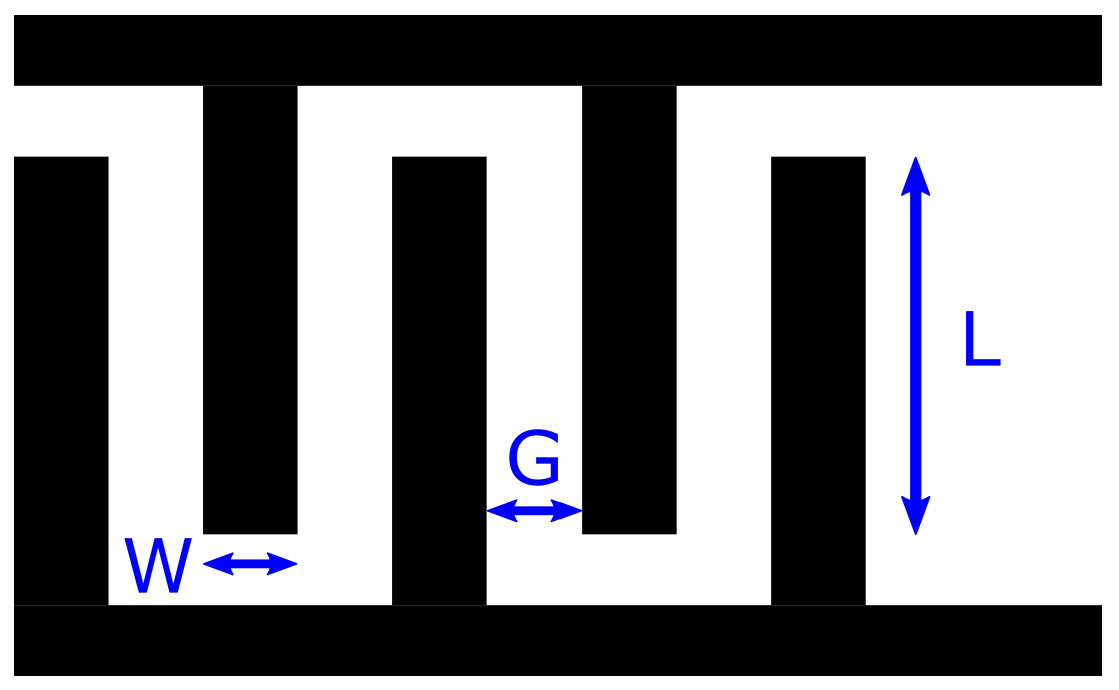
Abstract
1. Introduction
2. Theory
2.1. Interdigital Capacitance Sensors with Hydrogels
- (a)
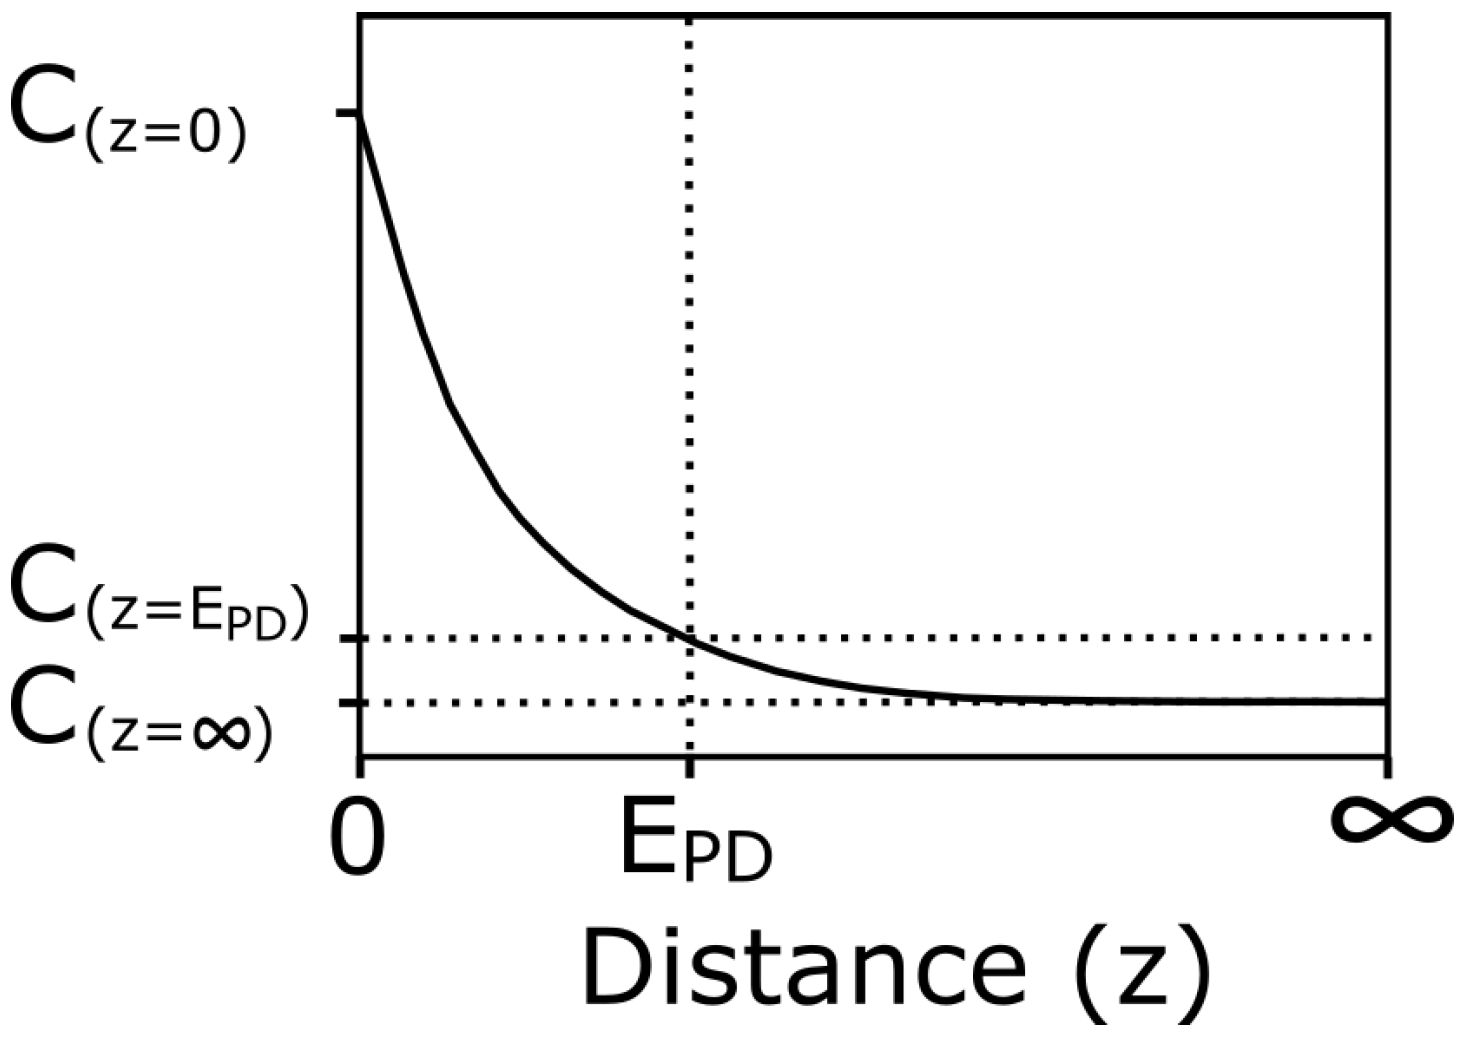
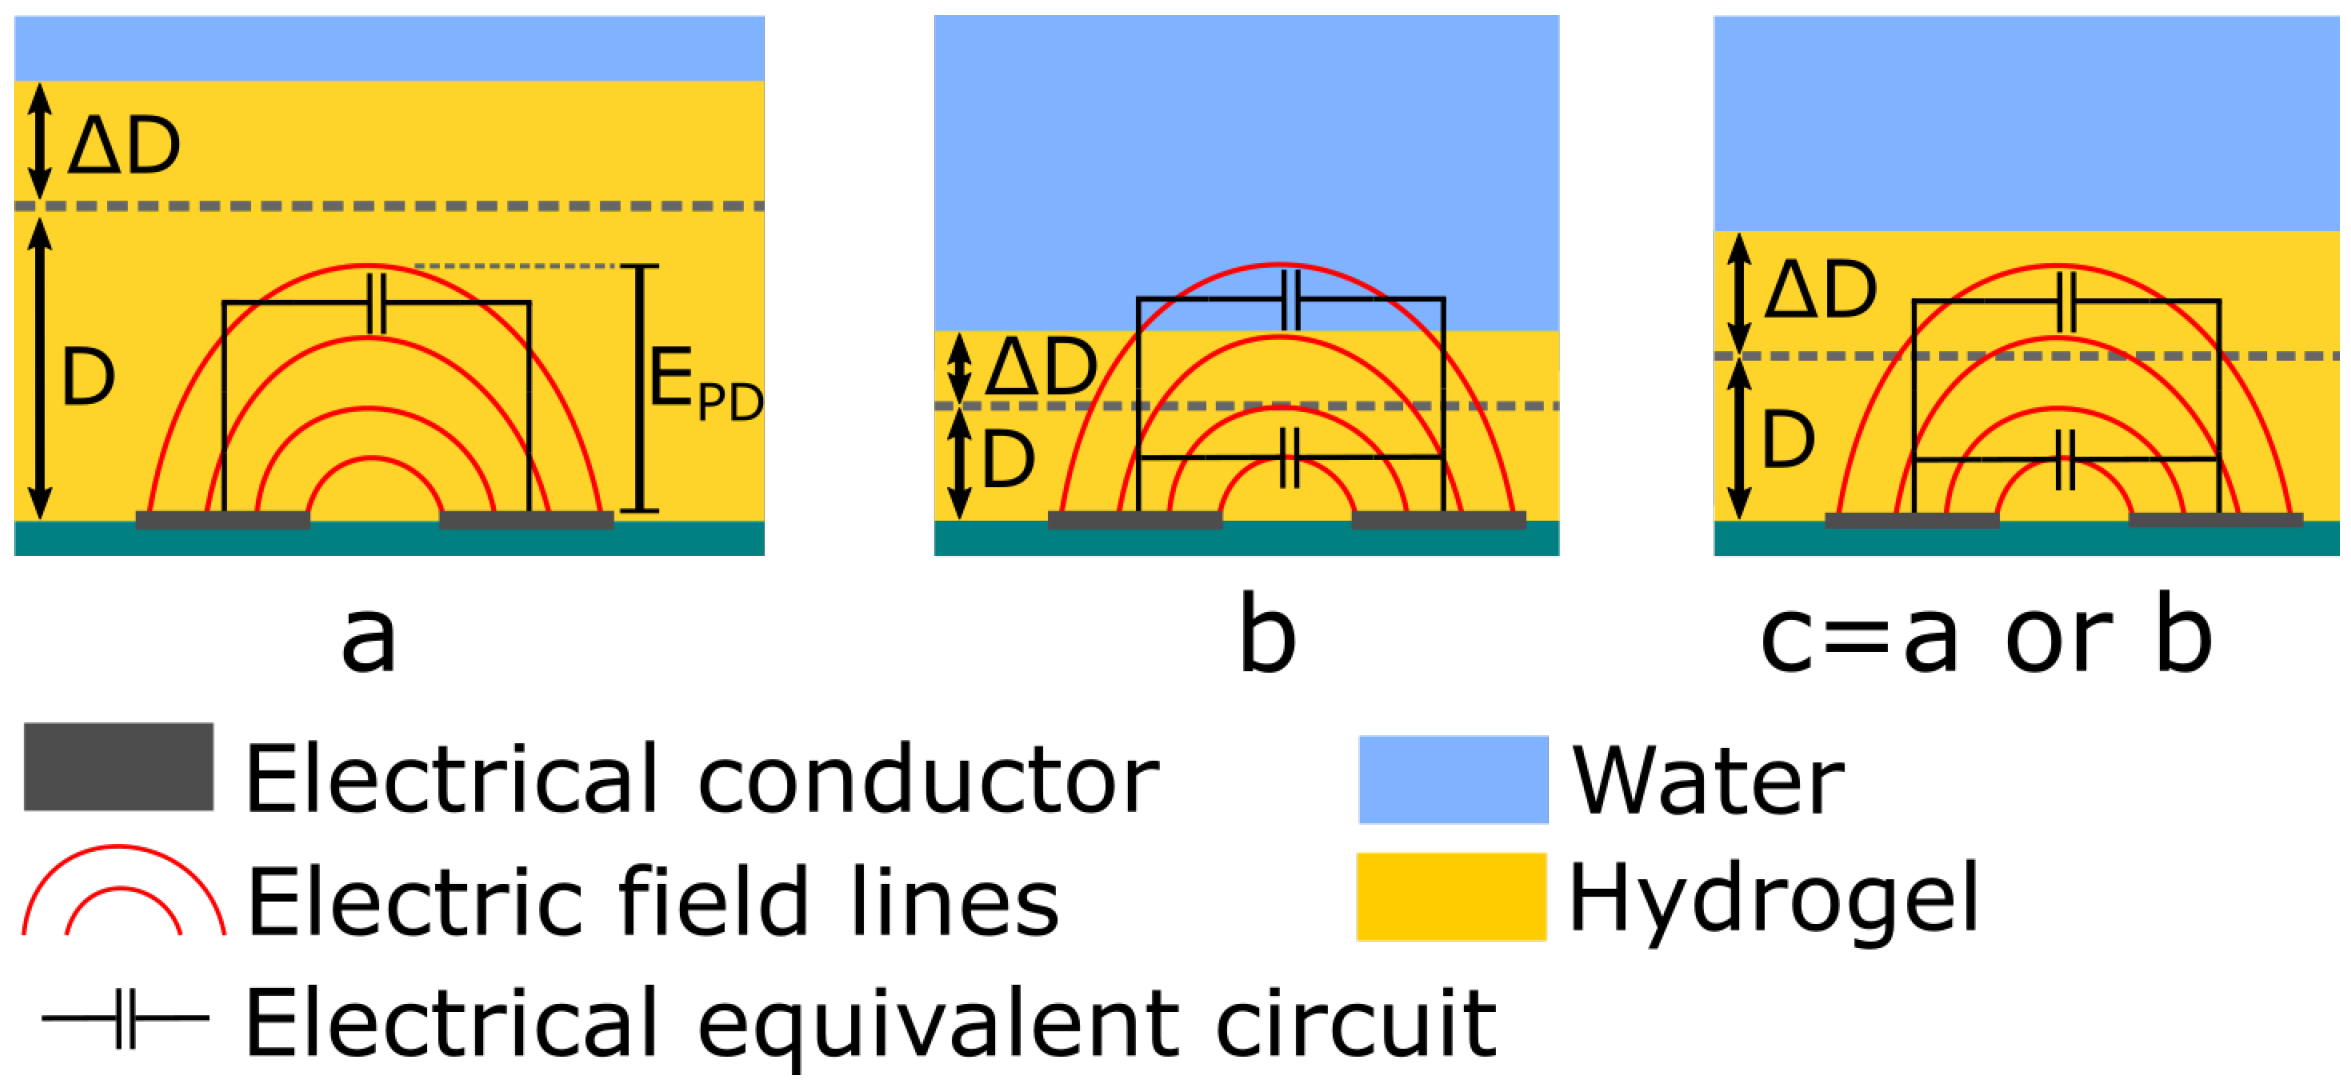
- If < D, the capacitance will be affected only by the permittivity change that occurs in the hydrogel by the uptake or release of water (Figure 3a). The total capacitance will be , where is defined as the capacitance of the hydrogel per unit thickness.
- (b)
- If > , the total capacitance consists of two parts and . The capacitance contribution from is affected by the effective relative permittivity within the hydrogel and is affected from the relative permittivity of the surrounding media (water), see Figure 3b. The total capacitance then becomes , where is defined as the capacitance of the water per unit thickness.
- (c)
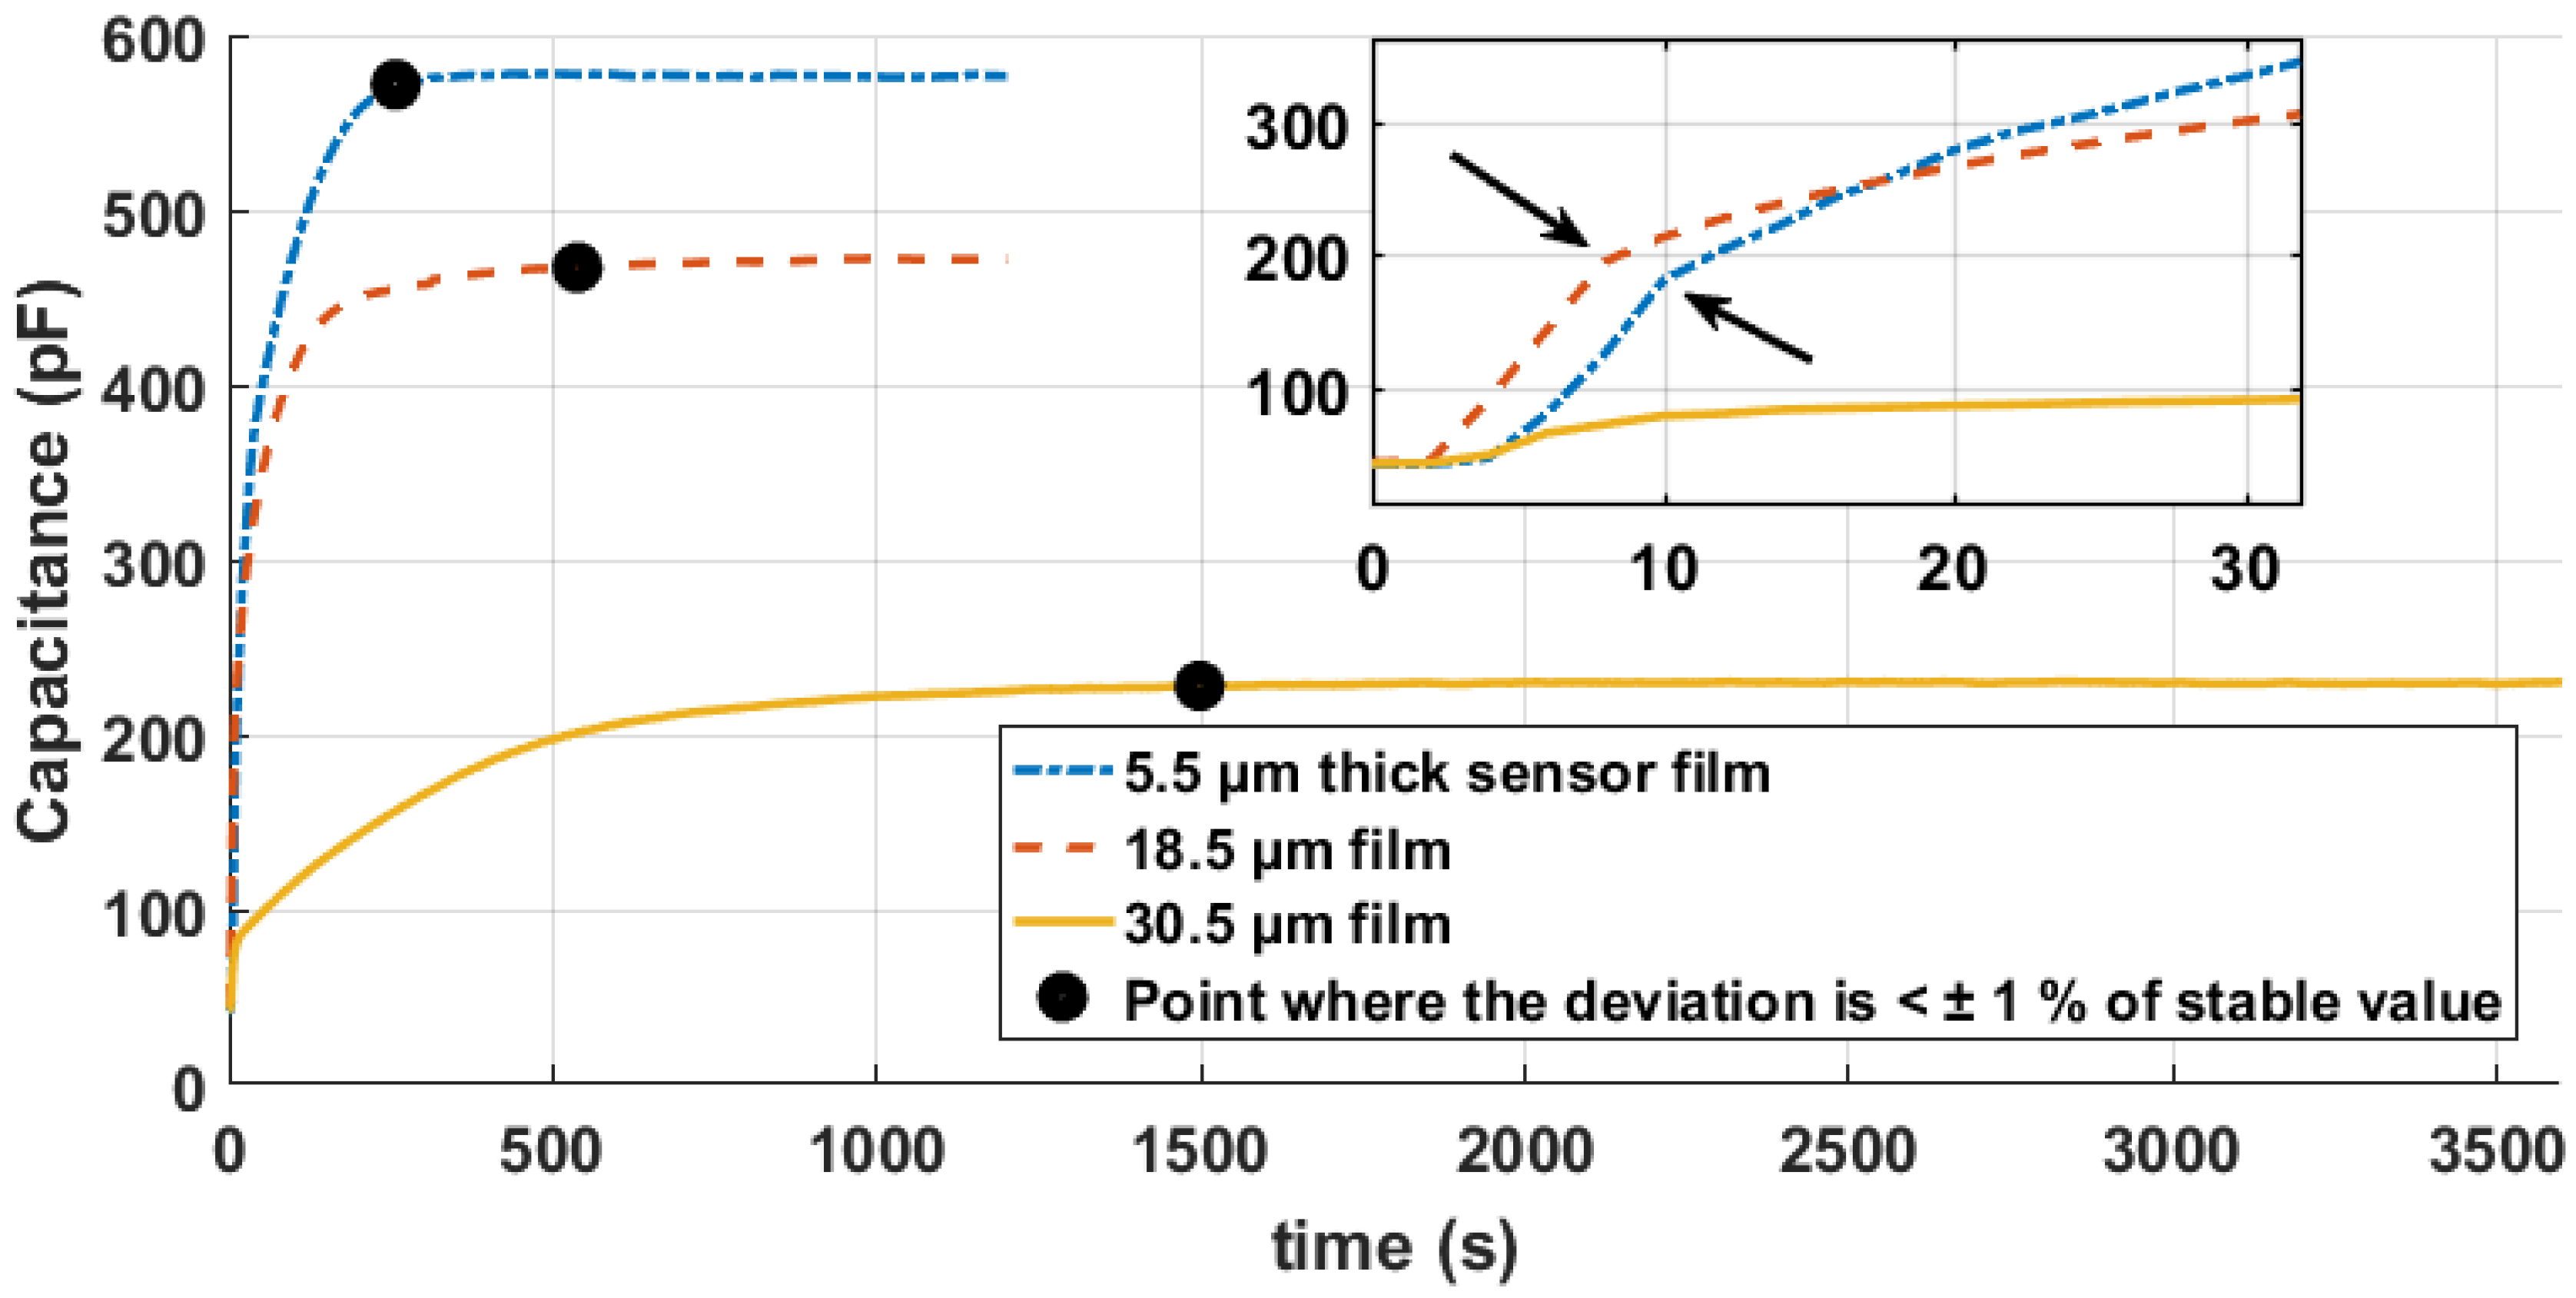
- For the case when and , which means that the thickness of the hydrogel is very close to the depth of the electric field, the capacitance will alternate between cases (a) or (b) depending on the thickness change of the hydrogel, see Figure 3c.
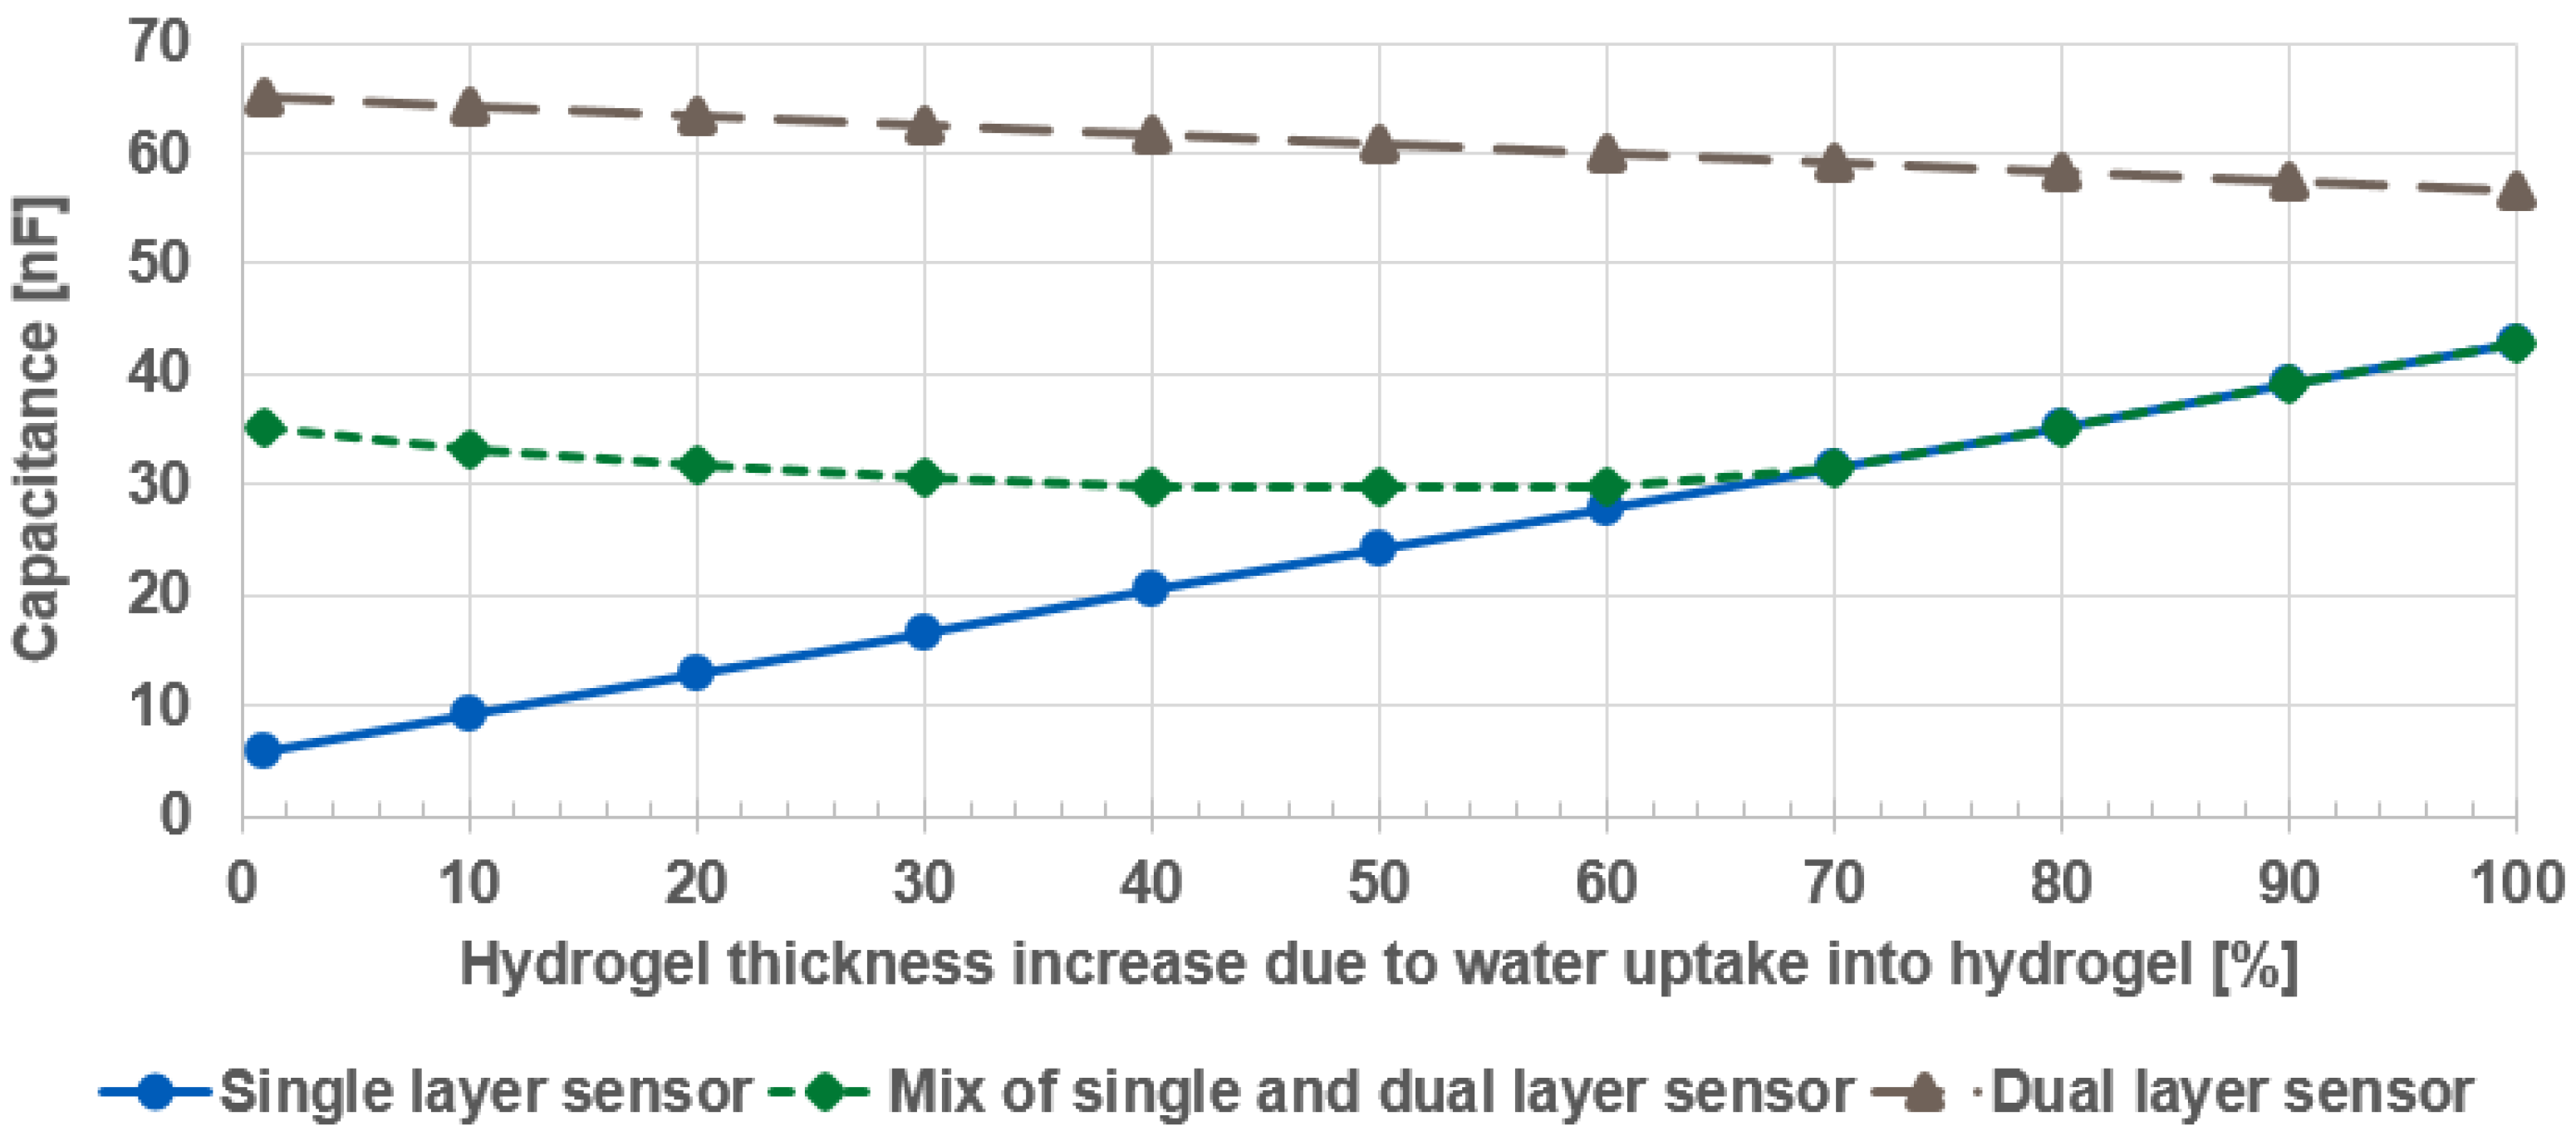
2.2. Simulation
3. Experimental
3.1. Materials
3.2. AOBAE
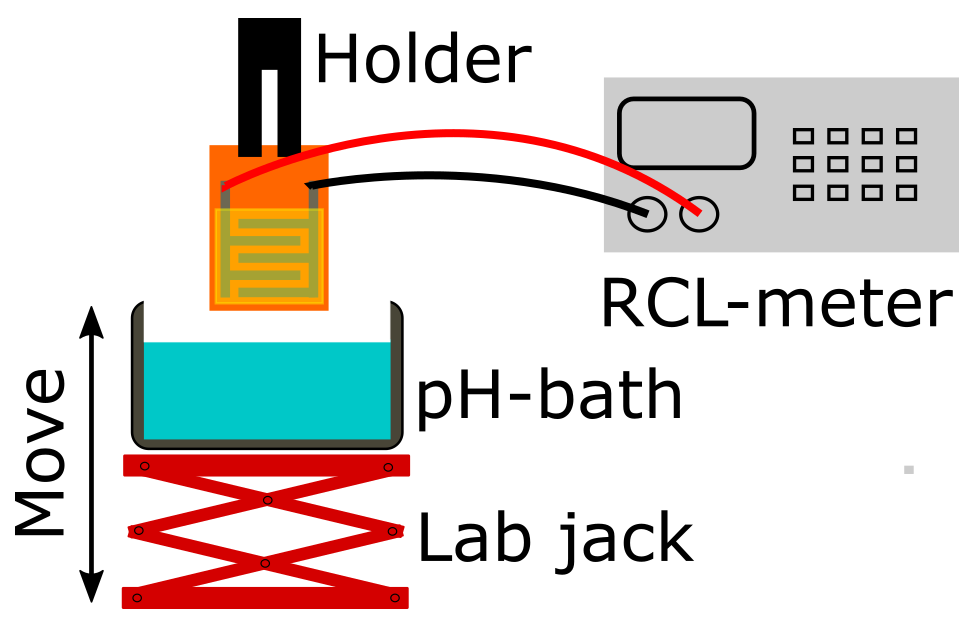
3.3. Instruments and Manufacturing of Sensors
3.4. Capacitance Measurements
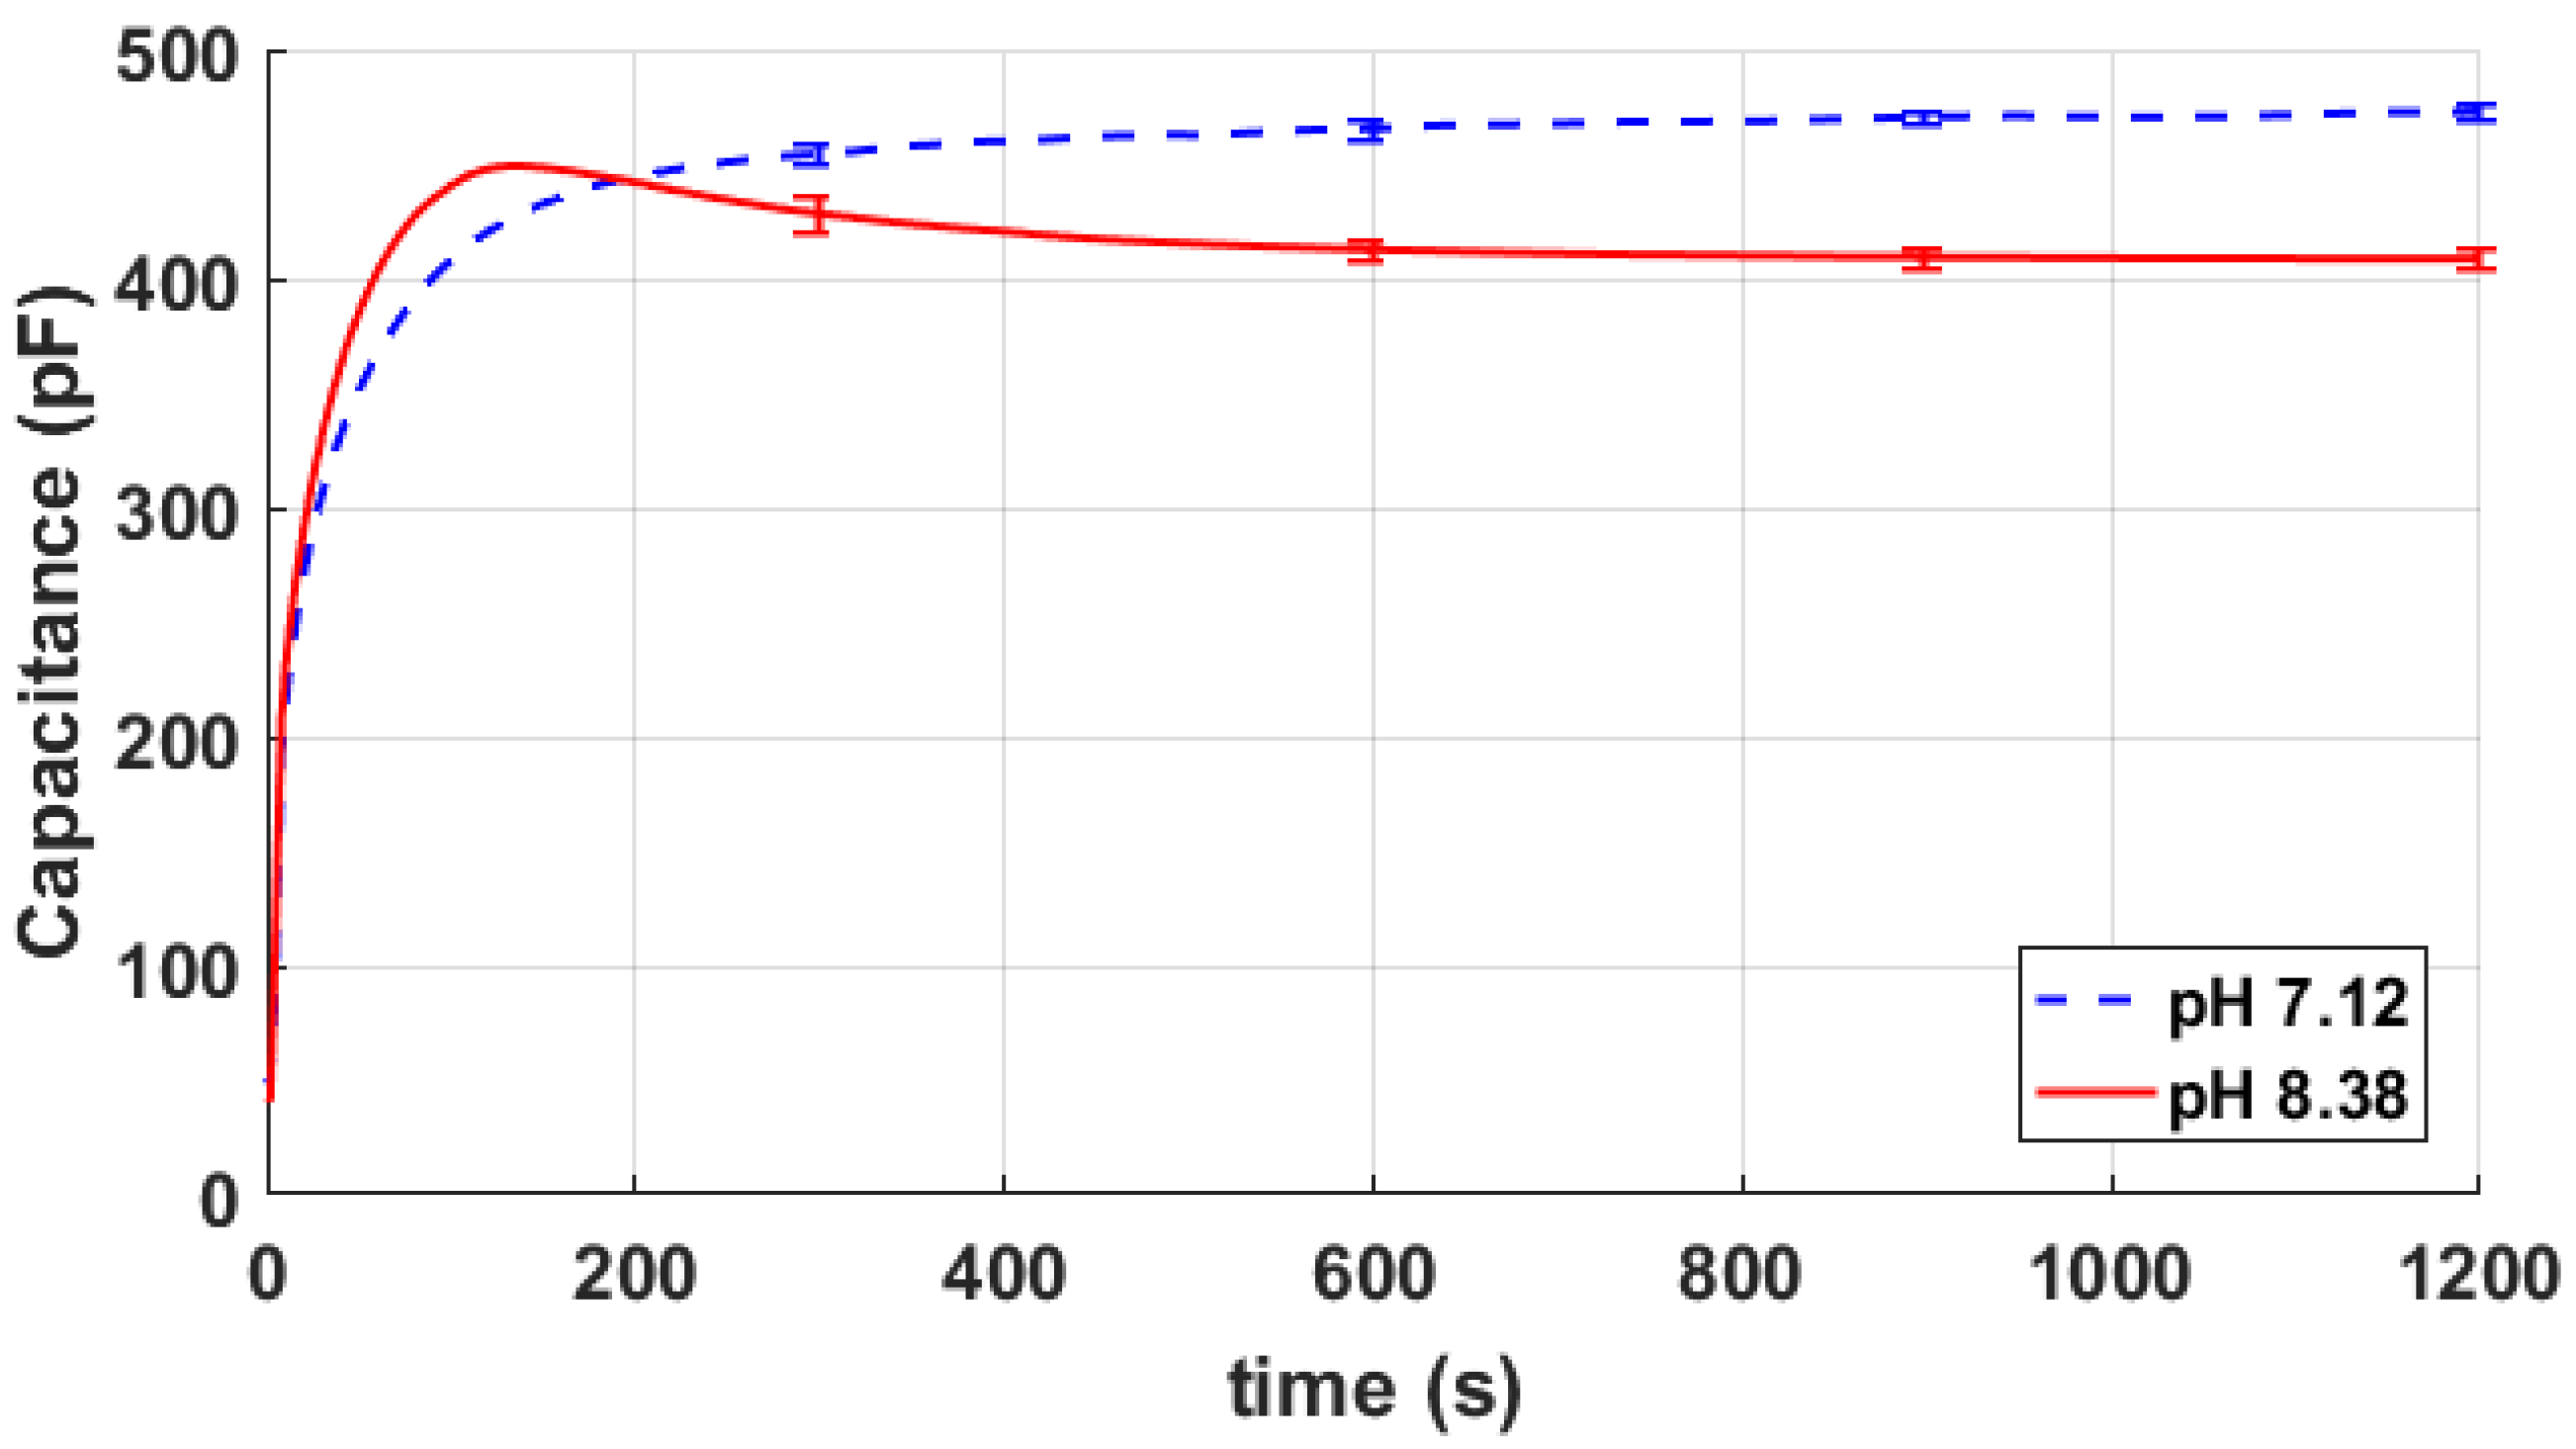
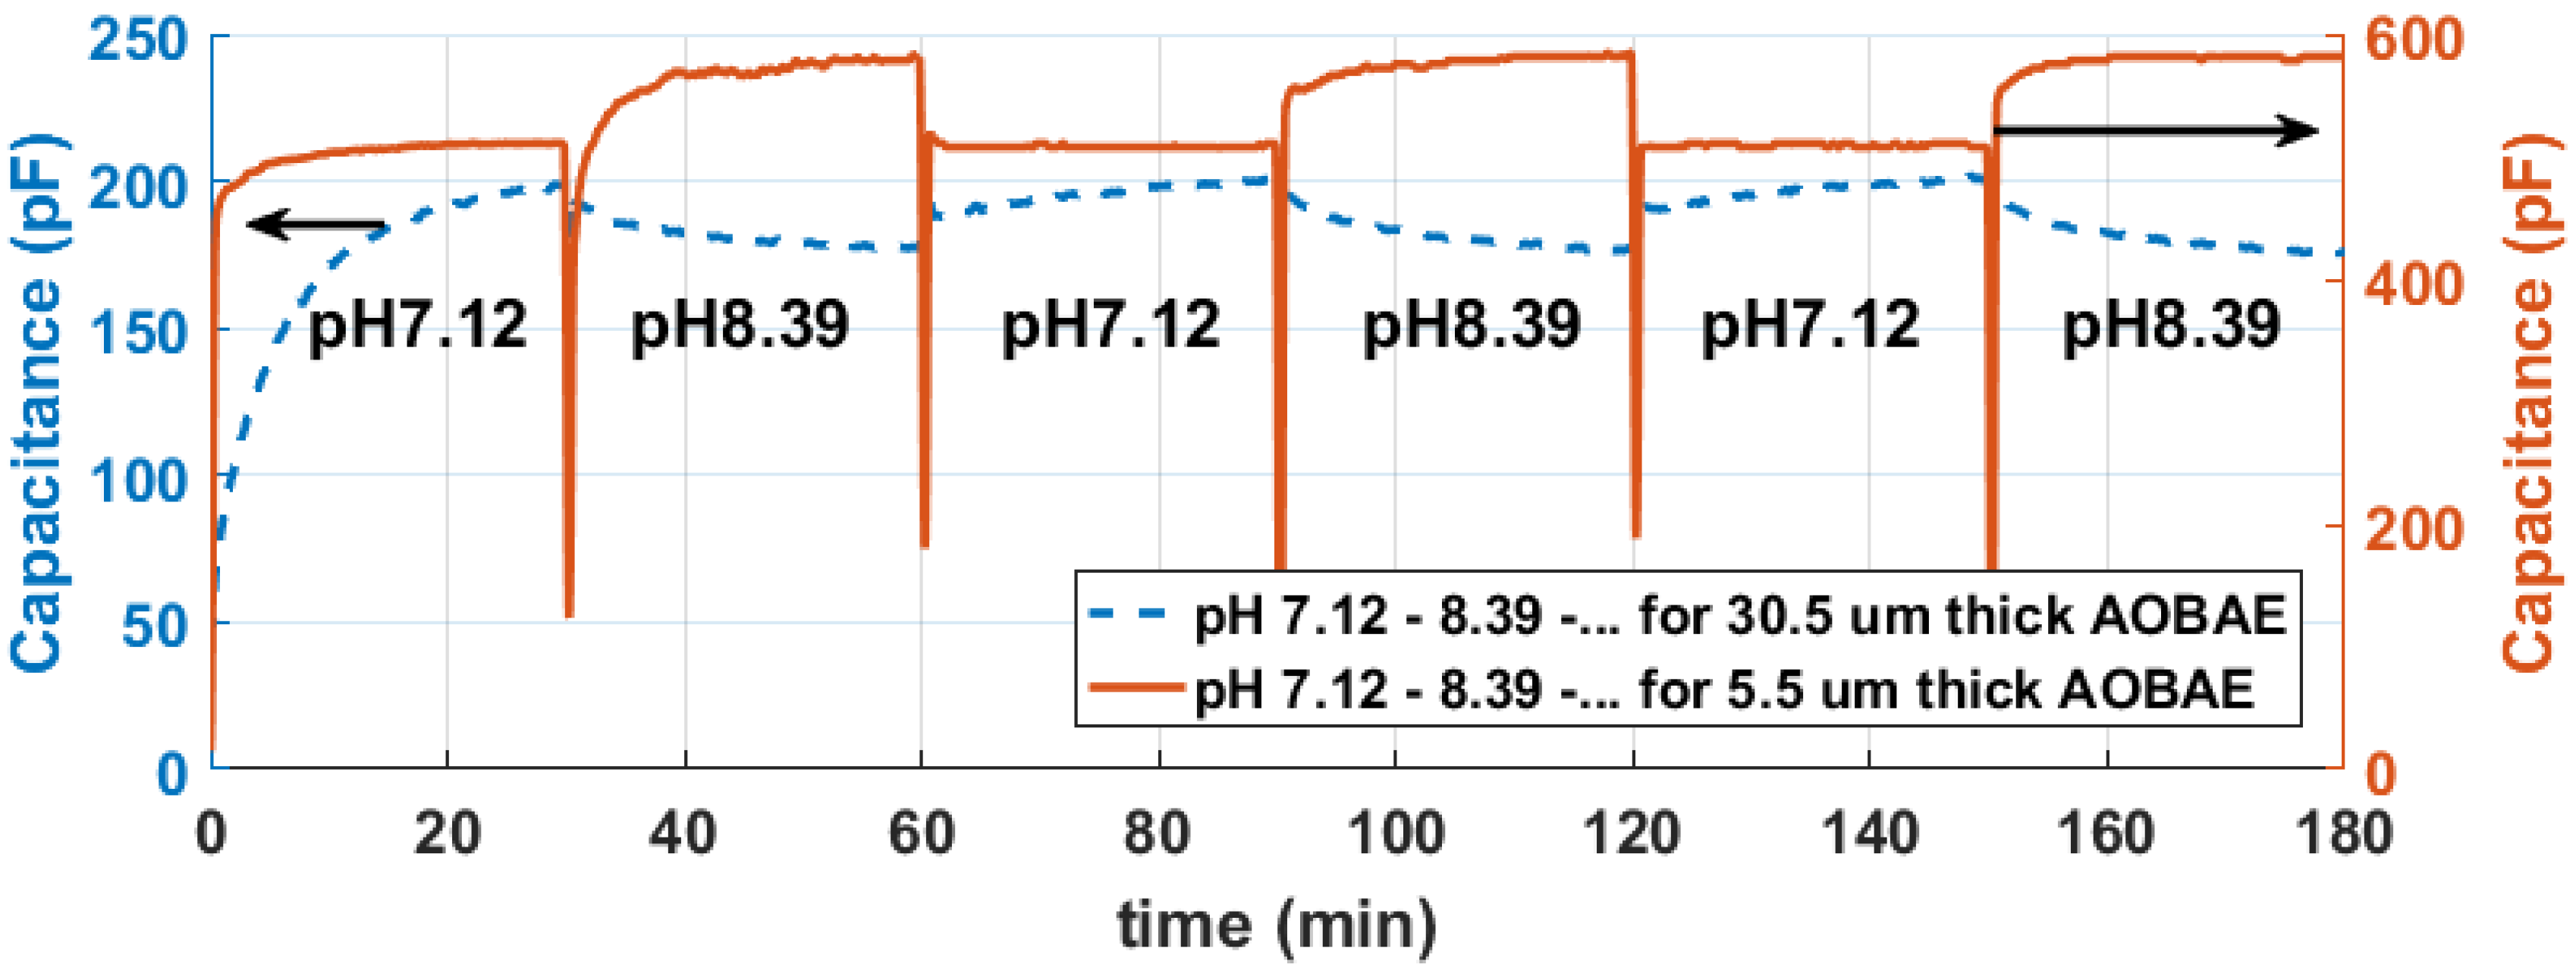
4. Results
5. Discussion
6. Conclusions
Author Contributions
Acknowledgments
Conflicts of Interest
Abbreviations
| AOBAE | Acryl-terminated oligo (-amino ester) |
| BDDA | Butanediol diacrylate |
| PIP | Piperazine |
| TPO | Diphenyl(2,4,6-trimethylbenzoyl)phosphine oxide |
| BRB | Britton-Robinson buffer |
Appendix A. Simulation
References
- Dimpe, K.M.; Nomngongo, P.N. Current sample preparation methodologies for analysis of emerging pollutants in different environmental matrices. TrAC Trends Anal. Chem. 2016, 82, 199–207. [Google Scholar] [CrossRef]
- Dehua, W.; Pan, L.; Bo, L.; Zeng, G. Water quality automatic monitoring system based on GPRS data communications. Procedia Eng. 2012, 28, 840–843. [Google Scholar] [CrossRef]
- Luo, X.; Yang, J.; Chai, L. Water pollution source detection in wireless sensor networks. In Proceedings of the 2015 IEEE International Conference on Information and Automation, Lijiang, China, 8–10 August 2015; pp. 2311–2315. [Google Scholar] [CrossRef]
- Yang, X.; Ong, K.G.; Dreschel, W.R.; Zeng, K.; Mungle, C.S.; Grimes, C.A. Design of a wireless sensor network for long-term, in-situ monitoring of an aqueous environment. Sensors 2002, 2, 455–472. [Google Scholar] [CrossRef]
- Lukman, S.; Essa, M.; Mu’azu, N.D.; Bukhari, A.; Basheer, C. Adsorption and desorption of heavy metals onto natural clay material: influence of initial pH. J. Environ. Sci. Technol. 2013, 6, 1–5. [Google Scholar] [CrossRef]
- Balintova, M.; Petrilakova, A.; Singovszka, E. Study of metals distribution between water and sediment in the Smolnik Creek (Slovakia) contaminated by acid mine drainage. Chem. Eng. Trans. 2012, 28, 73–78. [Google Scholar]
- Pastor, J.; Hernández, A.J. Heavy metals, salts and organic residues in old solid urban waste landfills and surface waters in their discharge areas: Determinants for restoring their impact. J. Environ. Manag. 2012, 95, S42–S49. [Google Scholar] [CrossRef] [PubMed]
- Wu, Q.; Leung, J.Y.; Geng, X.; Chen, S.; Huang, X.; Li, H.; Huang, Z.; Zhu, L.; Chen, J.; Lu, Y. Heavy metal contamination of soil and water in the vicinity of an abandoned e-waste recycling site: Implications for dissemination of heavy metals. Sci. Total Environ. 2015, 506, 217–225. [Google Scholar] [CrossRef] [PubMed]
- Zheng, J.; Chen, K.h.; Yan, X.; Chen, S.J.; Hu, G.C.; Peng, X.W.; Yuan, J.G.; Mai, B.X.; Yang, Z.Y. Heavy metals in food, house dust, and water from an e-waste recycling area in South China and the potential risk to human health. Ecotoxicol. Environ. Saf. 2013, 96, 205–212. [Google Scholar] [CrossRef] [PubMed]
- Connell, D.W.; Miller, G.J. Chemistry and Ecotoxicology of Pollution; John Wiley & Sons: Hoboken, NJ, USA, 1984; Volume 65. [Google Scholar]
- Khan, M.I.; Mukherjee, K.; Shoukat, R.; Dong, H. A review on pH sensitive materials for sensors and detection methods. Microsyst. Technol. 2017, 23, 4391–4404. [Google Scholar] [CrossRef]
- Huang, W.D.; Cao, H.; Deb, S.; Chiao, M.; Chiao, J.C. A flexible pH sensor based on the iridium oxide sensing film. Sens. Actuators A Phys. 2011, 169, 1–11. [Google Scholar] [CrossRef]
- Kaempgen, M.; Roth, S. Transparent and flexible carbon nanotube/polyaniline pH sensors. J. Electroanal. Chem. 2006, 586, 72–76. [Google Scholar] [CrossRef]
- Gerlach, G.; Guenther, M.; Sorber, J.; Suchaneck, G.; Arndt, K.F.; Richter, A. Chemical and pH sensors based on the swelling behavior of hydrogels. Sens. Actuators B Chem. 2005, 111, 555–561. [Google Scholar] [CrossRef]
- Hammarling, K.; Sandberg, M.; Engholm, M.; Andersson, H.; Nilsson, H.E. Synthesis, Curing Behavior and Swell Tests of pH-Responsive Coatings from Acryl-Terminated Oligo (β-Amino Esters). Chemosensors 2018, 6, 10. [Google Scholar] [CrossRef]
- Mamishev, A.V.; Sundara-Rajan, K.; Yang, F.; Du, Y.; Zahn, M. Interdigital sensors and transducers. Proc. IEEE 2004, 92, 808–845. [Google Scholar] [CrossRef]
- Ong, J.B.; You, Z.; Mills-Beale, J.; Tan, E.L.; Pereles, B.D.; Ong, K.G. A wireless, passive embedded sensor for real-time monitoring of water content in civil engineering materials. IEEE Sens. J. 2008, 8, 2053–2058. [Google Scholar] [CrossRef]
- Kim, J.S.; Lee, D.G. Analysis of dielectric sensors for the cure monitoring of resin matrix composite materials. Sens. Actuators B Chem. 1996, 30, 159–164. [Google Scholar]
- Ong, K.G.; Grimes, C.; Robbins, C.; Singh, R. Design and application of a wireless, passive, resonant-circuit environmental monitoring sensor. Sens. Actuators A Phys. 2001, 93, 33–43. [Google Scholar] [CrossRef]
- Steindl, R.; Pohl, A.; Seifert, F. Impedance loaded SAW sensors offer a wide range of measurement opportunities. IEEE Trans. Microw. Theory Tech. 1999, 47, 2625–2629. [Google Scholar] [CrossRef]
- Igreja, R.; Dias, C. Analytical evaluation of the interdigital electrodes capacitance for a multi-layered structure. Sens. Actuators A Phys. 2004, 112, 291–301. [Google Scholar] [CrossRef]
- Von Guggenberg, P.; Zaretsky, M. Estimation of one-dimensional complex-permittivity profiles: A feasibility study. J. Electrostat. 1995, 34, 263–277. [Google Scholar] [CrossRef]
- Ngo, T.T.; Bourjilat, A.; Claudel, J.; Kourtiche, D.; Nadi, M. Design and realization of a planar interdigital microsensor for biological medium characterization. In Next Generation Sensors and Systems; Springer: Basel, Switzerland, 2016; pp. 23–54. [Google Scholar]
- Starzyk, F. Parametrisation of interdigit comb capacitor for dielectric impedance spectroscopy. Arch. Mater. Sci. Eng. 2008, 34, 31–34. [Google Scholar]
- Li, X.B.; Larson, S.D.; Zyuzin, A.S.; Mamishev, A.V. Design principles for multichannel fringing electric field sensors. IEEE Sens. J. 2006, 6, 434–440. [Google Scholar] [CrossRef]
- Puers, R. Capacitive sensors: When and how to use them. Sens. Actuators A Phys. 1993, 37, 93–105. [Google Scholar] [CrossRef]
- Richter, A.; Paschew, G.; Klatt, S.; Lienig, J.; Arndt, K.F.; Adler, H.J.P. Review on hydrogel-based pH sensors and microsensors. Sensors 2008, 8, 561–581. [Google Scholar] [CrossRef] [PubMed]
- Deligkaris, K.; Tadele, T.S.; Olthuis, W.; van den Berg, A. Hydrogel-based devices for biomedical applications. Sens. Actuators B Chem. 2010, 147, 765–774. [Google Scholar] [CrossRef]
- Tokarev, I.; Minko, S. Stimuli-responsive hydrogel thin films. Soft Matter 2009, 5, 511–524. [Google Scholar] [CrossRef]
- Richter, A. Hydrogels for actuators. In Hydrogel Sensors and Actuators; Springer Science & Business Media: Berlin, Germany, 2009; pp. 221–248. [Google Scholar]
- Banna, M.H.; Imran, S.; Francisque, A.; Najjaran, H.; Sadiq, R.; Rodriguez, M.; Hoorfar, M. Online drinking water quality monitoring: Review on available and emerging technologies. Crit. Rev. Environ. Sci. Technol. 2014, 44, 1370–1421. [Google Scholar] [CrossRef]
- Rahman, M.S.A.; Mukhopadhyay, S.C.; Yu, P.L. Novel planar interdigital sensors. In Novel Sensors for Food Inspection: Modelling, Fabrication and Experimentation; Springer: Berlin, Germany, 2014; pp. 11–35. [Google Scholar]
- Mamishev, A.V.; Lesieutre, B.C.; Zahn, M. Optimization of multi-wavelength interdigital dielectrometry instrumentation and algorithms. IEEE Trans. Dielectr. Electr. Insul. 1998, 5, 408–420. [Google Scholar] [CrossRef]
- Mamishev, A.V.; Du, Y.; Bau, J.H.; Lesieutre, B.C.; Zahn, M. Evaluation of diffusion-driven material property profiles using three-wavelength interdigital sensor. IEEE Trans. Dielectr. Electr. Insul. 2001, 8, 785–798. [Google Scholar] [CrossRef]
- Britton, H.T.S.; Robinson, R.A. CXCVIII.—Universal buffer solutions and the dissociation constant of veronal. J. Chem. Soc. 1931, 0, 1456–1462. [Google Scholar] [CrossRef]
- Dorf, R.C. Electronics, Power Electronics, Optoelectronics, Microwaves, Electromagnetics, and Radar; CRC Press: Boca Raton, FL, USA, 2006. [Google Scholar]
- Tanaka, T.; Fillmore, D.J. Kinetics of swelling of gels. J. Chem. Phys. 1979, 70, 1214–1218. [Google Scholar] [CrossRef]
- Lesho, M.J.; Sheppard, N.F., Jr. A method for studying swelling kinetics based on measurement of electrical conductivity. Polym. Gels Netw. 1998, 5, 503–523. [Google Scholar] [CrossRef]


© 2018 by the authors. Licensee MDPI, Basel, Switzerland. This article is an open access article distributed under the terms and conditions of the Creative Commons Attribution (CC BY) license (http://creativecommons.org/licenses/by/4.0/).
Share and Cite
Hammarling, K.; Engholm, M.; Andersson, H.; Sandberg, M.; Nilsson, H.-E. Broad-Range Hydrogel-Based pH Sensor with Capacitive Readout Manufactured on a Flexible Substrate. Chemosensors 2018, 6, 30. https://doi.org/10.3390/chemosensors6030030
Hammarling K, Engholm M, Andersson H, Sandberg M, Nilsson H-E. Broad-Range Hydrogel-Based pH Sensor with Capacitive Readout Manufactured on a Flexible Substrate. Chemosensors. 2018; 6(3):30. https://doi.org/10.3390/chemosensors6030030
Chicago/Turabian StyleHammarling, Krister, Magnus Engholm, Henrik Andersson, Mats Sandberg, and Hans-Erik Nilsson. 2018. "Broad-Range Hydrogel-Based pH Sensor with Capacitive Readout Manufactured on a Flexible Substrate" Chemosensors 6, no. 3: 30. https://doi.org/10.3390/chemosensors6030030
APA StyleHammarling, K., Engholm, M., Andersson, H., Sandberg, M., & Nilsson, H.-E. (2018). Broad-Range Hydrogel-Based pH Sensor with Capacitive Readout Manufactured on a Flexible Substrate. Chemosensors, 6(3), 30. https://doi.org/10.3390/chemosensors6030030