Article

A Novel Conductometric Methanol Sensor Based on Green-Synthesized Fe3O4-Nanoparticles

by
Sabri Ouni
1,2,
Eslam Elkalla
1,
Sumera Khizar
1,
Abdelhamid Elaissari
1,
Abdelhamid Errachid
1 and
Nicole Jaffrezic-Renault
3,*
1
Institute of Analytical Sciences, University of Lyon, 69100 Villeurbanne, France
2
Research Laboratory on Heteroepitaxy and Applications, University of Monastir, Monastir 5000, Tunisia
3
UTINAM Institute, University Marie et Louis Pasteur, 25030 Besançon, France
*
Author to whom correspondence should be addressed.
Chemosensors 2026, 14(4), 90; https://doi.org/10.3390/chemosensors14040090
Submission received: 4 February 2026 / Revised: 23 March 2026 / Accepted: 31 March 2026 / Published: 3 April 2026

Abstract

Methanol (MeOH) is widely used in industry and is highly toxic when ingested. In this work, a new micro-conductometric transducer is functionalized with magnetic Fe3O4 nanoparticles capped with Artemisia Herba Alba (AHA) extract. The resulting AHA-Fe3O4 nanoparticles, crystallized in the cubic spinel phase, exhibit an average crystallite size of 6 nm. These nanoparticles were homogeneously dispersed within an electrodeposited chitosan film on interdigitated electrodes for conductometric measurements. The gas-sensing behavior of the films was evaluated at room temperature toward methanol, ethanol, and acetone vapors. For methanol, the sensor shows response times (tRes) ranging from 9 to 12 s depending on the analyte concentration, with a detection limit of 600 ppm in the gas phase. The methanol sensor presents a sensitivity 30 times lower for acetone and 3.7 times lower for ethanol. The sensor exhibited stable detection sensitivity over two months, under intermittent storage at 4 °C. Methanol was detected in the headspace of commercial product samples, in good agreement with the producer’s value.

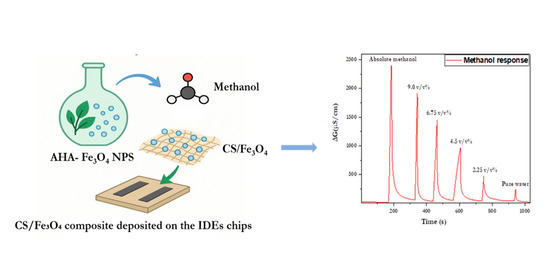
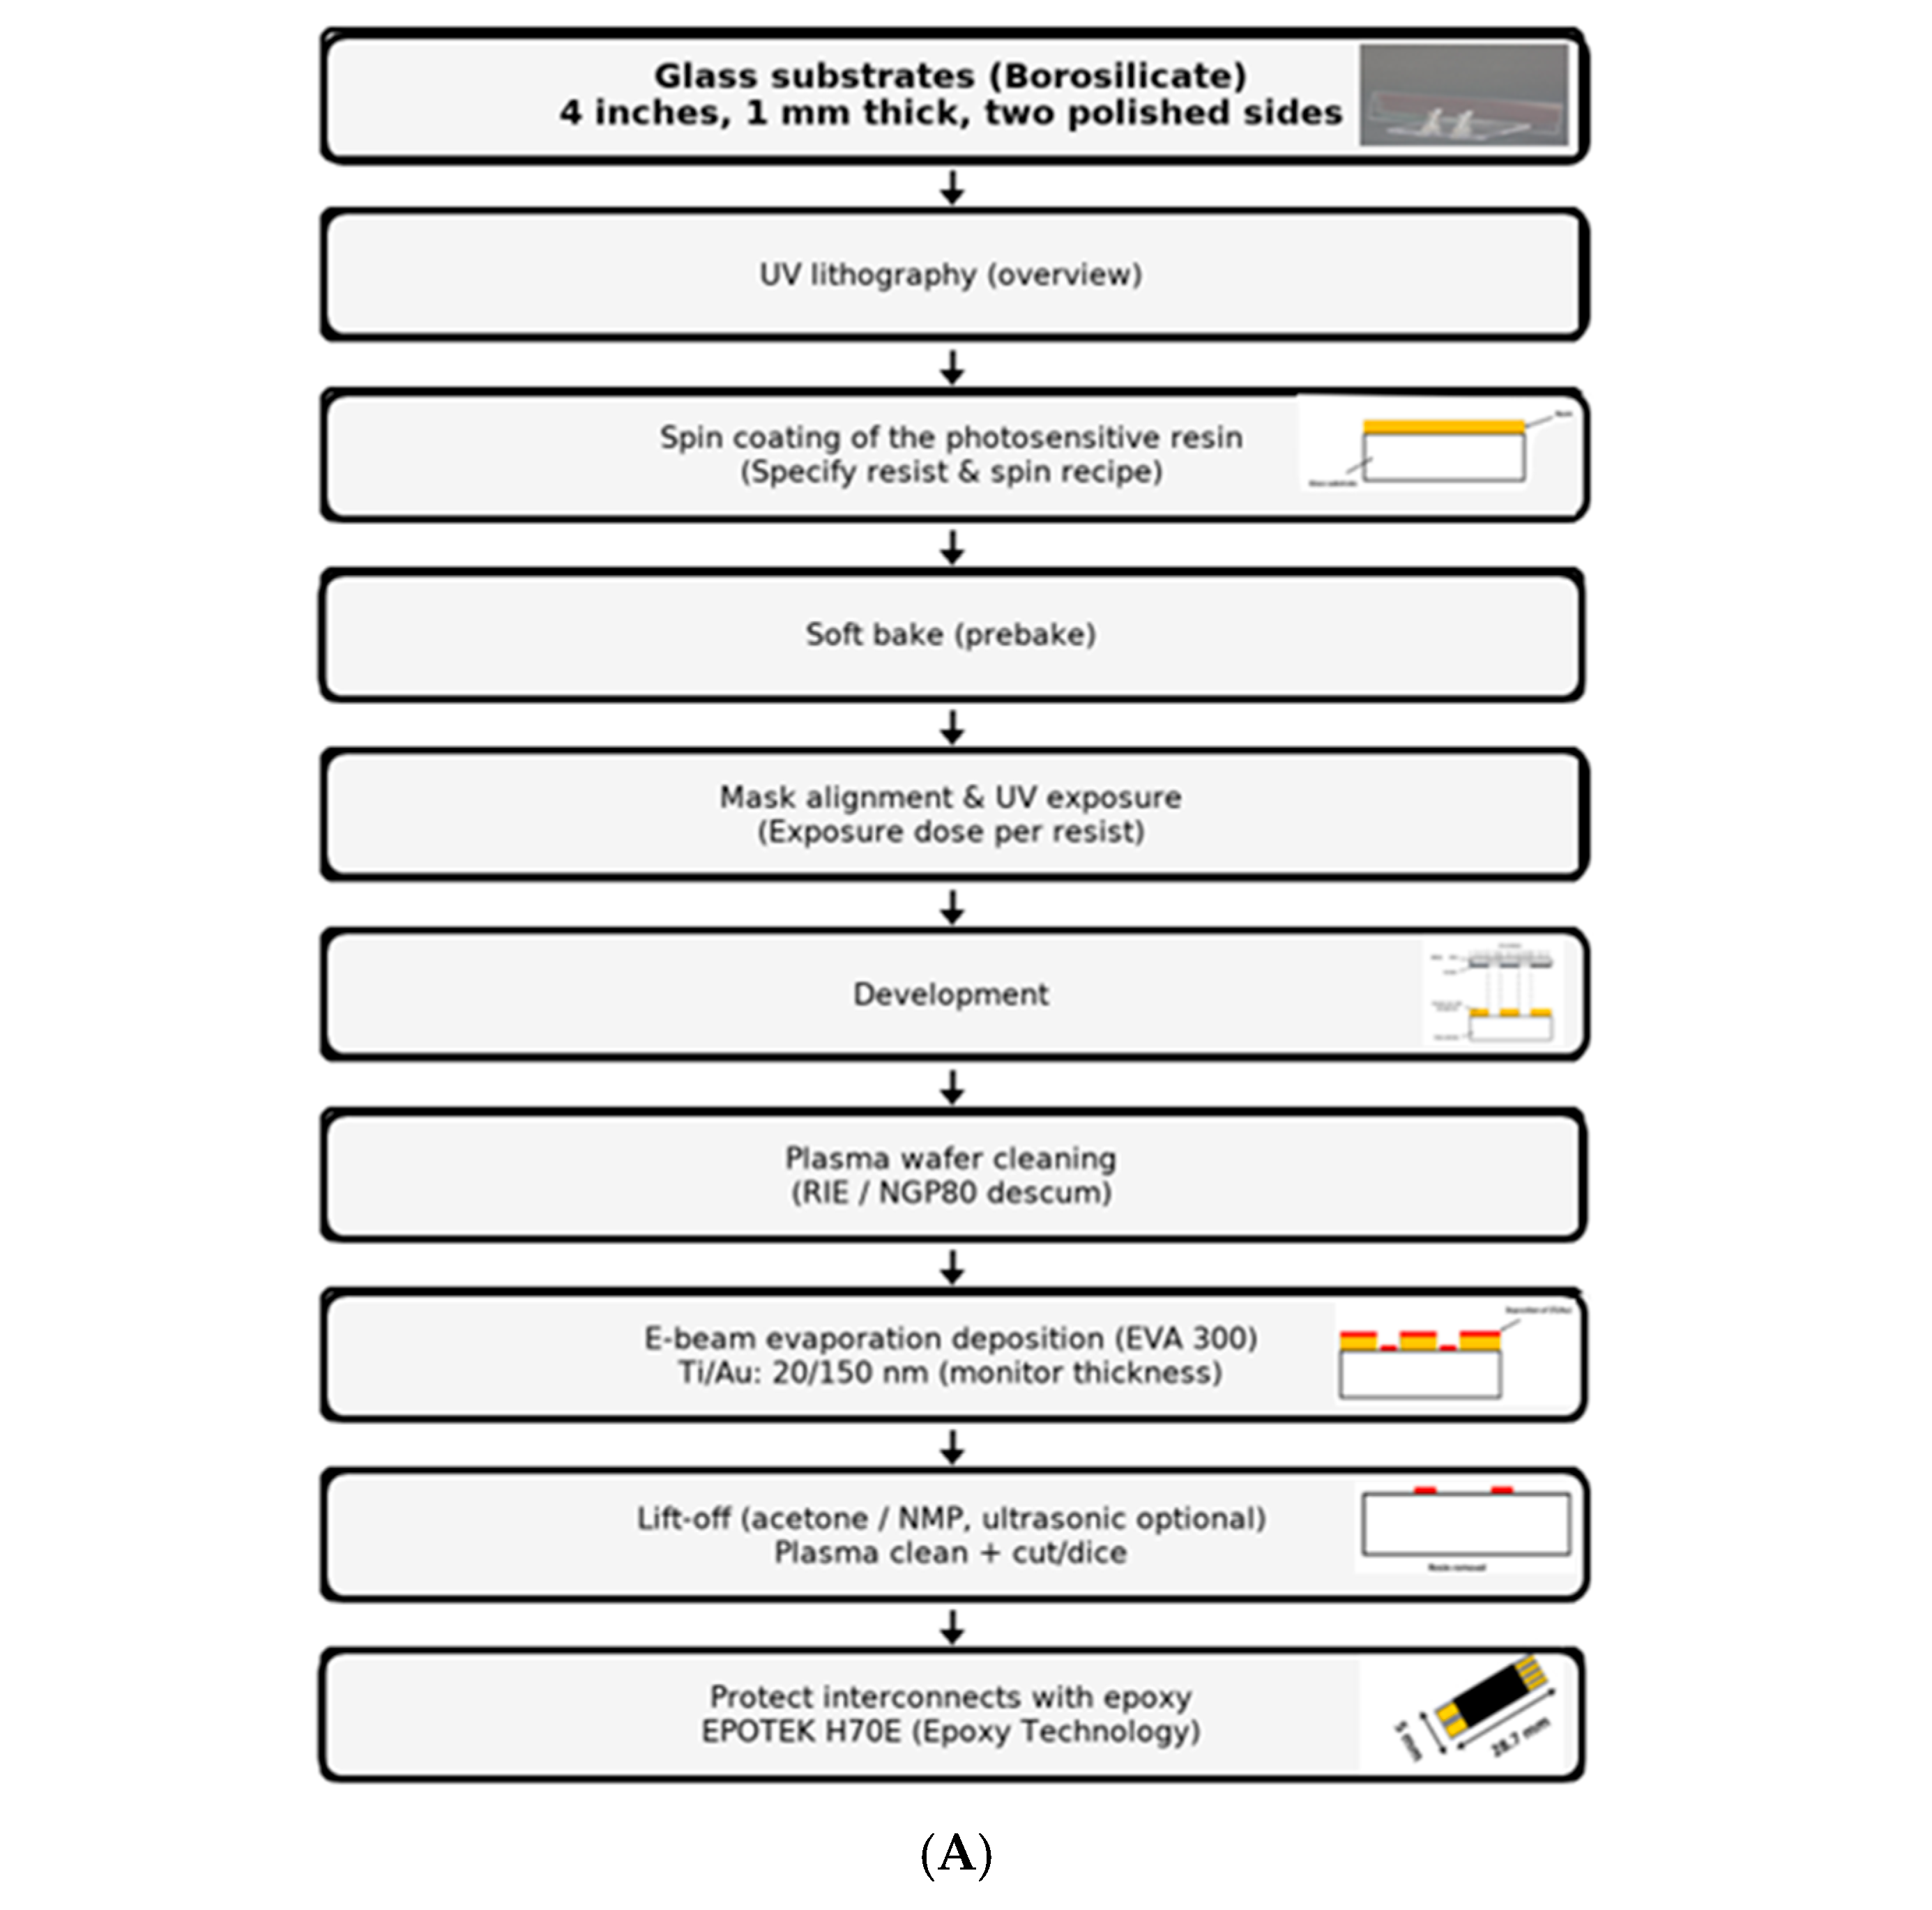
Graphical Abstract

1. Introduction

Methanol is one of the most important industrial chemicals used globally in a broad range of applications, including chemical synthesis, pharmaceutical formulation, antifreeze solutions, paint manufacturing, and renewable energy systems [1,2,3,4]. Its efficiency as a solvent and its function as a crucial raw material in the synthesis of formaldehyde, acetic acid, and other fine chemicals are the reasons behind its rising demand throughout industrial sectors [5,6]. Methanol has significant toxicological risks despite these benefits. Severe health consequences, including metabolic acidosis, central nervous system depression, visual abnormalities, and, in severe cases, permanent blindness or death, can result from even low-level exposure [7]. Methanol vapor inhalation in inadequately ventilated settings is still a serious risk in production facilities, storage facilities, and laboratories [8]. Therefore, it is crucial to detect methanol quickly and accurately to protect people, avoid unintentional poisoning and contaminating the environment. The creation of sensitive, selective, and reliable methanol sensors has received a lot of interest lately due to these safety concerns. Optical, catalytic, electrochemical, piezoelectric, and semiconductor-based sensing technologies have all been investigated [9,10,11]. Despite the great sensitivity and precision of many of these methods, their general application is limited by their complicated equipment, high energy consumption, or expensive manufacturing stages [12]. Conversely, the structural simplicity, low manufacturing cost, quick reaction, and interoperability with portable detection systems of conductometric gas sensors have made them a desirable substitute [13]. When a sensitive substance (AHA-ZnS) interacts with gas molecules, these sensors track changes in electrical conductivity. However, the physicochemical characteristics of the active sensing layer play a major role in determining how effective such sensors are. The development of sophisticated nanostructured materials that can increase gas-material interactions and sensing performance has therefore been the focus of significant research efforts [14,15].
Magnetic nanoparticles, carbon-based nanostructures, and metal oxides have shown great promise in increasing sensitivity and selectivity toward different gases [16,17,18]. Magnetite (Fe3O4) nanoparticles present a remarkable chemical stability, a large surface area, strong electron mobility, and special magnetic properties [19]. Compared to ZnS, their band gap is narrower (2.08 eV compared to 3.5 eV), which allows for higher conductivity. Fe3O4 is an excellent electrocatalyst for the oxygen reduction reaction, due to its high affinity for oxygen [20]. When compared to AHA-ZnS, oxygen is not adsorbed on the ZnS crystal itself but on its vacancies [21], leading to a lower adsorption density. Fe3O4 nanoparticles may be produced using a variety of methods, such as co-precipitation, thermal decomposition, microemulsion techniques, and hydrothermal procedures, in addition to their functional advantages [22,23,24]. However, a lot of traditional synthesis techniques rely on dangerous substances, high reaction temperatures, or energy-intensive settings, which cause problems for the environment and the economy [25].
Green synthesis techniques, which make use of microbes, plant extracts, or ecologically safe reducing agents, have become viable substitutes over the past ten years. These eco-friendly techniques provide various advantages, such as decreased toxicity, lower manufacturing costs, greater biocompatibility, and higher nanoparticle stability due to natural capping agents found in plant-based extracts [26,27]. Green-synthesized Fe3O4 nanoparticles frequently present better dispersion, controllable size, and surface functionalization that promote efficient interaction with gas molecules and polymer matrices [28]. Hybrid composites with distinctive structural and functional characteristics are produced by incorporating green-synthesized Fe3O4 nanoparticles into chitosan matrices [29]. Interfacial interactions between chitosan functional groups and Fe3O4 nanoparticles improve mechanical stability, electrical conductivity, and reactivity and biocompatibility [30]. The porous structure of chitosan films, along with the nanoparticles’ high surface-to-volume ratio, allows for fast diffusion, resulting in observable changes in the conductivity of the sensing layer [31]. The majority of investigations on Fe3O4/chitosan have studied these materials for other applications, such as drug administration, magnetic separation, or biosensing [32,33,34,35]. Systematic investigations are needed to assess the structural features, electrical characteristics, and sensing capabilities of green-synthesized chitosan/Fe3O4 composites designed for methanol detection. The present study attempts to bridge this gap by creating a new conductometric methanol sensor based on a chitosan/Fe3O4 nanocomposite synthesized by an eco-friendly green synthesis approach and employing Artemisia Herba Alba extract as a capping agent. The suggested study examines the composite’s morphological, structural, and electrical characteristics and assesses how well it senses methanol vapor under controlled circumstances.

2. Materials and Methods

2.1. Reagents

Iron(II) chloride tetrahydrate (FeCl2·4H2O; MW = 198.81 g/mol, purity ≥ 99%), Iron(III) chloride hexahydrate (FeCl3·6H2O; MW = 270.30 g/mol, purity ≥ 99%), and ammonium hydroxide solution (NH4OH; MW = 35.05 g/mol, purity ≥ 99%) were provided by Sigma-Aldrich (Saint-Quentin-Fallavier, France) and used without any further purification step. Every aqueous solution used ultra-pure water (UPW) from Millipore System (Millipore S.A.S., Guyancourt, France) (resistivity ˃ 18 MOhm.com).

2.2. Artemisia Herba Alba Extraction

Artemisia Herba Alba (AHA) leaves were obtained from the Kasserine region of Tunisia, and the extraction process was carried out based on the previous study [36]. After being cleaned with deionized water and allowed to air dry at room temperature in the shade, the chosen plant pieces were crushed into a fine powder. 11.5 g of this powder was poured into 200 mL of distilled water. After two hr of heating at 100 °C, the mixture was filtered at ambient temperature. The aqueous extract of AHA, which was utilized in the current investigation to produce Fe3O4 nanoparticles, was the resultant filtrate.

2.3. Synthesis of AHA-Capped Fe3O4 NPs

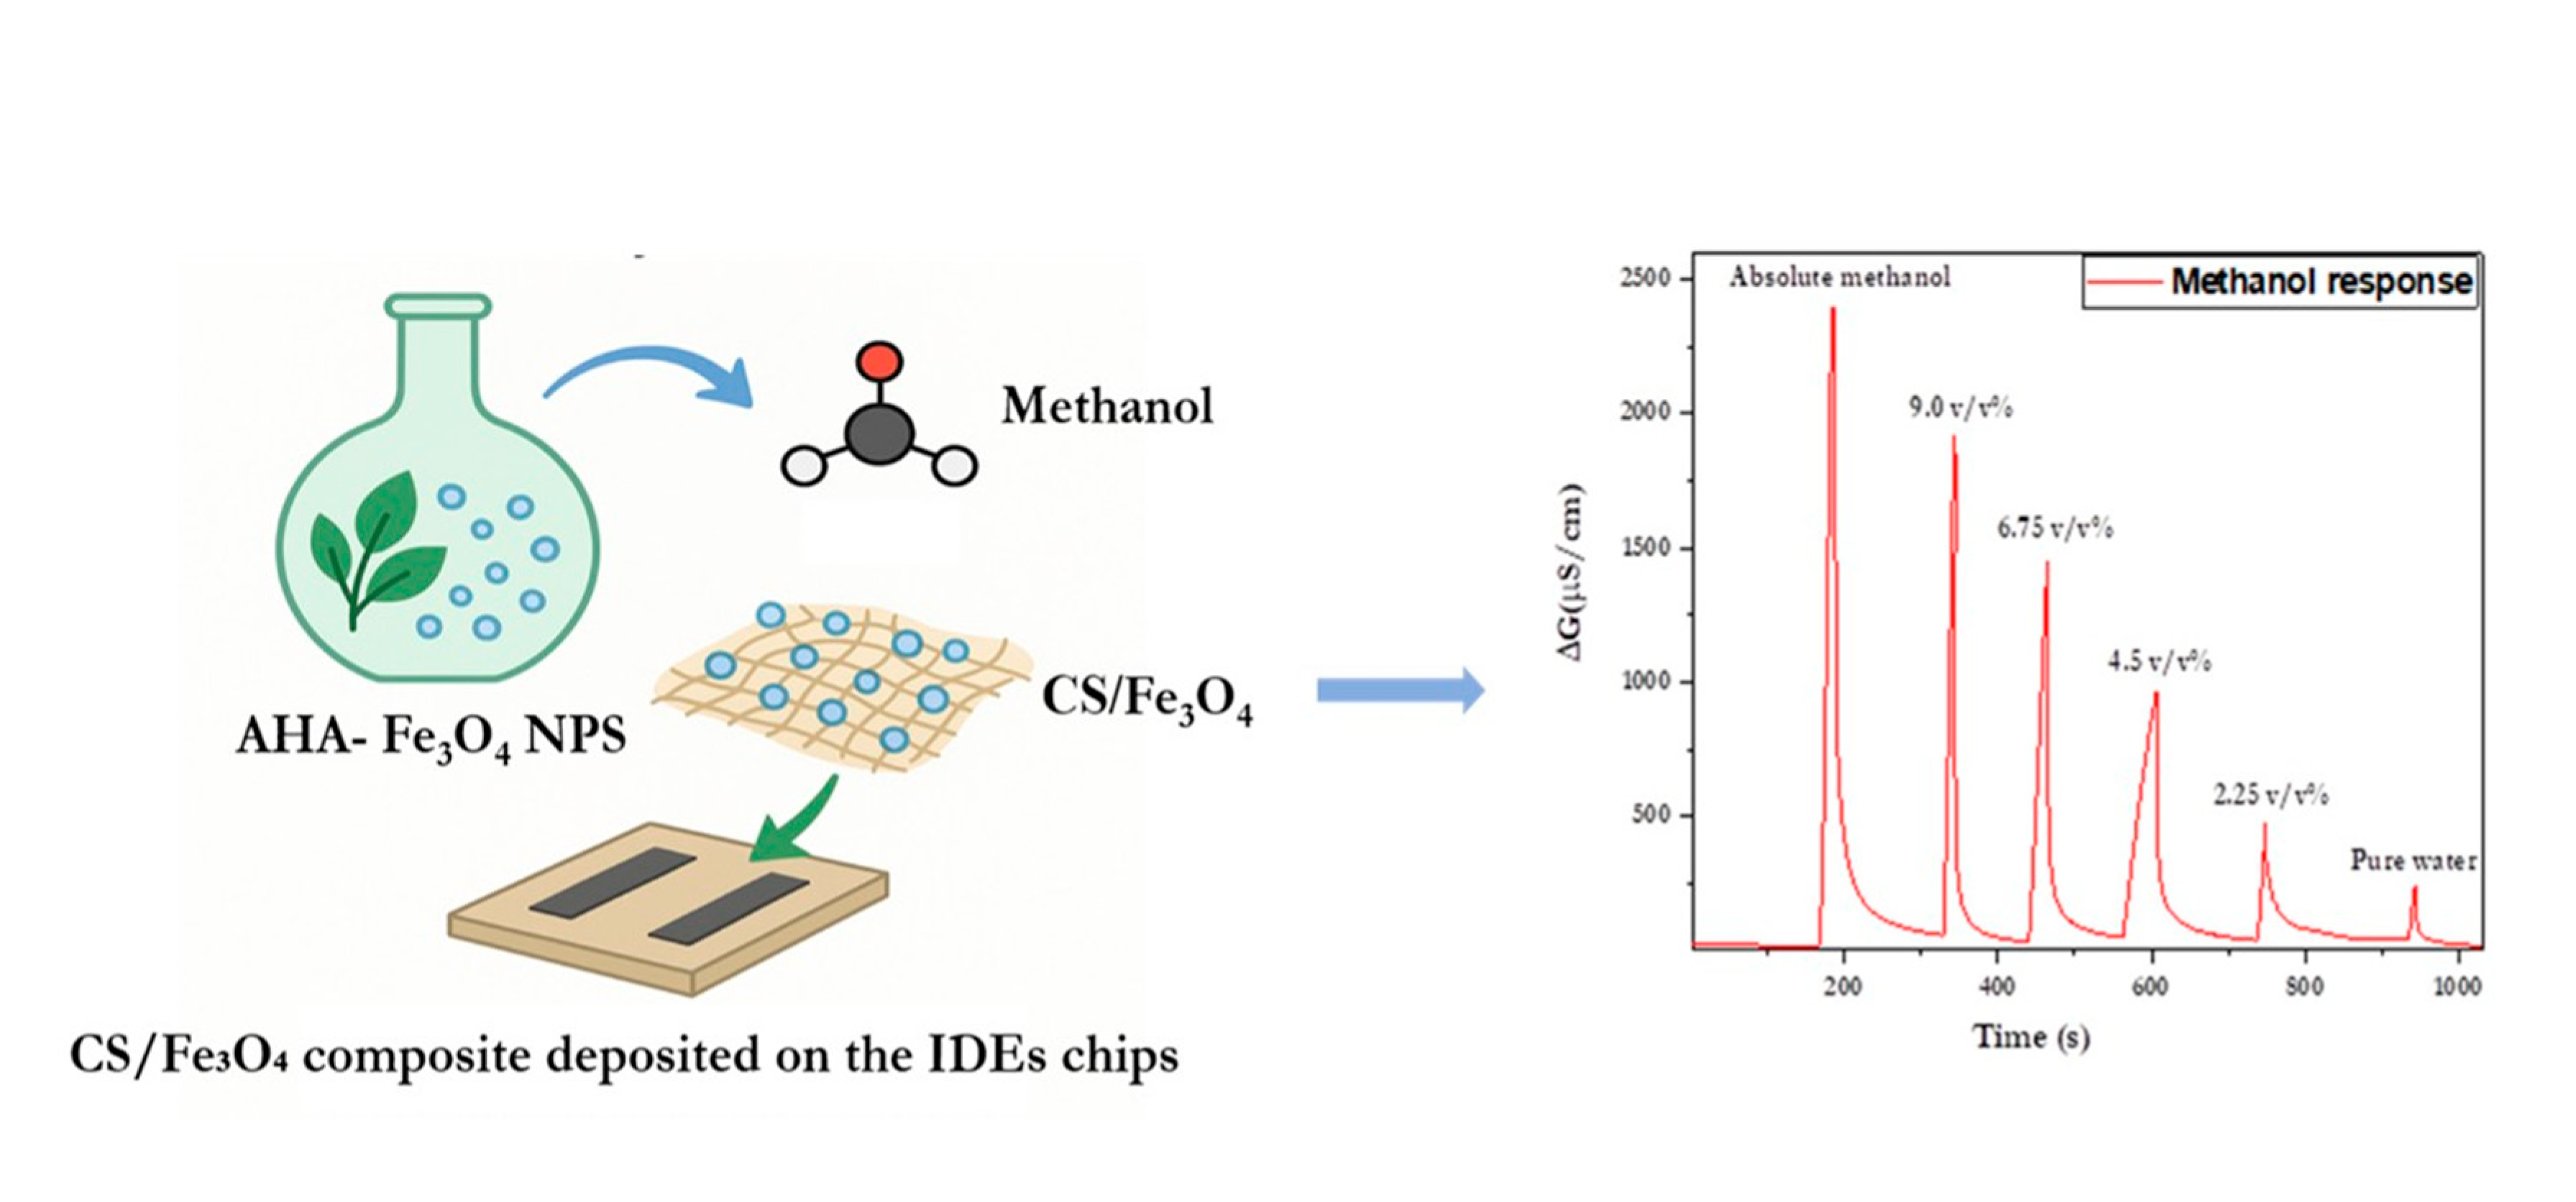
Aqueous leaf extract of AHA was used as a reducing and capping agent in the co-precipitation process to yield Fe3O4 nanoparticles (Figure 1). Typically, a 250 mL Erlenmeyer flask was filled with 85 mL of Milli-Q water, and a 2:1 molar ratio of FeCl3·6H2O (1.50 g) and FeCl2·4H2O (0.55 g) was added, respectively. After that, the reaction was kept in a nitrogen atmosphere at 80 °C for 60 min while being continuously stirred. The reaction mixture was then immediately supplemented with 30 mL of the aqueous AHA extract. After 30 min of refluxing, NH4OH was added dropwise to raise the pH of the reaction mixture to 10.
Fe3O4 NPs, a dark precipitate, were extracted using a bar magnet. For future usage, the product was vacuum-dried at room temperature after being cleaned three times with Milli-Q water and once with ethanol.

2.4. Characterization Techniques

The AHA-capped Fe3O4 nanoparticles (NPs) were analyzed using a range of characterization methods. A PANalytical X’Pert Pro diffractometer (Malvern Pananalytical, Venissieux, France) with a Cu Kα radiation source (λ = 1.542 Å) was used to perform X-ray diffraction (XRD) studies. A Nexus Nicolet spectrometer (Thermo Fisher Scientific, Lyon, France) was used to capture the Fourier-transform infrared (FTIR) spectra of the Fe3O4–AHA nanoparticles in the 4000–400 cm−1 wavenumber area. The samples were previously prepared as KBr pellets for analysis. A JEM-2100 analytical electron microscope (JEOL SAS, Croissy-sur-Seine, France) operating at an accelerating voltage of 200 kV was used to generate high-resolution transmission electron microscopy (HR-TEM) pictures. A drop of the nanoparticle suspension was deposited onto carbon-coated copper grids, and the excess solvent was allowed to evaporate before imaging. Using ImageJ software (version 1.50), at least 100 nanoparticles, selected at random, were measured to quantify the particle size and size distribution from HR-TEM micrographs. A Bruker Esprit Compact EDS detector (Bruker France SAS, Palaiseau, France) for elemental analysis was coupled to a Tescan Vega SBU microscope (TESCAN, Fuveau, France) running at 20 kV for scanning electron microscopy (SEM).

2.5. Conductometric Detection of Methanol

2.5.1. Fabrication Process and Packaging of Micro-Conductometric Chips

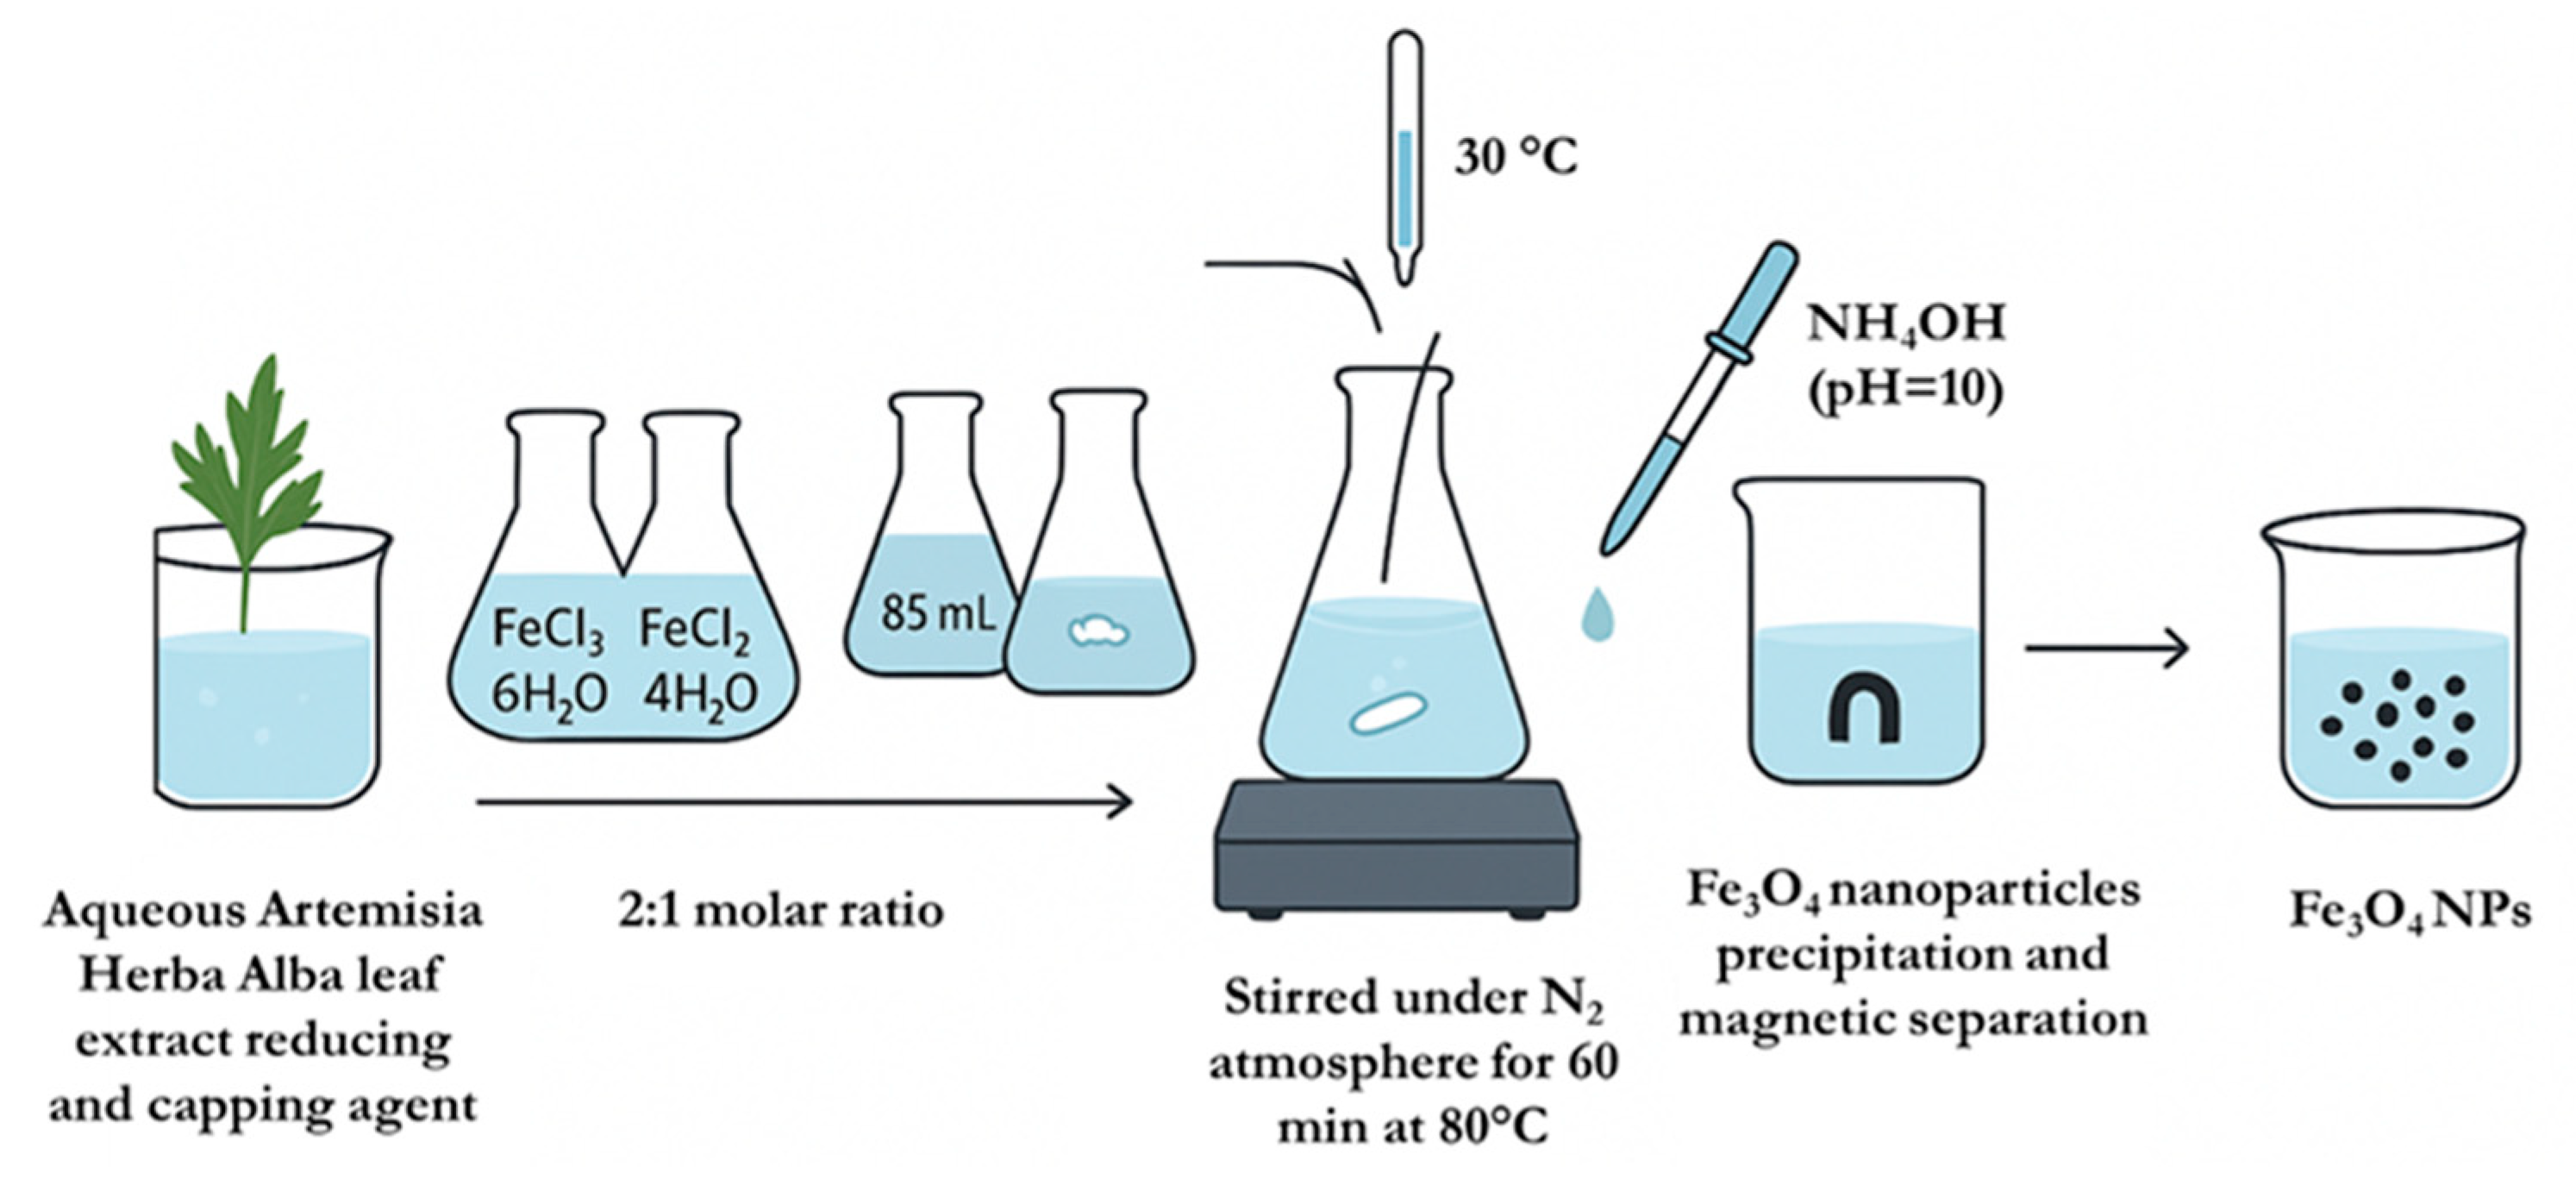
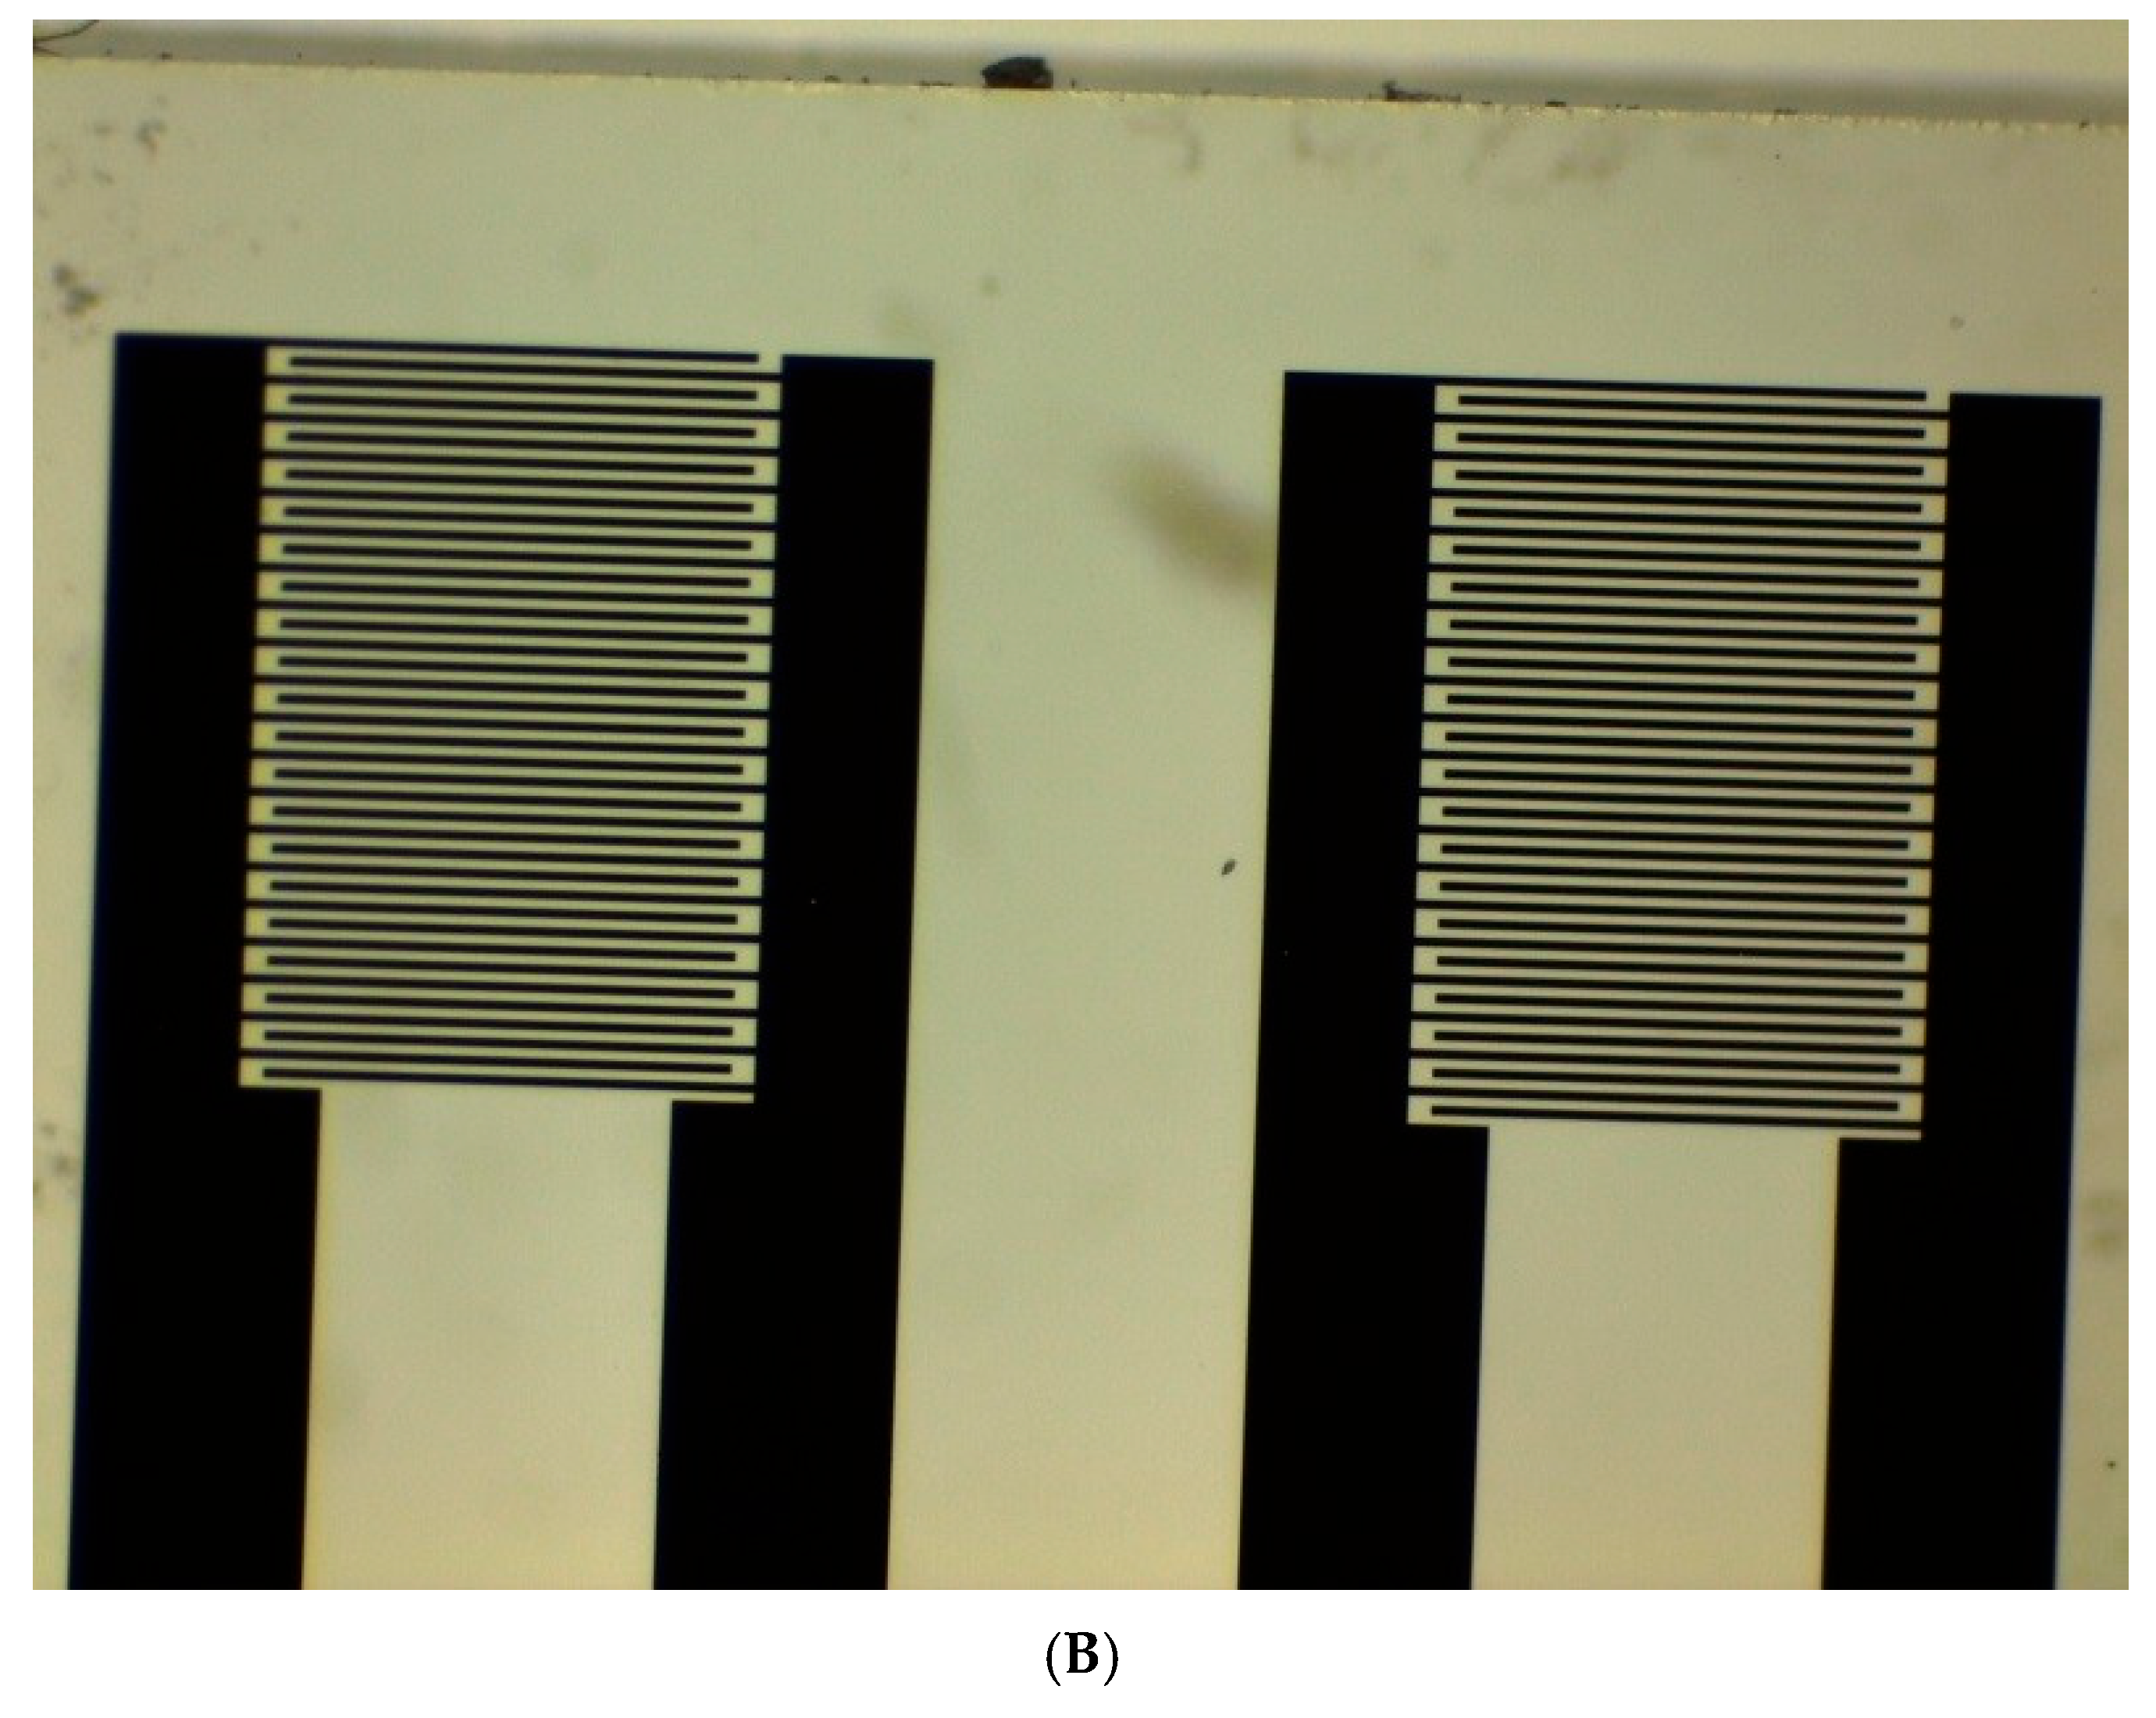
The interdigitated microelectrode chip was fabricated using UV lithography, followed by thin-film deposition via e-beam evaporation of 20 nm of titanium and 150 nm of gold on a borosilicate glass wafer [13,36]. All fabrication processes were conducted at the Institute of Nanotechnology of Lyon (INL), France. The resulting chip measured 5 × 28.7 mm, with interdigitated fingers having a width of 20 µm and a spacing of 20 µm. The sensitive surface of each electrode pair was approximately 2.9 mm2. Figure 2 presents a schematic flowchart illustrating the fabrication steps of the microconductometric chip, and an optical microscopy view of a pair of interdigitated electrodes.

2.5.2. Electrodeposition of Chitosan/Fe3O4-AHA Films on the Interdigitated Electrodes

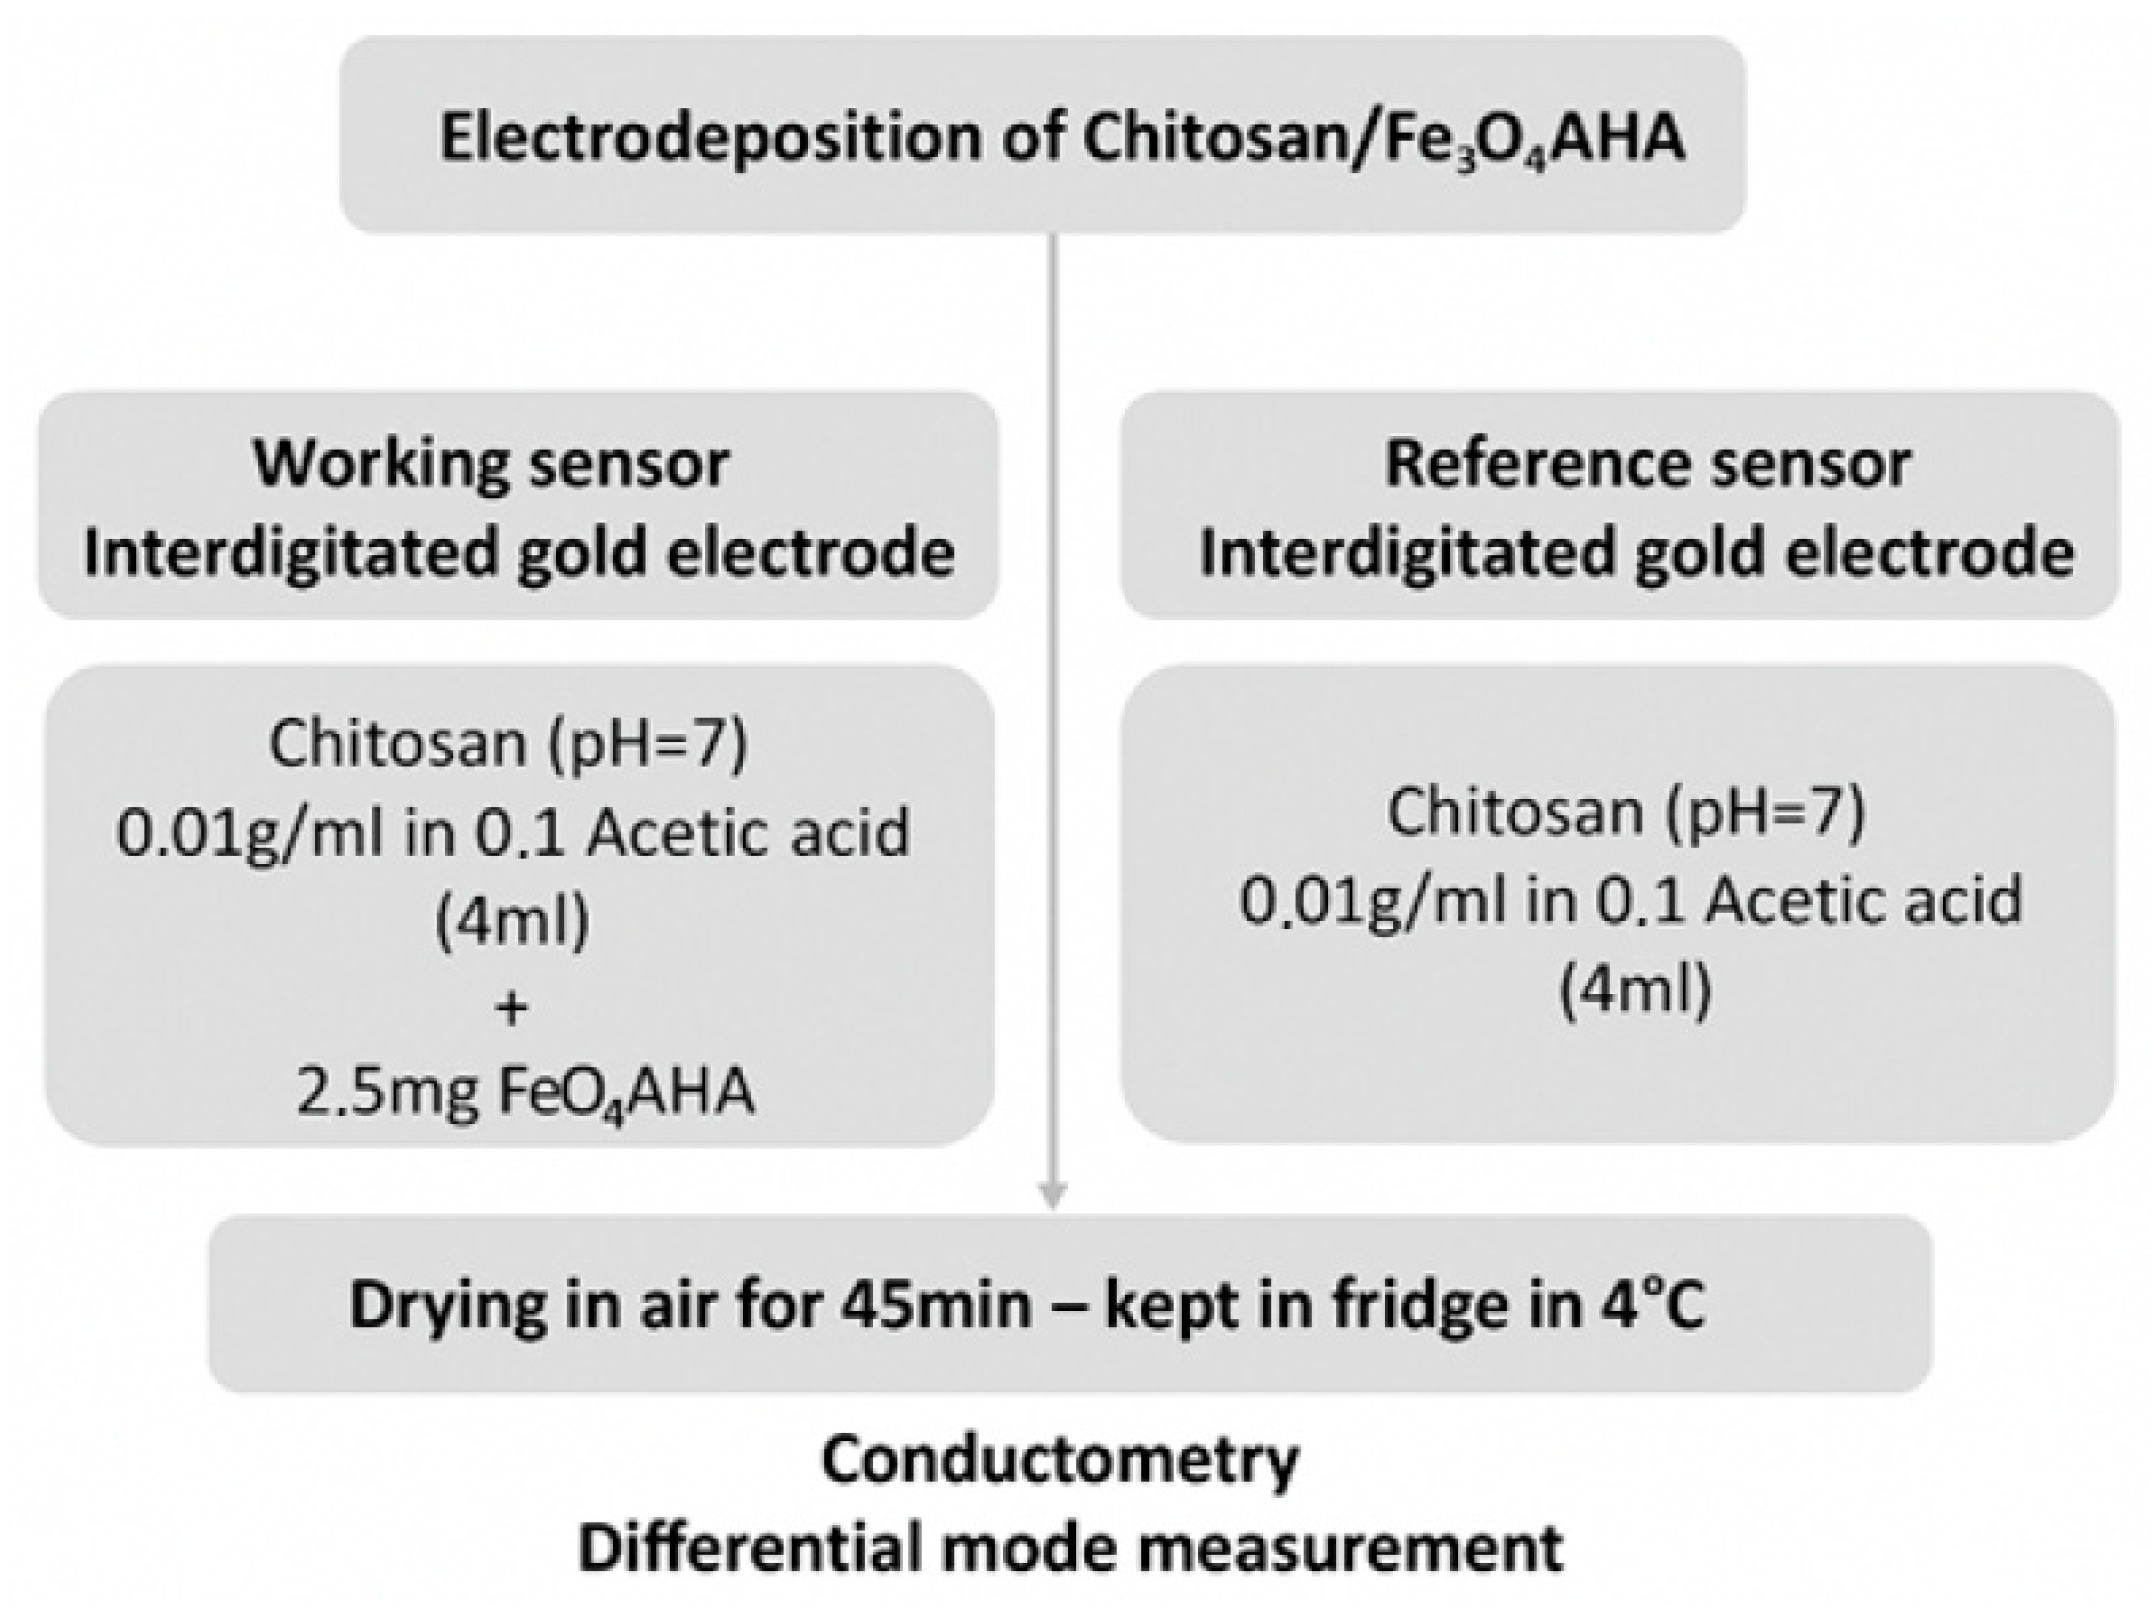
The fabricated microelectrode chips were cleaned by sonication in ethanol for 15 min, followed by sonication in acetone for an additional 15 min. The chips were then rinsed with deionized water, dried under a nitrogen stream, and subsequently treated with a UV–ozone cleaner (BioForce) for 30 min prior to the electrodeposition of the chitosan/Fe3O4–AHA layer on the electrode surfaces. The Fe3O4–AHA nanoparticle suspension was prepared in a solution containing 1% (v/v) acetic acid and 1% (w/w) low-molecular-weight chitosan. The pH of the suspension was adjusted to 7 by the gradual addition of 0.1 M NaOH under continuous stirring [13]. The electrodeposition process employed for the fabrication of the conductometric sensor is schematically illustrated in Figure 3.
For the chronoamperometric electrodeposition, a three-electrode configuration was employed, consisting of the working sensor (serving as the working electrode), an Ag/AgCl reference electrode, and a platinum wire counter electrode. The three electrodes were immersed in a 5 mL beaker containing the chitosan/Fe3O4 nanoparticle solution, serving as the electrolyte. The deposition was carried out at an applied potential of −1.4 V for 4 min using an EC-Lab potentiostat [37]. During deposition, the cathodic current recorded as a function of time exhibited a characteristic decay associated with the diffusion of protons (H+) from the bulk solution toward the electrode surface. The current, initially measured around 50 μA, corresponding to proton reduction, gradually decreased as the chitosan/Fe3O4 nanocomposite film formed on the gold interdigitated electrodes (IDEs). A stable current of approximately 3 μA was reached after about one minute, indicating the completion of the film formation process (Figure S1). A reference sensor was fabricated under identical conditions, except that a pure chitosan solution (without Fe3O4 nanoparticles) was used for electrodeposition. After deposition, the chips were rinsed with ultrapure water (UPW), air-dried for 45 min at ambient temperature (23 ± 1 °C), and subsequently stored at 4 °C before use. The thickness of the chitosan/Fe3O4–AHA layer was 1.1 µm ± 0.2 µm. The resulting chitosan/Fe3O4-AHA-based sensor was then ready for gas detection measurements under differential conductometric mode.

2.5.3. Conductometric Measurements

Conductometric measurements were performed by applying a small-amplitude sinusoidal voltage of 10 mV peak-to-peak at 0 V to each pair of interdigitated electrodes (IDEs) at a frequency of 10 kHz, generated by a “VigiZMeter” conductometer (Covarians). The sensor responses were recorded as a function of time under these conditions, which were selected to minimize Faradaic reactions, multilayer charging, and polarization effects at the microelectrode surface [13,38]. The differential output signal was measured between the working and reference pairs of IDEs. The working sensor was fabricated by electrodeposition of a chitosan/Fe3O4–AHA nanoparticle film, while the reference sensor was prepared by electrodeposition of a pure chitosan film.
Conductometric measurements were carried out by placing both the working and reference sensors in the headspace above the liquid phase inside a cylindrical container for one minute, followed by their withdrawal (Figure S2). The differential conductance (ΔG) was continuously monitored as a function of time. The corresponding gas-phase concentrations were calculated based on Henry’s law constants of each analyte in water, using Henry’s law (Table S1), and verified through GC-FID headspace measurements. In the concentration range, the relative standard deviation between the calculated gas phase concentrations and the measurements was less than 10%.
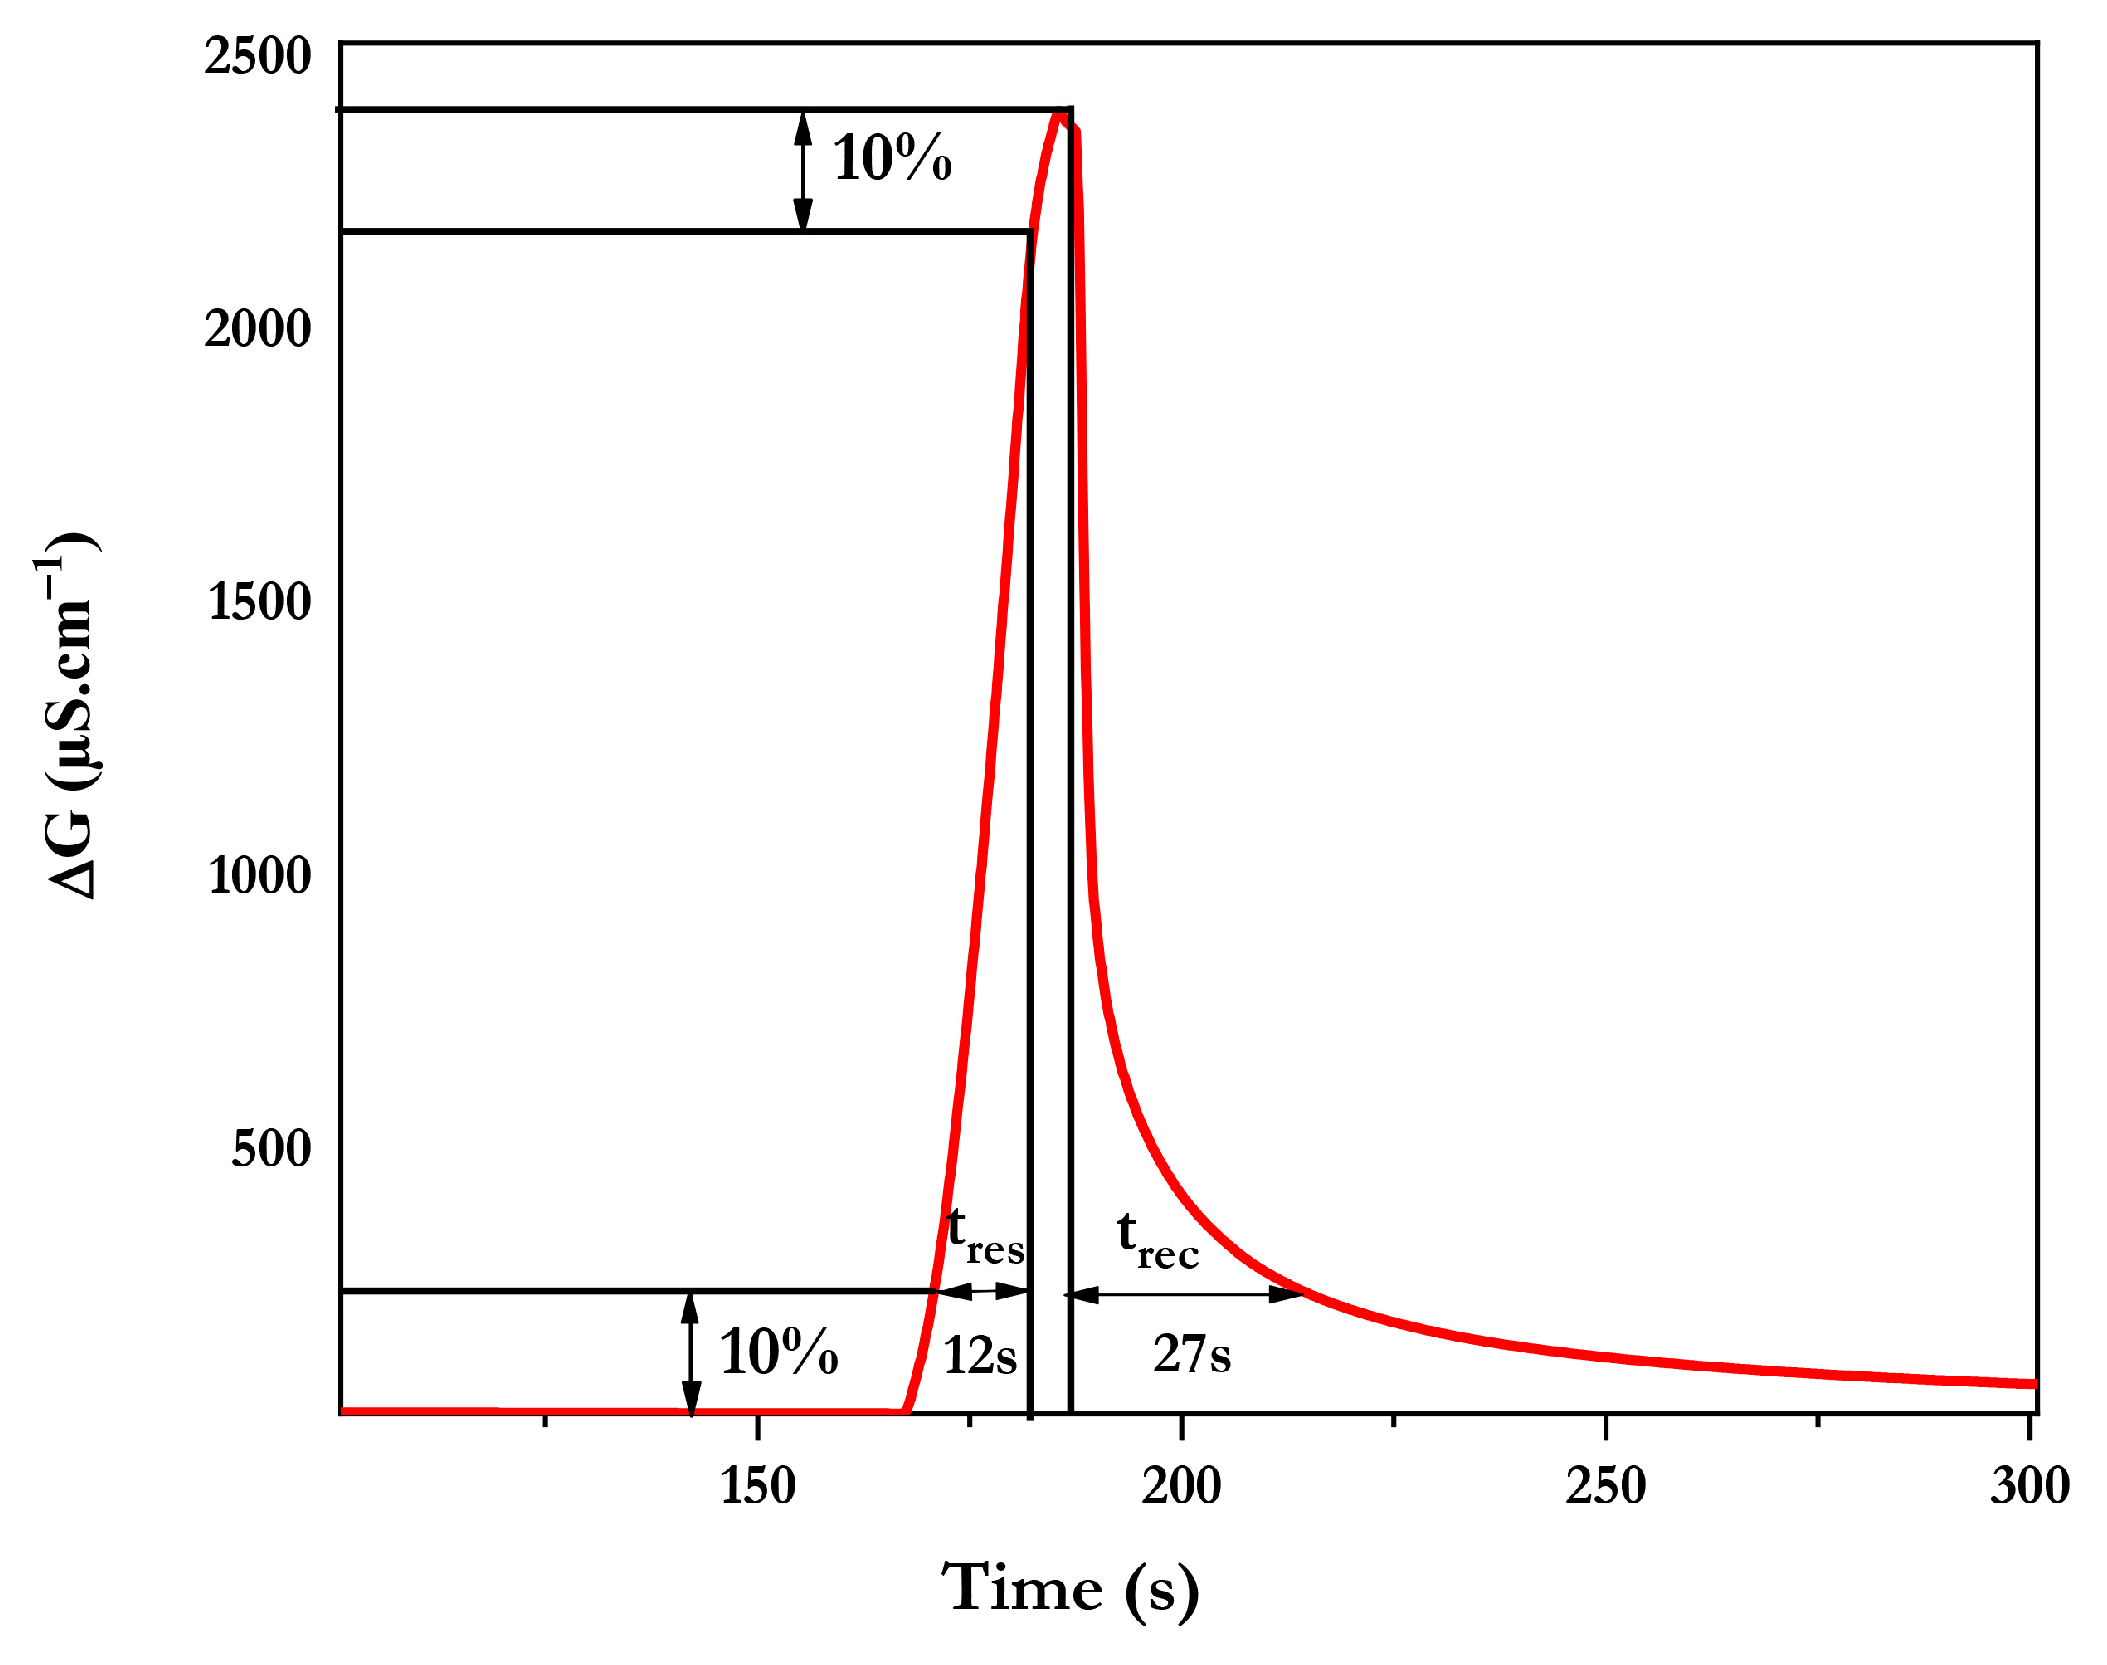
The response time (tRes) was defined as the time required to reach 90% of the total conductance change, while the recovery time (tRec) corresponded to the time required for the signal to return to 10% of the total conductance change.

3. Results and Discussion

3.1. Characterization of Green-Synthesized Fe3O4 Nanoparticles

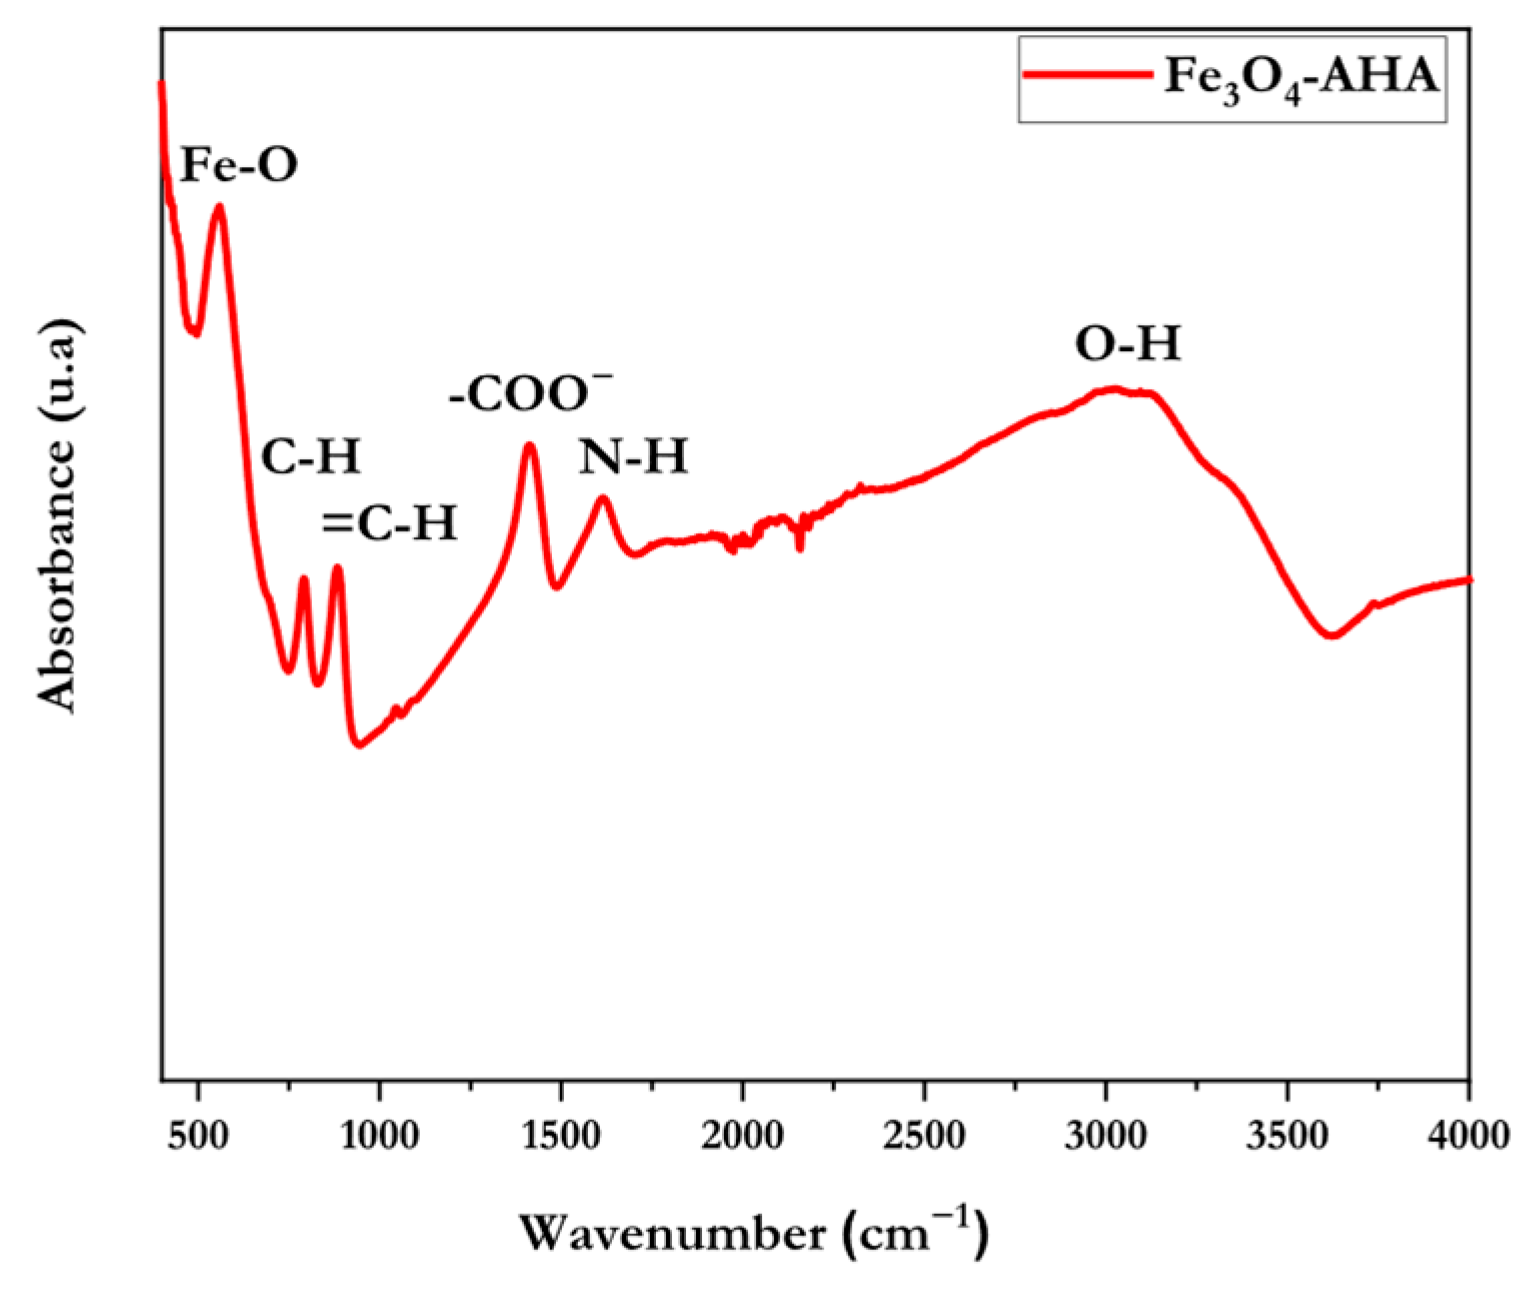
The FTIR spectrum of the AHA-Fe3O4 NPs is presented in Figure 4. An absorption band at 561 cm−1 was observed, corresponding to the Fe–O stretching vibration, characteristic of the spinel structure of Fe3O4 [39]. This Fe–O vibrational feature confirms the successful formation of Fe3O4 nanoparticles. A broad absorption band around 3048 cm−1 is associated with O–H stretching vibrations of hydroxyl groups from polyphenolic and alcoholic compounds, as well as adsorbed water on the nanoparticle surface [40]. The presence of amide or carbonyl functional groups originating from flavonoids, proteins, or other bioactive compounds in the plant extract is suggested by the peak at 1614 cm−1, which corresponds to N–H or C=O stretching vibrations [41]. The symmetric stretching vibration of carboxylate (–COO) was associated with a unique band at 1417 cm−1, suggesting the presence of organic acids and phenolic compounds from AHA [42]. This suggests that these functional groups have a role in the stability and coordination of Fe3O4 nanoparticles. AHA contains unsaturated phytochemicals, as evidenced by additional peaks at 787 and 887 cm−1 due to C–H out-of-plane bending vibrations of aromatic or alkene groups [43]. These bands may overlap with Fe–O lattice vibrations, indicating plant-derived biomolecules on the surface of Fe3O4 nanoparticles. AHA biomolecules worked as both reducing and capping agents during nanoparticle formation, stabilizing Fe3O4 by surface interaction with hydroxyl, carboxyl, and amine groups [44].
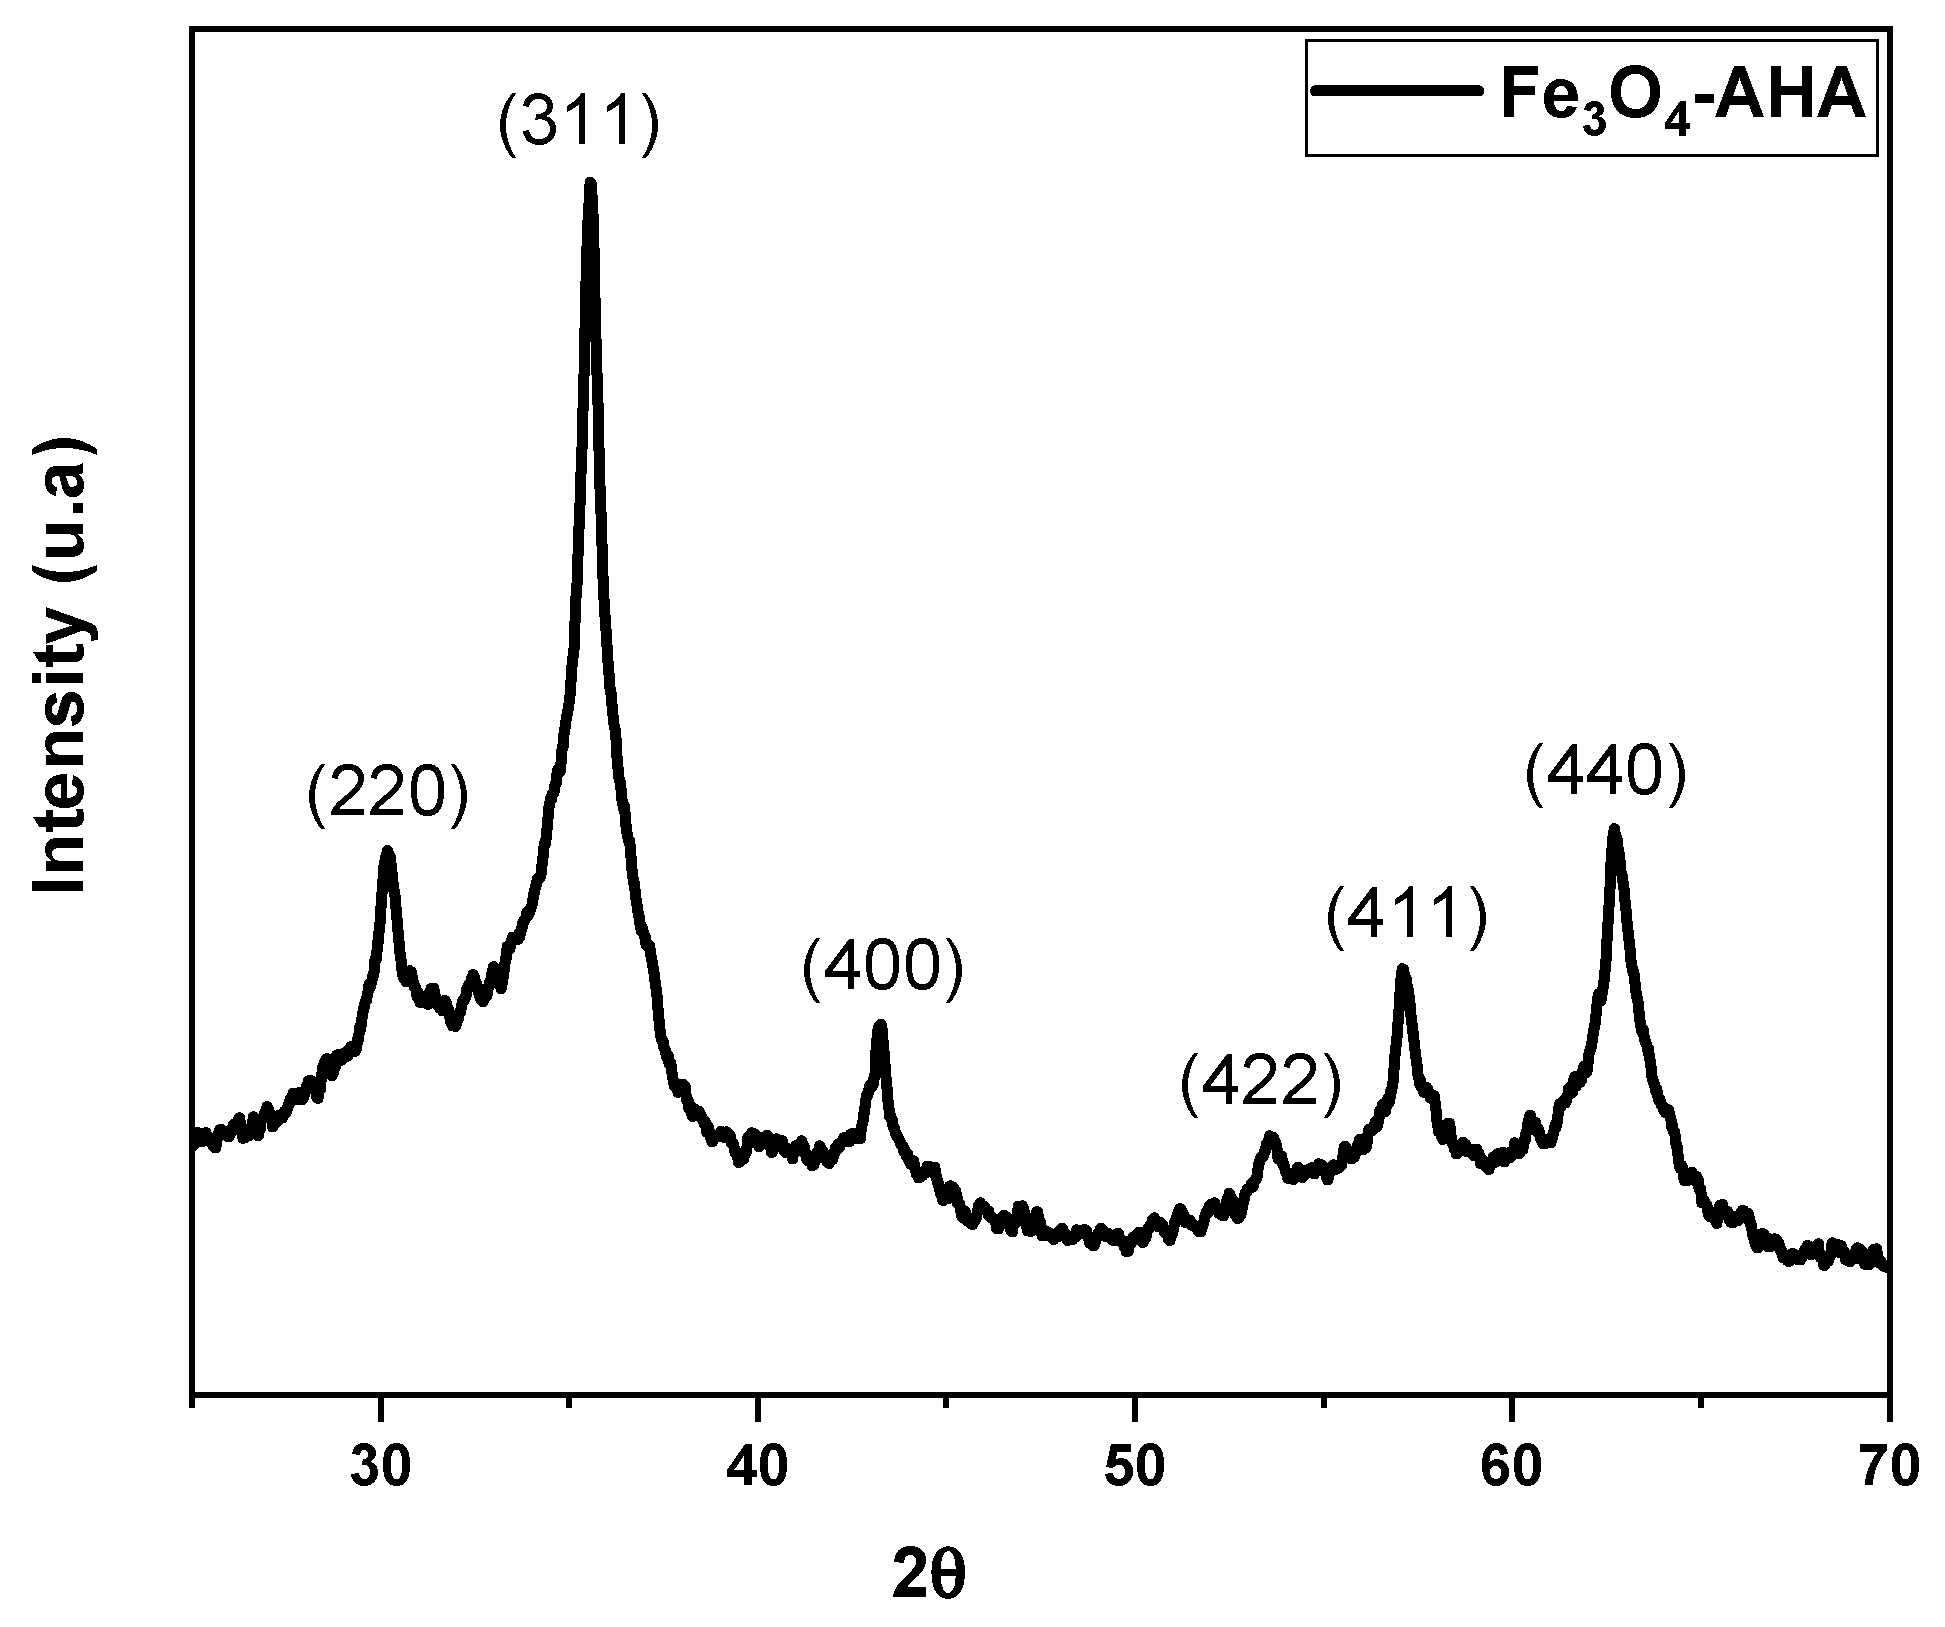
The crystalline structure of the synthesized sample was analyzed using X-ray diffraction (XRD), and the corresponding diffraction pattern is presented in Figure 5. The diffraction peaks observed at 2θ values of approximately 30.2°, 35.6°, 43.2°, 53.5°, 57.1°, and 62.7° can be indexed to the (220), (311), (400), (422), (511), and (440) crystal planes, respectively, which are in good agreement with the standard JCPDS card No. 19-629 corresponding to magnetite (Fe3O4) [45]. No secondary peaks corresponding to other iron oxide phases such as maghemite (γ-Fe2O3) or hematite (α-Fe2O3) were detected, indicating the formation of a pure Fe3O4 phase [46]. The intense reflection at the (311) plane, in contrast to the other planes, may specify the growth direction of the Fe3O4 NPs [47]. To better quantify the effect of the stabilizers, we fitted the XRD data using a profile to calculate the full width at half maximum (FWHM) from the main diffraction peaks, and the average size D of AHA-capped Fe3O4 NPs was obtained from the Scherrer formula as shown below [48,49].
D = K λ β c o s ( θ )
where D is the average crystallite size (nm), K = 0.9 is the Scherrer constant, λ is the wavelength of X-ray (1.5402 Å) Cu Kα radiation, β represents the FWHM (in radian) and θ is the Bragg diffraction angle, respectively. The average calculated crystallite size was found to be approximately 5.1 nm. Additional evidence that the nanoparticles have high crystallinity comes from the distinct and sharp peaks. In order to promote the creation of evenly dispersed nanoparticles with improved structural integrity, the AHA capping agent was essential for limiting particle development and avoiding agglomeration. The cubic spinel phase of Fe3O4 NCs has a lattice constant that may be computed as in Equation (2) [50,51]:
d h k l 2 = a 2 h 2 + k 2 + l 2
where dhkl is the inter-reticular distance that is given for the spinel cubic structure; λ is the wavelength of the X-ray radiation; h, k, and l are the Miller indices, and a is the lattice constant of the cubic phase of nanocrystals. The formation of a cubic spinel magnetite phase was confirmed by the lattice parameter of the Fe3O4 NPs, which was determined to be 8.36 Å using Bragg’s law. This value is in excellent agreement with the standard value (8.396 Å, JCPDS No. 19-0629) [52]. It should be noted that the Scherrer equation accounts only for the size-induced broadening of diffraction peaks, thus providing merely a lower limit of the nanocrystal size while neglecting the contribution of microstrain effects [53]. Consequently, the calculation of nanocrystallite size can be improved by taking into account several structural characteristics, such as lattice strain (ε), dislocation density (δ), and stacking fault (SF). Table 1 reports the computed values of these parameters, which were obtained using the corresponding relations (Equation (3)) [54].
ε = β c o s ( θ ) 4 ;   δ = 1 D 2 ;     S F = 2 π 2 45 ( t a n θ ) 1 2 β h k l
A considerable degree of lattice distortion due to internal stress and surface effects characteristic of nanoscale materials was indicated by the calculated average microstrain (ε) of 0.0073. Because of the small crystallite size, the dislocation density (δ) was determined to be 0.0529 nm−2, indicating a rather high density of crystal defects [55]. On the other hand, the spinel lattice’s stacking fault probability (SF) showed a low average value of 0.021, indicating strong structural order. Overall, these average results show that the Fe3O4 nanoparticles have a fine crystalline structure with few stacking defects and mild internal strain, which contributes to their excellent structural stability and potential for improved catalytic and magnetic performance.
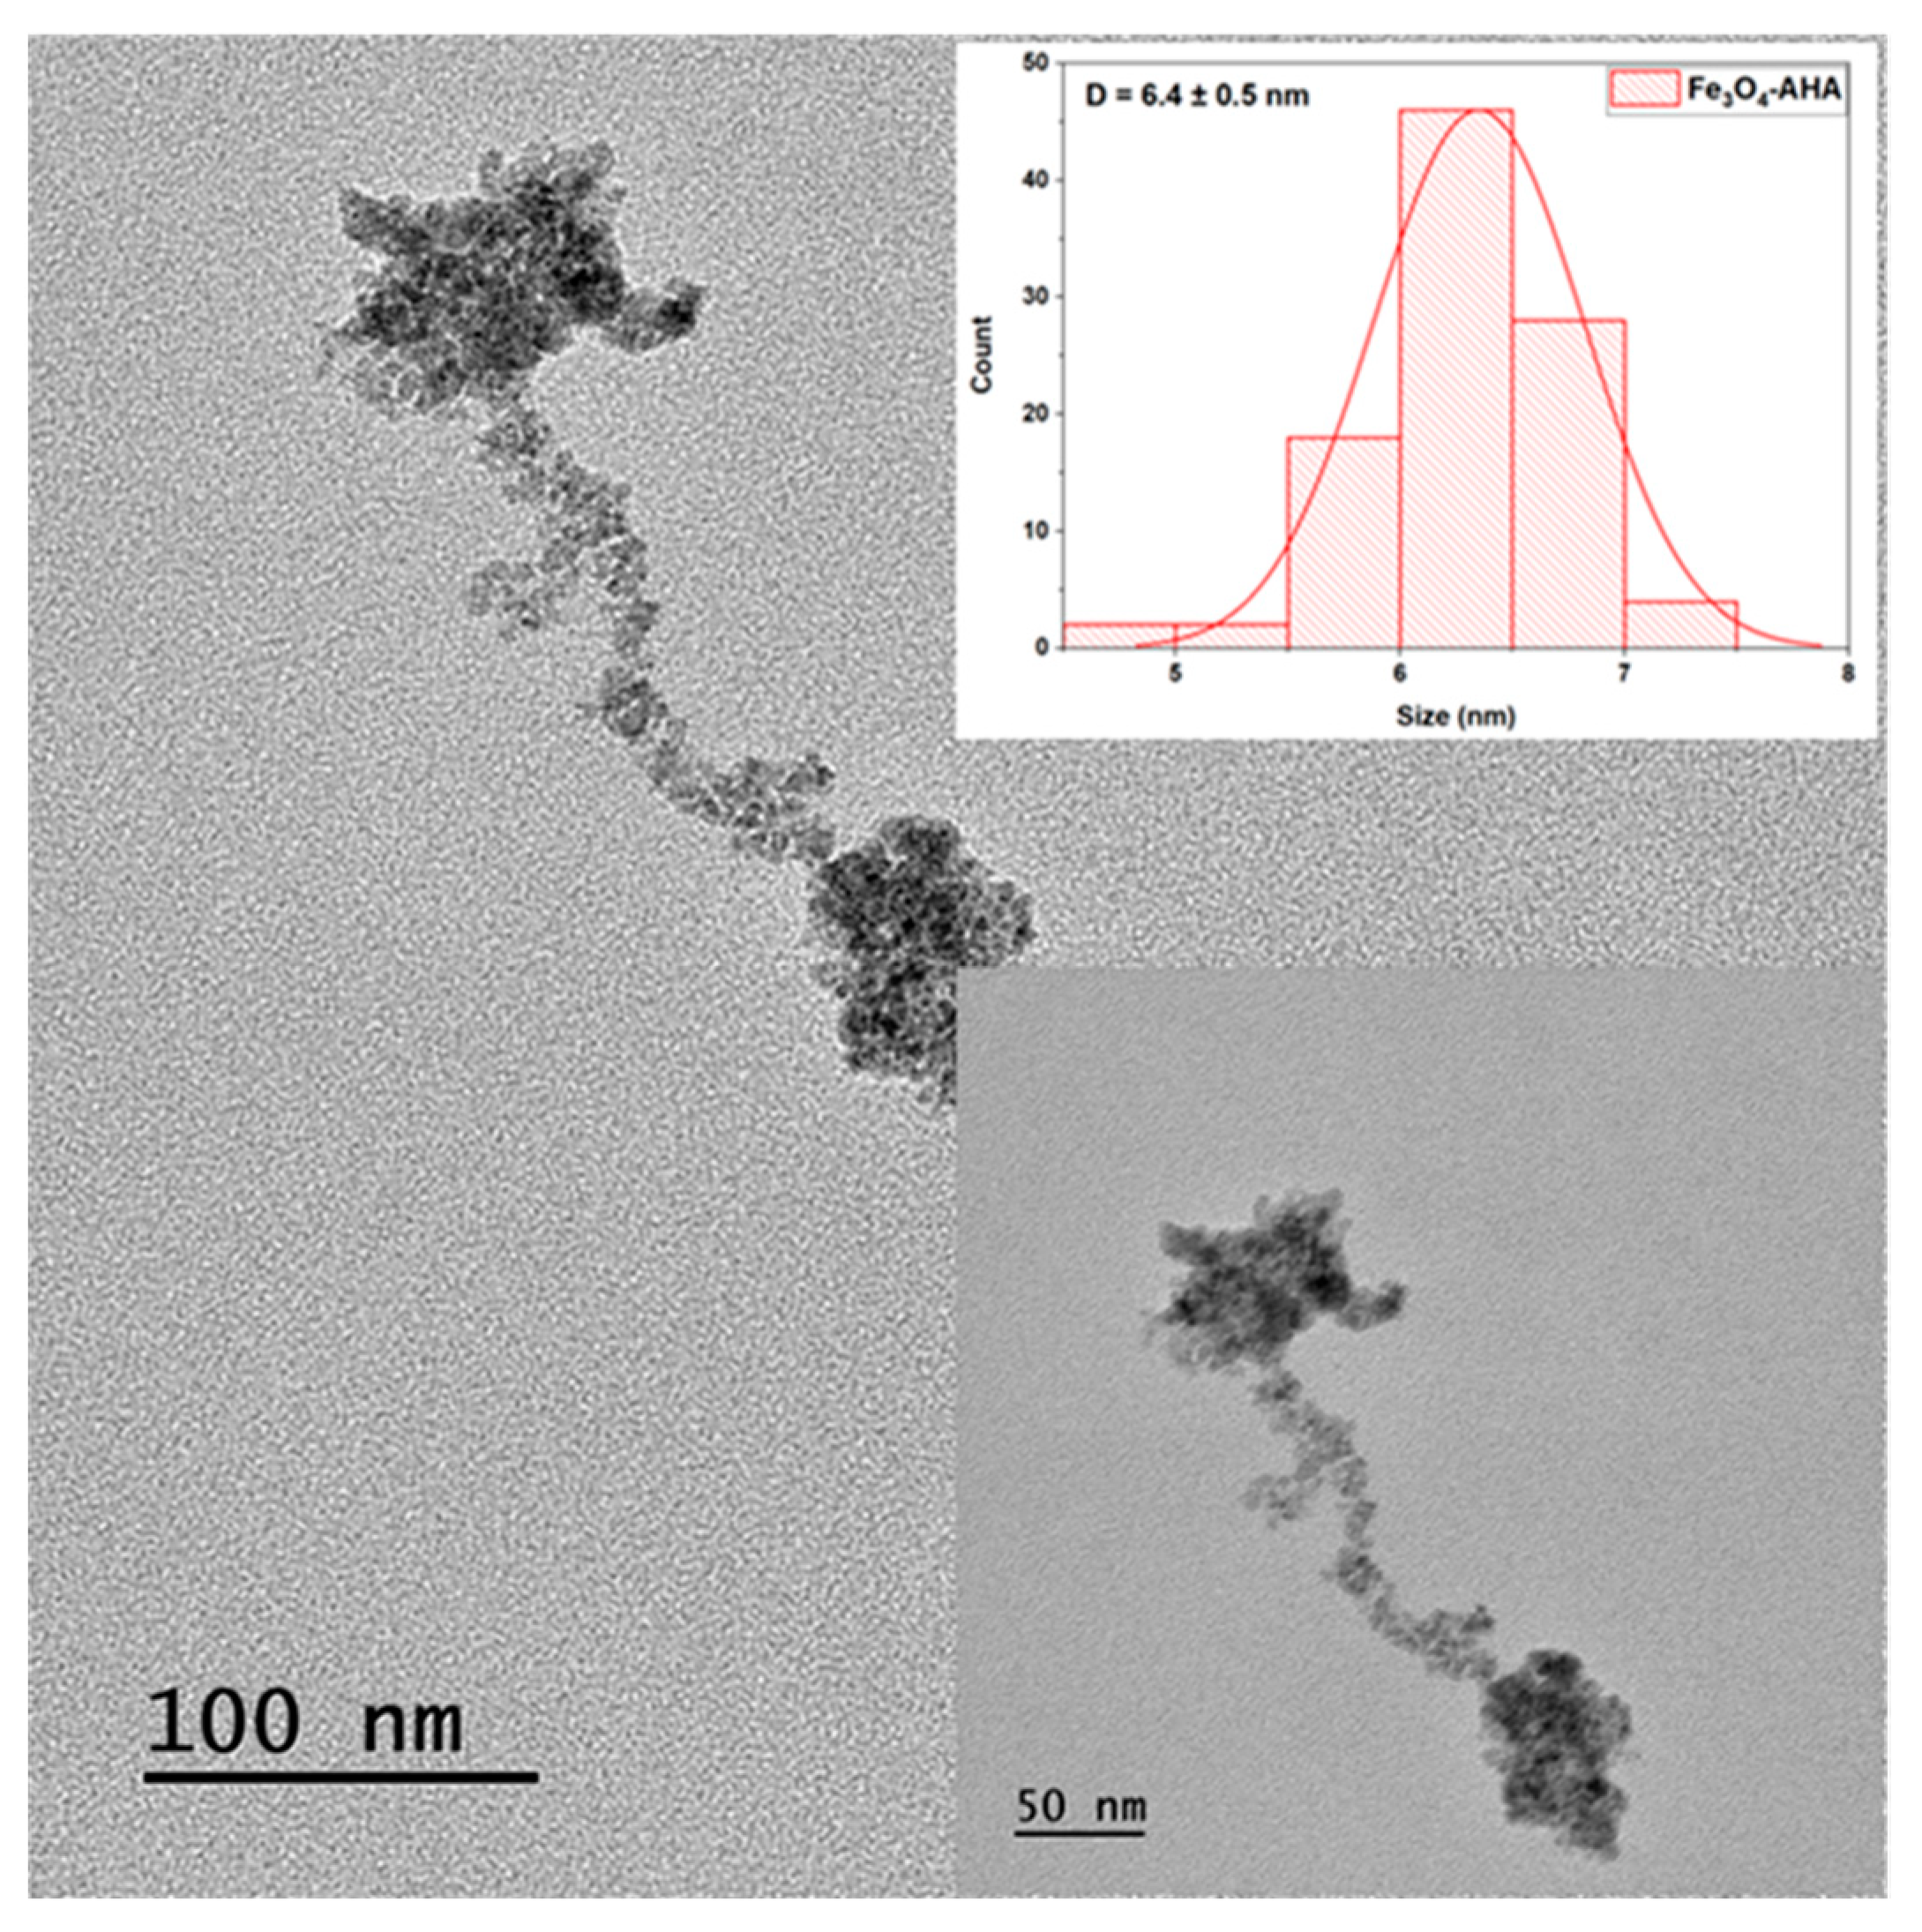
Figure 6 shows TEM pictures of green-synthesized AHA-Fe3O4 nanoparticles. The consistent spherical shape of the nanoparticles is revealed by the photos, indicating regulated nucleation and growth during the green synthesis process [56]. Using ImageJ software, a particle size study of more than 100 nanoparticles revealed an average diameter of 6.4 ± 0.5 nm, confirming the synthesis of well-defined nanoscale Fe3O4 particles and exhibiting a narrow size distribution. These findings support the development of distinct nanoscale Fe3O4 particles and are consistent with the crystallite size ascertained by XRD studies. They are intriguing prospects for applications in gas sensing, biological imaging, and catalysis because of their small and uniform size, which is predicted to improve magnetic characteristics and give a high surface-to-volume ratio [57].
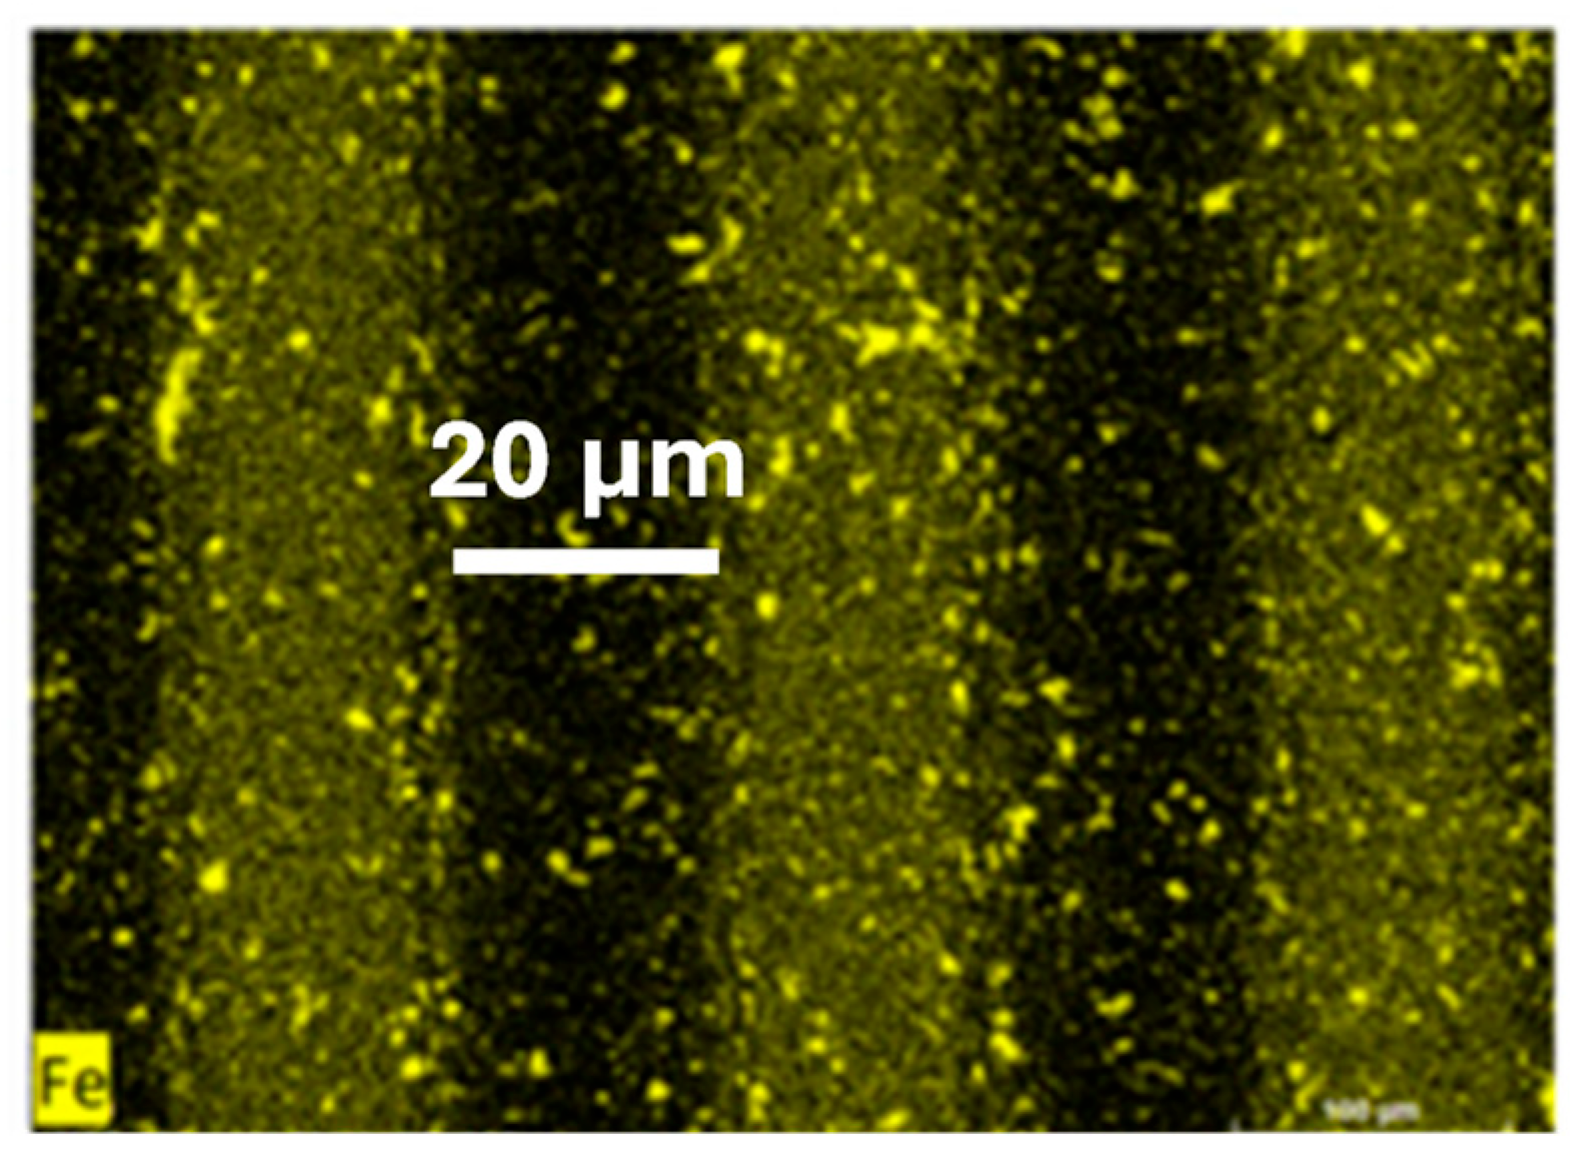
The composite CS/Fe3O4 is formed of magnetite (Fe3O4) nanoparticles mixed with a chitosan (CS) matrix. The spatial distribution of the elements on the micro-conductometric chips was examined using energy-dispersive X-ray spectroscopy (EDS) mapping. The effective deposition of the CS/Fe3O4 composite on electrodes that initially included Au, Si, and Ni was confirmed by the detection of the elements Au, Si, Ni, C, Fe, and O. Because they are indicative of the magnetite phase integrated into the chitosan matrix, the Fe and O signals are very important [58]. The existence of iron oxides in the deposited layer is confirmed by the Fe Kα peak (~6.4 keV) and the matching O Kα peak (~0.5 keV). Fe and O are interconnected inside the same nanostructured phase rather than appearing as distinct species, according to the spatial correlation between them in the EDS mapping [59]. This distribution pattern shows that the Fe3O4 nanoparticles are evenly distributed throughout the chitosan matrix (Figure 7), providing uniform electrode surface coverage. The performance of the micro-conductometric gas sensor depends on maintaining consistent electrical and magnetic characteristics, which are made possible by such a uniform dispersion [60].

3.2. The Conductometric Measurements

3.2.1. Conductometric Response to Vapors

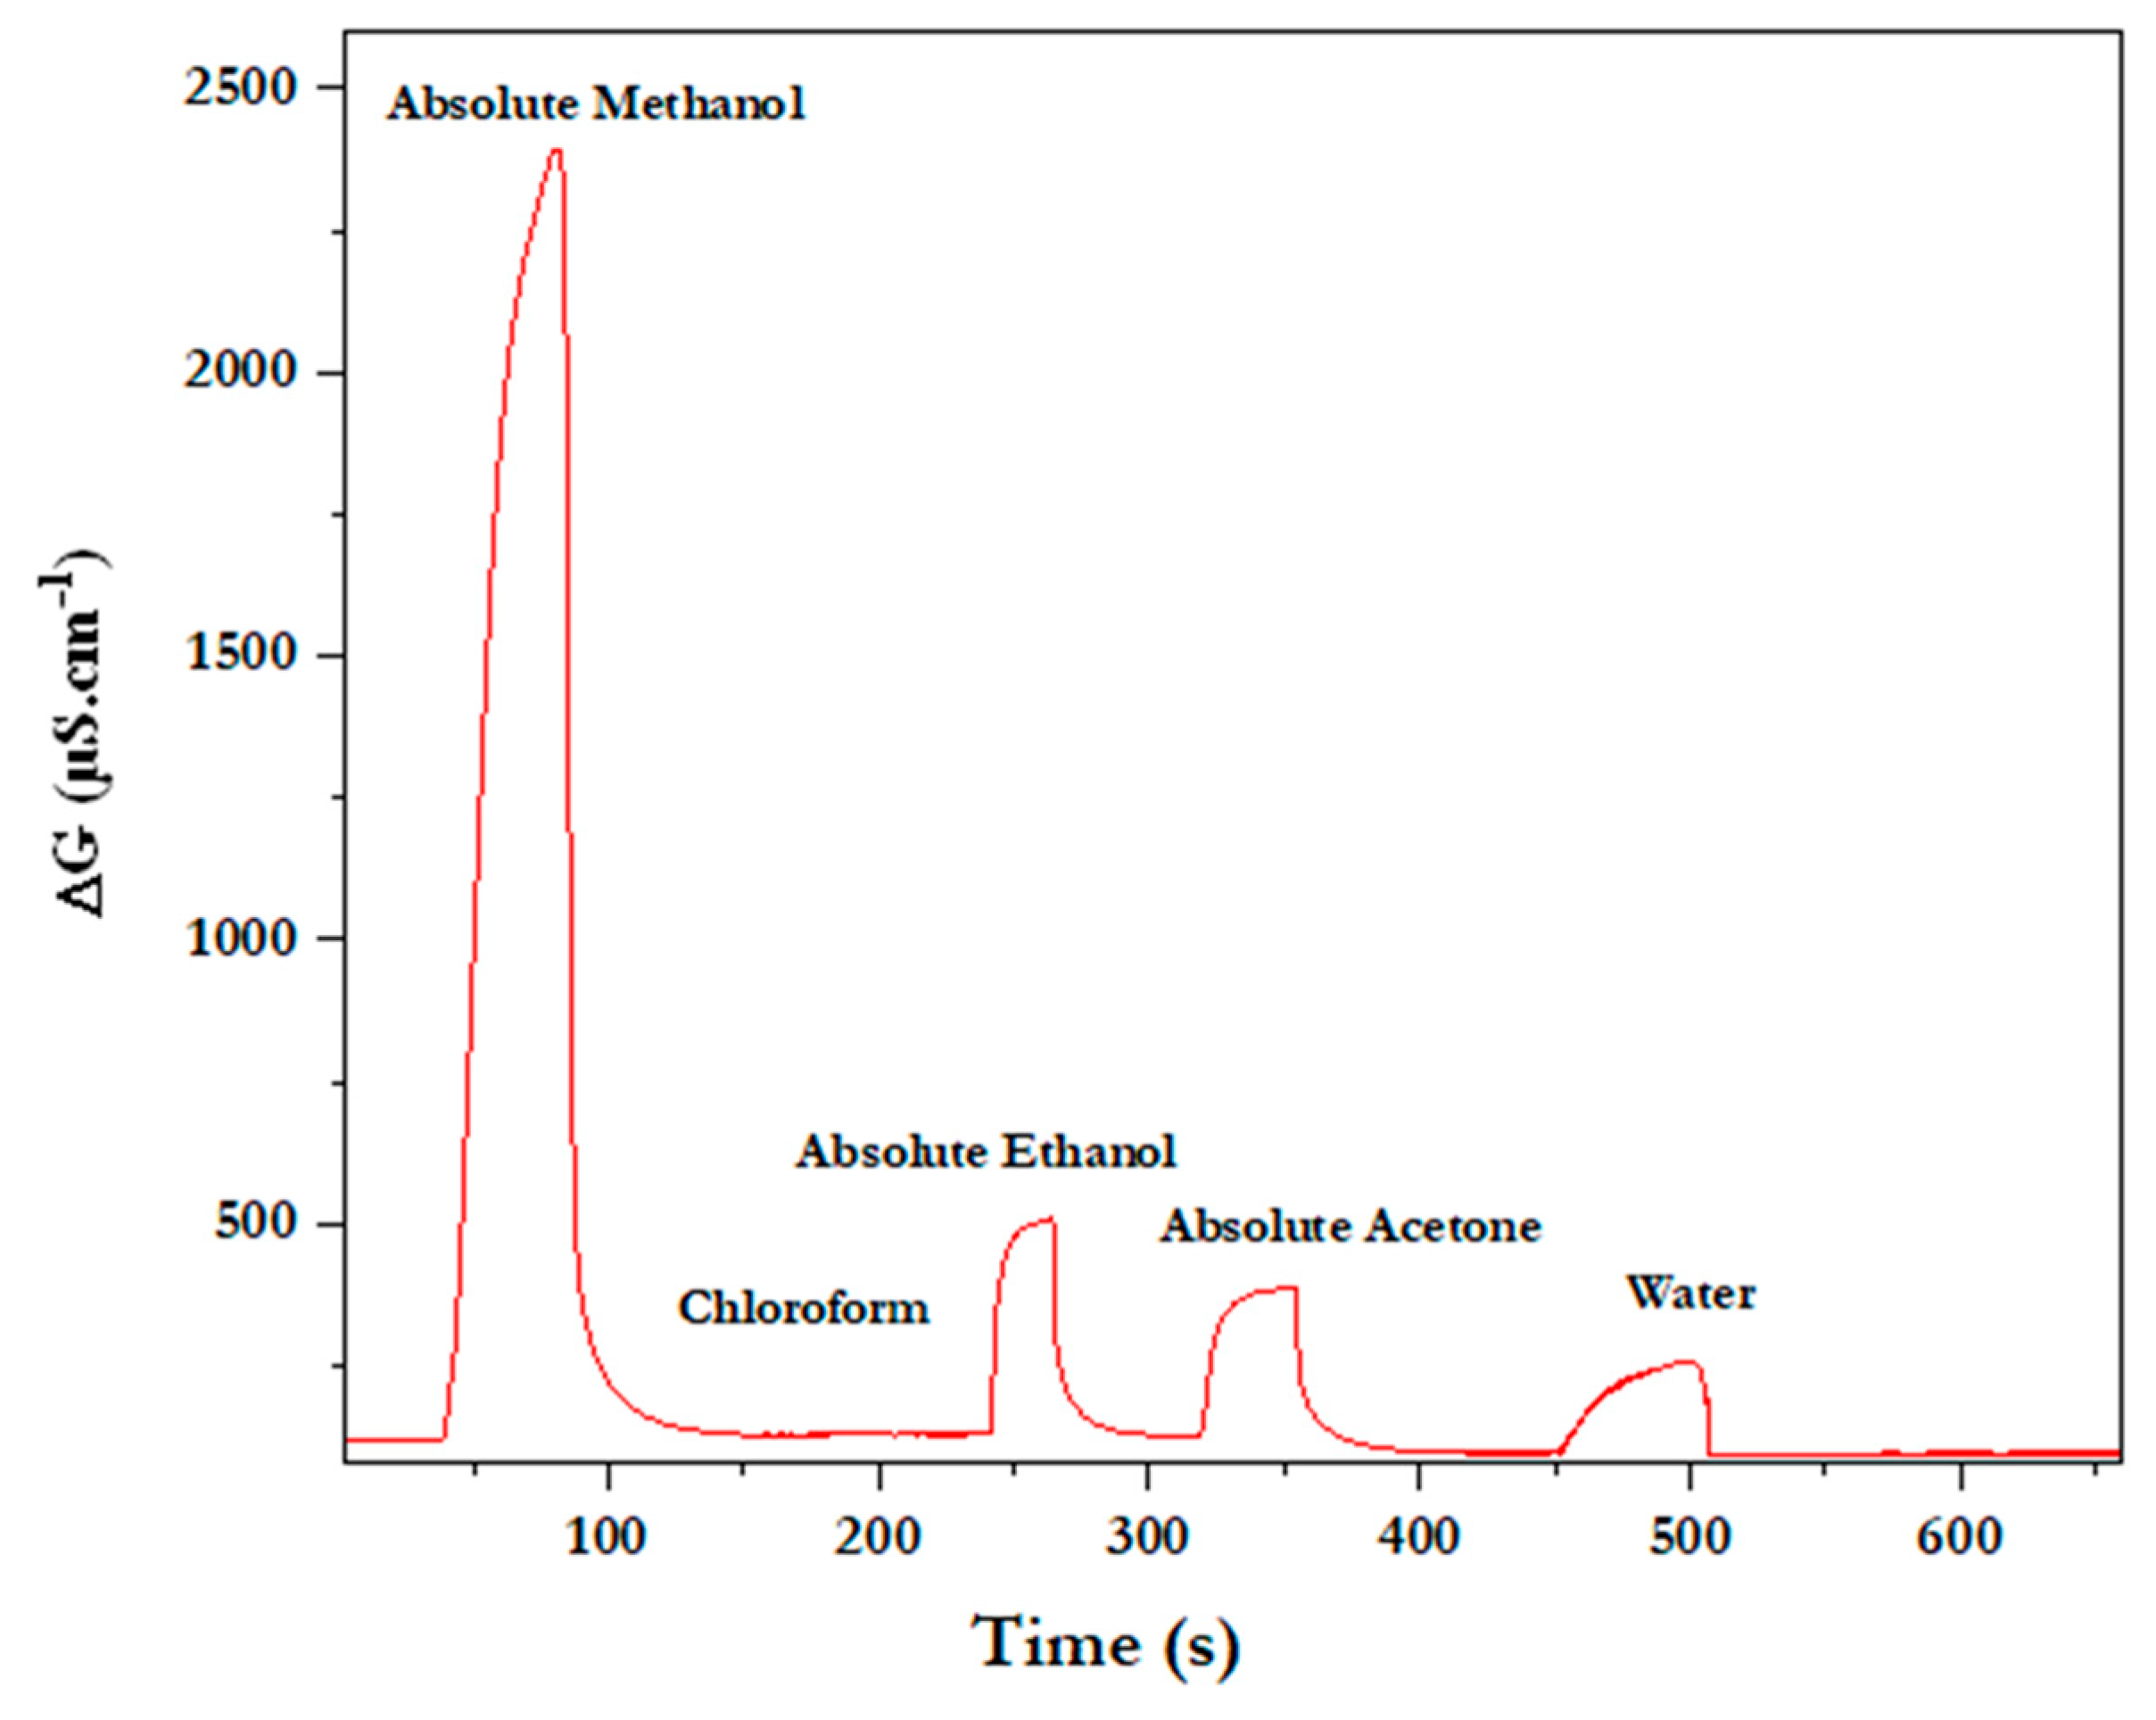
Conductometric detection of multiple VOCs (methanol, ethanol, acetone, chloroform, and water) was used to assess the gas-sensing performance. When exposed to the vapor phase of the pure solvents, the conductivity of the chitosan–Fe3O4 composite sensor, which was measured in differential mode using a lock-in amplifier, clearly increased, as shown in Figure 8 [37]. Compared to the other volatile organic chemicals, the sensor exhibits a much greater sensitivity to methanol. The detection signal for pure methanol vapor reached 2402 μS.cm−1, whereas that for pure water was very low, only 234 μS.cm−1. Under the fixed aqueous-headspace conditions used here, differential referencing reduces water-related baseline effects. Nevertheless, in our experimental conditions, where methanol is diluted in water, the robustness to variable RH steps was not evaluated.

3.2.2. Analytical Performance

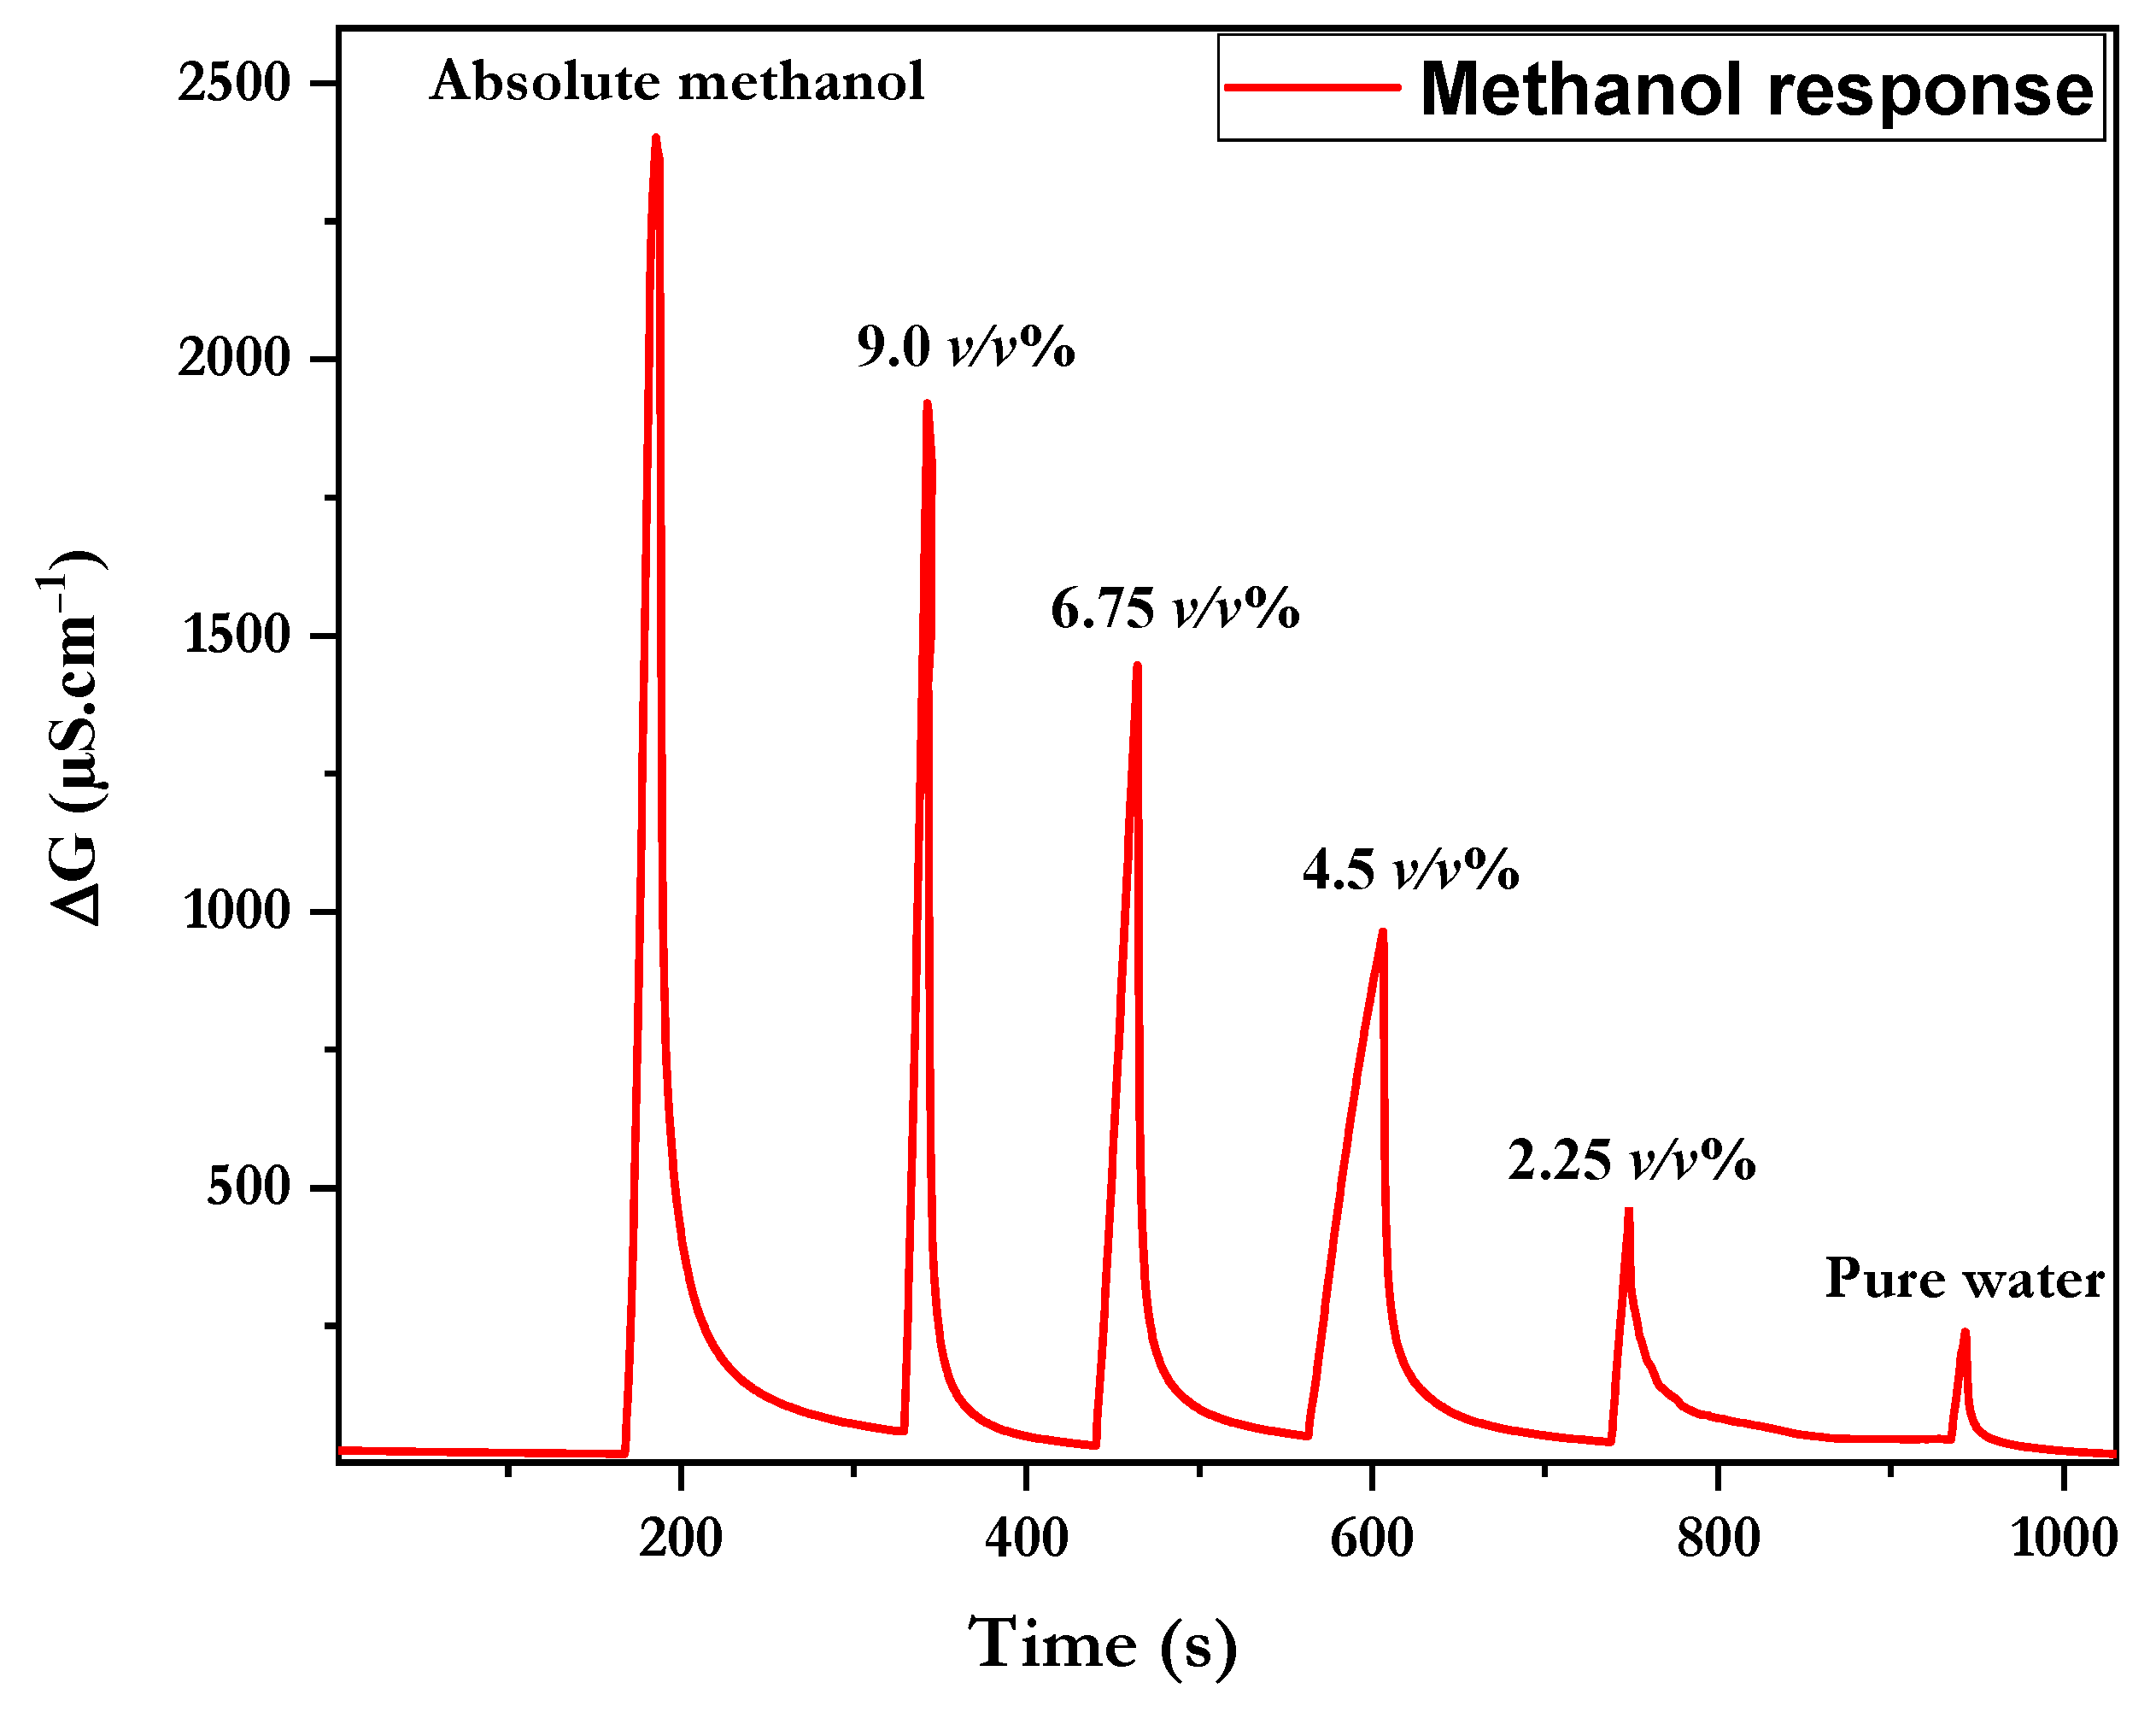
Figure 9 shows the microconductometric responses measured in the headspace of methanol–water mixtures with different methanol contents. The sensor conductance clearly rises with the concentration of methanol in the gas phase. In comparison to ethanol and acetone, the sensor responds substantially more to methanol. This can be attributed to the adsorption-based sensing mechanism, where methanol, owing to its higher polarity and lower steric hindrance, interacts more effectively with the sensor surface through hydrogen bonding [61].
The chitosan/Fe3O4-NPs-based conductometric sensor has a response time (tRes) of 9 to 12 s as the analyte concentration increases (Figure 10). In contrast, the recovery time (tRec), which is defined as the time necessary for the signal to return to baseline after being removed from the headspace, ranges between 20 and 27 s.
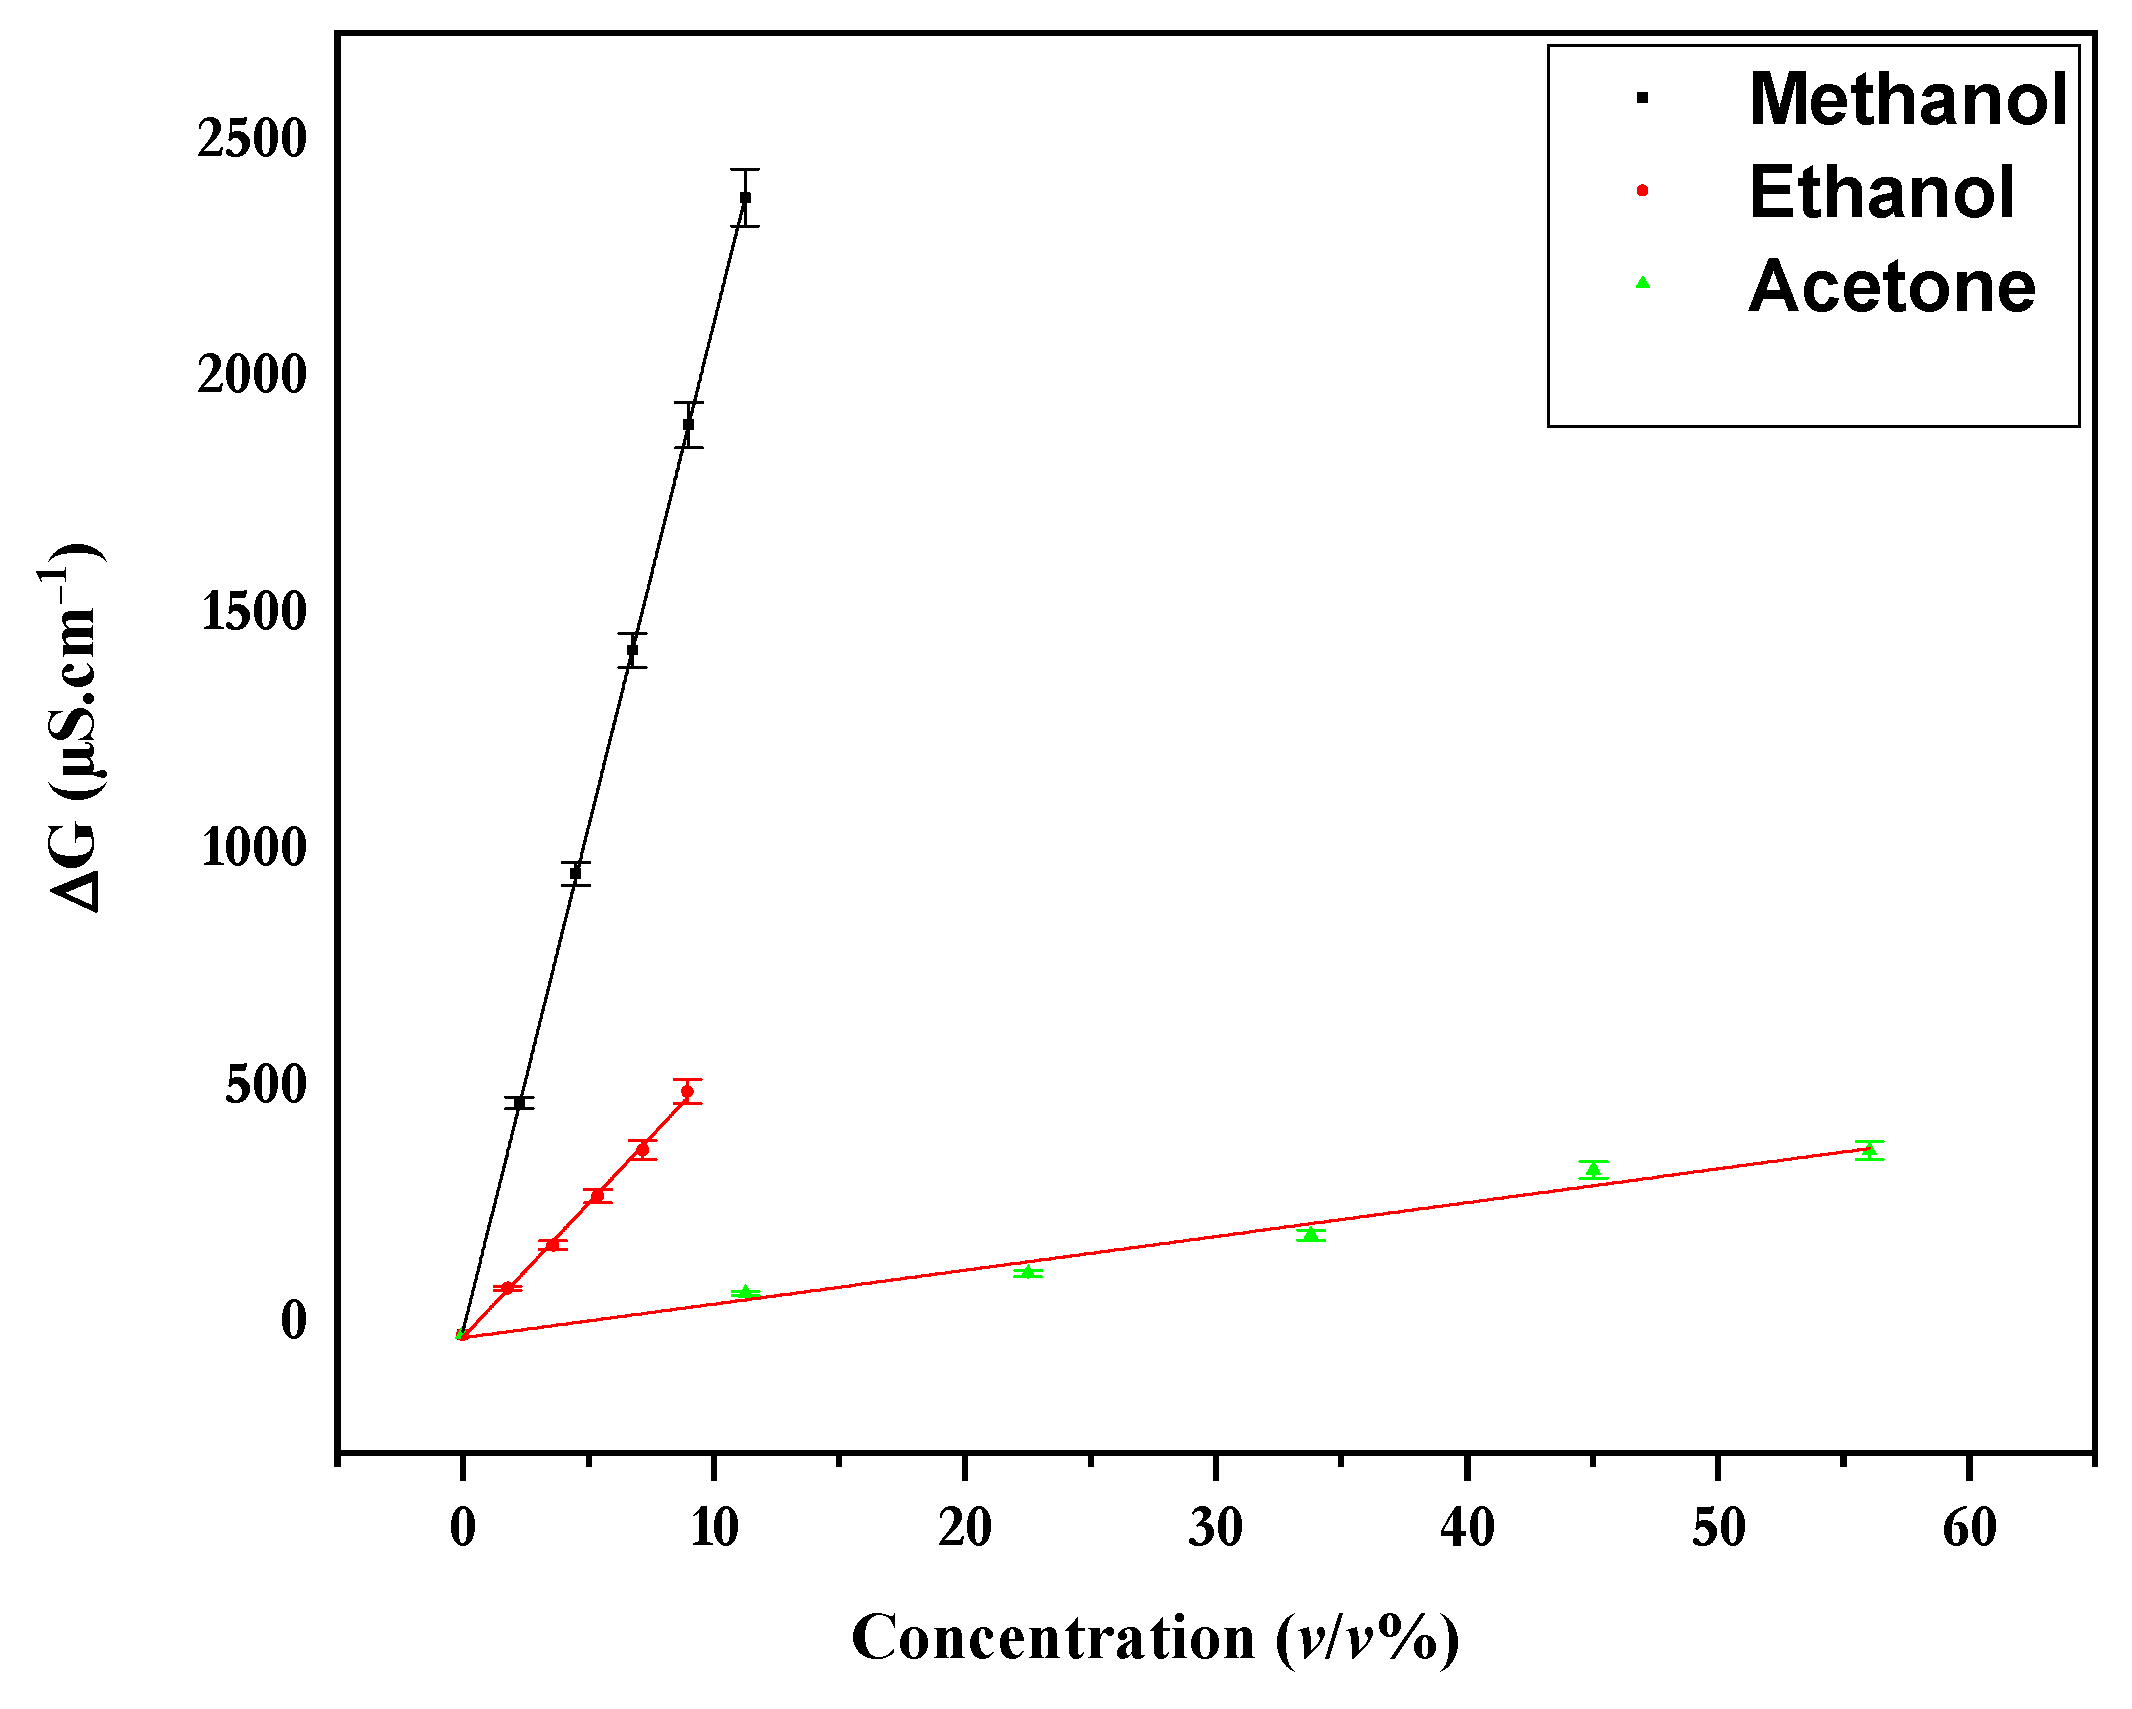
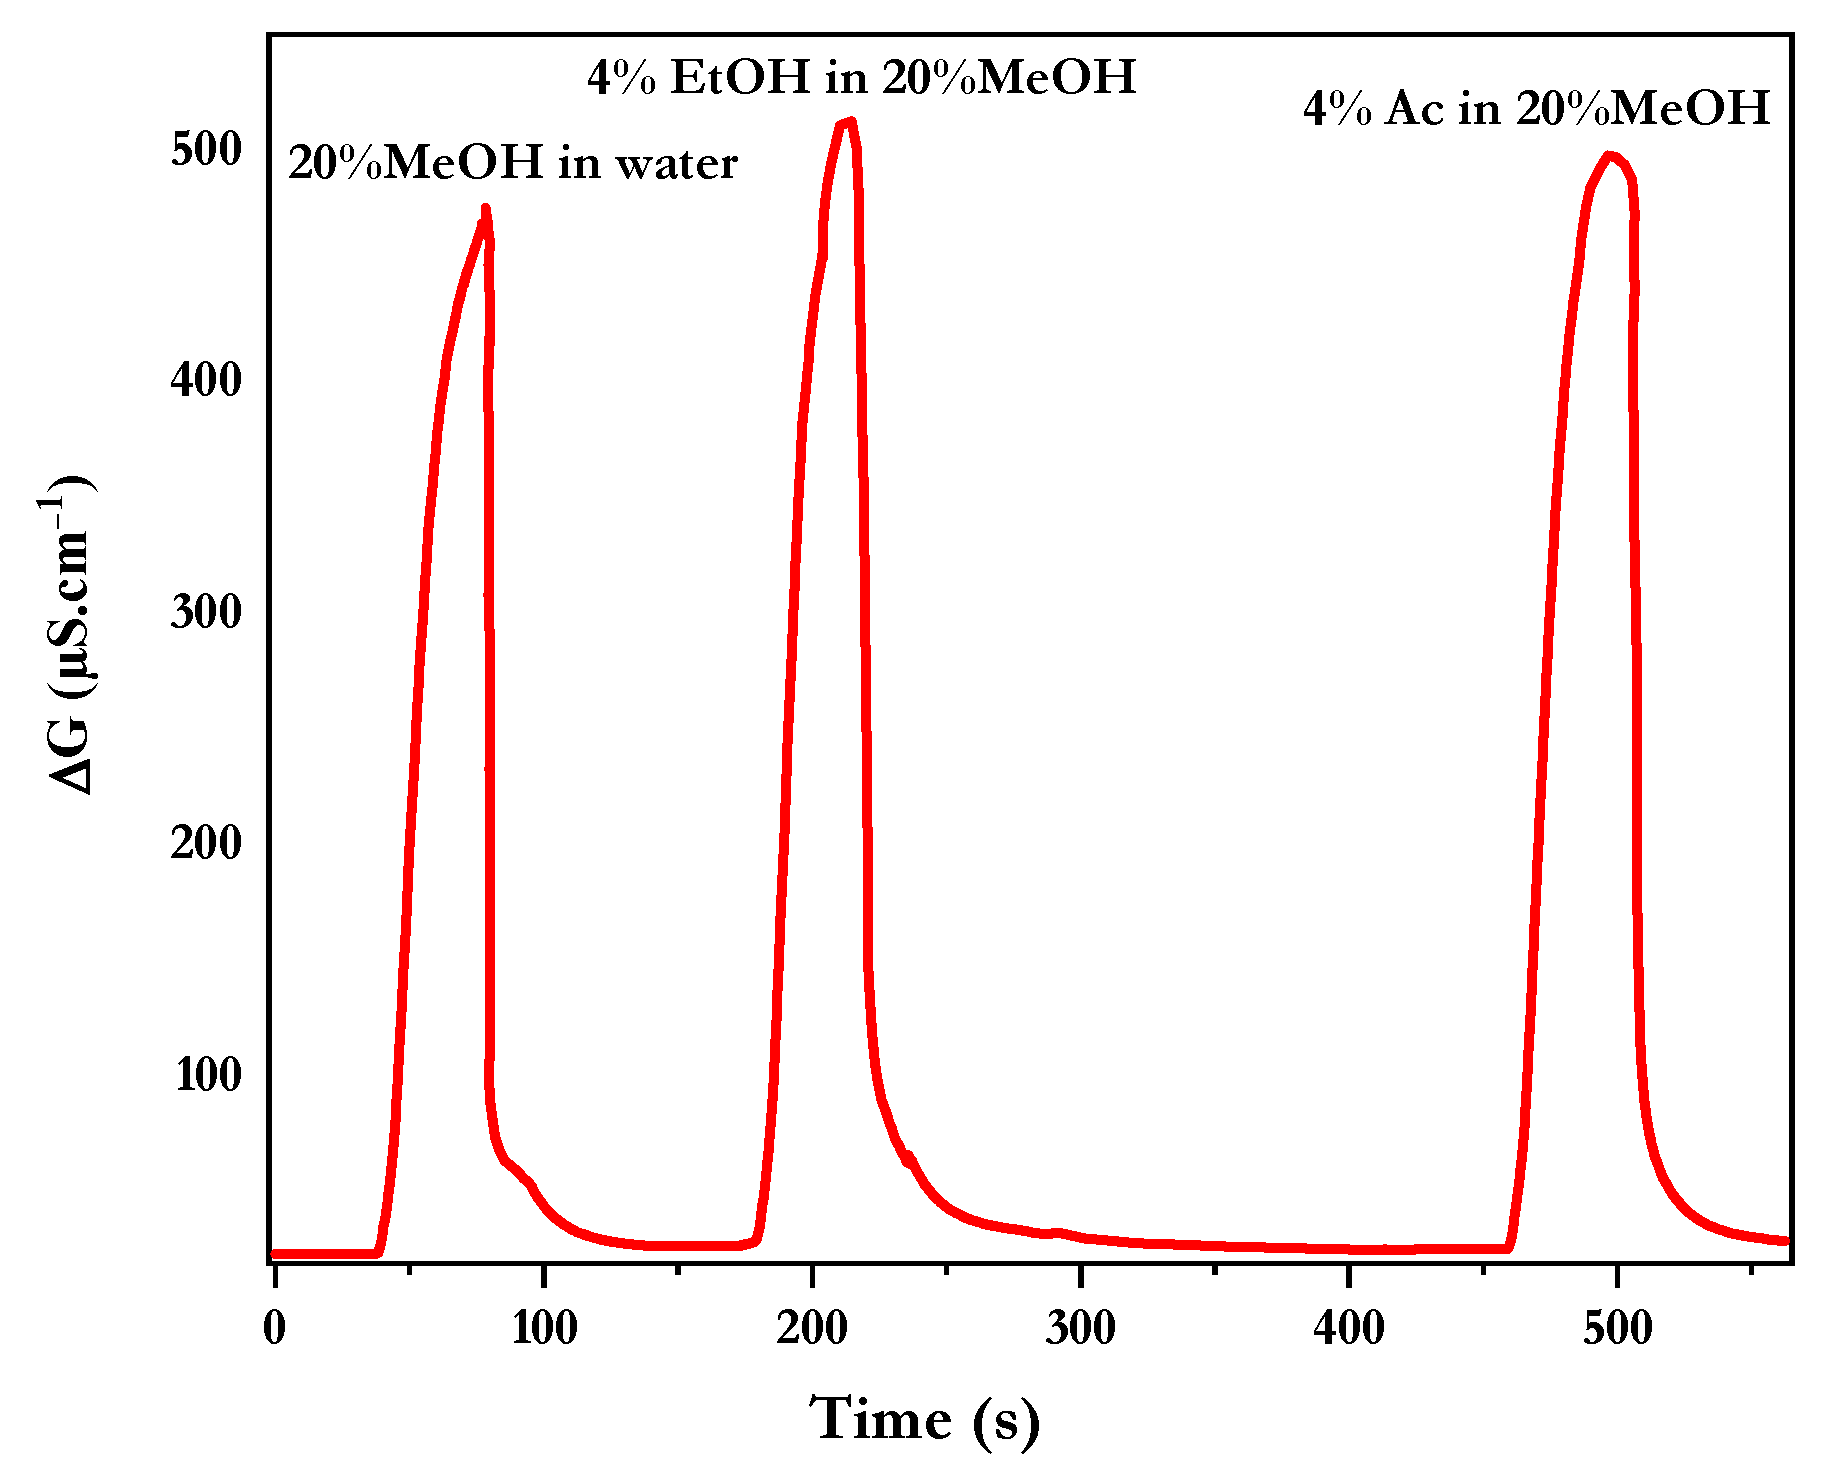
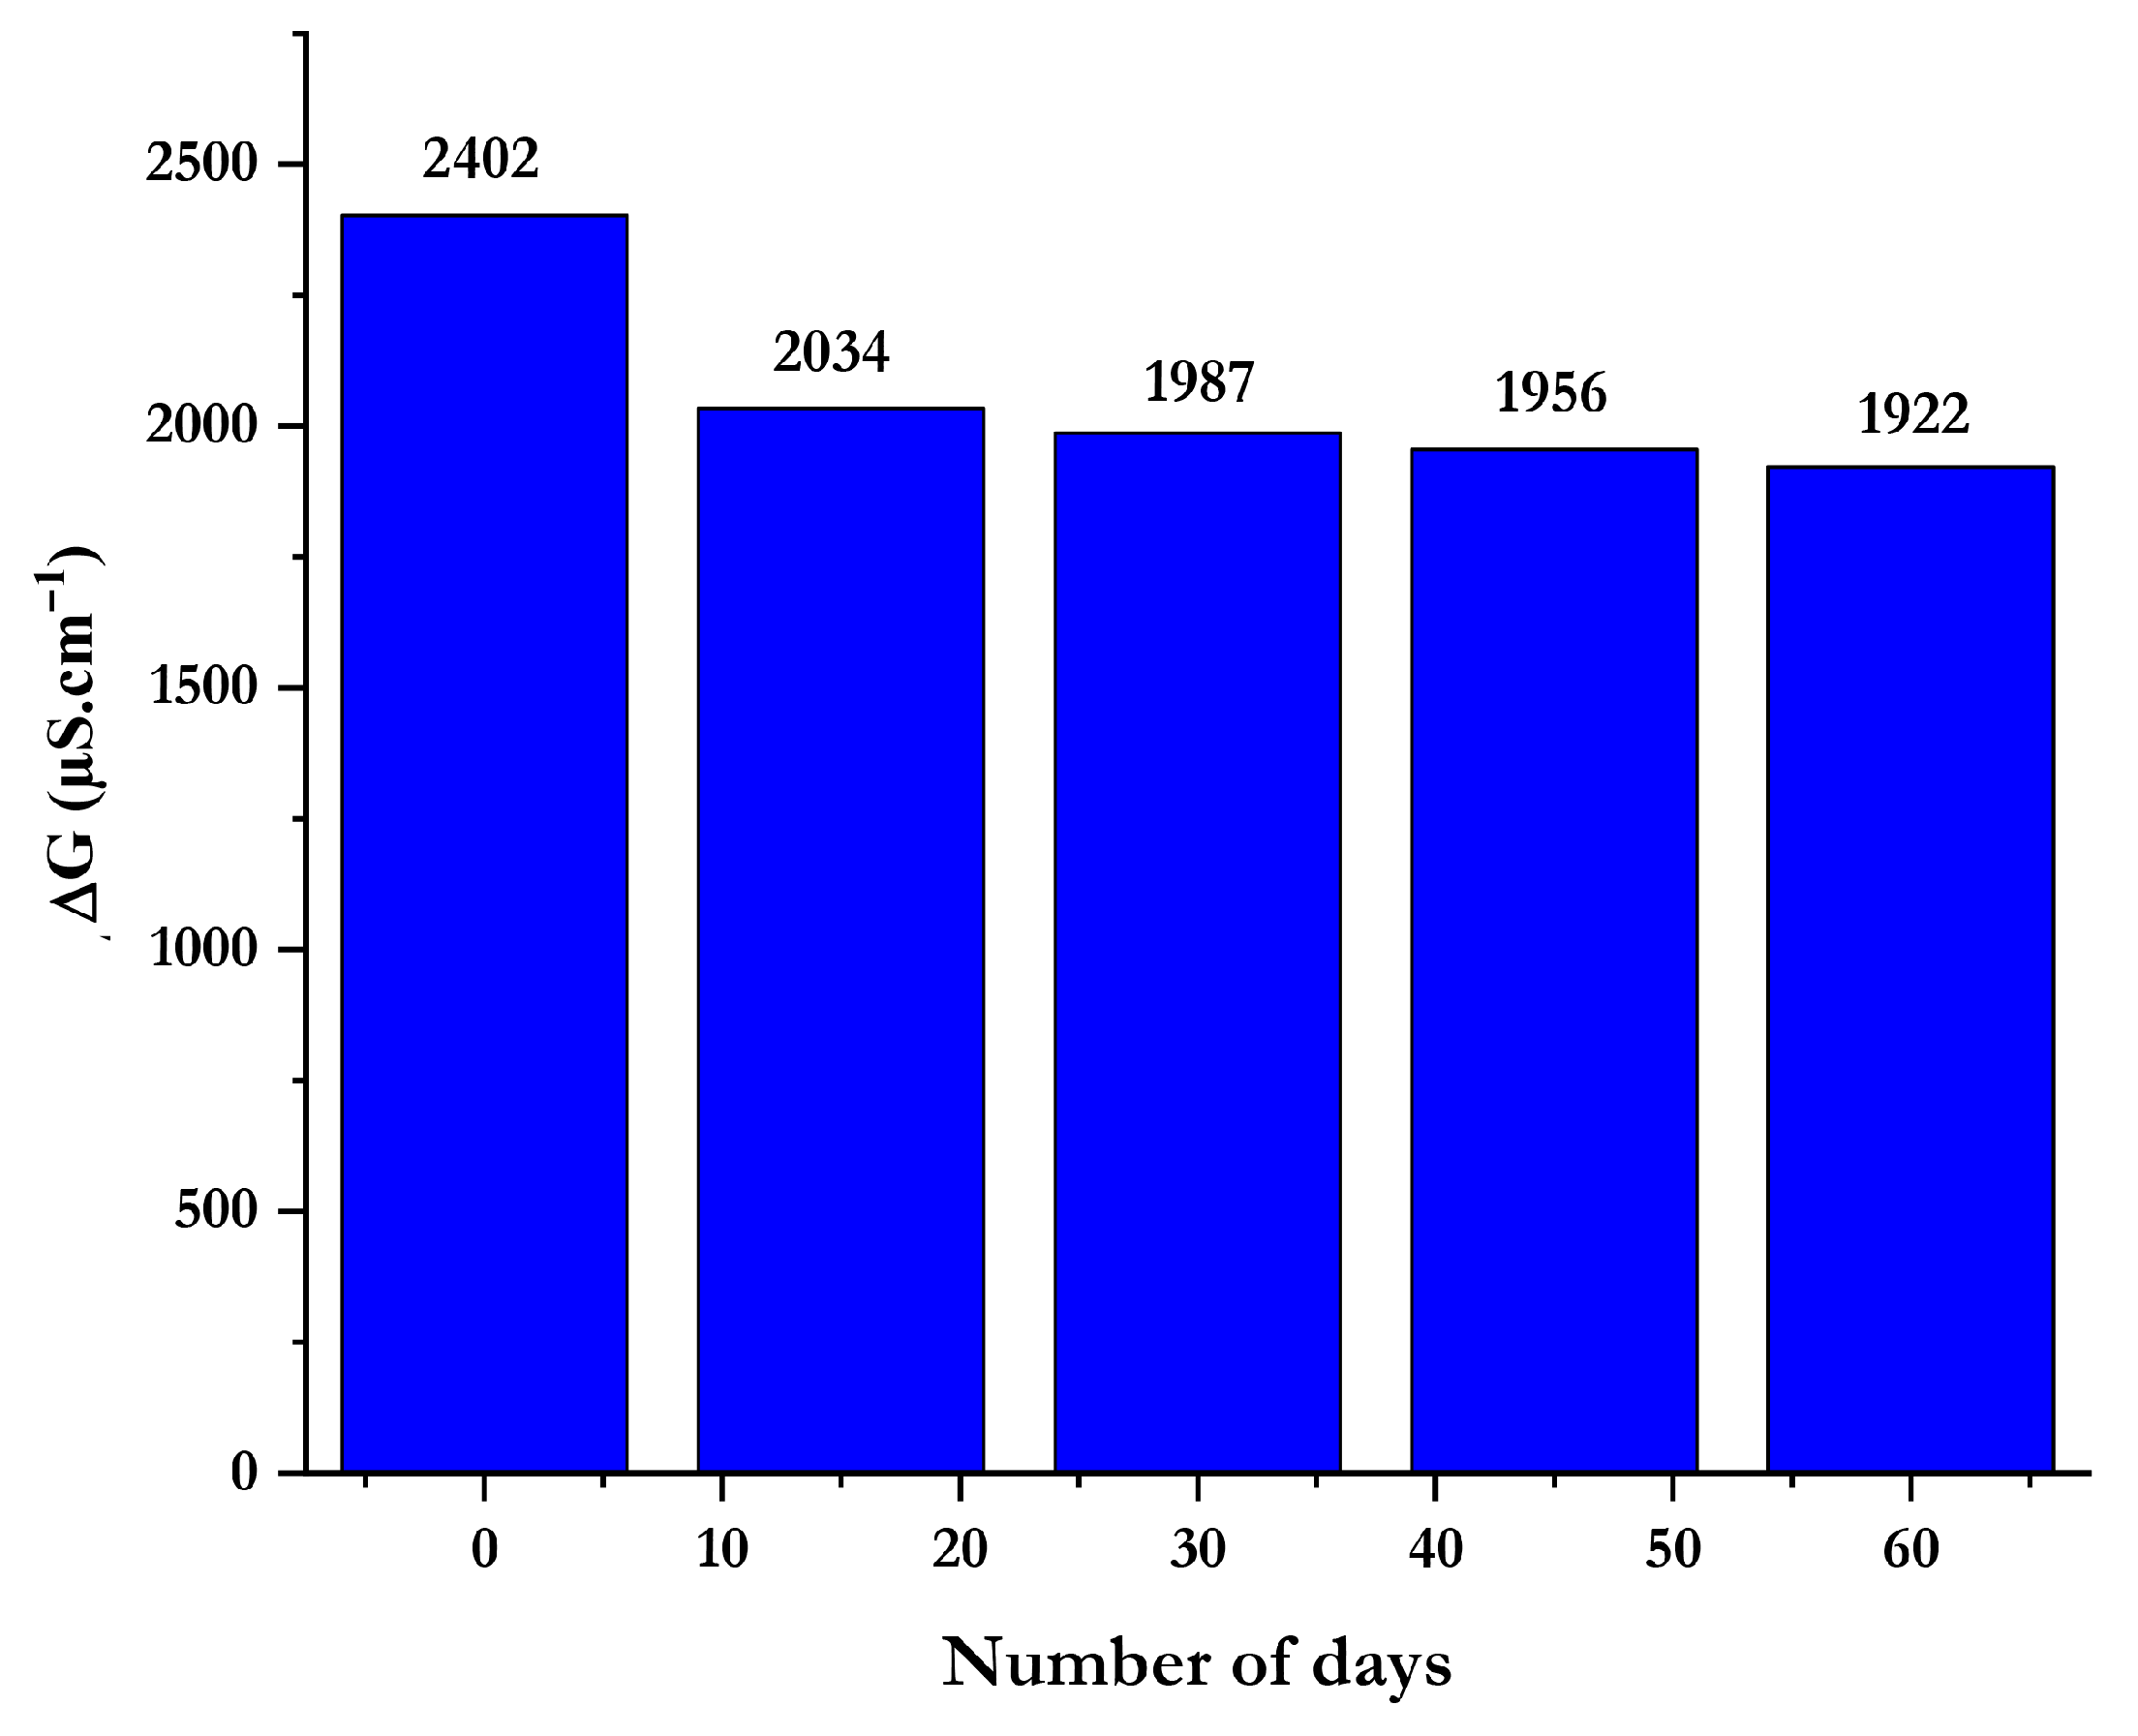
Figure 11 illustrates the variation in the change in electrical conductivity (ΔG) of the sensing film as a function of the analyte concentration for methanol, ethanol, and acetone vapors. A clear linear relationship is observed in all cases, confirming that the sensor response is proportional to analyte concentration within the tested range. Methanol presents the highest linearity (R2 = 0.99997), the steepest slope, and the highest sensitivity (213 ± 4 μS.cm−1 per v/v%), which is roughly 3.7 times higher than that of ethanol (57 ± 1 μS·cm−1·(v/v)) and roughly 30 times higher than that of acetone (7.0 ± 0.1 μS·cm−1·(v/v)). The higher response toward methanol can be attributed to its smaller molecular size, higher polarity, and stronger hydrogen-bonding ability, which facilitate adsorption and protonic conduction at the active surface. In contrast, acetone, being less polar and incapable of forming strong hydrogen bonds, exhibits minimal interaction and thus the lowest conductivity variation [62]. The limit of detection (LOD) was calculated from the calibration curves using the expression 3σ/S, where σ represents the noise level of the blank signal, and S is the slope of the calibration curve [13]. The detection limit of the chitosan/Fe3O4-NPs-based sensor for methanol in the gas phase is 0.06 v/v% (600 ppm), which corresponds to 0.015 M in the aqueous phase. The applicability of this sensing system for the selective detection of short-chain alcohols, especially methanol, in mixed vapor environments is further demonstrated by the linear and reversible behavior of ΔG with increasing concentration. Despite the hygroscopic nature of chitosan, the differential measurement mode successfully suppresses water vapor interference. The dynamic response of the sensor to successive exposures to 20% methanol in water, 4% ethanol in 20% methanol, and 4% acetone in 20% methanol vapors is depicted in Figure 12, indicating that these substances cause an interference of less than 7%. The methanol signal presents good repeatability with a 2% relative standard deviation for five independent measurements with the same sensor. The reusability of the CS/Fe3O4-AHA film sensor was tested by measuring pure methanol four times at 15-day intervals. A slight decline in response was noted throughout all of the four cycles, most likely as a result of a slight degradation in the homogeneity of the film. The results are summarized in Figure 13, and the sensor lost 15% of its initial signal after 10 days and 5% after the following 50 days, when stored at 4 °C between measurements. The reproducibility obtained with 5 different sensors is 7%.
To the best of our knowledge, this work is the first use of chitosan/AHA-Fe3O4 nanocomposites for conductometric methanol detection, although several methanol sensors have been described (Table 2) [13,63,64,65,66,67,68,69,70,71,72]. The present sensor works at ambient temperature, which presents the advantage of saving energy. It is not the case for sensors based on TiO2-doped CdS [61], Pd-doped SnO2 nanoparticles [63], Pd–Pt–In2O3/SnO2 [65], ZnO/MoO3 [66], or rGO–TiO2 nanotubes [67], which must be heated to a high temperature. Compared to other sensors working at ambient temperature, based on NiPc and ZnS, the response time and the detection limit of the present sensor are the lowest. Nevertheless, the detection limit of the present sensor is rather high, which would restrict the application domain (sensor not suitable for low-ppm safety applications).

3.2.3. Proposed Mechanism for the Methanol Detection

The adsorption and desorption of gas molecules on the surface of the sensing films cause variations in the resistance of the magnetite gas sensor (see reactions (4) to (6)) [13]. The oxygen ions adsorbed on the surface of the AHA-capped Fe3O4 NPs can produce a depletion layer, withdrawing electrons from the bulk and increasing the electrical resistance. Oxygen adsorbates will react with the reducing gas (methanol, CH3OH), after being exposed to it, allowing the electrons to be injected back into the active material and increasing electrical conductivity [72]. The following reactions can be used to explain the chemical process at play:
O2 (gas) → O2 adsorbed
O2 adsorbed + 2e ↔ 2O (adsorption)
CH3OH (vapor) + 3O (adsorption) ↔ CO2 + 2H2O + 3e
e + h+ → null + energy
where the h+ means the holes with a positive charge.
The first step of the mechanism is the adsorption of oxygen molecules on the AHA-Fe3O4. This material is an excellent electrocatalyst for the oxygen reduction reaction, due to its high affinity for oxygen [20]. When compared to AHA-ZnS [13], oxygen is not adsorbed on the ZnS crystal itself but on its vacancies [21], leading to a lower adsorption density. This point can explain why the sensitivity of methanol detection is four times higher with AHA-Fe3O4 than with AHA-ZnS.
The sensor responds more strongly to methanol than ethanol or acetone due to the stronger polarity and lower steric hindrance of methanol during adsorption. Hydrogen bonding allows for a better interaction with the sensor [73].

3.3. Application of the Methanol Sensor

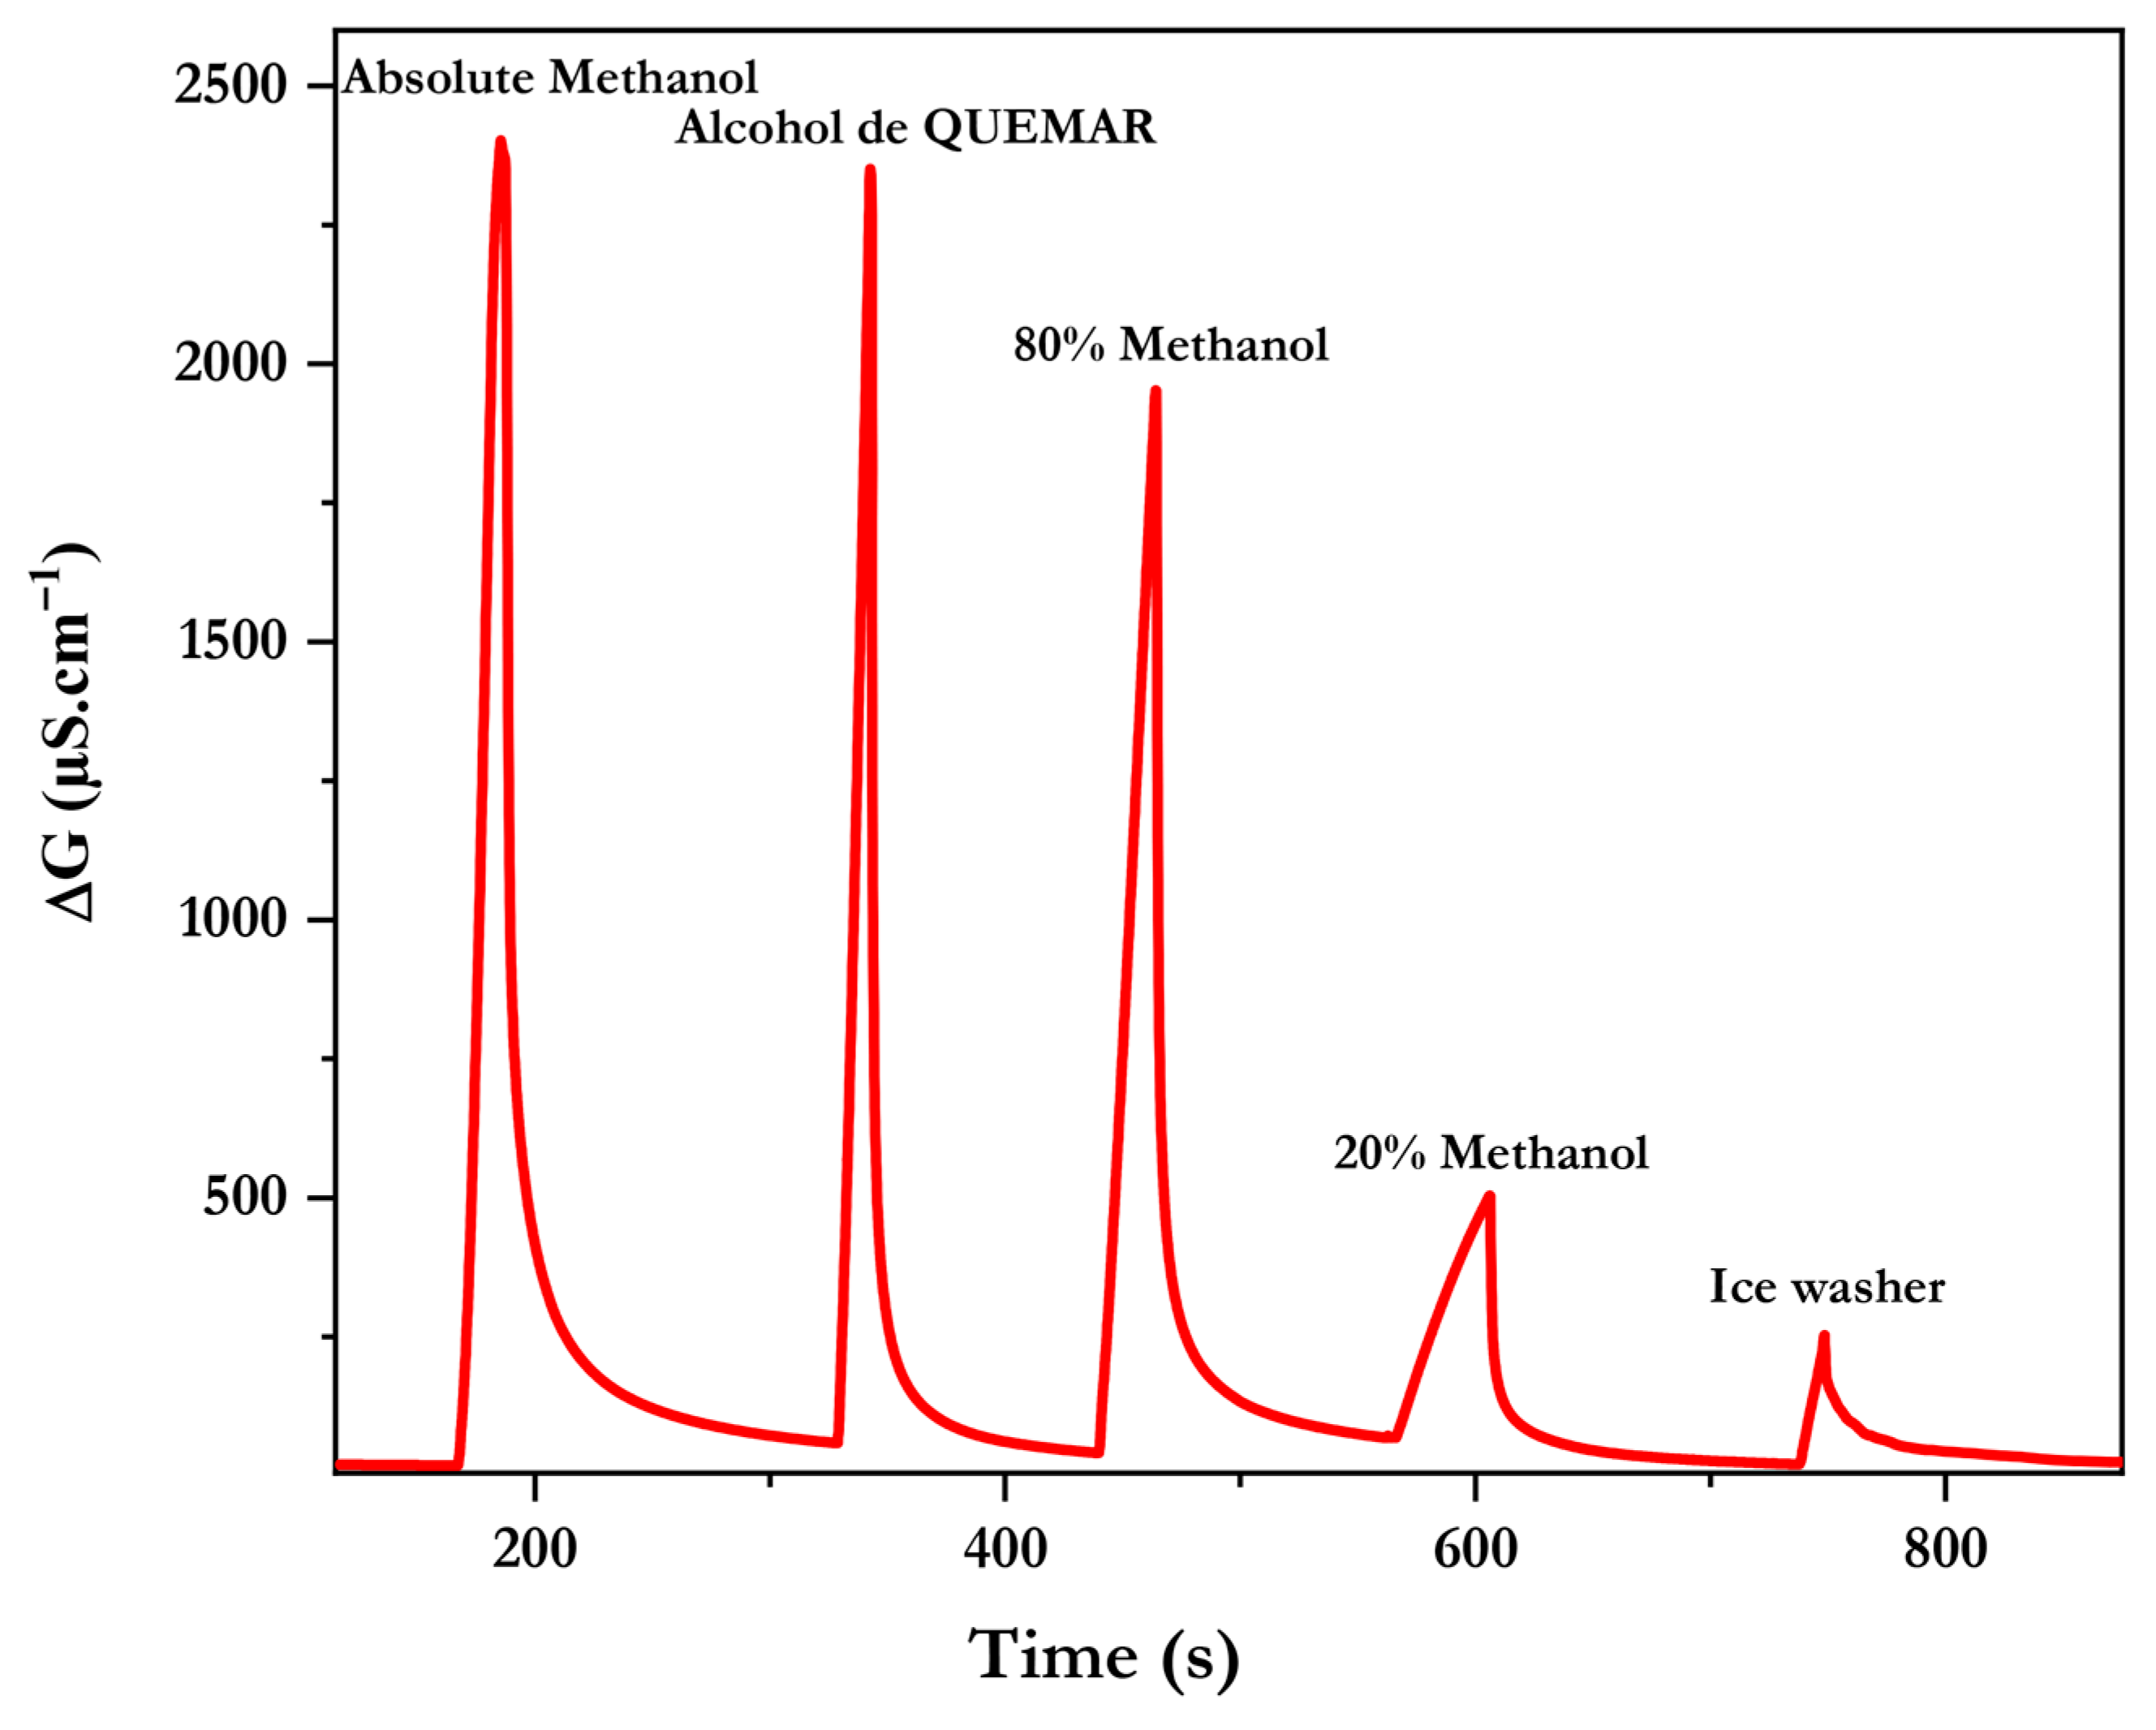
Two commercial products were chosen for testing in this section. The first is a windshield washing and degreasing solution called “New Standard 10% Methanol Ice Washer,” which has around 10% methanol in it. The second product, rubbing alcohol “Alcohol de QUEMAR,” is frequently used as an antifreeze solvent or as fuel for fires and barbecues. It contains around 95% methanol. Furthermore, when used domestically, it works well as a cleanser for tough stains, a polishing agent for diverse surfaces, and a general-purpose disinfectant. The vapors in the headspace of the New Standard 10% Methanol Ice Washer and 95% methanol rubbing alcohol were used after the gas-phase detection of absolute methanol (80%) and diluted methanol (20%) were tested (Figure 14). The Ice Washer sample headspace led to a conductivity of 252 µS.cm−1, which corresponds to 1.15 ± 0.23 v/v%. The concentration of rubbing alcohol in the liquid phase is 0.28 ± 0.06 M. This corresponds to 10.22 ± 2 v/v%, which is consistent with the 10% value provided by the vendor. The conductivity measured in the gas phase of the Alcohol de QUEMAR sample was 2351 μS·cm−1, corresponding to a methanol concentration of 10.92 ± 0.23 v/v% in the gas phase. This value translates to 2.7 ± 0.06 M in the aqueous phase, equivalent to 97.06 ± 2%, which is in good agreement with the nominal concentration of 95% reported by the manufacturer.

4. Conclusions

In this study, Artemisia Herba Alba extract is used as a capping agent in a new, environmentally friendly production of Fe3O4 nanoparticles at ambient temperature. Structural analysis (FTIR, XRD) confirmed successful surface functionalization and a cubic spinel structural phase, with HRTEM and Scherrer analysis showing an average size of ~6 nm. For sensor testing, gaseous samples of acetone, ethanol, and methanol were taken from the headspace above aqueous solutions with specified concentrations. These AHA-Fe3O4 NPs worked as a highly sensitive methanol vapor sensor when incorporated into a chitosan film. They present a rapid response time (9–12 s) from lower concentrations to higher concentrations, which is significantly faster than previously documented amperometric methanol sensors. The detection limit of the methanol microsensor in the gas phase is 600 ppm. It demonstrates excellent selectivity, with a response to methanol that is 3.7 and 30 times higher than to ethanol and acetone, respectively. The sensor was successfully applied to detect methanol in two commercial product samples. While this detection limit is high compared to existing amperometric sensors, the platform offers a significant advantage: it works at ambient temperature and presents good reusability for two months.

Supplementary Materials

The following supporting information can be downloaded at https://www.mdpi.com/article/10.3390/chemosensors14040090/s1: Figure S1: Chronoamperometric measurement monitoring of electrodeposition of chitosan/Fe3O4 NPs; Figure S2: Diagram of the experimental setup. Table S1: Equilibrium gaseous phase concentrations above aqueous methanol, ethanol, and acetone solution at 25 °C per Henry’s law constants reported by Sender et al. [38].

Author Contributions

Conceptualization, A.E. (Abdelhamid Elaissari) and A.E. (Abdelhamid Errachid); investigation, S.O. and E.E.; methodology, A.E. (Abdelhamid Errachid) and E.E.; writing—original draft preparation, S.O. and S.K.; writing—review and editing, N.J.-R. All authors have read and agreed to the published version of the manuscript.

Funding

The CNRS is acknowledged for the IRP NARES. Campus France is acknowledged for the financial support through PHC Maghreb EMBISALIM. S. OUNI thanks the University of Monastir for providing the scholarship.

Institutional Review Board Statement

Not applicable.

Informed Consent Statement

Not applicable.

Data Availability Statement

Data are available on demand.

Conflicts of Interest

The authors declare no conflicts of interest.

References

  1. Yahyazadeh, A.; Nanda, S.; Dalai, A.K. A Critical Review of the Sustainable Production and Application of Methanol as a Biochemical and Bioenergy Carrier. Reactions 2024, 5, 1–19. [Google Scholar] [CrossRef]
  2. Simon Araya, S.; Liso, V.; Cui, X.; Li, N.; Zhu, J.; Sahlin, S.L.; Jensen, S.H.; Nielsen, M.P.; Kær, S.K. A Review of The Methanol Economy: The Fuel Cell Route. Energies 2020, 13, 596. [Google Scholar] [CrossRef]
  3. Fasihi, M.; Breyer, C. Global production potential of green methanol based on variable renewable electricity. Energy Environ. Sci. 2024, 17, 3503–3522. [Google Scholar] [CrossRef]
  4. Nathrath, P.; Kroll, F.; Karmann, D.; Geißelbrecht, M.; Schühle, P. Methanol production in a sustainable, mild and competitive process: Concept launch and analysis. Green Chem. 2025, 27, 9268–9279. [Google Scholar] [CrossRef]
  5. Dalena, F.; Senatore, A.; Basile, M.; Knani, S.; Basile, A.; Iulianelli, A. Advances in Methanol Production and Utilization, with Particular Emphasis toward Hydrogen Generation via Membrane Reactor Technology. Membranes 2018, 8, 98. [Google Scholar] [CrossRef]
  6. Malik, M.I.; Abatzoglou, N.; Achouri, I.E. Methanol to Formaldehyde: An Overview of Surface Studies and Performance of an Iron Molybdate Catalyst. Catalysts 2021, 11, 893. [Google Scholar] [CrossRef]
  7. Mojica, C.V.; Pasol, E.A.; Dizon, M.L.; Kiat, W.A.; Lim, T.R.U.; Dominguez, J.C.; Valencia, V.V.; Tuaño, B.J.P. Chronic methanol toxicity through topical and inhalational routes presenting as vision loss and restricted diffusion of the optic nerves on MRI: A case report and literature review. eNeurologicalSci 2020, 20, 100258. [Google Scholar] [CrossRef]
  8. Briones-Claudett, K.H.; Briones-Claudett, M.H.; Briones-Zamora, K.H.; Briones-Zamora, A.D.; Granados Higgins, P.; Briones Marquez, D.; Benítes Solís, J.; Barberan-Torres, P.; Grunauer, M. Therapeutic Segmental Pulmonary Lavage for Methanol Inhalation Poisoning in a Shrimp Processing Plant Worker: A Novel Approach to Toxic Inhalants. J. Investig. Med. High Impact Case Rep. 2025, 13, 23247096251377186. [Google Scholar] [CrossRef]
  9. Wang, H.; Shao, Z.; Cai, M.; Shi, G.; Sun, B. Efficient Cataluminescence Sensor for Detecting Methanol Based on NiCo2O4//MIL-Ti125 Polyhedral Composite Nano-Materials. Chemosensors 2025, 13, 339. [Google Scholar] [CrossRef]
  10. Pooja; Pawar, R.; Subramanian, V. Studies on the electrochemical oxidation of methanol using La2MO4 (M = Ni, Cu and Zn) catalysts. Catal. Sci. Technol. 2025, 15, 6678–6692. [Google Scholar] [CrossRef]
  11. Ba Hashwan, S.S.; Khir, M.H.M.; Nawi, I.M.; Ahmad, M.R.; Hanif, M.; Zahoor, F.; Al-Douri, Y.; Algamili, A.S.; Bature, U.I.; Alabsi, S.S.; et al. A review of piezoelectric MEMS sensors and actuators for gas detection application. Discov. Nano 2023, 18, 25. [Google Scholar] [CrossRef]
  12. Lou, S.; Yuan, F.; Qin, Z.; Yang, Y.; Teng, X.; Lu, C. A novel cataluminescence sensor for rapid detection of methanol at low working temperature based on Ni/CeO2 catalyst. Analyst 2025, 150, 3551–3558. [Google Scholar] [CrossRef] [PubMed]
  13. Ouni, S.; Madaci, A.; Haouari, M.; Mohamed, N.B.H.; Bessueille, F.; Elaissari, A.; Errachid, A.; Jaffrezic-Renault, N. A novel conductometric micro-sensor for methanol detection based on chitosan/zinc sulfide-nanoparticles composite obtained by green synthesis. J. Inorg. Organomet. Polym. Mater. 2023, 33, 2574–2585. [Google Scholar] [CrossRef]
  14. Khnykov, A.Y.; Vdovichenko, A.Y.; Chvalun, S.N. Nanostructured Materials for Gas Sensors. Nanotechnol. Russ. 2025, 20, 101–117. [Google Scholar] [CrossRef]
  15. Sun, Y.-F.; Liu, S.-B.; Meng, F.-L.; Liu, J.-Y.; Jin, Z.; Kong, L.-T.; Liu, J.-H. Metal Oxide Nanostructures and Their Gas Sensing Properties: A Review. Sensors 2012, 12, 2610–2631. [Google Scholar] [CrossRef] [PubMed]
  16. Boultif, W.; Dehchar, C.; Belhocine, Y.; Zouaoui, E.; Rahali, S.; Zouari, S.E.; Sbei, N.; Seydou, M. Chitosan and Metal Oxide Functionalized Chitosan as Efficient Sensors for Lead (II) Detection in Wastewater. Separations 2023, 10, 479. [Google Scholar] [CrossRef]
  17. Freire, T.M.; Dutra, L.M.U.; Queiroz, D.C.; Ricardo, N.M.P.S.; Barreto, K.; Denardin, J.C.; Wurm, F.R.; Sousa, C.P.; Correia, A.N.; de Lima-Neto, P.; et al. Fast ultrasound assisted synthesis of chitosan-based magnetite nanocomposites as a modified electrode sensor. Carbohydr. Polym. 2016, 151, 760–769. [Google Scholar] [CrossRef]
  18. Chachuli, S.A.M.; Muhammad ‘Azmi, N.A.; Shamsudin, N.H.; Coban, O.; Aziz, S.A.C. Impact of Chitosan as a Binder in Graphene Gas Sensor for Volatile Organic Compound Detection. Chem. Sel. 2025, 10, e202405111. [Google Scholar] [CrossRef]
  19. Pitakrut, S.; Sanchayanukun, P.; Karuwan, C.; Muncharoen, S. Application of Chitosan@Fe3O4 Nanoparticle-Modified Screen-Printed Graphene-Based Electrode for Simultaneous Analysis of Nitrite and Ascorbic Acid in Hydroponics and Fruit Juice. Sensors 2025, 25, 1431. [Google Scholar] [CrossRef]
  20. Zhang, J.; Wang, J.; Fu, Y.; Peng, X.; Xia, M.; Peng, W.; Liang, Y.; Wei, W. Nanoscale Fe3O4 Electrocatalysts for Oxygen Reduction Reaction. Molecules 2025, 30, 1753. [Google Scholar] [CrossRef]
  21. Chen, J.; Chen, Y. A first-principle study of the effect of vacancy defects and impurities on the adsorption of O2 on sphalerite surfaces. Colloids Surf. A Physicochem. Eng. Asp. 2010, 363, 56–63. [Google Scholar] [CrossRef]
  22. Sharma, R.K.; Dutta, S.; Sharma, S.; Zboril, R.; Varma, R.S.; Gawande, M.B. Fe3O4 (iron oxide)-supported nanocatalysts: Synthesis, characterization and applications in coupling reactions. Green Chem. 2026, 18, 3184–3209. [Google Scholar] [CrossRef]
  23. Asab, G.; Zereffa, E.A.; Abdo Seghne, T. Synthesis of Silica-Coated Fe3O4 Nanoparticles by Microemulsion Method: Characterization and Evaluation of Antimicrobial Activity. Int. J. Biomater. 2020, 2020, 4783612. [Google Scholar] [CrossRef]
  24. Ganapathe, L.S.; Mohamed, M.A.; Mohamad Yunus, R.; Berhanuddin, D.D. Magnetite (Fe3O4) Nanoparticles in Biomedical Application: From Synthesis to Surface Functionalisation. Magnetochemistry 2020, 6, 68. [Google Scholar] [CrossRef]
  25. Kharissova, O.V.; Kharisov, B.I.; Oliva González, C.M.; Méndez, Y.P.; López, I. Greener synthesis of chemical compounds and materials. R. Soc. Open Sci. 2019, 6, 191378. [Google Scholar] [CrossRef]
  26. El-Seedi, H.R.; Omara, M.S.; Omar, A.H.; Elakshar, M.M.; Shoukhba, Y.M.; Duman, H.; Karav, S.; Rashwan, A.K.; El-Seedi, A.H.; Altaleb, H.A.; et al. Updated Review of Metal Nanoparticles Fabricated by Green Chemistry Using Natural Extracts: Biosynthesis, Mechanisms, and Applications. Bioengineering 2024, 11, 1095. [Google Scholar] [CrossRef]
  27. Eker, F.; Akdaşçi, E.; Duman, H.; Bechelany, M.; Karav, S. Green Synthesis of Silver Nanoparticles Using Plant Extracts: A Comprehensive Review of Physicochemical Properties and Multifunctional Applications. Int. J. Mol. Sci. 2025, 26, 6222. [Google Scholar] [CrossRef]
  28. Elizondo-Villarreal, N.; Verástegui-Domínguez, L.; Rodríguez-Batista, R.; Gándara-Martínez, E.; Alcorta-García, A.; Martínez-Delgado, D.; Rodríguez-Castellanos, E.A.; Vázquez-Rodríguez, F.; Gómez-Rodríguez, C. Green Synthesis of Magnetic Nanoparticles of Iron Oxide Using Aqueous Extracts of Lemon Peel Waste and Its Application in Anti-Corrosive Coatings. Materials 2022, 15, 8328. [Google Scholar] [CrossRef]
  29. Karami, N.; Mohammadpour, A.; Samaei, M.R.; Amani, A.M.; Dehghani, M.; Varma, R.S.; Sahu, J.N. Green synthesis of sustainable magnetic nanoparticles Fe3O4 and Fe3O4-chitosan derived from Prosopis farcta biomass extract and their performance in the sorption of lead(II). Int. J. Biol. Macromol. 2024, 254, 127663. [Google Scholar] [CrossRef]
  30. Zhang, W.; Li, X.; Zou, R.; Wu, H.; Shi, H.; Yu, S.; Liu, Y. Multifunctional glucose biosensors from Fe3O4 nanoparticles modified chitosan/graphene nanocomposites. Sci. Rep. 2015, 5, 11129. [Google Scholar] [CrossRef]
  31. Rukshan, R.; Rajapaksha, N.; Wijayawardana, S.; Thambiliyagodage, C.; Senevirathne, U.; Jayanetti, M.; Samarakoon, U. Fe3O4–Chitosan Nanocomposite as a pH-Responsive Delivery System for Enhanced Delivery of Punica granatum L. Polyphenols. ACS Omega 2025, 10, 50488–50510. [Google Scholar] [CrossRef] [PubMed]
  32. Bassim, S.; Mageed, A.K.; AbdulRazak, A.A.; Majdi, H.S. Green Synthesis of Fe3O4 Nanoparticles and Its Applications in Wastewater Treatment. Inorganics 2022, 10, 260. [Google Scholar] [CrossRef]
  33. Arias, J.L.; Reddy, L.H.; Couvreur, P. Fe3O4/chitosan nanocomposite for magnetic drug targeting to cancer. J. Mater. Chem. 2012, 22, 7622–7632. [Google Scholar] [CrossRef]
  34. Safari, J.; Javadian, L. Chitosan decorated Fe3O4 nanoparticles as a magnetic catalyst in the synthesis of phenytoin derivatives. RSC Adv. 2014, 4, 48973–48979. [Google Scholar] [CrossRef]
  35. Nazari, F.; Ghoreishi, S.M.; Khoobi, A. Bio-based Fe3O4/chitosan nanocomposite sensor for response surface methodology and sensitive determination of gallic acid. Int. J. Biol. Macromol. 2020, 160, 456–469. [Google Scholar] [CrossRef]
  36. Ouni, S.; Mohamed, N.; Haouari, M.; Elaissari, A.; Errachid, A.; Jaffrezic-Renault, N. A Novel Green Synthesis of Zinc Sulfide Nano-Adsorbents Using Artemisia Herba Alba Plant Extract for Adsorption and Photocatalysis of Methylene Blue Dye. Chem. Afr. 2023, 6, 2523–2535. [Google Scholar] [CrossRef]
  37. Madaci, A.; Suwannin, P.; Raffin, G.; Hangouet, M.; Martin, M.; Ferkous, H.; Bouzid, A.; Bausells, J.; Elaissari, A.; Errachid, A.; et al. A Sensitive Micro Conductometric Ethanol Sensor Based on an Alcohol Dehydrogenase-Gold Nanoparticle Chitosan Composite. Nanomaterials 2023, 13, 2316. [Google Scholar] [CrossRef]
  38. Razmshoar, P.; Besbes, F.; Madaci, A.; Mlika, R.; Bahrami, H.; Rabiee, M.; Martin, M.; Errachid, A.; Jaffrezic-Renault, N. A conductometric enzymatic methanol sensor based on polystyrene—PAMAM dendritic polymer electrospun nanofibers. Talanta 2023, 260, 124630. [Google Scholar] [CrossRef]
  39. Ates, B.; Ulu, A.; Köytepe, S.; Ali Noma, S.A.; Kolat, V.S.; Izgi, T. Magnetic-propelled Fe3O4–chitosan carriers enhance l-asparaginase catalytic activity: A promising strategy for enzyme immobilization. RSC Adv. 2018, 8, 36063–36075. [Google Scholar] [CrossRef]
  40. Khatun, R.; Mamun, M.S.A.; Islam, S.; Khatun, N.; Hakim, M.; Hossain, M.S.; Dhar, P.K.; Barai, H.R. Phytochemical-Assisted Synthesis of Fe3O4 Nanoparticles and Evaluation of Their Catalytic Activity. Micromachines 2022, 13, 2077. [Google Scholar] [CrossRef] [PubMed]
  41. Golabiazar, R. Green Synthesis and Characterization of Magnetite Nanoparticles (Fe3O4 NPs) Using Qazwan Seeds Extract as Antimicrobial Agent. Iran. J. Chem. Chem. Eng. 2023, 42, 2745–2756. [Google Scholar] [CrossRef]
  42. Jaison, J.P.; Balasubramanian, B.; Gangwar, J.; James, N.; Pappuswamy, M.; Anand, A.V.; Al-Dhabi, N.A.; Valan Arasu, M.; Liu, W.C.; Sebastian, J.K. Green Synthesis of Bioinspired Nanoparticles Mediated from Plant Extracts of Asteraceae Family for Potential Biological Applications. Antibiotics 2023, 12, 543. [Google Scholar] [CrossRef]
  43. Abdel-Ghany, H.; Abdel-Shafy, S.; Abuowarda, M.; El-Khateeb, R.; Es, H.; Fahmy, M. Acaricidal activity of Artemisia herba-alba and Melia azedarach oil nanoemulsion against Hyalomma dromedarii and their toxicity on Swiss albino mice. Exp. Appl. Acarol. 2021, 84, 241–262. [Google Scholar] [CrossRef]
  44. Awwad, A.M.; Salem, N.M. A Green and Facile Approach for Synthesis of Magnetite Nanoparticles. Nanosci. Nanotechnol. 2013, 2, 208–213. [Google Scholar] [CrossRef]
  45. Lakhali, H.; Şahin, Ö.; Ceyhan, A.A. A novel core–shell Fe3O4@SiO2/Co–Cr–B magnetic catalyst for efficient and reusable hydrogen evolution from NaBH4 hydrolysis. New J. Chem. 2025, 49, 11304–11325. [Google Scholar] [CrossRef]
  46. Hassan, R.F.; Jeber, J.N.; Abd-Alrazack, H.F.; Hammood, M.K.; Abd, M.M. Sensitive determination of chlorpromazine in pharmaceutical formulations and biological fluids using solid phase extraction followed by HPLC-UV and spectrophotometric analysis. RSC Adv. 2025, 15, 11478–11490. [Google Scholar] [CrossRef]
  47. Ramesh, A.V.; Lavakusa, B.; Mohan, B.S.; Kumar, Y.P.; Devi, D.R.; Basavaiah, K. A Facile Plant Mediated Synthesis of Magnetite Nanoparticles Using Aqueous Leaf Extract of Ficus hispida L. for Adsorption of Organic Dye. IOSR J. Appl. Chem. 2017, 10, 35–43. [Google Scholar] [CrossRef]
  48. Ouni, S.; Mohamed, N.; Bouzidi, M.; Bonilla-Petriciolet, A.; Haouari, M. High impact of thiol capped ZnS nanocrystals on the degradation of single and binary aqueous solutions of industrial azo dyes under sunlight. J. Environ. Chem. Eng. 2021, 9, 105915. [Google Scholar] [CrossRef]
  49. Ouni, S.; Yahia, F.; Mohamed, N.; Bouzidi, M.; Alshammari, A.; Abdulaziz, F.; Bonilla-Petriciolet, A.; Mohamed, M.; Khan, Z.; Chaaben, N.; et al. Effective removal of textile dye via synergy of adsorption and photocatalysis over ZnS nanoparticles: Synthesis, modeling, and mechanism. Heliyon 2024, 10, e36949. [Google Scholar] [CrossRef]
  50. Ouni, S.; Mohamed, N.; Chaaben, N.; Bonilla-Petriciolet, A.; Haouari, M. Fast and effective catalytic degradation of an organic dye by eco-friendly capped ZnS and Mn-doped ZnS nanocrystals. Environ. Sci. Pollut. Res. 2022, 29, 33474–33494. [Google Scholar] [CrossRef] [PubMed]
  51. Mohamed, N.; Ouni, S.; Mohamed, B.; Bouzidi, M.; Bonilla-Petriciolet, A.; Haouari, M. Synthesis and preparation of acid capped CdSe nanocrystals as successful adsorbent and photocatalyst for the removal of dyes from water and its statistical physics analysis. Environ. Sci. Pollut. Res. 2022, 29, 72747–72763. [Google Scholar] [CrossRef]
  52. Swastika, P.E.; Ardiyanti, H.; Zurnansyah; Puspitarum, D.L.; Istiqomah, N.I.; Wibowo, N.A.; Suharyadi, E. Commercial chip-based tunneling magnetoresistance sensor for green-synthesized magnetic nanoparticles assay. Sens. Int. 2024, 5, 100288. [Google Scholar] [CrossRef]
  53. Manh, D.H.; Ngoc Nha, T.T.; Hong Phong, L.T.; Nam, P.H.; Thanh, T.D.; Phong, P.T. Determination of the crystalline size of hexagonal La1−xSrx MnO3 (x = 0.3) nanoparticles from X-ray diffraction—A comparative study. RSC Adv. 2023, 13, 25007–25017. [Google Scholar] [CrossRef]
  54. Mohamed, N.; Bouzidi, M.; Ouni, S.; Alshammari, A.; Khan, Z.; Gandouzi, M.; Mohamed, M.; Chaaben, N.; Bonilla-Petriciolet, A.; Haouari, M. Statistical physics analysis of adsorption isotherms and photocatalysis activity of MPA coated CuInS2/ZnS nanocrystals for the removal of methyl blue from wastewaters. Inorg. Chem. Commun. 2022, 144, 109933. [Google Scholar] [CrossRef]
  55. Jeon, S.; Liu, X.; Azersky, C.; Ren, J.; Zhang, S.; Chen, W.; Hyers, R.W.; Costa, K.; Kolbe, M.; Matson, D.M. Particle size effects on dislocation density, microstructure, and phase transformation for high-entropy alloy powders. Materialia 2021, 18, 101161. [Google Scholar] [CrossRef]
  56. Yusefi, M.; Shameli, K.; Su Yee, O.; Teow, S.-Y.; Hedayatnasab, Z.; Jahangirian, H.; Webster, T.J.; Kuča, K. Green Synthesis of Fe3O4 Nanoparticles Stabilized by a Garcinia mangostana Fruit Peel Extract for Hyperthermia and Anticancer Activities. Int. J. Nanomed. 2021, 16, 2515–2532. [Google Scholar] [CrossRef]
  57. Gorylewski, D.; Tyszczuk-Rotko, K. From Synthesis to Sensing: The Insight into the Properties of Fe3O4 Magnetic Nanoparticles and Their Surface Modification Strategies in Voltammetric Trace Determination of Heavy Metal Ions. Molecules 2025, 30, 3796. [Google Scholar] [CrossRef]
  58. Tiama, T.M.; Ismail, A.M.; Elhaes, H.; Ibrahim, M.A. Structural and Spectroscopic Studies for Chitosan/Fe3O4 Nanocomposites as Glycine Biosensors. Biointerface Res. Appl. Chem. 2023, 13, 547. [Google Scholar] [CrossRef]
  59. Lesbayev, A.; Akalim, D.; Kalauov, B.; Yerezhep, D. An Investigation into Fe3O4 Nanoparticle-Based Composites for Enhanced Electromagnetic Radiation Shielding. J. Compos. Sci. 2025, 9, 226. [Google Scholar] [CrossRef]
  60. Freire, T.M.; Fechine, L.M.U.D.; Queiroz, D.C.; Freire, R.M.; Denardin, J.C.; Ricardo, N.M.P.S.; Rodrigues, T.N.B.; Gondim, D.R.; Junior, I.J.S.; Fechine, P.B.A. Magnetic Porous Controlled Fe3O4–Chitosan Nanostructure: An Ecofriendly Adsorbent for Efficient Removal of Azo Dyes. Nanomaterials 2020, 10, 1194. [Google Scholar] [CrossRef]
  61. Phasuksom, K.; Prissanaroon-Ouajai, W.; Sirivat, A. A highly responsive methanol sensor based on graphene oxide/polyindole composites. RSC Adv. 2020, 10, 15206–15220. [Google Scholar] [CrossRef]
  62. Suebphanpho, J.; Boonmak, J. Luminescence turn-on sensor for the selective detection of trace water and methanol based on a Zn(ii) coordination polymer with 2,5-dihydroxyterephthalate. RSC Adv. 2024, 14, 9781–9790. [Google Scholar] [CrossRef]
  63. Fong, C.-F.; Dai, C.-L.; Wu, C.-C. Fabrication and Characterization of a Micro Methanol Sensor Using the CMOS-MEMS Technique. Sensors 2015, 15, 27047–27059. [Google Scholar] [CrossRef]
  64. Liu, Q.; Kirchhoff, J.R. Amperometric detection of methanol with a methanol dehydrogenase modified electrode sensor. J. Electroanal. Chem. 2007, 601, 125–131. [Google Scholar] [CrossRef]
  65. van den Broek, J.; Abegg, S.; Pratsinis, S.E.; Güntner, A.T. Highly selective detection of methanol over ethanol by a handheld gas sensor. Nat. Commun. 2019, 10, 4220. [Google Scholar] [CrossRef] [PubMed]
  66. Li, Y.; Deng, D.; Xing, X.; Chen, N.; Liu, X.; Xiao, X.; Wang, Y. A high performance methanol gas sensor based on palladium-platinum-In2O3 composited nanocrystalline SnO2. Sens. Actuators B Chem. 2016, 237, 133–141. [Google Scholar] [CrossRef]
  67. Mandal, B.; Aaryashree; Singh, R.; Mukherjee, S. Highly Selective and Sensitive Methanol Sensor Using Rose-Like ZnO Microcube and MoO3 Micrograss-Based Composite. IEEE Sens. J. 2018, 18, 2659–2666. [Google Scholar] [CrossRef]
  68. Acharyya, D.; Acharyya, S.; Huang, K.; Chung, P.; Ho, M.; Bhattacharyya, P. Highly Sensitive ppb Level Methanol Sensor by Tuning C:O Ratio of rGO-TiO2 Nanotube Hybrid Structure. IEEE Trans. Nanotechnol. 2017, 16, 1122–1128. [Google Scholar] [CrossRef]
  69. Phasuksom, K.; Prissanaroon-Ouajai, W.; Sirivat, A. Electrical conductivity response of methanol sensor based on conductive polyindole. Sens. Actuators B Chem. 2018, 262, 1013–1023. [Google Scholar] [CrossRef]
  70. Musa, I.; Raffin, G.; Hangouet, M.; Martin, M.; Bausells, J.; Zine, N.; Bellagambi, F.; Jaffrezic-Renault, N.; Errachid, A. Electrospun PVC-nickel phthalocyanine composite nanofiber based conductometric methanol microsensor. Microchem. J. 2022, 182, 107899. [Google Scholar] [CrossRef]
  71. Panigrahi, P.K.; Chandu, B.; Puvvada, N. Recent Advances in Nanostructured Materials for Application as Gas Sensors. ACS Omega 2024, 9, 3092–3122. [Google Scholar] [CrossRef] [PubMed]
  72. Li, K.; Wu, Y.; Chen, M.; Rong, Q.; Zhu, Z.; Liu, Q.; Zhang, J. High Methanol Gas-Sensing Performance of Sm2O3/ZnO/SmFeO3 Microspheres Synthesized Via a Hydrothermal Method. Nanoscale Res. Lett. 2019, 14, 57. [Google Scholar] [CrossRef] [PubMed]
  73. Maqbool, Q.; Yigit, N.; Stöger-Pollach, M.; Ruello, M.L.; Tittarelli, F.; Rupprechter, G. Operando monitoring of a room temperature nanocomposite methanol sensor. Catal. Sci. Technol. 2023, 13, 624–636. [Google Scholar] [CrossRef]
Figure 1. The schematic illustration of the synthesis of AHA-capped Fe3O4 NPs.
Chemosensors 14 00090 g001
Figure 2. (A) Flow-chart for the process of fabrication of microconductometric chips. (B) Optical microscopy view of a pair of interdigitated electrodes.
Chemosensors 14 00090 g002aChemosensors 14 00090 g002b
Figure 3. Flow-chart for the process of functionalization of microconductometric chips.
Chemosensors 14 00090 g003
Figure 4. FTIR spectra of AHA-capped Fe3O4 NPs.
Chemosensors 14 00090 g004
Figure 5. XRD patterns of AHA-capped Fe3O4 nanocrystals.
Chemosensors 14 00090 g005
Figure 6. HR-TEM images of AHA-capped Fe3O4 NPs.
Chemosensors 14 00090 g006
Figure 7. Fe EDS mapping (yellow dots).
Chemosensors 14 00090 g007
Figure 8. Detection of gas-phase concentration for pure liquid phases of methanol, acetone, chloroform, ethanol, and water.
Chemosensors 14 00090 g008
Figure 9. Detection of gas-phase concentration for different methanol/water solutions of chitosan/Fe3O4-NPs sensor, using a lock-in amplifier.
Chemosensors 14 00090 g009
Figure 10. Response time (tRes) and recovery time (tRec) on the real-time registration of the methanol sensor response.
Chemosensors 14 00090 g010
Figure 11. Calibration curve of the gas-phase concentrations of methanol, ethanol, and acetone.
Chemosensors 14 00090 g011
Figure 12. Effect of the presence of 4% of ethanol and of 4% acetone compared to 20%methanol on the sensor signal.
Chemosensors 14 00090 g012
Figure 13. Variation in the headspace signal over absolute methanol obtained with the Chitosan/Fe3O4-NPs sensor over 60 days.
Chemosensors 14 00090 g013
Figure 14. Detection of gas-phase concentrations for different methanol/water solutions and commercial products, with the chitosan/Fe3O4-NPs sensor.
Chemosensors 14 00090 g014
Table 1. Structural properties of AHA-capped Fe3O4 nanocrystals.
SampleCrystallite Size D (nm)Dominant Planes dhklLattice Constant (Å)Strain (ε)Dislocation Density (δ) (Lines/m2) × 1015Stacking Fault (SF)
Fe3O4-AHA5.10C (311)a = 8.360.007352.90.0208
Table 2. Response times and detection limits of previously published methanol sensors based on various materials.
Methanol SensorsOperating Temperature (°C)Response Time (tRes)Detection Limit (ppm)Refs
TiO2 doped CdS/amperometry36010 s0.18[63]
ADH/Amperometry365 s10[64]
Pd doped SnO2 nanoparticles/
conductivity
35010–25 s1[65]
graphene oxide/polyindole/
conductivity
2670.015[61]
Pd–Pt–In2O3/SnO2160320.1[66]
ZnO/MoO32005434[67]
rGO–TiO2 nanotubes11041 [68]
dPIn pellet262648[69]
PVC-NiPc nanofibers251315[70]
Chitosan-NiPc/Conductometry2525–32 s700[71]
Chitosan/AHA-ZnS/
Conductometry
2511–25 s1400[13]
Chitosan/AHA-Fe3O4/
Conductometry
259–12 s600This work
Disclaimer/Publisher’s Note: The statements, opinions and data contained in all publications are solely those of the individual author(s) and contributor(s) and not of MDPI and/or the editor(s). MDPI and/or the editor(s) disclaim responsibility for any injury to people or property resulting from any ideas, methods, instructions or products referred to in the content.