Article

Heavy Metal Ion Detection by Carbonized Metal–Organic–Framework (MOF-C) Nanocomposite-Modified Electrochemical Sensors


1
Guangdong Provincial Key Laboratory of Intelligent Equipment for South China Sea Marine Ranching, Guangdong Ocean University, Zhanjiang 524088, China
2
College of Naval Architecture and Shipping, Guangdong Ocean University, Zhanjiang 524088, China
3
Marine Engineering College, Dalian Maritime University, Dalian 116026, China
4
Fisheries College, Guangdong Ocean University, Zhanjiang 524088, China
5
Guangdong Provincial Key Laboratory of Aquatic Animal Disease Control and Healthy Culture, College of Fisheries, Guangdong Ocean University, Zhanjiang 524088, China
*
Author to whom correspondence should be addressed.
These authors contributed equally to this work.
Chemosensors 2026, 14(2), 40; https://doi.org/10.3390/chemosensors14020040
Submission received: 23 December 2025 / Revised: 30 January 2026 / Accepted: 1 February 2026 / Published: 3 February 2026

Abstract

Efficient detection of heavy metal ions in complex marine environments is essential to the safety of marine organisms and human beings. This study developed a novel screen-printed-electrode (SPE) electrochemical sensor for rapid on-site determination of typical heavy metal ions such as Cu2+, Pb2+, Cd2+, and Hg2+ in seawater. The sensor employs a three-electrode system, with the working electrode modified with a composite of metal–organic framework-derived carbon (MOF-C) and multiwalled carbon nanotubes (MWCNTs), thereby significantly enhancing detection sensitivity and selectivity. By optimizing square-wave anodic stripping voltammetry (SWASV) parameters, detection limits of 0.83, 0.40, 1.05, and 0.30 μM for the detection of Cu2+, Pb2+, Cd2+, and Hg2+ ions were achieved. In mixed-ion detection, excellent peak separation and strong resistance to interferences were demonstrated. Experimental results demonstrate that the sensor exhibits good linear response, excellent interference resistance, and high practicality, providing a new approach for rapid on-site determination of heavy metal pollution in marine environments.

1. Introduction

Heavy metal ions such as lead (Pb2+), mercury (Hg2+), and cadmium (Cd2+) enter the aquatic environment through multiple pathways, including industrial wastewater discharge, ship antifouling coatings, ballast water transport and accumulation via the water cycle from land-based pollution [1,2]. These ions exhibit substantial toxicity, poor degradability, and high bioaccumulation potential, posing severe threats to marine ecosystems and human health [3,4,5,6]. They can readily accumulate in marine organisms and the human body through the food chain. Long-term exposure to heavy metal environments may lead to widespread and profound health hazards to the nervous, blood, and digestive systems, subsequently causing reduced immune function and immune system disorders, triggering major pollution incidents like Japan’s Minamata disease [7,8,9,10,11,12,13,14,15,16,17]. The development of highly efficient and sensitive heavy metal ion detection technologies for real-time monitoring and early warning of marine pollution is urgently needed for ecological security and sustainable development.
Currently, the most commonly used methods for heavy metal ion detection primarily involve high-end instruments such as atomic absorption spectroscopy (AAS), atomic fluorescence spectroscopy (AFS), and inductively coupled plasma mass spectrometry (ICP-MS) [18,19,20,21,22]. While these methods offer high sensitivity and accuracy [23,24,25,26,27,28,29,30,31,32], they generally suffer from significant drawbacks, including high cost, bulky instrumentation, limited portability, and cumbersome sample pretreatment processes. There is still a lack of convenient, rapid methods for detecting heavy metal ions, especially in complex aquatic environments with high precision. Electrochemical sensors, with their high sensitivity, fast response, and low cost, have been widely used to detect trace amounts of pollutants, particularly heavy metal ions [33].
Detection of typical toxic heavy metal ions in marine environments such as Cu2+, Pb2+, Cd2+, Hg2+, and common coexisting interfering ions like Zn2+, Cr3+, and As3+ by the electrochemical method has been reported [34], and many nanomaterials have been used to improve the performance of the sensors due to their three-dimensional nanostructure networks at the electrode/electrolyte interface, featuring high specific surface area, excellent charge-transport capability, and tunable surface chemistry [35]. For example, Bismuth Tungstate Nanocrystals (Bi2WO6) [36], metal–organic frameworks (MOFs) [37] and multiwalled carbon nanotubes (MWCNTs) [38,39,40] have been employed to functionalize electrode surfaces of ion sensors [41]. These materials enhance the performance of the sensors in different ways. For instance, Bi2WO6 nanocrystals exhibit outstanding electrocatalytic activity due to their layered semiconductor structure, which enables the catalysis of redox reactions for target molecules at low overpotentials while amplifying current signals [42]. Metal–organic frameworks (MOFs) and their derivatives possess porous structures and abundant coordination sites yet suffer from inherently low conductivity [43]. Metal/metal oxide nanomaterials can reduce overpotentials and enhance signal intensity through alloying effects but face challenges of agglomeration and insufficient stability [44]. MWCNT networks with high conductivity can form efficient electronic “highways” and are suitable for adsorbing catalytic carriers; their accelerated response rates make them ideal for use as electrode materials. However, MWCNT materials face challenges of insufficient selectivity, stability, and lifespan.
The development and optimization of new nanomaterial compositions have been used to improve the performance of electrochemical sensors for heavy metal ions. The combination of MOFs and MWCNTs would form a continuous conductive network in which MOFs provided pores and coordination sites for target ion adsorption and MWCNTs enhance the conductivity of the sensing electrodes and sensitivity of the sensors [45]. MOF and MWCNT nanocomposites for the detection of metal ions have been reported previously [46]. However, previous works only focus on either one specific ion detection, like Pb2+ [47], or two kinds of ions but using bulky sensing systems [48,49]. The use of electrochemical sensors for detecting multiple ions simultaneously in real seawater samples remains challenging, and investigations into sensing stability, selectivity, and practicality under the conditions of complex aquatic environments remain unexplored. On-site, real-time detection applications that require enhanced interference resistance in high-salinity seawater matrices are urgently needed.
This paper proposes investigating an SPE electrochemical sensor for the determination of coexisting marine heavy metal ions. A Carbonized Metal–Organic Framework–MWCNT (MOF-C@MWCNT) nanocomposite was functionalized on the Screen-Printed Electrode (SPE) to enhance sensor conductivity and specificity. Working parameters of the electrochemical sensor for detecting four typical heavy metal ions, i.e., Cu2+, Pb2+, Cd2+, and Hg2+, were optimized to improve the sensitivity and selectivity. The sensor’s performance was verified by detecting seawater samples spiked with target ions, as well as real samples obtained from different coastal locations.

2. Materials and Methods

2.1. Reagents and Materials

All reagents were used as received. Ion solutions of different concentrations were prepared as required by using dry reagent powder or standard ion solutions, in which copper sulfate (CuSO4), magnesium chloride (MgCl2), calcium chloride (CaCl2), and potassium chloride (KCl) were purchased from Sinopharm Reagents (Shanghai, China), and standard lead nitrate titration solution, cadmium solution, mercury solution, and zinc chloride (ZnCl2) solution were obtained from Tianjin Comeo Chemical Reagent Co., Ltd. (Tianjin, China). The polyvinyl chloride (PVC) substrate (Pinrui Plastic Industry, Wenzhou, China), MOF-C (Guangdong Tanyu New Materials Co., Ltd., Zhuhai, China), flower-shaped bismuth tungstate nanoparticles (Jiangsu Xianfeng Nanotechnology Co., Ltd., Suzhou, China), MWCNTs (Guangdong Kaisa Group New Materials Co., Ltd., Shenzhen, China), Ag/AgCl ink (GIE-4250), and carbon ink (G1-2067) purchased from Guangzhou Yinbiao Trading Co., Ltd. (Guangzhou, China) were applied for printing the sensor electrodes, and ethanol (Sinopharm Reagents) and slow-drying water (Tuye Sanx, Taiyuan, China) were used as cleaning solutions during the screen-printing process. Artificial seawater samples were ordered from the National Marine Standard Substance Center (Hangzhou, China). Real seawater samples obtained from Dalian, Zhenjiang, and Maoming were pretreated with 0.22 μm filter membranes and syringes to remove impurities. To enable high-selectivity detection of heavy metal ions, Nafion solution (DuPont, Wilmington, DE, USA) was applied to create cation-selective channels on the working electrodes. Potassium ferricyanide (Aladdin, Shanghai, China) was used as a substrate to optimize and verify the electrochemical sensors.

2.2. Design and Preparation of Electrochemical Sensors

The working steps for the design and preparation of the electrochemical sensor are described briefly as follows: firstly, the layout of the sensor was designed by AutoCAD 2018 software, followed by the creation of the screen-printing stencils by photolithography techniques; secondly, the electrodes of the sensor and the insulating layer were printed on the PVC substrate, sequentially followed by the functionalization of nanomaterials on the working electrode. PVC was chosen for its excellent hydrophobicity, biocompatibility, cost-effectiveness, ease of handling, and environmental friendliness.
Note that before screen-printing, carbon ink was diluted with a slow-drying solution at a 1:10 mass ratio to achieve the desired viscosity. After printing the carbon working electrode (WE) and counter electrode (CE), the devices were heated at 65 °C for 30 min to remove the solvent. The reference electrode (RE) was printed on the sensor using a fine-screen stencil, followed by a second heating step at 65 °C for 30 min to dry the RE. To achieve effective signal transmission, the printed electrodes were 5~10 μm thick. To ensure a stable potential response and durability across a wide potential window, Ag/AgCl ink was selected for printing RE. Finally, the three-electrode electrochemical sensor was encapsulated with a confined reaction zone of 5 mm in diameter using a photocurable insulating layer, which was irradiated with a 180 W UV lamp at 365 nm for 5 min, as shown in Figure S1 of the Supplementary Information (SI-1). The screen-printing method is cost-effective, and 105 chips can be produced for a few USD in an hour.

2.3. Functionalization and Optimization of the WE

To enhance the sensor’s detection limits and selectivity, the WE of the printed sensors was functionalized with MWCNTs and MOF-C nanomaterials. The modification was performed as follows: first, a solution was prepared by mixing 0.02 g of MOF-C with 2 mL of solvent (1:1 ethanol/deionized water) then adding 20 μL of Nafion solution as a binder. After mixing, the solution was sonicated for 20 min at 25 °C to achieve uniform dispersion and then pipetted onto the WE surface. To achieve full coverage of the WE, 5 μL solution was applied to each WE. The electrode was then heated at 50 °C for 10 min, then dried at room temperature for 20 min. This process allowed Nafion and the nanomaterials to form a continuous thin film, enhancing adhesion to the electrode and yielding the modified nanomaterial electrode chip. In addition, Bi2WO6 and MWCNTs were applied to modify the working electrode, in which 2 mg of Bi2WO6 or MWCNTs were dispersed in 1 mL of ethanol solution containing 0.1% Nafion and sonicated for 30 min to form a uniform suspension, followed by dip-coating the solution on the WE.

2.4. Data Acquisition and Processing

2.4.1. Parameter Setting and Data Acquisition

To characterize the performance of the SPE sensors, square-wave anodic stripping voltammetry (SWASV) and cyclic voltammetry (CV), which have been commonly used for electrochemical mechanism studies, were applied in this study [50,51,52]. Unless otherwise stated, CV scanning in the range of −0.8~1.0 V with a scan rate between 50 and 300 mV/s under the condition of 1 μA/V signal sensitivity was applied. All electrochemical signals were acquired using a portable PalmSens4 electrochemical workstation paired with a three-electrode system for the SPE electrochemical sensor. Before the experiments, the workstation was calibrated with K3[Fe(CN)6]/K4[Fe(CN)6] standard solution, which was freshly prepared before each experiment by dissolving 10 mM (K3Fe(CN)6) and 10 mM (K4Fe(CN)6) in 0.1 M KCl solution. Real-time current responses were recorded throughout the scans to assess electrode performance. All tests were conducted at a constant temperature of 25 ± 1 °C and a humidity of 50 ± 5% RH. Electrochemical Impedance Spectroscopy (EIS) in the range of 0.1~0.1 MHz was conducted by Randles to evaluate the conductivity of electrochemical sensors.
Square-wave anodic stripping voltammetry (SWASV) was employed in this study to quantify heavy metal ions because it combines enrichment and stripping of the target ions. Deposition potential and scanning parameters were optimized to achieve effective separation of multiple ion peaks with high specificity. For single heavy metal ion SWASV parameter optimization, an enrichment time of 120 s, square-wave amplitude of 25 mV, frequency of 15 Hz, and scan range of −0.2~0.5 V were applied during Hg2+ detection. Stripping peak currents were used to quantify the concentration of target ions. The detection procedures for the other three ions were the same but with different scanning ranges adjusted based on preliminary stripping potentials (−0.2~0.1 V, −0.8~−0.2 V, −1.0~−0.5 V, for Cu2+, Pb2+, and Cd2+, respectively). For mixed heavy metal ion detection, samples with ion concentration gradients of 1, 5, 8, 10, 50, and 80 μM were tested, and the working conditions of −0.60 V deposition voltage with an enrichment time of 150 s and a 15 Hz square-wave amplitude of 25 mV with a scanning range of −1.0~0.5 V were applied. To detect seawater, both spiked artificial seawater and real seawater were used. Because four metal ions are detected simultaneously in the mixed solution, −0.6 V is uniformly used as the deposition voltage. The SWASV operating parameters were the same as those used for detecting mixed ions. Each sample underwent three parallel measurements to ensure data reproducibility. After each SWASV scanning, the electrode was electrochemically cleaned by applying +0.80 V (vs. Ag/AgCl) for 60 s in the supporting electrolyte, followed by rinsing with DI water and drying, to minimize memory effects from residual metal deposition.

2.4.2. Raw Data Processing

The amperometry curves were processed using baseline correction and smoothing to improve visual comparison with commercial software (PSTrace). The baseline interval was selected within the potential range, avoiding significant elution peaks. The “Peak Analysis” function was applied to identify and extract key parameters of the stripping peaks, namely, peak potential Ep, peak current Ip and half-peak width W1/2. Note that peaks with a signal-to-noise ratio (S/N) < 5 were manually verified to avoid misidentification of false peaks [53]. Peak current data were exported and preprocessed using Origin software.

2.4.3. Quantitative Calculation and Statistical Analysis

During quantitative analysis, for each individual heavy metal ion, a linear fitting of the elution peak current (Ip) with the ion concentration (C, μM) was conducted. The limit of detection (LOD) of the sensor was calculated by using the 3σ method; i.e., LOD = 3σ/k, where σ is the standard deviation of peak current measurements from 10 blank samples, and k is the slope of the corresponding heavy metal ion calibration curve. For the detection of seawater samples, the spiked recovery rate was calculated using the following formula:
R % = C f o u n d C 0 C s p i k e × 100 %
where C 0 is the concentration of the target heavy metal ion in the sample to be detected, C f o u n d is the target heavy metal ion concentration in the spiked sample, and C s p i k e is the concentration of target heavy metal ions added to the sample. During statistical analysis, all experimental data were presented as “mean ± standard deviation” (mean ± SD, n = 3). The repeatability of the detection method was evaluated by calculating the relative standard deviation (RSD).

3. Results and Discussion

3.1. Device Fabrication and Characterization

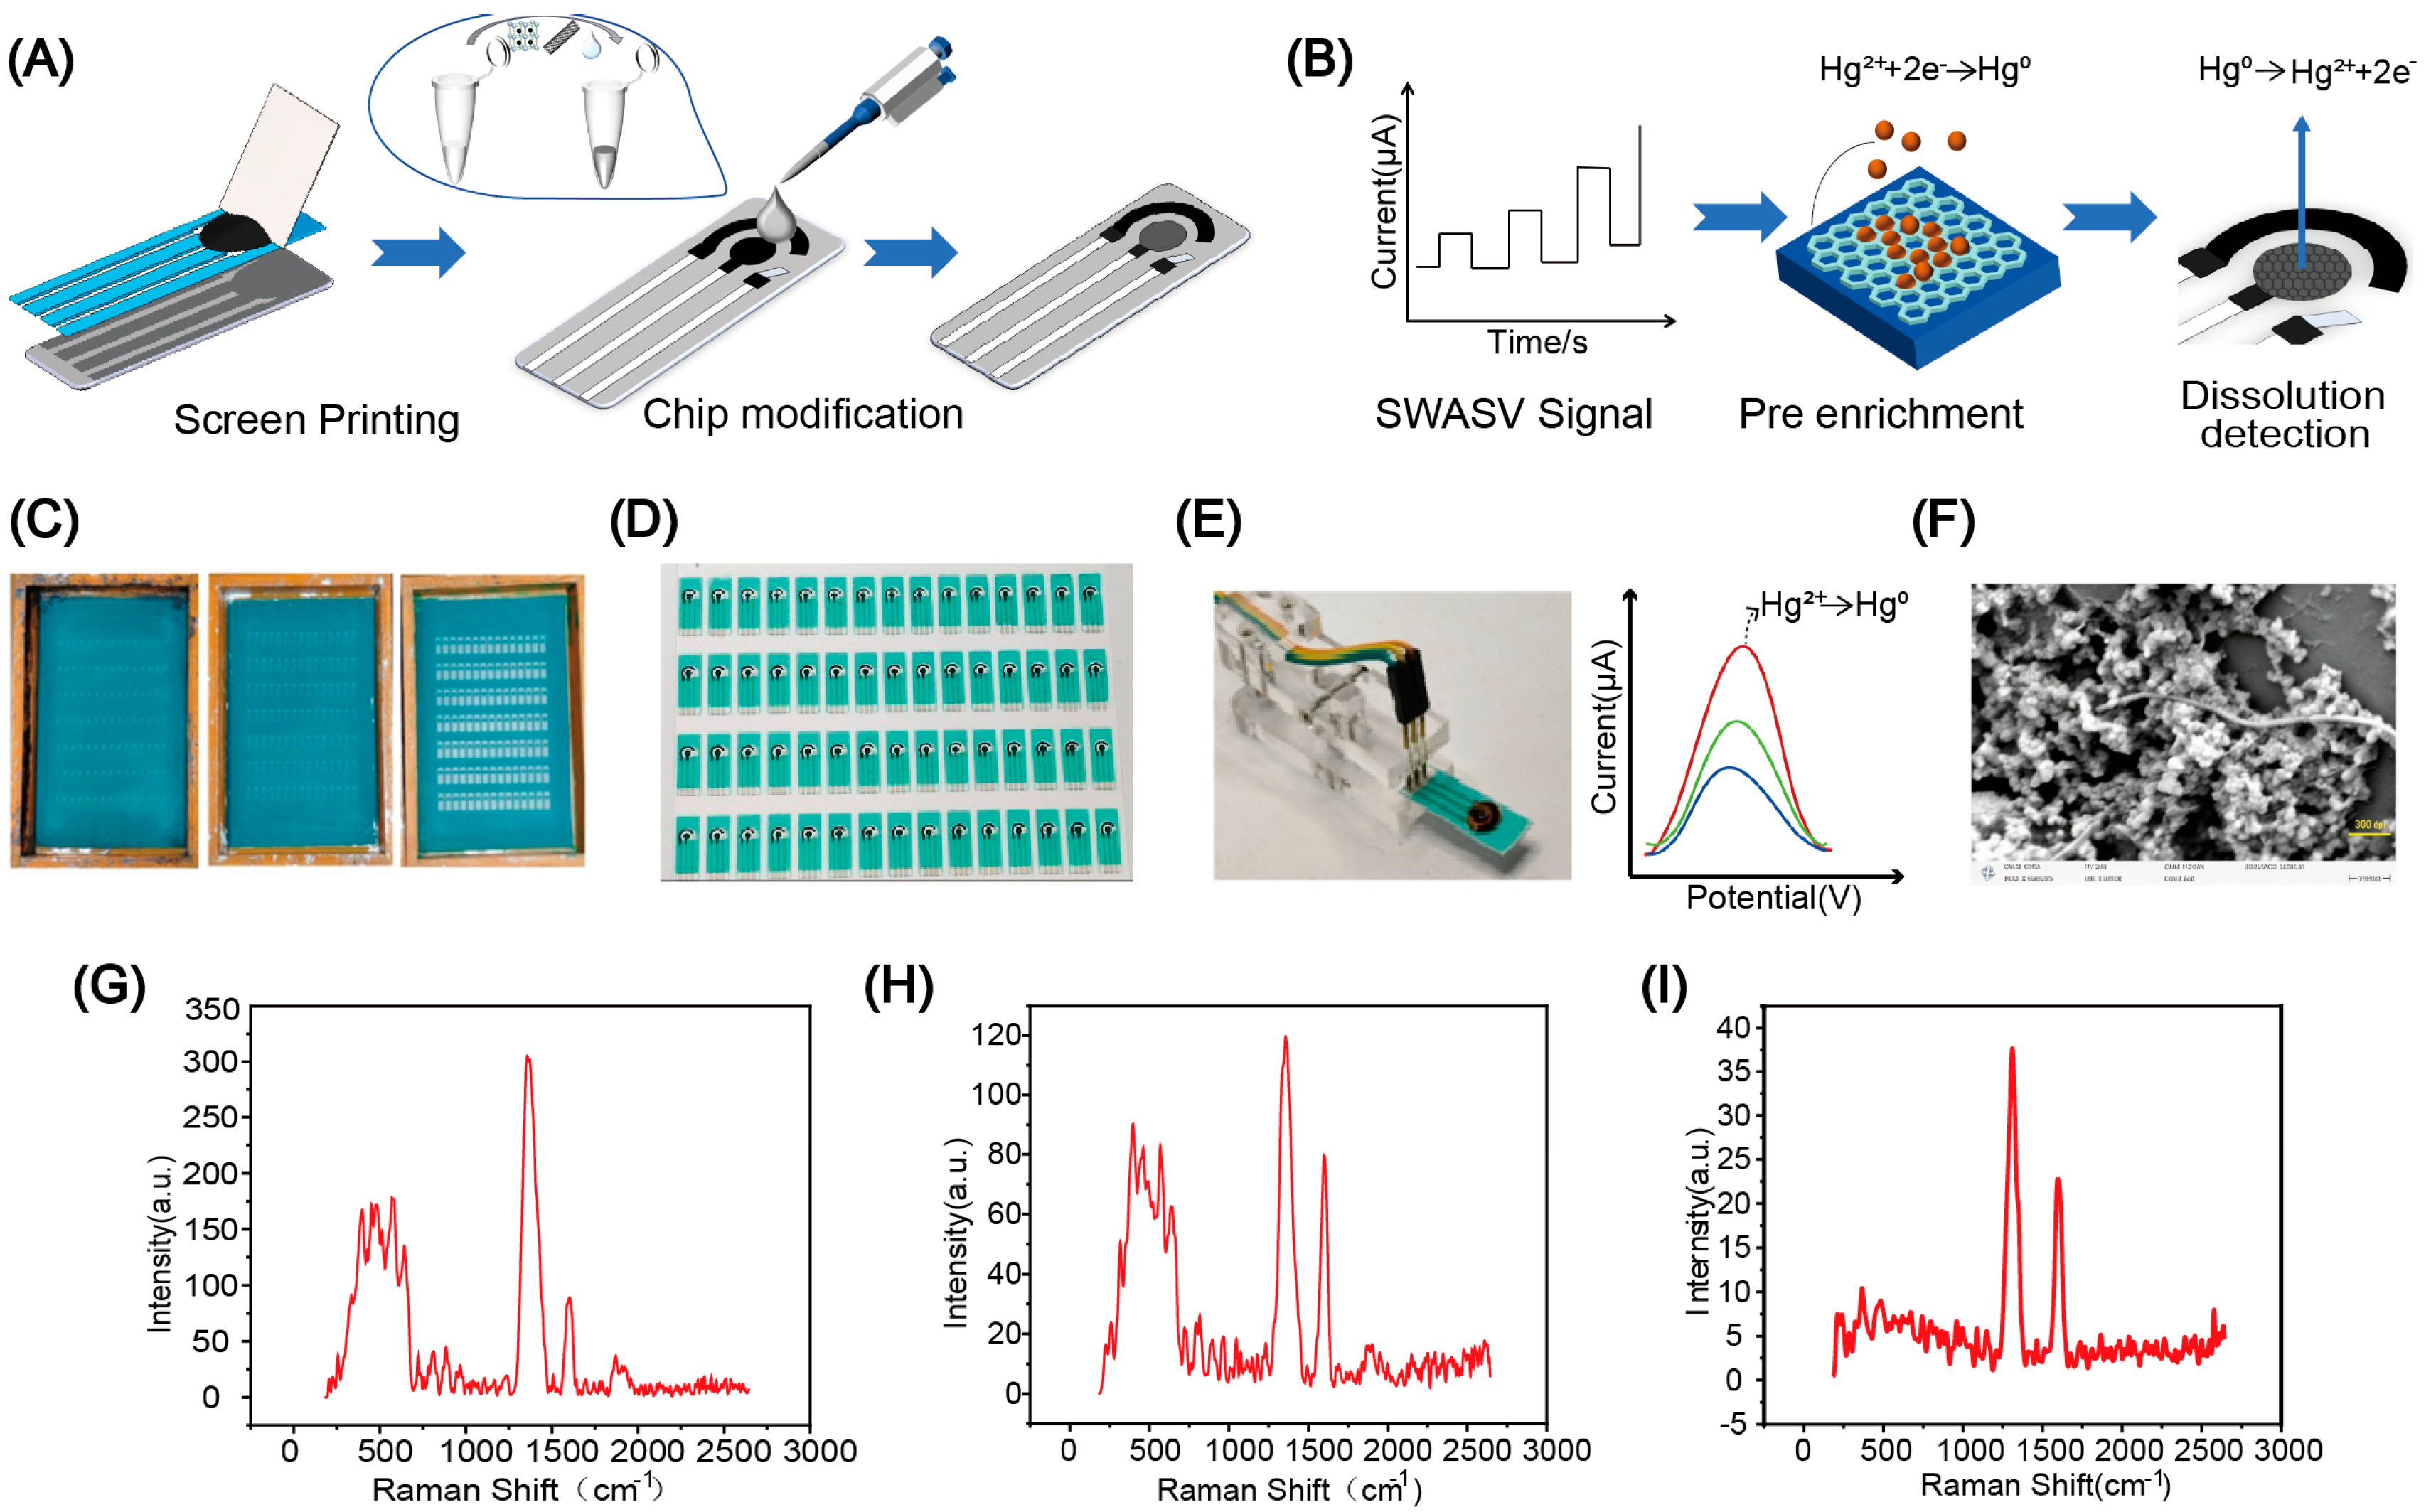
The electrochemical sensor was fabricated using the screen-printing method, as previously reported [54]. The working procedure and the design of the chip can be found in Figures S1 and S2 of the Supplementary Information (SI). PVC film serves as the substrate due to its excellent corrosion resistance and insulation properties, capable of withstanding most chemical corrosions while maintaining highly stable physicochemical characteristics. The working steps are briefly described as shown in Figure 1A. The fabrication and modification of the SPE sensor involved sequentially printing layers of carbon electrodes (WE and CE), a Ag/AgCl electrode (RE), and a hydrophobic insulating layer onto the flexible PVC substrate to construct a confined sensing area for the testing. Thereafter, the WE of the sensor was functionalized by dip-coating with the MWCNT/MOF-C composite and then drying the device. At this stage, the sensor is ready to use. Figure 1B illustrates the operating mechanism of the sensor for detecting heavy metal ions, with Hg2+ as an example. The central circular carbon WE serves as a heavy metal ion enrichment electrode, and the outer carbon CE ensures a symmetrical electric-field distribution and efficient electrolyte exchange, while the Ag/AgCl RE provides spatial utilization and potential stability. During testing, an SWASV signal is applied between WE and CE. Hg2+ is first preconcentrated and reduced onto the WE surface by electrodeposition and then stripped back into solution during the applied potential sweep. The resulting current generated during the preconcentration and stripping step is recorded. The amplitude of the stripping current is proportional to the concentration of Hg2+ in the sample; consequently, the current can be used to quantify trace amounts of the target Hg2+ [55,56].
Figure 1C illustrates the screen stencils used for screen-printing, and Figure 1D shows an example of the printed electrochemical sensor array, with multiple sensors printed on PVC film. The screen-printing method offers significant process advantages for fabricating SPE sensors, including large-scale production and low cost. The high-precision screens enable high-resolution patterning, and multiple coating steps further enhance the uniformity and adhesion of the conductive ink layer as well as batch-to-batch consistency. Figure 1E presents a schematic of the testing system, in which a sensor is clamped in a three-electrode clip and an analyte solution is loaded onto the sensing area; an example of the resulting SWASV signal is shown on the right-hand side of the panel. The peak current is collected to calibrate and characterize the concentration of target ions in the sample. The chip electrode system modified with MOF-C@MWCNTs, which exhibited the strongest modification effect, was characterized using scanning electron microscopy (SEM) and Raman spectroscopy. Figure 1F illustrates an example of the WE surface after the modification of MOF-C@MWCNT/SPE, indicating the success of the modification of porous nanomaterial composite on the surface. Figure 1G–I shows the Raman spectrum of the MWCNTs (Figure 1G), MOF-C (Figure 1H), and the chip modified with MOF-C@MWCNT composite (Figure 1I), respectively.
The high-temperature carbonized MOF-C material exhibits D and G peaks at approximately 1350 cm−1 and 1580 cm−1, respectively, attributed to sp3-hybridized carbon-defect vibrations and sp2-graphitic-structure vibrations. The ratio of D peak intensity to G peak intensity is ~1.5. MWCNTs exhibit characteristic D and G peaks at 1350 cm−1 and 1580 cm−1, respectively, with a peak intensity ratio of ~3. The peak observed at 1350 cm−1 in the MOF-C@MWCNT/SPE indicates the presence of numerous carbonized edges on the electrode surface. The ratio of the peak intensity at 1350 cm−1 to that at 1580 cm−1 is ~1.8, reflecting the differing MOF-C-to-MWCNT ratios on the electrode surface and resulting in a varying D/G peak intensity ratio. These peak positions confirm that the MOF-C@MWCNT composite has been successfully deposited onto the electrode surface. The characterization also supports the prior hypothesis that the MOF-C@MWCNT composite significantly outperforms individual nanomaterials in conductivity. The MOF-C@MWCNT-modified SPE constitutes a highly integrated sensing platform that enables rapid enrichment, uniform distribution, and electrochemical transformation of heavy metal ions at the working electrode surface. This rational chip design therefore provides a solid physical and electrochemical foundation for the high-performance detection of multiple heavy metal ions, as demonstrated in the following sections.

3.2. Parameter Optimization of the SPE Sensors

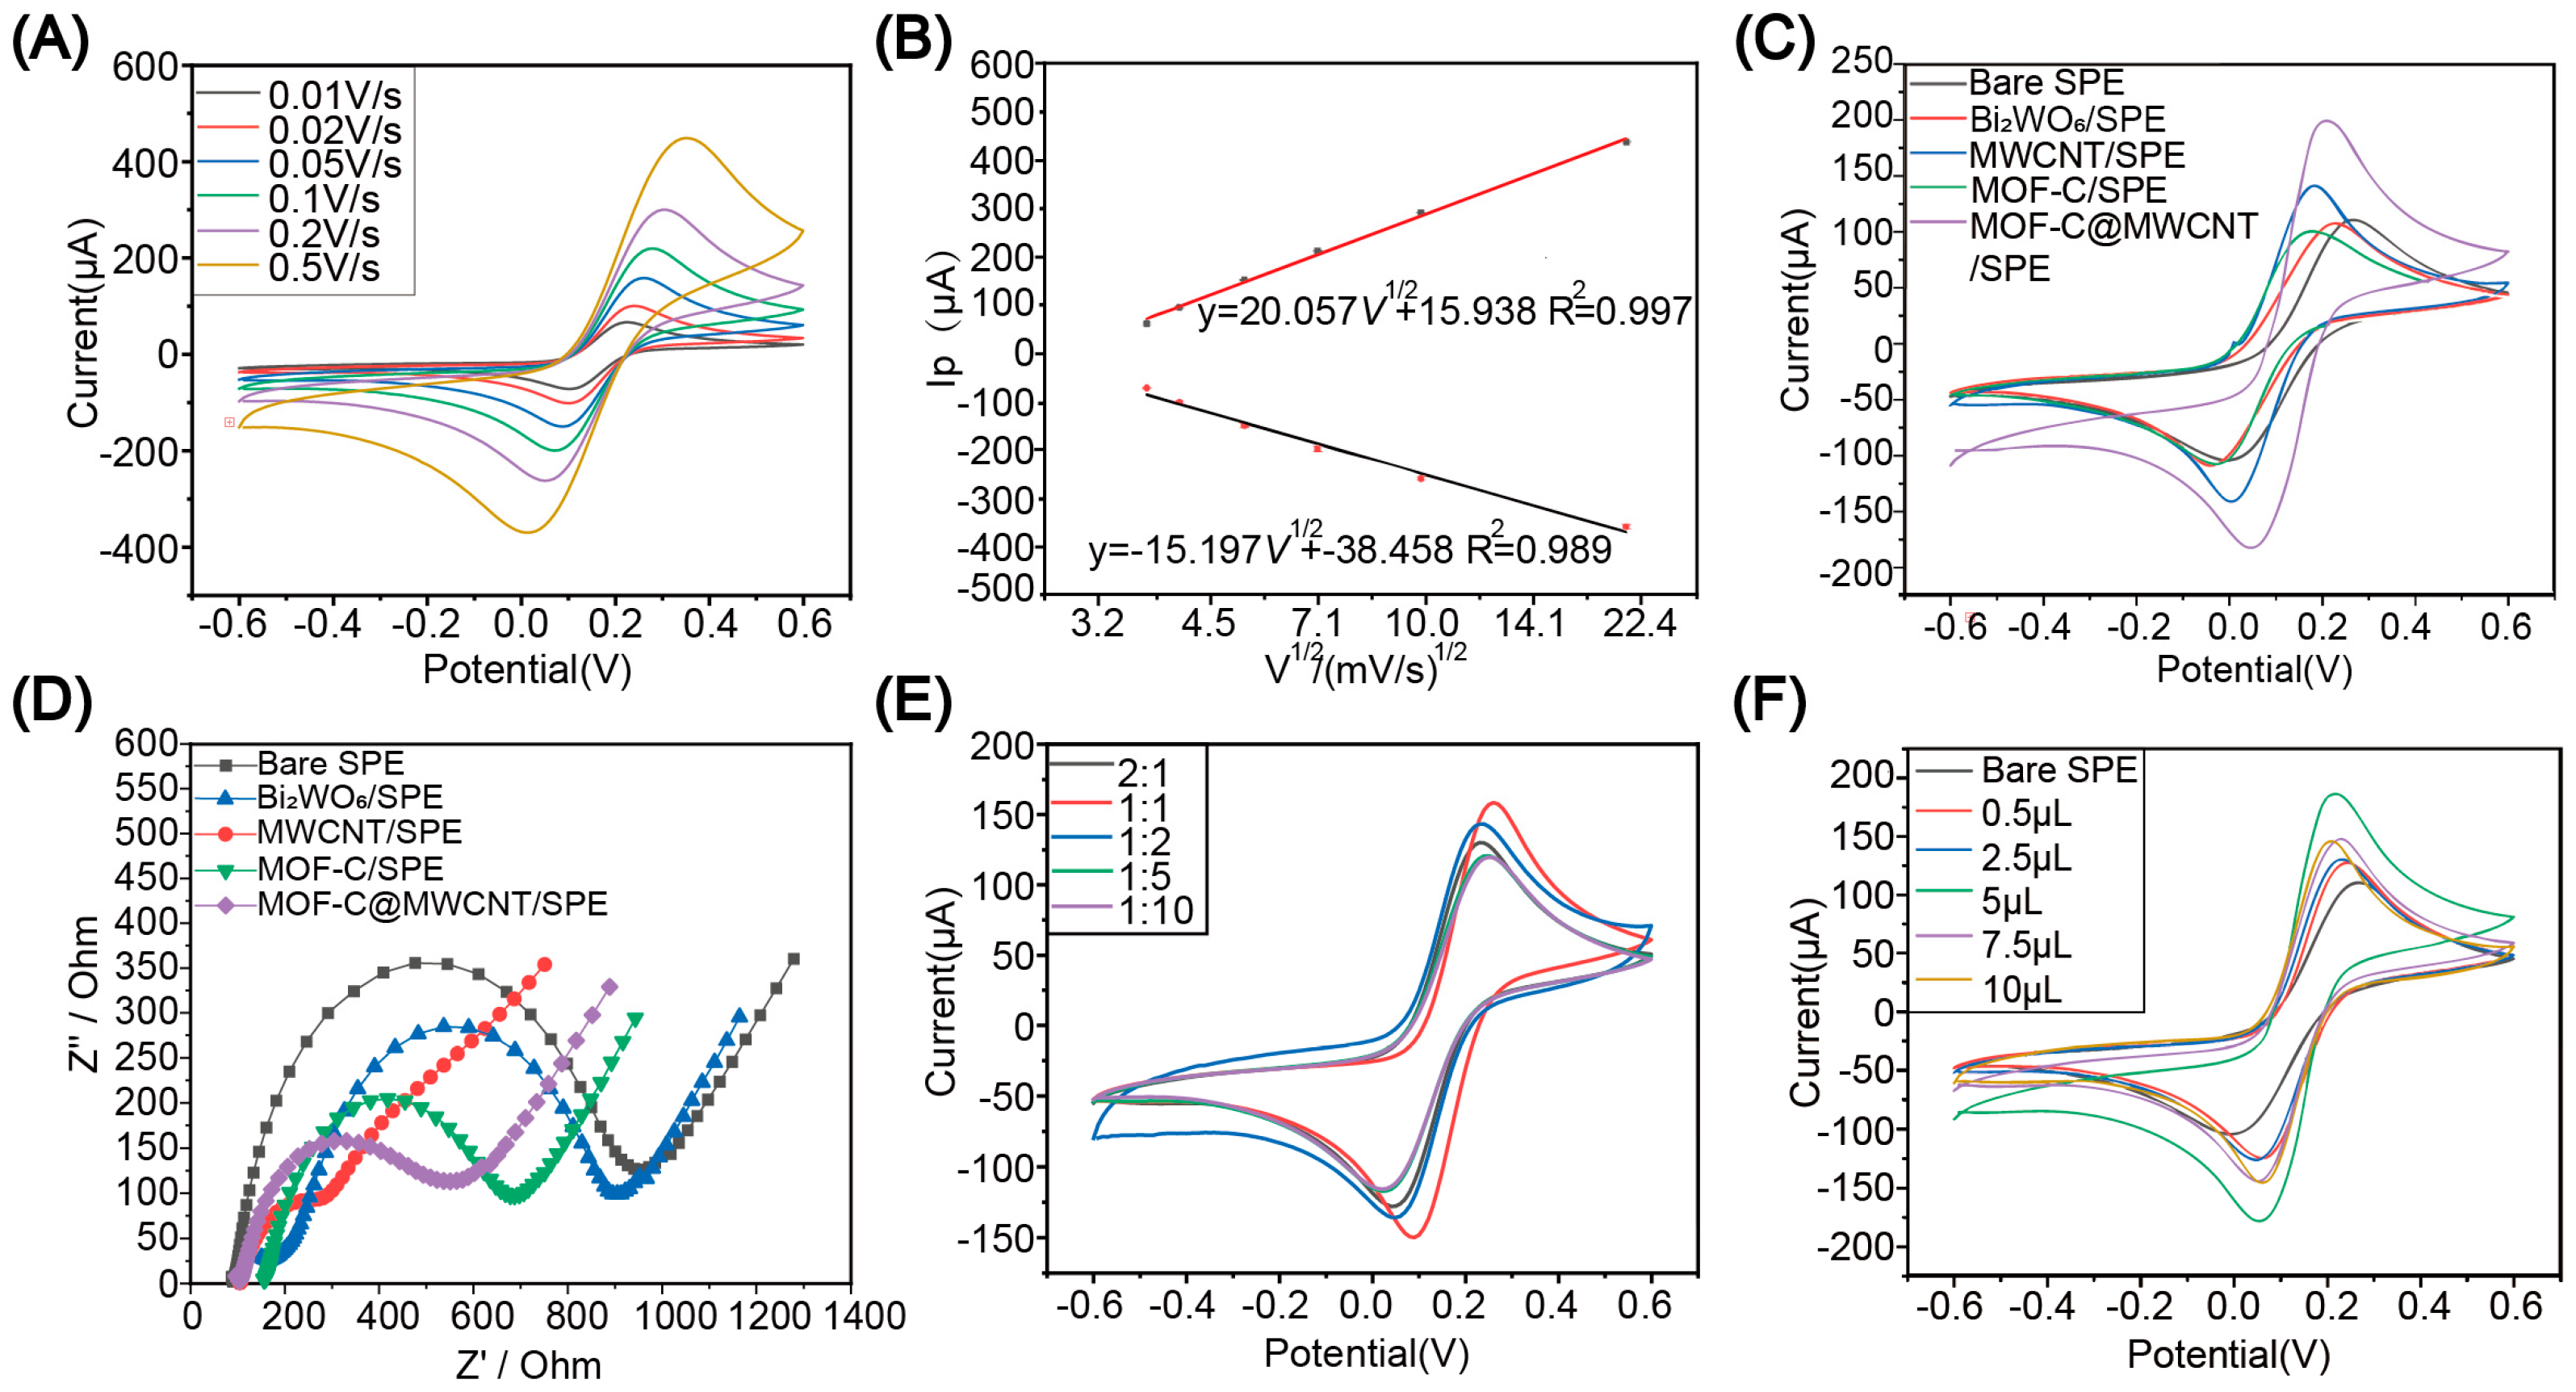
A K3Fe(CN)6/K4Fe(CN)6 redox system was used as the electrolyte to evaluate the effectiveness of the SPE electrochemical sensor via CV. Real-time current responses were recorded throughout the scans. As illustrated in Figure 2A, both the anodic and cathodic current peaks are highly symmetric across all scan rates, indicating a reversible redox process and good sensor performance. Figure 2B shows the linear fitting of the anodic and cathodic peak currents (Ipa and Ipc) and the square root of the scan rate. The peak potential remains nearly constant, and the resulting linear fitting coefficients (R2) are 0.997 and 0.989, respectively, indicating a diffusion-controlled electrode process. These results confirm that the SPE electrode exhibits efficient charge transfer kinetics and stable interfacial electrochemical behavior. The reliability of the SPE sensors was also verified by using commercial SPE sensors (Figure S1A), and the effectiveness of the quality control and the temporal stability of the fabricated chips were also verified by five randomly selected SPE sensors from the same batch that underwent uniformity testing (Figure S1B). More information is provided in the Supplementary Information (SI).
To identify the optimal nanomaterial for enhancing the performance of the fabricated SPE, MWCNTs, bismuth tungstate, MOF-C, and MOF-C@MWCNTs were also evaluated. CV curves and EIS curves obtained from the SPE sensors modified with these nanomaterials are compared with those of the bare SPE electrode. As shown in Figure 2C, the CV profiles indicate that the composite material combining MOF-C and MWCNTs exhibits a higher peak current than the other cases. Compared to the bare electrode, the peak current increased by approximately one-fold. This confirms the synergistic effect between MWCNTs and MOF-C. As verified in Figure 2D, the composite’s impedance lies between those of MWCNTs and MOF-C. Fitting with the Randles circuit reveals a surface resistance (Rct) of approximately 386 Ω, significantly lower than the bare electrode’s 750 Ω. This indicates efficient electron transfer at the electrode surface while maintaining selective adsorption. Consequently, in this study, MOF-C@MWCNTs are employed to modify SPE sensors.
The rational design and precise control of nanomaterial modification are pivotal in optimizing the detection performance of electrochemical sensors. In this study, the MOF-C-to-MWCNT ratio significantly influences the sensor’s conductivity and ion enrichment capability. A series of composite material groups (MOF-C: MWCNTs) was utilized to modify the chip surface and measured by CV scanning. As shown in Figure 2E, the optimal modification performance was achieved at an MOF-C: MWCNT ratio of 1:1, yielding the highest oxidation current peak of ~170 µA. This optimal ratio ensures balanced contributions from both components, thereby facilitating efficient charge-transfer pathways at the electrode surface while maximizing the number of active sites. Additionally, the volume of the deposited modification solution is another critical parameter affecting chip performance. With the MOF-C: MWCNT ratio fixed at 1:1, CV results presented in Figure 2F indicate that the peak current initially increases and then decreases as the deposition volume rises from 0.5 μL to 10 μL. The maximum peak oxidation current is observed at a deposition volume of 5 μL, reaching ~190 µA. This phenomenon can be attributed to the fact that an appropriate amount of nanomaterials enhances the electrode’s active surface area; however, excessive deposition can increase interfacial resistance and impede charge transport. This behavior arises because excessive loading of MOF-C/MWCNT produces an overly thick, densely packed film on the electrode, which increases interfacial resistance, lengthens electron-transfer pathways, and partially blocks ion diffusion channels, ultimately hindering charge transport and lowering the oxidation current, as reported in the literature [55].

3.3. Detection of Single Marine Heavy Metal Ions

As mentioned above, SWASV can detect multiple ions simultaneously at μM or even nM levels. As a result, SWASV was employed to detect Cu2+, Pb2+, Cd2+, and Hg2+ in this work. However, optimizing parameters such as the amplitude and frequency of the SWASV signal remains very tricky. For instance, exceeding amplitude thresholds will degrade sensing resolution, while improper frequencies will reduce the sensing signal-to-noise ratio [56,57]. To optimize the working parameters, herein, we take Hg2+ as an example. Preliminary experiments indicated that the stripping potential for Hg2+ is ~0.1 V. As the stripping peak positions of metal ions vary with different electrolyte/buffer systems, parameter optimization for SWASV was performed based on the preliminary deposition potential of Hg2+, using 0.1 M KCl as the supporting electrolyte to ensure consistent ionic strength and system stability.
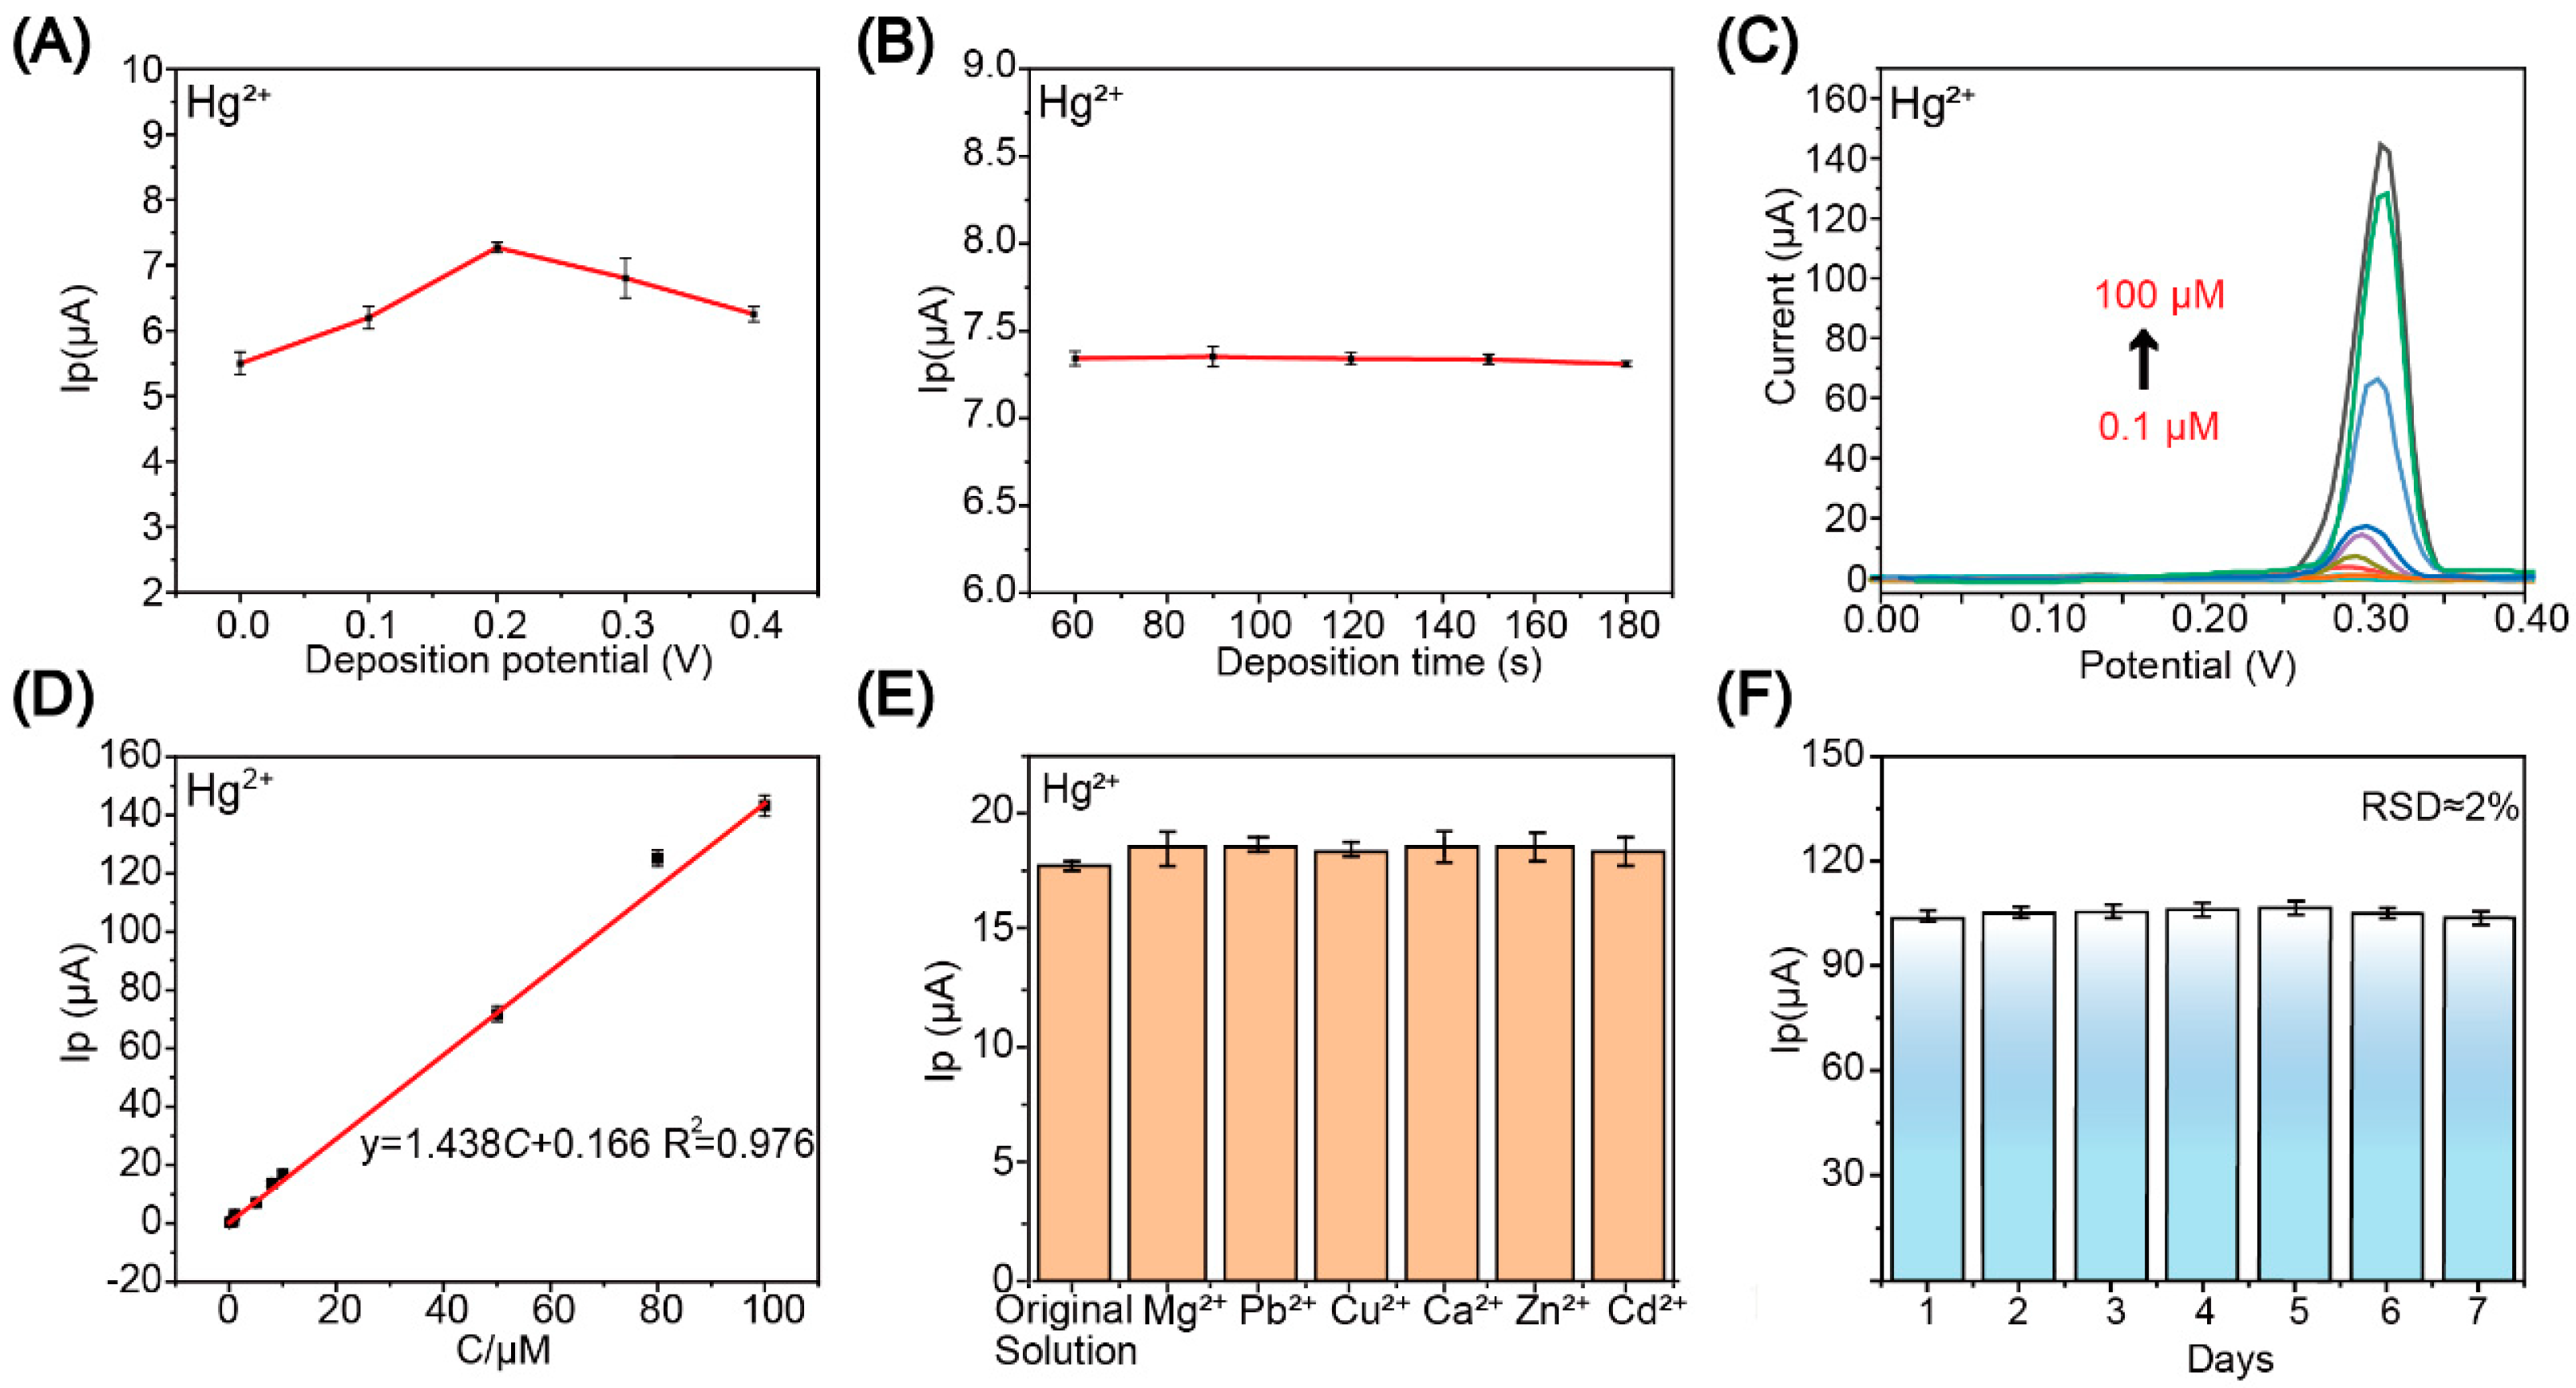
This study optimized deposition voltages of Hg2+ at five potential values: 0 V, 0.1 V, 0.2 V, 0.3 V, and 0.4 V. The optimal deposition potential was selected based on peak current magnitude. Within the potential range of −0.2 to 0.5 V, scans were performed with an enrichment time of 120 s, a square-wave amplitude of 25 mV, and a frequency of 15 Hz. As shown in Figure 3A, the optimal deposition voltage for Hg2+ was ~0.2 V. Following the determination of the optimal deposition potential, the deposition time for SWASV was optimized. Deposition durations of 60 s, 90 s, 120 s, 150 s, and 180 s were tried. As shown in Figure 3B, the peaking current of depositing Hg2+ tends to stabilize at ~7.3 µA. To achieve sufficient Hg deposition on the WE, an optimized deposition voltage of +0.30 V and a deposition time of 60 s were used for Hg2+ detection.
To characterize the performance of the sensor for Hg2+ ion detection, 0.1 M KCl solution was selected as the supporting electrolyte, and samples containing Hg2+ in the range of 0.1, 0.5, 0.8, 1, 5, 8, 10, 50, 80, and 100 μM were prepared. During detection, Hg2+ enrichment was performed at a deposition potential of +0.30 V for 60 s, as described above. Subsequently, a square-wave stripping scan with a step size of 4 mV, amplitude of 25 mV, and 15 Hz signal was applied over a potential window of −0.2 V to 0.4 V. Figure 3D summarizes the stripping peak current for Hg2+ collected at +0.3 V scanning voltage, indicating that the stripping peak current increased almost continuously as the Hg2+ concentration increased from 0.1 to 100 μM. A linear fitting of the peak current yields an equation Ip = 1.438 CHg2+ + 0.166, with a correlation coefficient R2 of 0.976, as shown in Figure 3E. After further subtracting the standard deviation of the blank current (σ = 0.142 µA), an LOD of 0.3 μM for the measurement of Hg2+ can be obtained. The value of σ was also used for the calibration of LOD of the other ion sensors. The sensor’s superb performance is attributed to the ion coordination in the MOF-C nanomaterial and the reduced interfacial resistance and polarization resulting from MWCNT modification [58]. To evaluate interference resistance, solutions of Mg2+, Cu2+, Zn2+, Cd2+, Pb2+, and Ca2+ at 50 times the Hg2+ concentration (10 μM) were spiked in the samples. As shown in Figure 3F, the measured Hg2+ peak current deviations were all within ±5%, indicating that, under these SWASV conditions, Hg2+ detection also exhibits high sensitivity and excellent interference resistance. Detection procedures for other ions follow the same steps as for Hg2+, and the results are demonstrated as follows. Repeated measurements of the same sensor over 7 days reveal consistent peak current responses, as illustrated in Figure 3F, with an RSD of approximately 2%, confirming the chip’s long-term stability. These performance tests confirm that the fabricated SPE electrochemical sensors exhibit outstanding electrochemical properties, thereby providing a robust platform for subsequent detection of heavy metal ions in marine samples.
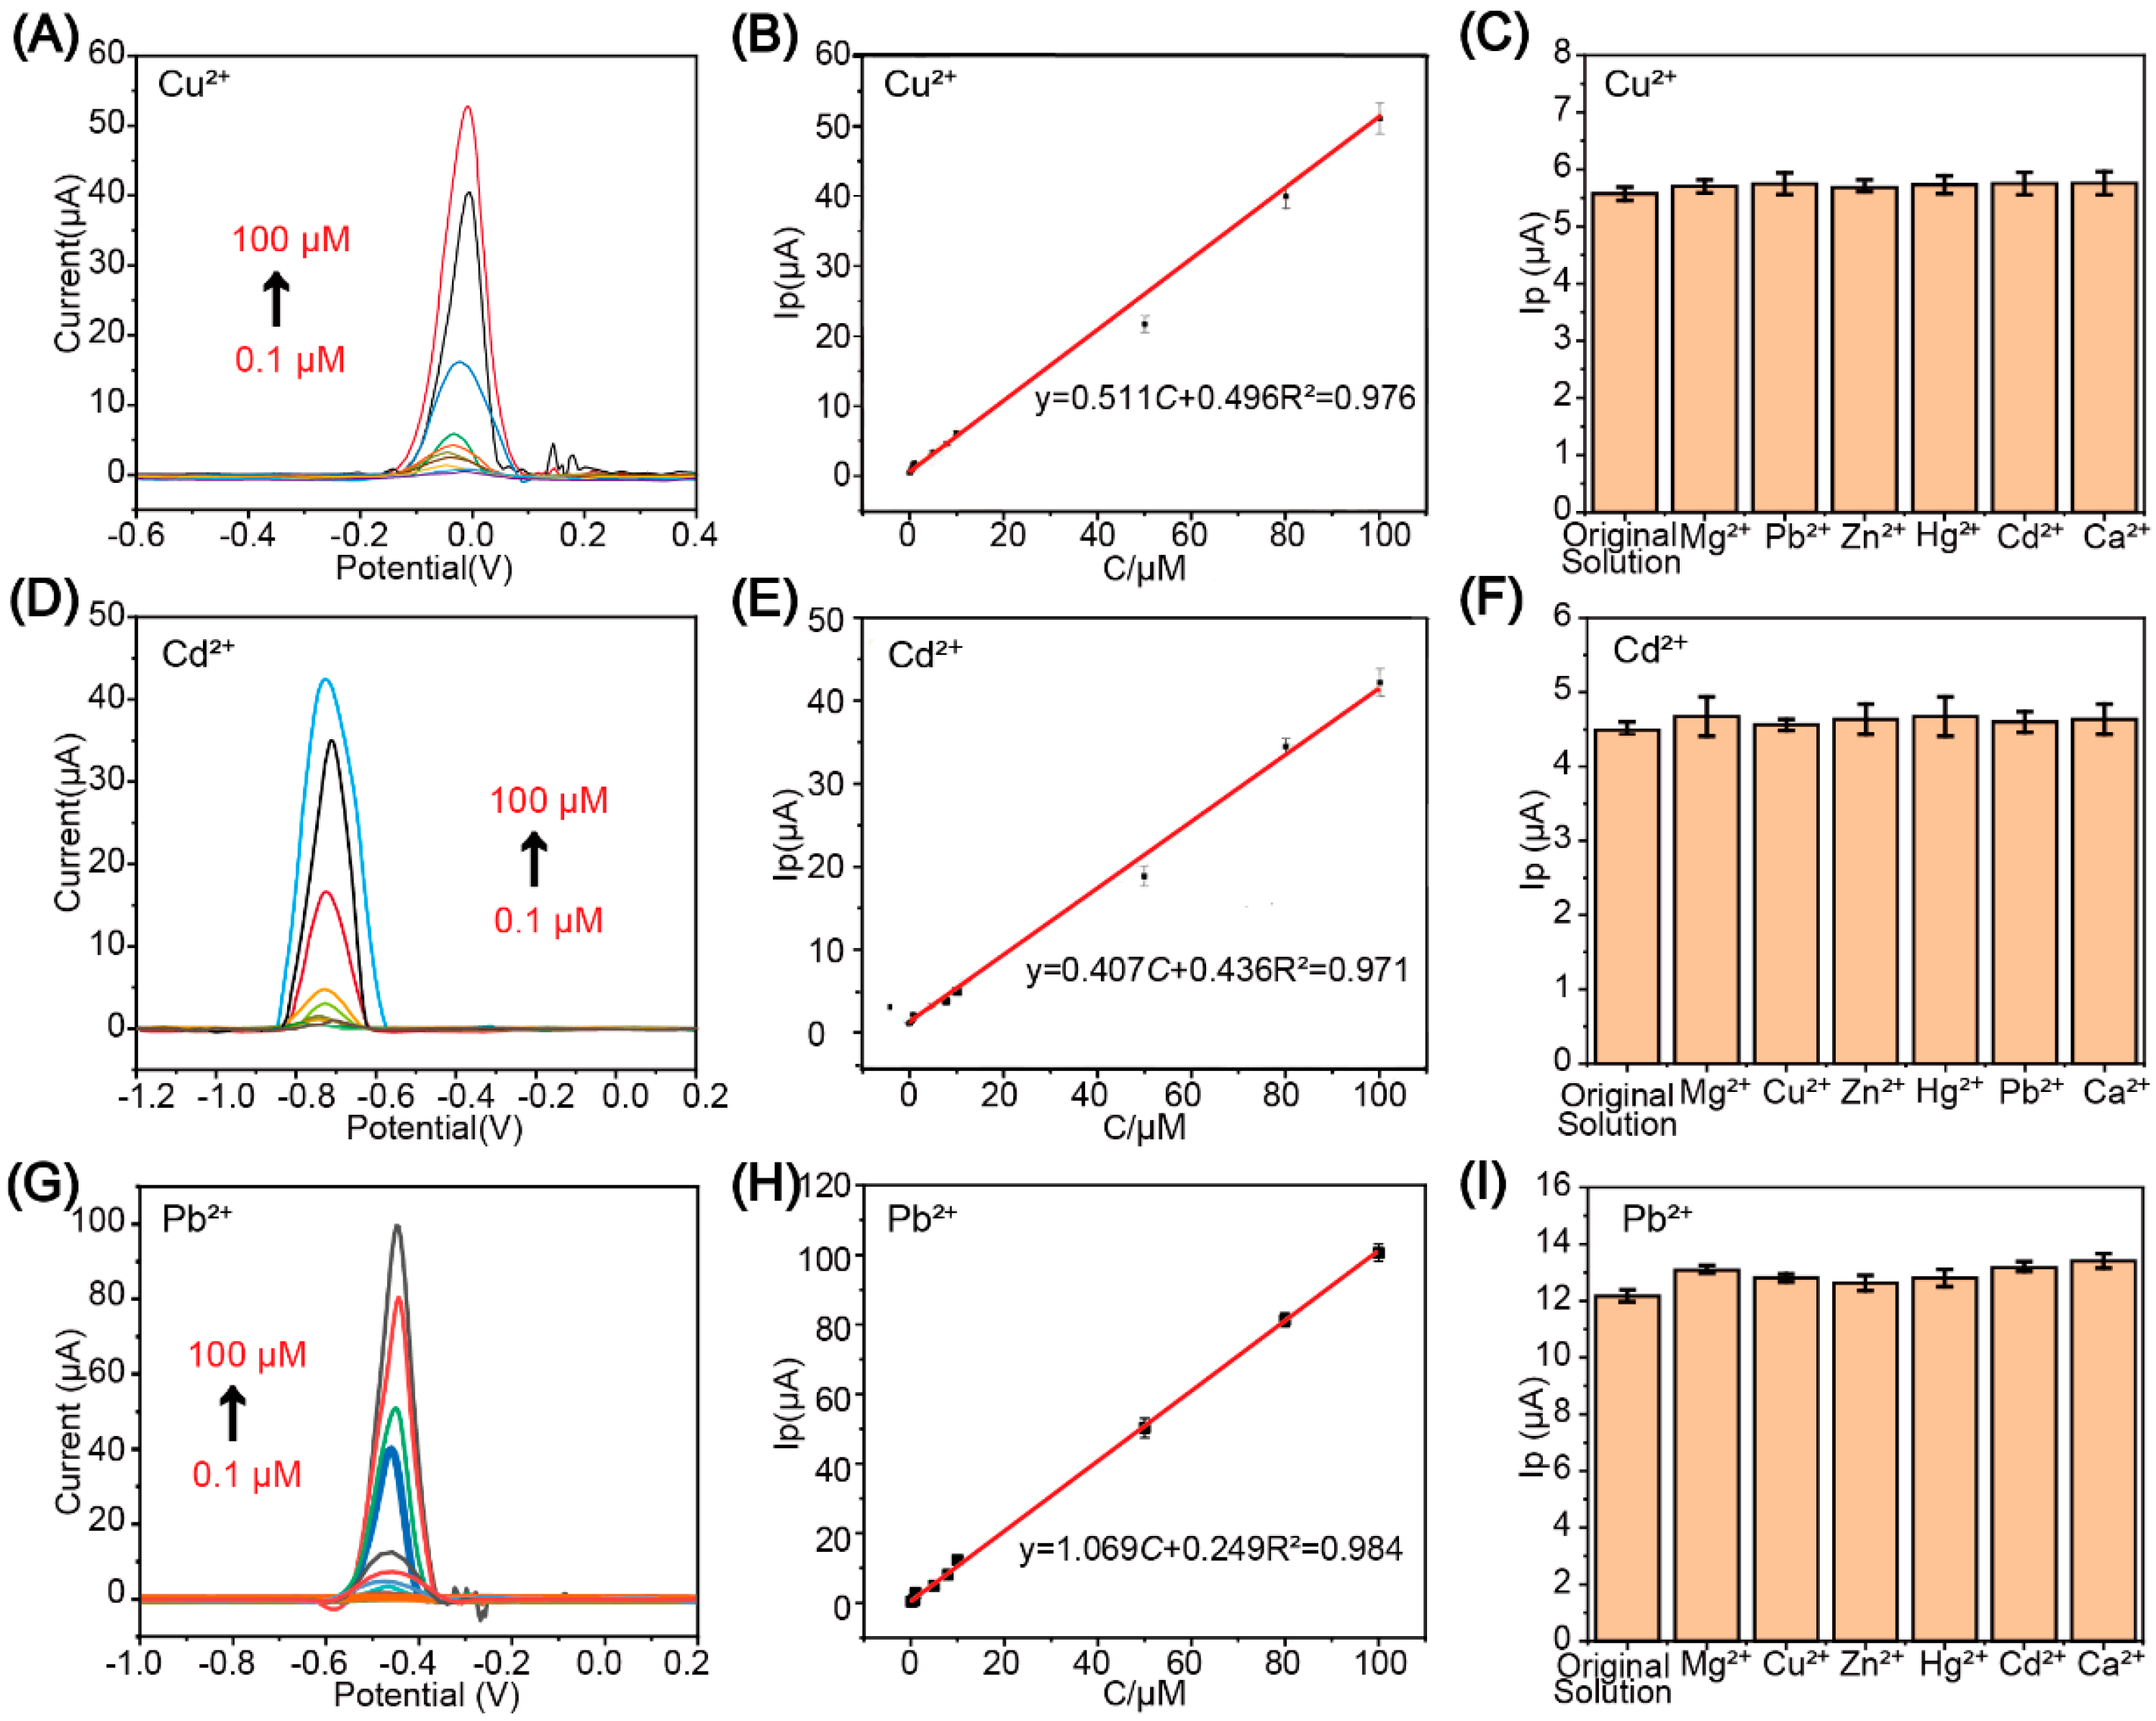
Optimization of working parameters for the detection of the other ions, Cu2+, Cd2+, and Pb2+, was the same as that of Hg2+, as demonstrated in Figure S2. Figure 4A shows the results of detecting Cu2+, in which the peak voltage for Cu2+ is around −0.03 V; however, this value is more positive than those reported in the literature [59]. This is attributed to Cu2+ coordination in the porous surface framework, which reduces the desorption overpotential, and to accelerated electron transport facilitated by the conductive MWCNT network. It exhibits good linearity over the concentration range of 0.1 μM to 100 μM, which can be fitted by a linear equation Ip = 0.511 C C u 2 + + 0.496 (R2 = 0.976) (Figure 4B). Based on the linear fitting curve, the detection limit is ~0.83 μM, demonstrating high detection accuracy and sensitivity.
Figure 4D,G show the electrochemical signals collected during the detection of Cd2+ and Pb2+ over the 0.1~100 μM range, respectively. For both ions, peak currents show a good linear correlation with concentration. Figure 4G shows a distinct oxidation peak for Cd2+ ions at −0.75 V, with the stripping potential shifted by 50 mV to more positive values than predicted. This shift is likely due to the electrode surface’s chemical sites, the pore environment, and the thickness of the mass-transfer layer. Within the concentration range of 0.1~100 μM, the peak current increases linearly with the concentration, with the linear fitting equation of Ip = 0.407 C C d 2 + + 0.436 (R2 = 0.971) (Figure 4E). An LOD of 1.05 μM for the detection of Cd2+ can be obtained based on the equation. Similarly, a distinct oxidation peak for Pb2+ detection at −0.40 V is observed in Figure 4G, and a linear fit of the peak current is shown in Figure 4H. Based on the fitting curve (Ip = 1.069 C P b 2 + + 0.249 (R2 = 0.984)), an LOD of ~0.40 μM for Pb2+ detection can be obtained.
Interference resistance testing was also performed for the testing of Cu2+, Cd2+, and Pb2+, in which 0.1 M KCl solution was employed as the supporting electrolyte and interfering ions (including Zn2+, Hg2+, Mg2+, Ca2+) of 50-fold concentrations of the target ions were spiked in the samples. The results are presented in Figure 4C, Figure 4F, and Figure 4I, respectively. The results indicate that the interfering ions have little effect on the target ions’ signals, with <5% amplitude deviation. All four ions demonstrated high sensitivity, broad linear ranges (i.e., good linearity), and excellent resistance to matrix interference. Noted that cyclic voltammetry (CV) experiments were also conducted to detect heavy metal ions, and examples of the results are presented in Figure S5. The results show that unsatisfactory peak currents were obtained because only linear potential scanning was used without a concentration step. In contrast, SWASV enriches metal ions on the MOF-C@MWCNT composite layer via electrodeposition, thereby amplifying peak currents and improving detection limits.

3.4. Simultaneous Determination of Mixed Heavy Metal Ions

After completing individual detection of four typical heavy metal ions, Cu2+, Cd2+, Pb2+, and Hg2+, validation of the SPE electrochemical sensor for the detection of metal ion mixture samples was conducted. During testing, Cu2+, Pb2+, Cd2+, and Hg2+ were spiked into a 0.1 M KCl supporting electrolyte, and concentration gradients of 80 μM, 50 μM, 10 μM, 8 μM, 5 μM, and 1 μM were prepared. According to the previously optimized parameters, cadmium ions require the longest deposition time of 150 s. To accommodate the reduction enrichment requirements of all four ions (Cu2+, Pb2+, Cd2+, and Hg2+), an enrichment potential of −0.60 V for 150 s was applied to the MOF-C@MWCNTs WE. Thereafter, an SWASV scan with a 25 mV square-wave amplitude, 15 Hz frequency, and 4 mV step size was applied across the WE scanning window of −1.0~0.5 V. Current–voltage curves were recorded in real time throughout the SWASV process, with each scan taking approximately 4 min.
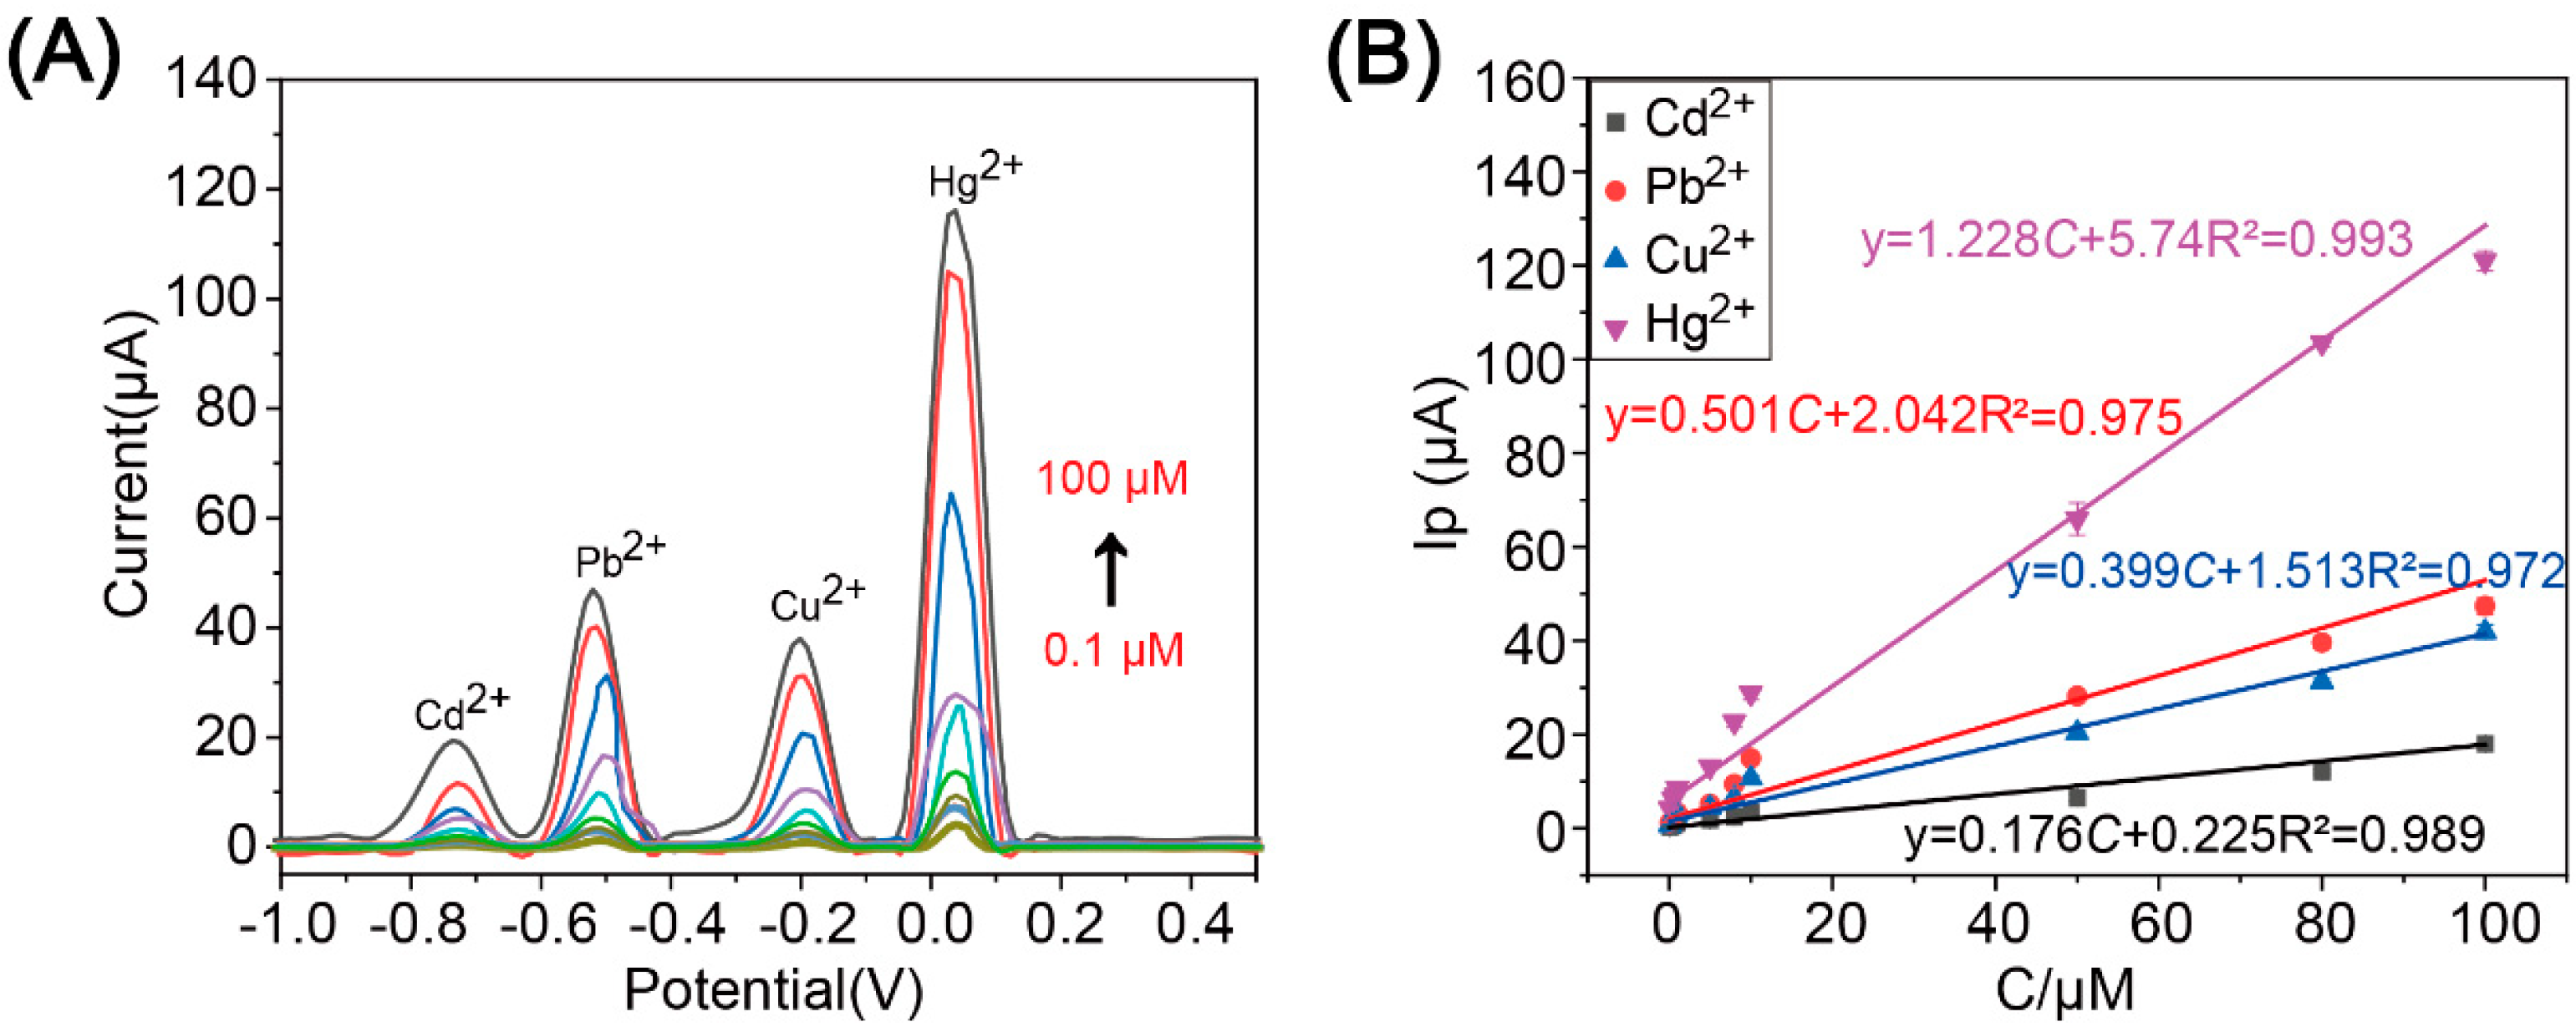
Figure 5 shows the results of detecting a mixture of four kinds of heavy metal ions (Cu2+, Cd2+, Pb2+, and Hg2+) spiked in KCl supporting electrolyte. Figure 5A reveals four successive peaks of the target ions from left to right: Cd2+ peak at ~−0.75 V, Pb2+ peak at ~−0.55 V, Cu2+ peak at ~−0.21 V, and Hg2+ peak at ~0.051 V. Compared to individual detection, the peaks for Cd2+ and Pb2+ show slight shifts but no significant changes. This occurs because, in a system where Cu2+, Pb2+, Cd2+, and Hg2+ coexist, their reduction enrichment at the electrode surface follows a first-come, first-served mechanism. Cu2+ and Hg2+ ions have higher reduction potentials than Cd2+ and Pb2+, resulting in thicker metal films that increase local resistance and polarization. At this stage, Cu2+ and Hg2+ ions occupy a large number of MOF sites, causing Cd2+ and Pb2+ ions to have fewer adsorption sites. Consequently, a more negative potential is required for desorption, indicating surface competition and adsorption effects [60]. The simultaneous presence of multiple metal ions reduces selectivity and results in higher detection limits than single-metal detection. In mixed-metal systems, ions compete for the limited electroactive sites during deposition, with higher-potential species such as Cu2+ and Hg2+ being preferentially reduced. Furthermore, co-deposition interferes with the stripping process, leading to peak broadening and partial overlap, thereby reducing the effective stripping current and increasing signal uncertainty. Therefore, the detection limit for mixed-metal detection is higher than that for single-metal detection [61,62]. Site competition reduces deposition rates, thereby lowering peak currents, whereas co-precipitation forms multimetallic layers that hinder electron-transfer efficiency. These synergistic effects result in lower actual deposition rates for each metal than in single-metal systems [63]. Ultimately, the simultaneous presence of multiple metal ions limits selectivity, resulting in higher detection limits in mixed-metal detection than in single-metal detection.
Figure 5B summarizes the fitting of the peak current for detecting these ions. Under mixed detection conditions, the detection limits for the four metals are 1.07 μM (Cu2+), 0.85 μM (Pb2+), 2.42 μM (Cd2+), and 0.35 μM (Hg2+), as obtained for the calculated σ b l a n k = 0.142 μA and the curve slopes. Compared to the LODs in single-component detection, the detection limits for all ions increased in the mixed system. For the mixed-ion calibration, linear regression to obtain k was performed within the validated working range; any concentration points below the corresponding LOD (if shown as exploratory data) were excluded from the regression. The increase was relatively small for Cu2+ and Hg2+, approximately 1.2 to 1.3 times compared to those of the individual cases, while Pb2+ and Cd2+ increased to about 3.9 times and 2.3 times, respectively. This trend primarily stems from competitive adsorption at the electrode’s active sites during the coexistence of multiple ions, coupled with the combined effects of mass transfer and interfacial resistance. The more negative potential and longer mass-transfer path during the enrichment phase resulted in the most significant reduction in enrichment efficiency for Pb2+ and Cd2+. Conversely, Cu2+ and Hg2+ exhibit more positive reduction potentials and are less affected by competition, resulting in a smaller increase in detection limits during mixed detection. This result aligns with expectations of increased background noise and physicochemical effects during simultaneous multi-ion enrichment. Note that in seawater matrices, the presence of Cl ions leads to the formation of stable complexes with target analytes, resulting in an increase in detection limits. Although the sensor’s detection limit for mixed-ion detection remained at the μM level, it exhibited a good linear response range and strong resistance to interference, making it suitable for rapid on-site screening of heavy pollution.

3.5. Real Sample Validation and Stability

To verify the sensor’s practicability, artificial seawater was spiked with heavy metal ions and then tested with the sensor. One control group contained no spiked heavy metal ions, while other groups were spiked with standard solutions of Cu2+, Pb2+, Cd2+, and Hg2+ at concentrations of 5 μM, 10 μM, and 20 μM. The recovery ratios of testing were obtained through spiking experiments, as shown in Table 1.
In the blank control solution, no detectable stripping current peaks were observed for Cd2+, Pb2+, or Cu2+, while Hg2+ exhibited a faint signal of 0.35 ± 0.08 µA. As concentration increased, the stripping peak currents for all four metals increased with the amounts of spiked ions. Taking the 5 µM spiked group as an example, the peak currents for Cd2+, Pb2+, Cu2+, and Hg2+ were 4.65 ± 0.32, 4.87 ± 0.25, 4.78 ± 0.18, and 4.96 ± 0.45 µA, corresponding to recovery ratios of 93.1%, 95.2%, 95.6%, and 92.2%, indicating a slight decrease in enrichment efficiency at low concentrations. At 10 µM spiking, recovery rates for all four ions increased to 98~99%, while at 20 µM spiking, recovery ratios further approached or exceeded 100%. The increasing recovery ratio may result from more complete enrichment at high concentrations or slight deviations in background subtraction. Overall, this method achieved spiked recovery rates for Cu2+, Pb2+, Cd2+, and Hg2+ in artificial seawater within the reasonable range of 92–107%, with excellent repeatability (RSD < 5%), indicating that the SPE electrochemical sensor we developed maintains stable quantitative accuracy and superior interference resistance even in high-salinity matrices.
In addition, coastal seawater samples collected from three different locations, Dalian, Zhanjiang, and Maoming (Figure S7), were detected by the sensors we developed. Suspended particles were removed using a 0.22 μm PTFE filter as described above, and the samples were acidified to pH < 2 before refrigeration at 4 °C to remove sediment. Subsequently, 10 μM Cd2+, Pb2+, Cu2+, and Hg2+ was spiked in the water sample, respectively. Target ions (e.g., Pb2+, Cd2+) were electro-deposited and enriched onto the WE by applying a constant potential (e.g., −1.2 V vs. Ag/AgCl), followed by the application of an SWASV signal with a scan range of 0.1~0.8 V (frequency 25 Hz, amplitude 50 mV, step size 4 mV). Ion species were qualitatively identified by their elution peak potentials. The entire process was completed within 20 min. When combined with portable electrochemical workstation data-processing software, it enables rapid on-site detection of heavy metal ions in seawater samples.
Table 2 presents the results for the detection of heavy metal ions in real seawater samples from Dalian, Zhanjiang, and Maoming, spiked with the target ions. In this spiked recovery experiment, Cd2+ and Cu2+ concentrations were undetectable in unspiked seawater samples from Dalian, Maoming, and Zhanjiang. The concentrations of Pb2+ and Hg2+ in the Dalian sample are the highest, at approximately 0.96 ± 0.13 μM and 0.65 ± 0.13 μM, respectively. After spiking target ions of 10 μM, the measured concentrations of Cd2+, Pb2+, Cu2+, and Hg2+ are 9.32~10.12 μM (Cd2+), 9.59~9.87 μM (Pb2+), 9.75~10.36 μM (Cu2+), and 10.11~10.91 μM (Hg), respectively. Recovery rates of 93.2–103.6% and relative standard deviations below 6% were obtained (Table 2), demonstrating excellent quantitative accuracy and detection repeatability.
Based on detection data from actual seawater samples collected from these locations, the spatio-temporal distribution patterns of coastal heavy metal pollution can be preliminarily revealed. For example, the background concentrations of Pb2+ and Hg2+ in Dalian seawater samples are significantly higher than in the other two locations. This may be closely related to the dense shipbuilding and repair industries, port logistics, and historical industrial sediment releases in the surrounding areas. In contrast, the Hg2+ background levels in Zhanjiang and Maoming waters (0.53~0.57 μM) were lower than Dalian’s. This indicates that the Beibu Gulf region of the South China Sea is significantly affected by feed discharge from coastal aquaculture, wastewater discharge from the petrochemical industry, and atmospheric deposition carried by monsoons [64]. Notably, Cd2+ and Cu2+ were not detected in any of the three locations under non-spiked conditions, potentially reflecting stringent environmental controls imposed on electroplating and metallurgical industries in recent years [65]. The test results indicate potential improvements in the protection of the marine environment, thereby enhancing the safety of the ecosystem and marine organisms.

4. Conclusions

This study developed a highly sensitive, low-cost, and portable SPE electrochemical sensor for detecting heavy metal ions in the marine environment. Batch preparation of a three-electrode electrochemical sensor via screen-printing under conventional laboratory conditions was achieved. An optimized MOF-C@MWCNT composite was used to functionalize WE, thereby significantly enhancing conductivity and specificity for the detection of four typical marine heavy metal ions by SWASV. Simultaneous detection of heavy metal ion mixtures in seawater matrices was also achieved by optimizing deposition potential and scanning parameters. The sensor developed in this work demonstrates high accuracy and stability for detecting heavy metal ions in high-salinity matrices, with recoveries ranging from 92% to 107% and a relative standard deviation (RSD) below 5%. This study presents a facile method for fabricating high-performance SPE electrochemical sensors, particularly for heavy metal ion detection, via an innovative nanomaterial composite strategy. The SPE electrochemical sensor is compact and enables the entire detection process, from sample loading to result output, to be completed within 10 min using a handheld electrochemical reader. We believe that the advantages of portability, mass production, and simultaneous detection capabilities offered by the reported sensor would make it a practical tool for rapid on-site screening of heavy metal pollution, particularly in marine environments.

Supplementary Materials

The following supporting information can be downloaded at https://www.mdpi.com/article/10.3390/chemosensors14020040/s1, Figure S1: Fabrication of the screen-printing paper-based electrochemical sensor; Figure S2: Design of the paper-based electrochemical sensor; Figure S3: Reliability and repeatability of the SPE sensors; Figure S4: Optimization of deposition voltage and deposition duration for detecting Cd2+, Cu2+ and Pb2+ ions; Figure S5: Cyclic voltammetric curves of detecting Cu2+, Pb2+, Hg2+ and Cd2+ ions; Figure S6: CV determination of mixed heavy metal ions (Cu2+, Cd2+, Pb2+, Hg2+) in KCl electrolyte; Figure S7: Locations of seawater samples.

Author Contributions

R.P. and W.W. generated the ideas and drafted the manuscript; P.Z., C.W., G.W. and W.M. conducted the experiments; A.X., W.W. and Z.H. organized and analyzed the data; R.P., Y.L. and J.Y. coordinated and supervised this project. All authors have read and agreed to the published version of the manuscript.

Funding

This research was funded by Open Fund of Guangdong Provincial Key Laboratory of Intelligent Equipment for South China Sea Marine Ranching (Grant NO. 2023B1212030003), the National Natural Science Foundation of China (52273243, 52101395), and China Postdoctoral Science Foundation (2022MS720621).

Institutional Review Board Statement

Not applicable.

Informed Consent Statement

Not applicable.

Data Availability Statement

The data presented in this study are available upon request from the respective authors.

Conflicts of Interest

The authors declare no conflicts of interest.

References

  1. Turdean, G.L. Design and Development of Biosensors for the Detection of Heavy Metal Toxicity. Int. J. Electrochem. 2011, 2011, 343125. [Google Scholar] [CrossRef]
  2. Masindi, V.; Muedi, K.L. Environmental Contamination by Heavy Metals. In Heavy Metals; InTech: Hong Kong, China, 2018. [Google Scholar]
  3. Shimizu, F.M.; Braunger, M.L.; Riul, A. Heavy Metal/Toxins Detection Using Electronic Tongues. Chemosensors 2019, 7, 36. [Google Scholar] [CrossRef]
  4. Aragay, G.; Pons, J.; Merkoçi, A. Recent Trends in Macro-, Micro-, and Nanomaterial-Based Tools and Strategies for Heavy-Metal Detection. Chem. Rev. 2011, 111, 3433–3458. [Google Scholar] [CrossRef]
  5. Duffus, J.H. “Heavy Metals” a Meaningless Term? (IUPAC Technical Report). Pure Appl. Chem. 2002, 74, 793–807. [Google Scholar] [CrossRef]
  6. Li, M.; Gou, H.; Al-Ogaidi, I.; Wu, N. Nanostructured Sensors for Detection of Heavy Metals: A Review. ACS Sustain. Chem. Eng. 2013, 1, 713–723. [Google Scholar] [CrossRef]
  7. Azimi, A.; Azari, A.; Rezakazemi, M.; Ansarpour, M. Removal of Heavy Metals from Industrial Wastewaters: A Review. ChemBioEng Rev. 2017, 4, 37–59. [Google Scholar] [CrossRef]
  8. Carić, H.; Cukrov, N.; Omanović, D. Nautical Tourism in Marine Protected Areas (MPAs): Evaluating an Impact of Copper Emission from Antifouling Coating. Sustainability 2021, 13, 11897. [Google Scholar] [CrossRef]
  9. Tornero, V.; Hanke, G. Chemical Contaminants Entering the Marine Environment from Sea-Based Sources: A Review with a Focus on European Seas. Mar. Pollut. Bull. 2016, 112, 17–38. [Google Scholar] [CrossRef]
  10. Mititelu, M.; Neacșu, S.M.; Busnatu, Ș.S.; Scafa-Udriște, A.; Andronic, O.; Lăcraru, A.-E.; Ioniță-Mîndrican, C.-B.; Lupuliasa, D.; Negrei, C.; Olteanu, G. Assessing Heavy Metal Contamination in Food: Implications for Human Health and Environmental Safety. Toxics 2025, 13, 333. [Google Scholar] [CrossRef]
  11. Kumar, V.; Umesh, M.; Shanmugam, M.K.; Chakraborty, P.; Duhan, L.; Gummadi, S.N.; Pasrija, R.; Jayaraj, I.; Dasarahally Huligowda, L.K. A Retrospection on Mercury Contamination, Bioaccumulation, and Toxicity in Diverse Environments: Current Insights and Future Prospects. Sustainability 2023, 15, 13292. [Google Scholar] [CrossRef]
  12. Balali-Mood, M.; Naseri, K.; Tahergorabi, Z.; Khazdair, M.R.; Sadeghi, M. Toxic Mechanisms of Five Heavy Metals: Mercury, Lead, Chromium, Cadmium, and Arsenic. Front. Pharmacol. 2021, 12, 643972. [Google Scholar] [CrossRef]
  13. Lee, J.; Freeman, J. Zebrafish as a Model for Developmental Neurotoxicity Assessment: The Application of the Zebrafish in Defining the Effects of Arsenic, Methylmercury, or Lead on Early Neurodevelopment. Toxics 2014, 2, 464–495. [Google Scholar] [CrossRef]
  14. de Paula Arrifano, G.; Crespo-Lopez, M.E.; Lopes-Araújo, A.; Santos-Sacramento, L.; Barthelemy, J.L.; de Nazaré, C.G.L.; Freitas, L.G.R.; Augusto-Oliveira, M. Neurotoxicity and the Global Worst Pollutants: Astroglial Involvement in Arsenic, Lead, and Mercury Intoxication. Neurochem. Res. 2023, 48, 1047–1065. [Google Scholar] [CrossRef]
  15. Cariccio, V.L.; Samà, A.; Bramanti, P.; Mazzon, E. Mercury Involvement in Neuronal Damage and in Neurodegenerative Diseases. Biol. Trace Elem. Res. 2019, 187, 341–356. [Google Scholar] [CrossRef]
  16. Abu-Dieyeh, M.H.; Usman, K.; Alduroobi, H.; Al-Ghouti, M. Mercury Toxicity. In Heavy Metals in the Environment; A science publishers book; CRC Press: Boca Raton, FL, USA, 2018; pp. 248–267. [Google Scholar]
  17. Hapke, H.-J. Heavy Metal Transfer in the Food Chain to Humans. In Fertilizers and Environment; Springer: Dordrecht, The Netherlands, 1996; pp. 431–436. [Google Scholar]
  18. Abdel-Haleem, A.S.; Sroor, A.; El-Bahi, S.M.; Zohny, E. Heavy Metals and Rare Earth Elements in Phosphate Fertilizer Components Using Instrumental Neutron Activation Analysis. Appl. Radiat. Isot. 2001, 55, 569–573. [Google Scholar] [CrossRef]
  19. Prange, A.; Knöchel, A.; Michaelis, W. Multi-Element Determination of Dissolved Heavy Metal Traces in Sea Water by Total-Reflection x-Ray Fluorescence Spectrometry. Anal. Chim. Acta 1985, 172, 79–100. [Google Scholar] [CrossRef]
  20. Schramel, P.; Wendler, I.; Angerer, J. The Determination of Metals (Antimony, Bismuth, Lead, Cadmium, Mercury, Palladium, Platinum, Tellurium, Thallium, Tin and Tungsten) in Urine Samples by Inductively Coupled Plasma-Mass Spectrometry. Int. Arch. Occup. Environ. Health 1997, 69, 219–223. [Google Scholar] [CrossRef]
  21. Willis, J.B. Determination of Lead and Other Heavy Metals in Urine by Atomic Absorption Spectroscopy. Anal. Chem. 2002, 34, 614–617. [Google Scholar] [CrossRef]
  22. Tokalioǧlu, Ş.; Kartal, Ş.; Elçi, L. Determination of Heavy Metals and Their Speciation in Lake Sediments by Flame Atomic Absorption Spectrometry after a Four-Stage Sequential Extraction Procedure. Anal. Chim. Acta 2000, 413, 33–40. [Google Scholar] [CrossRef]
  23. Arvand, M.; Pourhabib, A.; Afshari, A.; Bagherinia, M.; Ghodsi, N.; Shemshadi, R. Determination of Cadmium and Zinc in Water Samples by Flame Atomic Absorption Spectrometry after Cloud-Point Extraction. J. Anal. Chem. 2008, 63, 954–959. [Google Scholar] [CrossRef]
  24. Sardans, J.; Montes, F.; Peñuelas, J. Electrothermal Atomic Absorption Spectrometry to Determine As, Cd, Cr, Cu, Hg, and Pb in Soils and Sediments: A Review and Perspectives. Soil Sediment Contam. Int. J. 2011, 20, 447–491. [Google Scholar] [CrossRef]
  25. Palareti, G.; Legnani, C.; Cosmi, B.; Antonucci, E.; Erba, N.; Poli, D.; Testa, S.; Tosetto, A. Comparison between Different D-Dimer Cutoff Values to Assess the Individual Risk of Recurrent Venous Thromboembolism: Analysis of Results Obtained in the DULCIS Study. Int. J. Lab. Hematol. 2016, 38, 42–49. [Google Scholar] [CrossRef] [PubMed]
  26. Thompson, M. Handbook of Inductively Coupled Plasma Spectrometry; Springer Science & Business Media: New York, NY, USA, 2012; ISBN 1461306973. [Google Scholar]
  27. Ma, W.; Xu, S.; Liu, H.; Bai, Y. Mass Spectrometry Methods for In Situ Analysis of Clinical Biomolecules. Small Methods 2020, 4, 1900407. [Google Scholar] [CrossRef]
  28. Bojkovic, A.; Vermeire, F.H.; Kuzmanović, M.; Dao Thi, H.; Van Geem, K.M. Analytics Driving Kinetics: Advanced Mass Spectrometric Characterization of Petroleum Products. Energy Fuels 2022, 36, 6–59. [Google Scholar] [CrossRef]
  29. Santos-Hernández, M.; Amigo, L.; Recio, I. Induction of CCK and GLP-1 Release in Enteroendocrine Cells by Egg White Peptides Generated during Gastrointestinal Digestion. Food Chem. 2020, 329, 127188. [Google Scholar] [CrossRef]
  30. Liu, H.; Xu, C.; Wang, W.; Zhao, Y. Development and Validation of an LC-ESI-MS/MS Method for Simultaneous Determination of Ligustroflavone and Rhoifolin in Rat Plasma and Its Application to a Pharmacokinetic Study. J. Chromatogr. Sci. 2017, 55, 267–274. [Google Scholar] [CrossRef]
  31. Williamson, J.P.; Emmert, G.L. A Flow Injection Analysis System for Monitoring Silver (I) Ion and Iodine Residuals in Recycled Water from Recovery Systems Used for Spaceflight. Anal. Chim. Acta 2013, 792, 72–78. [Google Scholar] [CrossRef]
  32. Abdul Hakkeem, H.M.; Babu, A.; Kumar Pal, S.; Peer Mohamed, A.; Kumar Ghosh, S.; Pillai, S. Cellulose Nanocrystals Directed In-Situ Assembly of Au@Ag Nanostructures with Multifunctional Activities. Microchem. J. 2021, 168, 106393. [Google Scholar] [CrossRef]
  33. Wang, X.; Li, Y.; Chen, M.; Li, C.; Huang, W.; Gu, K.; Yu, H.; Yuan, Y.; Wang, Y.; Yang, B.; et al. Stepwise Rapid Tracking Strategy to Identify Active Molecules from Ixeris Sonchifolia Hance Based on “‘Affinity Mass Spectrometry-Atomic Force Microscopy Imaging’” Technology. Talanta 2020, 217, 121031. [Google Scholar] [CrossRef]
  34. Abd El-Raheem, H.; Helim, R.; Hassan, R.Y.A.; Youssef, A.F.A.; Korri-Youssoufi, H.; Kraiya, C. Electrochemical Methods for the Detection of Heavy Metal Ions: From Sensors to Biosensors. Microchem. J. 2024, 207, 112086. [Google Scholar] [CrossRef]
  35. Aragay, G.; Merkoçi, A. Nanomaterials Application in Electrochemical Detection of Heavy Metals. Electrochim. Acta 2012, 84, 49–61. [Google Scholar] [CrossRef]
  36. He, Y.; Ma, L.; Zhou, L.; Liu, G.; Jiang, Y.; Gao, J. Preparation and Application of Bismuth/MXene Nano-Composite as Electrochemical Sensor for Heavy Metal Ions Detection. Nanomaterials 2020, 10, 866. [Google Scholar] [CrossRef]
  37. Bazazi, S.; Hashemi, E.; Mohammadjavadi, M.; Saeb, M.R.; Liu, Y.; Huang, Y.; Xiao, H.; Seidi, F. Metal-Organic Framework (MOF)/C-Dots and Covalent Organic Framework (COF)/C-Dots Hybrid Nanocomposites: Fabrications and Applications in Sensing, Medical, Environmental, and Energy Sectors. Adv. Colloid Interface Sci. 2024, 328, 103178. [Google Scholar] [CrossRef]
  38. Lu, Y.; Chen, X.; Lan, H.; Nag, A.; Chen, Y.; Gao, J.; Deng, S. A Review of Multi-Walled Carbon Nanotubes-Based Electrochemical Sensors to Detect Heavy Metals for Food Packaging Applications. J. Alloys Compd. 2025, 1017, 179106. [Google Scholar] [CrossRef]
  39. Bagheri, H.; Afkhami, A.; Khoshsafar, H.; Rezaei, M.; Shirzadmehr, A. Simultaneous Electrochemical Determination of Heavy Metals Using a Triphenylphosphine/MWCNTs Composite Carbon Ionic Liquid Electrode. Sens. Actuators B Chem. 2013, 186, 451–460. [Google Scholar] [CrossRef]
  40. Muthukumaran, M.K.; Govindaraj, M.; Kogularasu, S.; Sriram, B.; Raja, B.K.; Wang, S.-F.; Chang-Chien, G.-P.; Selvi, J.A. Recent Advances in Metal-Organic Frameworks for Electrochemical Sensing Applications. Talanta Open 2025, 11, 100396. [Google Scholar] [CrossRef]
  41. Couto, R.A.S.; Lima, J.L.F.C.; Quinaz, M.B. Recent Developments, Characteristics and Potential Applications of Screen-Printed Electrodes in Pharmaceutical and Biological Analysis. Talanta 2016, 146, 801–814. [Google Scholar] [CrossRef] [PubMed]
  42. Jesu Amalraj, A.J.; Wang, S.-F. An Effective Morphology Controlled Hydrothermal Synthesis of Bi2WO6 and Its Application in Riboflavin Electrochemical Sensor. Colloids Surf. A Physicochem. Eng. Asp. 2022, 648, 129183. [Google Scholar] [CrossRef]
  43. Zhang, H.; Wang, J.; Wu, W.; Han, C.; Li, M. Graphene Oxide Supported MOFs-Nanofiber Carbon Aerogel/SPCE for Simultaneous Detection of Cd2+ and Pb2+ in Seafood. Food Chem. 2025, 470, 142643. [Google Scholar] [CrossRef]
  44. Adegoke, K.A.; Maxakato, N.W. Porous Metal Oxide Electrocatalytic Nanomaterials for Energy Conversion: Oxygen Defects and Selection Techniques. Coord. Chem. Rev. 2022, 457, 214389. [Google Scholar] [CrossRef]
  45. Zhang, W.; Li, X.; Ding, X.; Hua, K.; Sun, A.; Hu, X.; Nie, Z.; Zhang, Y.; Wang, J.; Li, R.; et al. Progress and Opportunities for Metal–Organic Framework Composites in Electrochemical Sensors. RSC Adv. 2023, 13, 10800–10817. [Google Scholar] [CrossRef] [PubMed]
  46. Chronopoulos, D.D.; Saini, H.; Tantis, I.; Zbořil, R.; Jayaramulu, K.; Otyepka, M. Carbon Nanotube Based Metal–Organic Framework Hybrids From Fundamentals Toward Applications. Small 2022, 18, 2104628. [Google Scholar] [CrossRef]
  47. Sun, X.; Chen, Y.; Xie, Y.; Wang, L.; Wang, Y.; Hu, X. Preparation of a Chemically Stable Metal-Organic Framework and Multi-Walled Carbon Nanotube Composite as a High-Performance Electrocatalyst for the Detection of Lead. Analyst 2020, 145, 1833–1840. [Google Scholar] [CrossRef] [PubMed]
  48. Zhang, Y.; Yu, H.; Liu, T.; Li, W.; Hao, X.; Lu, Q.; Liang, X.; Liu, F.; Liu, F.; Wang, C.; et al. Highly Sensitive Detection of Pb2+ and Cu2+ Based on ZIF-67/MWCNT/Nafion-Modified Glassy Carbon Electrode. Anal. Chim. Acta 2020, 1124, 166–175. [Google Scholar] [CrossRef]
  49. Ma, Y.; Wang, Y.; Xie, D.; Gu, Y.; Zhu, X.; Zhang, H.; Wang, G.; Zhang, Y.; Zhao, H. Hierarchical MgFe-Layered Double Hydroxide Microsphere/Graphene Composite for Simultaneous Electrochemical Determination of Trace Pb(II) and Cd(II). Chem. Eng. J. 2018, 347, 953–962. [Google Scholar] [CrossRef]
  50. Guo, H.; Cheng, Y.; Li, Y.; Guo, X. Discussion on the Principles of Cyclic Voltammetry. Daxue Huaxue 2023, 38, 2212024. [Google Scholar] [CrossRef]
  51. Farghaly, O.A.; Ghandour, M.A. Square-Wave Stripping Voltammetry for Direct Determination of Eight Heavy Metals in Soil and Indoor-Airborne Particulate Matter. Environ. Res. 2005, 97, 229–235. [Google Scholar] [CrossRef]
  52. Clavijo Morales, J.A.; Zea Ramírez, H.R. Simultaneous Quantification of Hg(II) and Pb(II) by Square Wave Anodic Stripping Voltammetry Using Bi/Graphite Electrode. Heliyon 2024, 10, e34656. [Google Scholar] [CrossRef]
  53. Tennekes, M.; Chen, M. Design Space of Origin-Destination Data Visualization. Comput. Graph. Forum 2021, 40, 323–334. [Google Scholar] [CrossRef]
  54. Hai, T.L.; Hung, L.C.; Phuong, T.T.B.; Ha, B.T.T.; Nguyen, B.-S.; Hai, T.D.; Nguyen, V.-H. Multiwall Carbon Nanotube Modified by Antimony Oxide (Sb2O3/MWCNTs) Paste Electrode for the Simultaneous Electrochemical Detection of Cadmium and Lead Ions. Microchem. J. 2020, 153, 104456. [Google Scholar] [CrossRef]
  55. Munz, M.; Poon, J.; Frandsen, W.; Cuenya, B.R.; Kley, C.S. Nanoscale Electron Transfer Variations at Electrocatalyst-Electrolyte Interfaces Resolved by in Situ Conductive Atomic Force Microscopy. J. Am. Chem. Soc. 2023, 145, 5242–5251. [Google Scholar] [CrossRef]
  56. Mohamad, A.A. Cyclic Voltammetry of Hybrid Supercapacitors: A Characterization Review. Inorg. Chem. Commun. 2025, 172, 113677. [Google Scholar] [CrossRef]
  57. Karakaya, S.; Dilgin, Y. Disposable and Sensitive Electrochemical Determination of Molnupiravir at a Pencil Graphite Electrode (PGE) by Differential Pulse Voltammetry (DPV). Anal. Lett. 2024, 57, 783–796. [Google Scholar] [CrossRef]
  58. Kaliyaraj Selva Kumar, A.; Compton, R.G. Understanding Carbon Nanotube Voltammetry: Distinguishing Adsorptive and Thin Layer Effects via “Single-Entity” Electrochemistry. J. Phys. Chem. Lett. 2022, 13, 5557–5562. [Google Scholar] [CrossRef]
  59. Bodkhe, G.A.; More, M.S.; Umar, A.; Ibrahim, A.A.; Siva, S.; Deshmukh, M.A.; Ingle, N.N.; Gaikwad, D.K.; Tsai, M.-L.; Hianik, T.; et al. Enhanced Detection of Heavy Metal Ions Using Ag Nanoparticles and Single-Walled Carbon Nanotubes within Cu-Based Metal-Organic Frameworks. J. Environ. Chem. Eng. 2024, 12, 113024. [Google Scholar] [CrossRef]
  60. van Leeuwen, H.P.; Jansen, S. Dynamic Aspects of Metal Speciation by Competitive Ligand Exchange–Adsorptive Stripping Voltammetry (CLE–AdSV). J. Electroanal. Chem. 2005, 579, 337–342. [Google Scholar] [CrossRef]
  61. Thanh, N.M.; Van Hop, N.; Luyen, N.D.; Phong, N.H.; Toan, T.T.T.; Mai, H.D. Simultaneous Determination of Zn(II), Cd(II), Pb(II), and Cu(II) Using Differential Pulse Anodic Stripping Voltammetry at a Bismuth Film-Modified Electrode. Adv. Mater. Sci. Eng. 2019, 2019, 1826148. [Google Scholar] [CrossRef]
  62. Buffle, J.; Tercier-Waeber, M.L. Voltammetric Environmental Trace-Metal Analysis and Speciation: From Laboratory to in Situ Measurements. TrAC-Trends Anal. Chem. 2005, 24, 172–191. [Google Scholar] [CrossRef]
  63. Yin, C.; Zhang, Y.; Tao, Y.; Zhu, X. Competitive Adsorption Behavior and Adsorption Mechanism of Limestone and Activated Carbon in Polymetallic Acid Mine Water Treatment. Sci. Rep. 2024, 14, 23561. [Google Scholar] [CrossRef]
  64. Zhang, H.; Tang, D.; He, J.; Yang, X.; Feng, Z.; Fu, Y.; Yuan, X.; Chang, X.; Teng, D.; Liu, F.; et al. Assessment of Heavy Metal Contamination in the Surface Sediments, Seawater and Organisms of the Pearl River Estuary, South China Sea. Sci. Total Environ. 2024, 950, 175266. [Google Scholar] [CrossRef]
  65. Leviston, Z.; Walker, I.; Green, M.; Price, J. Linkages between Ecosystem Services and Human Wellbeing: A Nexus Webs Approach. Ecol. Indic. 2018, 93, 658–668. [Google Scholar] [CrossRef]
Figure 1. Design and fabrication of MWCNT@MOF-C for heavy metal ion detection. (A) Schematic diagram of the fabrication and functionalization of three-electrode electrochemical sensor. (B) Working mechanism of sensing heavy metal ions by SWASV with the electrochemical sensor. (C,D) Pictures of (C) screen stencils used for screen-printing and (D) an electrochemical sensor array on one page of the flexible PVC substrate. (E) A photo of the layout of the testing system and an example of the testing result. (F) SEM image of the WE after modification of the nanocomposite. (GI) Raman spectra of the materials: (G) MWCNT/SPE; (H) MOF-C/SPE; (I) MOF-C@MWCNT/SPE.
Chemosensors 14 00040 g001
Figure 2. Testing and optimization of the SPE sensors by using 10 mM K3Fe(CN)6/K4Fe(CN)6 redox electrolyte. (A) CV curves obtained at different scan rates; (B) fitting curves of the scan rate and peak current. (C) CV curves of SPE sensor modified with different nanomaterials. (D) EIS signals of SPE sensors modified with different nanomaterials. (E,F) Optimization of (E) the nanocomposites and (F) the dip–coating volume of surface modification.
Chemosensors 14 00040 g002
Figure 3. Optimization of the SWASV working parameters for the detection of Hg2+. (A,B) Stripping peak current of depositing Hg2+ under different deposition (A) voltages and (B) durations. (C) Quantitative detection of Hg2+ in the range of 0.1~100 µM. (D) Linear fitting of the stripping peak current and (E) interference testing of Hg2+. (F) Shelf–life testing of the electrochemical sensor.
Chemosensors 14 00040 g003
Figure 4. Quantitative detection of Cu2+, Cd2+, and Pb2+ ions by the electrochemical sensor in the range of 0.1~100 µM, and linear fitting of the stripping peak currents, as well as interference testing of ions. (AC) Cu2+, (DF) Cd2+, and (GI) Pb2+.
Chemosensors 14 00040 g004
Figure 5. Detection of a mixture of four kinds of heavy metal ions (Cu2+, Cd2+, Pb2+, and Hg2+) spiked in KCl supporting electrolyte. (A) SWASV signals of the samples containing Cu2+, Pb2+, Cd2+, and Hg2+ of different concentrations in the range of 0.1~100 µM and (B) linear fitting of the peaking current.
Chemosensors 14 00040 g005
Table 1. Recovery ratio of heavy metal ions spiked in artificial seawater.
GroupSpiked (μM)Detected (μM)Recovery Rate (%)
BlankCd2+ = 0, Pb2+ = 0,
Cu2+ = 0, Hg2+ = 0
Cd2+ = 0, Pb2+ = 0.12 ± 0.05
Cu2+ = 0, Hg2+ = 0.35 ± 0.08
None
1Cd2+ = 5, Pb2+ = 5
Cu2+ = 5, Hg2+ = 5
Cd2+ = 4.65 ± 0.32, Pb2+ = 4.87 ± 0.25
Cu2+ = 4.78 ± 0.18, Hg2+ = 4.96 ± 0.45
93.33
95.25
95.62
92.27
2Cd2+ = 10, Pb2+ = 10,
Cu2+ = 10, Hg2+ = 10
Cd2+ = 9.87 ± 0.63, Pb2+ = 10.1 ± 0.54
Cu2+ = 9.87 ± 0.65, Hg2+ = 10.2 ± 0.88
98.73
99.12
98.23
98.43
3Cd2+ = 20, Pb2+ = 20,
Cu2+ = 20, Hg2+ = 20
Cd2+ = 18.8 ± 1.32, Pb2+ = 21.2 ± 1.15
Cu2+ = 20.8 ± 1.23, Hg2+ = 21.8 ± 1.96
93.42
106.24
104.35
107.25
Table 2. Detection of heavy metal ions in real seawater samples.
Water SampleBlank (μM)Spiked (μM)Detected (μM)Recovery Rate (%)
DalianCd2+ = 0
Pb2+ = 0.96 ± 0.12
Cu2+ = 0
Hg2+ = 0.65 ± 0.13
Cd2+ = 10
Pb2+ = 10
Cu2+ = 10
Hg2+ = 10
Cd2+ = 9.76 ± 0.65
Pb2+ = 10.22 ± 0.54
Cu2+ = 10.36 ± 0.56
Hg2+ = 10.91 ± 0.89
97.63
98.13
92.64
102.62
MaomingCd2+ = 0
Pb2+ = 0
Cu2+ = 0
Hg2+ = 0.53 ± 0.19
Cd2+ = 10
Pb2+ = 10
Cu2+ = 10
Hg2+ = 10
Cd2+ = 10.12 ± 0.35
Pb2+ = 9.59 ± 0.24
Cu2+ = 9.86 ± 0.36
Hg2+ = 10.74 ± 0.75
101.25
95.95
98.67
102.15
ZhanjiangCd2+ = 0
Pb2+ = 0
Cu2+ = 0
Hg2+ = 0.57 ± 0.11
Cd2+ = 10
Pb2+ = 10
Cu2+ = 10
Hg2+ = 10
Cd2+ = 9.32 ± 0.34
Pb2+ = 9.87 ± 0.62
Cu2+ = 9.75 ± 0.23
Hg2+ = 106.6 ± 0.55
93.22
98.74
97.53
100.93
Disclaimer/Publisher’s Note: The statements, opinions and data contained in all publications are solely those of the individual author(s) and contributor(s) and not of MDPI and/or the editor(s). MDPI and/or the editor(s) disclaim responsibility for any injury to people or property resulting from any ideas, methods, instructions or products referred to in the content.