Article

High-Performance Cataluminescence Sensor Based on UIO-66/HKUST-1 Composite for Rapid Detection of Dichloromethane


1
Anhui Institute of Strategic Study on Carbon Dioxide Emissions Peak and Carbon Neutrality in Urban-Rural Development, College of Environment and Energy Engineering, Anhui Jianzhu University, Hefei 230601, China
2
Environmental Materials and Pollution Control Laboratory, Hefei Institute of Physical Science, Chinese Academy of Sciences, Hefei 230031, China
3
College of Mathematics and Physics, Anhui Jianzhu University, Hefei 230601, China
*
Authors to whom correspondence should be addressed.
Chemosensors 2026, 14(3), 58; https://doi.org/10.3390/chemosensors14030058
Submission received: 27 January 2026 / Revised: 17 February 2026 / Accepted: 26 February 2026 / Published: 3 March 2026
(This article belongs to the Special Issue Advancements of Chemosensors and Biosensors in China—3rd Edition)

Abstract

Dichloromethane, as a widely used highly volatile industrial solvent, has neurotoxicity and hepatotoxicity and is suspected of being a carcinogen to humans. Therefore, it is necessary to develop a detection method that is more convenient for users, responds faster and is more efficient than traditional analytical techniques. In cataluminescence (CTL) technology, as a promising alternative, the performance of CTL sensors critically depends on the design of high-performance sensitive materials. In this study, by rationally designing two typical metal–organic frameworks (MOFs), UIO-66 (zirconium-based) and HKUST-1 (copper-based), UIO-66/HKUST-1 nanocomposites for dichloromethane CTL detection were prepared by using a simple hydrothermal method. The experimental results show that when the composition ratio of UIO-66 is 2%, this composite exhibits the strongest CTL response to dichloromethane. Under optimized conditions, this sensor exhibits high selectivity, excellent stability (RSD = 3.98%), and a rapid response advantage for dichloromethane. The response time and recovery time are 5 and 19 s, respectively. It shows a good linear relationship within the concentration range of 8.4–84 ppm, along with a detection limit as low as 1.71 ppm. Analysis indicates that the enhanced performance stems from the formation of high-concentration oxygen vacancies and significantly strengthened synergistic effects at the UIO-66/HKUST-1 composite. This increases the concentration of surface reactive oxygen species, thereby providing more active sites for catalytic reactions. This work provides a robust and efficient sensing strategy for dichloromethane detection.

1. Introduction

Depending on the acceleration of global industrialization and urbanization, environmental pollution has become a serious global challenge. VOCs are chemical substances with wide sources and significant hazards to both health and the environment [1,2]. Among them, dichloromethane is often used as a solvent in industrial production such as chemical synthesis, paint dilution, and extraction separation. Due to its high toxicity, strong volatility, and potential threat to human liver and kidney functions and the nervous system through bioaccumulation effects, it has received widespread attention [3]. The detection of dichloromethane is challenging. On the one hand, its volatile nature makes it prone to loss during sampling and pretreatment, affecting the accuracy of detection. On the other hand, coexisting substances in different detection matrices (such as other complex organic compounds in industrial wastewater) can interfere with or even mask the detection signal, further increasing the difficulty. Facing increasingly strict environmental protection standards and the public’s higher expectations for health, developing rapid, accurate and efficient volatile organic compounds (VOCs) detection technologies is highly required.
At present, the detection of VOCs primarily relies on techniques such as gas chromatography–mass spectrometry (GC–MS) [4] and high-performance liquid chromatography (HPLC) [5]. Although these methods are highly accurate and reliable, their inherent limitations, such as expensive equipment, high cost and difficulty in achieving on-site rapid detection [6], seriously restrict their application in real-time monitoring and large-scale screening. Therefore, the development of new detection technologies that are easy to operate, respond quickly and are low-cost holds significant scientific research value and practical application potential.
CTL is a sensing technology based on gas–solid interface catalytic reactions. Its core principle is as follows: when target gas molecules undergo catalytic oxidation/cracking reactions on the surface of a sensitive material, they form high-energy excited-state intermediates. These intermediates release characteristic light radiation during their transition back to the ground state. By detecting this light signal, the target gas can be analyzed [7]. Compared with traditional detection technologies such as GC–MS, the CTL detection method does not require complex sample pretreatment processes (such as the extraction and concentration steps of GC–MS). The volume of the detection equipment is only equivalent to that of a small desktop computer case, which has the advantage of portability. In addition, this technology has a simple process, does not require an external light source, and can achieve real-time sampling and detection through a portable air pump. It has the advantages of fast response speed, high sensitivity, and support for continuous multi-point screening, and is suitable for rapid on-site screening and real-time monitoring scenarios [8,9]. In 2002, Zhang’s team [10] first introduced nano-sized catalytic materials into CTL sensing systems and applied them to organic gas detection. This significant breakthrough has paved the way for a new avenue in the advancement of CTL sensors. By regulating the morphology, composition and electronic structure of nano-catalytic materials, researchers have developed a variety of high-performance CTL sensors targeting VOCs. Regarding sensitive materials, as the core elements determining the selectivity, sensitivity and stability of CTL sensors, their reasonable design and performance optimization have become the key to promoting the development of this technology [11,12].
In recent years, MOF materials have been considered as a research hotspot for CTL-sensitive materials due to their tunable chemical composition [13] and abundant active sites [14], driving significant improvements in CTL sensor performance. By efficiently adsorbing and specifically recognizing target molecules, MOFs effectively overcome the selectivity limitations of traditional metal oxide semiconductors (MOSs). Li et al. [15] synthesized a highly catalytic Ce(IV)-MOF-based sensing material. Under optimized conditions, this CTL sensor accurately detected H2S within a range of 1.04 to 21.0 μg/mL, demonstrating the targeted recognition capability of MOFs for specific gases. Zhu et al. [16] prepared Y2O3 nanoparticles using MOFs as precursors, developing an acetone CTL sensor with a response time reduced to 3 s, demonstrating the rapid response advantage of MOF-derived materials. Shi et al. [17] designed a LaCO3OH MOF microsphere-based CTL sensor that achieves discrimination detection of multiple VOCs through pattern recognition, expanding the application scenarios of MOF-based CTL sensors. However, existing single MOF-based CTL sensors still face significant limitations: certain MOFs exhibit insufficient catalytic activity, resulting in limited response intensity; others suffer from poor structural stability, affecting long-term performance; and single active sites struggle to balance high selectivity with high sensitivity, thereby restricting their application in target gas detection [18].
Huang et al. [19] employed the chemically and thermally stable UIO-66 adsorbent as a pre-enrichment component, coupled with a CTL sensor. Acetone molecules preferentially adsorbed onto the Zr clusters within UIO-66, enhancing the CTL signal by 25-fold. Xue et al. [20] prepared HKUST-1 through coordination reactions and explored the intrinsic mechanism by which the defects of HKUST-1 enhance the catalytic performance of CO through spatial and electronic effects. Li et al. [21] synthesized two-dimensional-to-three-dimensional metal–organic framework composites via surface modification. Benefiting from the synergistic effects of the two MOF components, this composite exhibited outstanding activity and stability during the photocatalytic reduction in nitroaromatics to aniline. The synergistic effects of metal–organic framework materials offer novel insights into enhancing the selectivity of CTL reactions. UIO-66 possesses a stable zirconium-based framework structure with outstanding chemical stability, capable of supporting the HKUST-1 structure to inhibit its agglomeration and collapse. Moreover, the abundant Cu2+ active sites on the HKUST-1 surface compensate for UIO-66’s catalytic performance limitations, enhancing the adsorption and activation of target gases. The two materials complement each other structurally and functionally. Theoretically, the composite formed by them can achieve synergistic optimization across structural stability, adsorption capacity, and catalytic activity.
In this study, a novel CTL sensor based on UIO-66/HKUST-1 nanocomposites has been developed for the detection of dichloromethane. The basic properties of the material, such as its microstructure and chemical composition, are systematically characterized. The influence of key parameters such as working temperature and carrier gas flow rate on the CTL response signal was mainly discussed. Under the optimal experimental conditions, the detection limit and selectivity of the sensor for dichloromethane were evaluated, and its catalytic reaction mechanism was explored. In addition, this approach would provide a potential strategy for rapid on-site detection of dichloromethane.

2. Materials and Methods

2.1. Chemicals

Copper(III) nitrate hydrate (Cu(NO3)3·3H2O, 99.5%), trimesic acid (H3BTC, 98.0%), terephthalic acid (H2BTC, 99.0%), and zirconium tetrachloride (ZrCl4, 98.0%) were procured from Shanghai Yien Chemical Technology Co., Ltd. (Shanghai, China). Dichloromethane (CH2Cl2, 99.5%) and hydrochloric acid (HCl, Assay: 36–38%) were obtained from Shanghai Macklin Biochemical Technology Co., Ltd. (Shanghai, China). N,N-Dimethylformamide (C3H7NO, 99.5%) and absolute ethanol (CH3CH2OH, 99.7%) were supplied by Sinopharm Chemical Reagent Co., Ltd. (Shanghai, China).

2.2. Preparation of Adsorbent

UIO-66/HKUST-1 was synthesized by a simple hydrothermal method. In the first step, zirconium tetrachloride (ZrCl4, 750 mg) and terephthalic acid (738 mg) were fully dissolved in N,N-dimethylformamide (DMF, 80 mL) under magnetic stirring. Concentrated hydrochloric acid (6 mL) was then added dropwise to the homogeneous solution. The resulting mixture was transferred into a Teflon-lined autoclave, which was sealed and maintained at 100 °C for 12 h. After the reaction system was cooled down to room temperature naturally, the precipitated product was collected by centrifugation, followed by repeated washing with DMF and ethanol. The obtained powder was dried in a vacuum oven at 60 °C for 12 h.
Step Two: 1,3,5-Benzenetricarboxylic acid (H3BTC, 4 mmol) and copper(II) nitrate hydrate (Cu(NO3)2·3H2O, 8 mmol) were separately dissolved in ethanol (40 mL) and deionized water (40 mL) to form two homogeneous solutions. Under continuous stirring, the two solutions were mixed, and 0.04 mmol of UIO-66 was added during the mixing process. The resultant suspension was transferred into a 100 mL Teflon-lined autoclave, which was heated to 120 °C and held for 24 h. After the hydrothermal reaction, the product was centrifuged and sequentially washed with deionized water and ethanol several times to eliminate impurities. Finally, the collected powder was dried overnight in a vacuum oven at 60 °C, and the resulting composite was denoted as 2% UIO-66/HKUST-1 (the molar ratio of UIO-66 relative to HKUST-1 was 2%).
Using the same hydrothermal synthesis method, 1% UIO-66/HKUST-1 and 3% UIO-66/HKUST-1 composites were prepared by adjusting the amount of UIO-66 added. For comparison, a sample prepared without adding UIO-66 was denoted as pure HKUST-1.
The yield (%) of the synthesized material was calculated according to the equation: Yield (%) = (mass of actual dry product/mass of theoretical product) × 100%. The specific yields are as follows: pure UIO-66: 80.2%; pure HKUST-1: 83.6%; 1% UIO-66/HKUST-1 composite: 78.4%; 2% UIO-66/HKUST-1 composite: 79.7%; 3% UIO-66/HKUST-1 composite: 75.9%.

2.3. Experimental Instruments

The UIO-66/HKUST-1 nanocomposite was thoroughly investigated using a suite of analytical techniques. Its surface morphology and structure were examined by field emission scanning electron microscopy (SEM, AURIGA, ZEISS, Jena, Germany) complemented by energy dispersive spectrometer (EDS) for elemental analysis. The crystalline structure was determined by X-ray diffraction (XRD, Panalytical, Almelo, The Netherlands) with a Cu Kα source. X-ray photoelectron spectroscopy (XPS, Thermo Fisher K-alpha, Waltham, MA, USA) with a monochromatic Al Kα source was employed to analyze the surface composition and chemical states. Fourier Transform Infrared Spectroscopy (FT-IR) was conducted using the Nexus-870 spectrometer (Thermo Nicolet, Waltham, MA, USA), with the transmission mode employed for spectral acquisition and recording. At the same time, the ultraviolet–visible diffuse reflectance spectra were recorded using the UV-3600i spectrophotometer (Shimadzu, Kyoto, Japan).

2.4. CTL Sensing Measurements

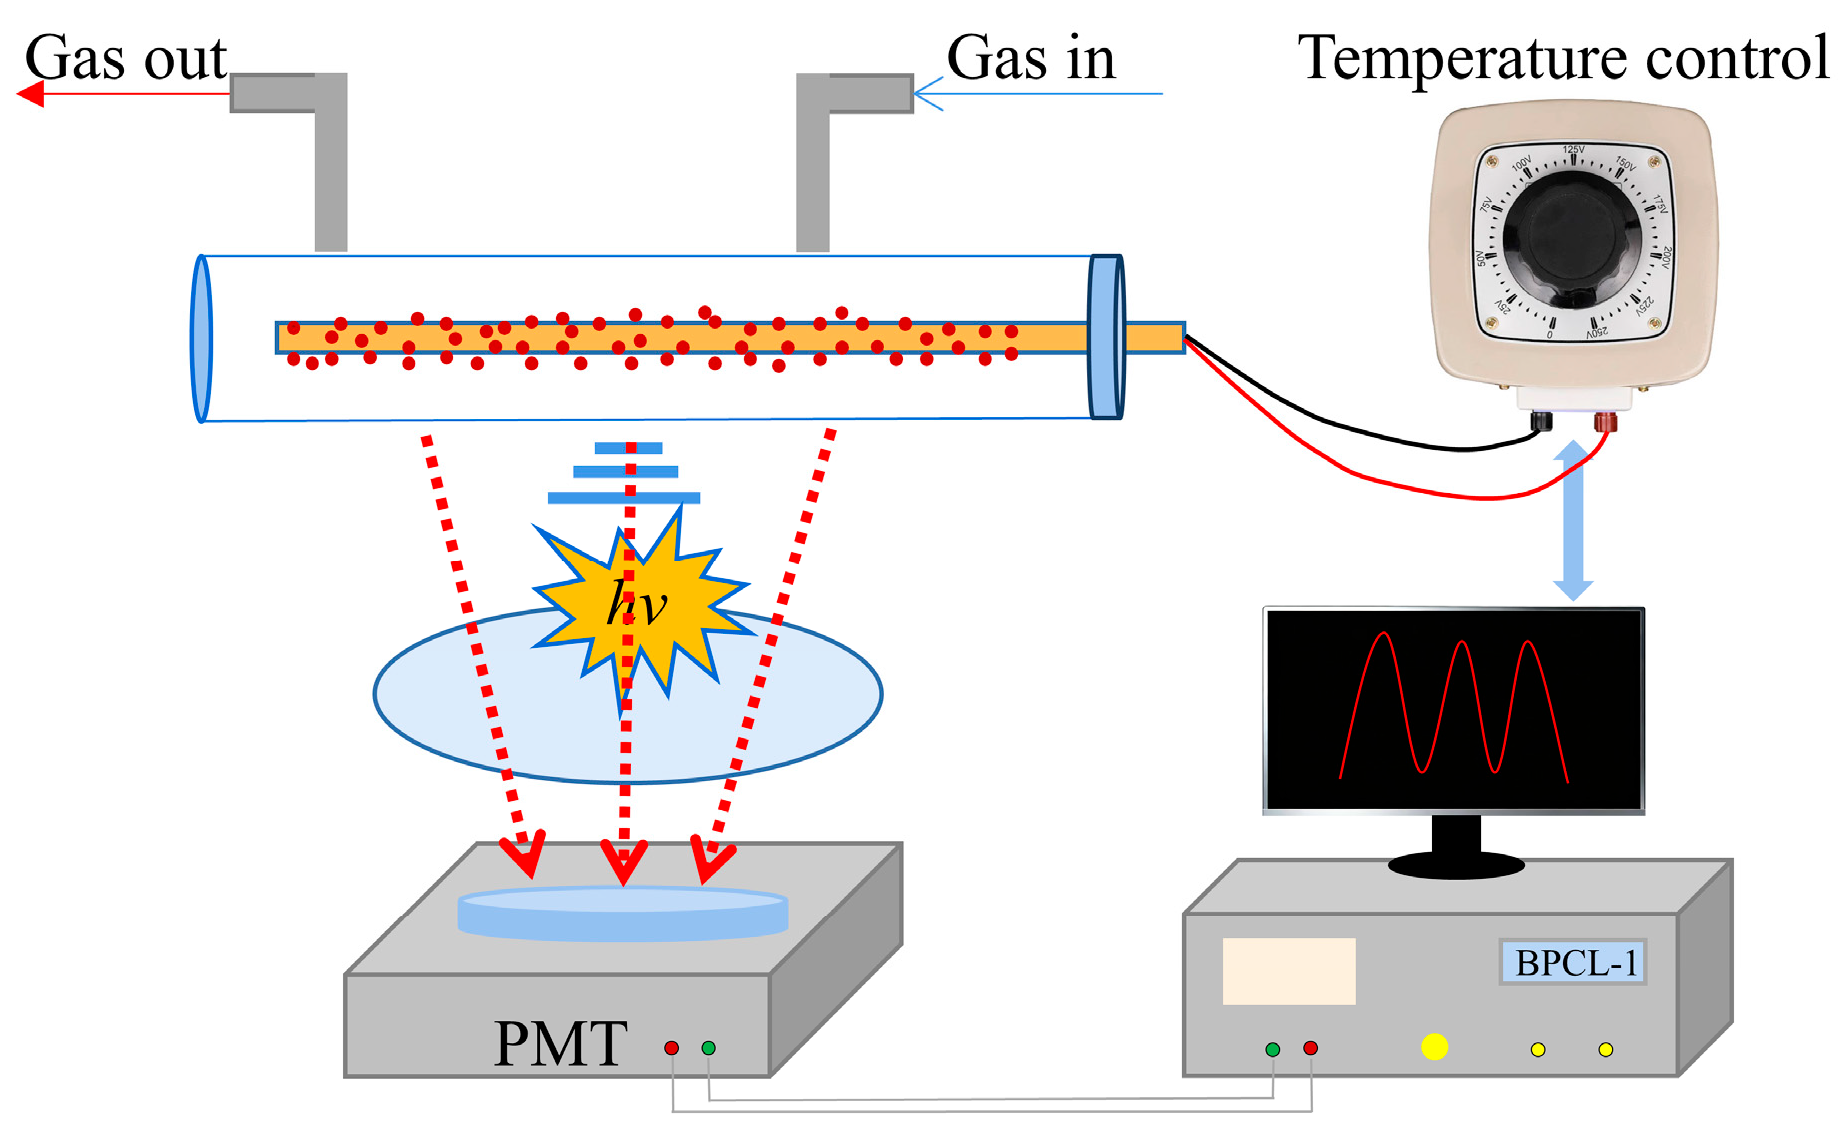
During the experiment, as shown in Figure 1, 20 mg of the sensitive material powder was first weighed and then added to 0.5 mL of anhydrous ethanol. After ultrasonic dispersion for 15 min, it was vortexed for 5 min to form a uniform slurry. The quantitative slurry drop coating method was adopted. The slurry was evenly coated on the front surface of the ceramic rod with a pipette (the coating area was 6.0 cm in length and 0.5 cm in diameter). After coating, the ceramic rod was placed under an infrared lamp at 40–50 °C for slowly drying for 2 h, and then transferred to a vacuum oven at 60 °C for curing for 1 h. Finally, a structurally stable coating was obtained. After drying and curing, use a balance to weigh the total mass of the coated ceramic rods to calculate the actual dry weight of the coating, ensuring that the mass of dry matter coated in each experiment is 10 mg. By directly controlling the dry weight of the coating, the thickness of the coating can be controlled. Subsequently, the ceramic heating rod is assembled into the quartz tube. By regulating the temperature system (local heating of the sensitive material coating on the surface of the ceramic heating rod) and the air pump, the vapor of the analyte is introduced into the reaction chamber, and the ambient temperature and gas flow rate are precisely adjusted. Ultimately, the generated CTL optical signal () was detected by the BPCL (Biochemical Photon Counter Luminometer), with a detection wavelength range of 300–650 nm, covering the characteristic luminescence wavelength of CTL corresponding to dichloromethane in this study. The instrument converts the signal into quantifiable numerical data for subsequent analysis and processing.
The BPCL instrument recorded the dynamic curve of the CTL signal over time, and the baseline signal was set as the average signal value 30 s before the introduction of the target gas. After the analyte is introduced, the time it takes for the CTL signal to rise from the baseline to the peak is taken as the response time (τres), and the time required to drop from the peak to a stable baseline level is taken as the recovery time (τrec) [22]. Each sample was tested three times, and the error line was the standard deviation of the three parallel experiments (n = 3).
In the experiment, the signal-to-noise ratio (S/N) is defined as the ratio of the CTL signal (S) of the target gas to the baseline noise (N). Among them, S is the response value of the CTL signal after the target gas is introduced minus the base value, and N is the standard deviation of the signal fluctuation continuously recorded by the instrument for 30 s under the same test conditions (consistent temperature and flow rate) when no reaction gas is introduced and pure air is used.
The corresponding gas concentration is then calculated according to the following formula (Equation (1)) [23].
C = V i × p 0 V c × p a
Herein, C, Vi, Vc, P0 and Pa denote the concentration of the target gas, the volume of the injected gas, the volume of the chamber, the equilibrium vapor pressure at room temperature, and the standard atmospheric pressure, respectively.

3. Results and Discussion

3.1. Analysis of Material Characterization

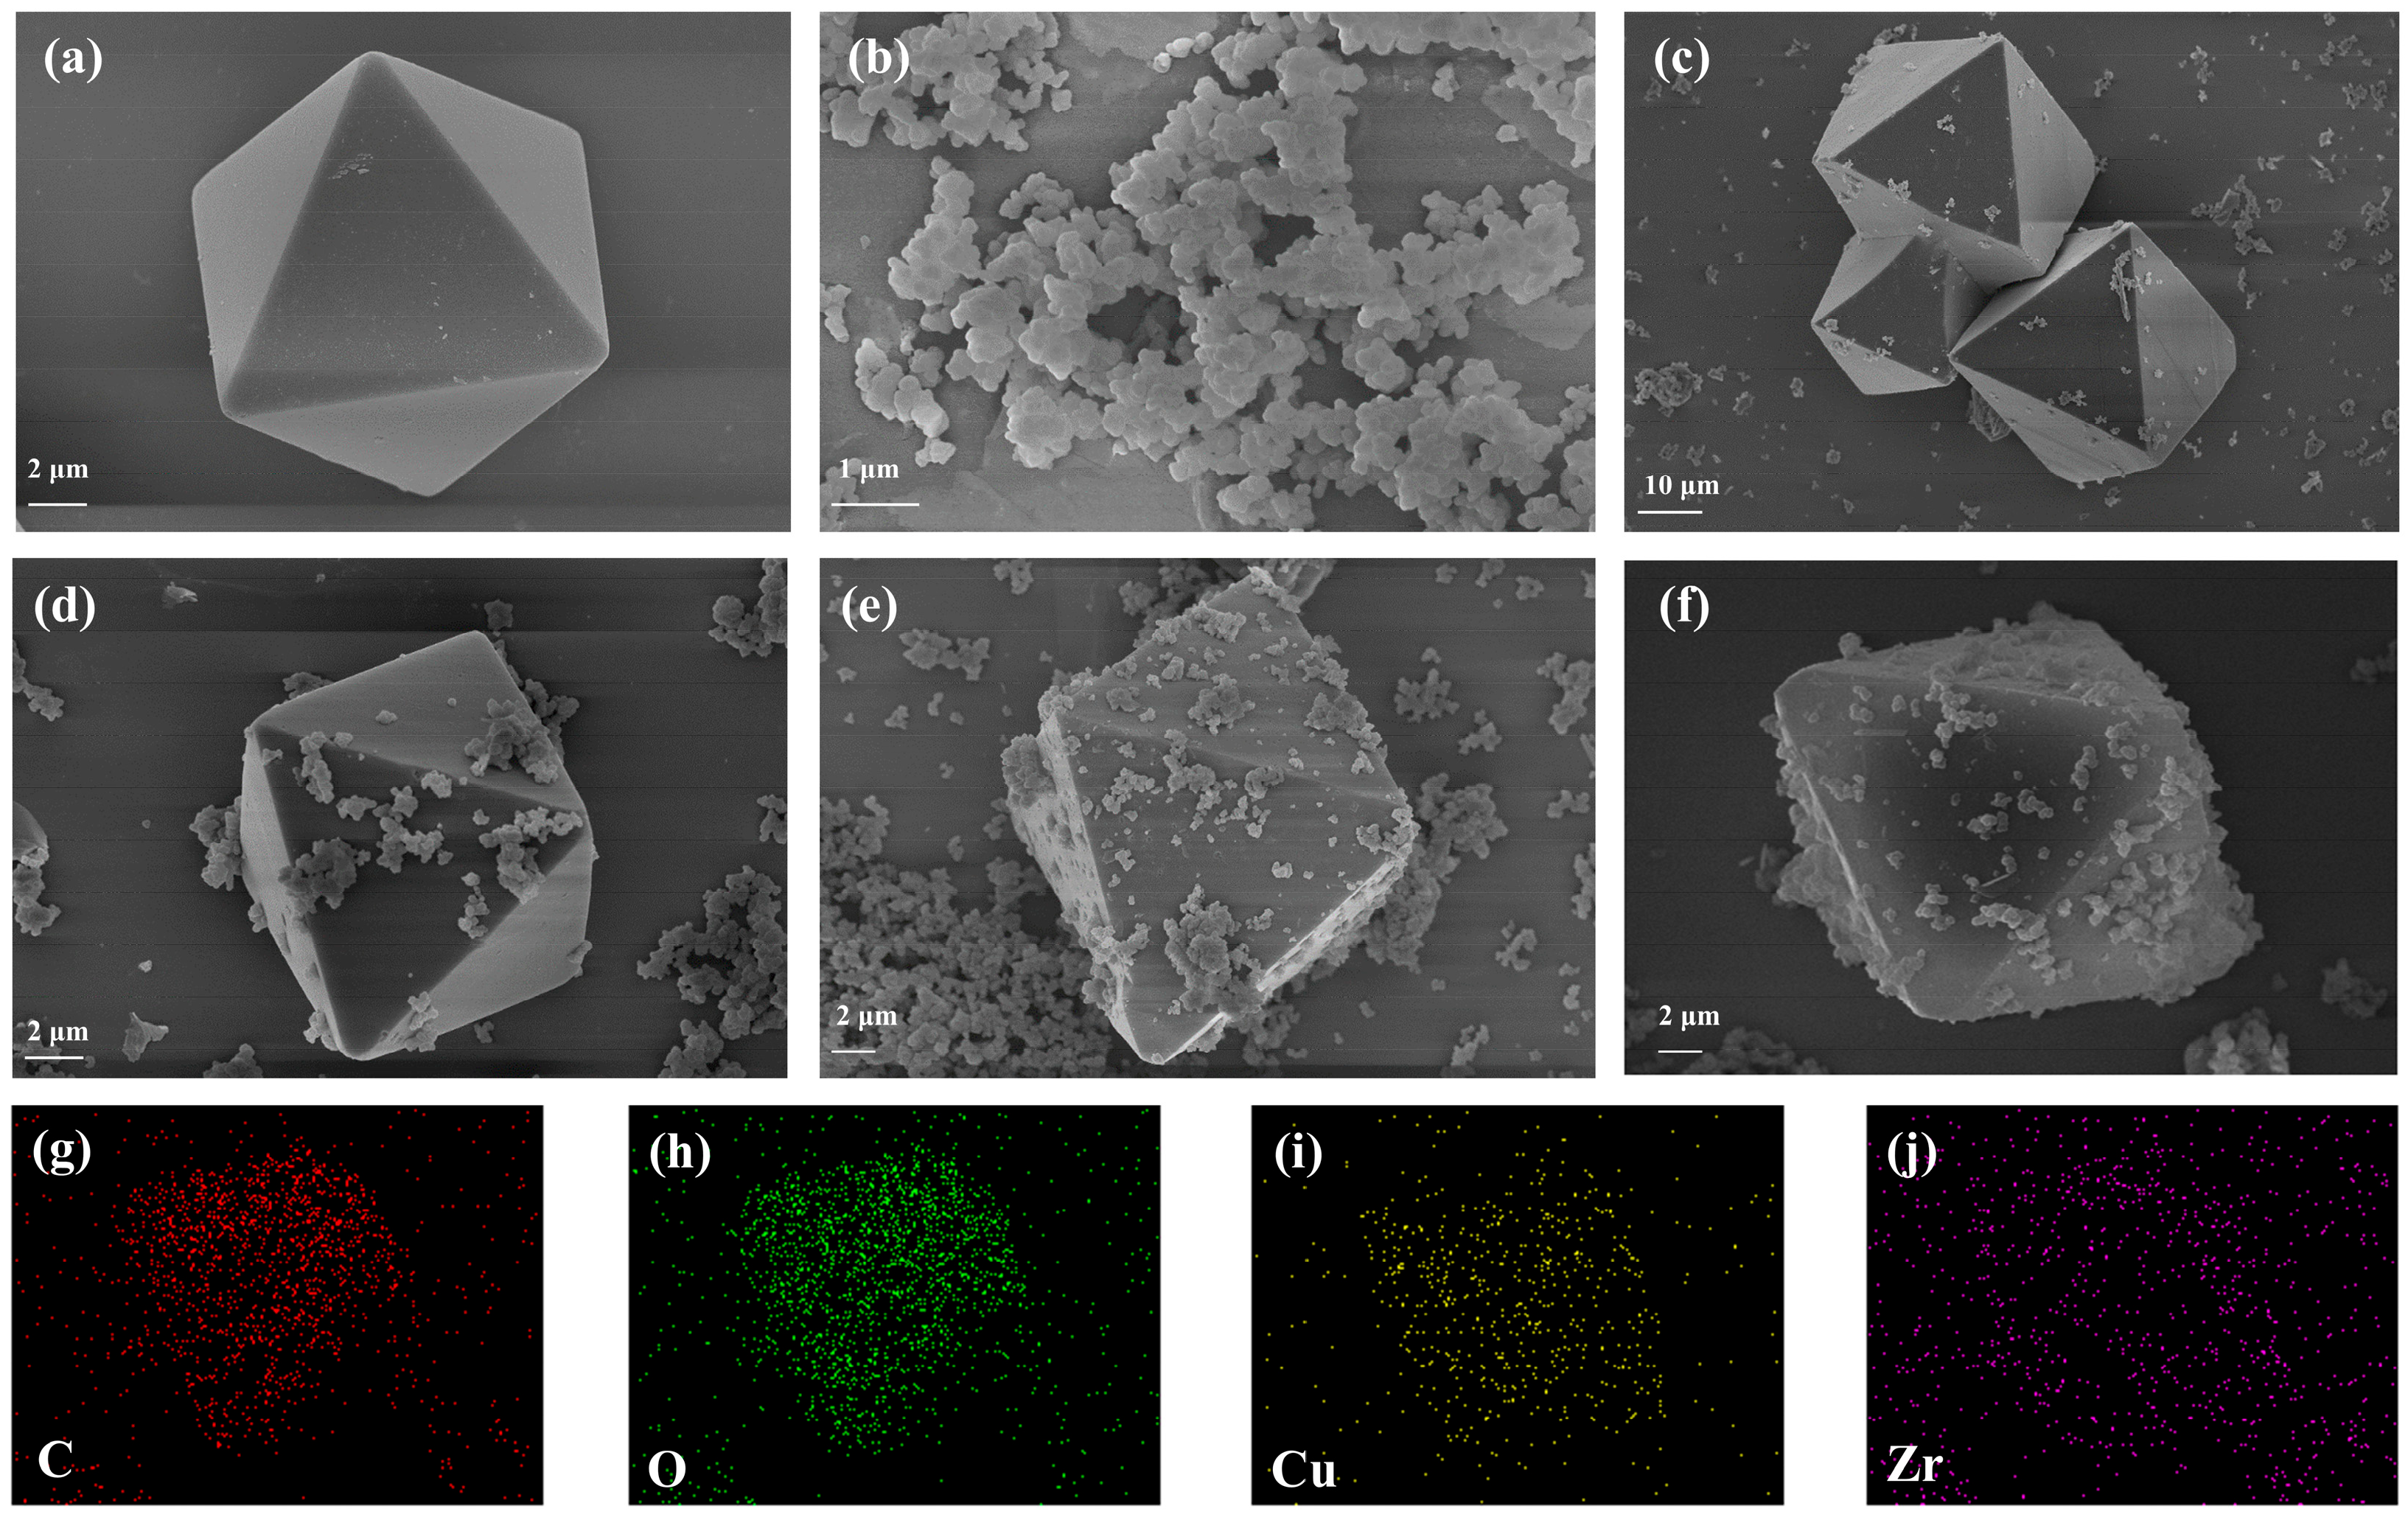
The morphology of the composite was investigated using SEM. Figure 2a–e shows the SEM images of UIO-66/HKUST-1 at different scales. As shown in Figure 2a, HKUST-1 presents a typical octahedral structure with regular geometric morphology and a flat and smooth surface. In contrast, UIO-66 (Figure 2b) is entirely composed of agglomerated spherical particles, which interweave with each other to form a dense three-dimensional network. As shown in Figure 2c, the octahedral skeleton of HKUST-1 remains basically intact under the condition of a lower composite ratio (1%), and only a small amount of UIO-66 adhesion is observed on its surface. It can be observed in Figure 2d that when the proportion of UIO-66 increases to 2%, a significant number of nanospheres aggregate on the surface of HKUST-1, forming a dense nanosphere–octahedral composite structure. It indicates that the UIO-66 particles grow closely on the surface of the HKUST-1 crystal. In Figure 2e, the octahedral appearance of HKUST-1 was still basically maintained after further increasing the composite ratio of UIO-66 to 3%, but its surface was covered with a large amount of UIO-66.
The mapping images clearly show the spatial distribution of elements C, O, Cu and Zr (Figure 2f). It is worth noting that the Zr element (the characteristic element of UIO-66) is mainly enriched on the surface of octahedral particles, indicating that UIO-66 nanoparticles are mainly attached to HKUST-1 crystals. The coexistence and overlap of C, O, Cu and Zr signals jointly prove that UIO-66 is in close contact with the HKUST-1 octahedron.
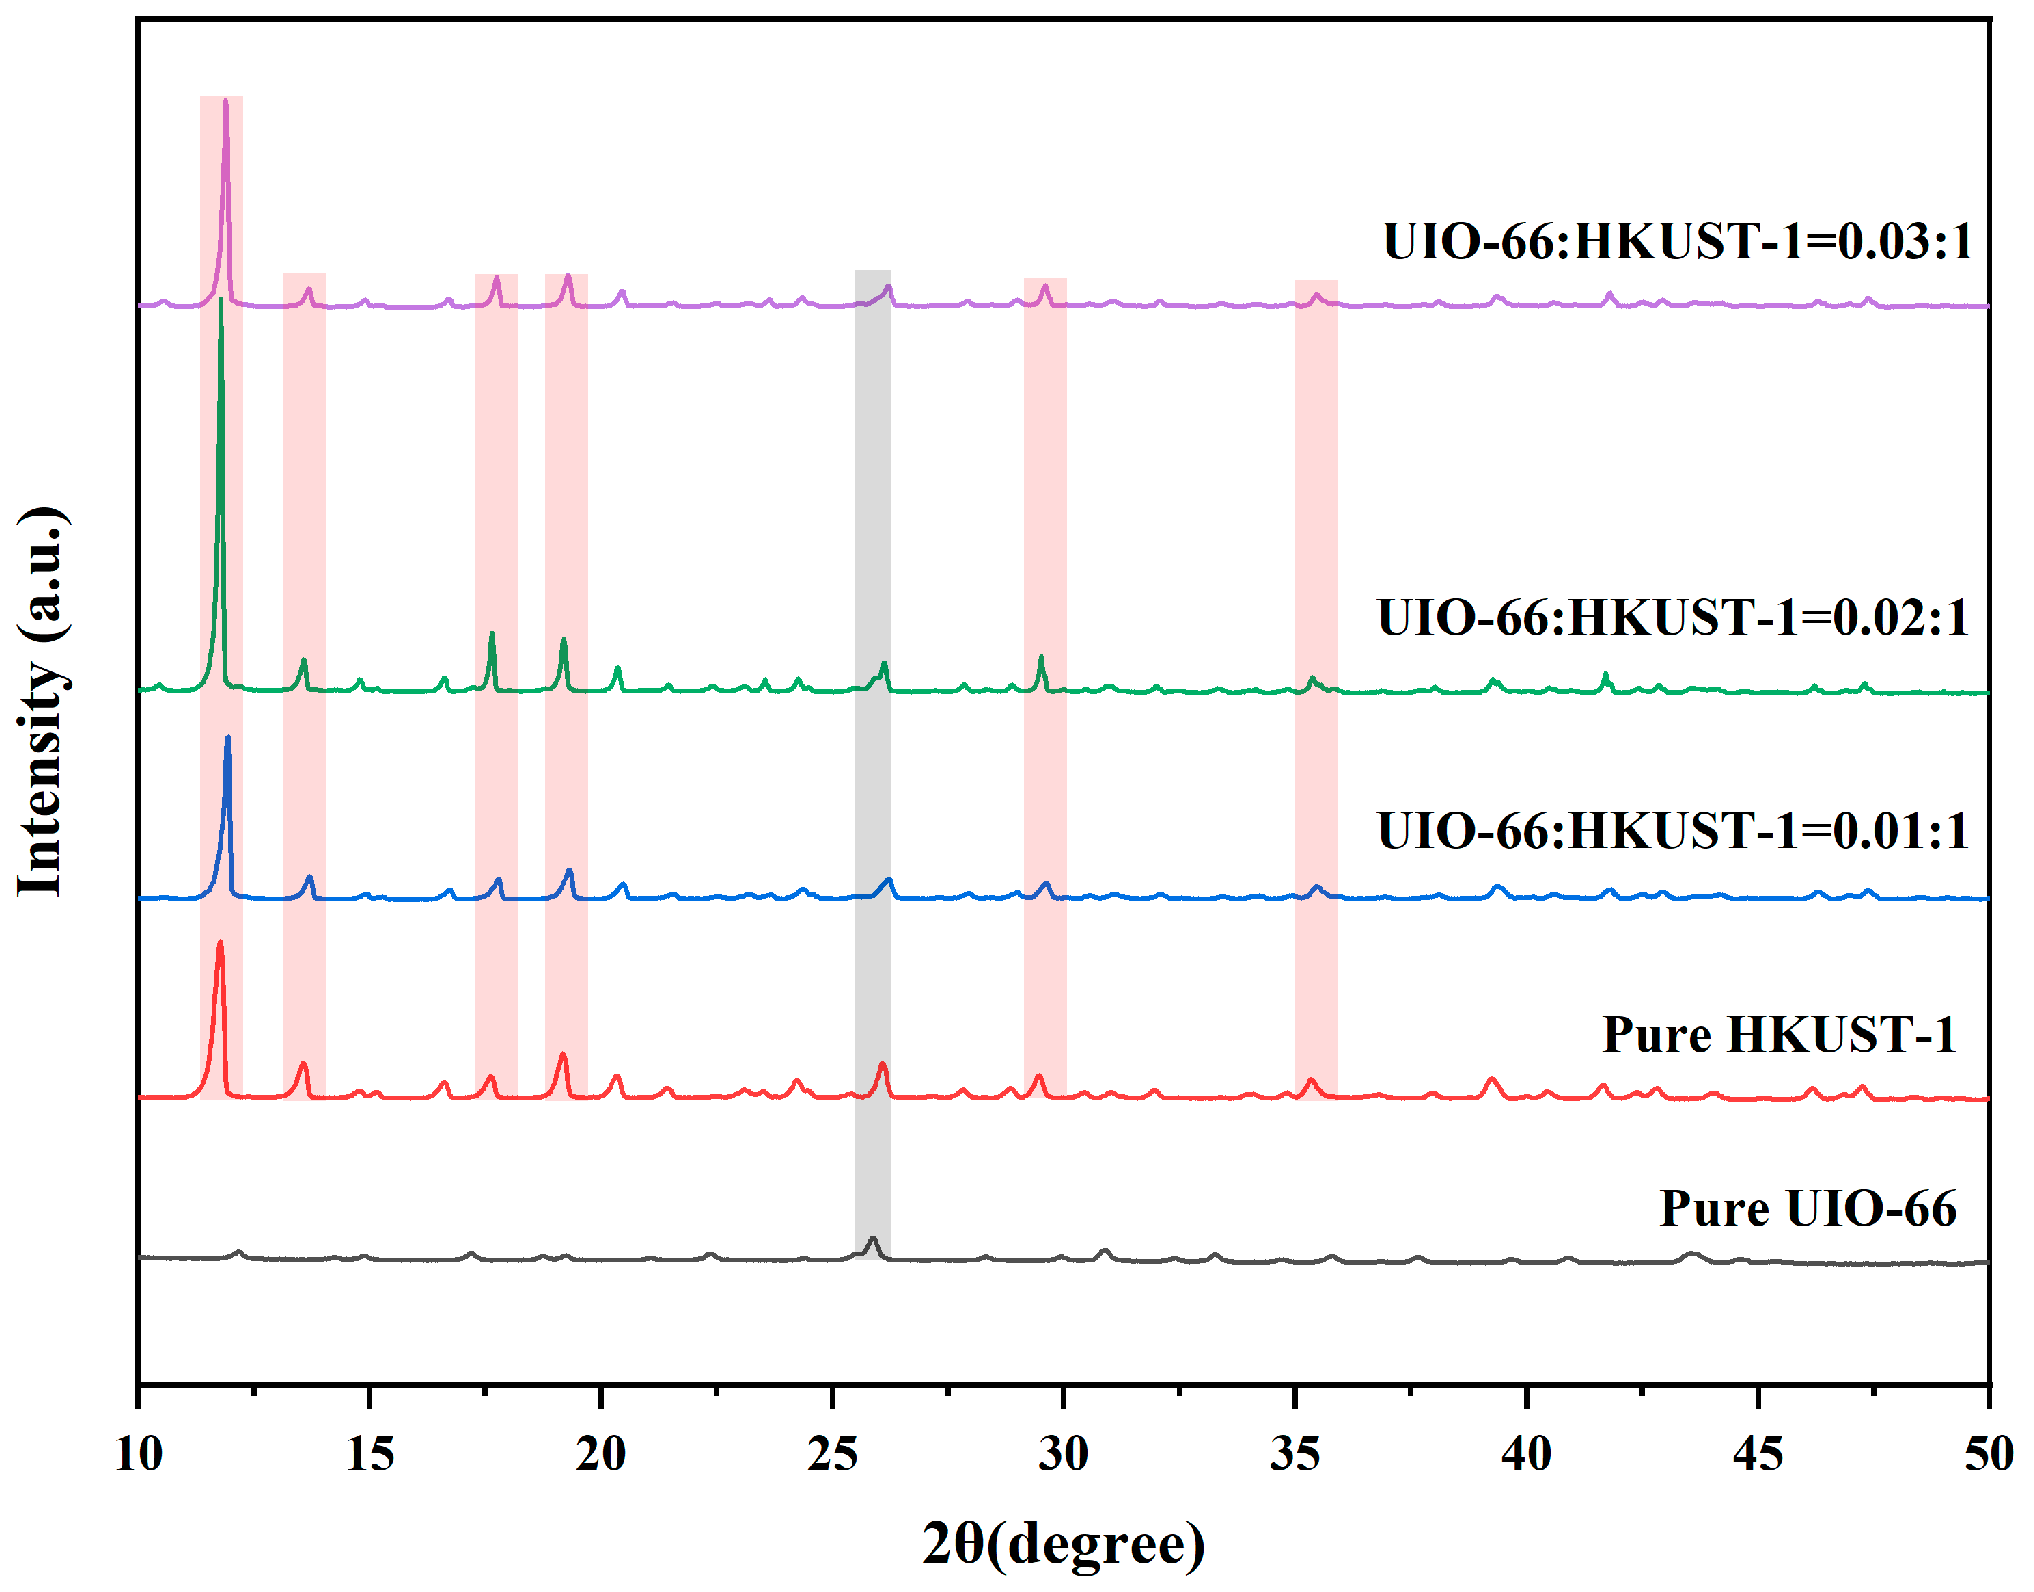
The crystal structure of the synthesized composite was determined by X-ray diffraction analysis. As shown in Figure 3, the XRD patterns of the five samples are presented. The diffraction peaks of the complex UIO-66/HKUST-1 at 2θ = 11.6°, 13.4°, 17.5°, 19.1°, 29.4° and 35.2° are consistent with the crystal planes of (222), (400), (333), (440), (751) and (733) of HKUST-1 [24]. The diffraction peaks located around 2θ = 26.0° are derived from the combination of the peaks of HKUST-1 at 2θ = 26.1° and UIO-66 at 2θ = 25.9°. The diffraction peak intensity of HKUST-1 in the composite is higher than that in the pure HKUST-1; this may be attributed to the UIO-66 enhancing the HKUST-1 particle agglomeration to form big ones, while the reduced half-width of the diffraction peak indicates increased particle size, and thereby the XRD peak intensity of HKUST-1displays higher for the composite [25]. Moreover, a slight shift in the peak of the composite indicates the presence of lattice distortion at the UIO-66/HKUST-1, arising from electronic interactions and charge transfer [26].
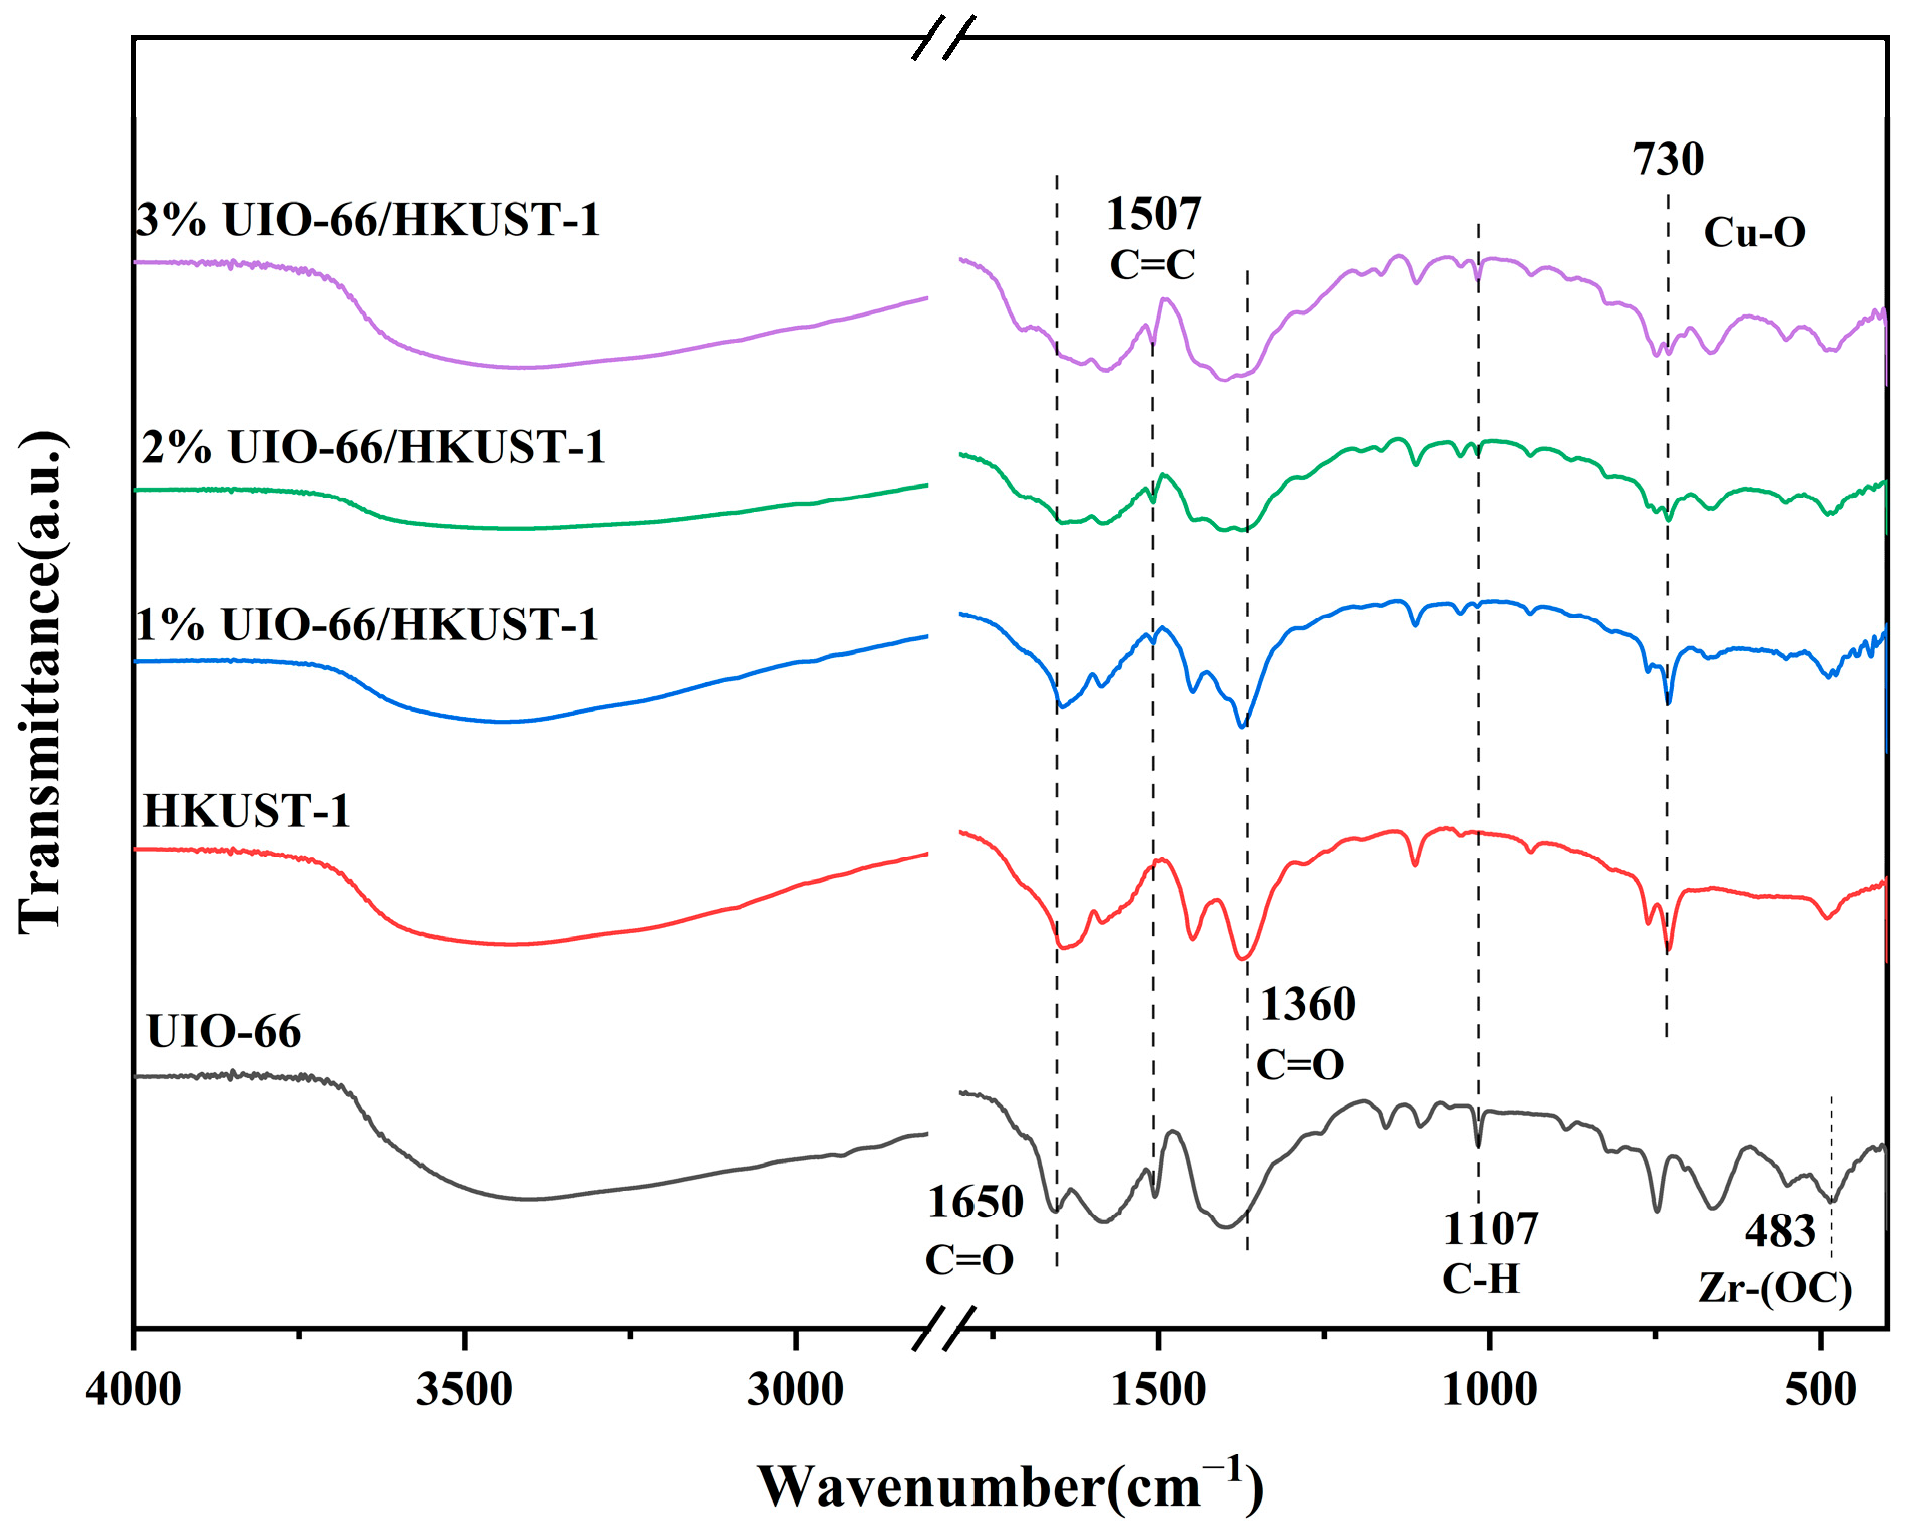
The functional groups presented in the synthesized composite were analyzed using Fourier Transform Infrared Spectroscopy (FT-IR). Figure 4 displays the FT-IR spectra of HKUST-1, UIO-66 and different ratios of UIO-66/HKUST-1. The absorption peaks at 730 cm−1 and 1650 cm−1 correspond to the Cu-O vibrational mode and C=O stretching vibration in HKUST-1, respectively, serving as characteristic signals for HKUST-1 [24]. The peak near 1507 cm−1 belongs to the skeletal stretching vibration of the C=C bond in aromatic compounds, corresponding to the characteristic vibration of the benzene ring in the organic ligand terephthalic acid [27]. The vibrational peak observed near 1107 cm−1 may be associated with the C-H bending vibration of terephthalic acid [28]. With increasing UIO-66 content, the relative intensities of the characteristic C=C peak near 1507 cm−1 and the C-H peak at 1107 cm−1 gradually increase, directly reflecting the corresponding rise in UIO-66 content within the composite material. Concurrently, the relative intensities of the peaks at 730 cm−1 (Cu-O vibration) and 1650 cm−1 (C=O stretching vibration) decrease. This might be attributed to the interaction between the ligand (terephthalic acid) of UIO-66 and the groups in HKUST-1 [29]. No significant peak shifts were observed for other functional groups, indicating that the two components in the composite achieve synergistic effects at the molecular level without undergoing destructive reactions.
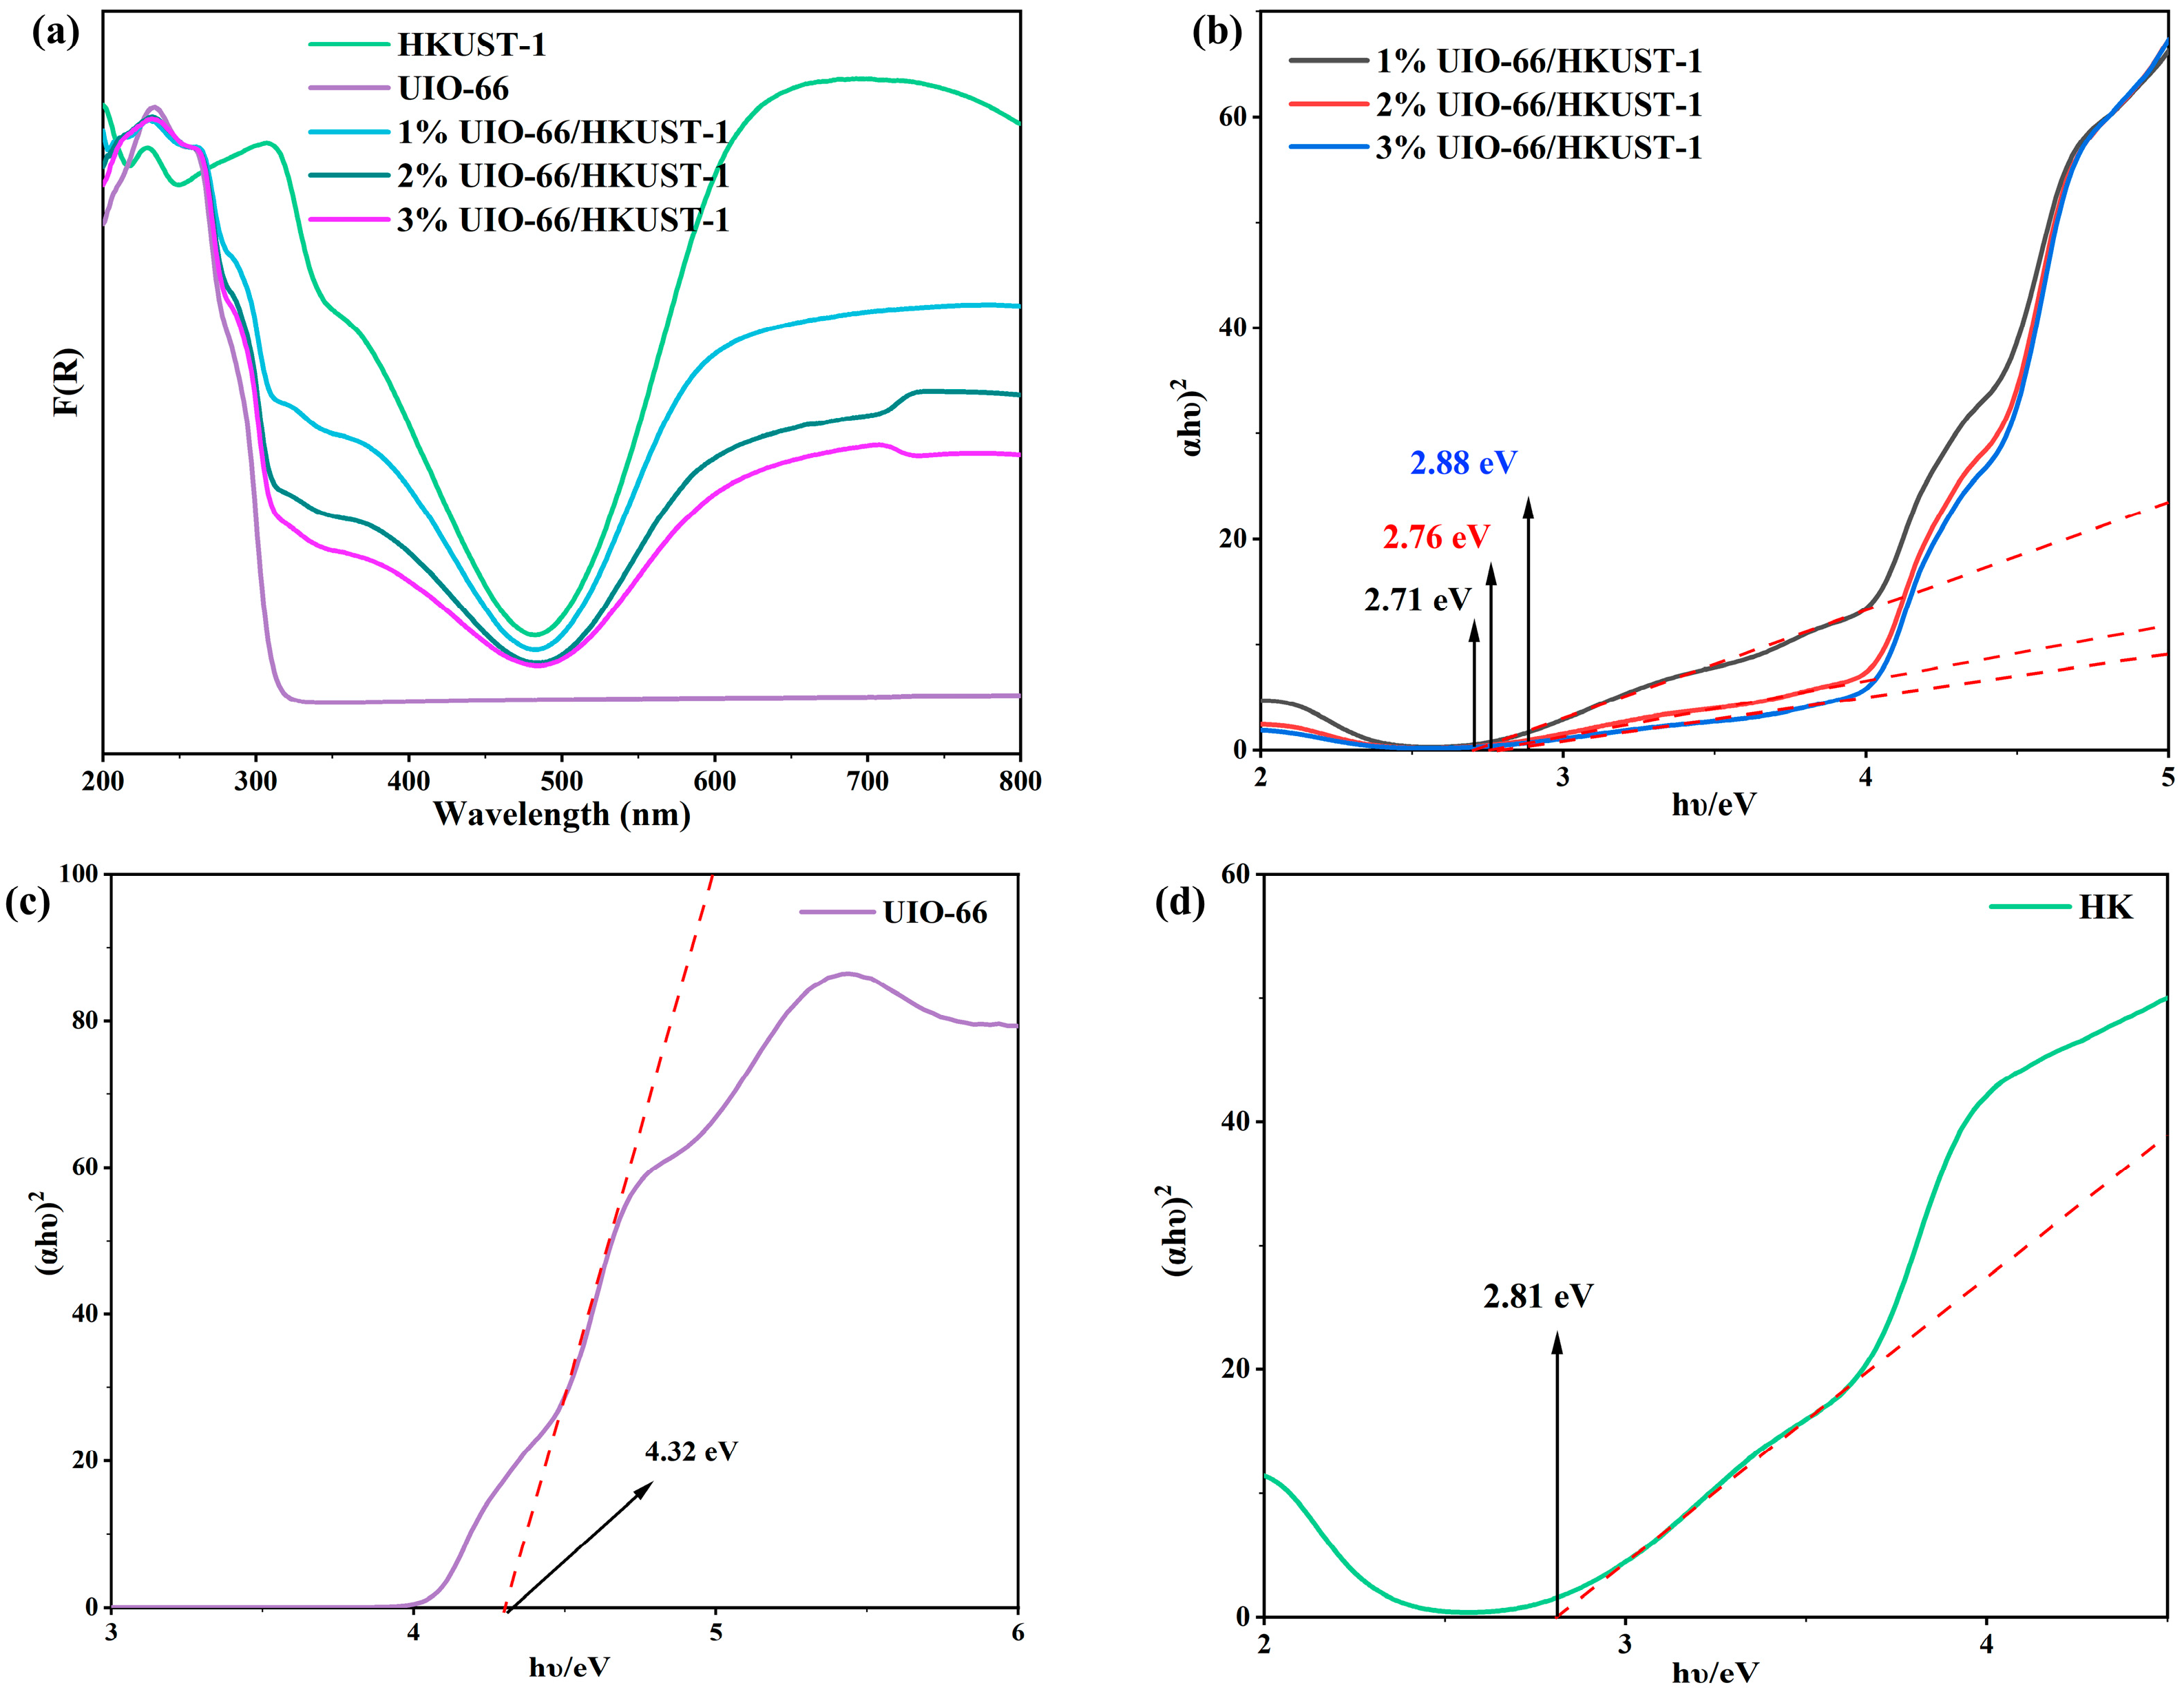
Figure 5a displays the ultraviolet–visible diffuse reflectance spectra (UV–Vis DRS) of HKUST-1, UIO-66, and their composite materials. Pure HKUST-1 exhibits absorption in the visible region (400–800 nm), with stronger absorption (higher extinction coefficient) in the 550–800 nm range and relatively weaker absorption in the 400–550 nm range. As the proportion of UIO-66 increases, the total absorption of the composite in the visible region (400–800 nm) gradually decreases, with the lowest absorption observed at 3% UIO-66/HKUST-1. The bandgap exhibits a trend of gradual reduction (as shown in Figure 5b). This phenomenon indicates that the introduction of UIO-66 effectively modulates the band structure of the UIO-66/HKUST-1 composite, thereby decreasing its bandgap. The decreased bandgap enhances the material’s ability to efficiently capture electrons from the conduction band via adsorbed oxygen molecules on its surface. This process increases the thickness of the electron depletion layer, ultimately improving the sensor’s response performance [30,31]. Notably, an appropriate amount of UIO-66 composite material not only modulates the band structure but also provides additional active sites, synergistically optimizing the material’s catalytic performance [32]. However, excessively high composite ratios lead to decreased structural stability and reduced crystallinity, ultimately degrading sensitivity performance [33,34]. As shown in Figure 5c,d, the diffuse reflectance was converted into relative values proportional to the absorption coefficient using the Kubelka–Munk function (Equation (2)) [35,36], followed by calculation of the semiconductor bandgap energy (Eg) via the Tauc plot equations (Equations (3) and (4)) [37]. HKUST-1 and UIO-66 serve as n-type semiconductor MOF materials [37,38] and have Eg values of 2.81 eV and 4.32 eV respectively. The narrow bandgap characteristic of HKUST-1 brings its conduction band bottom energy level closer to the Fermi level, significantly enhancing the mobility of conduction band electrons. This makes them more readily captured by surface-adsorbed oxygen and reduced into reactive oxygen species [39]. This enhances the response sensitivity and detection limit of CTL sensors. Meanwhile, the stable framework of UIO-66 maintains the structural integrity of this thick depletion layer within the composite system, further enhancing the stability and response persistence. The distinct bandgap characteristics between the two MOFs can effectively predict their performance in sensors.
F ( R ) = K S = ( 1 R ) 2 2 R
E = h ν = 1240 λ
a h γ = A ( h γ E g ) n / 2
In the equation, R is the reflectance of an infinitely thick specimen, while K and S are the absorption and scattering coefficients, respectively. ν represents the frequency of light and λ represents the wavelength (in nanometers); a represents the absorption coefficient, h denotes Planck’s constant, γ signifies the frequency of the incident radiation, A is a constant, and Eg indicates the band gap energy. The value of n depends on whether the sample is an indirect bandgap semiconductor or a direct bandgap semiconductor. For indirect bandgap semiconductors, n equals 4; for direct bandgap semiconductors, n equals 1. In this paper, n = 1.
Figure 5. (a) UV–Vis DRS plots of materials, (b) Tauc curves of different composites, (c) Tauc plots of UIO-66, (d) Tauc plots of HKUST-1.
Chemosensors 14 00058 g005

3.2. The Influence of UIO-66 Combination on the Cataluminescence Performance of HKUST-1

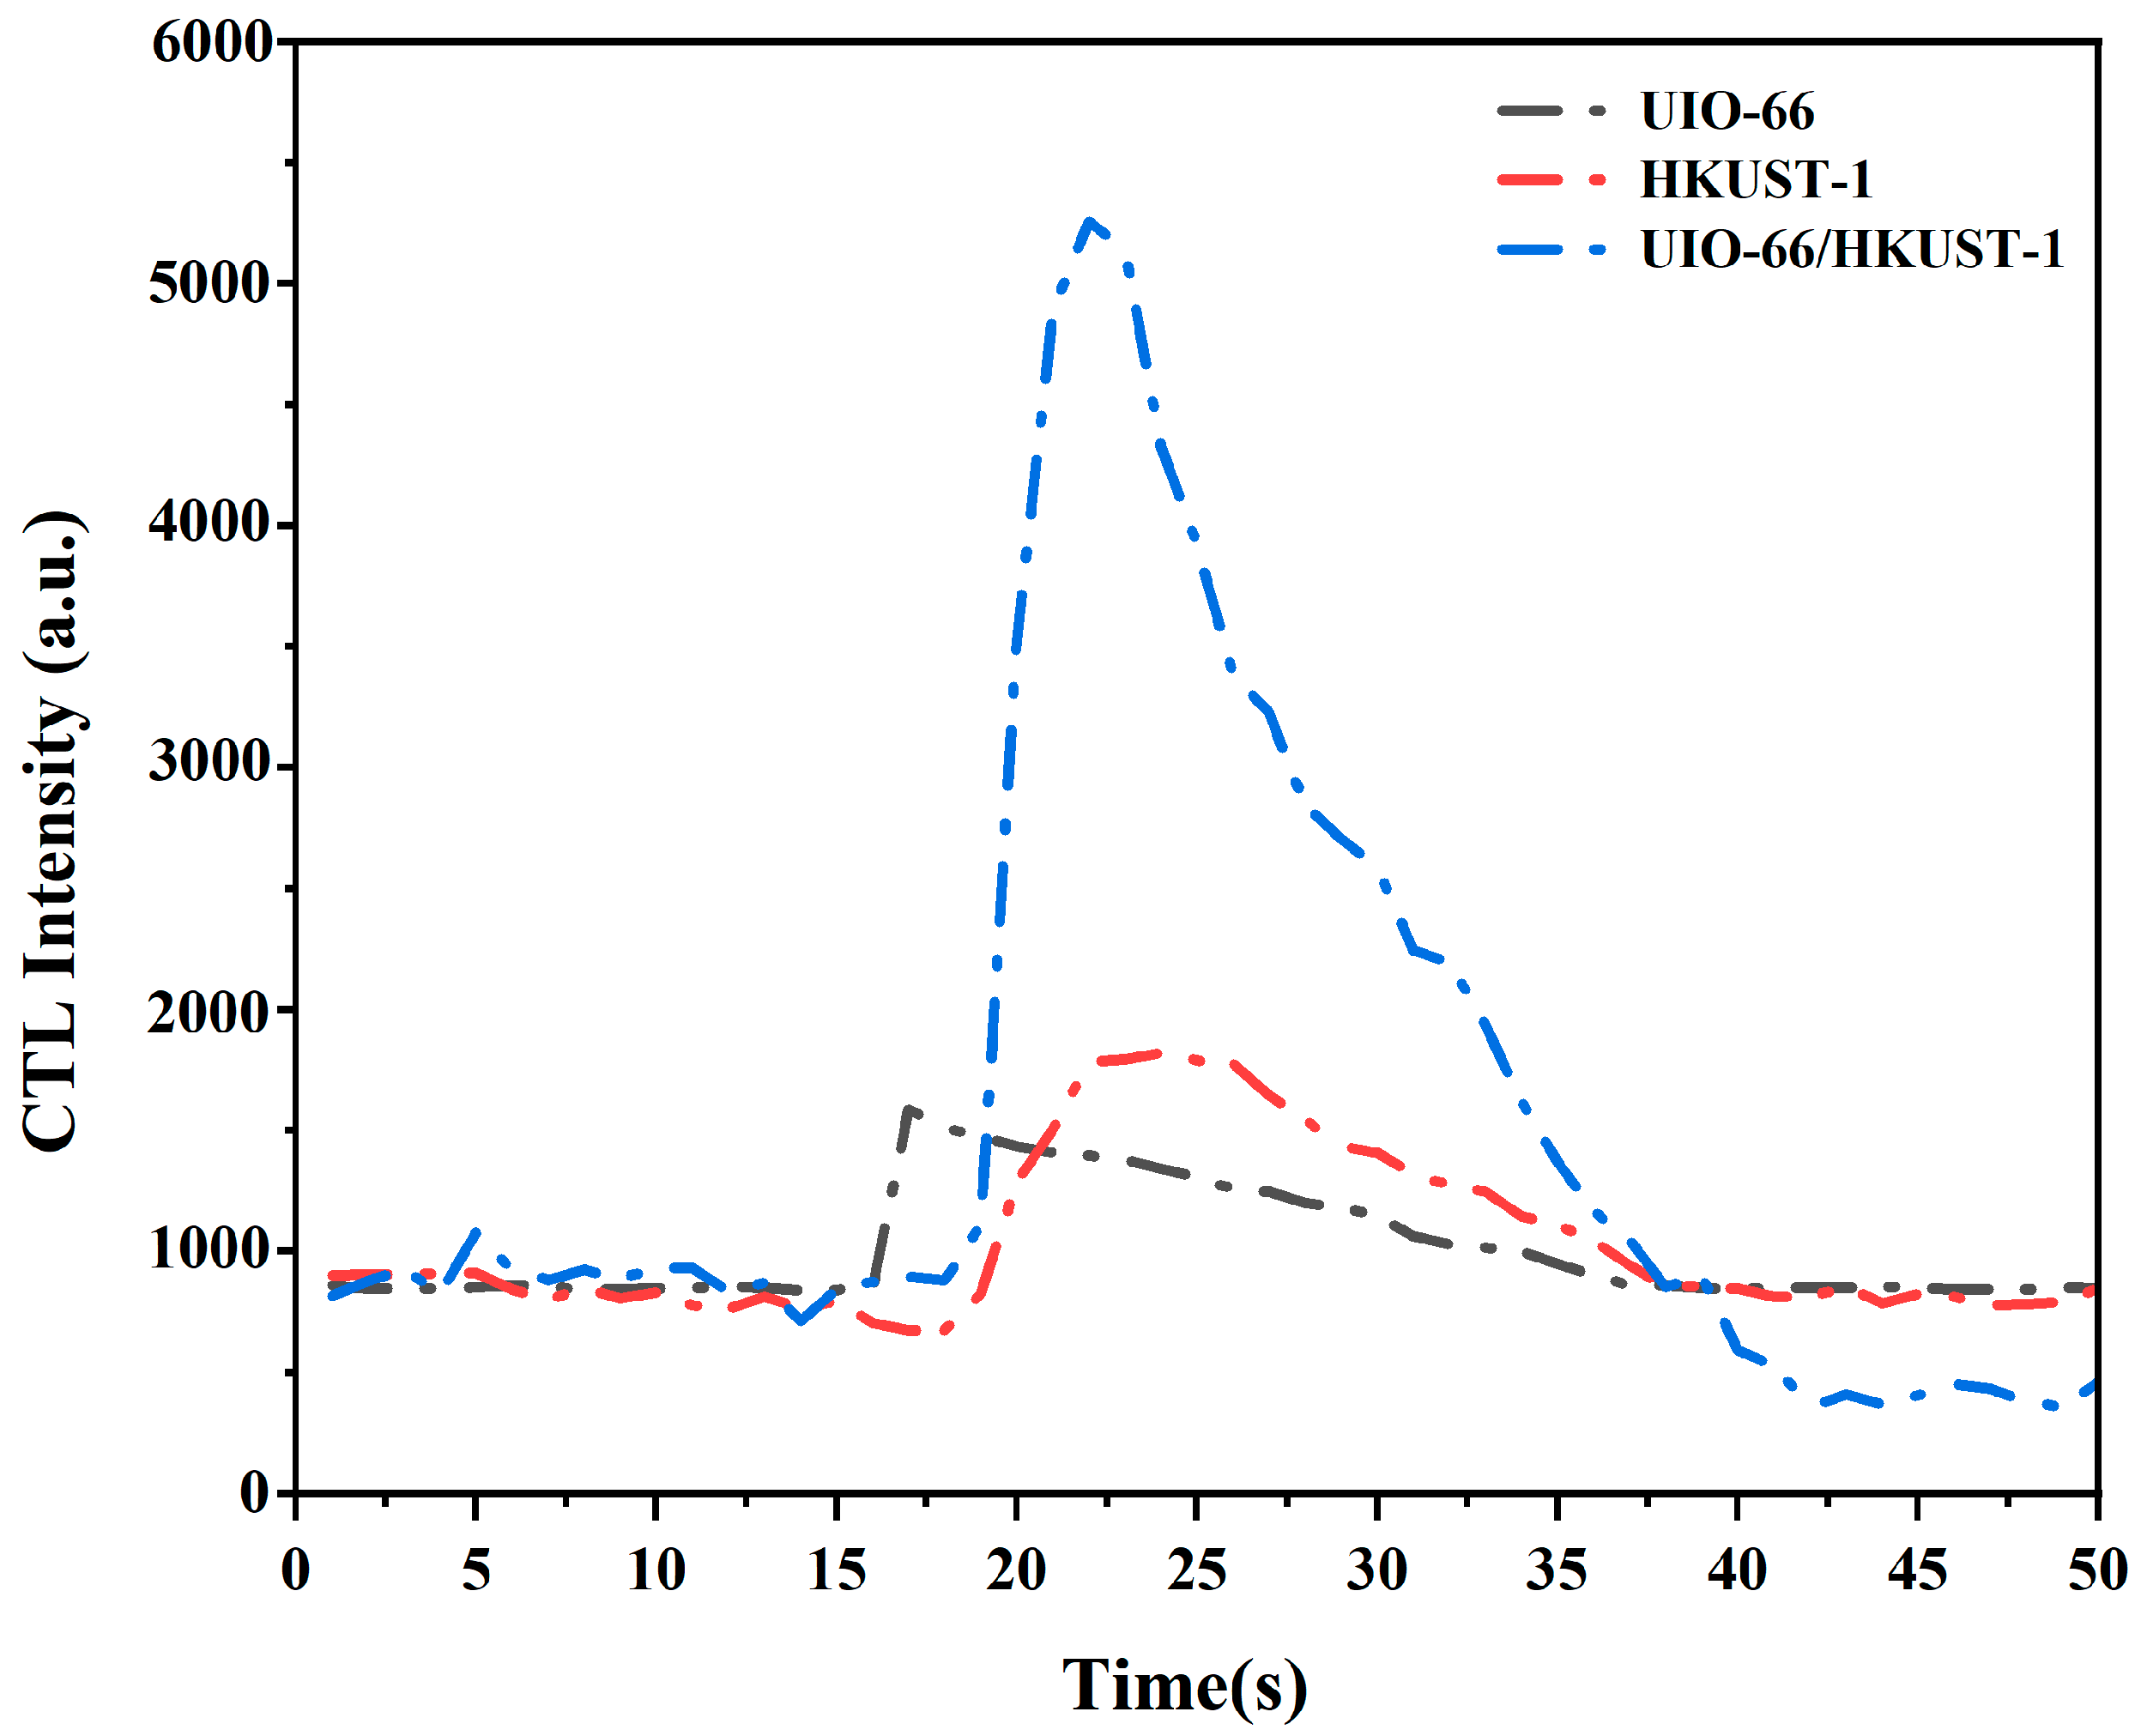
To assess the influence of UIO-66 composite on the CTL sensing performance of HKUST-1, the CTL response behaviors of UIO-66, HKUST-1 and their UIO-66/HKUST-1 composite to dichloromethane were studied respectively. According to relevant reports, the characteristic response wavelengths for the detection of dichlorinated alkanes CTL mainly fall within the 460 nm [40]. The corresponding photon energy level is approximately 2.70 eV. During the testing process, in order to obtain the best and effective response to the target gas, we collected the changes in the electrical signals generated by the light over the entire wavelength range (300–650 nm) for data analysis. The results are presented in Figure 6. The CTL response intensity of the single components UIO-66 and HKUST-1 to dichloromethane is relatively weak, indicating that their interaction with the target gas is limited. In contrast, the UIO-66/HKUST-1 composite demonstrated a significant CTL signal enhancement effect, with its response strength approximately four times that of the monomer material, confirming that the composite has excellent CTL sensing performance. This performance improvement can be attributed to the possible provision of more active sites by the UIO-66-HKUST-1 composite and the promotion of surface catalytic reaction processes.

3.3. The Influence of Temperature on Cataluminescence Performance

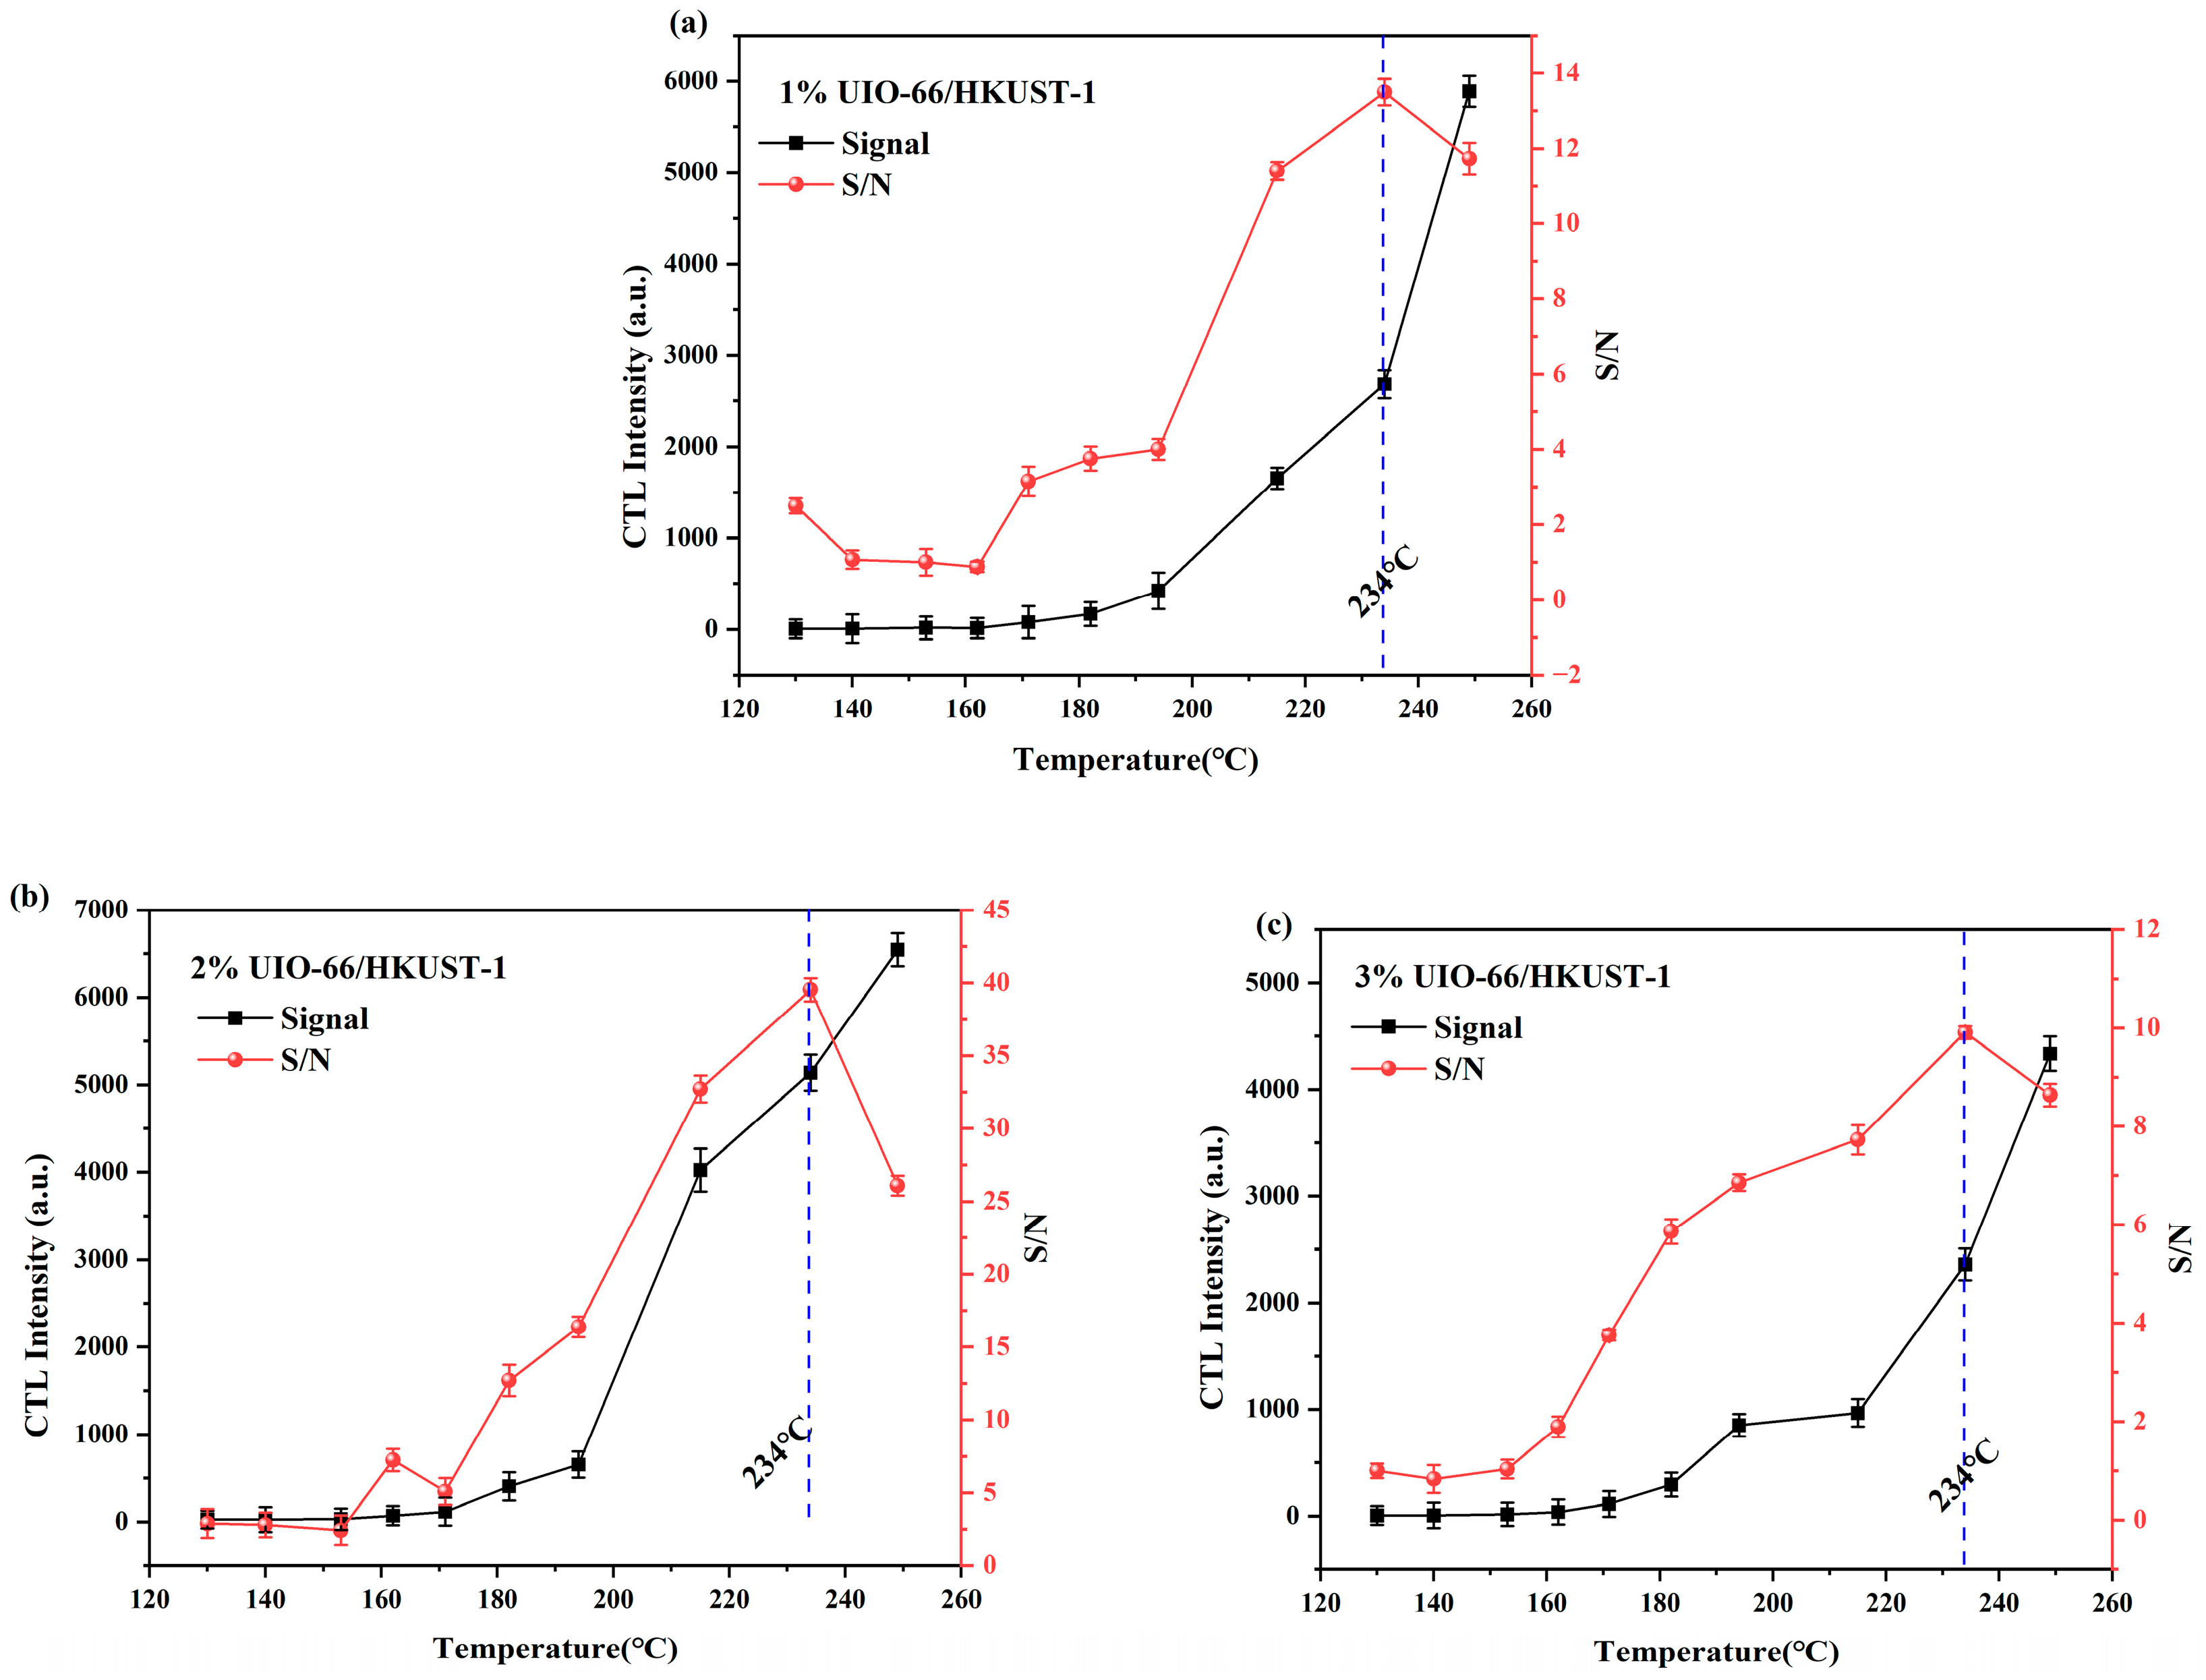
To systematically evaluate the CTL sensing performance of dichloromethane and optimize the detection conditions, this study focused on examining the effects of key parameters, including detection temperature and carrier gas flow rate. As illustrated in Figure 7a–c, we investigated how temperature influences the CTL response behavior of three different proportions of UIO-66/HKUST-1 composites that were detected. As the temperature rises from 130 °C to 234 °C, the CTL signal strength increases rapidly, and at the same time, the noise level also rises. This might be due to the intensification of thermal radiation with the increase in temperature [41]. During this process, the signal-to-noise ratio (S/N) reaches its maximum value at 234 °C and then gradually decreases. Therefore, 234 °C is selected as the optimal detection temperature. This condition not only helps to obtain a higher signal response but also contributes to maintaining the stability of the material structure and the reliability of the instrument operation [42]. Based on this temperature condition, subsequent experiments further investigated the influence of other factors on the performance of CTL.

3.4. The Influence of Flow Rate on Cataluminescence Performance

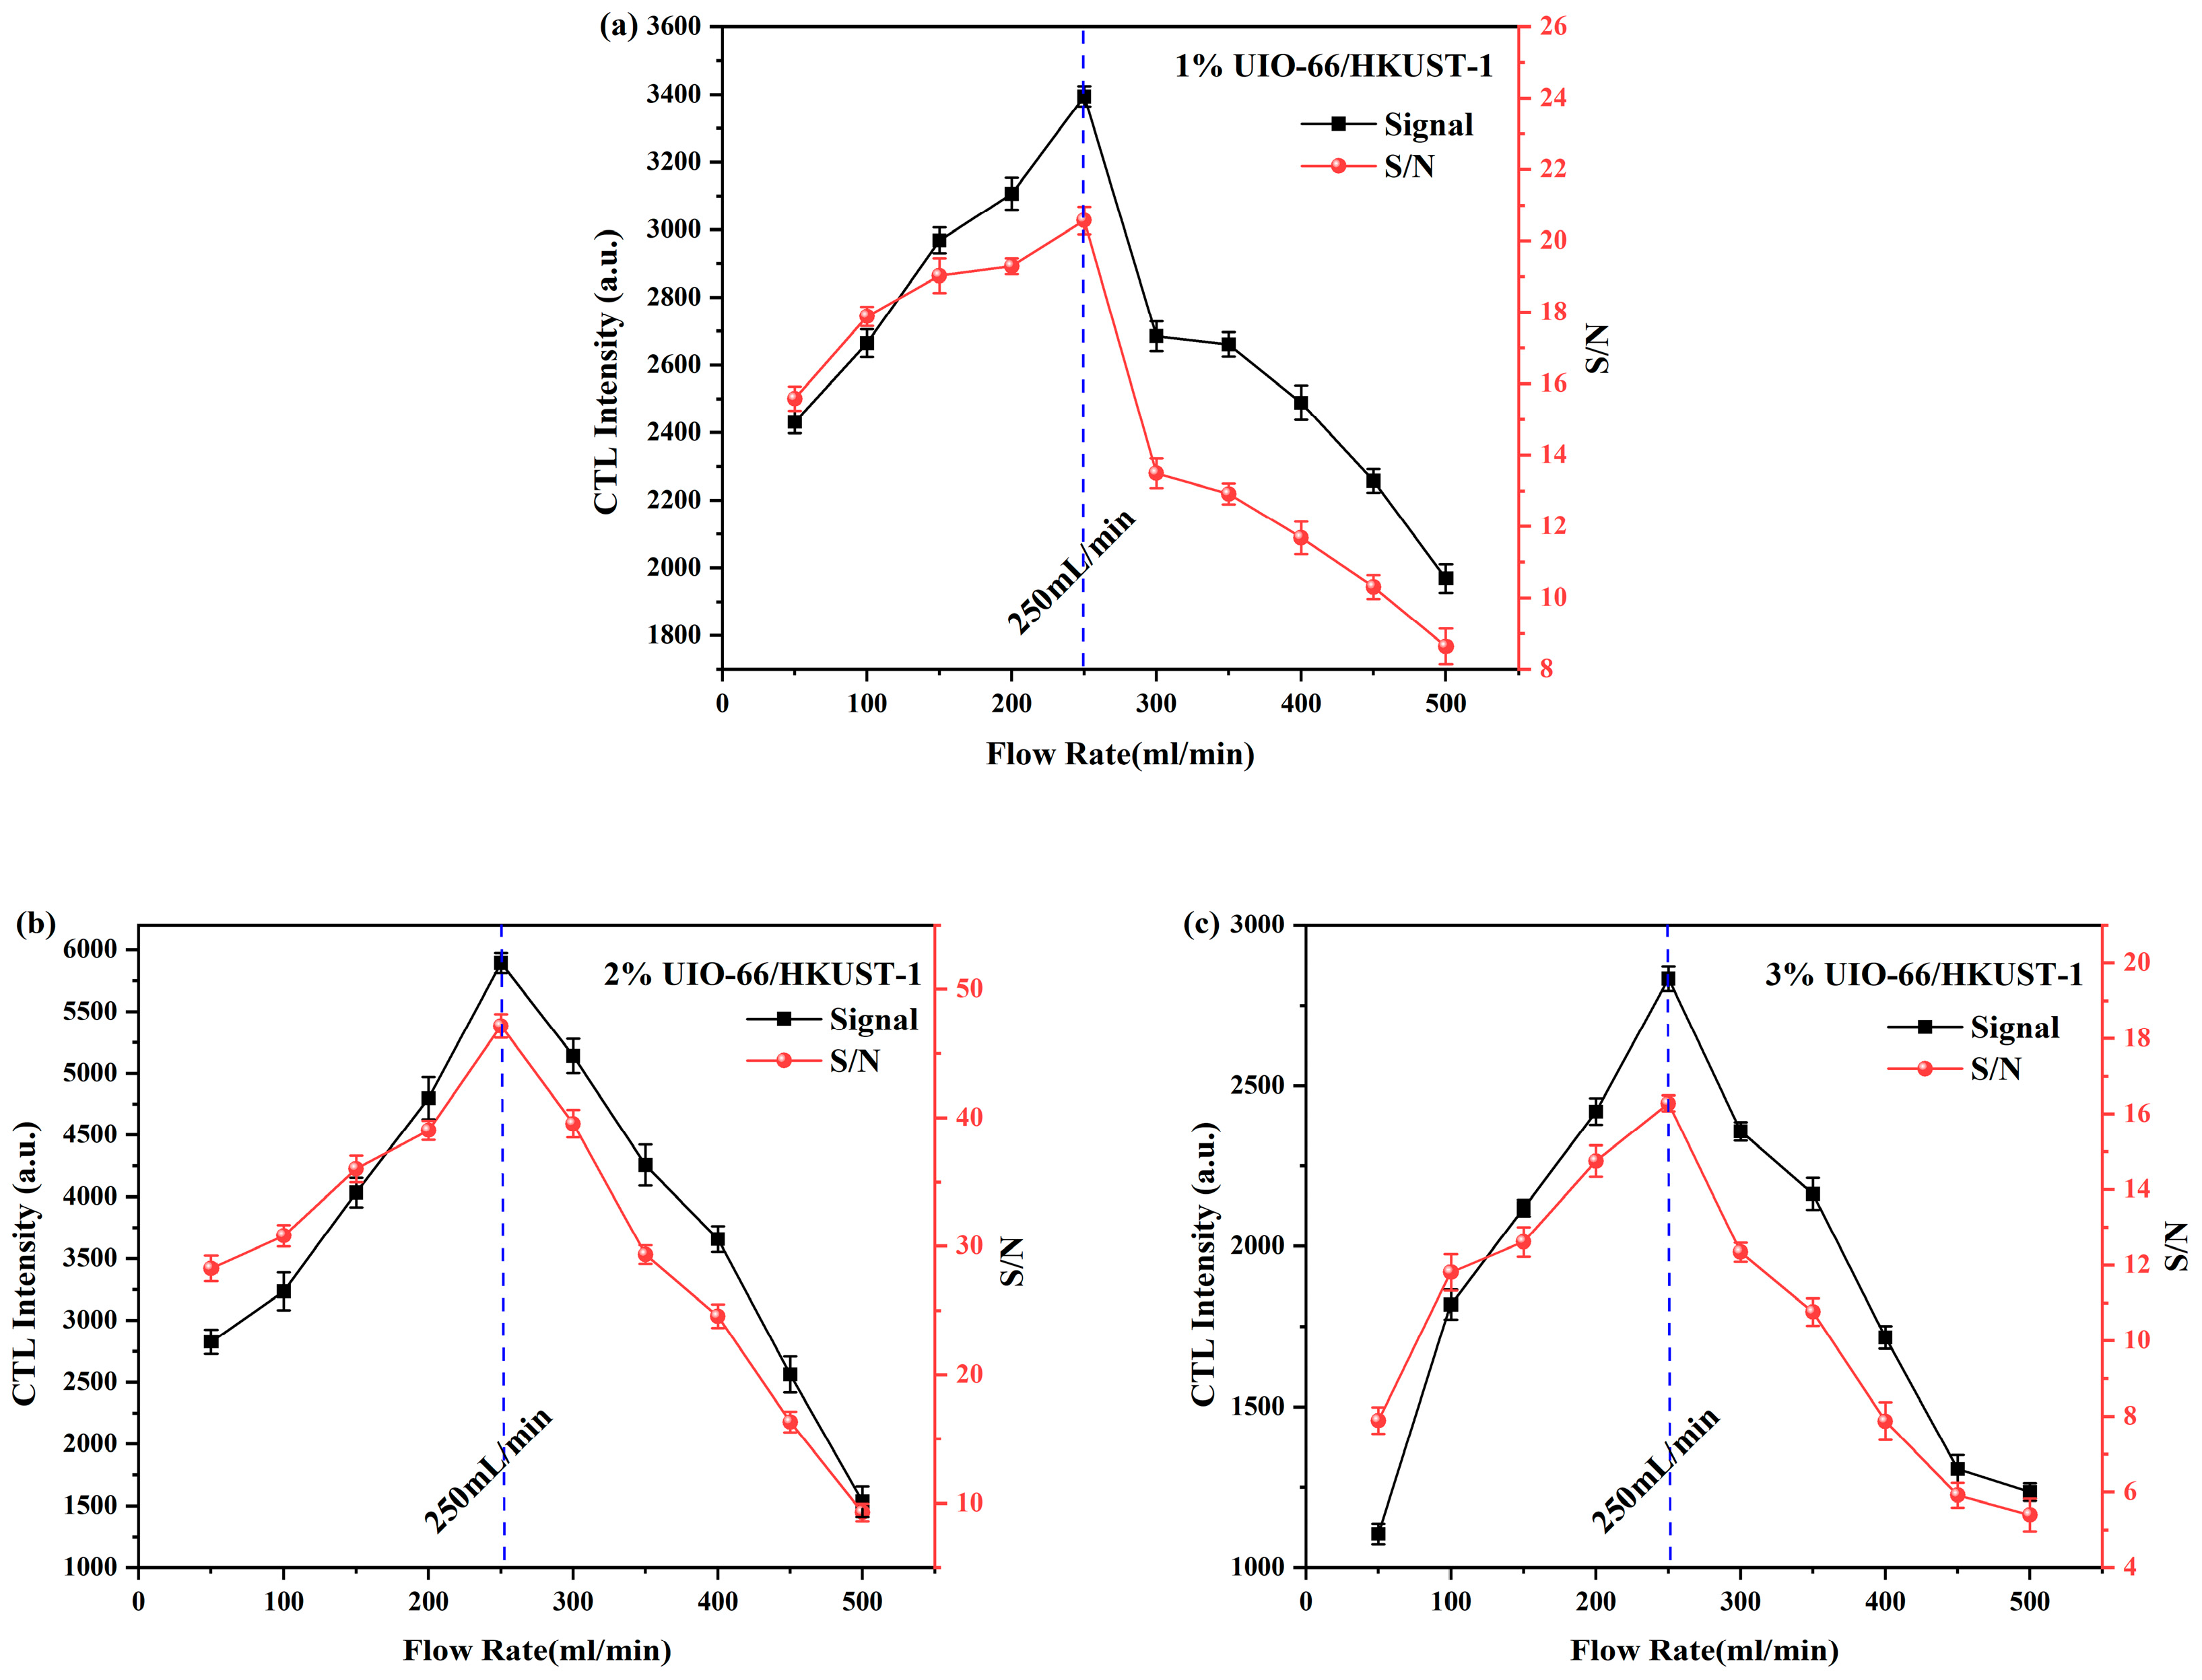
During the testing process, referring to other reports, we continuously adjusted the carrier gas flow rate within the range of 50 to 500 mL/min in a gradient manner, and simultaneously recorded the CTL signal strength and signal-to-noise ratio (S/N) of the sensor [17,43]. Figure 8 shows the variation in CTL intensity with carrier gas flow rate at 234 °C for dichloromethane on UIO-66/HKUST-1 materials at different loading ratios. Composites of different proportions all showed similar changing trends. Taking 2% UIO-66/HKUST-1 as an example, it is observed that the CTL intensity attains its maximum value when the carrier gas flow rate is approximately 250 mL/min. At lower flow rates, the dichloromethane molecules on the material surface can be fully oxidized, and the reaction is relatively complete. However, when the flow rate is too high, the catalytic reaction process appears insufficient. This phenomenon indicates that the diffusion rate of dichloromethane is lower than the generation rate of the luminescent intermediate in the low-flow rate range. In this condition, CTL intensity is controlled by the diffusion process and thus increasing with the increase in flow rate [44]. In addition, a higher gas flow rate can accelerate the gas displacement around the sensor and promptly remove the reaction products, thereby promoting the reaction to proceed in the forward direction. However, when the carrier gas flow rate exceeds 250 mL min−1, the residence time of gas molecules on the catalyst surface is significantly shortened. Some dichloromethane is carried out of the reaction zone before it undergoes a full reaction, resulting in a decrease in CTL signals [45]. Therefore, to ensure the best performance of CTL sensing materials, all subsequent experiments were conducted under the flow rate conditions corresponding to the peak signal-to-noise ratio.

3.5. Study on the Performance of Cataluminescence Sensors

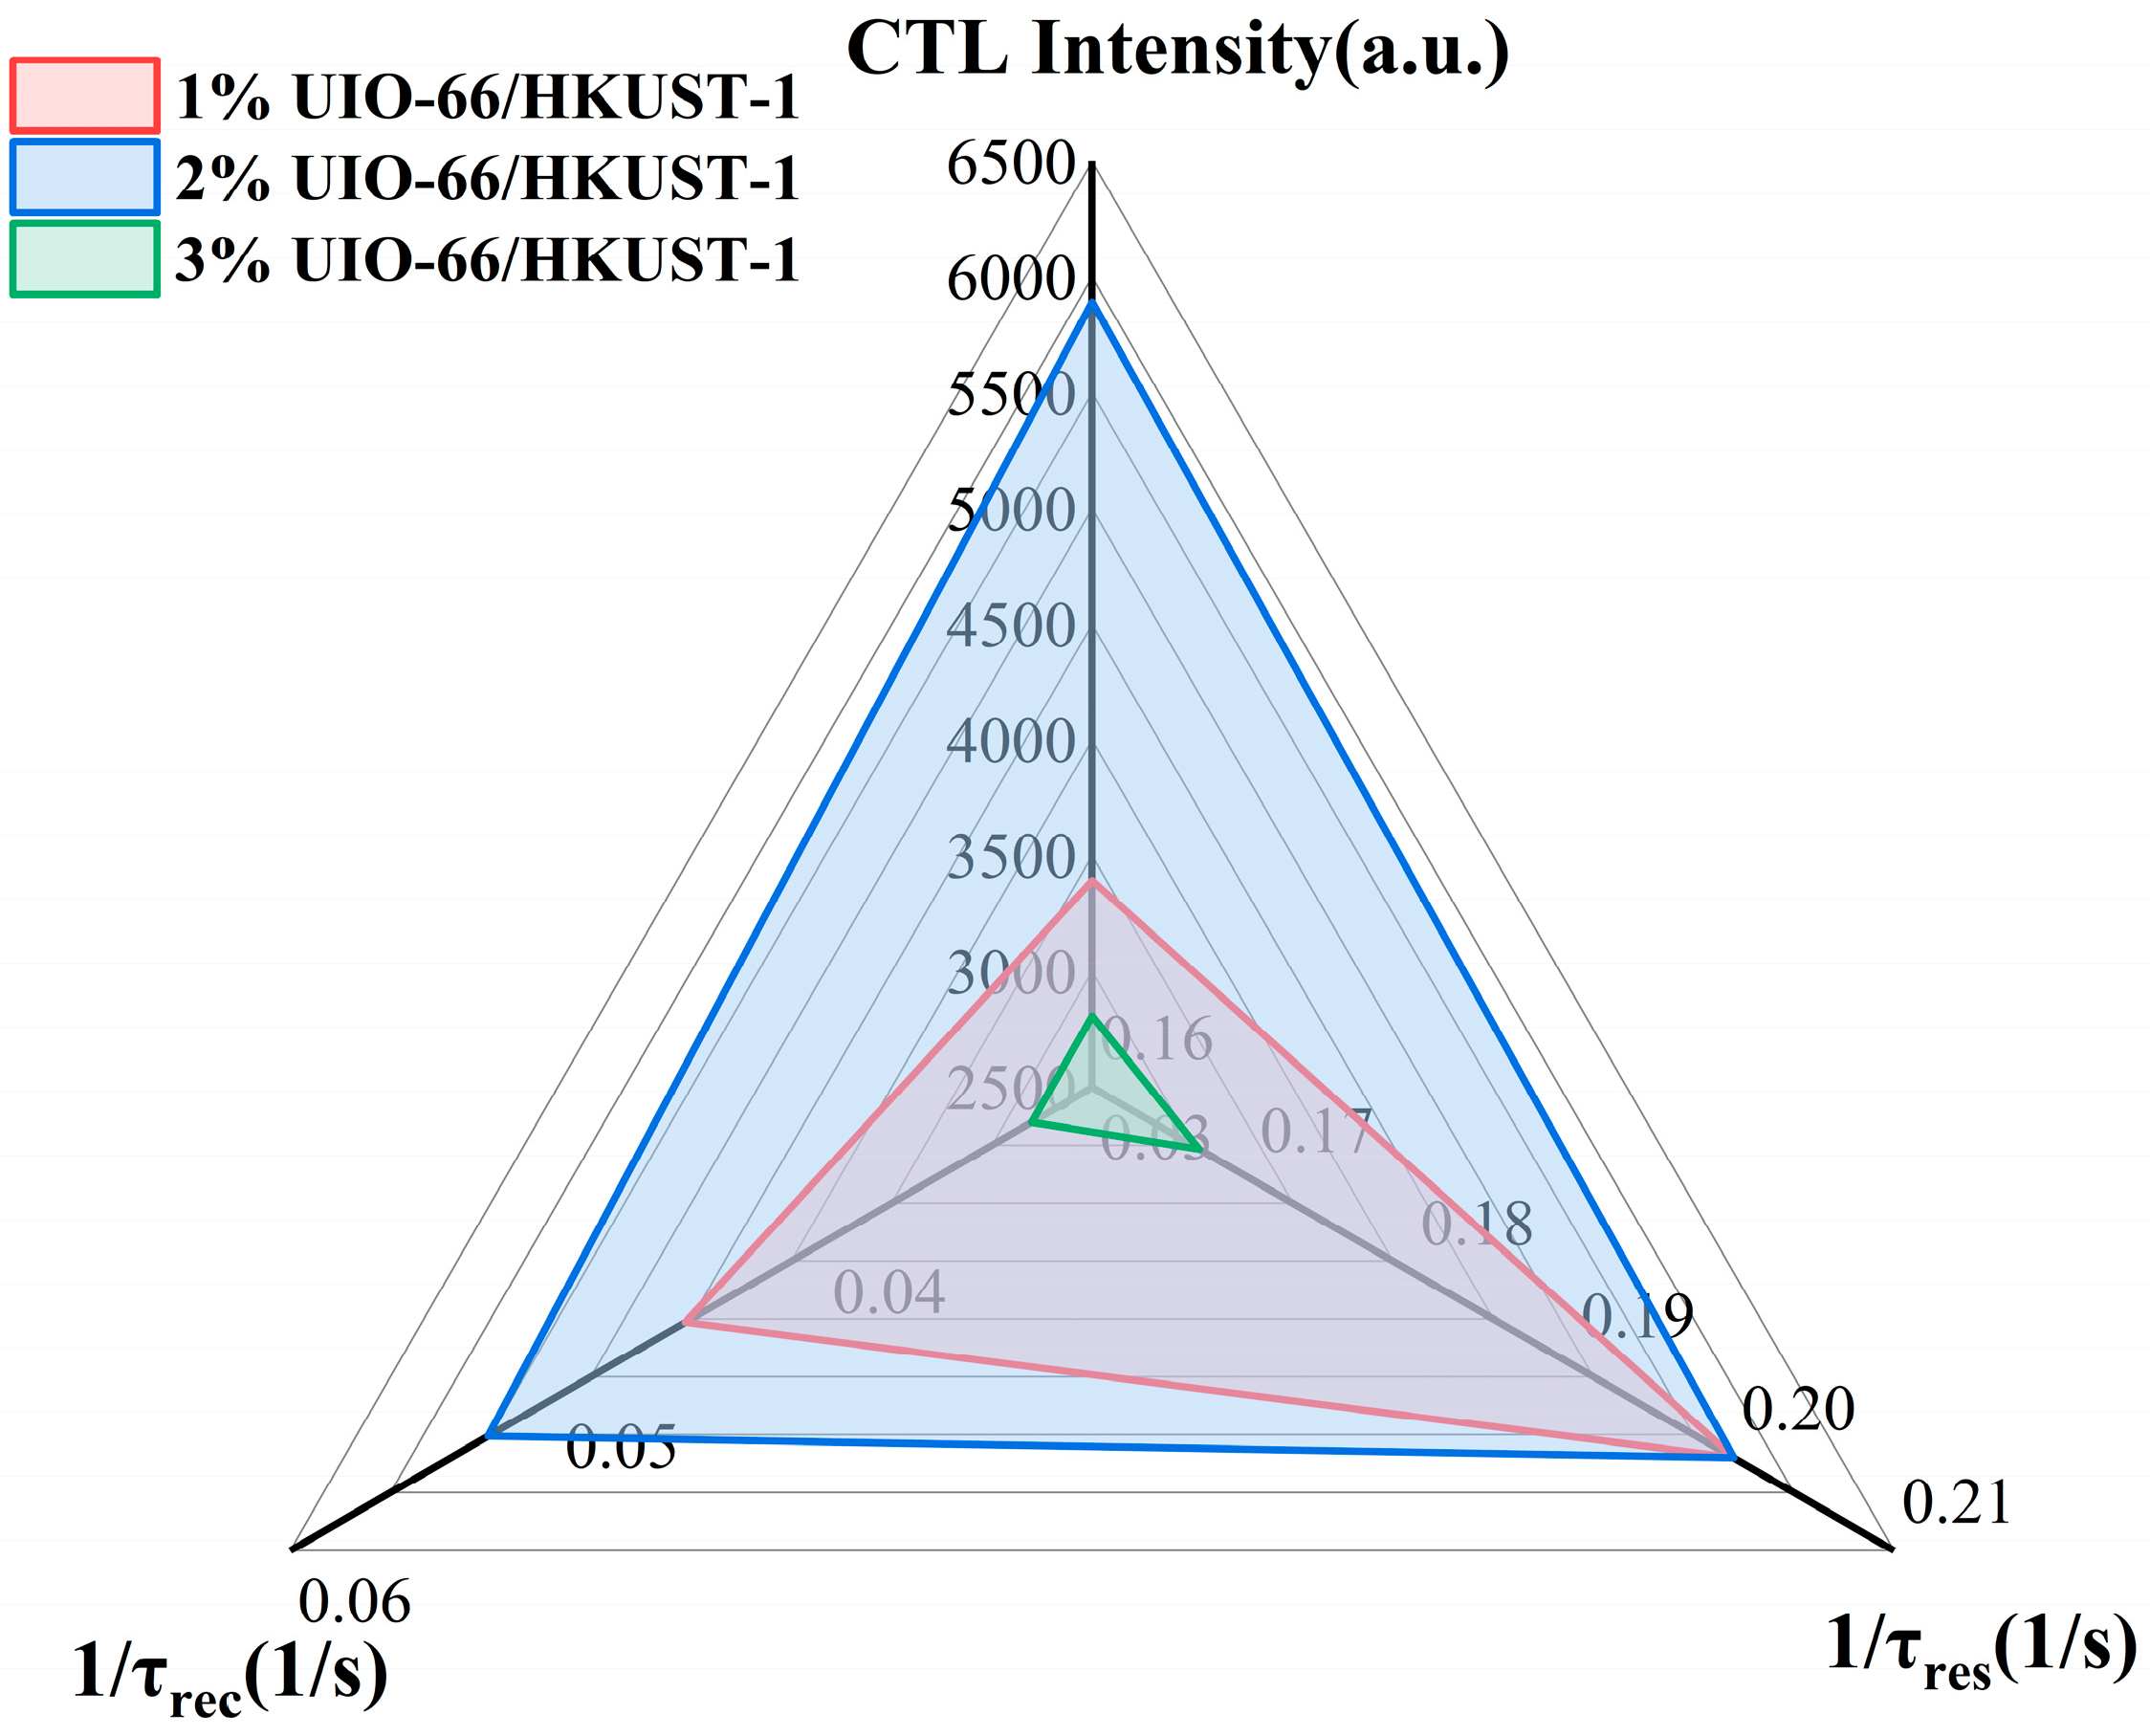
Figure 9 illustrates the response–recovery curves of the HKUST-1 sensor compounded with 1%, 2% and 3% UIO-66 to 84 ppm dichloromethane under the optimal conditions. As the composite ratio of UIO-66 increases, the sensitivity of the material’s response to CTL initially rises before subsequently decreasing. The sensor with a 2% UIO-66 exhibited the highest peak response signal, significantly outperforming the 1% and 3% ones, indicating that this ratio has the optimal detection sensitivity for dichloromethane. However, when the composite ratio was further increased to 3%, the response performance declined. It is speculated that this might be due to the excessive UIO-66 leading to the accumulation of active sites or the enhanced interaction between particles, thereby reducing the response efficiency [46]. Furthermore, as the composite ratio increases, the recovery time of the sensor gradually prolongs, indicating that the dynamic response characteristics are affected. Comprehensive comparison shows that the 2% UIO-66 composite not only achieves a high response signal, but also maintains a relatively short response time (τres = 5 s) and recovery time (τrec = 19 s), thus achieving the best balance between sensitivity and dynamic performance. Therefore, 2% UIO-66/HKUST-1 was identified as the optimal composite and applied in subsequent research to fully leverage its enhancing effect on the sensitivity of HKUST-1.

3.6. Study on the Relationship Between Dichloromethane Concentration and Cataluminescence Signal

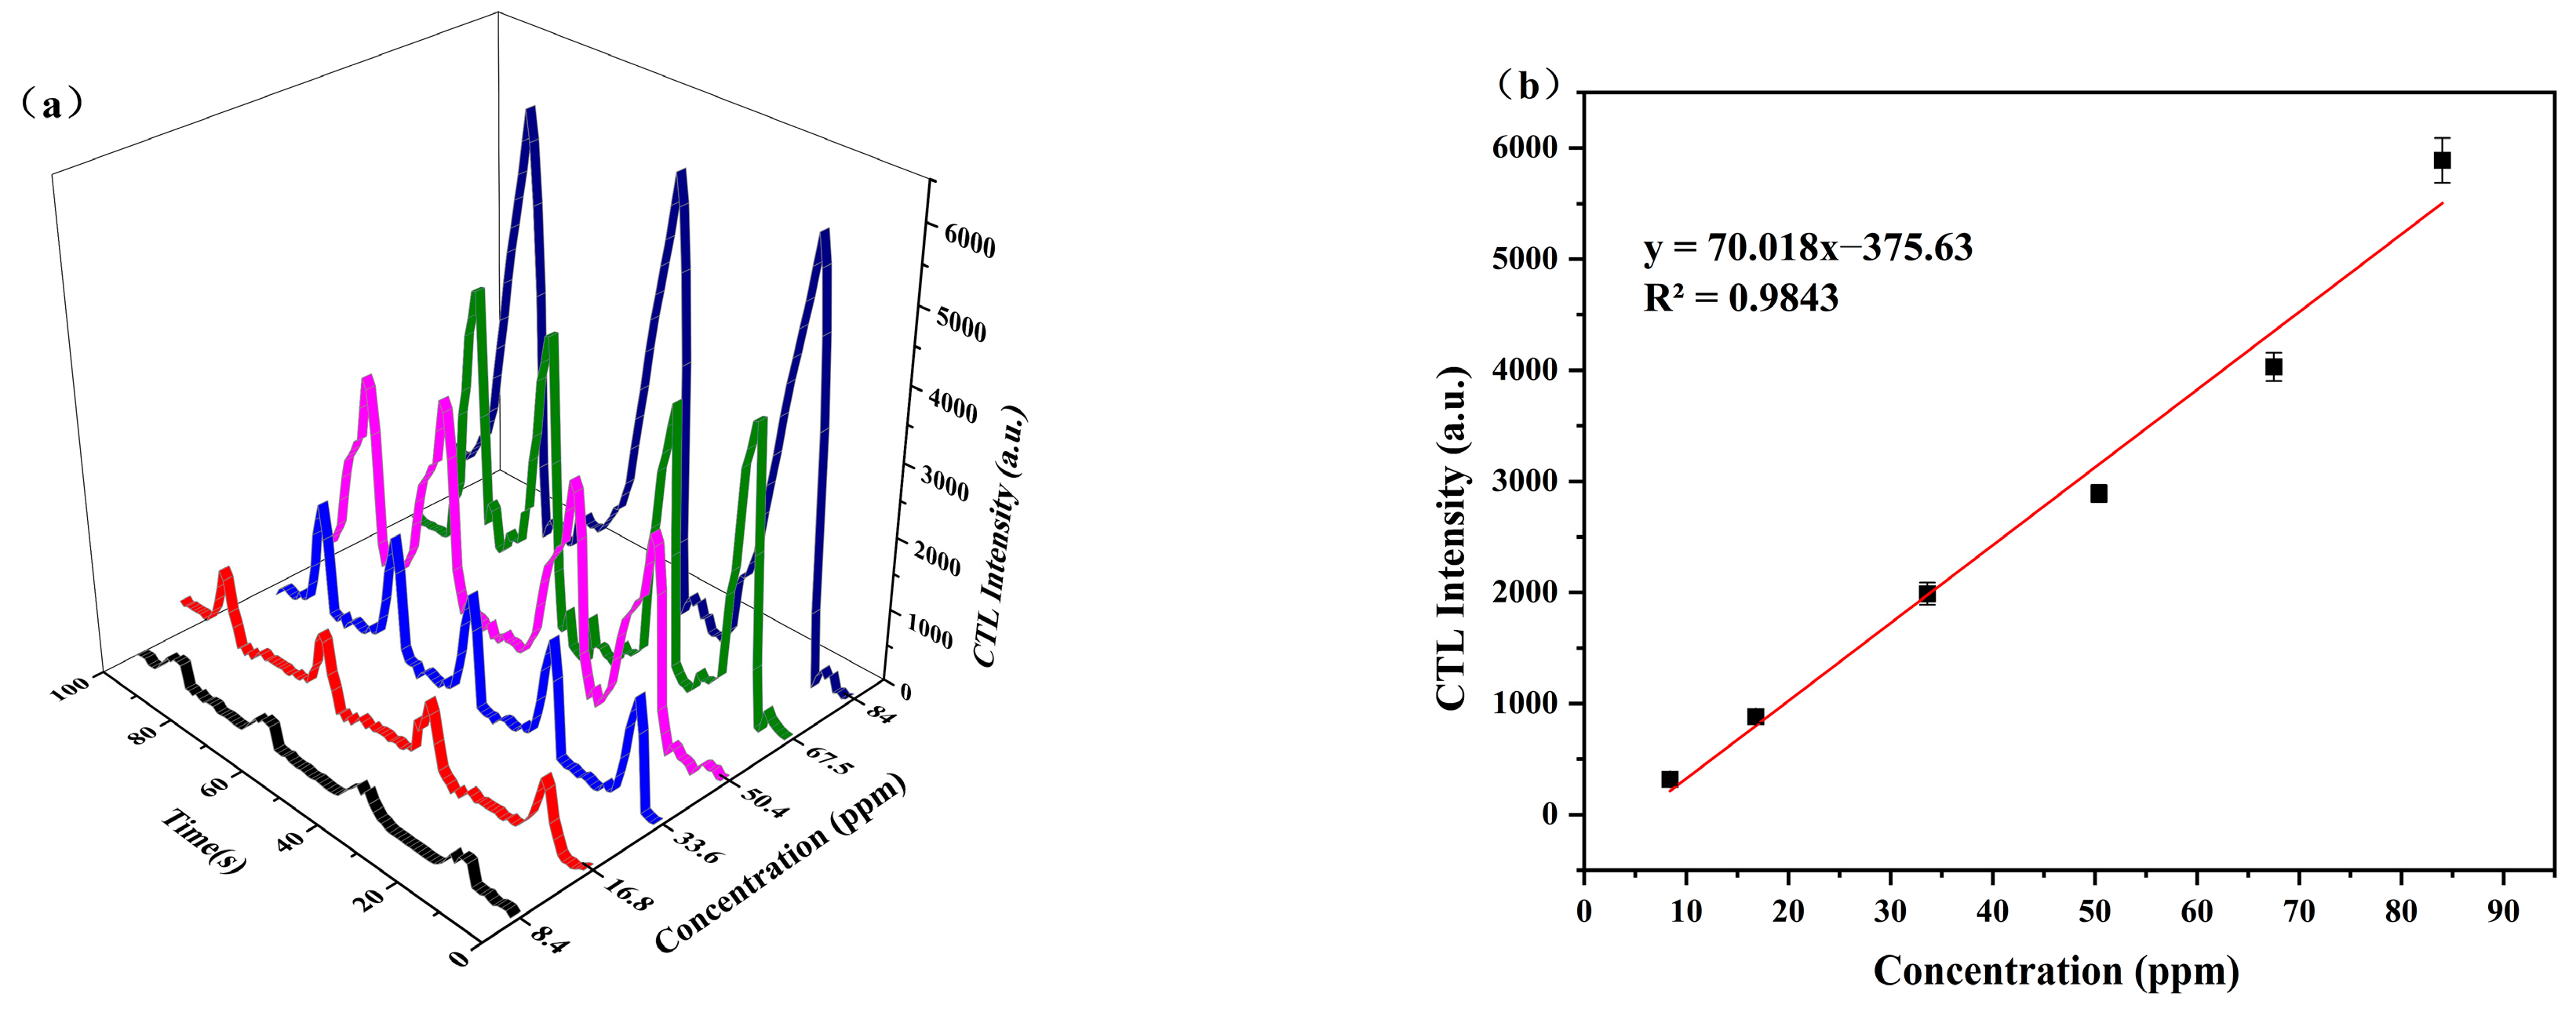
Figure 10 shows the correspondence between dichloromethane concentration and CTL response signals under optimized experimental parameters. Within the concentration interval of 8.4 to 84 ppm, the intensity of the CTL signal exhibits a significant upward trend with the elevation of dichloromethane concentration (Figure 10a). This phenomenon can be attributed to the fact that the number of dichloromethane molecules adsorbed on the surface of sensitive materials increases with the rise in concentration, promoting the surface reaction between them and oxygen, thereby enhancing the strength of CTL signal. At the same time, it reflects that the sensor has a high sensitivity and stability to the target gas. Figure 10b further presents the calibration curve linking CTL signal intensity to dichloromethane concentration. The two variables display a favorable linear relationship within the aforementioned concentration range. The fitted linear regression equation is expressed as y = 70.018x − 375.63 (R2 = 0.9843), where y denotes the CTL signal intensity and x corresponds to the dichloromethane concentration. According to the signal-to-noise ratio standard (Equation (5)), the detection limit of this sensor is 1.71 ppm. It is far lower than the weighted average allowable concentration limit of 57.5 ppm for occupational exposure time stipulated in the current occupational health standards of the National Health Commission of the People’s Republic of China [47].
D = 3 N × Q I
In the equation, Q represents the minimum inlet concentration within the concentration detection range, N denotes the noise level corresponding to this minimum inlet concentration, and I stands for the response signal value associated with the minimum inlet concentration in the detection range.
Figure 10. (a) CTL response characteristics of 2% UIO-66/HKUST-1 under optimized conditions; (b) linear relationship between CTL signal intensity and dichloromethane concentration (temperature: 234 °C, flow rate: 250 mL/min).
Chemosensors 14 00058 g010

3.7. Study of Sensor Selectivity and Stability

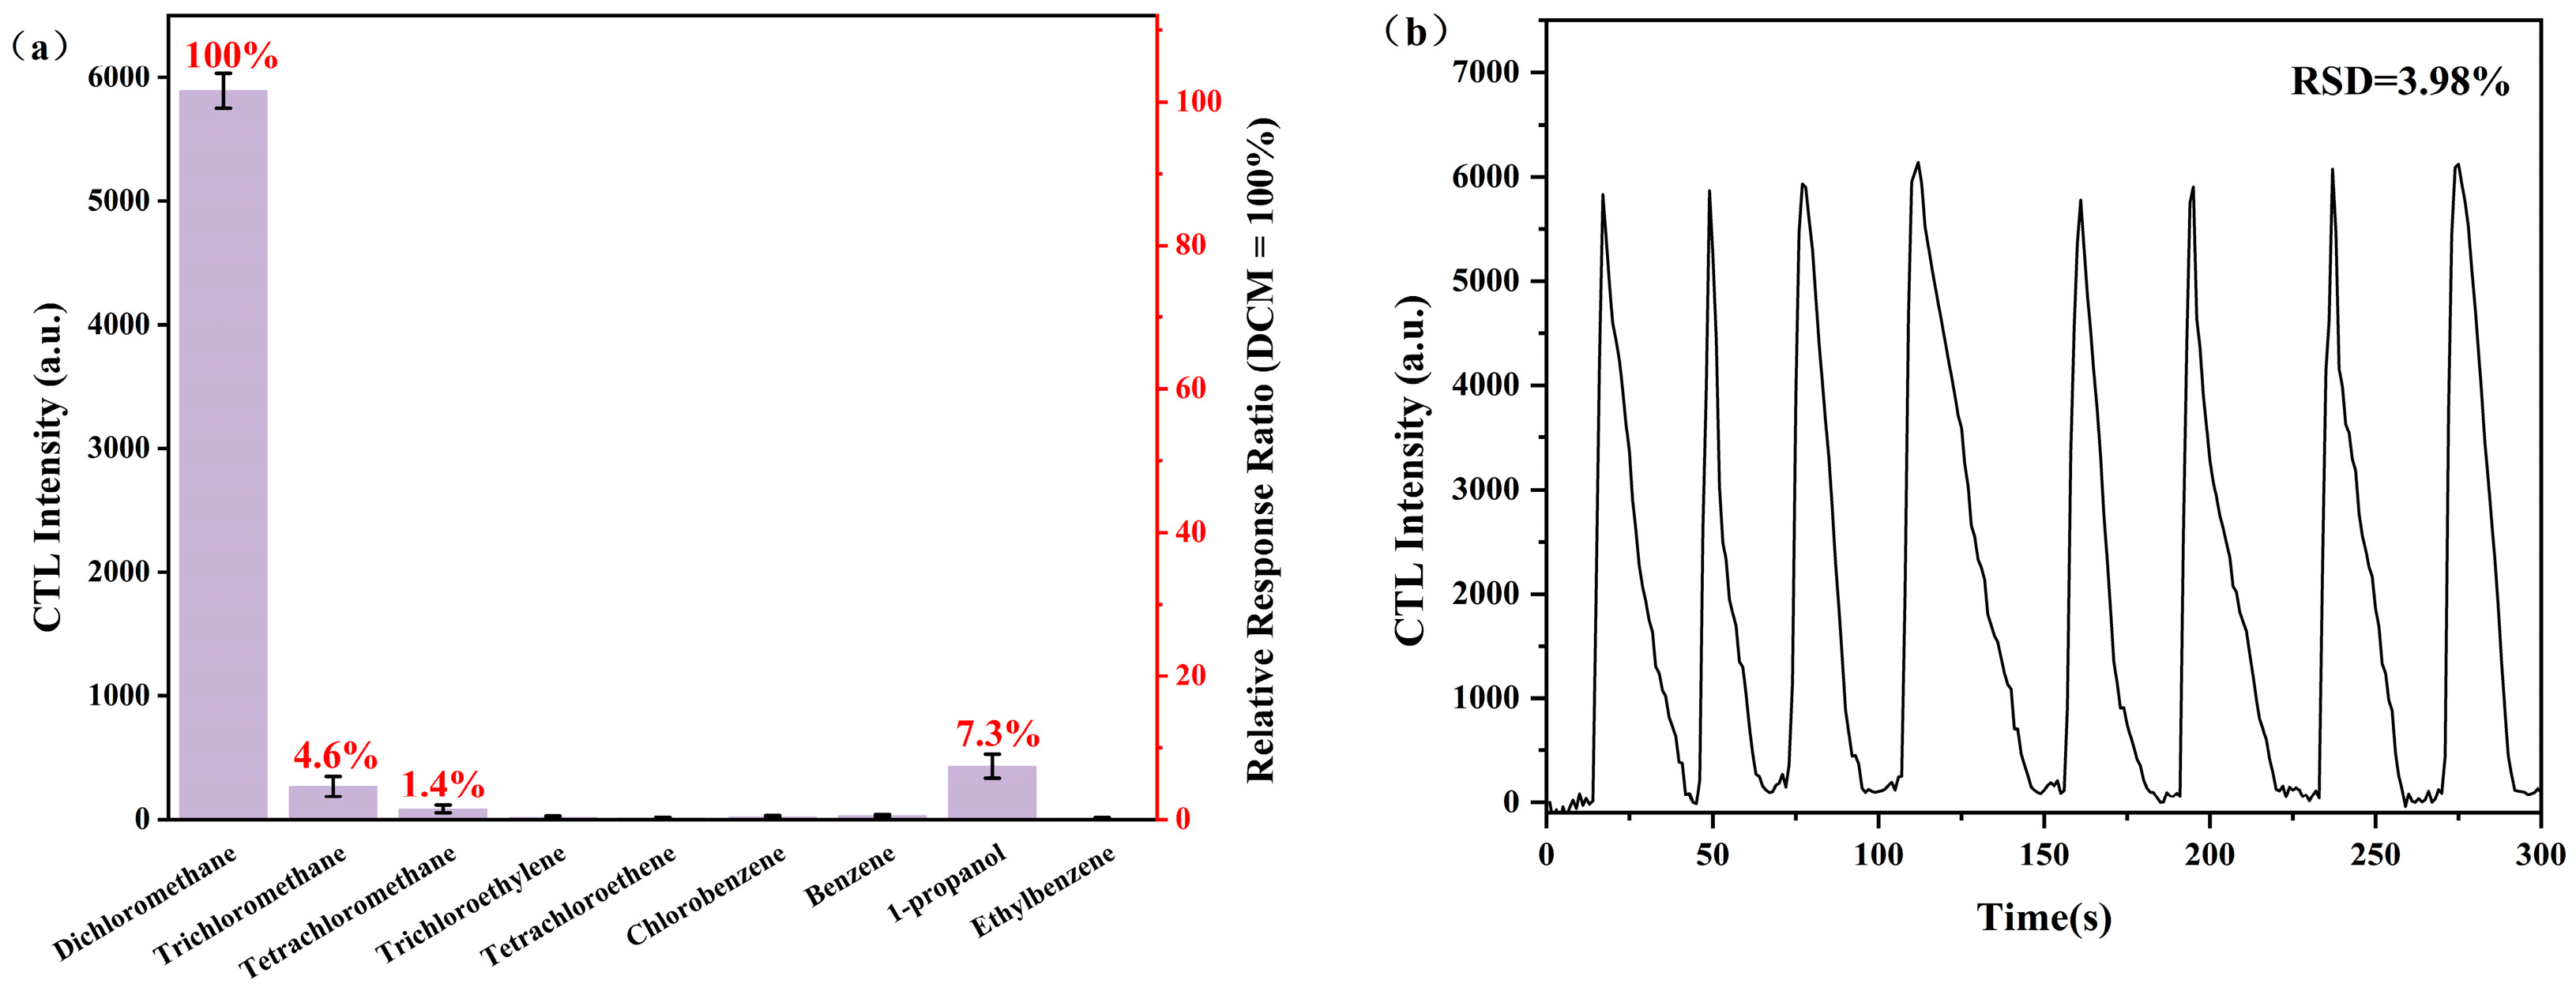
To evaluate the selectivity of 2% UIO-66/HKUST-1 nanocomposites in CTL sensors, this study systematically investigated their response characteristics to chlorinated hydrocarbons such as dichloromethane (including trichloromethane, tetrachloromethane, trichloroethylene and tetrachloroethylene) as well as other typical VOCs under optimized conditions. The response signals obtained from repeated measurements are shown in Figure 11a. The research results show that the response signal of this sensor to dichloromethane is significantly higher than that of other volatile organic compounds. In the relative response ratio (dichloromethane = 100%), trichloromethane is 4.6%, tetrachloromethane is 1.4%, and 1-propanol is 7.3%, while other volatile organic compounds (such as trichloroethylene, tetrachloroethylene, etc.) are almost zero, demonstrating excellent selectivity. On the one hand, an increase in the number of Cl atoms may lead to an increase in molecular steric hindrance for chlorinated hydrocarbons, making it difficult for the Cu2+ site to effectively approach and activate the C-Cl bond. An excessive number of Cl atoms can cause “chlorine poisoning” on the catalyst surface, reducing the oxygen activation ability of the Zr4+ site [48,49]. Other volatile organic compounds such as chlorinated benzene and benzene are difficult to be cleaved due to the conjugated stable structure of the aromatic ring, resulting in a relatively weak response [50]. On the other hand, this might be due to the specificity of the interaction between MOF and molecules. The Cu2+ and Zr4+ metal sites in the UIO-66/HKUST-1 composite have strong coordination interactions with the Cl atoms in the dichloromethane molecule, which can stably adsorb the dichloromethane molecule and activate the C-Cl bond [51]. However, the interactions between other VOCs and metal sites (such as hydrogen bonds) are relatively weak, or they lack characteristic functional groups that are prone to cleavage [52]. This specific interaction further enhances the selective recognition of dichloromethane.
Furthermore, to explore the long-term stability of the sensor, after an eight-week storage period, samples of the same concentration of dichloromethane were continuously injected into the reaction chamber eight times under optimized conditions for repeated detection. As illustrated in Figure 11b, the sensor’s response signal demonstrates a high level of consistency across multiple cycle tests, with a relative standard deviation (RSD) of 3.98%, indicating that the CTL sensor exhibits excellent repeatability and long-term operational stability.
To verify the practical application advantages of CTL sensor detection technology, it was compared with other dichloromethane detection technologies, and the results are shown in Table 1.
Through comparative analysis, it is noted that the UIO-66/HKUST-1 CTL sensor demonstrates superior comprehensive advantages over other detection technologies in two core metrics, detection limit and response speed, achieving a balance between high sensitivity and rapid response.

3.8. Mechanism Discussion

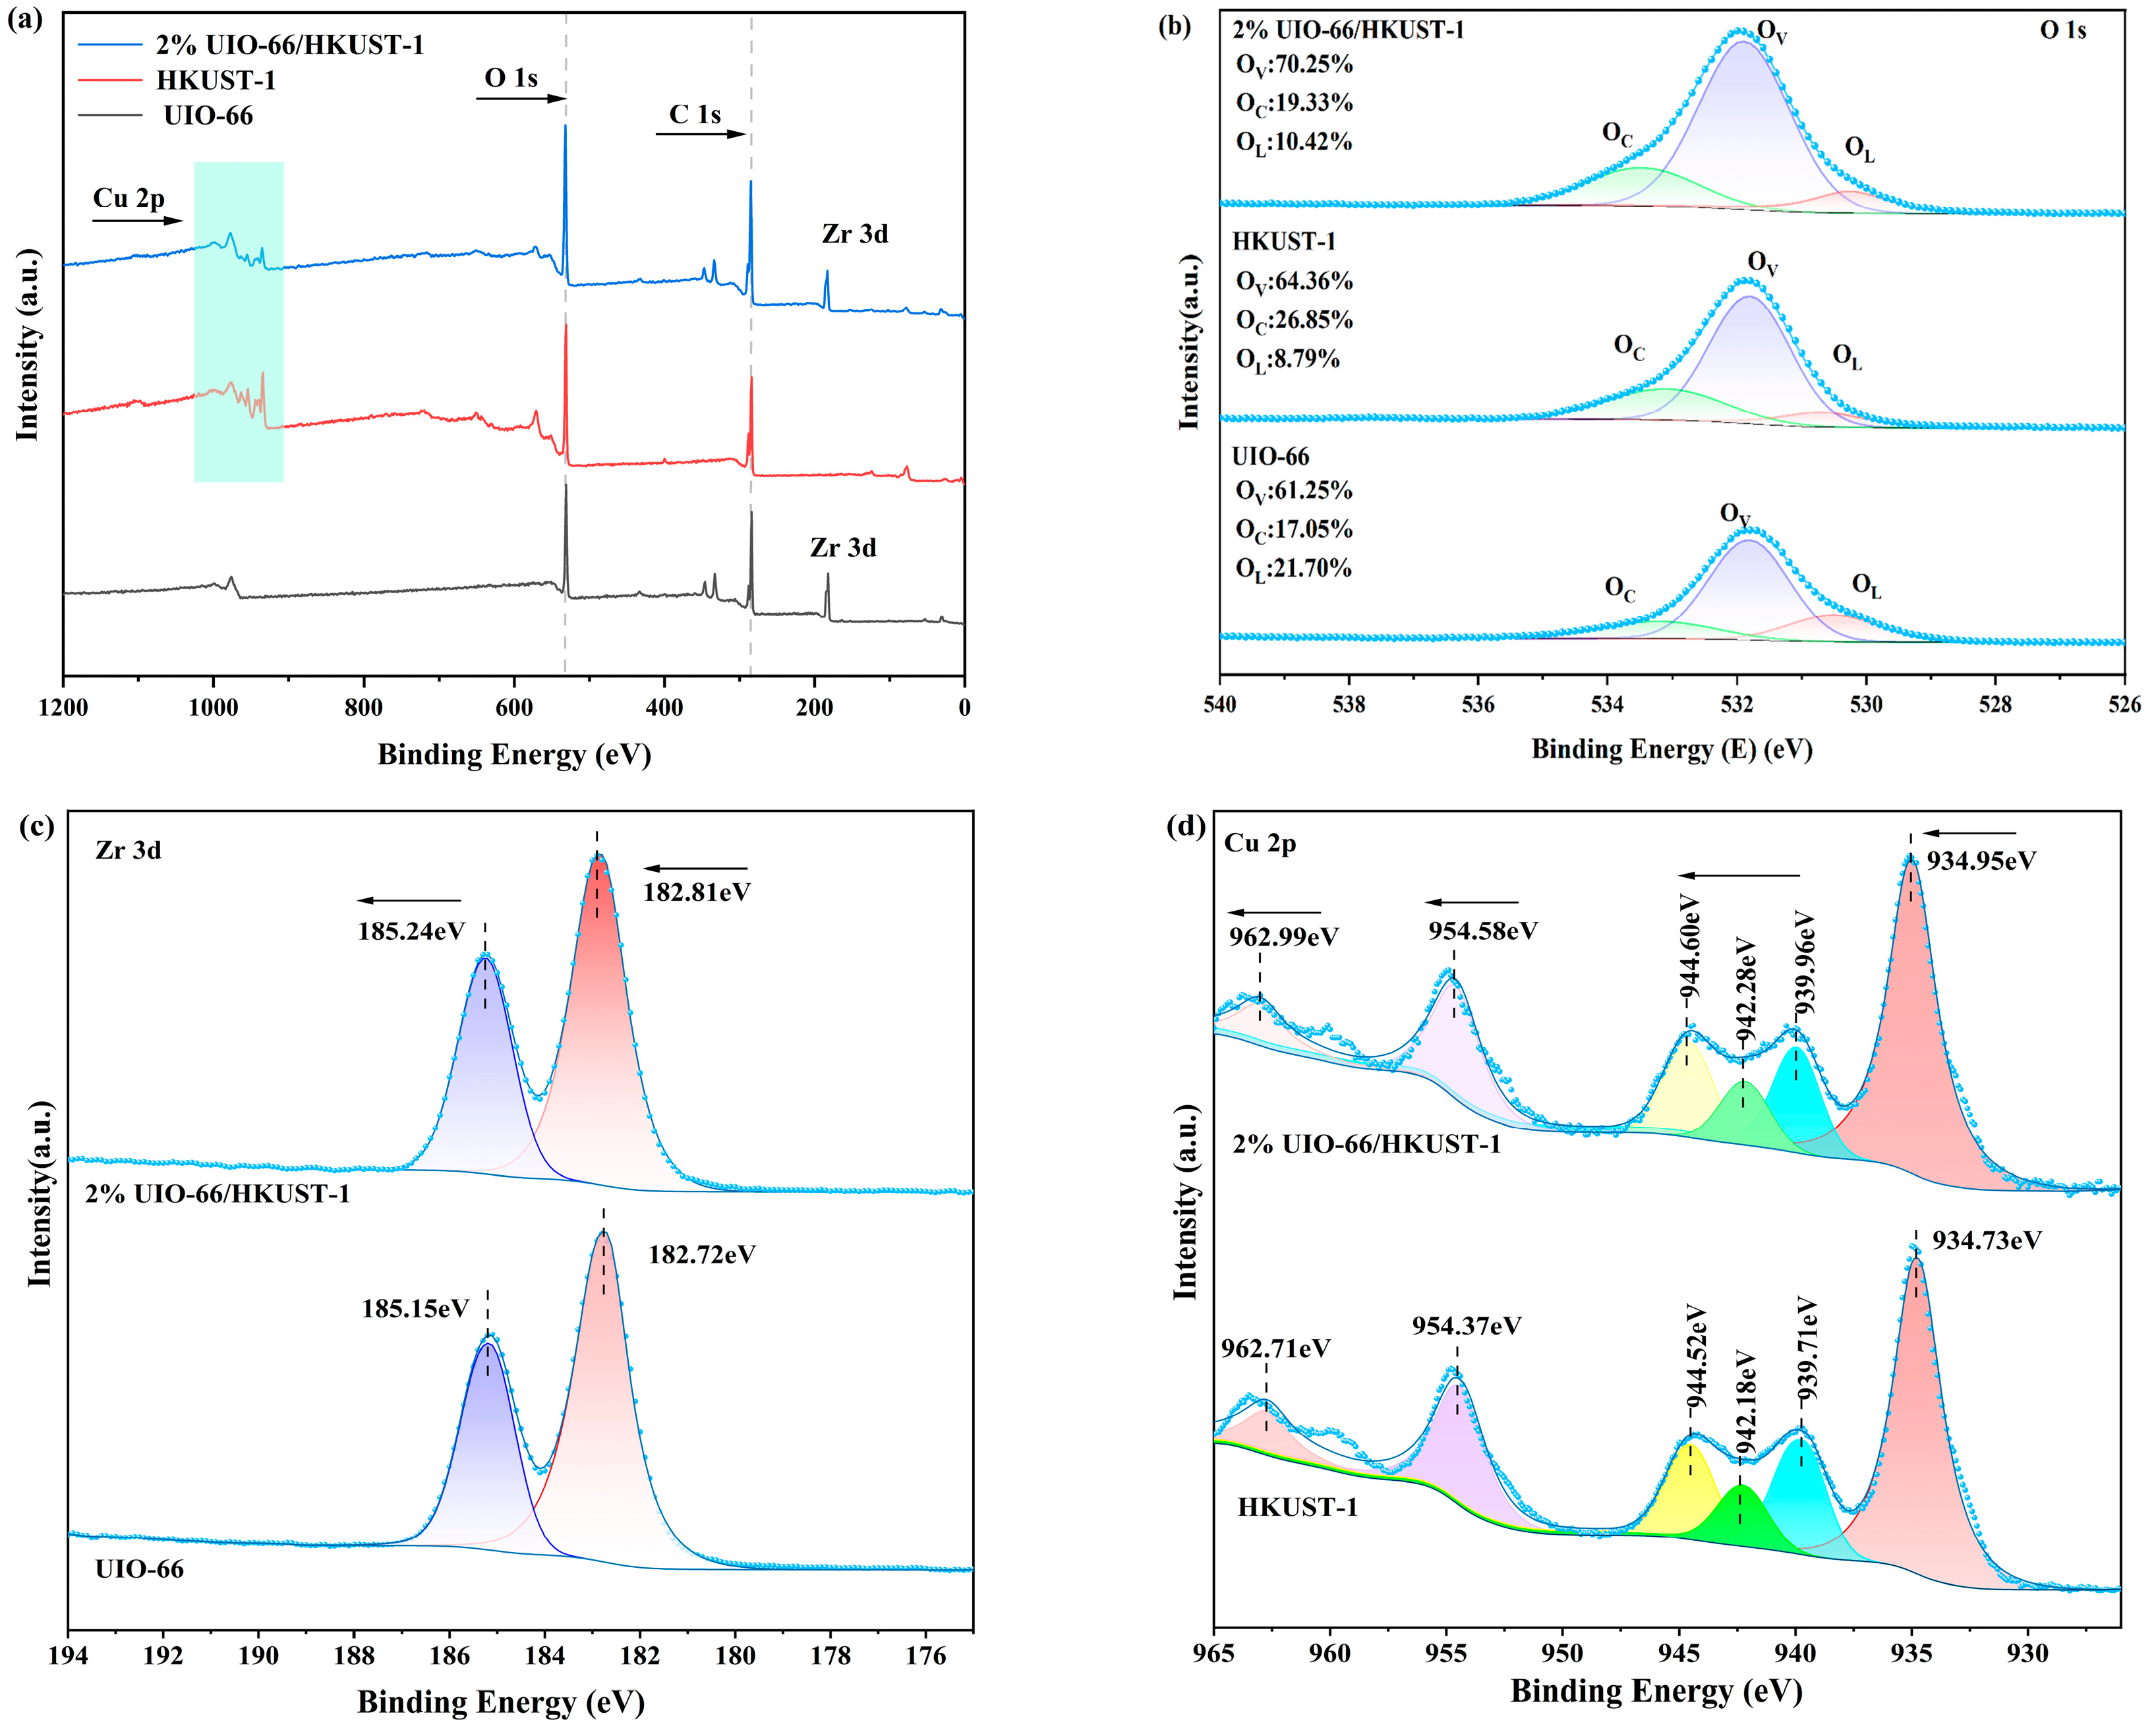
In this study, high-resolution XPS spectroscopy was utilized to analyze and compare the surface chemical states of composite and single-component materials. The XPS data were calibrated on the basis of the C 1s peak with a binding energy of 284.8 eV. The results show that characteristic signals of Cu, O and C can be observed in HKUST-1, and spectral peaks of Zr, O and C exist in UIO-66. In the 2% UIO-66/HKUST-1 composite, the four elements of Cu, Zr, O and C coexist. For the fitting of the O 1s XPS spectra for the 2% UIO-66/HKUST-1 sample and the monomer (Figure 12b), the results indicate that the oxygen species in the composite can be resolved into three chemical states: lattice oxygen (OL) at 530.26 eV, oxygen vacancy (OV) at 531.89 eV, and chemisorbed oxygen (OC) at 533.46 eV [58]. Quantitative analysis revealed that the oxygen vacancy fraction in 2% UIO-66/HKUST-1 reached 70.25%, higher than both pure HKUST-1 (64.36%) and UIO-66 (61.25%). This result indicates that some lattice oxygen in the composite detaches from the framework and forms oxygen vacancies, providing direct structural evidence that composites regulate the material’s electronic structure and introduce defects [59,60]. OV serves as an active site for reactions, providing more sites for oxygen adsorption and activation [61]. In the high-resolution spectrum of the Zr 3d orbital (Figure 12c), the characteristic peaks of Zr 3d5/2 and Zr 3d3/2 were observed at 182.81 eV and 185.24 eV in the 2% UIO-66/HKUST-1 composite, respectively, which were consistent with the chemical state of Zr4+ in the monomer UIO-66 [62]. Further comparison of the XPS spectra of Cu and Zr (Figure 12c,d) reveals that the characteristic peak positions of Cu and Zr in the composite have slightly shifted compared to their monomer, indicating that there may be electronic interaction and charge transfer between UIO-66 and HKUST-1, forming an effective hybrid structure [32].
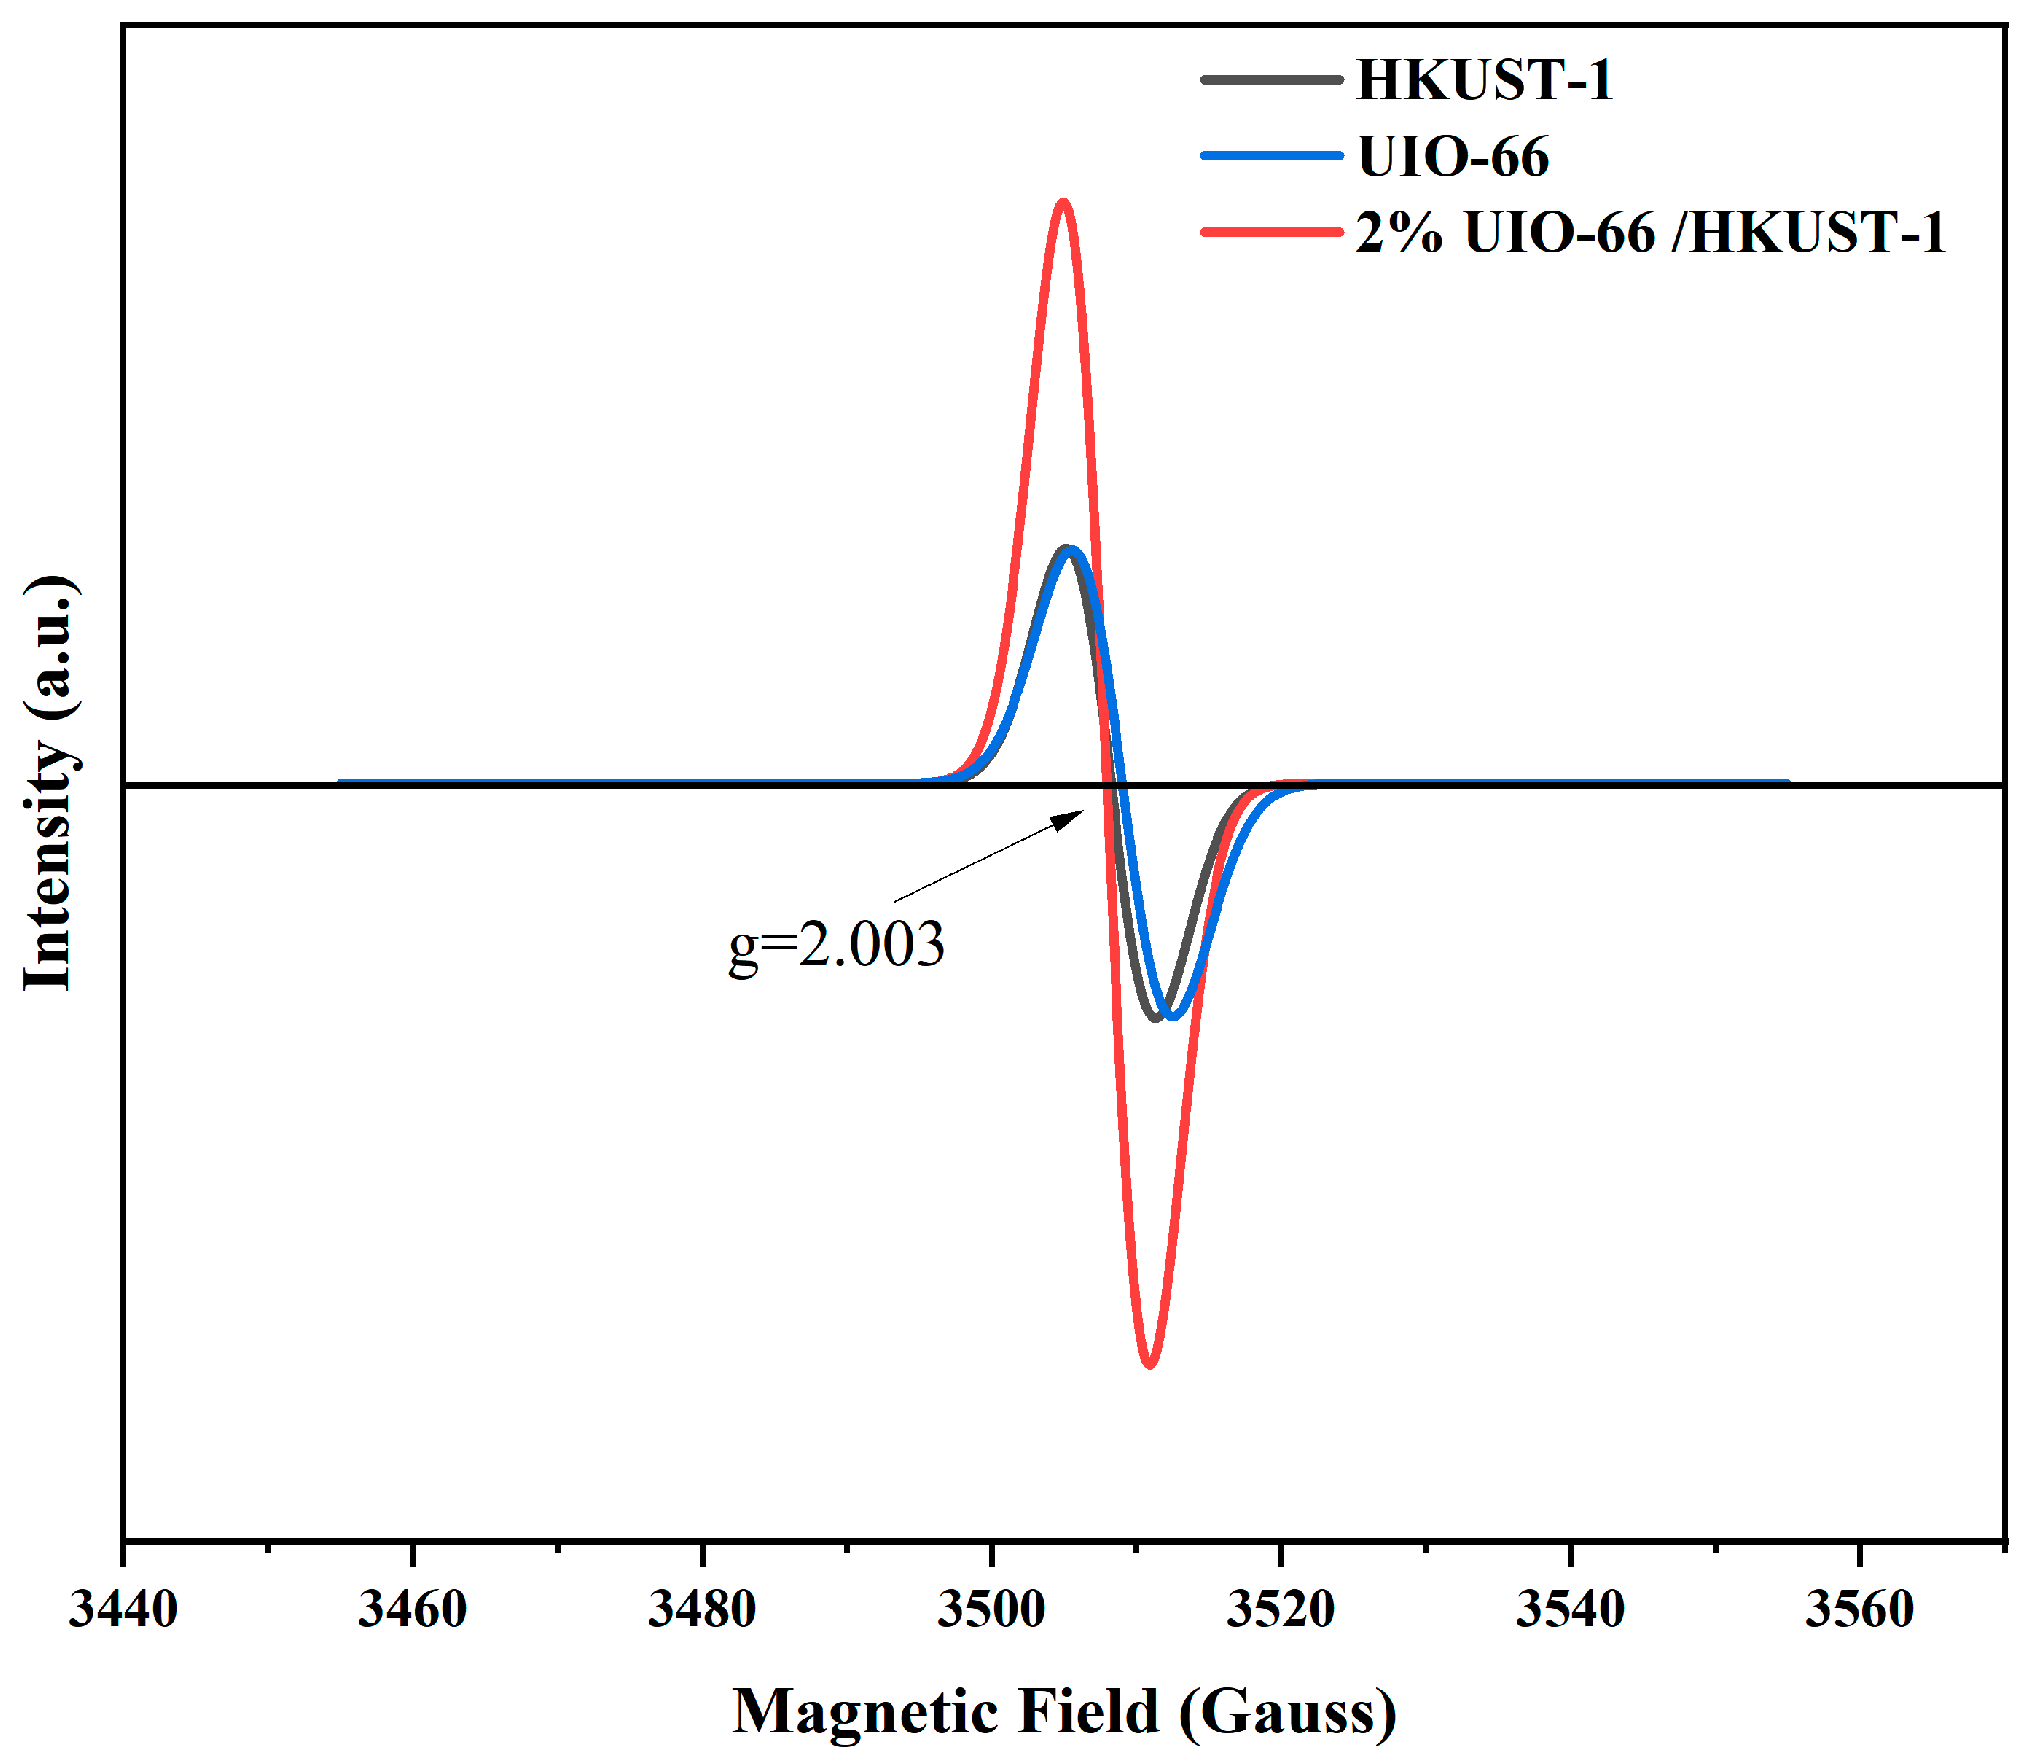
As shown in the electron paramagnetic resonance (EPR) spectrum in Figure 13, characteristic paramagnetic signals appear at g ≈ 2.003 for the UIO-66 and HKUST-1 monomers, as well as the 2% UIO-66/HKUST-1 composite. This signal is a typical signature of oxygen vacancy defects [63]. The peak shapes and positions of the three samples are relatively consistent, indicating that the electronic localization environment of oxygen vacancies remains fundamentally unchanged, with the defect type being uniform, though their quantities differ significantly. The EPR signal intensity of the 2% UIO-66/HKUST-1 composite is markedly higher than that of the two monomers. This phenomenon may stem from the interfacial charge rearrangement induced by the composite formed between UIO-66 and HKUST-1, which generates a large number of vacancy defects [64]. As coordination-unsaturated active sites, oxygen vacancies enhance the adsorption and activation of reactant molecules while lowering the reaction energy barrier [65]. The formation of high-concentration oxygen vacancies within the composite provides a structural foundation for enhancing the performance of CTL sensors.
Based on the above characterization and analysis results, the study shows that the cooperative active sites in the composite enhance the material’s selective adsorption ability for target molecules, facilitating their rapid enrichment at the reaction interface and creating favorable conditions for subsequent catalytic reactions. The stable zirconium-based framework of UIO-66 maintains the structural integrity of the active sites, preventing agglomeration or deactivation during the catalytic oxidation process [66]. The high concentration of oxygen vacancies in the material significantly increases the defect density. This not only further boosts the number of active sites, providing ample active centers for target molecule adsorption, activation, and catalytic reactions, but also enables oxygen vacancies to efficiently adsorb and activate oxygen molecules within the system [67,68]. Concurrently, the reduced bandgap also enhances the material’s ability to efficiently capture electrons from the conduction band during surface adsorption of oxygen molecules, a process that increases the thickness of the electron depletion layer [30]. The synergistic interaction of these multiple factors significantly boosts the generation and activation efficiency of reactive oxygen species, providing ample active material for catalytic oxidation reactions and accelerating their reaction rates.
O 2 ( g a s ) O 2 ( a d s )
O 2 + e O 2
O 2 + e O
O + e O 2
C H 2 C l 2 + O 2 + e C O 2 * + H 2 O + H C l
C O 2 * C O 2 + h v
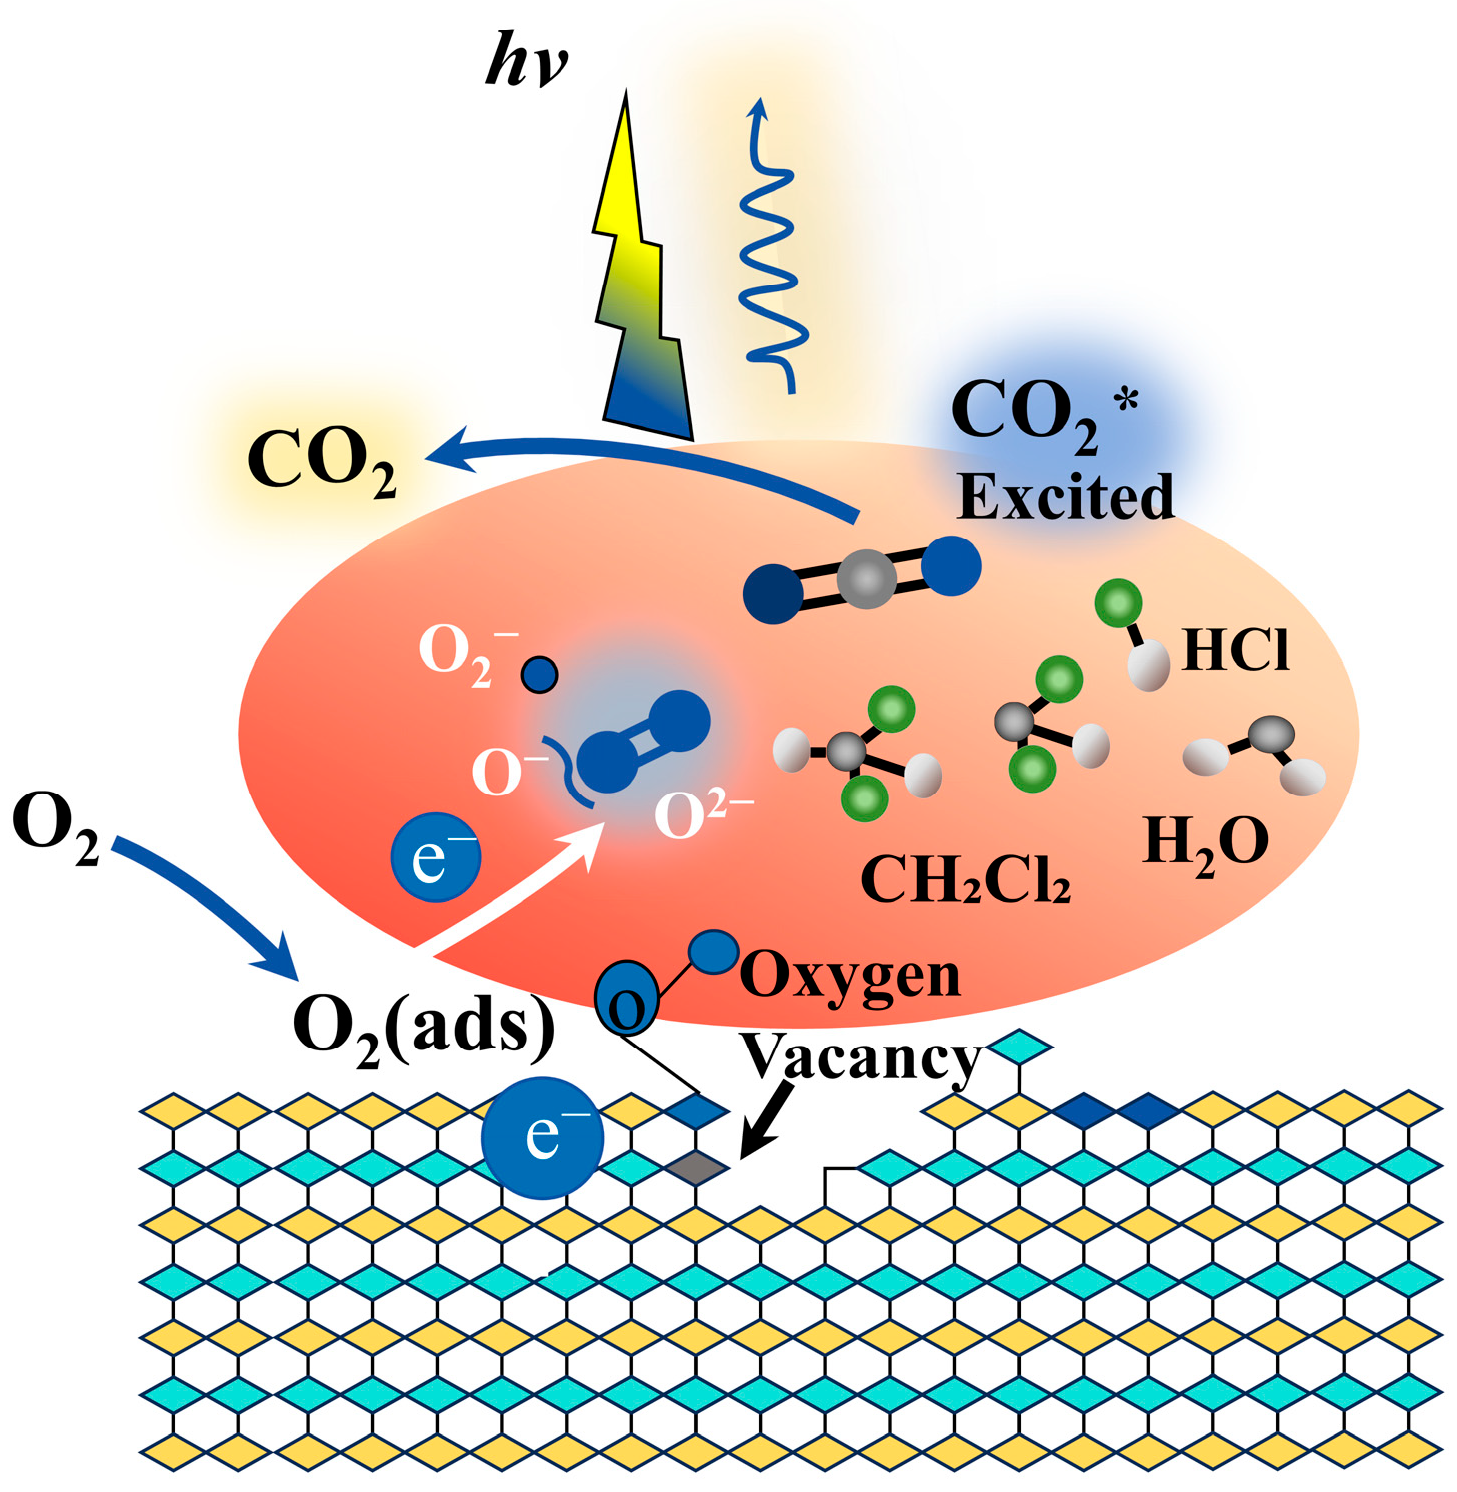
According to the CTL-related theories reported by predecessors and the analysis in the previous text, dichloromethane forms high-energy excited state intermediates during the surface reaction of UIO-66/HKUST-1 materials. These intermediates release energy and generate luminescent signals when rapidly returning to the ground state. Figure 14 illustrates the possible reaction mechanism for the UIO-66/HKUST-1 composite. The CTL reaction path is speculated as follows: upon exposure of the composite to air, oxygen molecules adsorb onto its surface to form adsorbed oxygen species O2(ads) (Equation (6)). After that, these adsorbed molecules capture electrons from the conduction band of the catalyst, undergoing transformation into various oxygen species (O2, O, and O2−) (Equations (7)–(9)) [69]. This process induces the formation of a surface charge depletion layer, thereby increasing the resistance. After introducing dichloromethane into the detection system, it reacts with the oxygen species adsorbed on the surface to form excited-state CO2 molecules, H2O and HCl (Equation (10)) [70,71,72]. During this process, the captured electrons are returned to the conduction band, reducing the thickness of the depletion layer and thus reducing the resistance. In addition, when the excited-state CO2 molecules return to the ground state, they release photons, finally generating CTL signals (Equation (11)) [73].

4. Conclusions

In this study, different proportions of UIO-66/HKUST-1 nanocomposites were successfully synthesized via a facile hydrothermal method to enhance the sensing performance of dichloromethane. Among them, the composite doped with 2% UIO-66 exhibits the optimal CTL sensing characteristics. The excellent sensing performance stems from the increased synergistic active sites and the elevated defect density in the composite, which jointly promote the generation and activation efficiency of reactive oxygen species. Under the optimized conditions of 234 °C and a carrier gas flow rate of 250 mL min−1, the sensor exhibits a rapid response rate with a response time of 5 s and a recovery time of 19 s. It has a good linear response to dichloromethane with a concentration of 8.4–84 ppm (y = 70.018x − 375.63 (R2 = 0.9843)), with a detection limit as low as 1.71 ppm, and displays high selectivity towards potential interferents. The sensor demonstrated excellent stability across eight consecutive tests, with a relative standard deviation of only 3.98%. This indicates that the 2% UIO-66/HKUST-1 composite not only holds promise as a potential sensing material for dichloromethane detection but also provides new insights and references for designing high-performance MOF-based sensing platforms through interfacial engineering and surface active site regulation strategies. This material holds promise for industrial online monitoring in high-concentration dichloromethane scenarios, such as chemical synthesis, paint dilution processes, solvent recovery stages in pharmaceutical plants, and extraction separation processes in paint production workshops. It can also enable real-time detection and capture of concentration fluctuations caused by pipeline leaks or equipment volatilization.

Author Contributions

Conceptualization, T.Z., P.Z. and B.S.; methodology, T.Z., J.F., P.Z., Y.W., L.B., M.Y., B.S., L.K. and S.Z.; software, T.Z., J.F. and B.S.; validation, P.Z., B.S., L.K. and S.Z.; formal analysis, T.Z., J.F., Y.W., X.W., M.Y. and Y.G.; investigation, T.Z., J.F. and P.Z.; resources, B.S., L.K. and S.Z.; data curation, P.Z. and B.S.; writing—original draft preparation, T.Z., P.Z., L.B. and B.S.; writing—review and editing, T.Z., L.B., X.W., Y.G. and B.S.; visualization, Y.W. and B.S.; supervision, B.S., L.K. and S.Z.; project administration, X.W., Y.G. and B.S.; funding acquisition, B.S. All authors have read and agreed to the published version of the manuscript.

Funding

The authors are especially grateful to the Anhui Provincial Key Research and Development Project (2023t07020011), the Anhui Province Ecological Environment Science and Technology Project (2025hb002), the Anhui Provincial Science and Technology Innovation Tackle Plan (202523anu11050016), the Anhui Provincial Department of Education Science Research Project (2025AHGXZK30705), the Open Project Program of Anhui Institute of Strategic Study on Carbon Dioxide Emissions Peak and Carbon Neutrality in Urban–Rural Development (STY-2024-06), the Open Project Program of Anhui Institute of Urban–Rural Green Development and Urban Renewal (2304001), the Scientific Research Start-up Foundation for Introduction of Talent, Anhui Jianzhu University (2016QD113).

Institutional Review Board Statement

Not applicable.

Informed Consent Statement

Not applicable.

Data Availability Statement

The original contributions presented in this study are included in the article material. Further inquiries can be directed to the corresponding authors.

Conflicts of Interest

The authors declare no conflicts of interest.

Abbreviations

The following abbreviations are used in this manuscript:
CTLCataluminescence
VOCsVolatile Organic Compounds
MOFsMetal–Organic Frameworks
UV–Vis DRSUltraviolet–Visible Diffuse Reflectance Spectroscopy
BPCLBiochemical Photon Counter Luminometer
RSDRelative Standard Deviation
EgBand Gap Energy
EPRElectron Paramagnetic Resonance

References

  1. Zhang, Q.; He, J.; Wan, C.; Long, X.; Ban, Z.; Tang, S.; Chen, Y. Porous aluminum nitride: A novel cataluminescence sensor for efficient detection of trace isobutyraldehyde. Microchem. J. 2025, 210, 113013. [Google Scholar] [CrossRef]
  2. Halios, C.H.; Landeg-Cox, C.; Lowther, S.D.; Middleton, A.; Marczylo, T.; Dimitroulopoulou, S. Chemicals in European residences—Part I: A review of emissions, concentrations and health effects of volatile organic compounds (VOCs). Sci. Total Environ. 2022, 839, 156201. [Google Scholar] [CrossRef] [PubMed]
  3. Wei, S.; Wu, Y.; Chang, G.; Li, H.; Ai, B.; Di, X. Flower-like In2O3/SnO2 n-n heterojunctions with exposed (110) planes for enhanced dichloromethane sensing. J. Alloys Compd. 2025, 1036, 181862. [Google Scholar] [CrossRef]
  4. Manisha, T.; Elsy Raynil, J.; Faraat, A.; Anuj, P.; Robin, K.; Gyanendra Nath, S. Development and Validation of an Automated Gas Chromatography Method for Determination of Dichloromethane in Ampicillin Sodium by Using Capillary Column Technology. Curr. Pharm. Anal. 2020, 16, 901–908. [Google Scholar] [CrossRef]
  5. Vempatapu, B.P.; Kumar, J.; Upreti, B.; Kanaujia, P.K. Application of high-performance liquid chromatography in petroleum analysis: Challenges and opportunities. TrAC Trends Anal. Chem. 2024, 177, 117810. [Google Scholar] [CrossRef]
  6. Alenezy, E.K.; Kandjani, A.E.; Shaibani, M.; Trinchi, A.; Bhargava, S.K.; Ippolito, S.J.; Sabri, Y. Human breath analysis; Clinical application and measurement: An overview. Biosens. Bioelectron. 2025, 278, 117094. [Google Scholar] [CrossRef] [PubMed]
  7. Hu, J.; Zhang, L.; Lv, Y. Recent advances in cataluminescence gas sensor: Materials and methodologies. Appl. Spectrosc. Rev. 2019, 54, 306–324. [Google Scholar] [CrossRef]
  8. Xiong, S.; Song, H.; Hu, J.; Xie, X.; Zhang, L.; Su, Y.; Lv, Y. Heterothermic Cataluminescence Sensor System for Efficient Determination of Aldehyde Molecules. Anal. Chem. 2024, 96, 11239–11246. [Google Scholar] [CrossRef]
  9. Hu, J.; Song, H.; Zhang, L.; Lv, Y. Recent progress of cataluminescence sensing based on gas–solid interfaces. Chem. Commun. 2024, 60, 11223–11236. [Google Scholar] [CrossRef]
  10. Zhu, Y.; Shi, J.; Zhang, Z.; Zhang, C.; Zhang, X. Development of a gas sensor utilizing chemiluminescence on nanosized titanium dioxide. Anal. Chem. 2002, 74, 120–124. [Google Scholar] [CrossRef]
  11. Ali, F.A.; Mishra, D.K.; Nayak, R.; Nanda, B. Solid-state gas sensors: Sensing mechanisms and materials. Bull. Mater. Sci. 2022, 45, 15. [Google Scholar] [CrossRef]
  12. Li, Y.; Zhang, Y.; Du, Y.; Zhang, Y. Enhanced cataluminescence sensing of volatile organic compounds using CeO2/MxOy nanocomposites. Anal. Chim. Acta 2025, 1374, 344520. [Google Scholar] [CrossRef] [PubMed]
  13. Mohanty, B.; Kumari, S.; Yadav, P.; Kanoo, P.; Chakraborty, A. Metal-organic frameworks (MOFs) and MOF composites based biosensors. Coord. Chem. Rev. 2024, 519, 216102. [Google Scholar] [CrossRef]
  14. Xu, J.; Xu, Y.; Bu, X.-H. Advances in Emerging Crystalline Porous Materials. Small 2021, 17, 2102331. [Google Scholar] [CrossRef]
  15. Li, Q.; Sun, M.; Zhang, L.; Song, H.; Lv, Y. A novel Ce(IV)-MOF-based cataluminescence sensor for detection of hydrogen sulfide. Sens. Actuators B Chem. 2022, 362, 131746. [Google Scholar] [CrossRef]
  16. Zhu, H.; Yan, S.; Wen, X.; Zheng, B.; Yang, X.; Huang, X.; Gong, Z. High-efficiency cataluminescence acetone sensor based on MOF-derived Y2O3 nanoparticles. Microchem. J. 2025, 218, 115409. [Google Scholar] [CrossRef]
  17. Shi, G.; Hu, G.; Gu, L.; Rao, Y.; Zhang, Y.; Ali, F. Cataluminescence sensor based on LaCO3OH microspheres for volatile organic compounds detection and pattern recognition. Sens. Actuators B Chem. 2024, 403, 135177. [Google Scholar] [CrossRef]
  18. Shi, Z.; Luo, Z.; Liu, Y.; Liu, Z.; Chen, X.; Zhang, Y.; Zhou, Y.; Xu, M. Ozone-assisted cataluminescence sensor based on morphology-controlled TiO2@Mg-MOF-74 composite for rapid detection of N-hexane. Microchim. Acta 2025, 192, 534. [Google Scholar] [CrossRef]
  19. Huang, X.; Huang, Z.; Zhang, L.; Liu, R.; Lv, Y. Highly efficient cataluminescence gas sensor for acetone vapor based on UIO-66 metal-organic frameworks as preconcentrator. Sens. Actuators B Chem. 2020, 312, 127952. [Google Scholar] [CrossRef]
  20. Xue, W.; Wang, J.; Huang, H.; Cui, Y.; Mei, D. CO Oxidation over HKUST-1 Catalysts: The Role of Defective Sites. J. Phys. Chem. C 2022, 126, 9652–9664. [Google Scholar] [CrossRef]
  21. Li, S.; Mo, Q.; Lin, H.; Chen, C.; Zhang, L. Engineering S-Scheme Heterojunction via MOF-on-MOF for Photocatalytic Nitroarene Hydrogenation. Inorg. Chem. 2025, 64, 11426–11435. [Google Scholar]
  22. Fan, B.; Zhang, J.-R.; Chen, J.-L.; Yang, Z.-T.; Li, B.; Wang, L.; Ye, M.; Zhang, L.-L. Highly Selective and Fast Response/Recovery Cataluminescence Sensor Based on SnO2 for H2S Detection. Molecules 2023, 28, 7143. [Google Scholar] [CrossRef]
  23. Meng, F.; Qi, T.; Zhang, J.; Zhu, H.; Yuan, Z.; Liu, C.; Qin, W.; Ding, M. MoS2-Templated Porous Hollow MoO3 Microspheres for Highly Selective Ammonia Sensing via a Lewis Acid-Base Interaction. IEEE Trans. Ind. Electron. 2022, 69, 960–970. [Google Scholar]
  24. Castells-Gil, J.; Novio, F.; Padial, N.M.; Tatay, S.; Ruíz-Molina, D.; Martí-Gastaldo, C. Surface Functionalization of Metal–Organic Framework Crystals with Catechol Coatings for Enhanced Moisture Tolerance. ACS Appl. Mater. Interfaces 2017, 9, 44641–44648. [Google Scholar] [CrossRef] [PubMed]
  25. Holder, C.F.; Schaak, R.E. Tutorial on Powder X-Ray Diffraction for Characterizing Nanoscale Materials. ACS Nano 2019, 13, 7359–7365. [Google Scholar] [CrossRef] [PubMed]
  26. Li, Q.; Liu, H.; Zhou, N.; Fu, D.; Fu, Z.; Tang, S.; Li, Y. Interfacial engineering induced robust S-scheme heterojunction in Bi2Sn2O7/BiOBr for highly efficient sacrificial-agent-free CO2 photoreduction. J. Colloid Interface Sci. 2026, 706, 139719. [Google Scholar] [CrossRef] [PubMed]
  27. Rekik, N.; Alsaif, N.A.M.; Flakus, H.T.; Farooq, U.; Chand, R. A unified quantum model susceptible to elucidate the dissimilarity of IR spectral density of dicarboxylic acid crystals: Phthalic and terephthalic acid crystals cases. Spectrochim. Acta Part A Mol. Biomol. Spectrosc. 2020, 242, 118728. [Google Scholar]
  28. Téllez Soto, C.A.; Hollauer, E.; Mondragon, M.A.; Castaño, V.M. Fourier transform infrared and Raman spectra, vibrational assignment and ab initio calculations of terephthalic acid and related compounds. Spectrochim. Acta Part A Mol. Biomol. Spectrosc. 2001, 57, 993–1007. [Google Scholar] [CrossRef]
  29. Ediati, R.; Zulfa, L.L.; Putrilia, R.D.; Hidayat, A.R.P.; Sulistiono, D.O.; Rosyidah, A.; Martak, F.; Hartanto, D. Synthesis of UiO-66 with addition of HKUST-1 for enhanced adsorption of RBBR dye. Arab. J. Chem. 2023, 16, 104637. [Google Scholar] [CrossRef]
  30. Sun, L.; Sun, J.; Han, N.; Liao, D.; Bai, S.; Yang, X.; Luo, R.; Li, D.; Chen, A. rGO decorated W doped BiVO4 novel material for sensing detection of trimethylamine. Sens. Actuators B Chem. 2019, 298, 126749. [Google Scholar]
  31. Han, D.; Li, X.; Zhang, F.; Gu, F.; Wang, Z. Ultrahigh sensitivity and surface mechanism of gas sensing process in composite material of combining In2O3 with metal-organic frameworks derived Co3O4. Sens. Actuators B Chem. 2021, 340, 129990. [Google Scholar] [CrossRef]
  32. Quan, Y.; Wang, G.; Jin, Z. Tactfully Assembled CuMOF/CdS S-Scheme Heterojunction for High-Performance Photocatalytic H2 Evolution under Visible Light. ACS Appl. Energy Mater. 2021, 4, 8550–8562. [Google Scholar] [CrossRef]
  33. Unnikrishnan, P.M.; Premanand, G.; Das, S.K. Fabricating MOF–GO Composites by Modulating Graphene Oxide Content to Achieve Superprotonic Conductivity. Inorg. Chem. 2025, 64, 3506–3517. [Google Scholar] [CrossRef]
  34. Shi, K.; Lai, J.; Xia, X.; Jeong, S.; Zhu, C.; Zhou, L.; Guo, J.; Zhang, J.; Yang, C.; Li, X.; et al. Synergistic Effects of Solid and Solvent Additives on Film Morphology Enable Binary Organic Solar Cells with Efficiency of over 19%. Adv. Funct. Mater. 2025, 35, 2411787. [Google Scholar] [CrossRef]
  35. He, L.; Wang, X.; Hong, D. Preparation and Photocatalytic Degradation of Fe-Doped BiOCl Photocatalytic Materials. Langmuir 2025, 41, 21471–21482. [Google Scholar] [CrossRef]
  36. Makuła, P.; Pacia, M.; Macyk, W. How to Correctly Determine the Band Gap Energy of Modified Semiconductor Photocatalysts Based on UV–Vis Spectra. J. Phys. Chem. Lett. 2018, 9, 6814–6817. [Google Scholar] [CrossRef]
  37. Huang, Q.; Zhu, F.; Xiao, F.; Zhang, G.; Hou, H.; Bi, J.; Yan, S.; Hao, H. Construction of S-scheme heterogeneous HKUST-1/g-C3N4 with the piezoelectric effect for enhanced piezo-photocatalytic performance. Solid State Sci. 2023, 144, 107303. [Google Scholar] [CrossRef]
  38. Sun, Y.; Huang, T.; Feng, W.; Zhang, G.; Ji, H.; Zhu, Y.; Zhou, H.; Dou, F.; Su, Y.; Liu, Z.; et al. Enhanced Photocatalytic Nitrogen Fixation over Nano-UiO-66(Zr) via Natural Chlorophyll Sensitization. Inorg. Chem. 2024, 63, 24876–24884. [Google Scholar] [CrossRef]
  39. Hu, J.; Zhang, L.; Song, H.; Lv, Y. Evaluating the Band Gaps of Semiconductors by Cataluminescence. Anal. Chem. 2021, 93, 14454–14461. [Google Scholar] [CrossRef] [PubMed]
  40. Wei, C.; Song, H.; Huang, Z.; Zhang, L.; Li, L.; Lv, Y. Ozone-Activated Cataluminescence Sensor System for Dichloroalkanes Based on Silica Nanospheres. ACS Sens. 2021, 6, 2893–2901. [Google Scholar] [CrossRef] [PubMed]
  41. Zhou, Q.; Song, H.; Sun, T.; Zhang, L.; Lv, Y. Cataluminescence on 2D WS2 nanosheets surface for H2S sensing. Sens. Actuators B Chem. 2022, 353, 131111. [Google Scholar] [CrossRef]
  42. Cheng, P.; Dang, F.; Wang, Y.; Gao, J.; Xu, L.; Wang, C.; Lv, L.; Li, X.; Zhang, B.; Liu, B. Gas sensor towards n-butanol at low temperature detection: Hierarchical flower-like Ni-doped Co3O4 based on solvent-dependent synthesis. Sens. Actuators B Chem. 2021, 328, 129028. [Google Scholar] [CrossRef]
  43. Su, Y.; Pu, S.; Zhang, L.; Lv, Y. A novel Ln-MOF-based cataluminescence sensor for detection of propionaldehyde. Microchem. J. 2024, 201, 110564. [Google Scholar] [CrossRef]
  44. Hu, J.; Zhang, L.; Song, H.; Hu, J.; Lv, Y. Ratiometric Cataluminescence for Rapid Recognition of Volatile Organic Compounds Based on Energy Transfer Process. Anal. Chem. 2019, 91, 4860–4867. [Google Scholar] [CrossRef]
  45. Kumar, D.; Chaturvedi, P.; Saho, P.; Jha, P.; Chouksey, A.; Lal, M.; Rawat, J.S.B.S.; Tandon, R.P.; Chaudhury, P.K. Effect of single wall carbon nanotube networks on gas sensor response and detection limit. Sens. Actuators B Chem. 2017, 240, 1134–1140. [Google Scholar]
  46. Shuai, Y.; Peng, R.; He, Y.; Liu, X.; Wang, X.; Guo, W. NiO/BiVO4 p-n heterojunction microspheres for conductometric triethylamine gas sensors. Sens. Actuators B Chem. 2023, 384, 133625. [Google Scholar]
  47. GBZ 2.1-2019; Occupational Exposure Limits for Hazardous Agents in the Workplace—Part 1: Chemical Hazardous Agents. National Health Commission of the People’s Republic of China: Beijing, China, 2019.
  48. Lin, F.; Wang, Q.; Huang, X.; Jin, J. Investigation of chlorine-poisoning mechanism of MnOx/TiO2 and MnOx-CeO2/TiO2 catalysts during o-DCBz catalytic decomposition: Experiment and first-principles calculation. J. Environ. Manag. 2021, 298, 113454. [Google Scholar]
  49. Shenoy, C.S.; Khan, T.S.; Verma, K.; Tsige, M.; Jha, K.C.; Haider, M.A.; Gupta, S. Understanding the origin of structure sensitivity in hydrodechlorination of trichloroethylene on a palladium catalyst. React. Chem. Eng. 2021, 6, 2270–2279. [Google Scholar] [CrossRef]
  50. Hutskalova, V.; Sparr, C. Aromatic ring-opening metathesis. Nature 2025, 638, 697–703. [Google Scholar] [PubMed]
  51. Liu, X.; Geng, X.; Zhang, C.; Ren, Z.; Liu, X.; Sun, Y. Single-Atom Ni Catalysts Enable a Cl-Shift Pathway for Low-Temperature Chlorobenzene Decomposition. Environ. Sci. Technol. 2025, 59, 23974–23983. [Google Scholar] [CrossRef]
  52. Momotko, M.; Łuczak, J.; Przyjazny, A.; Boczkaj, G. First deep eutectic solvent-based (DES) stationary phase for gas chromatography and future perspectives for DES application in separation techniques. J. Chromatogr. A 2021, 1635, 461701. [Google Scholar] [CrossRef] [PubMed]
  53. Xu, M.; Zhong, Y.; Zhang, H.; Tao, Y.; Shen, Q.; Zhang, S.; Zhang, P.; Hu, X.; Liu, X.; Sun, X.; et al. Recoverable Detection of Dichloromethane by MEMS Gas Sensor Based on Mo and Ni Co-Doped SnO2 Nanostructure. Sensors 2025, 25, 2634. [Google Scholar]
  54. Wang, H.; Zhan, S.; Wu, X.; Wu, L.; Liu, Y. Nanoporous fluorescent sensor based on upconversion nanoparticles for the detection of dichloromethane with high sensitivity. RSC Adv. 2021, 11, 565–571. [Google Scholar] [CrossRef] [PubMed]
  55. Lopes, N.; Hawkins, S.A.; Jegier, P.; Menn, F.-M.; Sayler, G.S.; Ripp, S. Detection of dichloromethane with a bioluminescent (lux) bacterial bioreporter. J. Ind. Microbiol. Biotechnol. 2012, 39, 45–53. [Google Scholar] [CrossRef]
  56. Capan, R.; Capan, I.; Bayrakci, M. Sensor parameters and adsorption behaviour of rhodamine-based polyacrylonitrile (PAN) nanofiber against dichloromethane vapour. Microchem. J. 2024, 207, 111806. [Google Scholar] [CrossRef]
  57. Kim, E.-B.; Abdullah; Ameen, S.; Akhtar, M.S.; Shin, H.S. Environment-friendly and highly sensitive dichloromethane chemical sensor fabricated with ZnO nanopyramids-modified electrode. J. Taiwan Inst. Chem. Eng. 2019, 102, 143–152. [Google Scholar] [CrossRef]
  58. Wang, T.; Wang, X.; Wang, Y.; Yi, G.; Shi, C.; Yang, Y.; Sun, G.; Zhang, Z. Construction of Zn2SnO4 decorated ZnO nanoparticles for sensing triethylamine with dramatically enhanced performance. Mater. Sci. Semicond. Process. 2022, 140, 106403. [Google Scholar]
  59. Hussain, A.; Zhang, X.; Shi, Y.; Bushira, F.A.; Barkae, T.H.; Ji, K.; Guan, Y.; Chen, W.; Xu, G. Generation of Oxygen Vacancies in Metal–Organic Framework-Derived One-Dimensional Ni0.4Fe2.6O4 Nanorice Heterojunctions for ppb-Level Diethylamine Gas Sensing. Anal. Chem. 2023, 95, 1747–1754. [Google Scholar] [CrossRef] [PubMed]
  60. Wang, J.; Wen, D.; Li, X.; Xie, Y.; Huang, B.; Xie, D.; Lin, D.; Xu, C.; Guo, W.; Xie, F. Redox-mediated oxygen evolution reaction: Engineering oxygen vacancies and heterojunctions in CeFeCo-UiO-66/layered double hydroxide via a two-step corrosion strategy. J. Colloid Interface Sci. 2025, 695, 137687. [Google Scholar] [CrossRef]
  61. Zhou, C.; Meng, F.; Chen, K.; Yang, X.; Wang, T.; Sun, P.; Liu, F.; Yan, X.; Shimanoe, K.; Lu, G. High sensitivity and low detection limit of acetone sensor based on NiO/Zn2SnO4 p-n heterojunction octahedrons. Sens. Actuators B Chem. 2021, 339, 129912. [Google Scholar] [CrossRef]
  62. Mocniak, K.A.; Kubajewska, I.; Spillane, D.E.M.; Williams, G.R.; Morris, R.E. Incorporation of cisplatin into the metal–organic frameworks UiO66-NH2 and UiO66—Encapsulation vs. conjugation. RSC Adv. 2015, 5, 83648–83656. [Google Scholar] [CrossRef]
  63. Tang, L.-B.; Yang, P.; Chen, Y.-J.; Li, P.-Y.; Peng, T.; Wei, H.-X.; Wang, Z.; He, Z.-J.; Yan, C.; Mao, J.; et al. Cation doping constructed vacancy engineering for designing Sn3Se5@PPy heterostructures toward lithium/sodium-ion batteries. J. Power Sources 2022, 552, 232210. [Google Scholar] [CrossRef]
  64. Wu, K.; Wang, C.; Lang, X.; Cheng, J.; Wu, H.; Lyu, C.; Lau, W.-M.; Liang, Z.; Zhu, X.; Zheng, J. Insight into selenium vacancies enhanced CoSe2/MoSe2 heterojunction nanosheets for hydrazine-assisted electrocatalytic water splitting. J. Colloid Interface Sci. 2024, 654, 1040–1053. [Google Scholar] [CrossRef]
  65. Qiao, S.; Zhou, Q.; Ma, M.; Liu, H.K.; Dou, S.X.; Chong, S. Advanced Anode Materials for Rechargeable Sodium-Ion Batteries. ACS Nano 2023, 17, 11220–11252. [Google Scholar] [CrossRef]
  66. Sultana, N.; Priyadarshini, P.; Parida, K. UiO-66-NH2 and its functional nanohybrids: Unlocking photocatalytic potential for clean energy and environmental remediation. Sustain. Energy Fuels 2025, 9, 3458–3494. [Google Scholar] [CrossRef]
  67. Yang, J.; Ye, L.; Kim, D.-P.; Sun, D. Oxygen Vacancy Engineering in Metal–Organic Frameworks Regulates the Generation of Reactive Oxygen Species (ROS) for Photocatalytic C=N and C–N Coupling. Inorg. Chem. 2025, 64, 21274–21283. [Google Scholar] [CrossRef] [PubMed]
  68. Zhang, L.; Wang, S.; Lu, C. Detection of Oxygen Vacancies in Oxides by Defect-Dependent Cataluminescence. Anal. Chem. 2015, 87, 7313–7320. [Google Scholar] [CrossRef] [PubMed]
  69. Guo, L.; Wang, Y.; Shang, Y.; Yang, X.; Zhang, S.; Wang, G.; Wang, Y.; Zhang, B.; Zhang, Z. Preparation of Pd/PdO@ZnO-ZnO nanorods by using metal organic framework templated catalysts for selective detection of triethylamine. Sens. Actuators B Chem. 2022, 350, 130840. [Google Scholar] [CrossRef]
  70. Ding, J.; Liu, J.; Yang, Y.; Wang, Z.; Yu, Y. Reaction mechanism of dichloromethane oxidation on LaMnO3 perovskite. Chemosphere 2021, 277, 130194. [Google Scholar] [CrossRef]
  71. Nevanperä, T.K.; Pitkäaho, S.; Ojala, S.; Keiski, R.L. Oxidation of Dichloromethane over Au, Pt, and Pt-Au Containing Catalysts Supported on γ-Al2O3 and CeO2-Al2O3. Molecules 2020, 25, 4644. [Google Scholar] [CrossRef]
  72. El Assal, Z.; Ojala, S.; Pitkäaho, S.; Pirault-Roy, L.; Darif, B.; Comparot, J.-D.; Bensitel, M.; Keiski, R.L.; Brahmi, R. Comparative study on the support properties in the total oxidation of dichloromethane over Pt catalysts. Chem. Eng. J. 2017, 313, 1010–1022. [Google Scholar] [CrossRef]
  73. Meng, F.; Lu, Z.; Zhang, R.; Li, G. Cataluminescence sensor for highly sensitive and selective detection of iso-butanol. Talanta 2019, 194, 910–918. [Google Scholar] [CrossRef] [PubMed]
Figure 1. BPCL sensor assembly schematic diagram.
Chemosensors 14 00058 g001
Figure 2. SEM images of (a) HKUST-1, (b) UIO-66, (c) 1% UIO-66/HKUST-1, (d) 2% UIO-66/HKUST-1, (e) 3% UIO-66/HKUST-1. (f) SEM image and (gj) elemental mappings of 2% UIO-66/HKUST-1.
Chemosensors 14 00058 g002
Figure 3. XRD patterns of UIO-66/HKUST-1 with different proportions.
Chemosensors 14 00058 g003
Figure 4. FT-IR spectra of UIO-66/HKUST-1 with different proportions.
Chemosensors 14 00058 g004
Figure 6. Comparison of CTL intensities of UIO-66, HKUST-1 and UIO-66/HKUST-1 (concentration: 84 ppm, temperature: 215 °C, flow rate: 300 mL/min, detection wavelength range: 300–650 nm).
Chemosensors 14 00058 g006
Figure 7. (ac) Effects of different proportions of UIO-66/HKUST-1 operating temperatures on CTL signal strength and S/N (concentration: 84 ppm, flow rate: 300 mL/min).
Chemosensors 14 00058 g007
Figure 8. (ac) Effect of UIO-66/HKUST-1 flow rate at different ratios on CTL signal intensity and S/N (concentration: 84 ppm; temperature: 234 °C).
Chemosensors 14 00058 g008
Figure 9. CTL response characteristics of different proportions of UIO-66/HKUST-1 under optimized conditions (Concentration: 84 ppm).
Chemosensors 14 00058 g009
Figure 11. (a) CTL responses of the sensor to different compounds; (b) signal strength of UIO-66/HKUST-1 sensor 8 tests within 300 s (temperature: 234 °C, flow rate: 250 mL/min, concentration: 84 PPM).
Chemosensors 14 00058 g011
Figure 12. XPS spectra of HKUST-1, UIO-66 and 2% UIO-66/HKUST-1: (a) full spectrum, (b) O 1s, (c) Zr 3d and (d) Cu 2p.
Chemosensors 14 00058 g012
Figure 13. The EPR analysis of HKUST-1, UIO-66, and 2% UIO-66/HKUST-1.
Chemosensors 14 00058 g013
Figure 14. CTL mechanism of UIO-66/HKUST-1 for detecting dichloromethane (“*” for excited state intermediates).
Chemosensors 14 00058 g014
Table 1. Performance comparison of mainstream dichloromethane detection technologies.
Sensor TypeSensitive MaterialOperating Temperature (°C)Limit (ppm)Response/Recovery Time (s)References
ChemiresistiveMo, Ni co-doped SnO2310278/42[53]
OpticalNaGdF4:Yb,Er@NaYF4:Yb Room Temperature2.91None[54]
BiosensorMethylobacterium extorquens DCMluxRoom Temperature1.08280/None[55]
Quartz crystal microbalanceRhodamine-based polyacrylonitrile nanofiberRoom Temperature1532/3[56]
ElectrochemicalZnO nanopyramids-modified electrodeRoom Temperature1.4710/None[57]
CTL2% UIO-66/HKUST-12341.715/19This work
Disclaimer/Publisher’s Note: The statements, opinions and data contained in all publications are solely those of the individual author(s) and contributor(s) and not of MDPI and/or the editor(s). MDPI and/or the editor(s) disclaim responsibility for any injury to people or property resulting from any ideas, methods, instructions or products referred to in the content.