Article

Electrochemical Characterization of pH Indicators in Deep Eutectic Solvent for Carbon Dioxide Sensing


Department of Agrifood, Environmental and Animal Sciences, University of Udine, Via Cotonificio 108, 33100 Udine, Italy
*
Authors to whom correspondence should be addressed.
Chemosensors 2026, 14(2), 39; https://doi.org/10.3390/chemosensors14020039
Submission received: 28 November 2025 / Revised: 15 January 2026 / Accepted: 28 January 2026 / Published: 3 February 2026

Abstract

In this study, we present a new approach for detecting carbon dioxide based on the voltammetric behavior of selected pH indicators in a deep eutectic solvent (DES). The sensing strategy exploits the electrochemical oxidation potentials of acid–base indicators, in contrast to their conventional use in spectrophotometric analyses. For this purpose, a screen-printed carbon electrode (SPCE) coated with a thin film of DES containing an acid–base indicator was employed. This approach takes advantage of the unique properties of DESs, which make them safe and appealing electrolytes for gas sensing applications. It also exploits the behavior of acid–base indicators, which can exist in protonated or deprotonated forms with distinct oxidation potentials; the electron-rich basic form oxidizes at a lower potential than its protonated counterpart. Phenol Red (PR), Bromocresol Purple (BCP), and Bromothymol Blue (BTB) were investigated, and their voltammetric behavior was studied in different pH buffers as well as in reline DES. The pH dependence of their oxidation potential was used as the analytical parameter, varying in response to the concentration of acidic species in the gas phase. The proposed strategy was evaluated by performing CO2 measurements, achieving limits of detection (LOD) and quantification (LOQ) of 2083 and 6875 ppm, respectively. The same approach was then applied to monitor food freshness via CO2 detection, with results comparing favorably to nondispersive infrared (NDIR) methods for carbon dioxide analysis.

Graphical Abstract

1. Introduction

Monitoring volatile acidic and basic species is critical across various sectors, including food safety, environmental protection, industrial processes, and biomedical applications [1,2,3,4,5]. In the field of food control, monitoring the respiration of fruits and vegetables is crucial for assessing post-harvest quality, shelf life, and freshness, as respiration directly reflects metabolic activity and ripening processes. Respiration involves the consumption of oxygen and the release of carbon dioxide, with elevated CO2 production typically indicating increased metabolic stress, advanced ripening, or microbial spoilage [6]. Accurate measurement of respiration is therefore especially important during post-harvest handling, storage, and transportation, where inappropriate atmospheric conditions can accelerate quality degradation and lead to significant food waste.
Currently, respiration is most commonly monitored using nondispersive infrared (NDIR) sensors for carbon dioxide and electrochemical or optical sensors for oxygen, often integrated into controlled- or modified-atmosphere packaging systems. Although these techniques offer high sensitivity and reliability, they are generally associated with relatively high costs and limited suitability for disposable or in-package monitoring applications. In this context, the development of alternative sensing strategies that are low-cost, safe, and suitable for real-time monitoring is highly desirable [7].
To date, the detection of colorless acid or basic species is performed by pH-sensitive reagents, known as pH indicators; they change color in response to variations in acidity or alkalinity, not only in aqueous solutions but also in organic solvents [8,9,10].
To enhance sensitivity and applicability, numerous colorimetric and optical sensing methods have been developed, often involving the immobilization of pH-sensitive molecules on transducer surfaces [11,12,13,14]. In parallel, electrochemical methods such as amperometry, potentiometry, and conductometry have also been successfully applied to detect acidic and basic species in both liquid and gas phases [15]. At the same time, the advent of sustainable chemistry has guided research towards the development of greener and more sustainable solvents than traditional ones, which are often volatile, toxic, and flammable. Thus, interest in using ionic liquids (ILs) has grown due to their low volatility, high conductivity, excellent chemical and electrochemical stability, and ability to dissolve a wide range of organic and inorganic species. Moreover, their properties can be tuned through an appropriate selection of constituent cations and anions [16,17]. Consequently, on the basis of IL properties, various optical and electrochemical devices have been developed to detect gases such as CO2, O2, SO2, NH3, and H2S [18,19,20,21,22]. More recently, studies have focused on DESs, a class of solvents composed of a hydrogen-bond donor (HBD) and a hydrogen-bond acceptor (HBA), whose physicochemical properties are similar to those of ionic liquids (ILs) [23], but with the added advantages of being more biodegradable, easier to prepare, cheaper, and simpler to handle [24,25,26]. Several studies have investigated the solubility of CO2 in DESs. Notably, Li et al. measured CO2 solubility in a DES composed of choline chloride (ChCl) and urea over a temperature range of 313.15–333.15 K and pressures from 10 to 130 bar [27]. Their results demonstrated that CO2 solubility in DESs is governed by three main factors: (i) pressure, with solubility increasing as CO2 pressure increases; (ii) temperature, with solubility decreasing at higher temperatures; and (iii) the molar ratio of ChCl to urea.
Further advantages arising from the favorable physicochemical properties of DES/water mixtures have also been demonstrated [28], where the DES structure is preserved even at relatively high water levels (ca 40–50 v/v % H2O) due to its incorporation within the DES as nanostructured domains. Studies investigating the nanostructure of reline DES/water mixtures over a broad range of water concentrations reveal that at low water contents (up to 6.48 wt%), the DES hydrogen-bond network remains largely intact, while in the range between 12 and 40 wt% water, the DES intermolecular bonding persists within clusters that are surrounded by water [29,30].
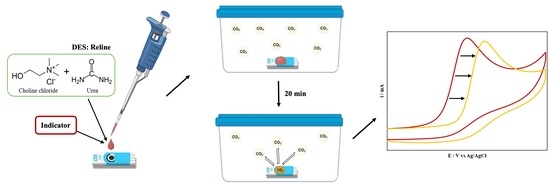
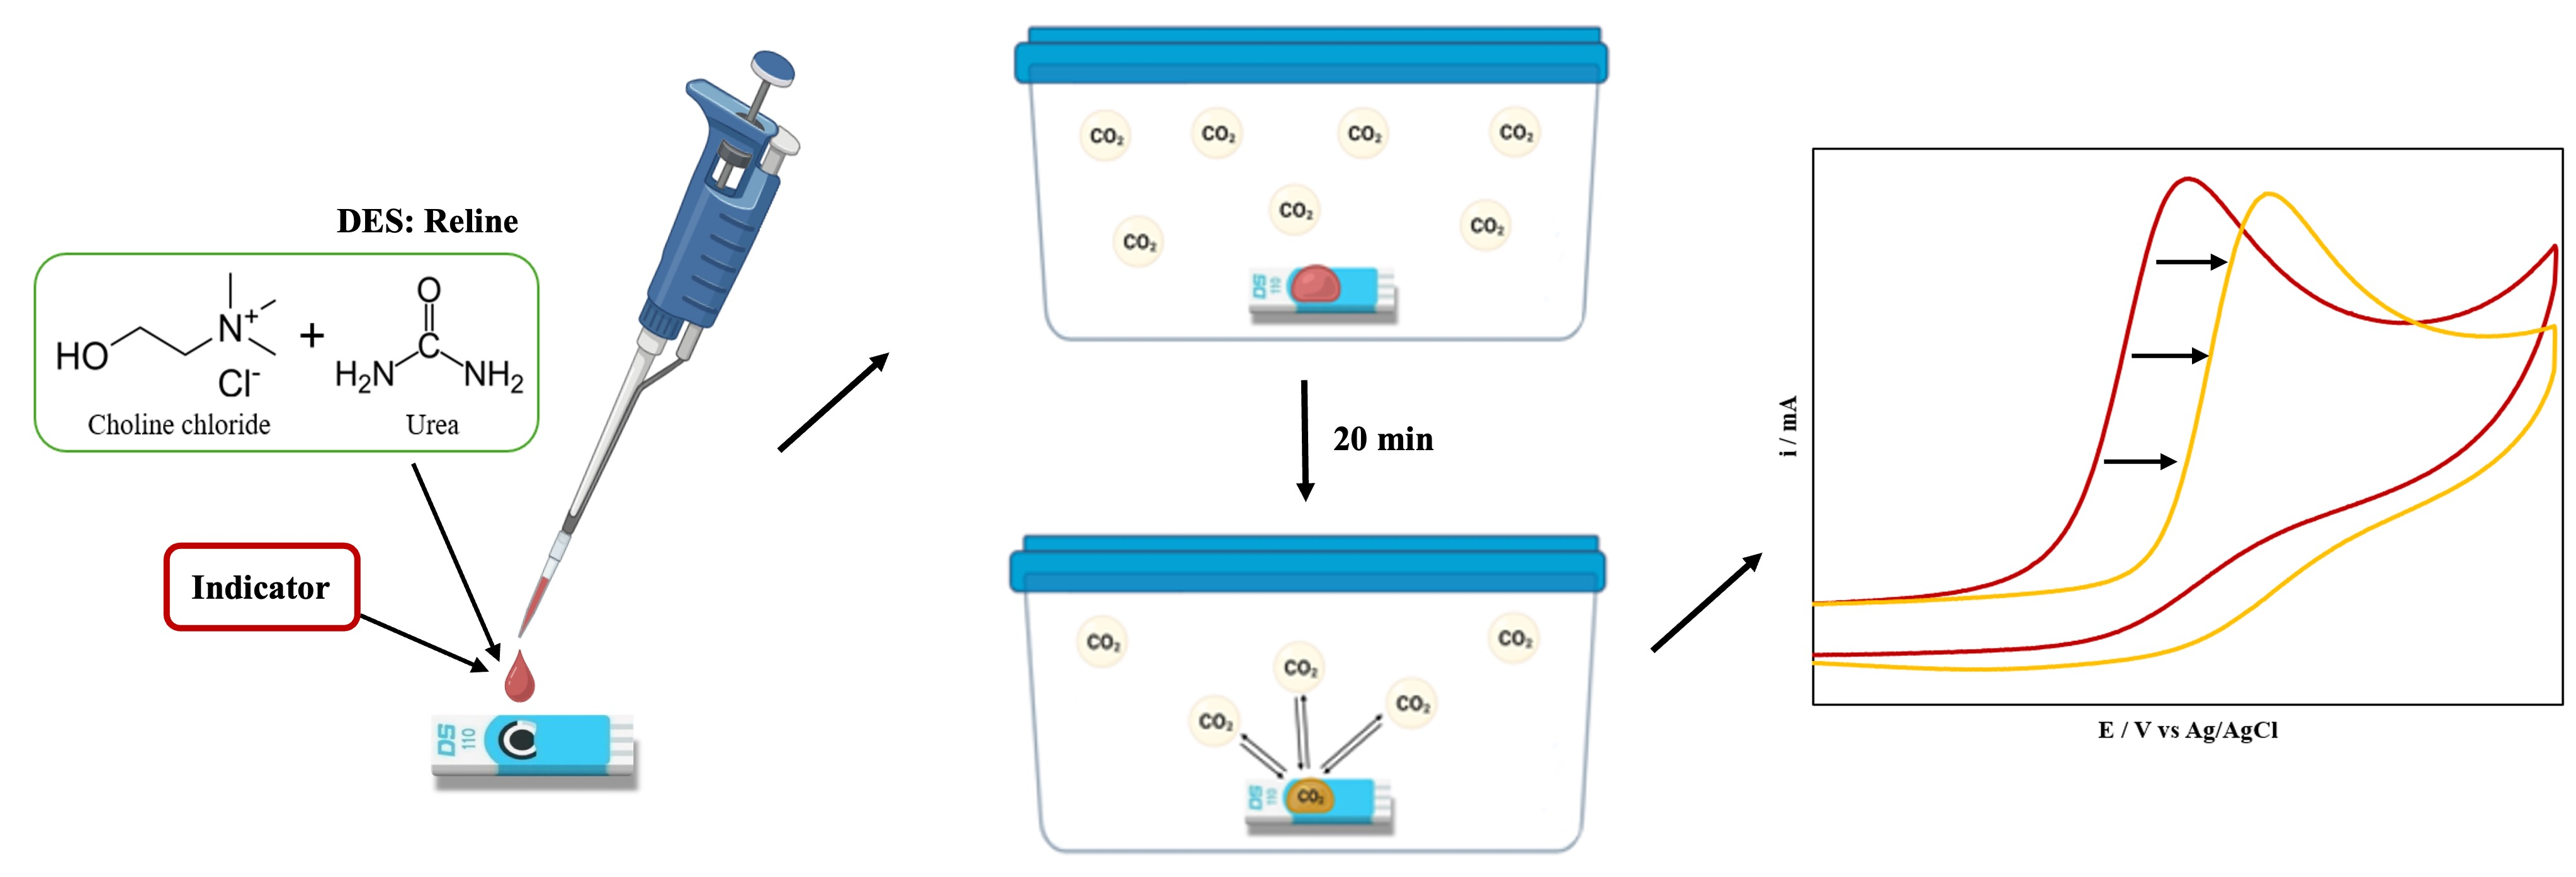
In this study, we introduced an innovative electrochemical approach for the detection of acidic species in the gas phase, based on the voltammetric behavior of pH indicators dissolved in hydrated DES, rather than their conventional colorimetric response. Specifically, we exploit the unique physicochemical properties of hydrated reline, a DES characterized by favorable viscosity, electrical conductivity, surface tension, electrochemical stability, and CO2 absorption capacity [31], to integrate acid–base indicators as electroactive sensing probes. Phenol Red (PR), Bromocresol Purple (BCP), and Bromothymol Blue (BTB) were investigated due to their distinct redox behavior in both buffer solutions and hydrated reline. These indicators exist in protonated and deprotonated forms with characteristic oxidation potentials; the electron-rich deprotonated species oxidizes at lower potentials, which shift toward more positive values as the pH decreases upon CO2 absorption [32,33]. When CO2, released during the respiration of fruits and vegetables [34], is absorbed by the hydrated reline matrix, it induces a measurable change in the voltammetric response of the pH-sensitive dyes. This response enables rapid and reliable CO2 detection using SPCEs as sensing platforms. The proposed concept was successfully demonstrated for monitoring the respiration of fresh food stored in sealed containers, highlighting its potential for real-time and low-cost assessment of food freshness.

2. Materials and Methods

2.1. Reagents and Materials

Potassium phosphate monobasic, sodium phosphate dibasic, potassium chloride, Bromothymol Blue, Bromocresol Purple, Phenol Red, hydrochloric acid, sodium hydroxide, and 2-propanol were purchased from Sigma-Aldrich (Milan, Italy). Reline (choline chloride–urea, 1:2) was purchased from Scionix Ltd. (London, UK). Carbon dioxide was of UPP purity (99.99%), supplied by SIAD (Trieste, Italy). Gas-tight microsyringes were purchased from Hamilton Company (Reno, NV, USA). Ultrapure water was used for the preparation of all solutions and for the cleaning and rising operations (R > 18 M Ω), obtained using an Elga Purelab flex 4 system (Veolia Water Technologies, Zoppola, Italy).
The food samples used in this study included avocado, banana, broccoli, mushrooms, and Golden Delicious apples purchased from a local supermarket.
pH measurements were made using a pH-meter model 2001 from CRISON (Barcelona, Spain), equipped with a model 52-40 combined glass electrode from the same manufacturer.
Viscosity was evaluated using a controlled stress rheometer (Haake RheoStress 6000, Thermo Scientific, Karlsruhe, Germany) equipped with a concentric cylinder geometry. The sample was loaded in the cylinder, slightly compressed, and allowed to relax for 5 min after loading before testing.
The spectrophotometric measurements were performed using a Nanodrop Ultra C Spectrophotometer (Thermo Fisher Scientific, Segrate Milano, Italy). The electrochemical measurements were conducted using a BiStat BioLogic (Grenoble, France) managed by EC-Lab software v10.37 and an SPCE manufactured by Dropsens (Metrohm Italiana S.r.l., Varese, Italy) in which the counter electrode (CE) is carbon and the reference electrode (RE) is a silver pseudo-reference, connected by means of a Dropsens model CAC connector cable (Metrohm Italiana S.r.l., Varese, Italy).
For validation of our measurement approach, we employed an Aranet4 (Riga, Latvia) nondispersive infrared (NDIR) sensor to measure carbon dioxide, specified with a measurement range of 0–9999 ppm and an accuracy of ±30 ppm plus 3% of the measured value. Data were collected via the Aranet Home smartphone app v3.9.1.

2.2. Evaluation of Electrochemical Behavior of Indicators in Buffer Solution at Different pH

To evaluate the electrochemical behavior of PR, BCP, and BTB in aqueous solutions at varying pH values, these indicators, each at 0.5 mM, were dissolved in 0.2 M phosphate buffer solutions containing 0.1 M potassium chloride at pH of 6, 7, and 8. For electrochemical analysis, 30 µL of each prepared solution was drop-cast onto the working area of an SPCE. The electrochemical behavior of the indicators was assessed using cyclic voltammetry (CV) at a scan rate of 50 mV/s, within a potential window from 0 V to 1 V vs. Ag/AgCl.

2.3. Evaluation of Electrochemical Behavior of Indicators in Acidified and Basified Reline Solutions

To assess the behavior of the three indicators in reline, distinct solutions were prepared: acidified solutions and basified solutions. The acidified solutions were prepared by adding HCl to the reline containing 0.5 mM of the indicator, yielding a final HCl concentration of 0.01 M and a water content of 10% (v/v). The basified solutions were prepared by adding NaOH to the reline mixture containing 0.5 mM of the indicator, yielding a final NaOH concentration of 0.01 M and a water content of 10% (v/v). Lastly, all solutions were doped with 0.1 M KCl. All solutions were accurately mixed prior to each measurement. The electrochemical measurement was carried out by drop-casting 30 μL of the solution to cover the three electrodes of the SPCE. The indicators’ behavior was evaluated using CV at a scan rate of 50 mV/s. For solutions containing HCl, a potential window from 0 V to 1.3 V was used, while for those with NaOH, the window was set from 0 V to 1 V.

2.4. Experimental Setup for CO2 Gas Measurement

An airtight plastic box was used for CO2 monitoring. The box was equipped with four ports: one dedicated to CO2 introduction via a gas-tight syringe, and three for the connection of connector cables to the SPCEs, enabling triplicate electrochemical measurement. Next, 30 µL of a solution containing 0.5 mM PR, 0.1 M KCl, 10% water, and reline was drop-casted onto the SPCEs. The SPCEs were then placed inside the box using the CAC cables; after the box was hermetically sealed and the desired amount of CO2 was introduced, the system was left to equilibrate under static conditions at ambient pressure for 20 min. This equilibration period was selected as a compromise to minimize measurement time, while accounting for the fact that the viscosity of the DES, although reduced by water addition, still significantly limits both the diffusion and adsorption of CO2 within the medium. Figure S1 shows the variation in the signal as a function of equilibration time. These data demonstrate that after 20 min, a clear and reproducible potential shift is observed, sufficient for reliable calibration, even though a slow residual drift indicates that complete equilibrium would require substantially longer times of about 60 min. Following the equilibration period, CV was performed at a scan rate of 50 mV/s within a potential window from 0 V to 1 V.

2.5. Food Sample Analysis

The same airtight box used for gas measurements was also utilized for the study of real matrices. Once the matrix samples (avocado, banana, broccoli, mushrooms, and Golden Delicious apples) were introduced, the SPCE, previously coated with the sensing solution, and the Aranet4 sensor (used for comparison) were placed inside the box. The box was then hermetically sealed and allowed to equilibrate for 1 h. This equilibration period was selected to ensure that the real sample reached a detectable CO2 concentration, taking into account that the samples selected exhibit a respiration rate in the range of 80–120 mL CO2·kg−1·h−1 at 20 °C [35]. Following this period, CV measurements were performed.

3. Results and Discussion

3.1. Effect of pH on the Voltammetric Characteristics of Indicators in Phosphate Buffer Solution

Since our aim was to assess whether certain acid–base indicators could detect gaseous acidic species through their voltammetric behavior rather than their color change, we first carried out tests on unmodified SPCEs to evaluate the effect of electrolyte pH on their anodic response. Preliminary tests on unmodified screen-printed carbon electrodes (SPCEs) showed that the anodic peak potential of the selected acid–base indicators varied with pH. These tests were conducted in ambient air on three pH indicators, PR, BCP, and BTB, which were dissolved in 0.2 M phosphate buffer solutions containing 0.1 M potassium chloride at different pH values (6, 7, and 8). These acid–base indicators were selected because they all belong to the sulfonephthalein family and have dissociation constants (pKa) within the pH range explored [36,37].
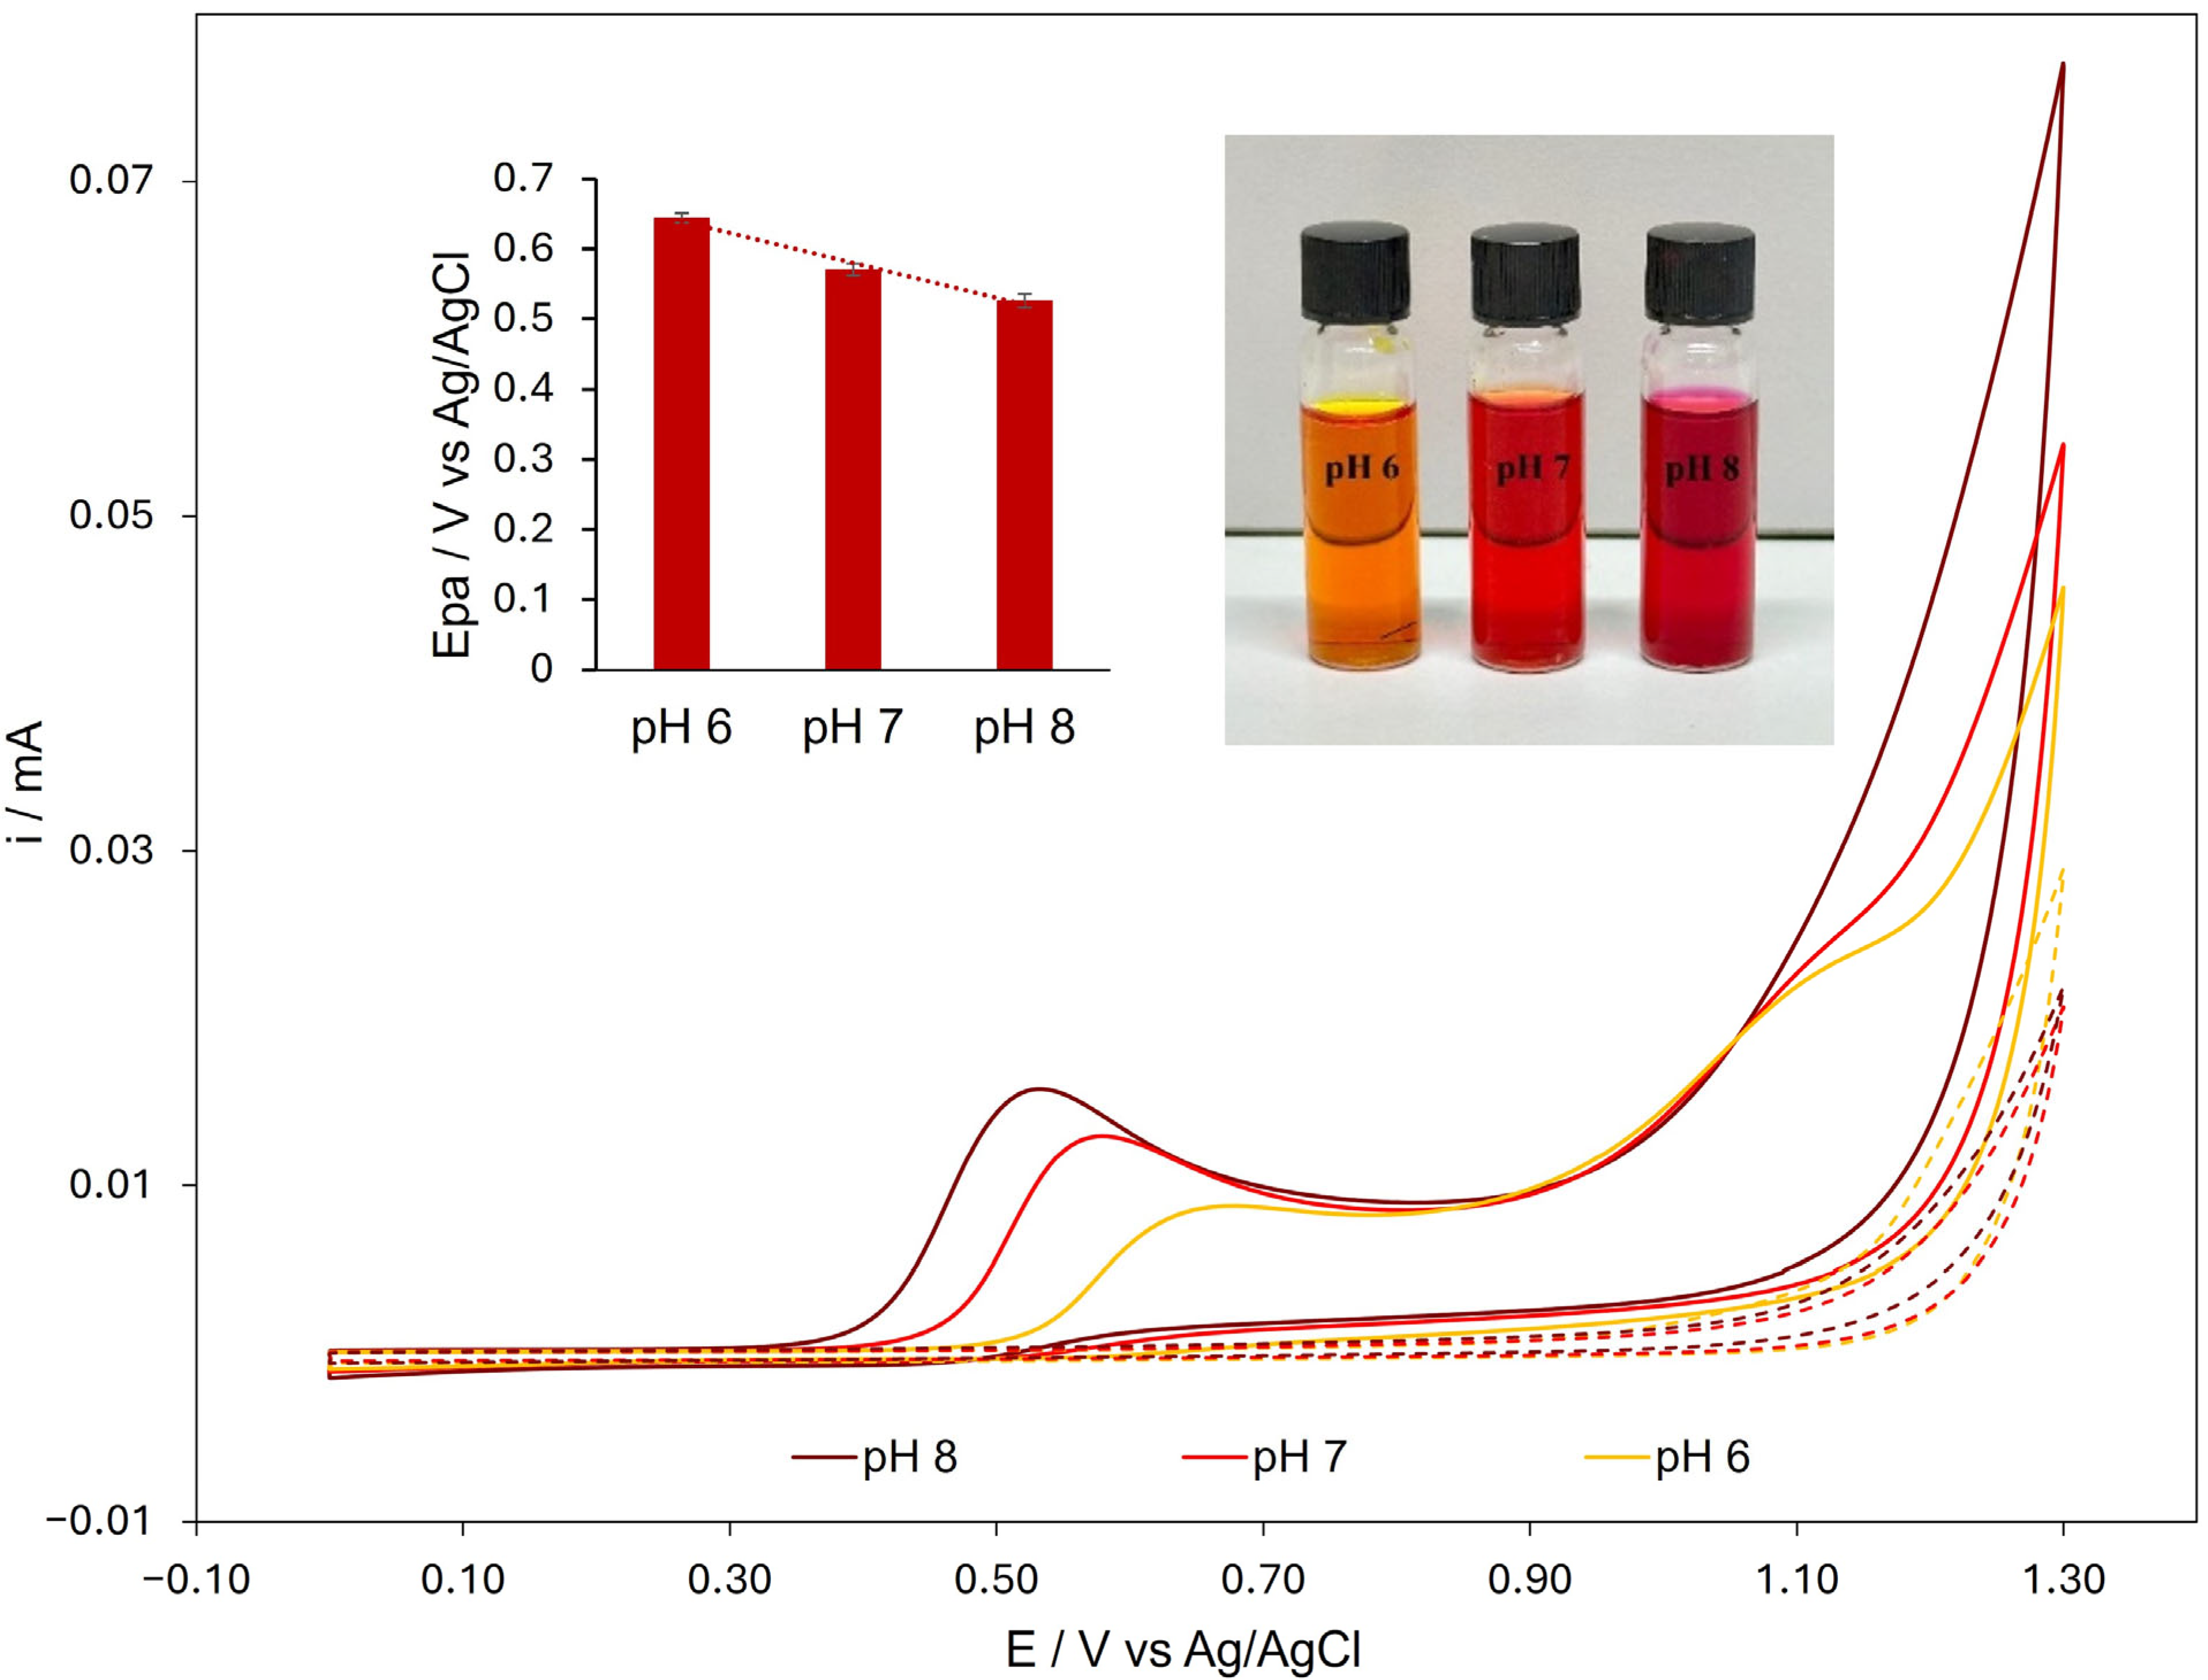
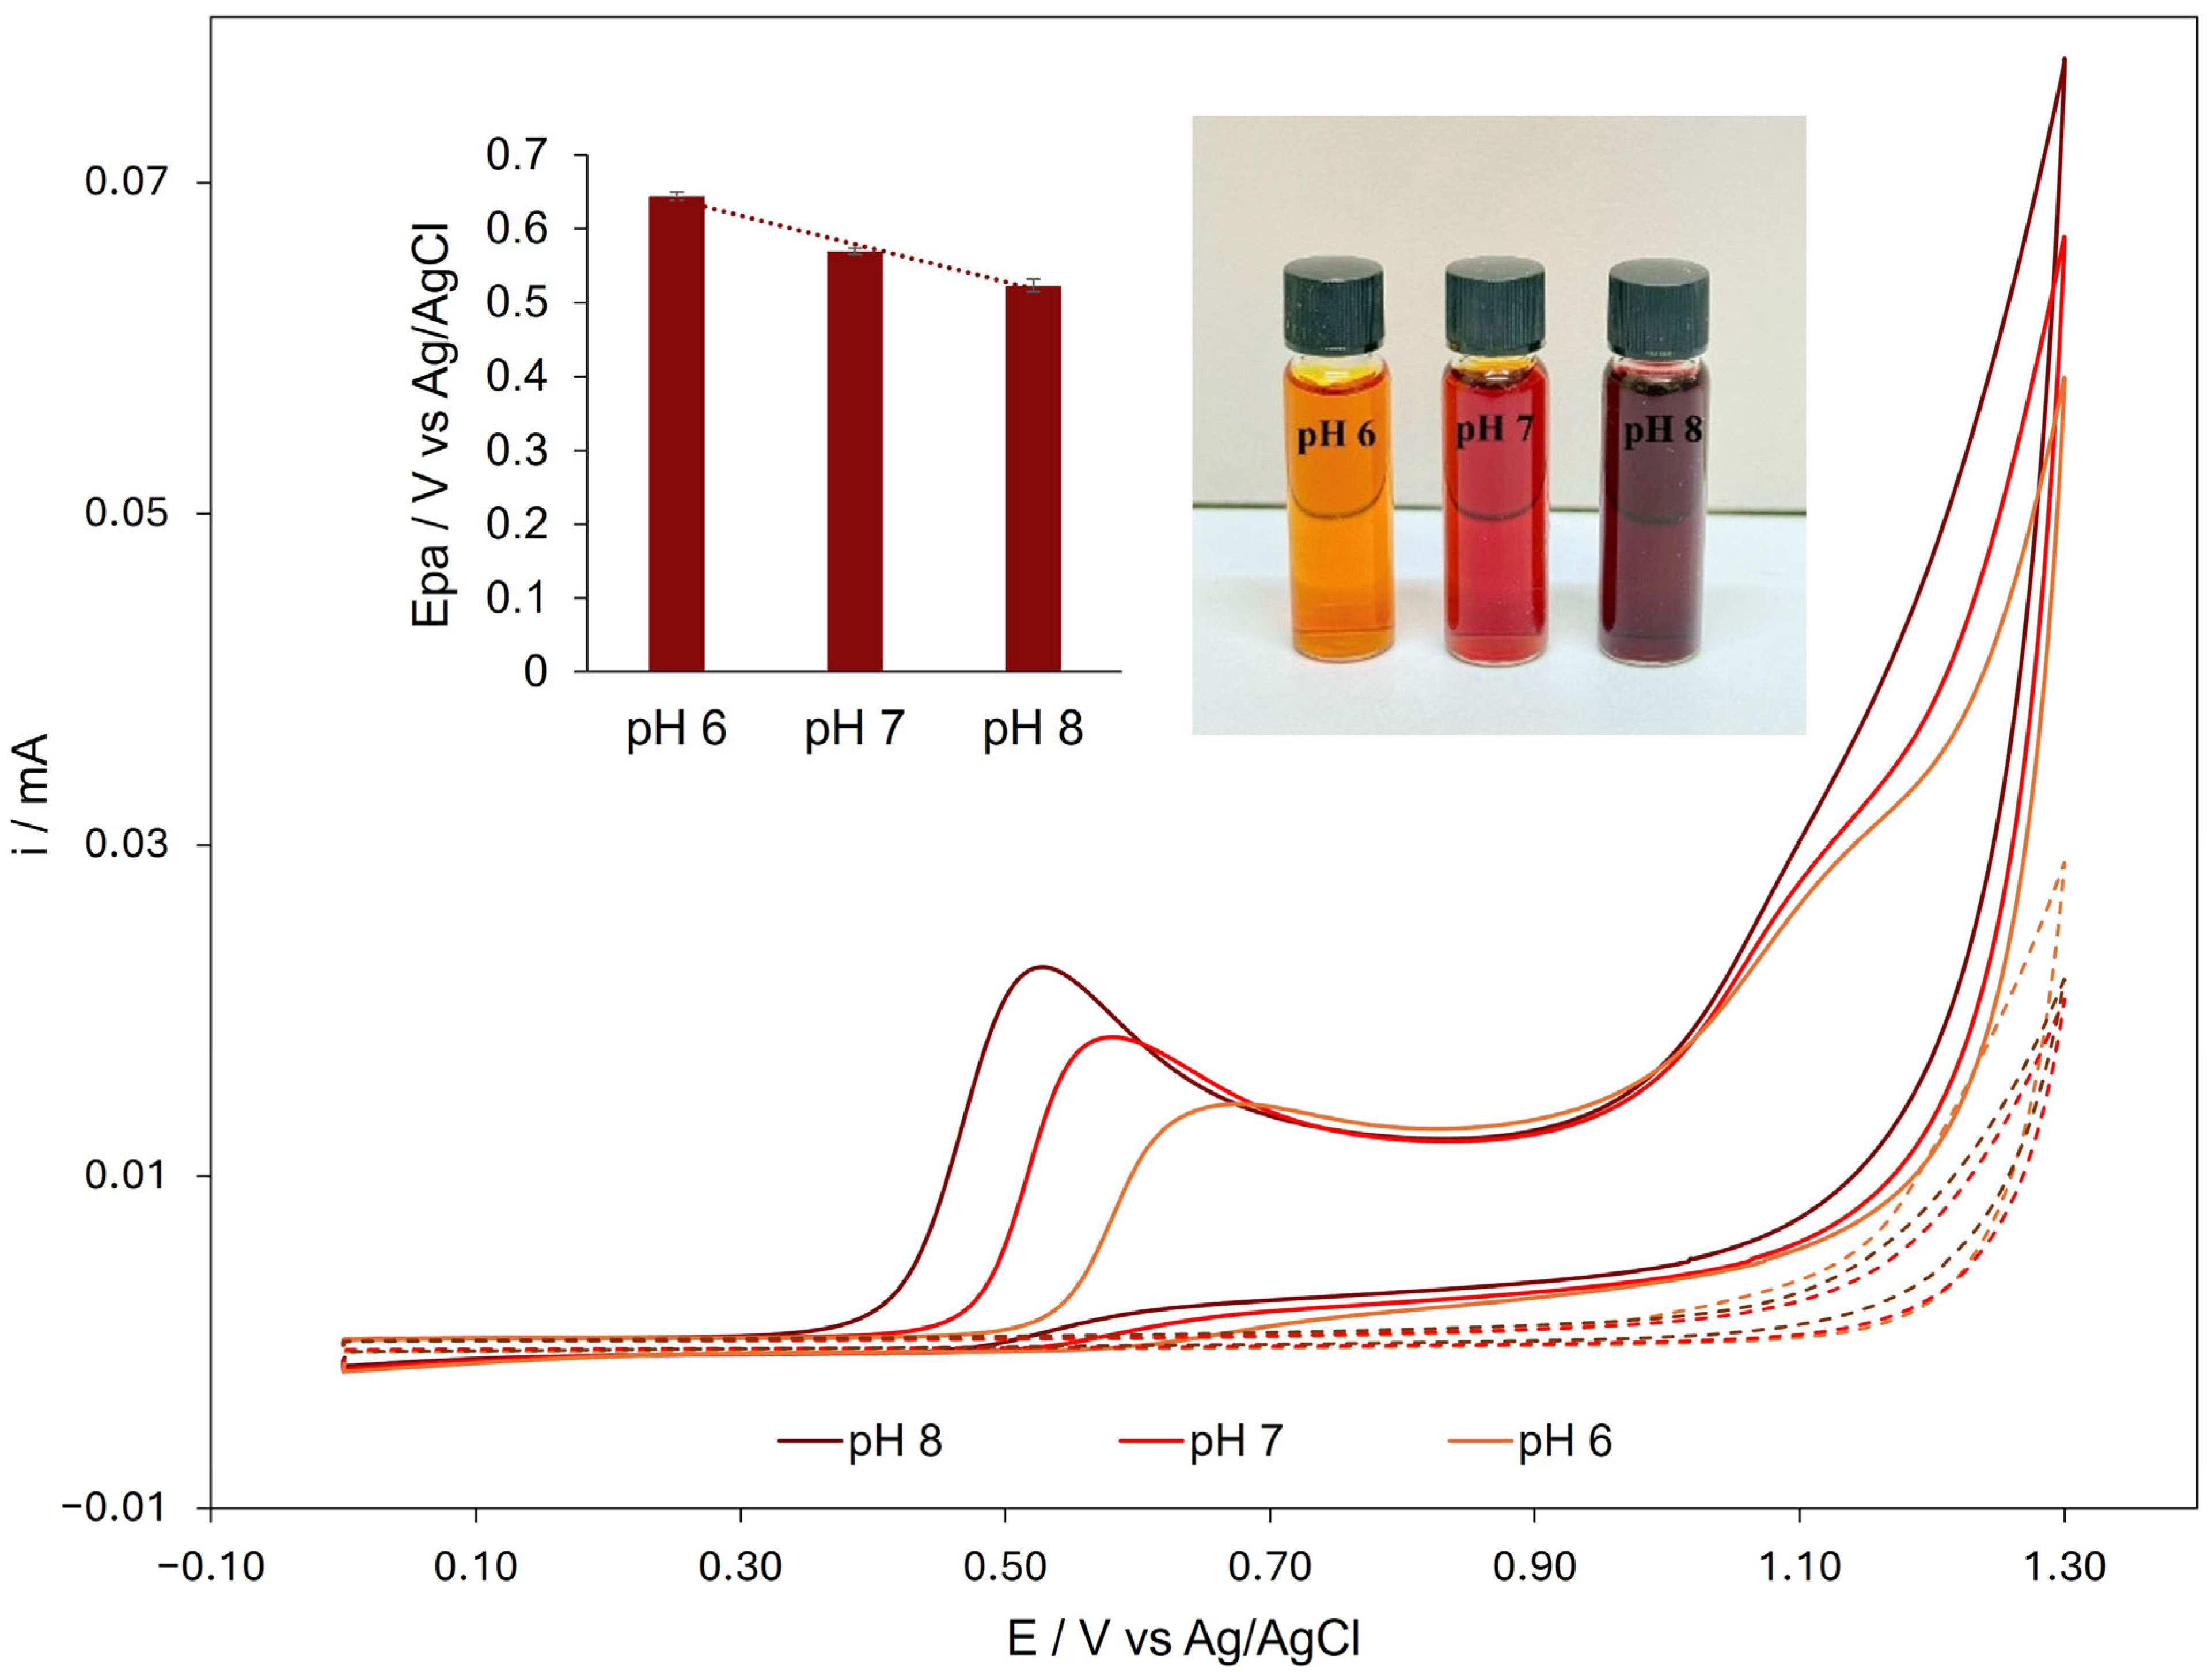
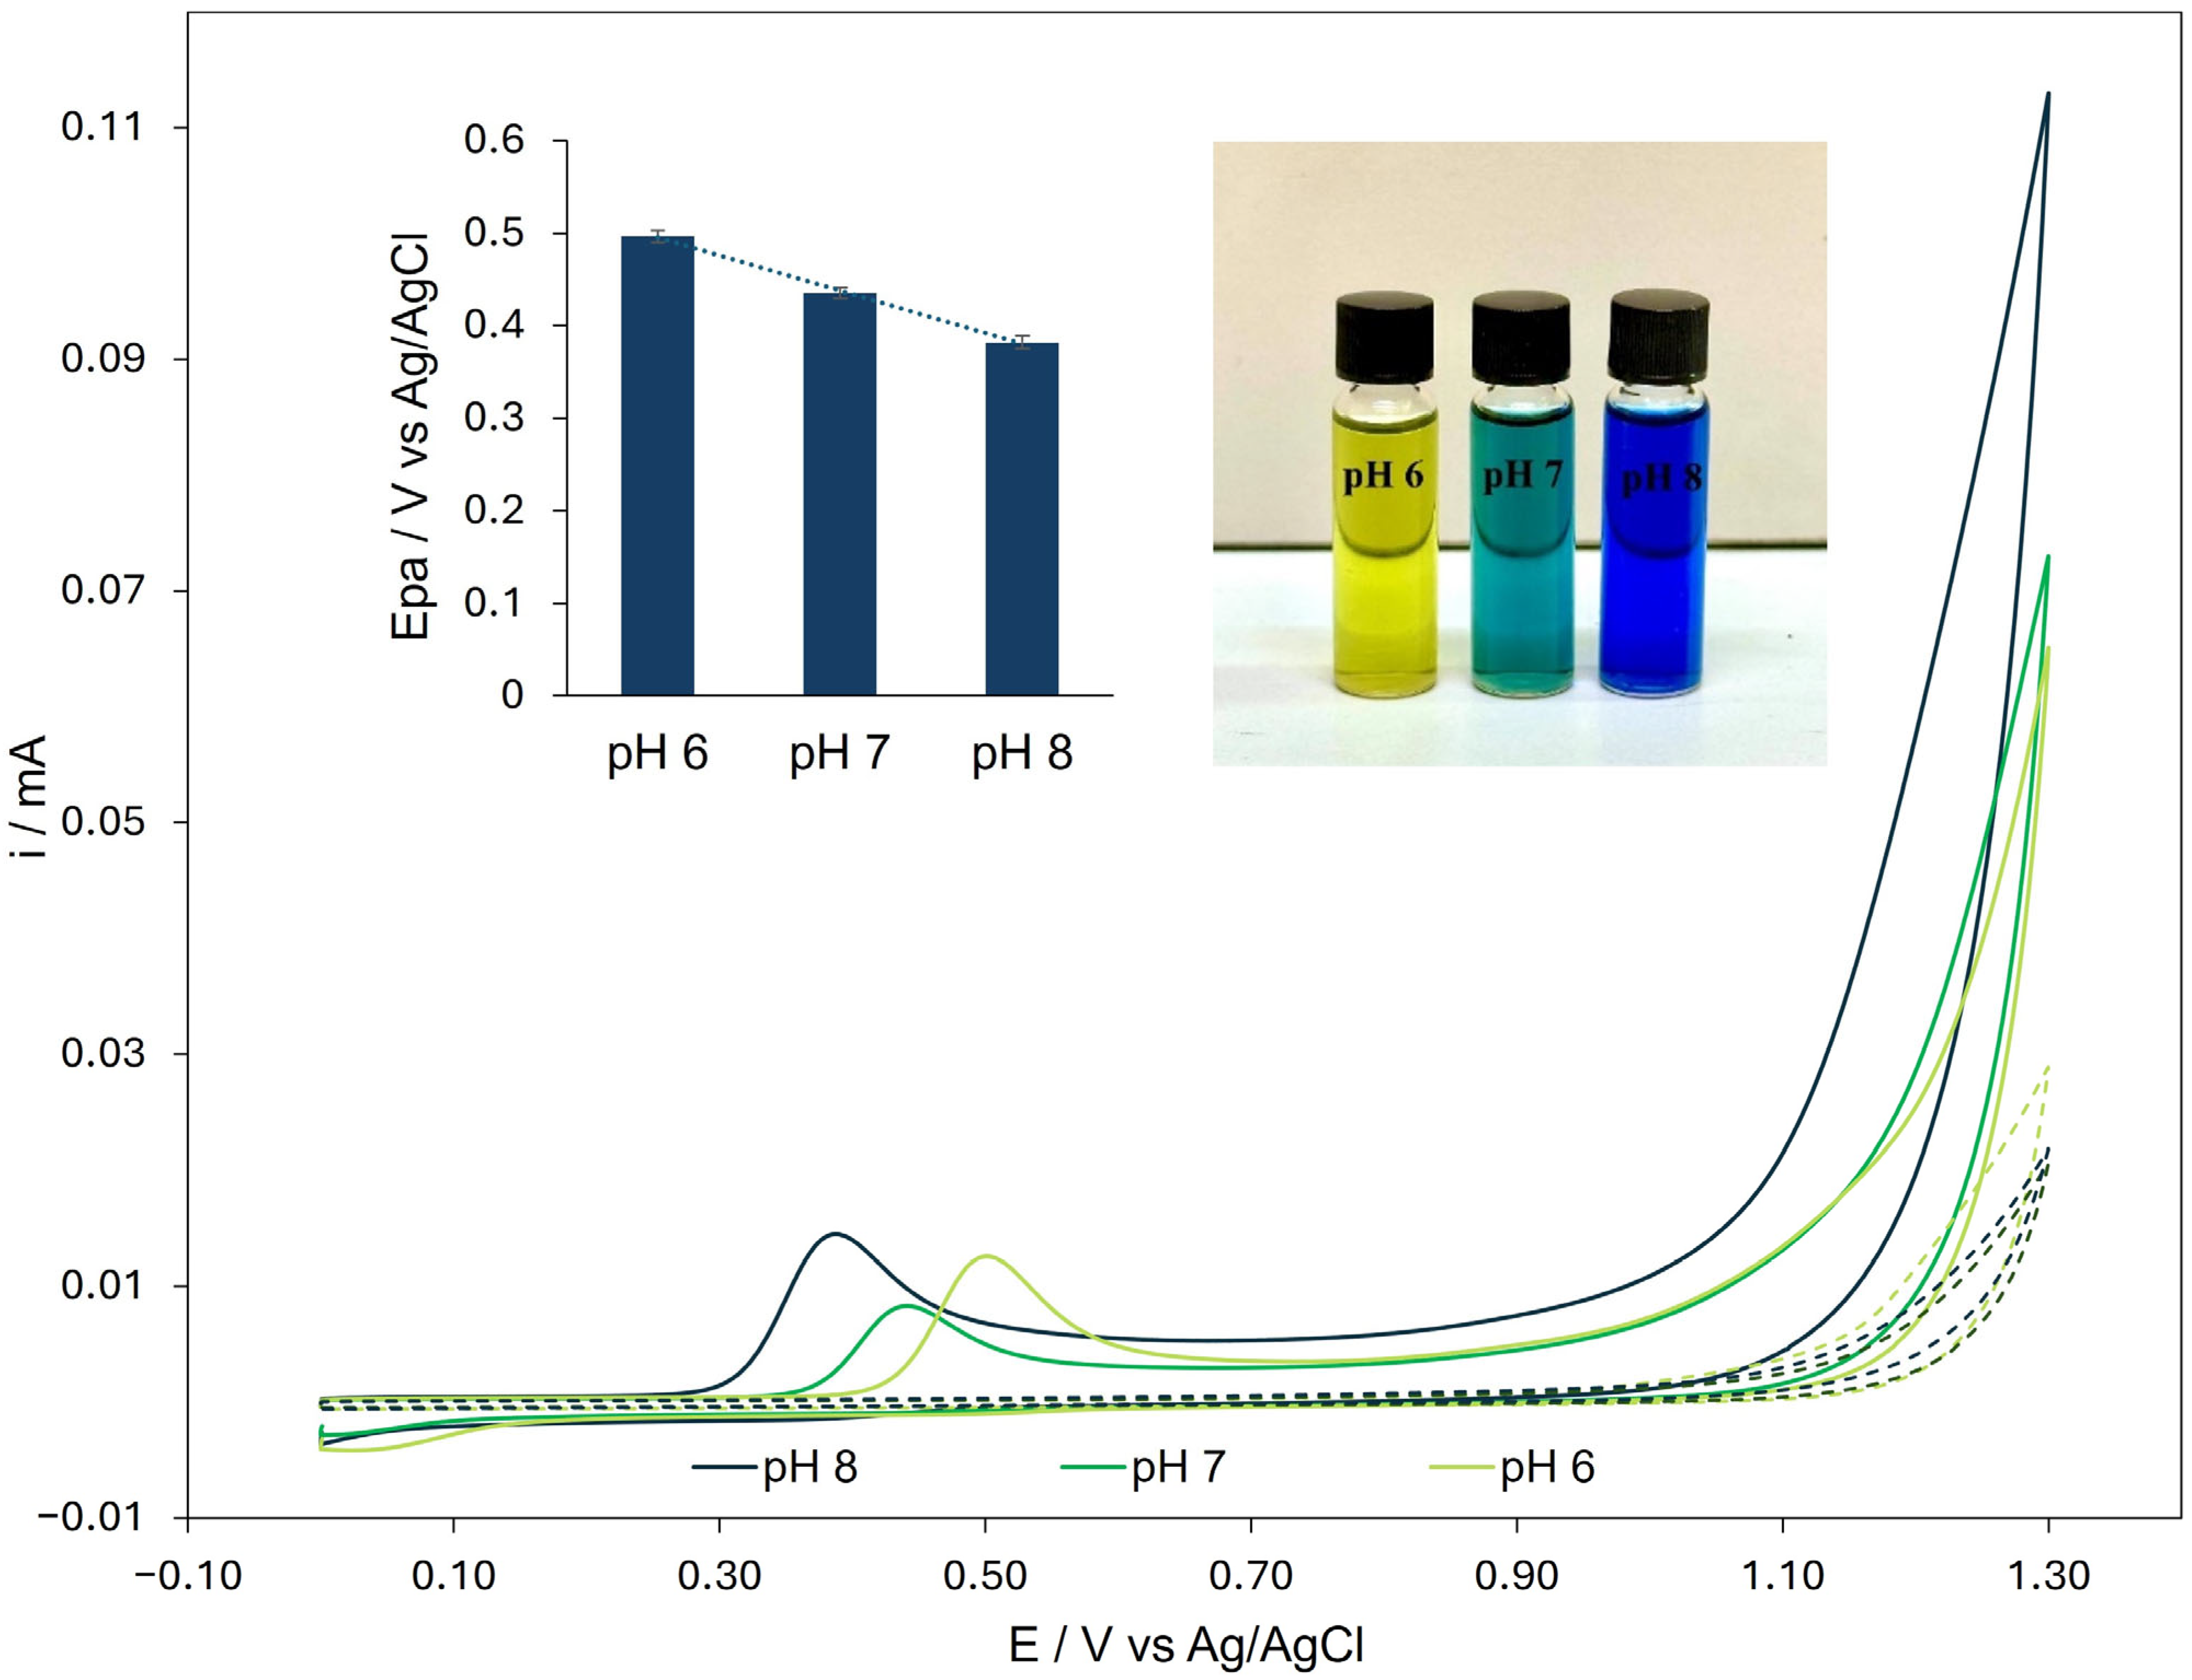
As observed in Figure 1 for PR at pH 6, during the forward scan, two anodic peaks are observed at 0.644 V and 1.091 V. Their presence, peak potentials, and intensities are pH-dependent. As the pH of the solution increases, the second anodic peak disappears, whereas the first peak shows an increase in current. Additionally, the anodic peak potential (Epa) shifts toward less positive values. Insets in Figure 1 show the linear dependence of the anodic peak potential (Epa) on pH, described by the equation Epa (mV) = 993 − 59·pH at 22 °C. They also illustrate the distinct color changes in PR observed across the investigated pH range, consistent with its reported pKa. These findings are coherent with an oxidation process in which, at lower pH, both the unprotonated and protonated forms of PR are present, with the former undergoing oxidation at a lower potential than the conjugate form. At higher pH, the second anodic peak disappears, as the unprotonated form of PR becomes predominant. At the same time, the Epa–pH relationship indicates an oxidation process involving an equal number of protons and electrons. Overall, these results are consistent with previously reported data for PR in the literature [38]. Similar behavior was observed for BCP and BTB, as shown in Figure 2 and Figure 3 for 0.5 mM BCP and 0.1 mM BTB, respectively. In the case of BTB, a lower concentration was employed due to its limited solubility in the water–DES solution. The corresponding linear relationships between Epa and pH were determined as follows: for BCP, Epa (mV) = 1002 − 60.5·pH at 22 °C, and for BTB, Epa (mV) = 838.6 − 57.2·pH at 22 °C. According to the literature, all voltammetric profiles presented here correspond to the first CV cycle, as repeated scans in the positive direction led to the formation of polymeric films [38].
In conclusion, the initial screening conducted in PBS demonstrated a clear correlation between the oxidation potential of each indicator and the pH of the solution, highlighting their potential for pH-sensitive electrochemical applications.

3.2. Effect of pH on the Voltammetric Characteristics of Indicators in Reline Solutions

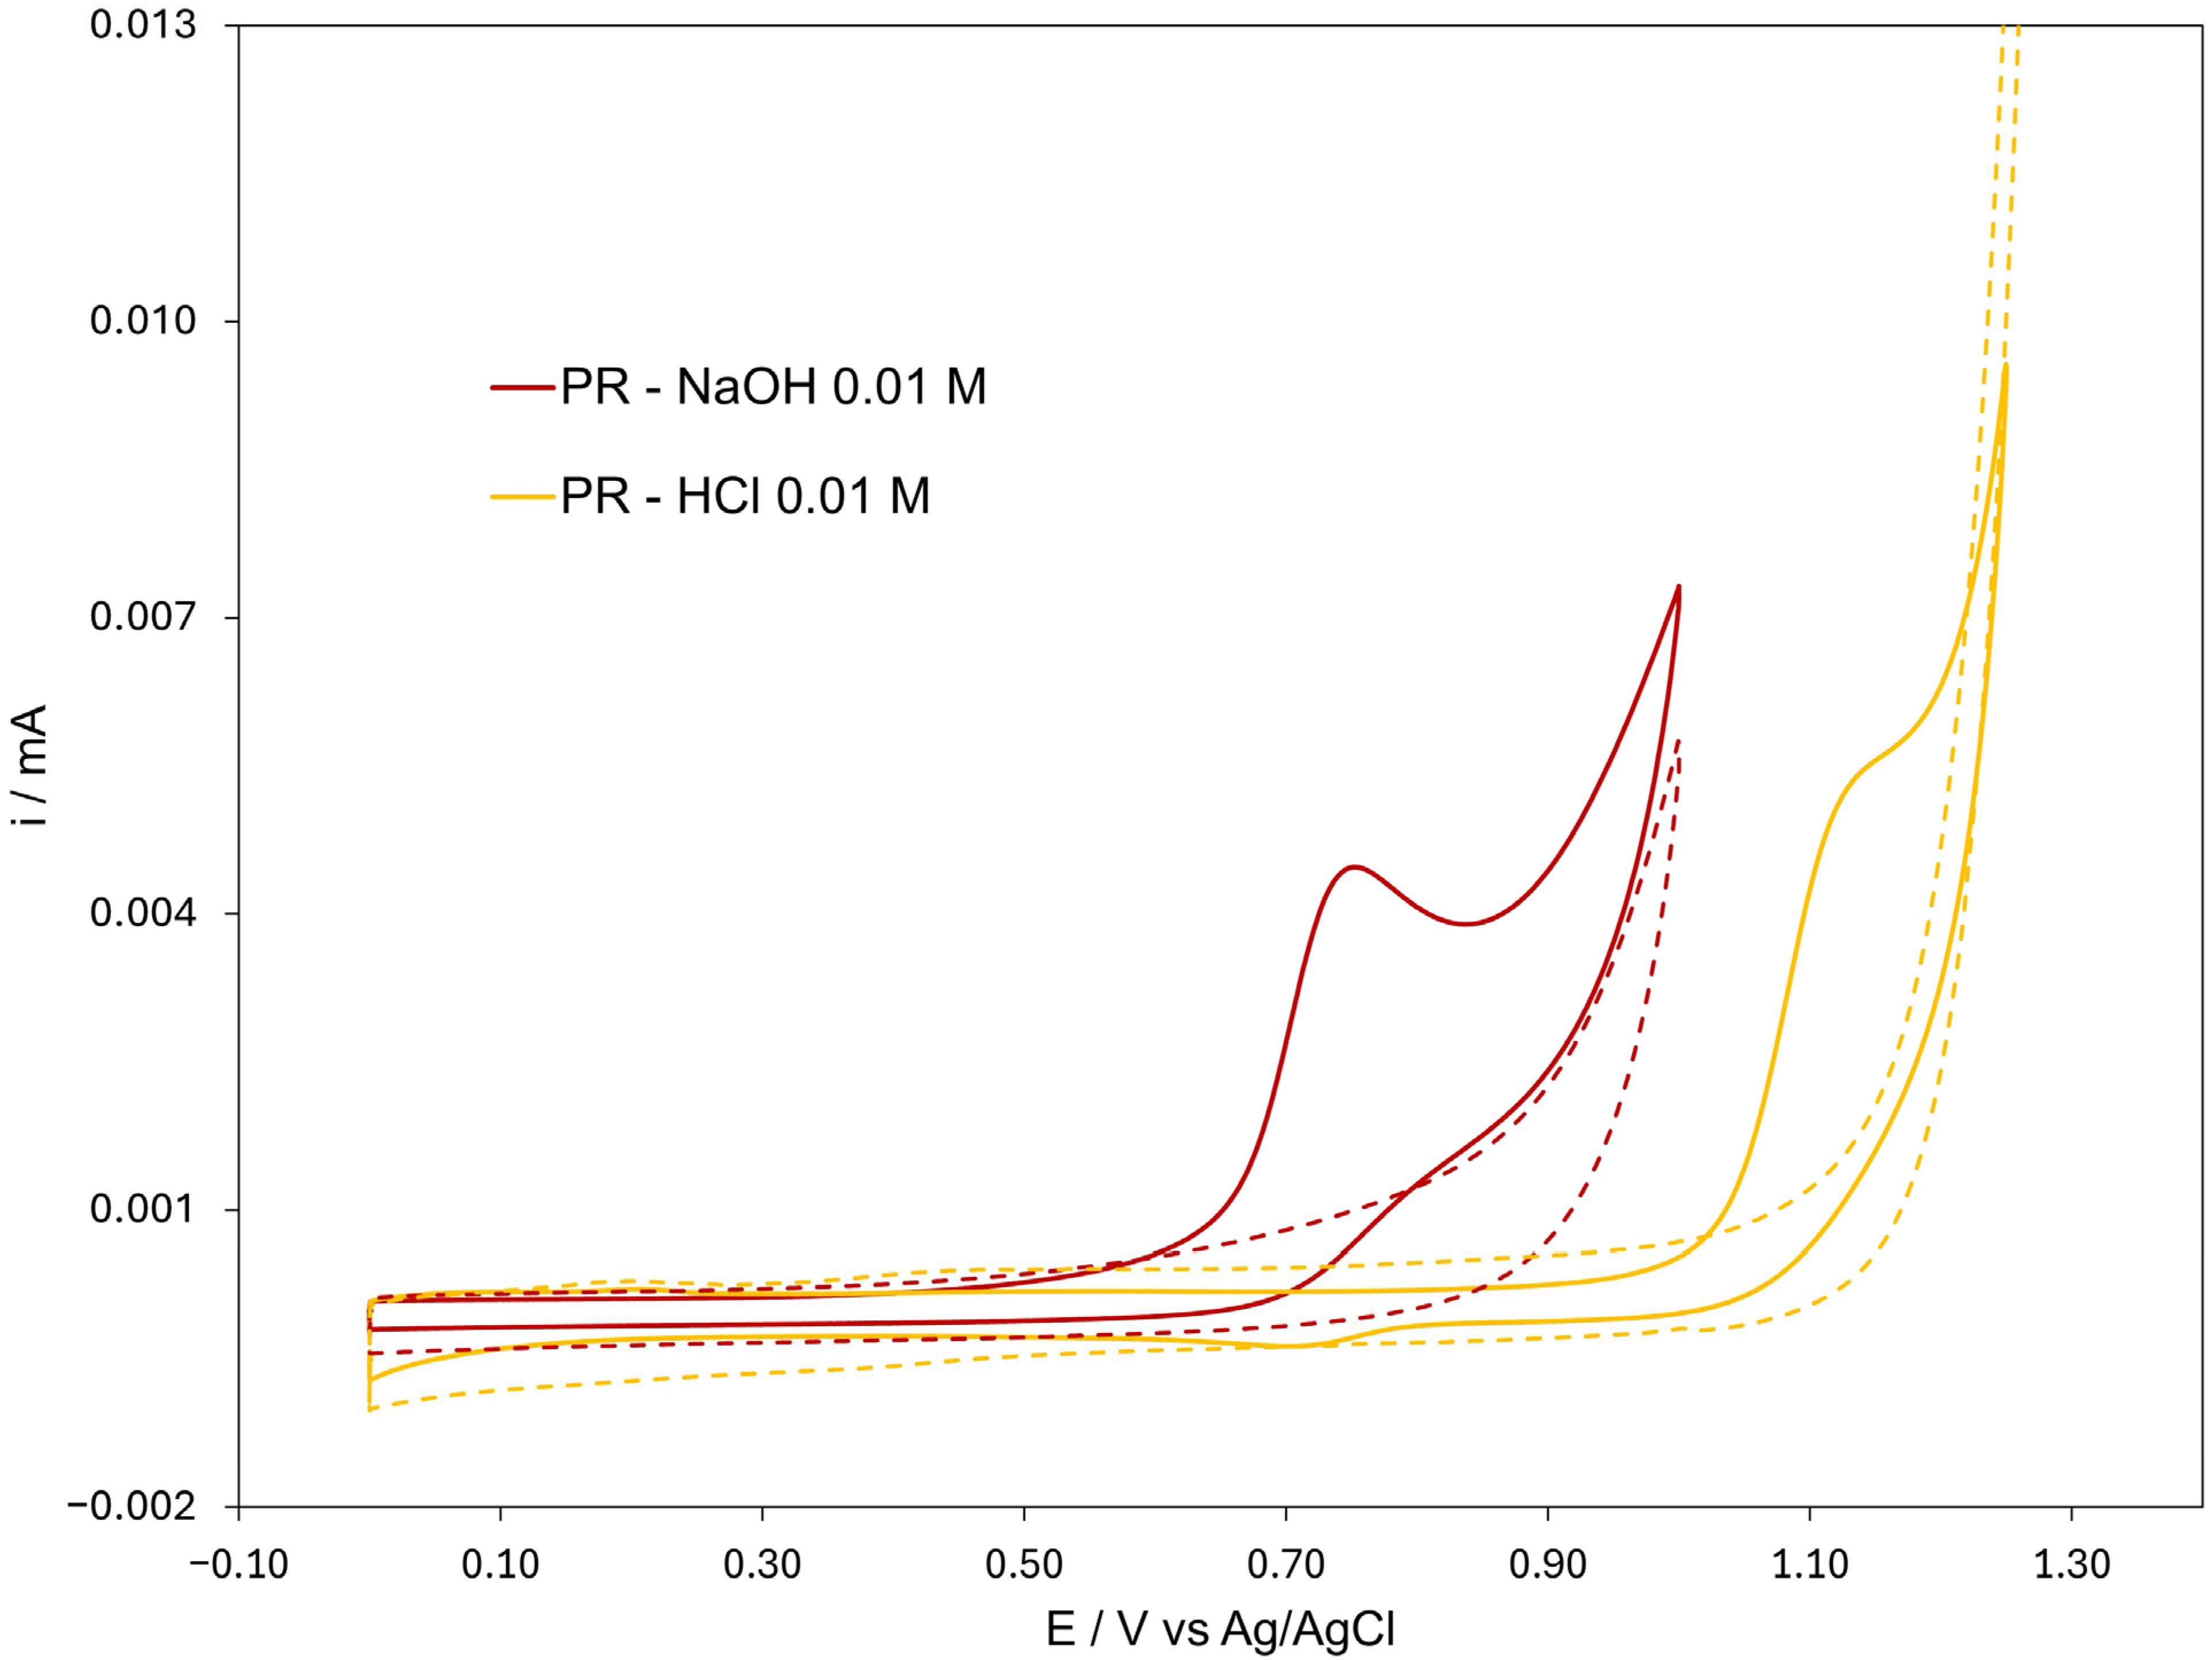
As previously described by Abbott [39], pH measurements in DES may be subjected to error. Indeed, if the solution is non-aqueous, the ionic composition and ion mobility differ significantly, and the junction potential may vary unpredictably, leading to errors in pH measurement. The addition of water may help mitigate differences in junction potential, making the response more similar to the Nernstian behavior. Accordingly, all solutions were prepared with the addition of 10% v/v water for the subsequent investigation. As previously reported in the literature, the nanostructure of DES is maintained even at relatively high water contents (up to ~42 wt% H2O) [29], owing to the solvophobic sequestration of water into nanostructured domains surrounding the cholinium cations. Following the addition of water and KCl, the reline pH decreased from 9.8 to 9.6, in agreement with previous studies [40], while the addition of HCl to a reline–water mixture decreased the pH to 2.9, whereas the addition of NaOH to a reline–water mixture increased the pH to 13.1, consistent with the pH of water containing reline. To investigate the influence of pH on the voltammetric behavior of pH indicators dissolved in reline, disposable SPCEs coated with a thin film of hydrated reline were employed. For this purpose, reline was doped with 10% v/v of aqueous HCl and NaOH solutions, yielding final concentrations of 10−2 M for each. As shown in Figure 4 for PR and in Figures S2 and S3 (see Supplementary Materials) for BCP and BTB, all three indicators exhibited a comparable shift in their oxidation processes in reline compared to that observed in aqueous buffer. In contrast, the second oxidation process appears either absent or obscured by solvent oxidation, with the anodic peak potential shift being smaller than that observed in aqueous solutions. In addition, the potential stability was evaluated with the ferro/ferricyanide redox couple serving as an internal electrochemical reference. The results confirmed that the oxidation potentials of the indicators did not vary significantly over time.

3.3. Carbon Dioxide Sensing Concept

In analogy with the operating principle of many optical CO2 sensors employing acid–base indicators and fundamentally based on the Severinghaus principle [41], the CO2 absorbed by the water–reline solution in our system also undergoes the following equilibria:
C O 2   ( g )   C O 2   ( w r e l i n e )
C O 2   w r e l i n e + H 2 O   H 2 C O 3  
H 2 C O 3   + H 2 O   H C O 3 + H 3 O +
H 3 O + + I n d ( w r e l i n e )   H I n d ( w r e l i n e )
However, our sensing concept is not based on the color change in the pH-sensitive indicators, but rather on their oxidation process, which shifts from the oxidation potential of the basic form (Ind) to that of the acidic form (Hind), moving toward more positive potentials as the pH decreases. The sensitivity and functionality of this sensing approach are thus governed by the indicator’s acid dissociation constant (pKa) as well as by the initial pH of the water–reline solution, which must ensure the prevalence of the indicator’s basic deprotonated form (Ind). As demonstrated by the UV–vis spectra shown in Supplementary Materials Figures S4–S6, at the pH of the hydrated reline solution, only PR prevailed in the deprotonated form, whereas for the other indicators, both the protonated and deprotonated species coexisted. For this reason, further investigations were carried out with PR.

3.4. Application of pH Indicators in Static Atmospheric Systems for Voltammetric Quantification of CO2

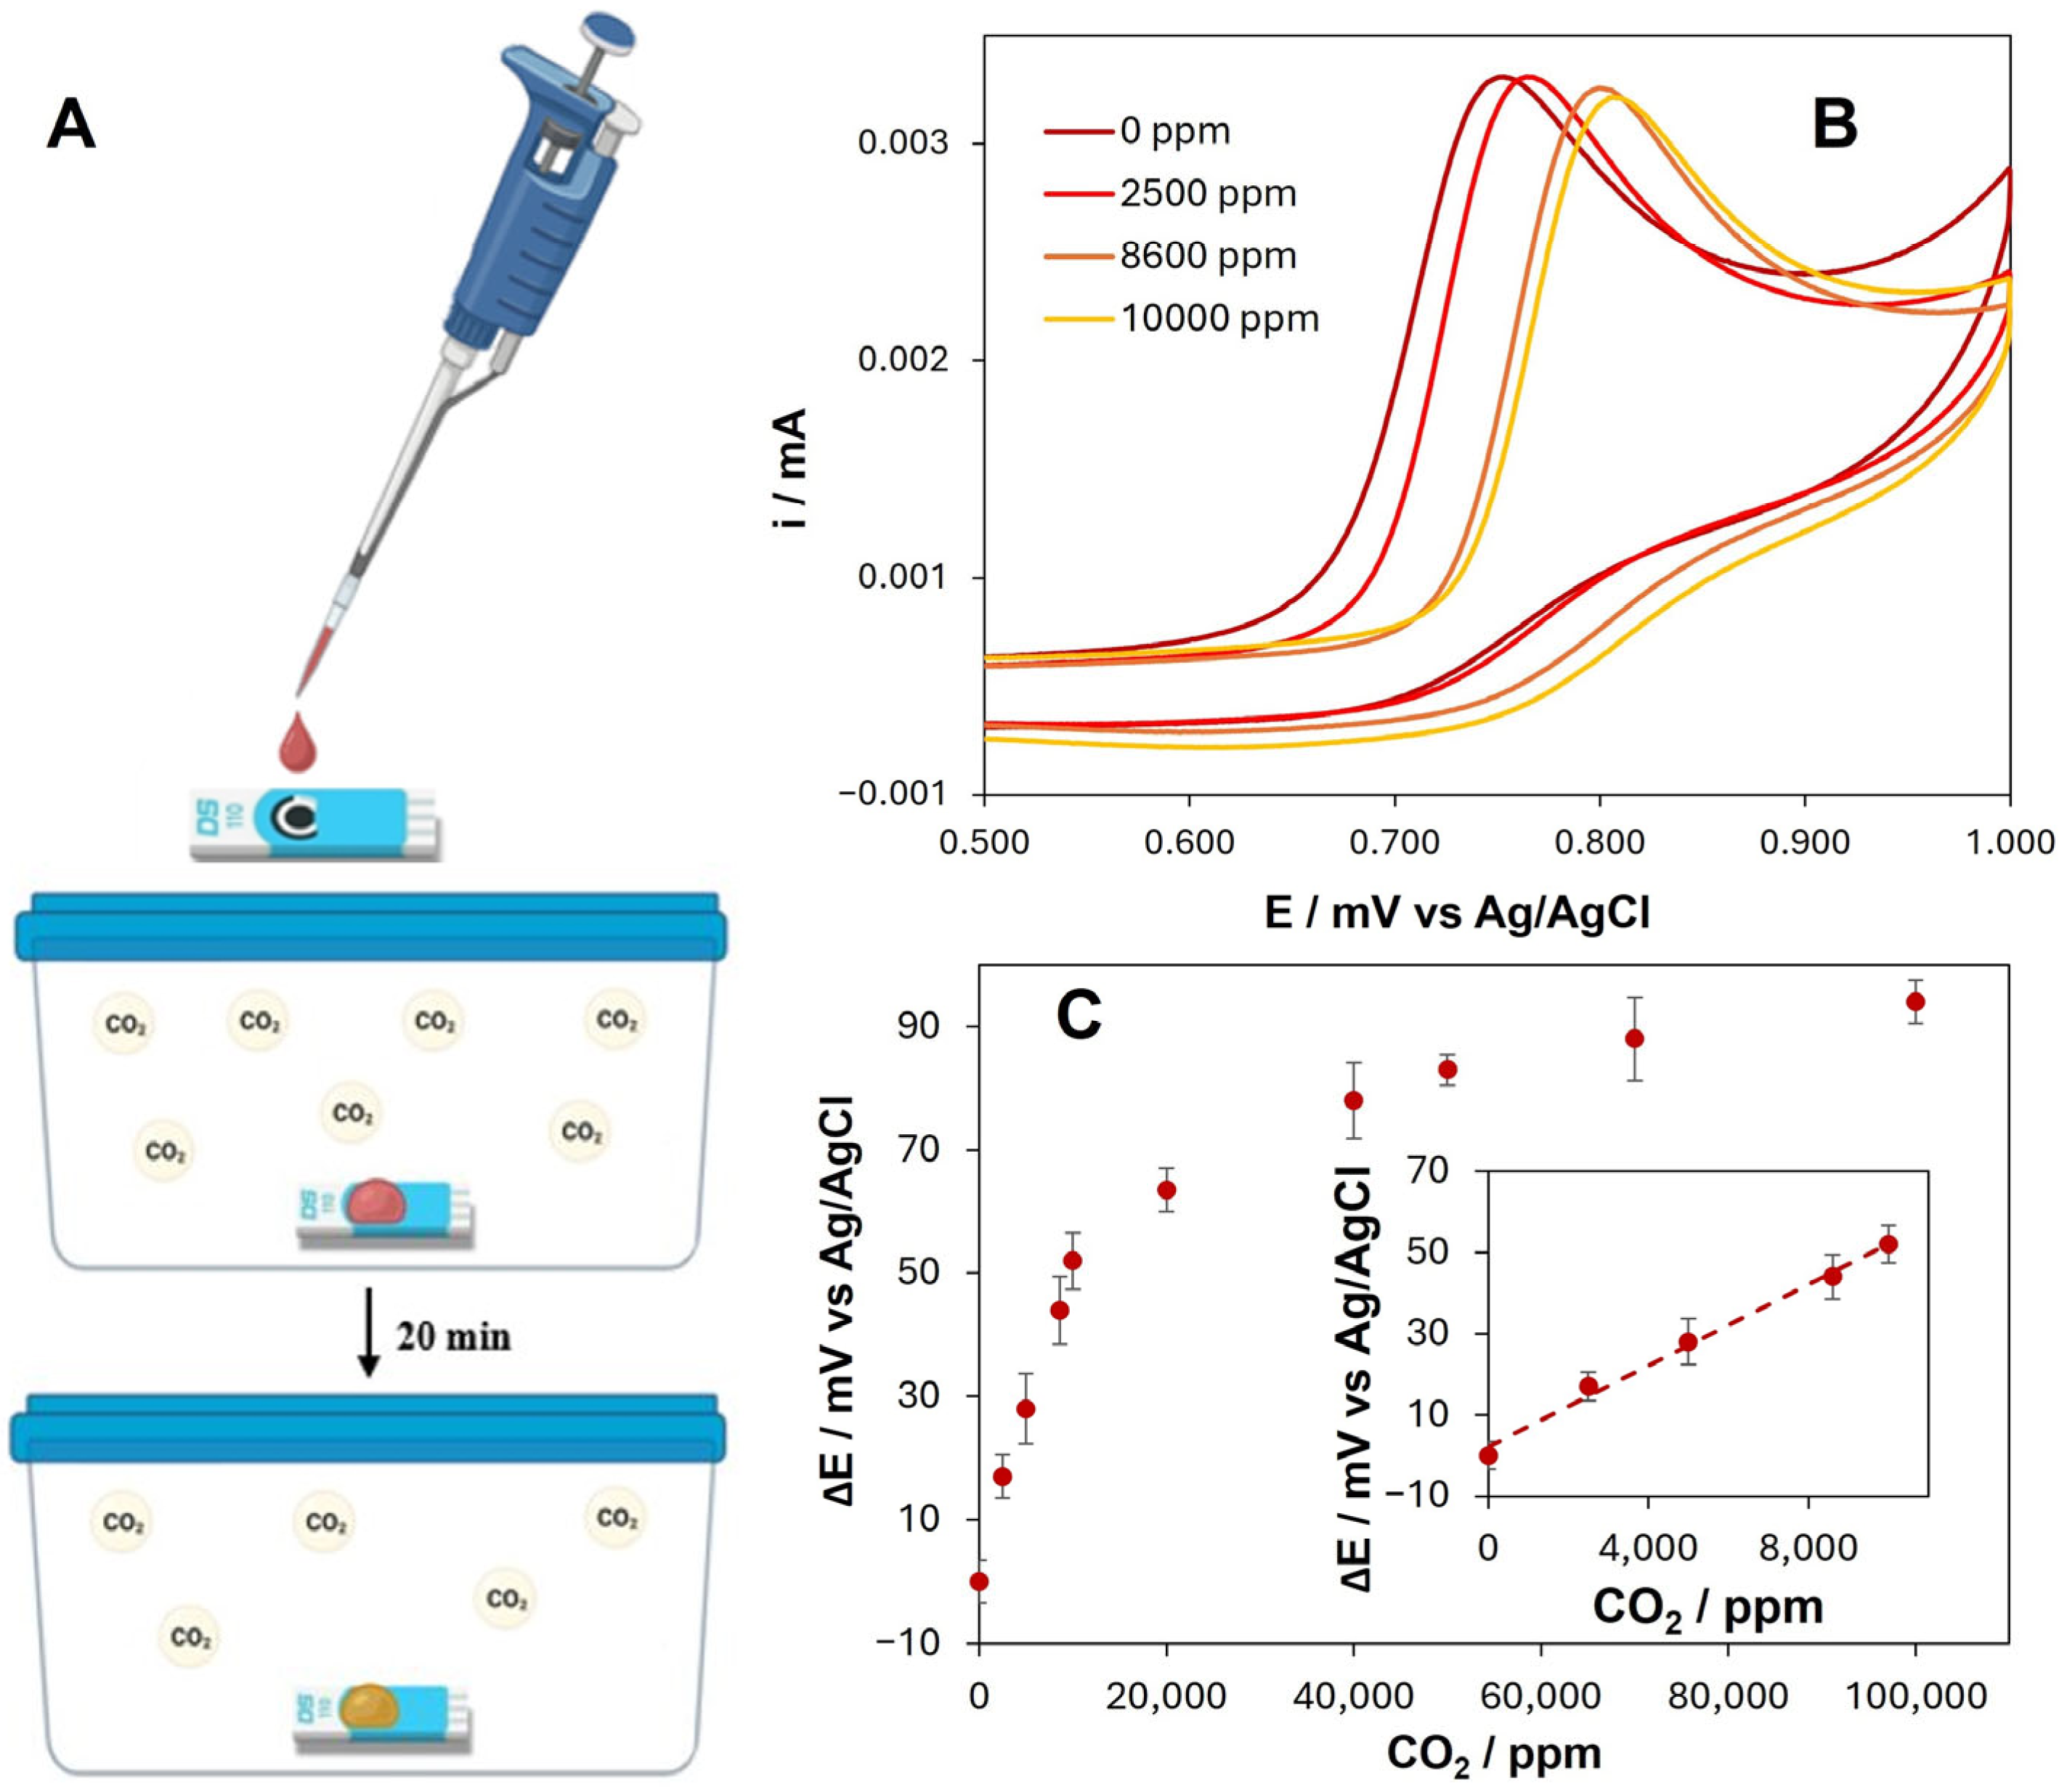
Following the promising results from exploratory voltammetric studies of the pH indicators in reline, we investigated the potential use of PR in hydrated DESs for CO2 quantification. Figure 5A provides a schematic representation of the concept. As an example, Figure 5B displays the voltammetric shift observed during the calibration experiments. The calibration curve, obtained using the setup described in the experimental section, is shown in Figure 5C, where CO2 concentrations were gradually increased. Voltammetric measurements were performed following a 20 min equilibration period, allowing CO2 absorption. These processes are influenced by the viscosity of the hydrated reline, which was determined to be 36.16 mPa·s at 20 °C. Equation (1) was chosen using Origin pro 2021 Software, selecting the fitting function that provided the highest coefficient of determination (R2 = 0.997) and best represented the experimental data.
y = x a + b x + c x
a = 107.28; b = 0.0093; c = 0.01216;
The limit of detection (LOD), calculated as three times the standard deviation of the blank signal divided by the slope of the calibration curve in the linear range, was determined to be 2083 ppm. The corresponding limit of quantification (LOQ), estimated by multiplying the LOD by 3.3, was 6875 ppm. As shown in Figure 5C, the inter-device reproducibility of the anodic peak potential obtained from three independently modified SPCEs used on different days exhibit an RSD below 5%, indicating good fabrication reproducibility.
We reported the calibration data using PR, as it provided the best results. Calibration was also performed with BCP (see Supplementary Materials Figure S7), while BTB was excluded due to its poor solubility in reline solutions.
The analytical figures of merit of the proposed indicator-based electrochemical approach are summarized in Table 1 and compared with some representative gas CO2 sensing methods reported in the literature. While conventional colorimetric sensors based on pH indicators often achieve lower detection limits, they typically rely on optical readout and may require spectrophotometric instrumentation or controlled illumination conditions. In contrast, the present method exploits the voltammetric oxidation potential shift of acid–base indicators solubilized in a deep eutectic solvent, offering an alternative electrochemical transduction mechanism, while many other electrochemical approaches rely, for example, on membrane-based electrodes [41] or require high-temperature operating conditions [42], which are not compatible with smart packaging applications.
The achieved LOD of 2083 ppm is well suited for applications related to food packaging and freshness monitoring, where CO2 concentrations generally fall within the high-ppm to percent range. Moreover, the use of DESs as the sensing medium provides additional advantages in terms of safety, chemical stability, and compatibility with screen-printed electrodes, while avoiding volatile or toxic electrolytes. Although nondispersive infrared (NDIR) sensors offer superior sensitivity, they are typically more expensive and less suitable for disposable or low-cost sensing platforms. Overall, the proposed approach is designed for single use and represents a favorable compromise between sensitivity, simplicity, and applicability, extending the use of conventional pH indicators beyond optical detection toward electrochemical CO2 sensing in static atmospheric systems.

3.5. Food Sample Analysis

Lastly, the applicability of this approach was evaluated by monitoring the respiration of fruits and vegetables, used as markers of ripening within the food supply chain. Table 2 presents the results relative to CO2 concentrations in ppm of different samples of avocado, banana, broccoli, mushrooms and Golden Delicious apples. The percentage error was calculated relative to the reference commercial NDIR sensor, Aranet4.
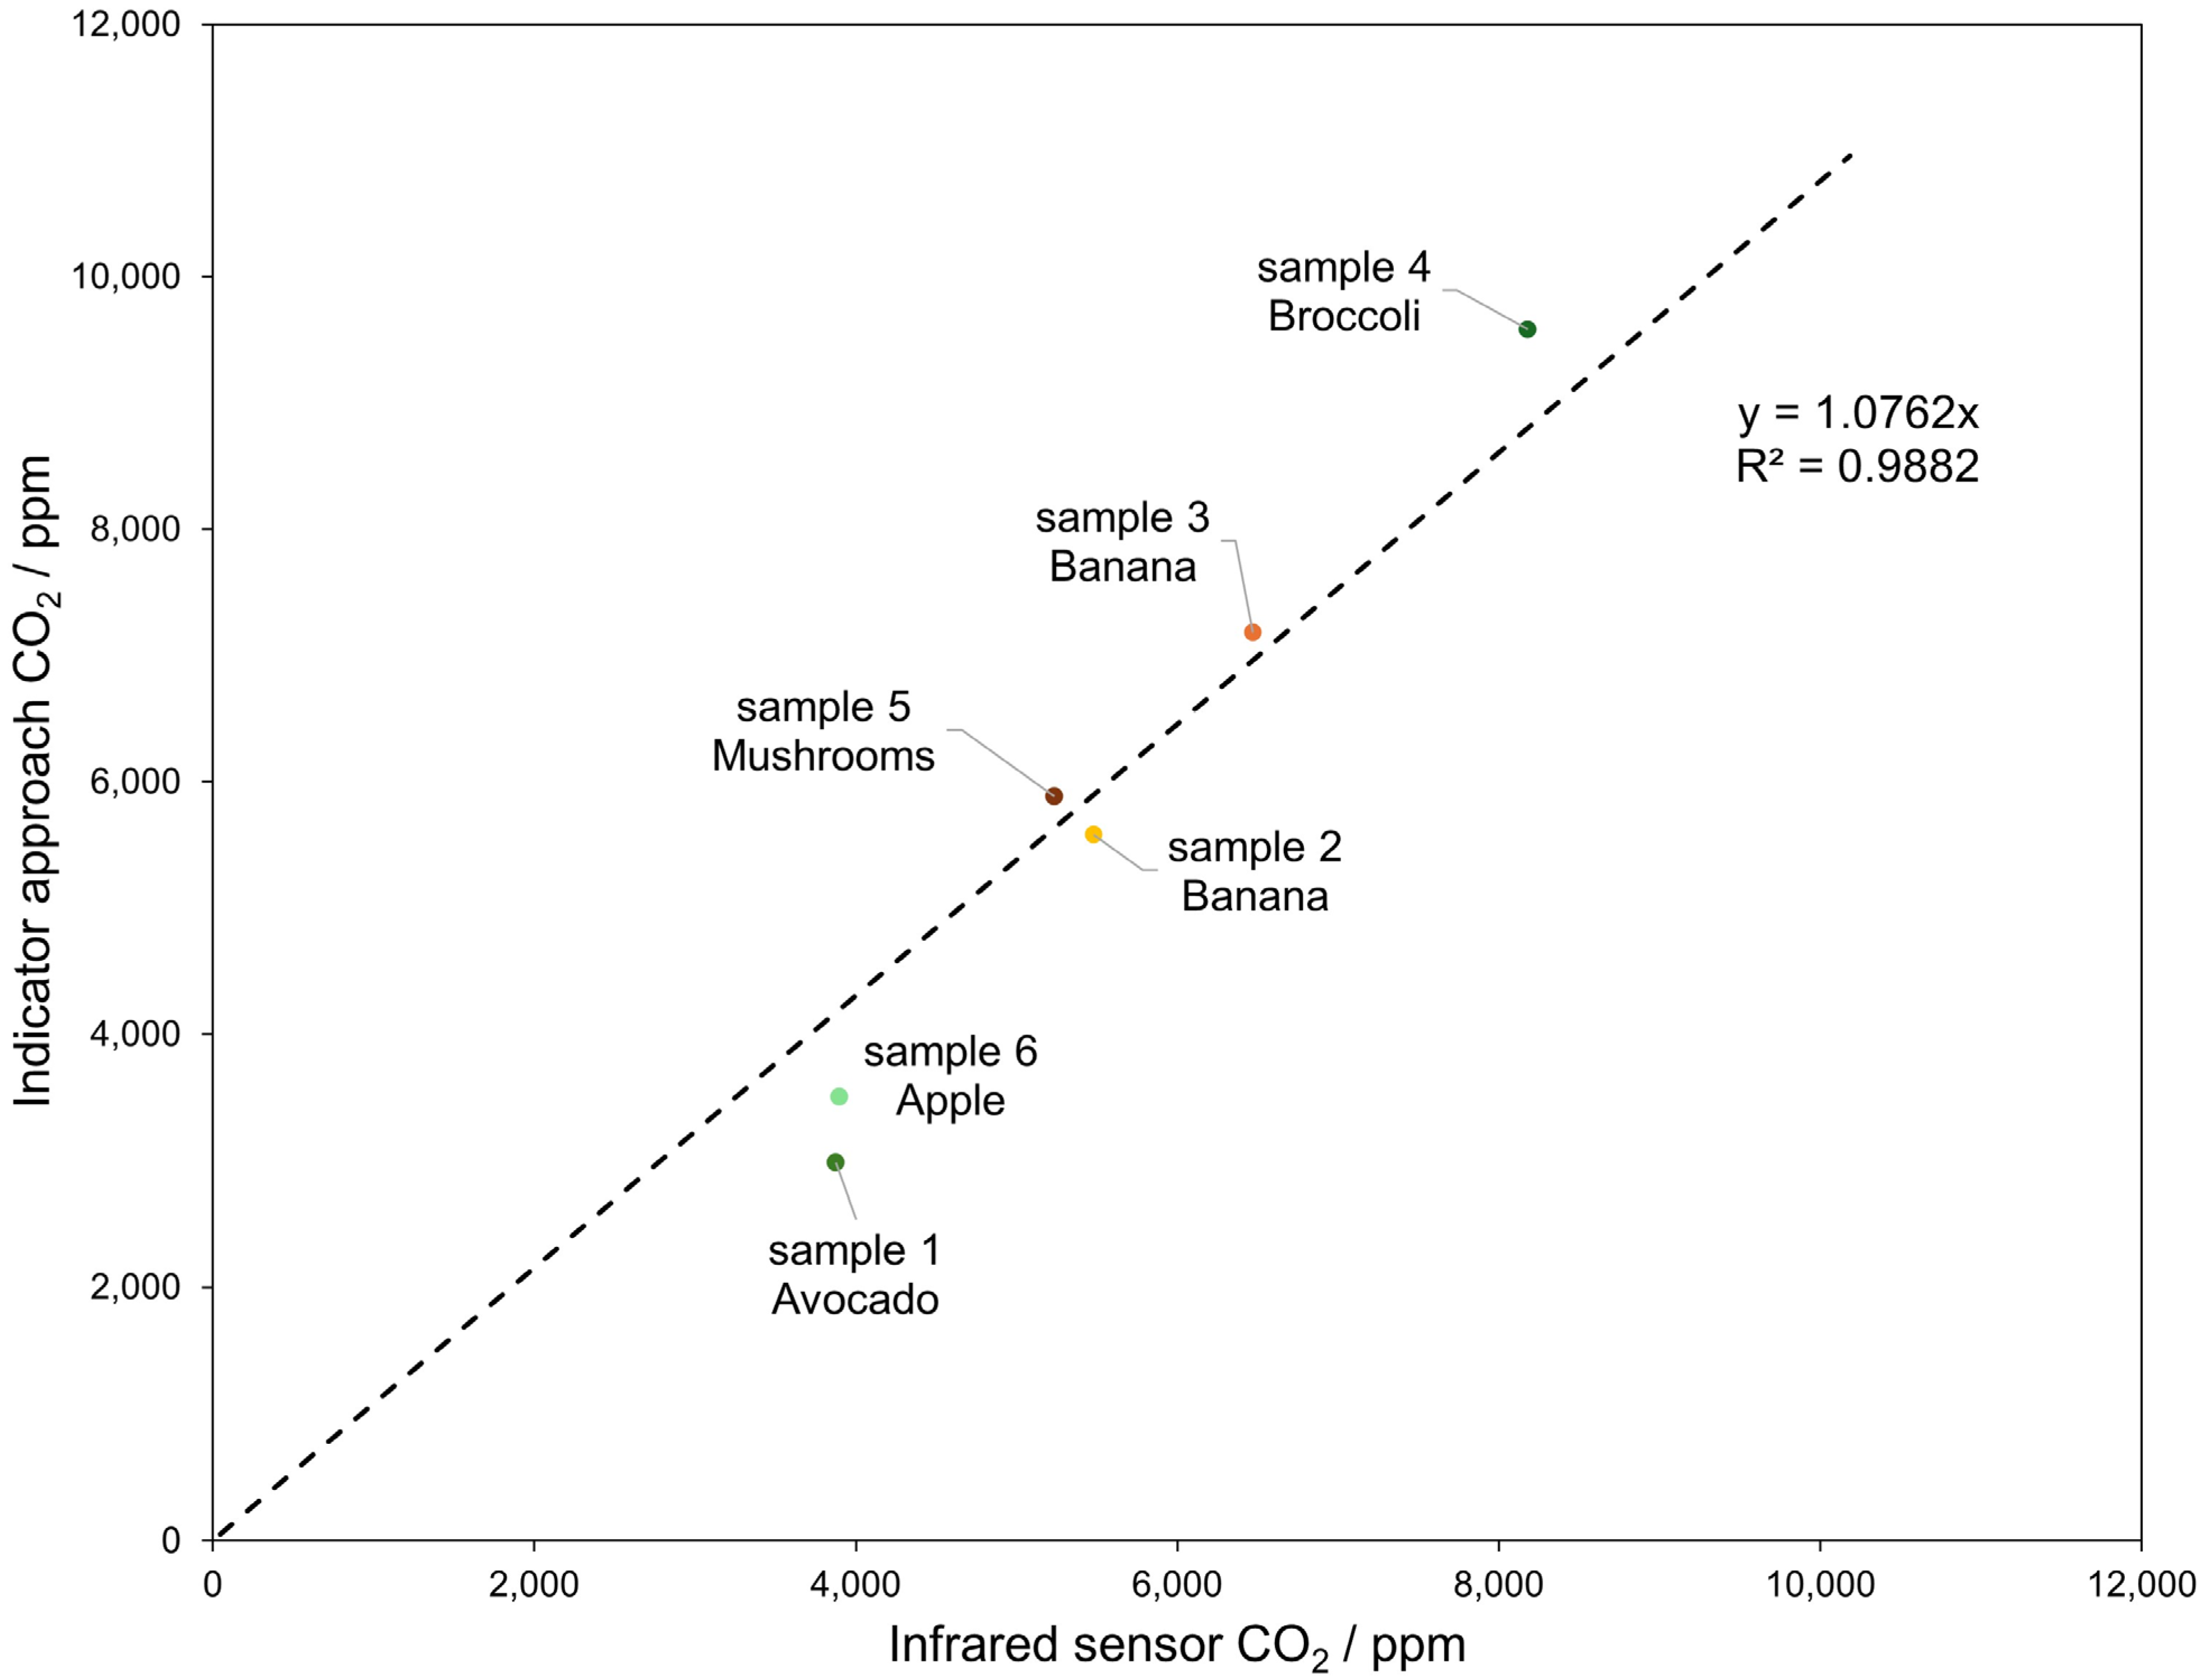
As shown in Figure 6, there is a good correlation (R2 = 0.9882) with the measurements obtained using the Aranet sensor. In addition, to assess potential interferences on the voltammetric signal, we performed selectivity tests using ethanol and acetaldehyde separately in concentrations comparable to those typically emitted by fruits. The results confirm the high selectivity of our sensor: in fact, the RSDs of the signal in the presence of ethanol was 0.56% and 0.80% for acetaldehyde, indicating negligible interference.

4. Conclusions

In this study, we investigated the potential use of acid–base indicators, typically employed for colorimetric determinations, by voltammetrically assessing the shift in their oxidation peak in DESs. The electrochemical behavior of the three indicators PR, BCP, and BTB was studied, revealing a strong correlation between the voltammetric peak shift and pH variation in a reline solution containing 10% water. This approach, applied for CO2 detection, exhibited an excellent correlation coefficient (R2 = 0.998) using nonlinear fitting, with limits of detection (LOD) and quantification (LOQ) of 2083 and 6875 ppm, respectively.
Furthermore, this setup performance was evaluated on real samples yielding promising results when compared with a commercially available infrared sensor. Overall, this work, essentially a proof of concept, proposes a new electrochemical sensing approach for CO2. Although the current configuration demonstrates good analytical performance, the sensing device could be further improved by replacing commercially available screen-printed carbon electrodes with paper-based substrates, in which pH indicators dissolved in hydrated deep eutectic solvents could be adsorbed rather than drop-cast. This methodology could potentially be extended to the detection of other gaseous analytes by tuning the pKa of the indicator, thereby enabling selective detection; in fact, gases such as sulfur dioxide (SO2), nitrogen dioxide (NO2), and ammonia (NH3) are particularly promising targets, as they readily interact with protonation equilibria and are known to cause pH changes upon dissolution. In these cases, the use of pH indicators with suitably tuned pKa values could enable selective sensitivity within relevant concentration ranges. For example, indicators with lower pKa values could be employed for strong acidic gases, whereas indicators with higher pKa values would be more appropriate for basic gases.

Supplementary Materials

The following supporting information can be downloaded at: https://www.mdpi.com/article/10.3390/chemosensors14020039/s1. Figure S1 Peak potential variation profile versus exposure time in a 10.000 ppm of CO2 concentration. Figure S2 Comparison of cyclic voltammograms recorded using SPCEs drop-cast with 30 µL of 0.5 mM of Bromocresol Purple (BCP) in Reline containing HCl 0.01 M or NaOH 0.01 M. The background currents are indicated by dashed lines. Scan rate: 50 mV·s−1. Figure S3 Comparison of cyclic voltammograms recorded using SPCEs drop-cast with 30 µL of 0.5 mM of Bromothymol Ble (BTB) in Reline containing HCl 0.01 M or NaOH 0.01 M. The background currents are indicated by dashed lines. Scan rate: 50 mV·s−1. Figure S4 Characteristic UV–visible spectra of PR at different pH values in hydrated reline. Figure S5 Characteristic UV–visible spectra of BCP at different pH values in hydrated reline. Figure S6 Characteristic UV–visible spectra of BTB at different pH values in hydrated reline. Figure S7 Bromocresol violet calibration curve obtained for increasing CO2 concentrations.

Author Contributions

Conceptualization, R.S. and R.T.; methodology, R.S. and F.Z.; investigation, R.S. and F.Z.; resources, R.T.; data curation, R.S. and F.Z.; writing—original draft preparation, R.S. and R.T.; visualization, F.Z.; supervision, R.T. and R.S. All authors have read and agreed to the published version of the manuscript.

Funding

This research was funded by the Italian Ministry of University and Research (PON 2014–2020, Action IV.6, 34-G-19900-3, project title: “Smart Green Biosensors To Improve Food Sustainability and Environmental Preservation”). This research was supported by co-funded resources from the European Social Fund Plus (FSE+) under the Regional Programme of the Autonomous Region Friuli Venezia Giulia.

Institutional Review Board Statement

Not applicable.

Informed Consent Statement

Not applicable.

Data Availability Statement

The original contributions presented in this study are included in the article/Supplementary Material. Further inquiries can be directed to the corresponding authors.

Conflicts of Interest

The authors declare no competing interests.

References

  1. Bhadra, S.; Thomson, D.J.; Bridges, G.E. Monitoring acidic and basic volatile concentration using a pH-electrode based wireless passive sensor. Sens. Actuators B Chem. 2015, 209, 803–810. [Google Scholar] [CrossRef]
  2. Chatterjee, C.; Sen, A. Sensitive colorimetric sensors for visual detection of carbon dioxide and sulfur dioxide. J. Mater. Chem. A 2015, 3, 5642–5647. [Google Scholar] [CrossRef]
  3. Puligundla, P.; Jung, J.; Ko, S. Carbon dioxide sensors for intelligent food packaging applications. Food Control 2012, 25, 328–333. [Google Scholar] [CrossRef]
  4. Lin, T.; Li, J. High-performance ammonia sensing electrode based on a graphene/porphyrin–polyaniline nanocomposite material. ACS Appl. Electron. Mater. 2025, 7, 5153–5164. [Google Scholar] [CrossRef]
  5. Rossi, A.; Spagnoli, E.; Visonà, A.; Ahmed, D.; Marzocchi, M.; Guidi, V.; Fabbri, B. SO2 detection over a wide range of concentrations: An exploration on MOX-based gas sensors. Chemosensors 2024, 12, 111. [Google Scholar] [CrossRef]
  6. Lamberty, A.; Kreyenschmidt, J. Ambient parameter monitoring in fresh fruit and vegetable supply chains using internet of things-enabled sensor and communication technology. Foods 2022, 11, 1777. [Google Scholar] [CrossRef]
  7. Alam, A.U.; Rathi, P.; Beshai, H.; Sarabha, G.K.; Deen, M.J. Fruit quality monitoring with smart packaging. Sensors 2021, 21, 1509. [Google Scholar] [CrossRef]
  8. Kahlert, H.; Meyer, G.; Albrecht, A. Colour maps of acid–base titrations with colour indicators: How to choose the appropriate indicator and how to estimate the systematic titration errors. ChemTexts 2016, 2, 7. [Google Scholar] [CrossRef]
  9. Tucker, S.A.; Bates, H.C.; Acree, W.E. Acid-Base Indicators: Transition colours and pH ranges determined in select aqueous-organic mixed solvents. Analyst 1995, 129, 181–188. [Google Scholar] [CrossRef]
  10. Liu, D.; Zhang, C.; Pu, Y.; Chen, S.; Liu, L.; Cui, Z.; Zhong, Y. Recent advances in pH-responsive freshness indicators using natural food colorants to monitor food freshness. Foods 2022, 11, 1884. [Google Scholar] [CrossRef]
  11. Wolfbeis, O.S.; Kovàcs, B.; Goswami, K.; Klainer, S.M. Fiber-optic fluorescence carbon dioxide sensor for environmental monitoring. Mikrochim. Acta 1998, 129, 181–188. [Google Scholar] [CrossRef]
  12. Bartoš, D.; Rewers, M.; Wang, L.; Sørensen, T.J. Incorporating fluorescent nanomaterials in organically modified sol–gel materials—Creating single composite optical pH sensors. Sens. Diagn. 2022, 1, 185–192. [Google Scholar] [CrossRef]
  13. Vasylevska, A.S.; Karasyov, A.A.; Borisov, S.M.; Krause, C. Novel coumarin-based fluorescent pH indicators, probes and membranes covering a broad pH range. Anal. Bioanal. Chem. 2007, 387, 2131–2141. [Google Scholar] [CrossRef]
  14. Mi, C.; Cheng, X.; Ning, Y.; Yan, Y.; Li, J.; Wang, L. Colorimetric wood-based CO2 sensor with dendrite structures via synergistic delignification-quaternization for monitoring fresh-cut mango freshness. Sens. Actuators B Chem. 2026, 449, 139143. [Google Scholar] [CrossRef]
  15. Saputra, H.A. Electrochemical sensors: Basic principles, engineering, and state of the art. Monatsh. Chem. 2023, 154, 1083–1100. [Google Scholar] [CrossRef]
  16. Galiński, M.; Lewandowski, A.; Stępniak, I. Ionic liquids as electrolytes. Electrochim. Acta 2006, 51, 5567–5580. [Google Scholar] [CrossRef]
  17. Wei, D.; Ivaska, A. Applications of ionic liquids in electrochemical sensors. Anal. Chim. Acta 2008, 607, 126–135. [Google Scholar] [CrossRef]
  18. Zuliani, I.; Fattori, A.; Svigelj, R.; Dossi, N.; Grazioli, C.; Bontempelli, G.; Toniolo, R. Amperometric detection of ethanol vapors by screen printed electrodes modified by paper crowns soaked with room temperature ionic liquids. Electroanalysis 2023, 35, e202200150. [Google Scholar] [CrossRef]
  19. Behera, K.; Pandey, S.; Kadyan, A.; Pandey, S. Ionic liquid-based optical and electrochemical carbon dioxide sensors. Sensors 2015, 15, 30487–30503. [Google Scholar] [CrossRef]
  20. Wan, H.; Yin, H.; Lin, L.; Zeng, X.; Mason, A.J. Miniaturized planar room temperature ionic liquid electrochemical gas sensor for rapid multiple gas pollutants monitoring. Sens. Actuators B Chem. 2018, 255, 638–646. [Google Scholar] [CrossRef]
  21. Huang, Q.; Li, W.; Wu, T.; Ma, X.; Jiang, K.; Jin, X. Monoethanolamine-enabled electrochemical detection of H2S in a hydroxyl-functionalized ionic liquid. Electrochem. Commun. 2018, 88, 93–96. [Google Scholar] [CrossRef]
  22. Toniolo, R.; Dossi, N.; Pizzariello, A.; Doherty, A.P.; Susmel, S.; Bontempelli, G. An oxygen amperometric gas sensor based on its electrocatalytic reduction in room temperature ionic liquids. J. Electroanal. Chem. 2012, 670, 23–29. [Google Scholar] [CrossRef]
  23. Zhang, Q.; Vigier, K.; Royer, S.; jérôme, F. Deep eutectic solvents: Syntheses, properties and applications. Chem. Soc. Rev. 2012, 41, 7108–7146. [Google Scholar] [CrossRef] [PubMed]
  24. Durand, E.; Lecomte, J.; Villeneuve, P. From green chemistry to nature: The versatile role of low transition temperature mixtures. SI Lipids Biosynth. Funct. 2016, 120, 119–123. [Google Scholar] [CrossRef] [PubMed]
  25. Hansen, B.B.; Spittle, S.; Chen, B.; Poe, D.; Zhang, Y.; Klein, J.M.; Horton, A.; Adhikari, L.; Zelovich, T.; Doherty, B.W.; et al. Deep eutectic solvents: A review of fundamentals and applications. Chem. Rev. 2021, 121, 1232–1285. [Google Scholar] [CrossRef]
  26. Abbott, A.P.; Boothby, D.; Capper, G.; Davies, D.L.; Rasheed, R.K. Deep eutectic solvents formed between choline chloride and carboxylic acids:  Versatile alternatives to ionic liquids. J. Am. Chem. Soc. 2004, 126, 9142–9147. [Google Scholar] [CrossRef]
  27. Li, X.; Hou, M.; Han, B.; Wang, X.; Zou, L. Solubility of CO2 in a Choline Chloride + Urea Eutectic Mixture. J. Chem. Eng. Data 2008, 53, 548–550. [Google Scholar] [CrossRef]
  28. Gabriele, F.; Chiarini, M.; Germani, R.; Tiecco, M.; Spreti, N. Effect of water addition on choline chloride/glycol deep eutectic solvents: Characterization of their structural and physicochemical properties. J. Mol. Liq. 2019, 291, 111301. [Google Scholar] [CrossRef]
  29. Hammond, O.S.; Bowron, D.T.; Edler, K.J. The effect of water upon deep eutectic solvent nanostructure: An unusual transition from ionic mixture to aqueous solution. Angew. Chem. Int. Ed. 2017, 56, 9782–9785. [Google Scholar] [CrossRef]
  30. Du, C.; Zhao, B.; Chen, X.-B.; Birbilis, N.; Yang, H. Effect of water presence on choline chloride-2urea ionic liquid and coating platings from the hydrated ionic liquid. Sci. Rep. 2016, 6, 29225. [Google Scholar] [CrossRef]
  31. Wang, B.; Zhang, W.; Lv, F.; Dai, Y.; Ren, S.; Wu, W. Advances in CO2 absorption by deep eutectic solvents. J. Chem. Eng. Data 2024, 69, 4288–4309. [Google Scholar] [CrossRef]
  32. Rioboó-Legaspi, P.; González-López, A.; Beltrán-Sánchez, J.F.; Cabal, C.; García-Suárez, M.; Sánchez, A.G.; Fernández-Otero, T.; Haro, J.G.; Costa-Rama, E.; Fernández-Abedul, M. Phenol red as electrochemical indicator for highly sensitive quantification of SARS-CoV-2 by loop-mediated isothermal amplification detection. Talanta 2024, 266, 124963. [Google Scholar] [CrossRef]
  33. González-López, A.; Cima-Cabal, M.D.; Rioboó-Legaspi, P.; Costa-Rama, E.; García-Suárez, M.d.M.; Fernández-Abedul, M.T. Electrochemical detection for isothermal loop-mediated amplification of pneumolysin gene of Streptococcus pneumoniae based on the oxidation of phenol red indicator. Anal. Chem. 2022, 94, 13061–13067. [Google Scholar] [CrossRef]
  34. Fonseca, S.; Oliveira, F.; Brecht, J. Modeling respiration rate of fresh fruits and vegetables for modified atmosphere packages: A review. J. Food Eng. 2002, 52, 99–119. [Google Scholar] [CrossRef]
  35. Produce Facts Sheets|Postharvest Research and Extension Center. 2025. Available online: https://postharvest.ucdavis.edu/produce-facts-sheets (accessed on 14 September 2025).
  36. Puschett, J.B.; Rao, B.S.; Karandikar, B.M.; Matyjaszewski, K. Indicator characteristics of bromothymol blue derivatives. Talanta 1991, 38, 335–338. [Google Scholar] [CrossRef]
  37. King, D.W.; Kester, D.R. Spectral modeling of sulfonephthalein indicators: Application to pH measurements using multiple indicators. Appl. Spectrosc. 1990, 44, 722–727. [Google Scholar] [CrossRef]
  38. Hsieh, M.-T.; Whang, T.-J. Mechanistic investigation on the electropolymerization of phenol red by cyclic voltammetry and the catalytic reactions toward acetaminophen and dopamine using poly(phenol red)-modified GCE. J. Electroanal. Chem. 2017, 795, 130–140. [Google Scholar] [CrossRef]
  39. Abbott, A.P.; Alabdullah, S.S.M.; Al-Murshedi, A.Y.M.; Ryder, K.S. Brønsted acidity in deep eutectic solvents and ionic liquids. Faraday Discuss 2018, 206, 365–377. [Google Scholar] [CrossRef]
  40. Sirviö, J.A.; Haataja, R.; Kantola, A.M.; Suopajärvi, T.; Liimatainen, H. Insights into the role of molar ratio and added water in the properties of choline chloride and urea-based eutectic mixtures and their cellulose swelling capacity. Phys. Chem. Chem. Phys. 2022, 24, 28609–28620. [Google Scholar] [CrossRef]
  41. Severinghaup, J.W.; Freeman, A. Electrodes for blood pO2, and pCO2, determination. J. Appl. Physiol. 1958, 13, 515–520. [Google Scholar] [CrossRef]
  42. Wang, L.; Kumar, R.V. A novel carbon dioxide gas sensor based on solid bielectrolyte. Sens. Actuators B Chem. 2003, 88, 292–299. [Google Scholar] [CrossRef]
  43. Grasso, S.; Zompanti, A.; Sabatini, A.; Pazzaglia, I.; Santonico, M.; Pennazza, G. Optical CO2 detectors for smart packaging of food in modified atmosphere. In Proceedings of the 2020 IEEE International Workshop on Metrology for Industry 4.0 & IoT, Rome, Italy, 3–5 June 2020; IEEE: New York, NY, USA, 2020; pp. 334–339. [Google Scholar]
  44. Jia, X.; Roels, J.; Baets, R.; Roelkens, G. A miniaturised, fully integrated NDIR CO2 sensor on-chip. Sensors 2021, 21, 5347. [Google Scholar] [CrossRef] [PubMed]
  45. Xu, M.; Tian, W.; Lin, Y.; Xu, Y.; Tao, J. Development of a compact NDIR CO2 gas sensor for a portable gas analyzer. Micromachines 2024, 15, 1203. [Google Scholar] [CrossRef] [PubMed]
  46. Lyu, J.S.; Choi, I.; Hwang, K.-S.; Lee, J.-Y.; Seo, J.; Kim, S.Y.; Han, J. Development of a BTB−/TBA+ ion-paired dye-based CO2 indicator and its application in a multilayered intelligent packaging system. Sens. Actuators B Chem. 2019, 282, 359–365. [Google Scholar] [CrossRef]
Figure 1. Comparison of cyclic voltammograms recorded on SPCEs drop-cast with 30 µL of 0.5 mM PR in PBS at pH 6 (yellow solid line), pH 7 (red solid line), and pH 8 (brown solid line). The background currents are reported as dashed lines. Scan rate: 50 mV/s.
Chemosensors 14 00039 g001
Figure 2. Comparison of cyclic voltammograms recorded on SPCEs drop-cast with 30 µL of 0.5 mM BCP in PBS at pH 6 (orange solid line), pH 7 (red solid line), and pH 8 (brown solid line). The background currents are reported as dashed lines. Scan rate: 50 mV/s.
Chemosensors 14 00039 g002
Figure 3. Comparison of cyclic voltammograms recorded on SPCEs drop-cast with 30 µL of 0.1 mM BTB in PBS at pH 6 (light green solid line), pH 7 (green solid line), and pH 8 (dark green solid line). The background currents are reported as dashed lines. Scan rate: 50 mV·s−1.
Chemosensors 14 00039 g003
Figure 4. Comparison of cyclic voltammograms recorded using SPCEs drop-cast with 30 µL of 0.5 mM PR in reline containing HCl 0.01 M or NaOH 0.01 M. The background currents are indicated by dashed lines. Scan rate: 50 mV·s−1.
Chemosensors 14 00039 g004
Figure 5. (A) Conceptual illustration of the measurement setup. (B) Representative cyclic voltammograms demonstrating the potential shift. (C) Calibration curve obtained for increasing CO2 concentrations; the inset displays the linear fit of the response in the linear region.
Chemosensors 14 00039 g005
Figure 6. Correlation plot between the quantification obtained with the developed sensor (y-axis) and that obtained with the reference method (x-axis). The dashed line represents the best-fit linear regression.
Chemosensors 14 00039 g006
Table 1. Comparison of the analytical performance of the proposed CO2 sensor with previously reported gas sensors.
MethodResponse TimeTemperatureRangeLimit of Detection (LOD)Reference
Colorimetric30–60 minRoom
temperature
ND *ND *[14]
Colorimetric30 minRoom
temperature
0–500,000 ppm8000 ppm–26,000 ppm
7000–16,000 ppm
[43]
NDIR30 sRoom
temperature
ND *~750 ppm[44]
NDIR3–6 s0–60 °C0–100,000 ppm90–94 ppm[45]
ColorimetricNDRoom
temperature
ND *ND *[46]
Electrochemical20–60 minRoom
temperature
0–50,000 ppm2083 ppmThis work
* not determined.
Table 2. CO2 quantification of the samples of avocado, banana, broccoli, mushrooms, and Golden Delicious apples by the indicator method and infrared comparison sensor; errors were calculated relative to infrared sensor measurements.
SamplesInfrared SensorIndicator ApproachError *
CO2 (ppm)CO2 (ppm)%
Sample 1
avocado
2981 ± 1463877 ± 288±23%
Sample 2
banana
5581 ± 1945477 ± 302±2%
Sample 3
banana
7181 ± 2246470 ± 382±11%
Sample 4
broccoli
9581 ± 2758182 ± 403±17%
Sample 5
mushrooms
5881 ± 1875235 ± 298±12%
Sample 6
apple
3500 ± 1473897 ± 329±10%
* The error was calculated based on the infrared sensor value.
Disclaimer/Publisher’s Note: The statements, opinions and data contained in all publications are solely those of the individual author(s) and contributor(s) and not of MDPI and/or the editor(s). MDPI and/or the editor(s) disclaim responsibility for any injury to people or property resulting from any ideas, methods, instructions or products referred to in the content.