Abstract
Gas chromatography with mass spectrometry (GC-MS) is a common analytical technique used for identifying and quantifying drugs of abuse, as well as their metabolites, extracted from biological samples. Depending on the properties of the analyzed compounds, particularly in the case of metabolites, derivatization is often necessary. In this article, we will address the definition, properties, sample preparation, and GC-MS analysis of the most common drugs of abuse in their native (seized) form and their metabolites in biological samples (urine, blood, hair, and tissue). Drugs that will be described are: amphetamines and their derivatives, cannabinoids, cocaine, opioids, lysergide (LSD), benzodiazepines, gamma-hydroxybutyric acid (GHB), phencyclidine (PCP), mescaline, psilocin, and psilocybin. The literature review showed that the analysis of the drugs of abuse requires a simple extraction procedure and analysis with or without derivatization. However, the analysis of the metabolites requires removing the interferences from the matrix (proteins, other compounds, water, and other species that may interfere with the analysis or contaminate the GC-MS). This review article will provide insights into the available procedures for sample preparation and analytical methods, helping authors gain the necessary information and select the desired procedure for analysis.
1. Introduction
Gas chromatography with mass spectrometry (GC-MS) is one of the most effective and commonly used techniques for analyzing seized drugs of abuse and their metabolites. For analysis of drug samples that can be volatilized, gas chromatography (GC) is a preferable analytical technique due to its considerable sensitivity and specificity, ability to analyze complex mixtures of substances, relatively low cost per analyzed sample (compared to other analytical techniques such as liquid chromatography), and accessibility to an extensive database. The most common detectors used in gas chromatography are the flame ionization detector (FID) and the mass spectrometer (MS), which are often used in combination. The FID detector is commonly used for the quantification of compounds due to its sensitivity, while MS can be used for both the identification and quantification of compounds. The primary drawback of using FID in gas chromatography is the inability to identify individual compounds. In contrast, with an MS detector, every signal can be confirmed by comparing its mass spectrum with a spectrum in the database. For accurate identification and quantification using GC-FID analysis, the use of standards for target compounds is necessary. For GC-MS, the use of standards is also needed for quantification [1].
Drugs of abuse are highly controlled or illicit chemicals with mind- and behavior-altering properties that are being misused (in the case of medications that are used for non-intended purposes), illegally produced, traded, and consumed (in the case of substances that are not produced for medical purposes). The production of some drugs of abuse and their distribution are tightly linked to criminal organizations, and their consumption is linked to crime, health problems, and death. Drugs of abuse are compounds that occur in nature, for example, THC (Δ9-tetrahydrocannabinol) as a secondary natural product of the Cannabis indica plant, or can be synthetic, for example, amphetamine [2]. Because of the wide range of different substances with diverse chemical structures and properties, their analysis can be challenging. The GC-MS technique is often considered the standard method for the analysis of drugs of abuse and their metabolites. Since GC-MS can only be applied to compounds that are volatile in some cases, it is necessary to derivatize the examined sample, especially in the case of metabolic products. This review article aimed to summarize the available analytical procedures and methods for analyzing drugs of abuse in their native form (seized samples) and biological samples (blood, hair, urine, and tissue) as metabolites. Developed analytical methods for GC-MS were also summarized, along with a description of the procedures. Furthermore, considering the specificity of the sample matrix, the procedures for sample cleaning, concentration, and analysis were summarized, described, and compared. Such insights will be helpful to the readers to gain information and select the desired method for analyzing drugs of abuse.
2. Introduction to Gas Chromatography
As mentioned above, gas chromatography is one of the most reliable and sensitive methods for analyzing the sizes of drugs of abuse and their metabolites. Compounds that can be analyzed by this method must be volatile at working temperatures or, if possible, they must be derivatized prior to analysis. A diluted sample is first injected into a liner connected to a capillary column, which is placed inside a GC oven. The liner is placed in an inlet that is sealed with a septum on top. The inlet is heated and under pressure by carrying gas (most commonly, helium is used as the carrying gas, but in some cases, hydrogen can also be used). The inlet temperature can be set to a constant value or increased at a specified heating rate from the starting to the final temperature. Inlet temperature and pressure depend on the method used during analysis. Different types of septa can be used in the inlet. However, they must be carefully selected based on the method used (most importantly, the maximum temperature of the inlet) to prevent septum bleeding, melting, or hardening, as well as contamination of the GC column with septum degradation products. Based on application and injection method, different types of liners can be selected. The two main injection modes are split and splitless. During the split mode, after the evaporation of solvent, only part of the sample is introduced to the GC column, while the rest is vented through the split vent. The split mode is usually used for concentrated samples. In the splitless mode, after solvent evaporation, the entire amount of sample is transferred to the GC column, and after 30–90 s, the sample residues are vented through the split vent [3]. This mode is useful for analyzing diluted samples and in cases of trace analysis. Typically, the initial temperature of the GC oven is set at 20–30 °C below the boiling point of the solvent used for sample dilution, and that temperature is maintained for 30–90 s. This ensures that most of the sample is transferred onto the GC column (usually 90–95%) [2,3].
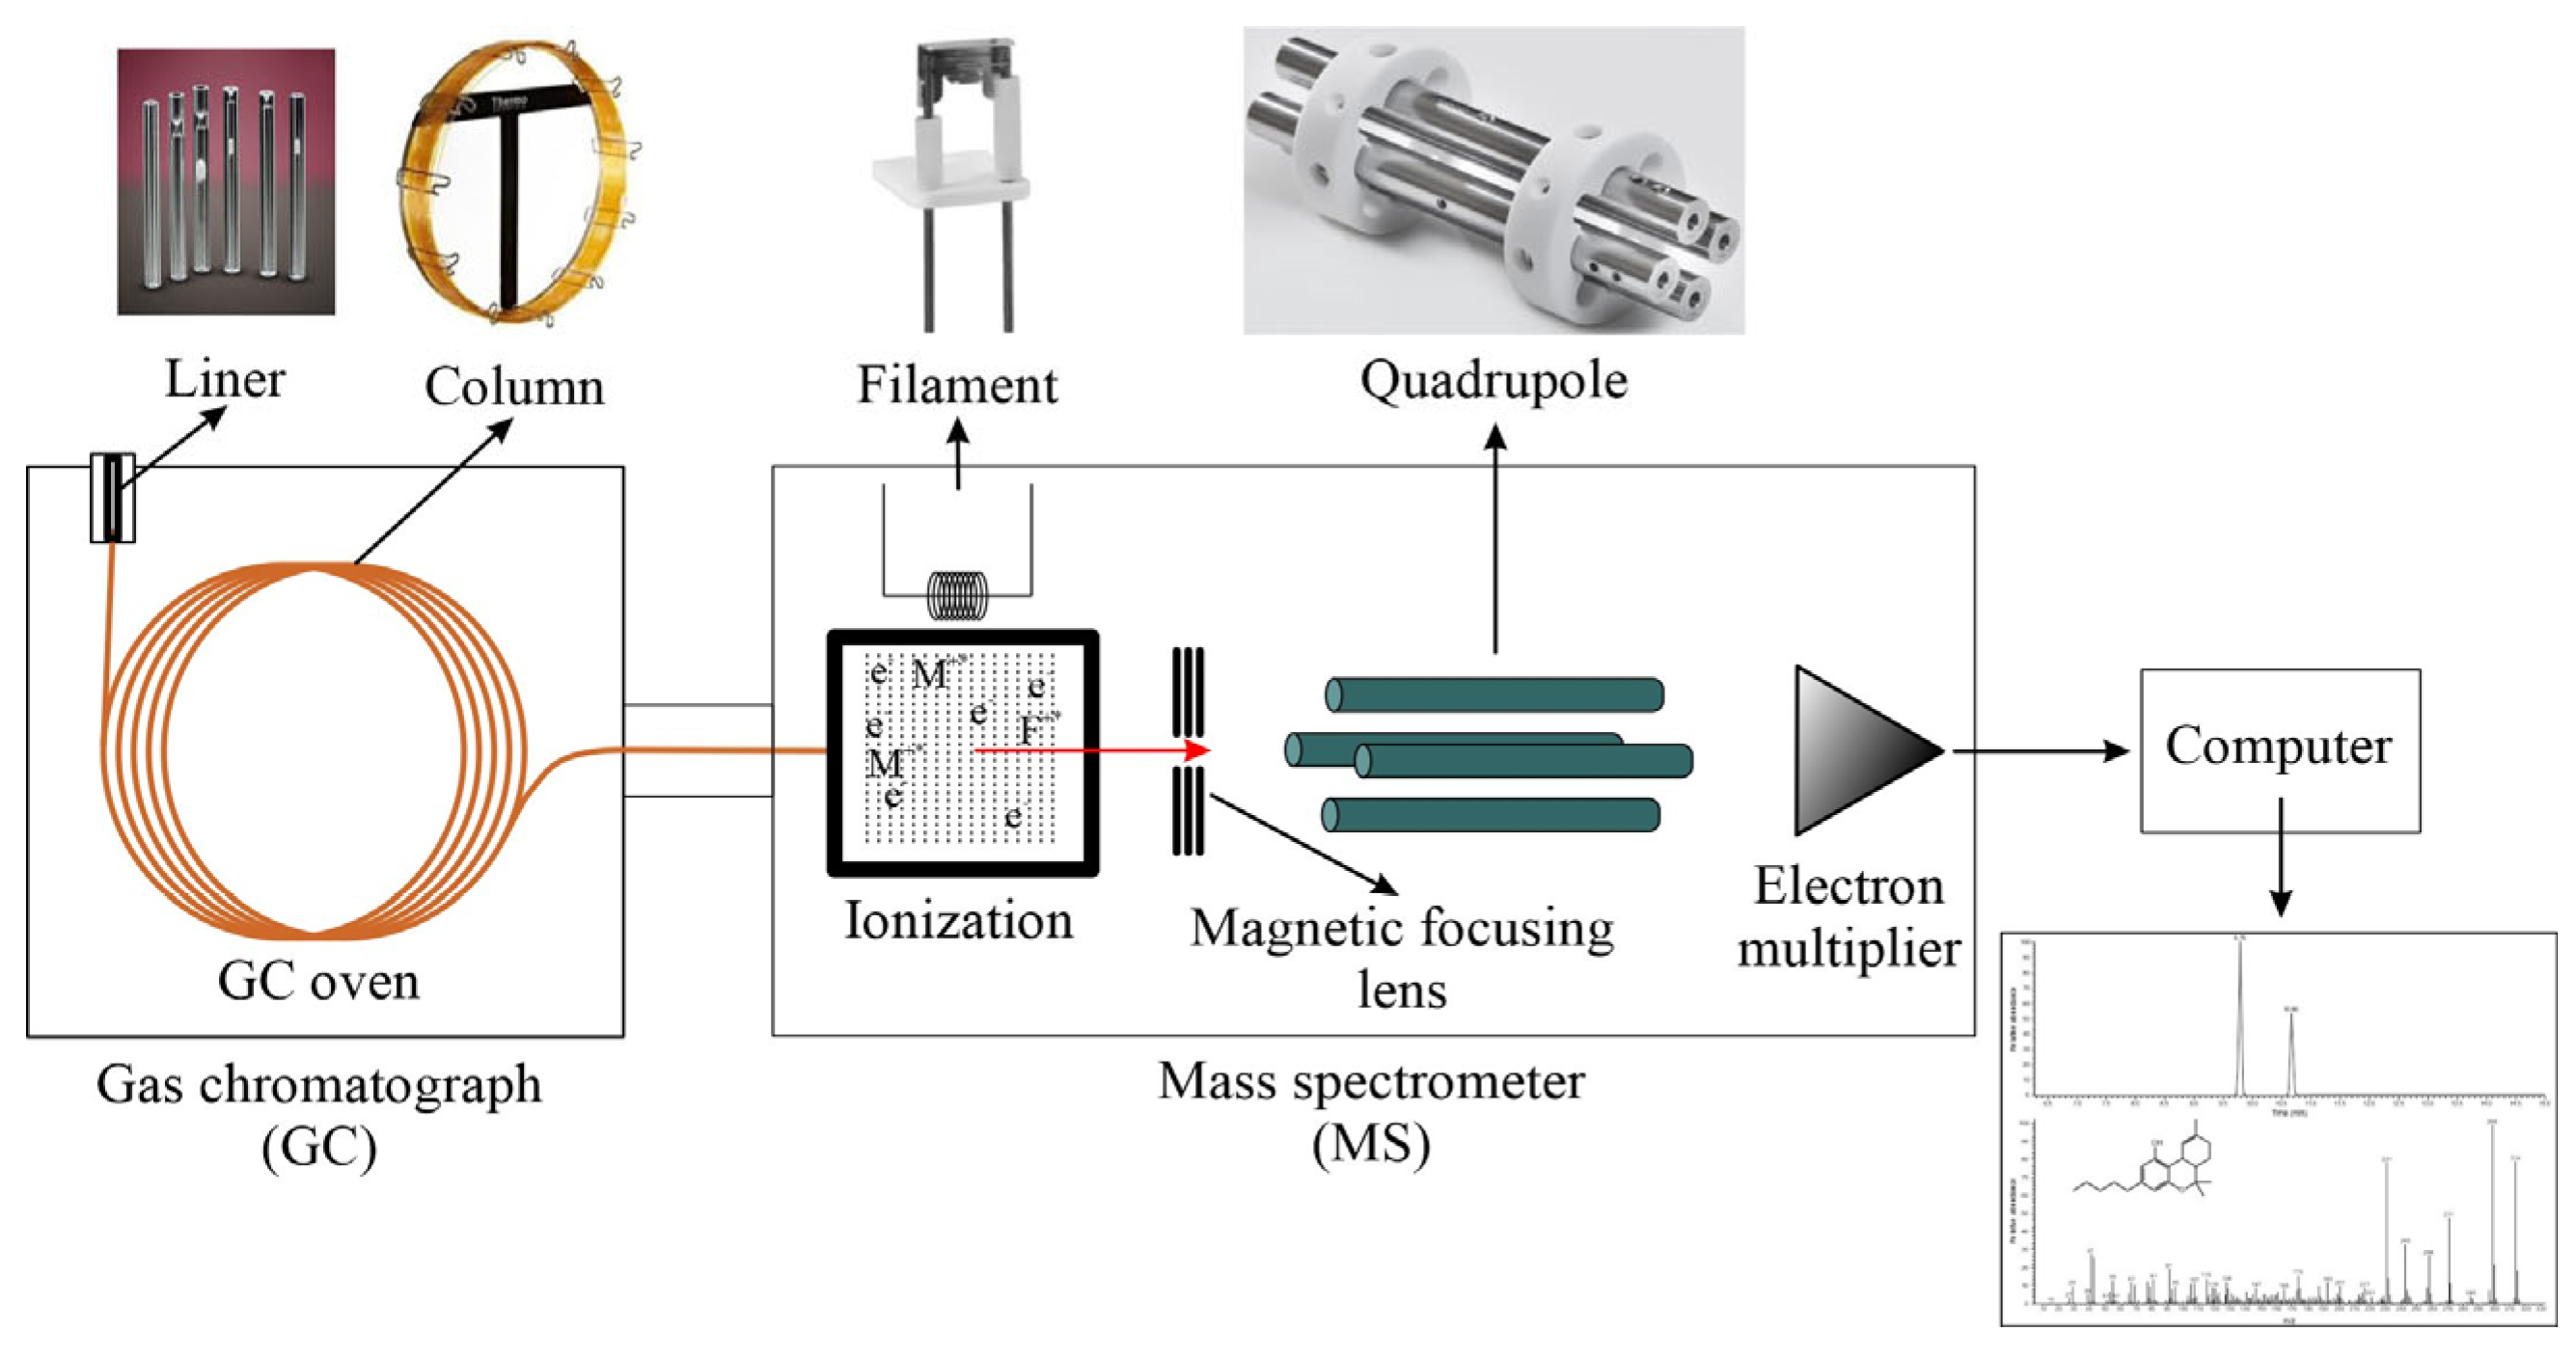
After the sample is transferred onto the chromatographic column, it is heated at a preset heating rate, allowing compounds to interact with the stationary phase of the column as the carrier gas carries them (Figure 1). The stationary phase of the GC column consists of a thin layer of synthetic polymer. Based on the composition of the polymer stationary phase, it exhibits different polarities and can be non-polar, polar, or somewhere in between. The stationary phase must be thermally stable at set temperatures, particularly high temperatures. The column manufacturer always specifies the highest allowed work temperature, polarity, and recommended application, and these must be carefully considered before analyzing specific compound classes. Different column stationary phases used for the analysis of drugs of abuse and their metabolites are presented in Table 1.
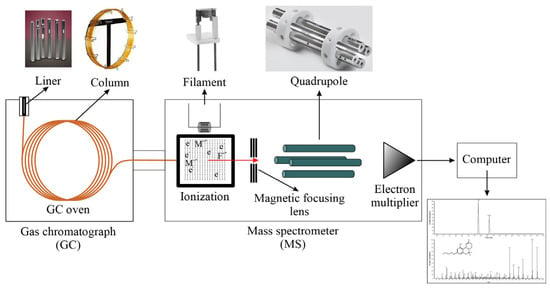
Figure 1.
Schematic of the gas chromatograph mass spectrometer (GC-MS) instrument.

Table 1.
Capillary columns, their stationary phases, operational temperatures, and recommended applications by Thermo Scientific.
During the heating of the column, compounds carried by the carrier gas (mobile phase) interact with the stationary phase, are separated, and are carried to the detector. Most commonly used detectors for the analysis of drugs of abuse are the flame ionization detector (FID) and the mass spectrometer (MS). Another important parameter that influences separation is film thickness. In general, a thicker film of the stationary phase is more suitable for analyzing gaseous and highly volatile compounds, as it allows for longer interaction with the stationary phase, thereby reducing their retention time. Additionally, a thicker film increases column load capacity, allowing for higher concentrations of analytes to be used. A thin film reduces the retention time due to the lower interaction of compounds with the stationary phase and has a lower column capacity; however, it is more suitable for higher temperatures. The column’s internal diameter influences the separation efficiency. Generally, a lower internal diameter increases column efficiency and can separate compounds with closely similar retention times; however, it also decreases the column’s load capacity. Another parameter that determines column efficiency is column length; with increased column length, the column efficiency increases, while the pressure of the mobile phase and analysis time also increase. Due to the price, it should be considered whether using a column with a smaller internal diameter is preferable to using a longer one [3].
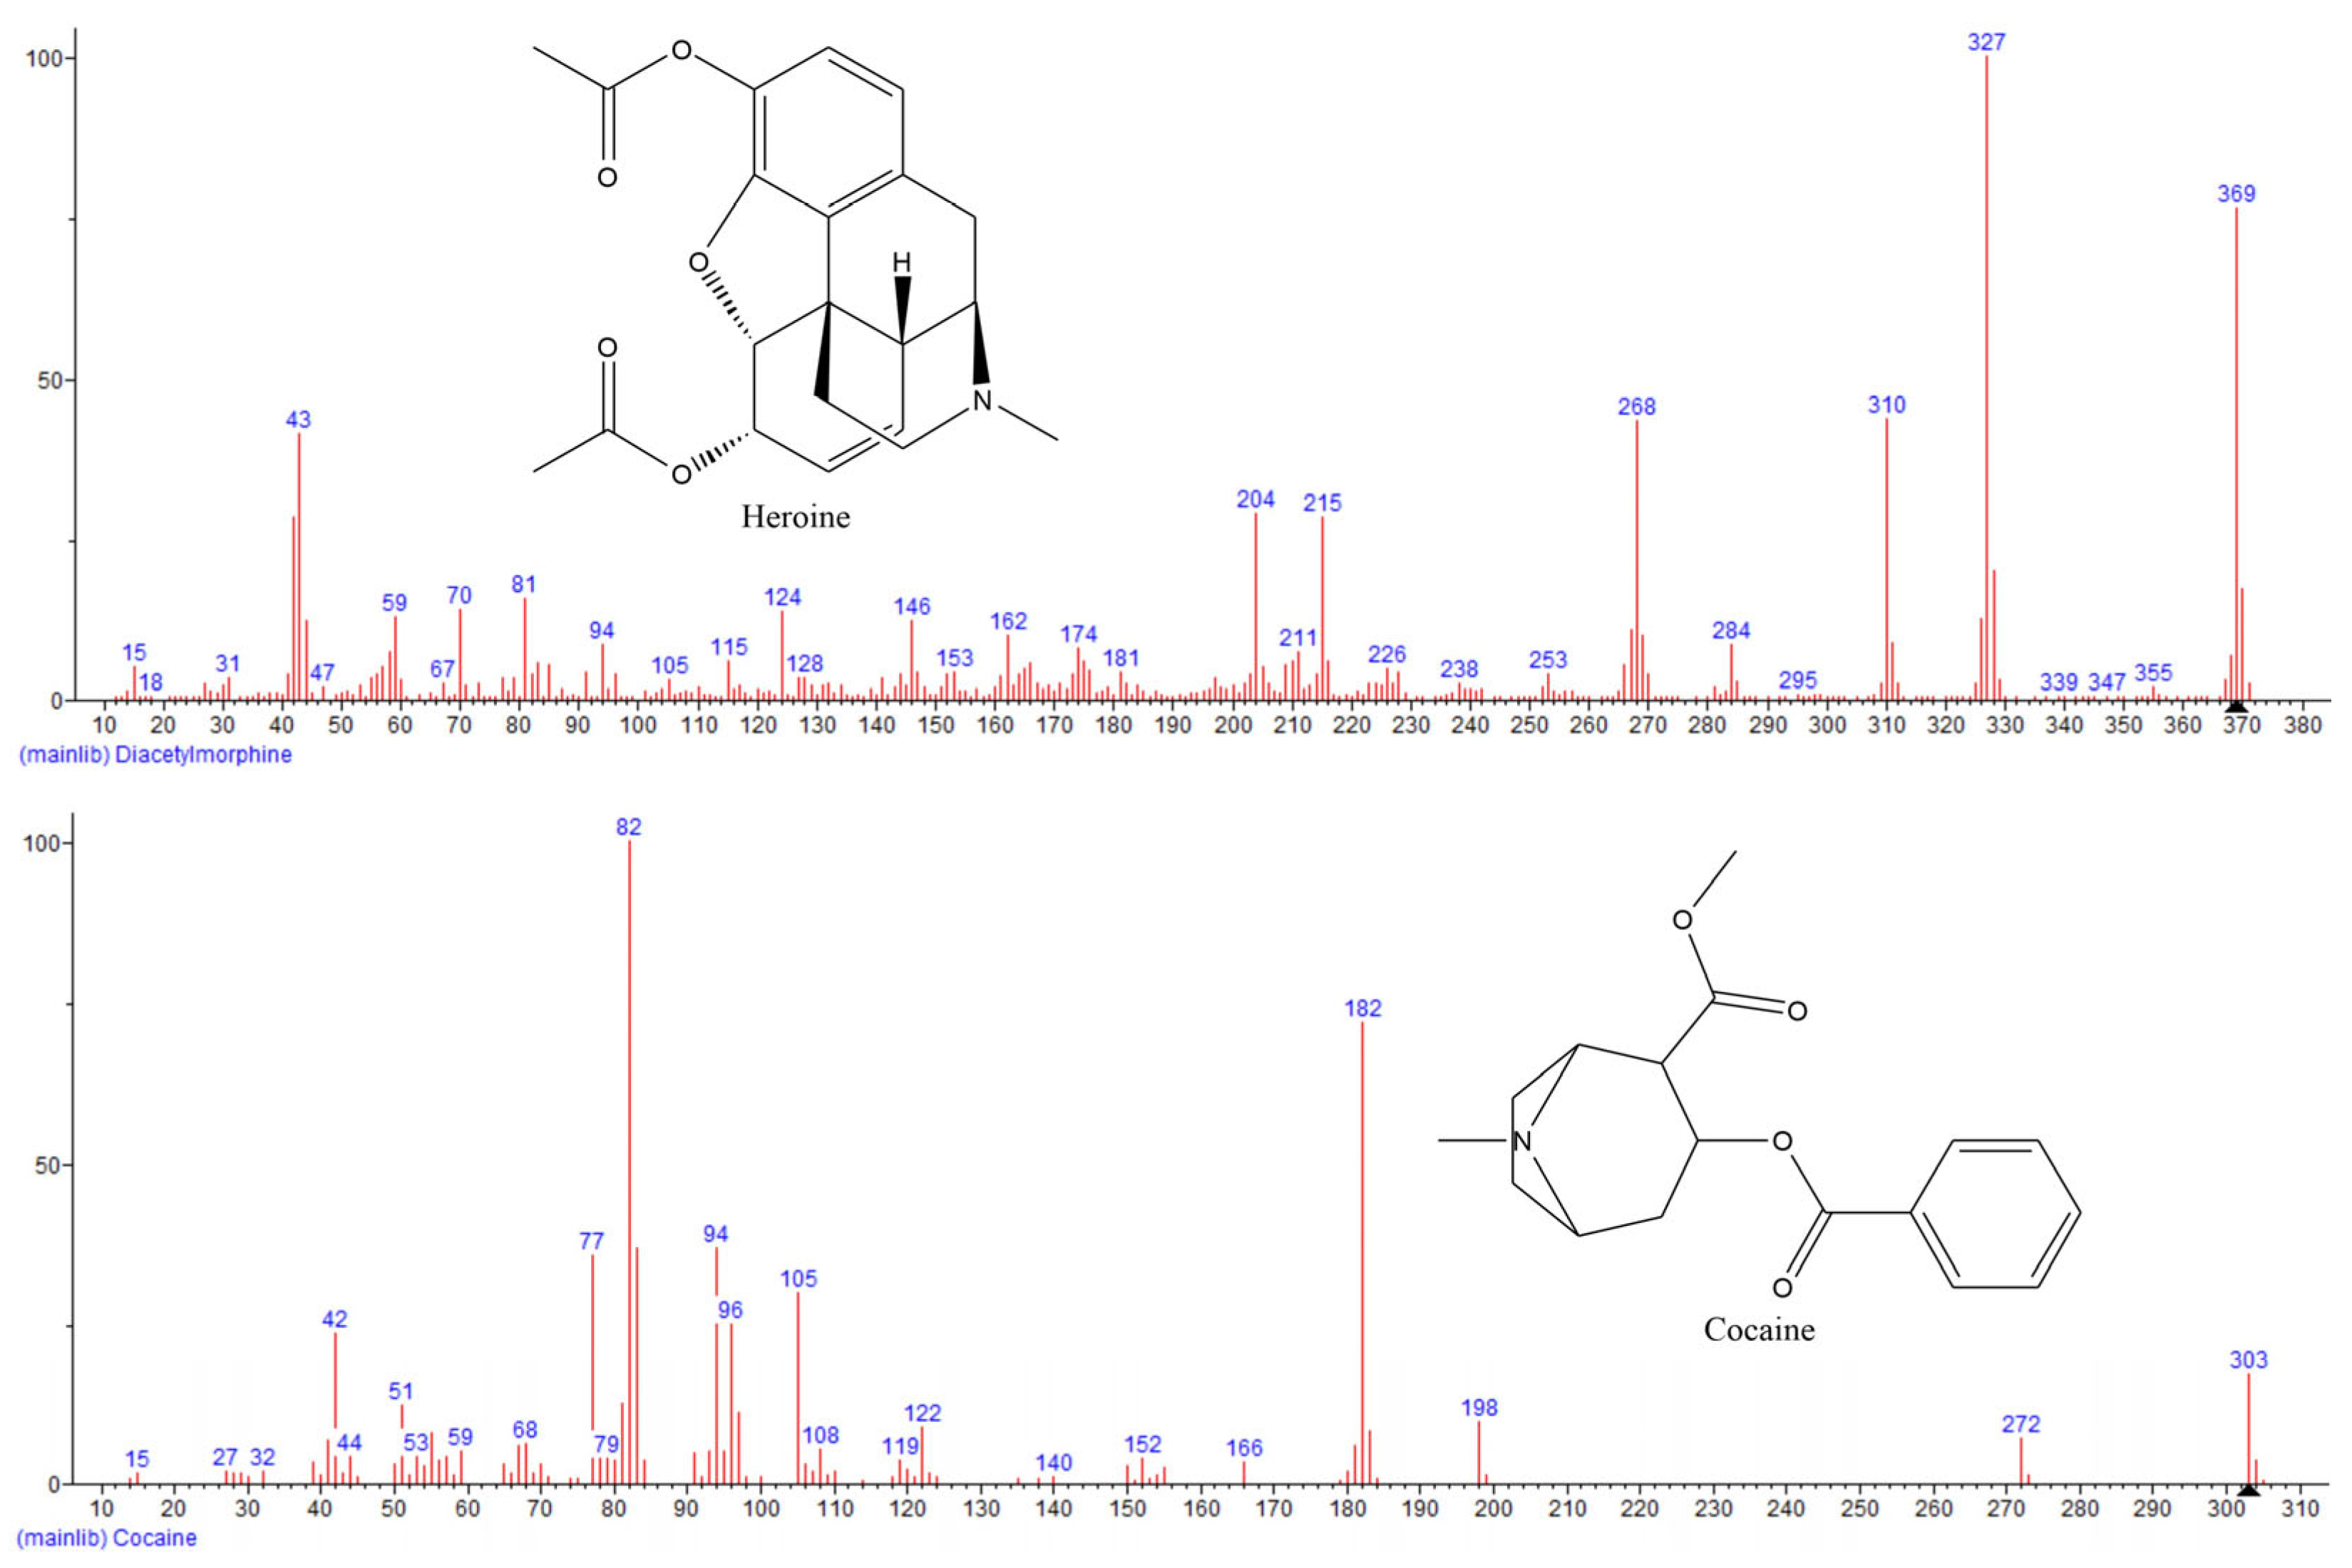
One of the commonly used detectors in gas chromatography is a mass spectrometer. With mass spectrometry, it is possible to perform a reliable identification and quantification of analyzed compounds in a single run. Compounds separated by GC are introduced to the mass spectrometer through a transfer line that is maintained at a constant temperature. Separated compounds are transferred to the ion source. There are different ionization methods, but the most commonly used is electron ionization (EI). During EI, compounds are bombarded with high-energy electrons (most often 70 eV) generated by the filament, and as a result, the compounds are fragmented. Generated fragments are separated by their mass-to-ion ratio (m/z) and are analyzed by a detector (the most common detector is a quadrupole) [2,3]. The typical mass spectra of heroin and cocaine are presented in Figure 2.
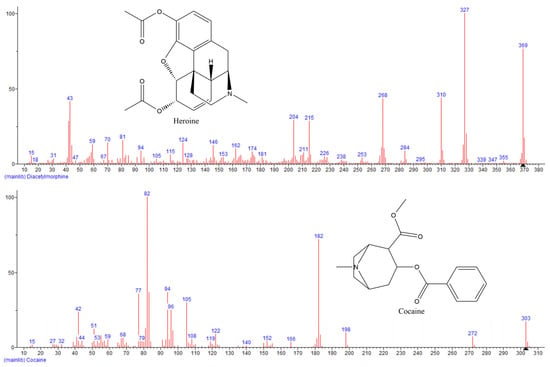
Figure 2.
Typical mass spectra of heroin (upper spectrum) and cocaine (lower spectrum) as presented in NIST 11 MS library.
3. Drugs of Abuse
According to one definition, drugs of abuse are substances that are used for a purpose other than their intended one because of other desirable effects. For example, some people find the effect of prescription opioids, such as morphine or oxycodone, pleasurable and use them outside their therapeutic use for severe pain relief. Another definition states that drugs of abuse are all substances whose distribution and possession are illegal by law because of their potentially harmful effect on the user [2]. Drugs of abuse can be produced under special licenses by pharmaceutical companies, and they are used in healthcare for specific medical conditions under the strict control and supervision of medical professionals. Examples of such drugs are opioids and benzodiazepines. Other drugs of abuse are produced and distributed illegally, such as methamphetamine, MDMA (3,4-methylenedioxymethamphetamine), LSD (lysergic acid diethylamide), heroin, and some plant-based natural products (like marihuana and psilocybin mushrooms). The most often used drugs of abuse are still plant-based, derived from plants or synthesized natural products, such as cocaine, diamorphine, and cannabis. However, the usage of fully synthetic drugs, such as amphetamine and MDMA, will present a more significant problem in the future [2].
Drugs of abuse can be classified as natural and synthetic, but the most common classification is by their pharmacological effect. According to their pharmacological effect, drugs are classified as stimulants, depressants, analgesics (commonly known as pain killers), and psychomimetics. Stimulants are compounds that cause euphoria, enhanced mental activity, loss of need for sleep, a sense of well-being, and loss of appetite (in some cases, even anorexia). Examples of stimulant drugs are cocaine, amphetamines, and phenmetrazine (an old used appetite suppressant). Depressants are compounds that show sedative properties and, with an increase in dosage, lead to anesthesia, coma, and death. Depressant drugs are barbiturates, benzodiazepines, tetrahydrocannabinol (THC), gamma-hydroxybutyric acid (GHB), and other GABA analogues and opioids. The main effect of analgesic drugs is pain relief, and they differ significantly in their addictive potential. Analgesics include opioids and THC. Finally, psychomimetics cause auditory and visual hallucinations and/or sensations that have no basis in reality. Those drugs are amphetamines, cocaine, THC, PCP (phencyclidine or phenylcyclohexyl piperidine), LSD, and psilocybin [4].
4. Determination of Tetrahydrocannabinol (THC)
Cannabis is commonly used due to the presence of the psychoactive Δ9-tetrahydrocannabinol (d9-THC) for recreational application. The cannabis plants are divided into three types based on the ratio between two major cannabinoids, tetrahydrocannabinol (THC) and cannabidiol (CBD). The first is type I (THC as a primary cannabinoid). Then, there are type II (equal amount of THC and CBD) and type III (CBD as a primary cannabinoid) [5]. Therefore, type I cannabis is of interest from a forensic perspective. The analysis of this compound in plant material and its extracts has its challenges. THC is sensitive to light and heat exposure, where it can oxidize into cannabinol (CBN) or be converted into more stable Δ8-tetahydrocannabinol (d8-THC). Moreover, d9-THC is present in the plant material in acidic form as carboxylic acid (THCA), and its decarboxylation is not an enzymatic process but rather thermal degradation [5,6].
Different analytical techniques are employed for analyzing this compound within the inflorescence and extracts, including gas and liquid chromatography combined with various detectors (mass spectrometer, flame ionization detector, UV detector, and others) [7]. When using GC for analysis, decarboxylation must be conducted prior to analysis to avoid potential errors [5]. Elevation of the temperature may also cause the mentioned oxidation and/or isomerization [8]. Besides decarboxylation, derivatization is also a possible approach to avoid problems with side processes. There are two agents for derivatization: N-methyl-N-trimethylsilyltrifluoroacetamide (MSTFA) and N,O-bis(trimethylsilyl)trifluoroacetamide/trimethylchlorosilane (BSTFA/TMCS) mixture [9]. The approach without the derivatization is faster, but analysts should be aware of other processes (oxidation and isomerization). These side processes require the application of the MS as a detector for the precise and accurate identification of potential products from these side reactions. Additionally, for a more precise and accurate determination of the THC concentration, the method of internal standard (ISTD) is recommended when MS is applied. Deuterated ISTDs are commonly used, but they are not readily available and are expensive. Other compounds, such as tribenzylamine (TBA), are suitable substitutes for these expensive ISTDs [10,11].
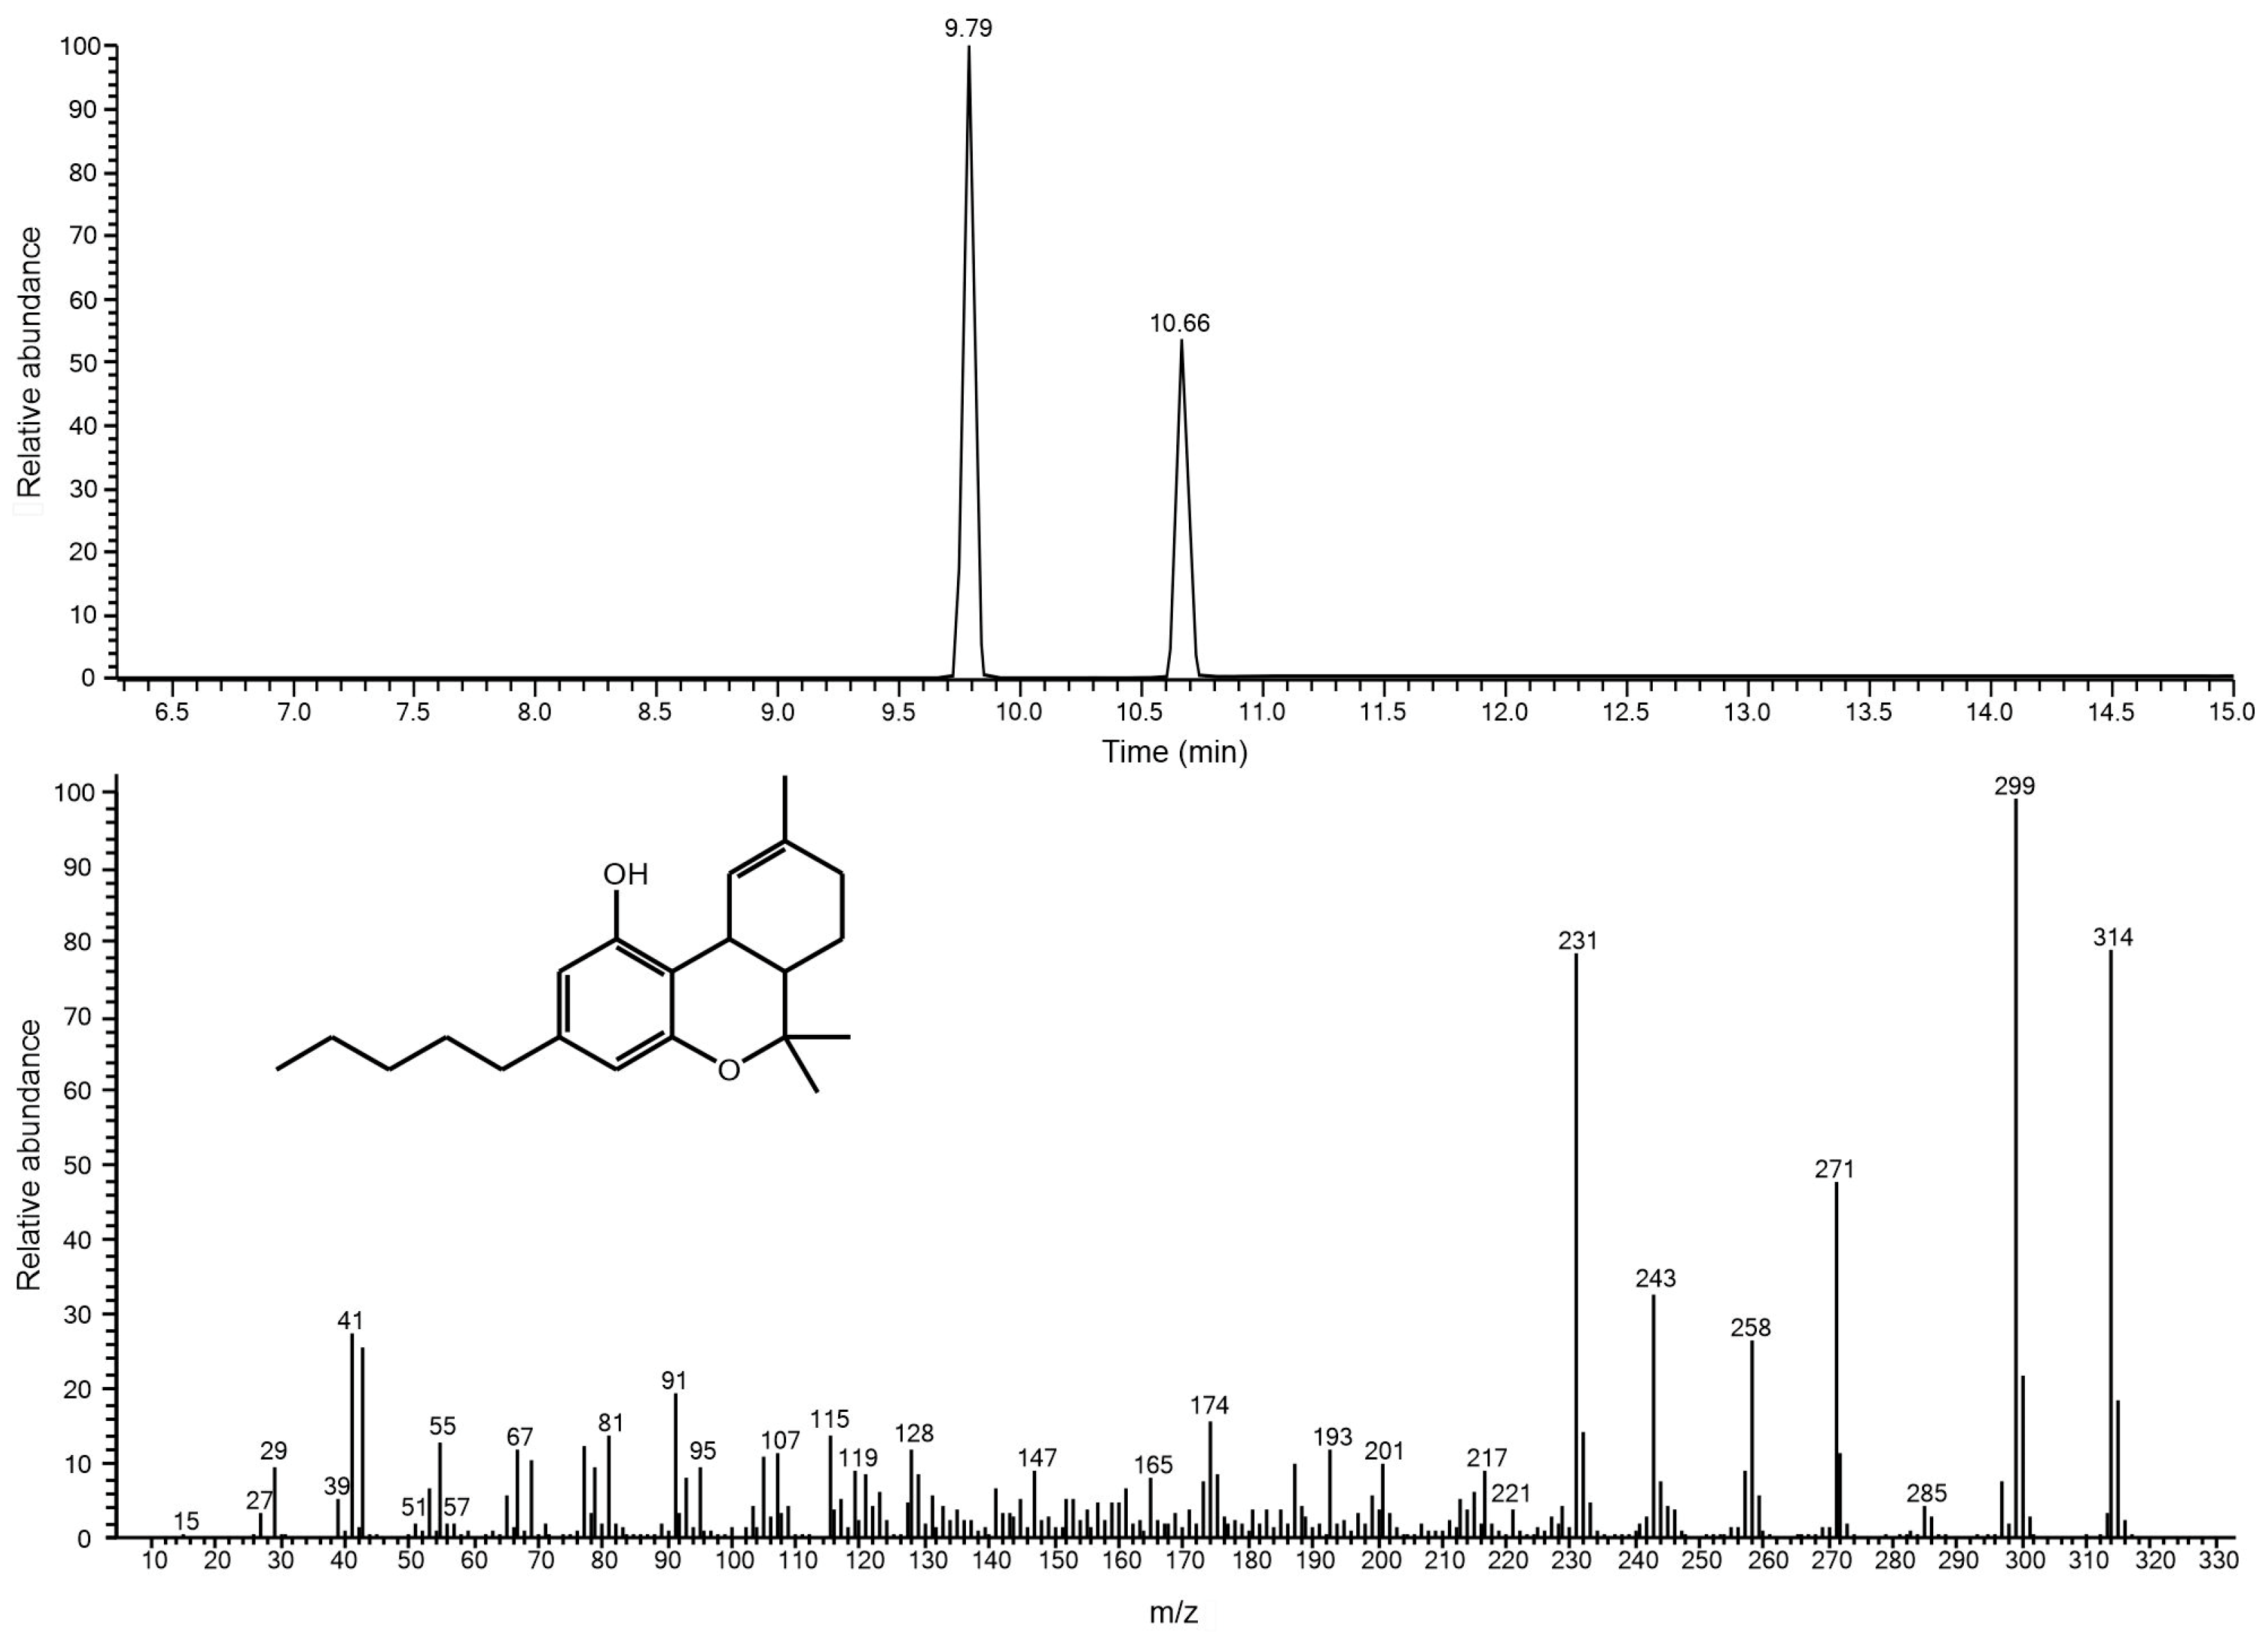
Đurović et al. (2025) successfully used TBA as the ISTD and developed a method for the analysis of major cannabinoids (CBD, THC, and CBG) in the inflorescence of the industrial hemp [5]. The authors used the single-ion monitoring (SIM) method for detecting the selected characteristic ions of these compounds in combination with a fast 15-min GC method using a TR-5MS capillary column (30 m × 0.25 mm, 0.25 µm) [5]. Taking into account that the content of the THC in industrial hemp is much lower than in type I cannabis, this method is suitable for the analysis of THC, but a suitable calibration for THC must be created (in a suitable concentration range). The chromatogram and mass spectra are presented in Figure 3.
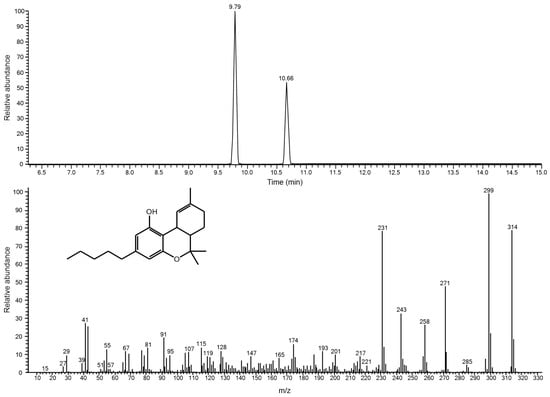
Figure 3.
The chromatograms and mass spectra of TBA (9.79 min) and THC (10.66 min). The chromatogram was obtained using Focus GC-Polaris Q ion trap MS (Thermo Fisher Corp., Waltham, MA, USA) and published by Đurović et al. [5].
If obtaining the acidic form of THC is the aim, derivatization must be performed. Thus, Cardenia et al. (2018) reported the development of a rapid GC/MS method with RTX 5 column (10 m × 0.10 mm, 0.10 µm) with two ISTDs (IS1 and IS2) [7] and two derivatization agents, diazomethane (for methylation) and a mixture of n-methyl-n-trimethylsilyltrifluoroacetamide and 1% of chlorotrimethylsilane (MSTFA-TMCS). IS1 was inserted during the extraction, while IS2 was added during derivatization, covering the entire analytical procedure [7]. The list of qualifier and quantifier ions is presented in Table 2.

Table 2.
Quantifier and qualifier ions for derivatized cannabinoids reported by Cardenia et al. [7].
The analysis of THC in a biological sample requires the detection, identification, and quantification of THC metabolic products, i.e., the primary active metabolite 11-hydroxy-Δ9-tetrahydrocannabinol (11-OH-THC) and the primary inactive metabolite, 11-nor-9-carboxy-Δ9-tetrahydrocannabinol (THC-COOH). Strano-Rossi et al. (2011) reported a method for analyzing THC-COOH in urine using a J&W DB-5 capillary column (10 m × 0.18 mm, 0.18 µm) in both the full-scan and SIM modes, following derivatization with MSTFA and 1% trimethylchlorosilane [12]. The ISTD was derivatized deuterated THC-COOH (d3-THC-COOH). The ions with m/z values selected for the SIM method were 371, 473, and 488 for THC-COOH and 374, 476, and 491 for ISTD. The authors reported very low limits of detection (5 ng/mL) and quantitation (10 ng/mL) levels, with excellent repeatability and accuracy but with very low recovery (55% and 60% for 20 ng/mL and 200 ng/mL, respectively) [12].
Two different methods have been reported for analyzing cannabinoids in hair samples. Hair serves as a suitable matrix for analyzing drugs of abuse because it allows for a wide detection window (months or even years). At the same time, sample collection is an easy and non-invasive process. The repeatability of the sample characteristics is excellent in contrast to blood and urine samples [13,14]. Moreover, hair samples do not require any special conditions for transportation and storage because they are relatively stable for an extended period [15]. Emidio et al. (2010) prepared a sample as follows. The hair sample was decontaminated with petroleum ether, deionized water, and methylene chloride and then dried. After mixing with d3-THC (ISTD), the sample was digested by alkaline hydrolysis using 1 M NaOH. After adjusting the pH value to approximately 10, the sample was incubated at 90 °C, allowing cannabinoids to adsorb onto the fiber for solid-phase microextraction (SPME), followed by their desorption in the GC inlet. The authors used ion trap MS with the MS/MS mode and ions with m/z of 193, 217, 243, and 257. The reported LOD (limit of detection) and LOQ (limit of quantitation) were 0.031 ng/mg and 0.062 ng/mg, respectively [16]. Merola et al. (2010) also reported a similar approach for analyzing THC in hair samples using the headspace (HS) method [17]. The authors also performed washing with deionized water and acetone. After cutting the samples into small pieces, hair samples were extracted with 1 M HCl in a headspace vial, along with ISTD (d8-THC). After extraction, the liquid was transferred to another vial and extracted using an SPME fiber. After the adsorption of analytes, derivatization was performed by exposing the fiber to MSTFA. After derivatization, the fiber was exposed to elevated temperatures in the GC inlet for analyte desorption. The SIM method was applied using ions with m/z values of 303, 371, and 386. The reported LOD and LOQ were 0.01 ng/mg and 0.02 ng/mg, respectively. The recovery was 99.8% and intraday and interday precision were 2.9–7.8% and 5.7–9.3%, respectively [17]. Lemos et al. (1999) analyzed nails for THC and THC-COOH using GC/MS. For decontamination, the samples were sonicated with sodium dodecyl sulphate and with deionized water (in triplicate). Then, the samples were sonicated with methanol (also in triplicate) and evaporated in a nitrogen stream. The ISTDs (d3-THC and d3-THC-COOH) were added, derivatized with BSTFA, and analyzed. The samples were prepared after air drying by alkaline hydrolysis in the presence of the ISTDs. After hydrolysis, ethyl acetate was added, and the mixture was agitated. The organic layer was separated, followed by subsequent derivatization and analysis [18]. The LOD was <0.1 ng/mg in both cases with high recovery levels (89.4% for THC and 81.1% for THC-COOH).
Overall, the selected analytical approach will mainly depend on the matrix being analyzed. When plant material is the analyzed matrix, ultrasound-assisted extraction using methanol, methylene chloride, or chloroform is a suitable approach. The THC may be analyzed in acidic form or the free form. Because of the instability of the acid at elevated temperatures (above 110 °C), derivatization must be performed. When analyzing the free THC, decarboxylation is recommended before the analysis to avoid possible errors in the final results due to the incomplete decarboxylation in the GC inlet or column. The analysis of the biological samples (blood, urine, saliva, nails, and hair) is based on the detection of metabolic products (THC-COOH and 11-OH-THC). Derivatization is again recommended for increasing the stability of the analyzed compounds and the sensitivity of the analytical method. Analysis in urine requires simple extraction prior to derivatization. At the same time, hair and nail samples need several steps, such as washing (for decontamination with water and organic solvents), followed by alkaline digestion and derivatization. Although the authors used different columns and methods, the common approach is the SIM method, which is highly recommended due to higher sensitivity and selectivity with application of the ISTD. The ISTD method ensures high precision of the analytical method, nullifying the influence of the fluctuation in the MS sensitivity due to contamination with samples.
5. Determination of Opioids
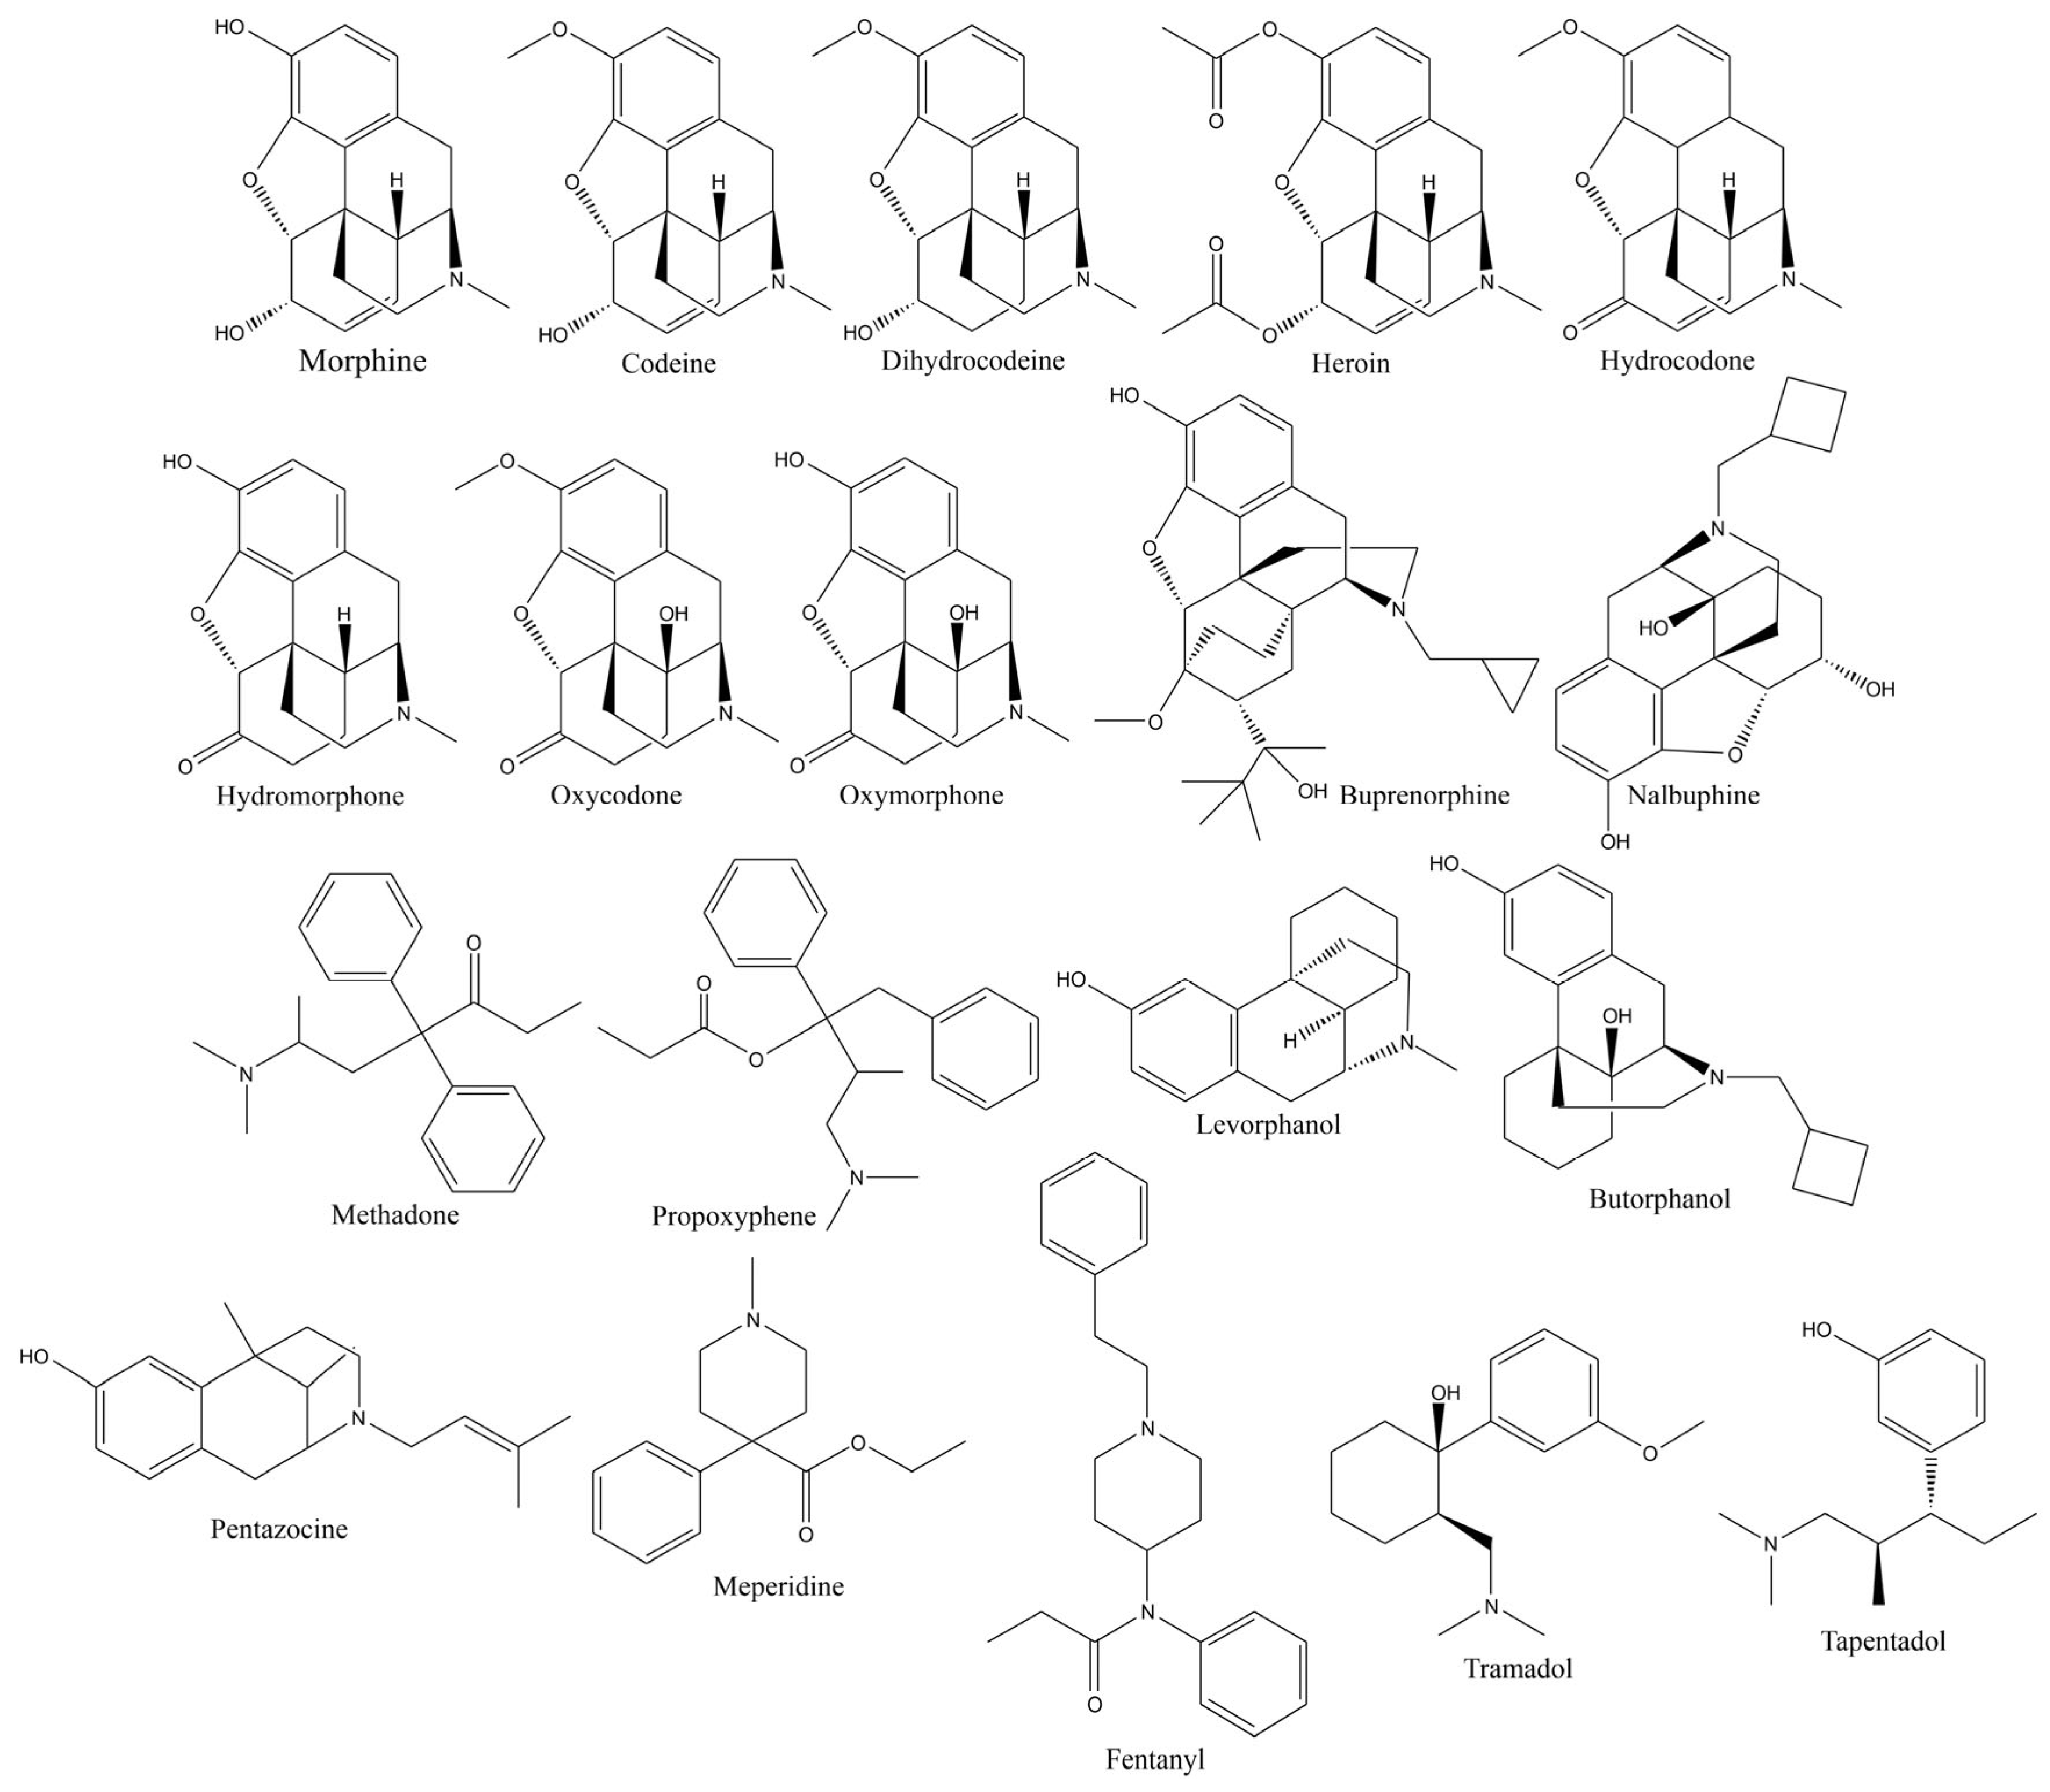
In this group of drugs are compounds such as morphine, codeine, heroin (diacetylmorphine), dihydrocodeine, hydrocodone, hydromorphone, oxycodone, oxymorphone, and others (Figure 4).
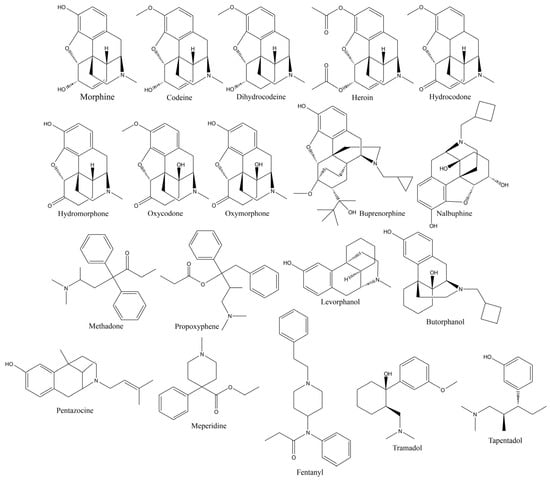
Figure 4.
Structures of opioids.
As in the case of d9-THC, these compounds can be analyzed using GC/MS or GC/FID for qualitative and quantitative analyses. When analyzing seized material, these compounds are analyzed as is after extraction (with or without derivatization), whereas in the case of biological samples, the analysis targets their metabolites rather than the starting compounds. Brettel and Lum published a protocol for the analysis of drugs of abuse using GC/MS with three different capillary columns: Rxi-5sil MS (30 m × 0.25 mm, 0.25 µm), DB-1 (12 m × 0.20 mm, 0.33 µm), and HP-5MS (12 m × 0.20 mm, 0.33 µm). The carrier gas was helium. Several different extraction techniques were assessed for sample preparation, including methanol extraction, hexane extraction, alternate non-organic reaction (ANOR), dry extraction, and others. The analyzed opioids were codeine, heroin, and oxycodone. The authors reported that separation was the best in the case of a longer column (Rxi-5sil MS) [1]. Sharma and Lahiri reported the GC/MS method for analyzing sized drugs in India between 1998 and 2003 [19], based on different active compounds such as codeine, papaverine, and noscapine, which were mixed with various compounds that play different roles in the mixture, including paracetamol, acetanilide, and caffeine. The authors used the ISTD method with anthracene as an internal standard. The samples were refluxed with acetic anhydride, neutralized with sodium carbonate, recrystallized in chloroform, and analyzed by GC/MS. The capillary RTX-5MS column (15 m × 0.25 mm, 0.25 µm) was used for the analysis, with helium as a carrier gas (flow 1.2 mL/min). The authors used GC-FTIR for double confirmation of their findings [19]. Sharma et al. (2005) also used a similar approach, converting the opioids into monoacetyl derivatives. However, the authors reported that the acetylation of morphine at room temperature yielded monoacetyl and diacetyl forms in a ratio of 5:1 [20].
Badria et al. (2018) also reported the application of GC/MS for the analysis of seized heroin samples. The samples were dissolved in a methanol–chloroform mixture (4:1 v/v) and sonicated for 10 min. Then, 2 µL were injected into the GC/MS. The second approach was derivatization with MSTFA in a chloroform–pyridine mixture (5:1 v/v) at 70 °C for 10 min. After cooling for 1 h, the samples were injected for the analysis. The authors reported the application of two columns, DB-1 and HP-5, of which DB-1 is more non-polar than HP-5 [21]. Askar et al. (2025) compared the performance of the rapid GC/MS method with that of the conventional GC/MS method developed by the Dubai Police Forensic Laboratory for the analysis of various drugs of abuse [22]. The parameters of both methods are presented in Table 3. The investigated samples were prepared by solid–liquid extraction using methanol. To validate and verify the methods, precision (interday and intraday) and limit of detection were determined for the mixture set. The rapid method showed better performance results, and the authors concluded that it can be successfully applied to the analysis of samples that satisfy the requirements of the UNODC office. Both investigated methods were performed using a J&W DB-5 ms capillary column (30 m × 0.25 mm, 0.25 µm) and helium as the carrier gas (flow rate of 2.0 mL/min) [22].

Table 3.
Operational parameters for rapid and standard GC/MS methods for seized drug analysis proposed by Askar et al. [22].
GC/MS can also be successfully used for the analysis of drugs of abuse in biological samples. In this case, however, the methods should be adjusted for the analysis of their metabolites. Thus, codeine and heroin are metabolized as morphine in the liver [23]. Cytochrome P450 transforms codeine through O-demethylation, while heroin transforms into 6-acetylmorphine via blood esterase and then to morphine in the liver. Buprenorphine (a semi-synthetic opioid and substitution for methadone for the treatment of heroin addiction) is metabolized into norbuprenorphine via N-dealkylation [24]. The analysis of these compounds in urine includes liquid–liquid extraction, Toxi-Tube A, or solid-phase extraction (SPE) [24,25,26]. Moreover, three-step derivatization with ethoxyimino/propionyl/TMS has been reported for the analysis of morphine, codeine, 6-acetylmorphine, hydromorphone, oxymorphone, hydrocodone, oxycodone, and noroxycodone [26]. The authors reported satisfactory validation parameters (LOD, LOQ, and linearity) with good chromatographic resolutions and mass spectrometry characteristics [26]. Zhang et al. (2013) also reported a method for the determination of morphine and codeine in human urine samples using GC/MS. The authors reported the use of an HP-1MS column (30 m × 0.25 mm, 0.25 µm) with a helium flow rate of 1.0 mL/min. The MS was operated in the SIM mode with the following targeted ions at m/z 341, 397, and 268 for morphine propionyl and 229, 355, and 282 for the codeine propionyl compound [27]. The proposed sample preparation procedure involved adjusting the pH to approximately 9 and adding a borax buffer solution. Target compounds were extracted with ethyl acetate, followed by the separation of the organic layer and evaporation of the solvent. Then, propionic anhydride was added with pyridine and mixed at 80 °C. After the evaporation of the remaining liquid, the solid residue was dissolved in methanol and injected into the GC/MS. The authors performed full-scale validation and verification, concluding that the developed method is suitable for determining these compounds in urine samples [27].
Santhosh et al. (2019) developed a method for the simultaneous analysis of ten drugs of abuse in blood and urine samples. They used GC/MS and a DB-5MS capillary column. The GC operated in split mode (5:1) with a split flow of 13.7 mL/min. The carrier was helium with the constant pressure mode. The run time was 9 min, while MS was operated in the SIM mode. The target ions were m/z 162 and 299 (for codeine), 242 and 299 (for hydro codeine), and 230 and 315 (for oxycodone). The developed method showed good resolution for all tested molecules. Samples were prepared after spiking the blood and urine of healthy people with a mixture of drugs and proteins, which were precipitated with acetonitrile. Supernatant was transferred into the SPE cartridge (Bond Elut Captiva ND Lipid). After centrifugation and evaporation, the resin was dissolved in toluene, and the solution was injected into the GC inlet [28]. A single-step GC/MS method for the analysis of 41 drugs of abuse in postmortem blood samples has also been reported [29]. The authors used alkaline liquid–liquid extraction for sample preparation. Nordazepam-d5 was selected to be the ISTD. After mixing the sample with the solvent and adjusting the pH to 12 with saturated potassium carbonate, the mixture was centrifuged, and the organic phase was separated and injected into the GC/MS. An Optima-5-ms capillary column (30 m × 0.25 mm, 0.25 µm) was used for the analysis, with a run time of 31 min. The results showed that butyl acetate, with a sample-to-solvent ratio of 4:1, was the most efficient extraction procedure. Interestingly, it was reported that ethyl acetate was not suitable as a solvent due to the extensive formation of an emulsion [29].
Dispersive solid-phase extraction (dSPE) has been reported for sample preparation (urine and blood) for the analysis of opioids. The samples were extracted using acetonitrile, supplemented with phosphate buffer (adjusted to pH 6) and magnesium sulfate. After mixing with a vortex and separating the supernatant, the acetonitrile was evaporated. Then, a small portion of fresh acetonitrile was added, followed by a specific volume of hexane to remove non-polar interferences, such as cholesterol. After separating the acetonitrile layer, BSTFA was added for derivatization, and the mixture was heated at 60 °C. After finishing the derivatization, the sample was injected into the GC inlet for analysis. A J&W capillary column (15 m × 0.25 mm) was used for the analysis, with helium serving as the carrier at a pressure of 8 psi. The MS was operated in the SIM mode (Table 4 summarizes data on compounds and used ions for identification and quantification). The authors validated the method according to the guidelines of the UNODC. The accuracy and precision of the method were determined using three concentration levels. Satisfactory results have been reported, with precision (CV, %) of less than 5%, accuracy (bias, %) of less than 1%, and recovery higher than 80%. The authors concluded that the developed method is suitable for the analysis of opioids in the urine and blood samples of addicts and victims [30].

Table 4.
Analyzed opioids and selected ions for identification and quantification proposed by Yasien et al. [30].
Salem et al. (2001) studied four different SPE cartridges (DETECABUSE, Clean Screen, Bond Elu Certify, and SPEC Columns) for the preparation of meconium samples for the analysis of heroin metabolites [31]. After cleaning with SPE, the cartridges and samples were hydrolyzed for the determination of morphine glucuronide (with β-glucuronidase). In the end, the sample was derivatized with BSTFA, including heating at 70 °C. The authors used both DB-1 (15 m × 0.25 mm, 0.25 µm) and DB-5 25 m × 0.20 mm, 0.33 µm) columns for the analysis, but with different proportional characteristics. After obtaining the results, the authors concluded that Clean Screen showed the best performance with LOD and LOQ values of 2.5 ng/g and 5 ng/g for 6-monoacetyl morphine, a specific marker for heroin abuse. The authors also reported that this cartridge provided cleaner samples, obtaining cleaner chromatograms with improved signal-to-noise ratio [31].
Opioid drugs of abuse can also be analyzed from seized materials and in biological samples (blood, urine, saliva, hair, and nails). Seized materials are a simpler case where the analysis may be performed after dissolving the samples in a suitable solvent (methanol, chloroform, or their mixtures). A longer column (30 m) is recommended to achieve a better separation of the compounds in the analyzed mixture. The analysis may be conducted directly without derivatization, which makes the method simpler. When it comes to biological samples, metabolites are of primary interest. Derivatization is again highly recommended to increase both the stability and volatility of the targeted molecules, which positively influences the performance of the used method. A urine sample is considered the simplest biological sample, which requires adjusting the pH to 9 with buffer and extraction (ethyl acetate), followed by derivatization (propionic anhydride). Blood is a much more complex matrix where the removal of the proteins is required (precipitation with acetonitrile). Further sample cleaning with suitable SPE cartridges is necessary. In the case of a blood sample, ethyl acetate is not desirable because it forms an emulsion. Both non-polar columns (such as HP-1MS) and HP-5 MS (which is slightly more polar than HP-1MS) are suitable for opioids. The SIM method with an ISTD is more desirable because of the higher selectivity and sensitivity of the analytical method.
6. Determination of Amphetamines
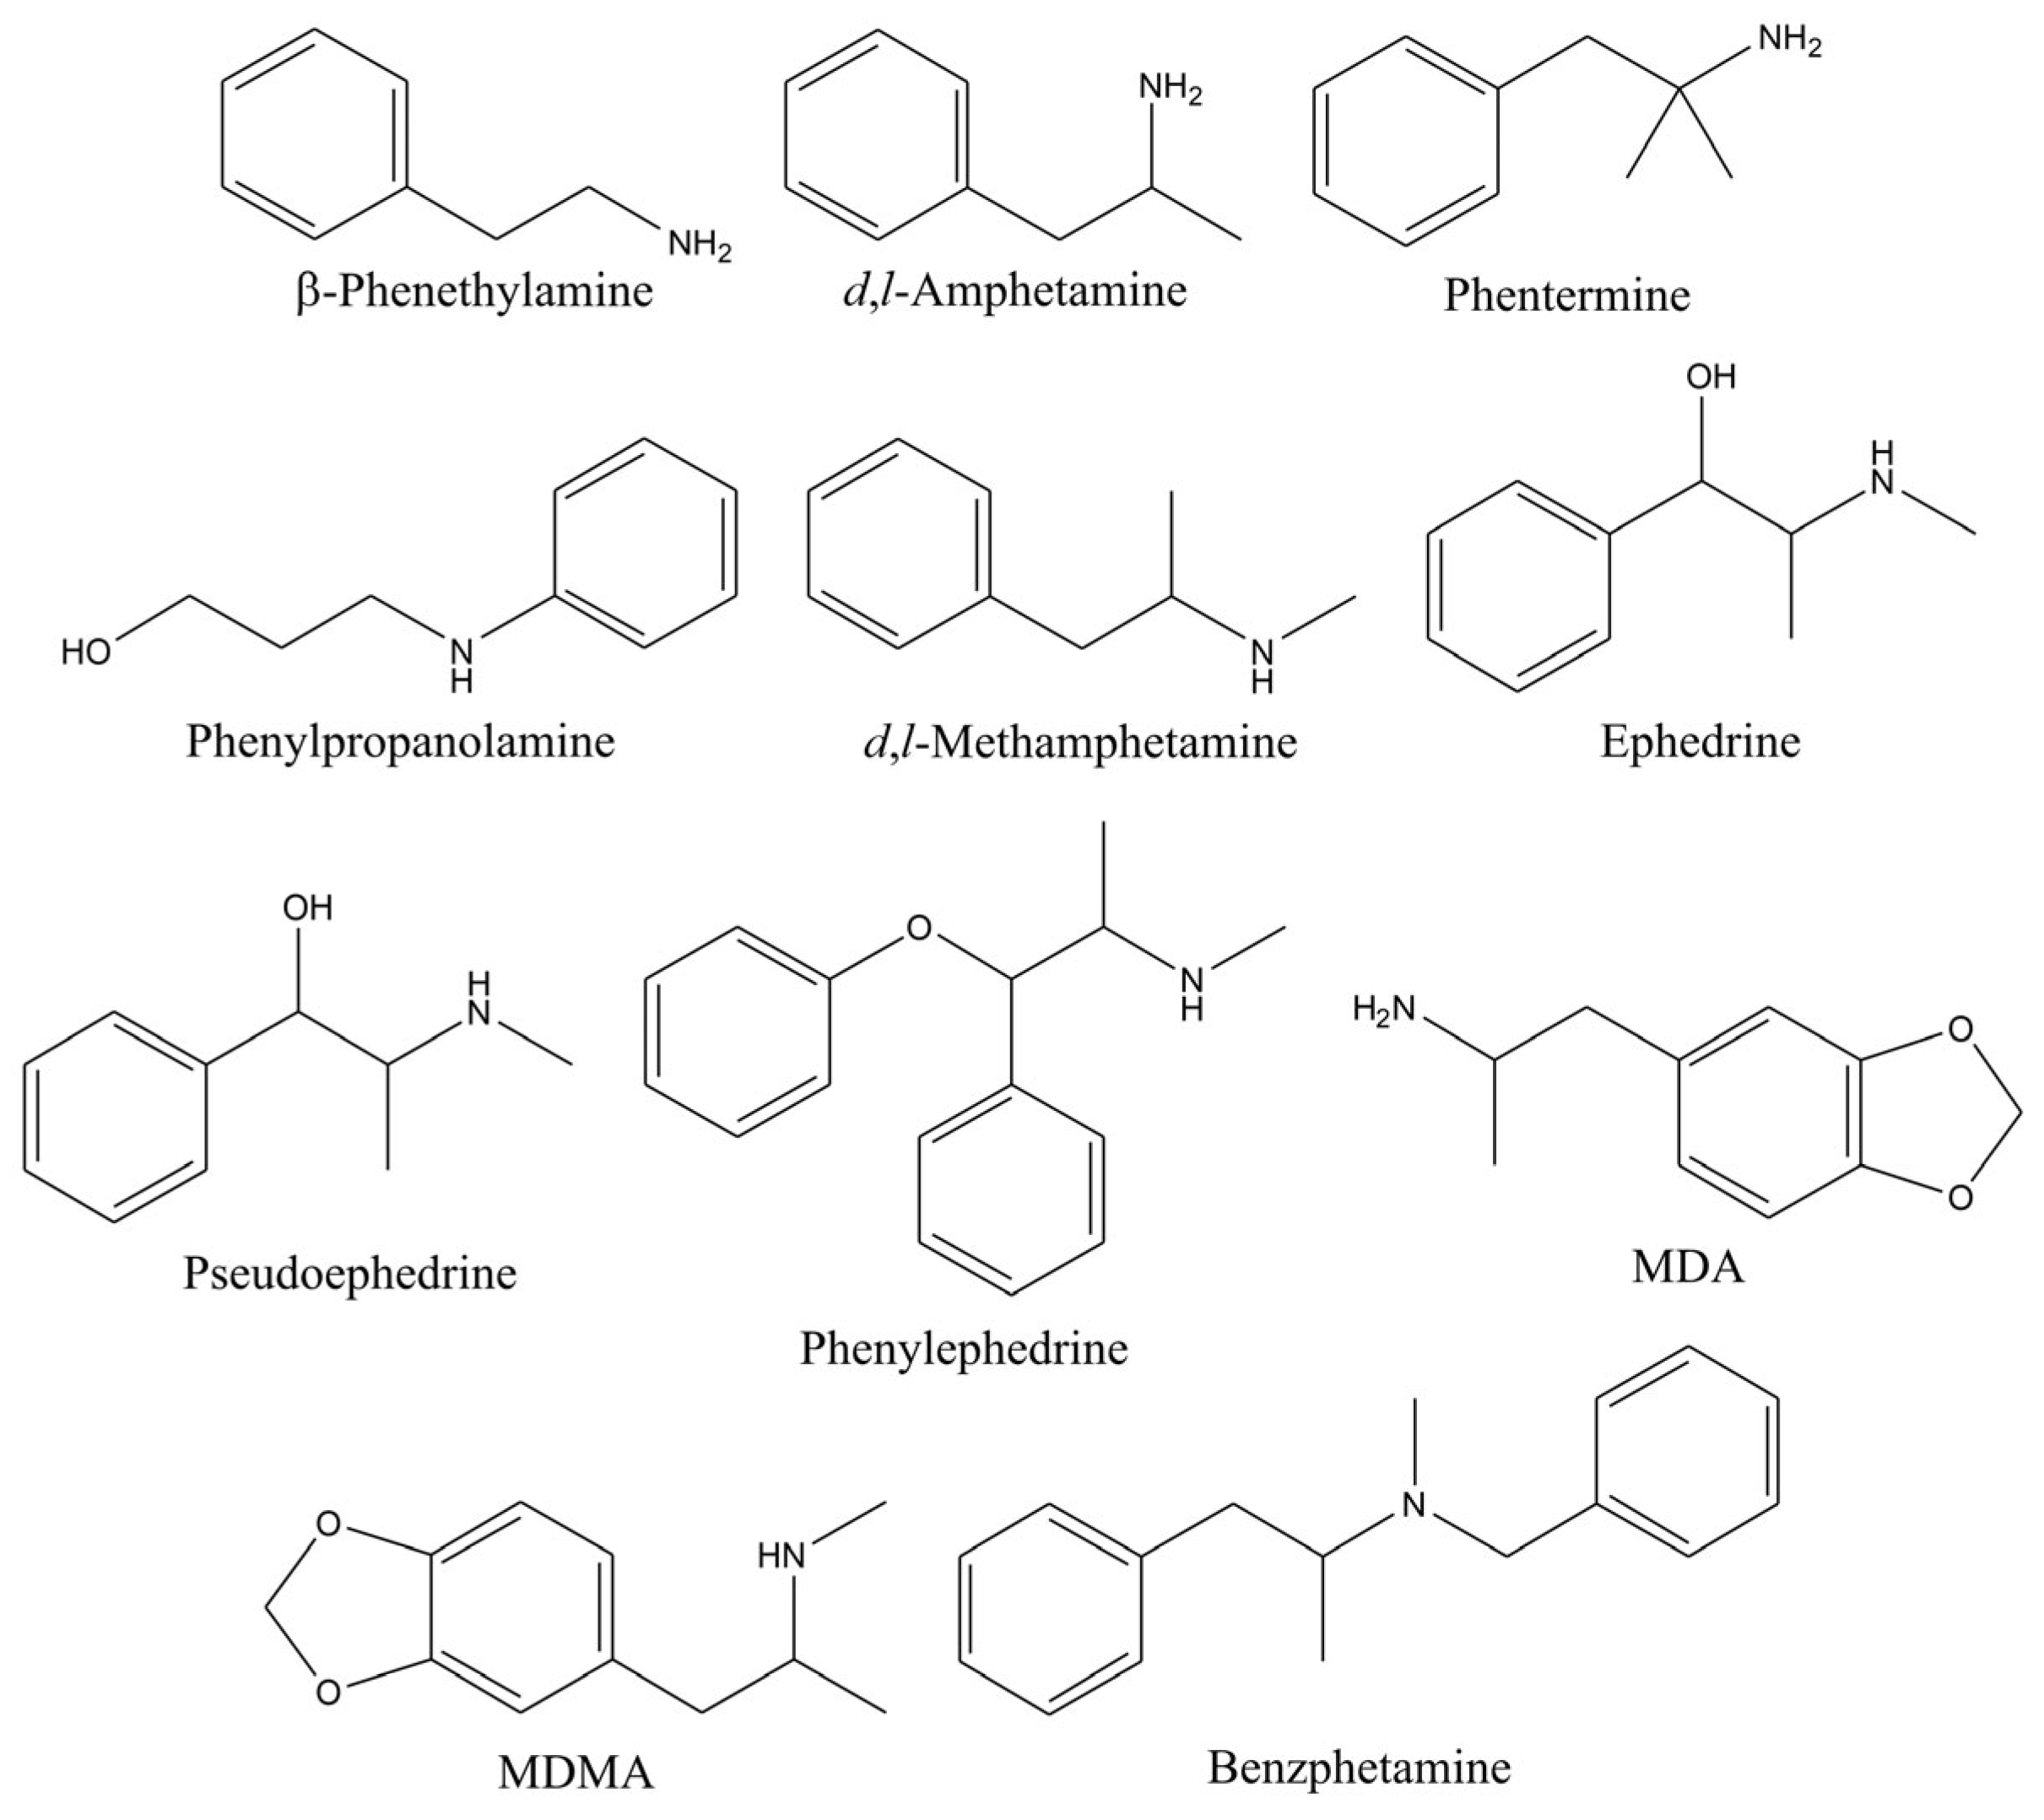
Amphetamines are a group of drugs of abuse also known as sympathomimetic amines, which includes amphetamine, methamphetamine, 3,4-methylenedioxyamphetamine (MDA), 3,4-methylenedioxymethamphetamine (MDMA), ephedrine, pseudoephedrine, phenylephedrine, β-phenethylamine, and others (Figure 5).
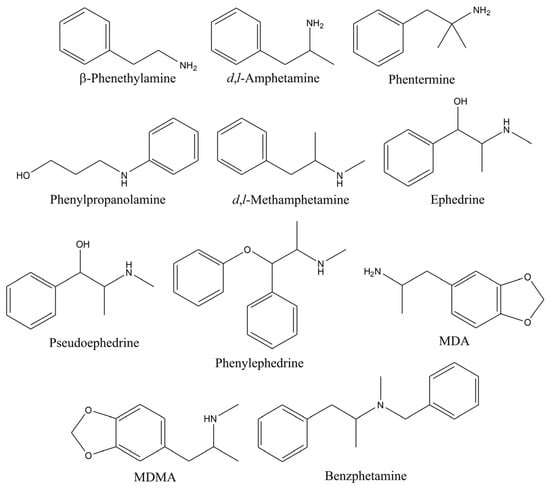
Figure 5.
Structures of amphetamines.
They act as stimulants of the central nervous system (CNS), stimulating the excessive secretion of dopamine [32]. They are obtained synthetically through various methods. Therefore, resins (impurities) are used as a fingerprint of the synthetic approach for their production [33]. For the analysis of these compounds in seized samples, both GC-FID and GC/MS have been reported. Exact concentration can be easily determined by creating calibration curves [33]. Awang et al. (2022) employed the method developed by UNODC [34] for the analysis of methamphetamines using GC/MS and an HP-5 capillary column (30 m × 0.25 mm, 0.25 µm). The MS was operated in full scan in the m/z range of 50–500. After confirming the presence of these compounds, analysis was repeated on GC/FID for the quantitation of amphetamines using an HP-5 column (30 m × 0.32 mm, 0.25 µm). Samples were prepared by the simple dissolution of the tablets in the solvent with ISTD. After analysis, the authors concluded that most of the tablets were adulterated with caffeine during production [32].
A similar sample preparation method was reported for the analysis of a seized sample in Poland. The powdered samples were homogenized in a mortar and dissolved in a mixture of methanol and water (8:2 v/v) containing the ISTD (N,N-dimethylbenzylamine) at a concentration of 1 g/L. After mixing and centrifugation, the supernatant (25 µL) was transferred into a vial, filled with methanol to 1 mL, and then injected into the GC for analysis. The HP-1 capillary column was used for the analysis (17 m × 0.20 mm, 0.11 µm) [33]. Al-Salman and Jasim (2018) proposed an even more straightforward method for sample preparation. Powdered samples were washed with deionized water and dissolved in methylene chloride. After filtering through filter paper, the filtrate was used for the analysis [35]. Frinculescu et al. (2023) reported the results of an analysis of the application of the portable GC/MS for the analysis of samples seized at UK music festivals. The HP-5 MS capillary column (30 m × 0.25 mm, 0.25 µm) was used for analysis in a laboratory GC/MS. The samples were powdered and mixed with methanol. The aliquot (10 µL) was then mixed with MTBE (methyl-tert-butyl ether) and two internal standard compounds (quinoline and tripelennamine). For portable GC/MS (Griffin G510 and Torion T-9), DB-5 MS (15 m × 0.18 mm, 0.18 µm) and MXT (5 m × 0.1 mm, 0.4 µm) columns were employed, respectively. Both MS detectors operated in the full-scan mode (m/z 40–450 and 41–500). The authors performed validation on different drugs (amphetamine among them) and reported the successful development and validation on Griffin G510 and partially successful validation on Torion T-9. The authors concluded that both portable instruments can adequately meet the need for on-site analysis [36]. Generally, methods that are developed for the analysis of drugs of abuse may be used for different types of drugs. Therefore, the methods developed by Brettell and Lum [1] and Askar et al. [22] may also be used for the analysis of amphetamines, with adjustments to the sample preparation procedures.
Procedures for determining amphetamines in biological samples include extraction, derivatization, separation, and identification [24]. Extraction can be simple liquid–liquid extraction in an alkaline medium [37,38,39,40] or SPE procedures [41,42]. Even simultaneous supercritical fluid extraction (SFE) and chemical derivatization was reported for the analysis of amphetamines in urine samples [43]. The popularity of miniaturization of analytical procedures also introduced the application of solid-phase microextraction (SPME) for sample preparation. The derivatization step is crucial for enhancing the volatility of the analyzed compounds and for generating characteristic fragment ions [25]. Commonly used reagents for derivatization include trifluoroacetic anhydride [37,39,43], pentafluoropropionic anhydride [37], and acetic anhydride [40]. After derivatization, the prepared sample is injected into the GC/MS, acquiring MS spectra in the SIM mode [37,38,43] or in both the full-scan and SIM modes [39,40,41,42].
Lin et al. (2005) reported the GC/MS method for the analysis of amphetamine, methamphetamine, MDA, and MDMA in hair samples [44]. The hair sample was cut into smaller pieces and decontaminated by rinsing with methanol. The rinsed samples were digested with 2 N NaOH solution at 80 °C for one hour. The prepared solution was cooled and extracted with ethyl acetate. The organic layer was separated, and 0.5 N HCl was added. The acidic layer was then separated, and the pH was increased with 2 N NaOH. The obtained mixture was then extracted again with ethyl acetate. The organic layer was separated and evaporated. Derivatization was achieved with heptafluorobutyric anhydride at 70 °C. The solvent was then evaporated, and the resin was dissolved in a small portion of ethyl acetate. The GC/MS analysis was conducted using an HP-1 MS capillary column (30 m × 0.25 mm, 0.25 µm), while the MS was operated in the SIM mode [44]. Merola et al. (2010) reported the HS-SPME method for the determination of amphetamine, methamphetamine, MDA, MDMA, and methylenedioxyethamphetamine (MDEA) in hair samples, while 3,4-methylenedioxypropylamphetamine (MDPA) was used as the ISTD [17]. The same method was also used for d9-THC (described in the previous section). Briefly, hair samples were treated with HCl and K2CO3 and sealed in the HS vial for incubation of the SPME fiber. After incubation, the fiber was exposed to acetic anhydride for derivatization, and then injected into the GC inlet for the desorption of the target compounds. Denia et al. (2022) reported a method for determining illicit drugs in oral fluids using gas chromatography-drift tube ion mobility spectrometry [45]. Samples for analysis were prepared using a simple procedure in which fluids were dissolved in chloroform. After shaking and centrifugation, the organic layer was separated and injected into the GC. A ZB-5 MS capillary column (30 m × 0.25 mm, 0.25 µm) was used for this purpose with nitrogen as the carrier gas (flow rate of 2.0 mL/min). The authors reported LOD and LOQ for amphetamine of 30 µg/L and 90 µg/L, respectively. Recovery was estimated at three concentration levels, ranging from 70% to 77%. After analyzing the certified reference material (CRM), the authors reported an error of 7.7% [45]. The previously described method for drug analysis in blood, urine, and postmortem blood was also applicable and tested for amphetamines. Santhosh et al. tested their method for methamphetamine, MDA, MDMA, and MDEA [28] in blood and urine. At the same time, Orfanidis reported that the method was suitable for determining the same compounds in postmortem blood samples [29].
For the analysis of amphetamines (synthetic drugs of abuse), the analysis of both active compounds (amphetamines) and impurities (which are considered as the fingerprints of the synthetic pathways) is important in the case of seized samples. To analyze both active compounds and impurities, the full-scan mode in the m/z range of 50–500 is recommended. Seized samples (tablets) are readily prepared for the analysis by dissolving them in a suitable solvent (methanol or methylene chloride) together with the ISTD. The analysis can be conducted straightforwardly without derivatization. On the other hand, biological samples require a more complex preparation procedure, including extraction (or SPE), derivatization, separation, and identification. Commonly reported derivatization agents are trifluoroacetic anhydride, pentafluoropropionic anhydride, and acetic anhydride (the easiest for manipulation). The hair sample preparation procedure is the same as that for THC analysis (decontamination and alkaline digestion). The SIM method is again recommended with the ISTD. Although it is possible to use SPME fibers for isolation of the targeted compounds, direct injection into the GC is more desirable in our opinion because of the lower recoveries obtained with the SPME method (70–77%).
7. Determination of Cocaine
Cocaine is a natural tropane alkaloid and a stimulant of the CNS. Its major metabolite is benzoylecgonine (BE), while ethylbenzoylecgonine (EBE) is the product of the simultaneous abuse of cocaine and alcohol [46]. The Forensic Toxicology Laboratory, Office of the Chief Medical Examiner, City of New York, proposed the GC/MS method for analyzing these compounds after derivatization with MTBSTFA. The samples are mixed with phosphate buffer at pH 6, and then mixed and sonicated. After centrifugation, the supernatant is run through the SPE Polychrom Clin II column. After washing the column with suitable solvents, elution is performed with a mixture of methylene chloride, isopropanol, and ammonium hydroxide. After evaporation to dryness, derivation is performed by adding N,N-dimethylformamide, MTBSTFA, and ethyl acetate. The mixture is heated at 80 °C. The RTX-5 SILMS (30 m × 0.25 mm, 0.25 µm) was recommended for the analysis, while MS was operated in the SIM mode, and fragments are summarized in Table 5 [46].

Table 5.
Selected ions for the SIM mode in the analysis of cocaine and its metabolites [46].
Wang et al. (2006) also reported derivatization for sample preparation for the analysis of cocaine and related compounds using the ISTD method [47]. They used trifluoroacetyl (TFA), pentafluoropropionyl (PFP), heptafluorobutyryl (HFB), methyl, ethyl, propyl, butyl, 2,2,3,3,3-pentafluoro-1-propanoxy (PFPoxy), 1,1,1,3,3,3-hexafluoro-2-propanoxy (HFPoxy), trimethylsilyl (TMS) and t-butyldimethylsilyl (t-BDMS) for derivatization. The HP-ULTRA-1 capillary column (12 m × 0.20 mm, 0.33 μm) was used. A combination of the full-scan and SIM modes was used for data acquisition from the MS [47]. The methods reported by Brettel and Lum were also suitable for the analysis of cocaine. However, the authors reported that the shape of the peak is a good indicator of instrument stability and dirtiness. The results indicated that lower ions (m/z 42 and 77) may indicate the contamination of the ion source [1]. The rapid GC/MS method developed by Askar et al. (2025) was also optimized for cocaine analysis using liquid–liquid extraction without derivatization [22]. The same case applies to the method reported by Denia et al. (2022), where the simple dissolving of the sample in chloroform, followed by the separation of the organic layer and analysis using gas chromatography-drift tube ion mobility spectrometry, was a suitable method for cocaine analysis [45].
The HP-SPME method reported by Merola et al. (2010) for analyzing hair samples is also applicable to cocaine analysis [17]. Interestingly, the authors investigated only the starting compound, but not the metabolic products within the samples. The same case is with the method reported by Santhosh et al. (2020) for the analysis of cocaine and other drugs in blood and urine samples [28]. Orfanidis et al. (2022) studied the developed and validated single-step method for analysis of 41 drugs in the postmortem blood sample, including cocaine [29]. They also searched only for cocaine.
Derivatization is also reported as desirable for the analysis of cocaine and its derivatives (BE and EBE). The most straightforward derivatization procedure is with MTBSTFA in combination with the SIM mode on the MS. Reported procedures also include cleaning with SPE, which helps maintain the MS ion source and detector system as clean as possible. The application of the ISTD is also recommended for higher precision and accuracy. Methods for cocaine analysis without derivatization have also been reported. However, these methods should be tested and validated during the introduction by the analysts.
8. Determination of Hallucinogens and Psychedelics
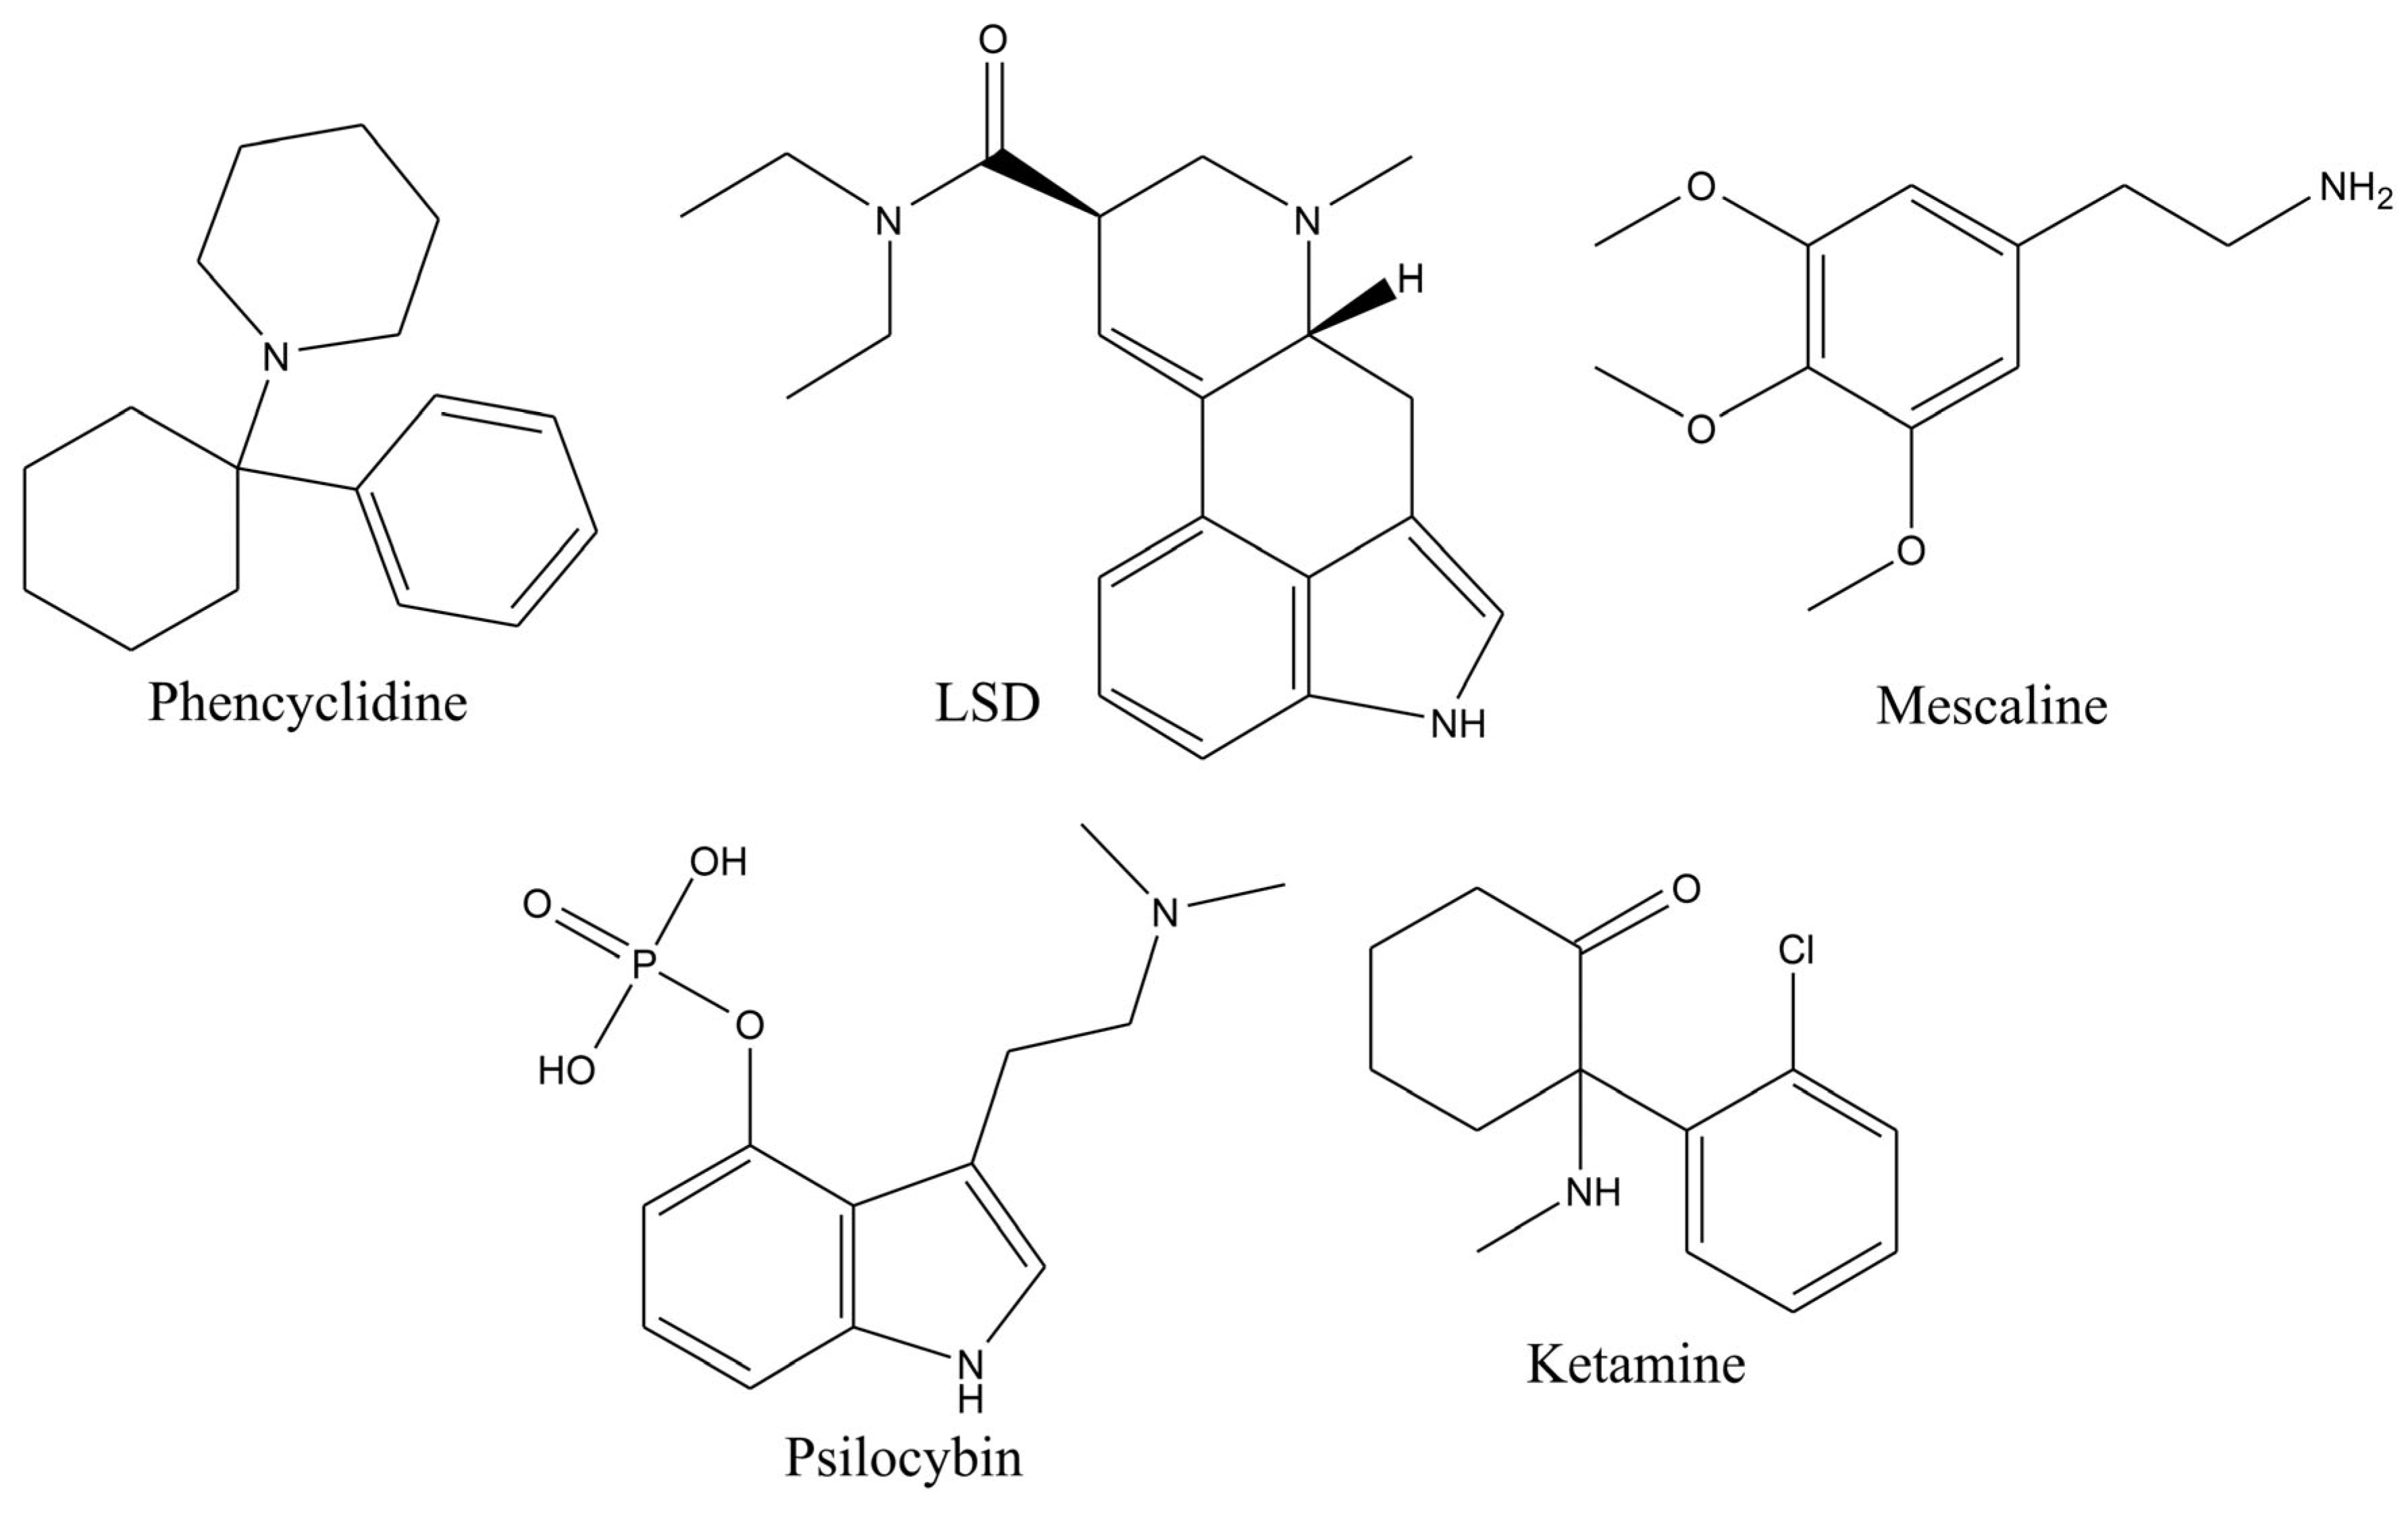
Hallucinogens and psychedelics are a group of illicit drugs containing structurally diverse compounds of both natural and synthetic origin. This group includes compounds such as phencyclidine (PCP), lysergic acid diethylamide (LSD), mescaline, psilocybin, psilocin, ketamine, and others (Figure 6).
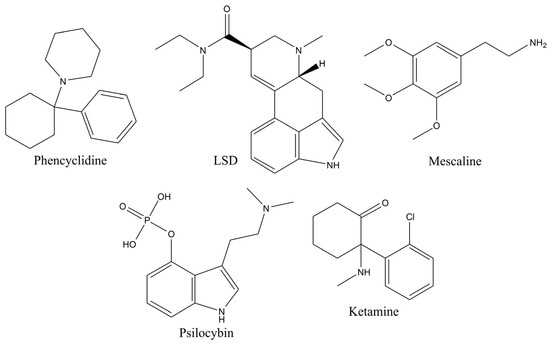
Figure 6.
Structures of hallucinogens and psychedelics.
Psilocin and psilocybin are widely known hallucinogens derived from mushrooms [48]. They are structurally tryptamines and traditional natural neuropsychiatric drugs [49,50]. A common form of abuse is the use of dried powdered mushroom material in capsule form [49]. The analysis of these compounds is quite challenging because psilocin oxidizes easily, while psilocybin can be easily dephosphorylated [50]. Several methods are available for determining these compounds in mushrooms [51], blood [52], and urine [53] after derivatization. On the other hand, Zhou et al. (2021) proposed grinding the mushroom samples at a lower temperature and extracting them with methanol. Hair samples were washed three times with acetone and cut into small pieces after drying. Then, extraction was performed, followed by the analysis using HPLC-MS/MS [49].
Keller et al. (1999) analyzed psilocybin and psilocin in mushroom samples using ion mobility spectrometry and GC/MS. The samples were powdered after lyophilization and subsequently extracted with chloroform using an ultrasonic bath. After centrifugation, the supernatant was separated, evaporated until dryness, and derivatized with MSTFA. The derivatized sample was analyzed using an HP-5 MS capillary column (30 m × 0.25 mm, 0.25 µm) and helium as the carrier gas with a flow rate of 1 mL/min [51]. Sticht and Kaferstein reported a method for determining psilocin in blood and urine samples [52]. The authors mixed the samples with methanol and a glucuronidase solution for the hydrolysis of glucuronides, followed by dilution with phosphate buffer at pH 8. Samples are then run through a SPE column for cleaning and eluted with a methanol/ammonium hydroxide mixture. After evaporation, derivatization was performed using MSTFA, and GC/MS analyzed the sample in the SIM mode [52].
Ketamine is a synthetic compound introduced to the market as an anesthetic for both human and animal use [54,55]. The primary metabolites are norketamine (NK) and dehydronorketamine (DHNK) [56]. Sample preparation for the analysis includes extraction, conjugate cleavage, and derivatization. Extraction of the ketamine and its metabolites is performed using liquid–liquid extraction in an alkaline solution [39,57,58,59,60] or using SPE [61,62]. Lin and Lua performed the cleavage of the conjugates to determine their presence during ketamine metabolism. Urine samples were hydrolyzed with concentrated HCl, followed by alkalinization and extraction. The authors concluded that the concentration of ketamine and its metabolites NK and DHNK increased significantly after acidic hydrolysis [60]. Although it has been reported that ketamine can be analyzed without derivatization [59,60,61,62], procedures involving derivatization have also been reported [57,58]. Chou et al. (2004) employed gas chromatography-isotope dilution mass spectrometry (GC-IDMS) in conjunction with liquid–liquid extraction and derivatization. The authors reported that derivatization enhanced the instrument’s response and facilitated the easier and more accurate selection of ions, thereby increasing the precision and accuracy of both qualitative and quantitative analysis [58]. The only flaw is the absence of the second ketamine metabolite, i.e., DHNK, in the study, as well as the use of other derivatization agents besides pentafluorobenzoyl chloride (PFBC). On the other hand, Wu et al. (2007) investigated several derivatization agents for sample preparation in the analysis of ketamine and its metabolites. Based on the obtained results, the authors reported that PFBC is the best choice for derivatization, providing the best characteristics [57].
Mescalin is also a natural alkaloid readily found in nature and shows a similar type of action to LSD [63]. However, LSD is considered to be 4000 times stronger compared to mescalin [64,65,66]. Gambelunghe et al. (2012) reported the GC/MS and GC-MS/MS methods for the analysis of mescaline in several types of samples (liquid, urine, and hair) [63]. For the liquid sample, d9-mescaline was added as an ISTD with NaOH and phosphate buffer, adjusting the pH to 9.2. Extraction was performed with a methylene chloride/isopropanol mixture (9:1 v/v). After centrifugation, the organic layer was separated and evaporated to dryness. The dried residue was derivatized with PFPA and PFPOH at 70 °C. The sample was evaporated again and reconstituted with ethyl acetate and injected into the GC/MS. The same procedure was repeated for the preparation of the urine sample, but the MS was operated in the SIM mode. In the case of the hair samples, d9-mescaline was added (ISTD), followed by hydrolysis with hydrochloric acid (HCl). After adjusting the pH with phosphate buffer to 9.2, the same derivatization procedure was applied, while the sample was analyzed with GC-MS/MS [63]. Based on the obtained results, the authors concluded that the developed method is suitable for analyzing mescaline at picogram concentrations. In this case, the authors used a SPB-35 capillary column (15 m × 0.25 mm, 0.25 µm). Henry et al. (2003) reported a method for analyzing mescaline in postmortem tissue, where the sample was prepared by adjusting the pH with ammonium hydroxide, followed by extraction with butyl chloride. The organic layer was separated and subsequently extracted with sulfuric acid. After the second pH adjustment with ammonium hydroxide, extraction with butyl chloride was repeated. The obtained organic layer was evaporated and reconstituted with methanol for analysis using an HP-1 capillary column (12 m × 0.20 mm) in the SIM mode, with the selection of ions having m/z values of 182, 181, and 167 [67].
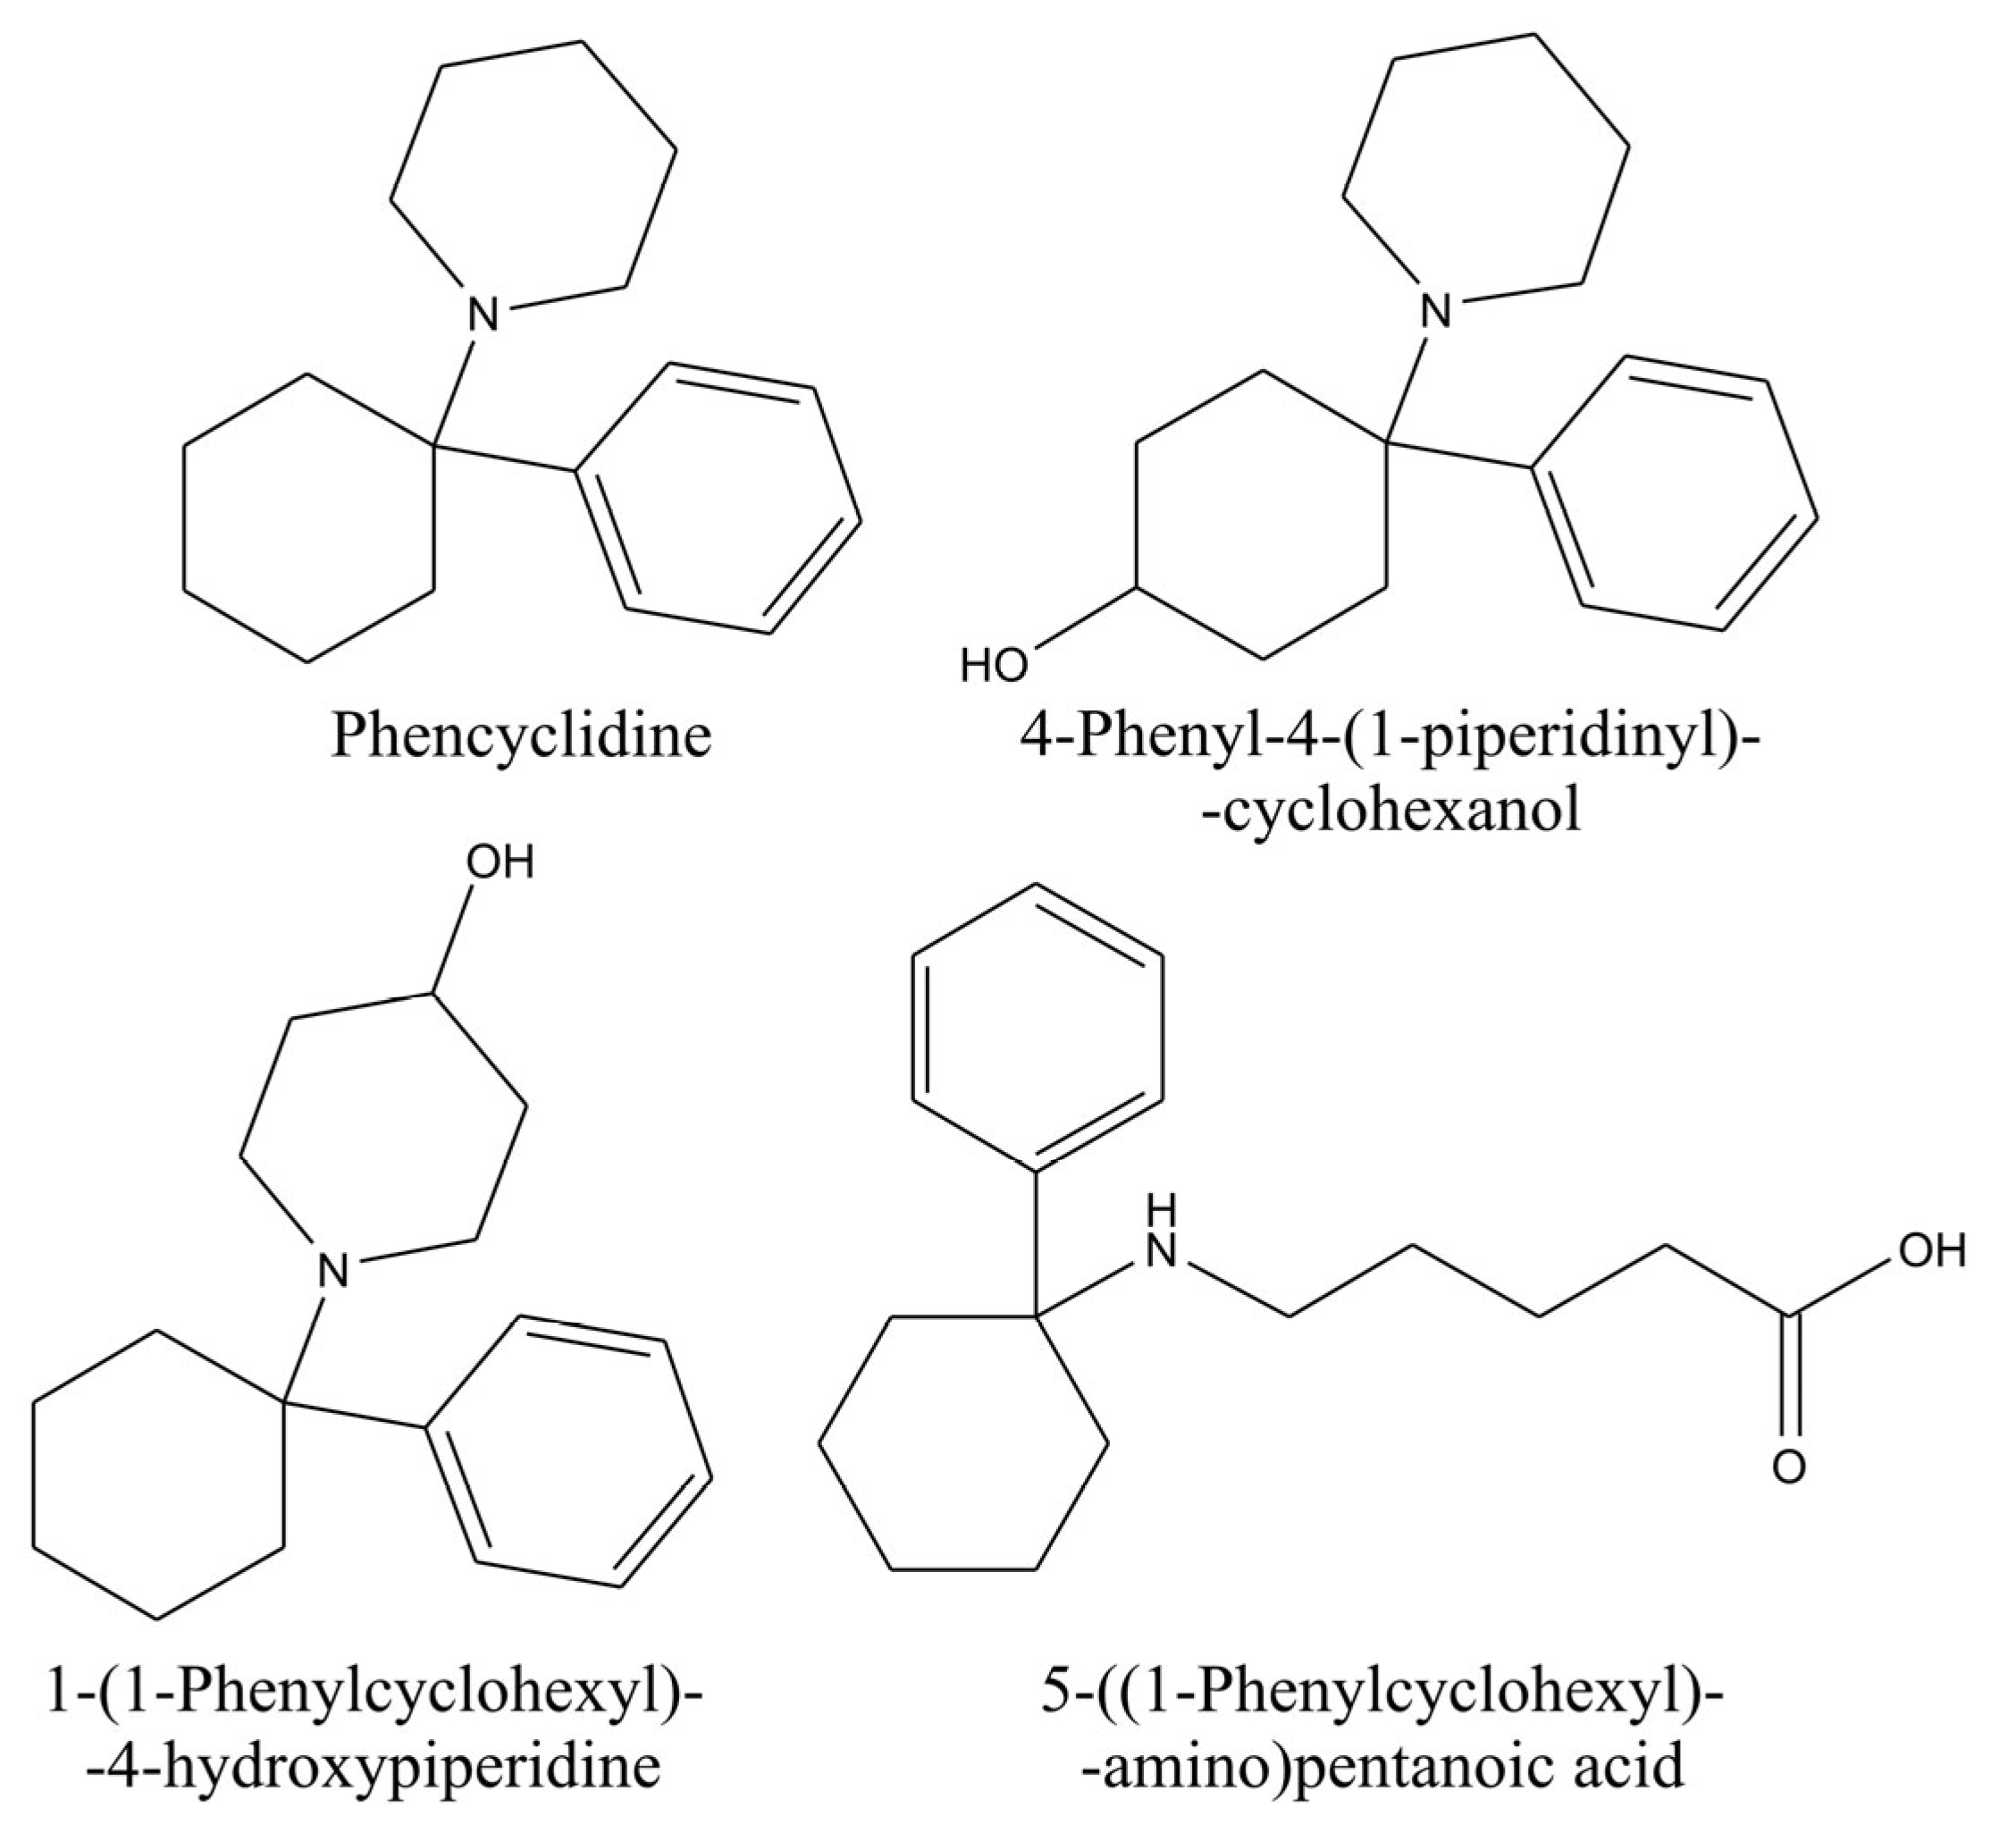
Phenylcyclidin (PCP) is a cycloalkylamine whose classification is a dissociative anesthetic. It was revoked for clinical application due to severe side effects. After being revoked, it became a street drug that could be administered by smoking, nasal insufflation, intravenous injection, or orally [68]. It could be abused alone or in combination with other illicit drugs, e.g., cannabis [69]. It is metabolized by hydroxylation of cyclohexane and piperidine rings or through the formation of amino acid metabolites (Figure 7). It is considered that the amino acid metabolite is created after the hydroxylation of the piperidine ring with subsequent oxidative hydrolysis of the created carbinolamine [69]. ElSohly et al. (1988) reported a method for analyzing PCP and its metabolites in urine samples. They used SPE Prep-Sep C18 cartridges for extraction. After washing with a 30% methanol solution in water, the analytes were eluted with methanol. Collected eluents were evaporated, and resins were dissolved in methanolic HCl and mixed with the subsequent addition of water. Then, the pH value was set to 9–10 with ammonium hydroxide, and the solution was extracted with hexane. After centrifugation, the hexane layer was separated, evaporated, and constituted with isooctane for the analysis [69]. Ferguson and Garg also reported the method for PCP analysis in urine and blood samples [68]. The sample was mixed with water and ISTD (d5-phencyclidine). After centrifugation, the upper organic phase was transferred, evaporated, and reconstituted with ethyl acetate for analysis using a Zebron ZB-1 column (15 m × 0.25 mm, 0.25 µm). The authors reported very high correlation coefficients for calibration curves and intraday and interday imprecisions lower than 10% [68].
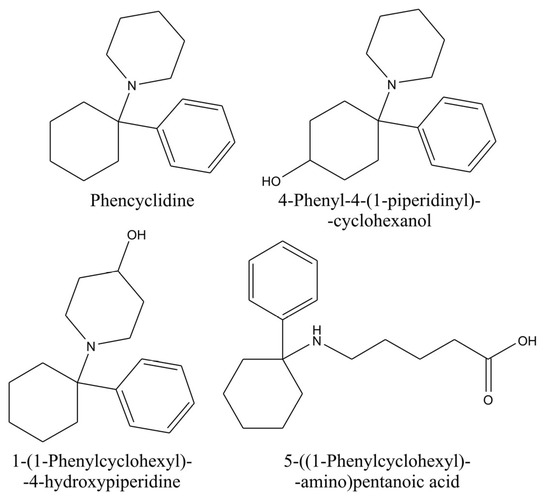
Figure 7.
Phencyclidine (PCP) metabolites.
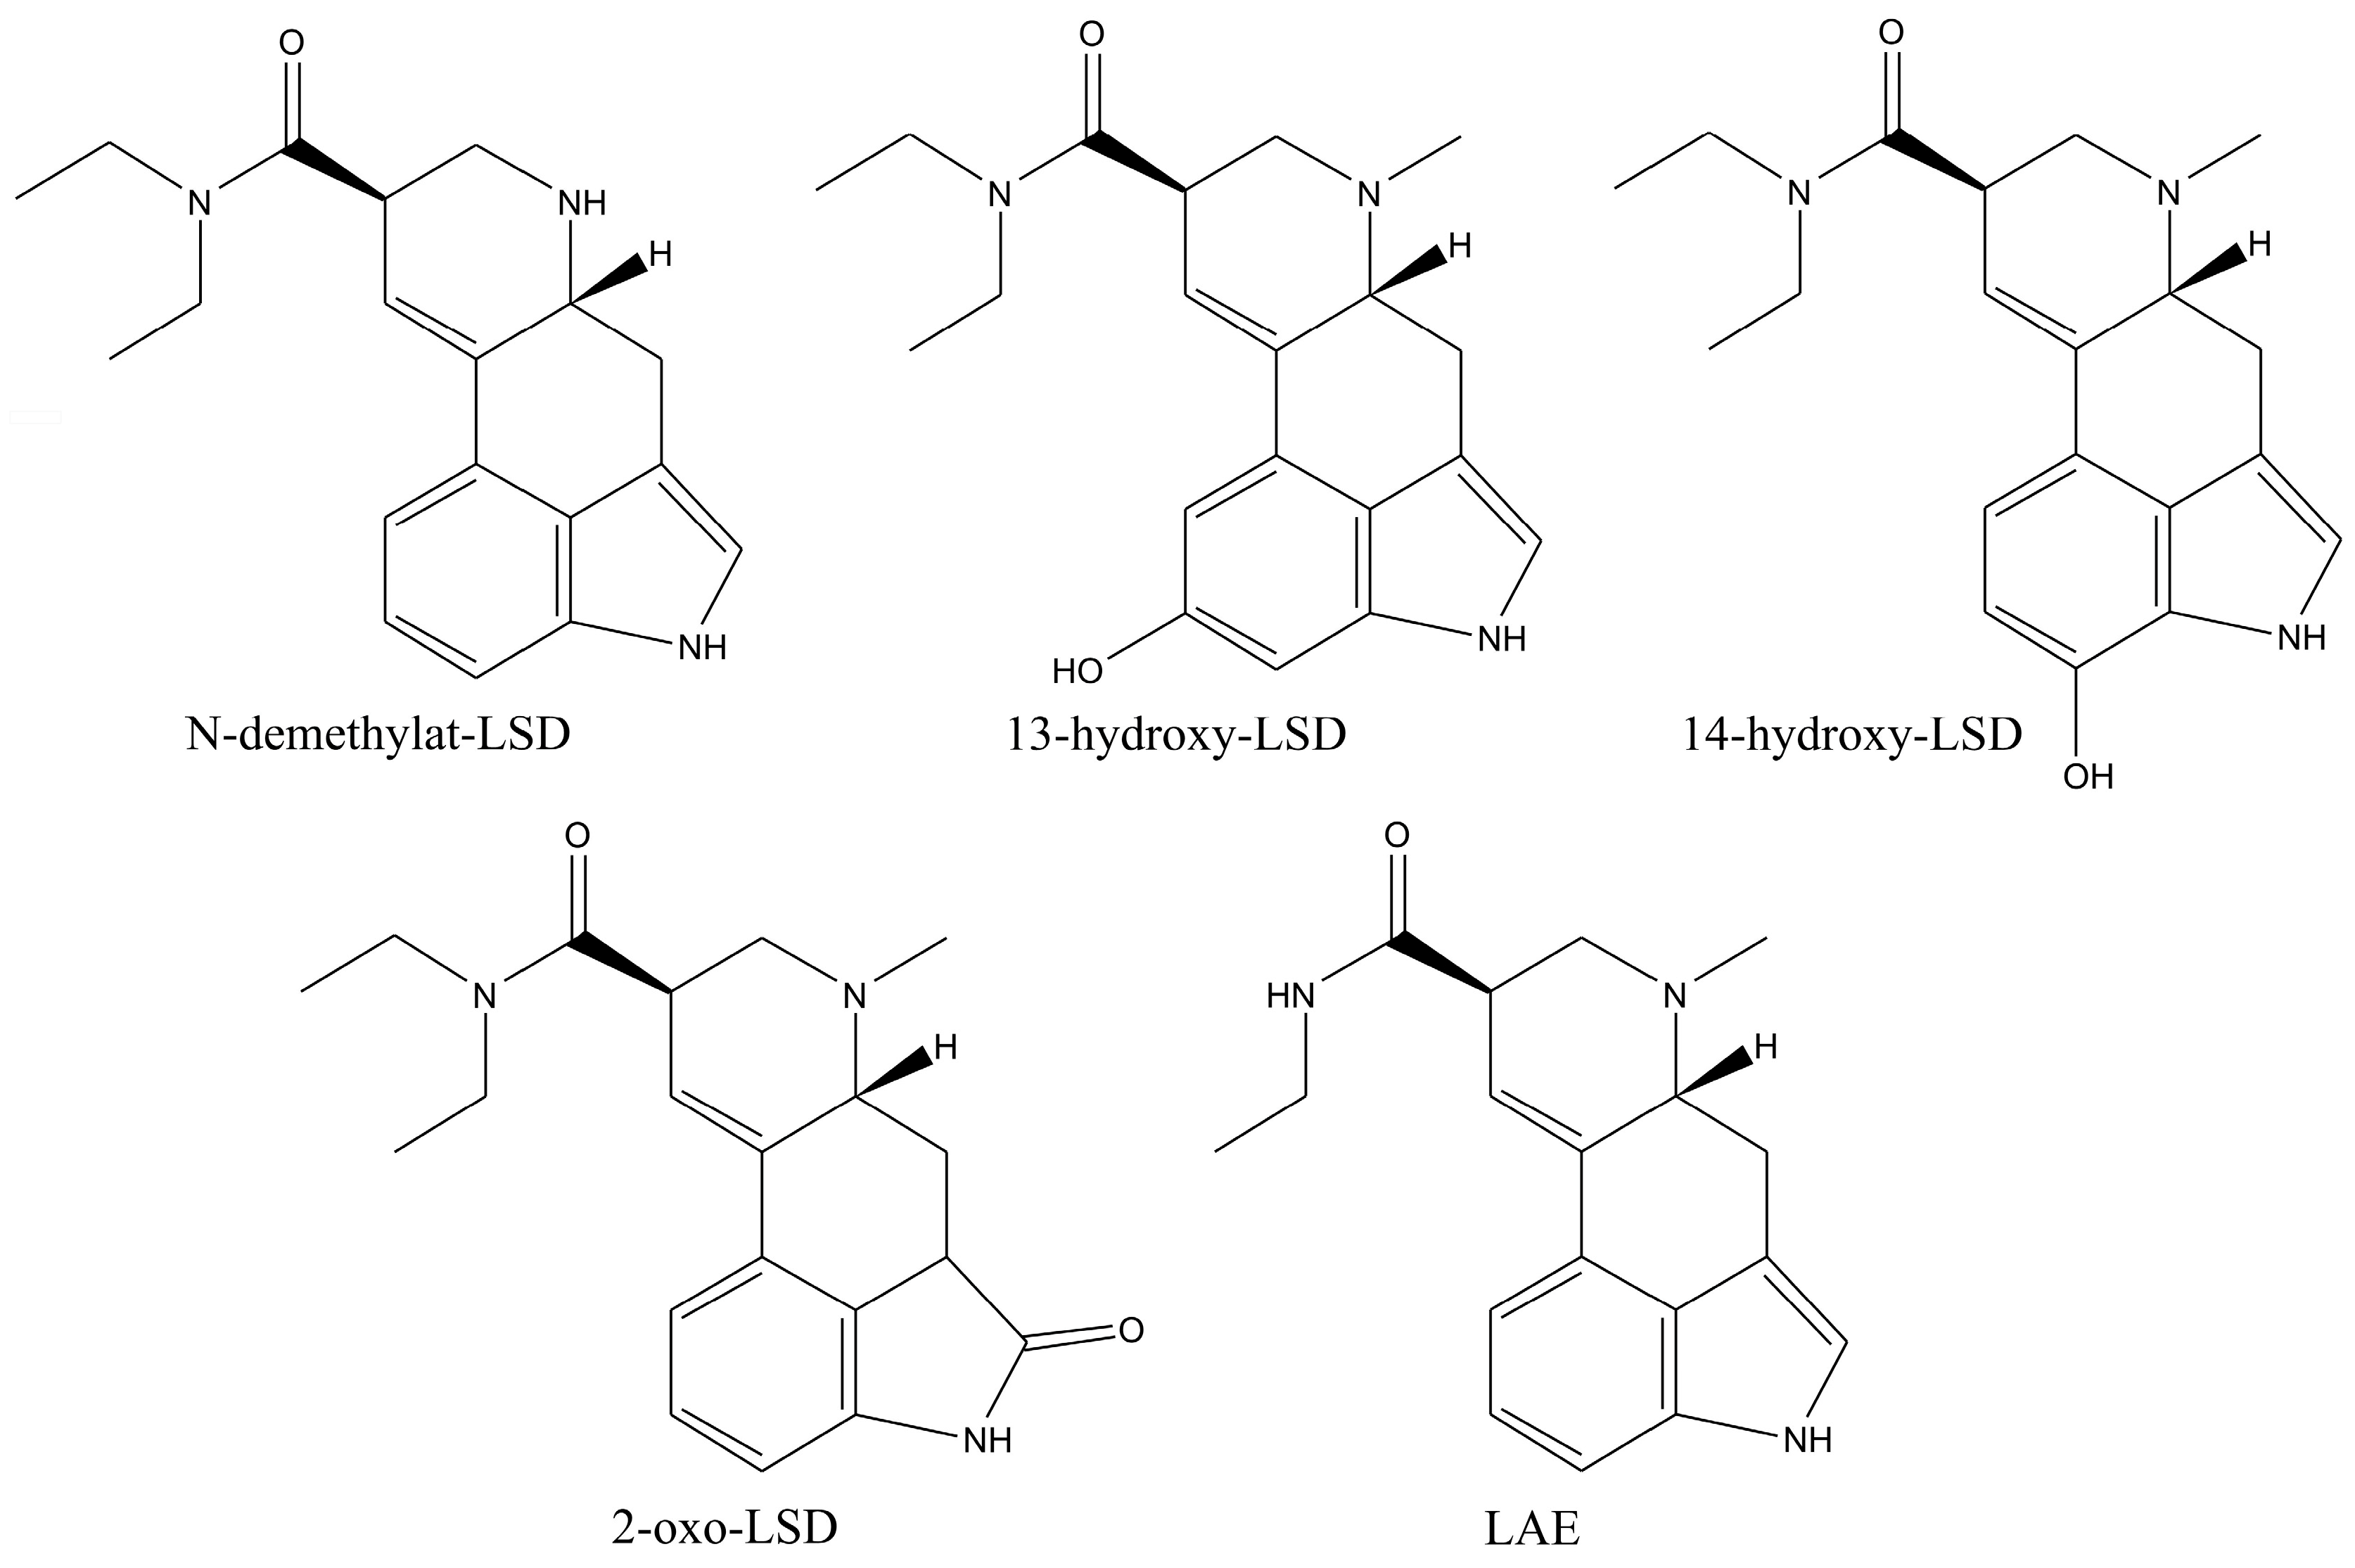
LSD is a highly potent psychoactive compound with hallucinatory effects, causing bizarre behavior in consumers [70]. The metabolites of these compounds are formed through N-demethylation, N-deethylation, and hydroxylation, resulting in inactive products at the end of the metabolic process [71]. The primary metabolites are N-demethyl-LSD (nor-LSD), 13-hydroxy-LSD, 14-hydroxy-LSD, lysergic acid ethylamide (LAE), and 2-oxo-LSD (Figure 8) [72]. This extensive metabolic pathway, in combination with LSD’s instability, makes its determination very difficult [70]. ElSohly et al. published a method for the analysis of LSD in a serum sample. The sample was spiked with an ISTD and alkalized with sodium carbonate and ammonium hydroxide. The sample was then extracted with butyl chloride. The organic layer was separated, evaporated, and reconstituted with methanol for the analysis [69]. In the event of interference, the extraction procedure should be repeated as follows: Butyl chloride should be evaporated, and the resin should then be mixed with phosphate buffer. This is followed by adding a mixture of butyl chloride and cyclohexane (1:1, v/v), which is then mixed and centrifuged. After discarding the organic layer, the acidic solution is mixed with sodium carbonate and ammonium hydroxide, followed by the addition of butyl chloride, mixing, and centrifugation. The organic layer is transferred, evaporated, and treated with an MSTFA/pyridine mixture for derivatization. However, the authors also reported the high sensitivity of LSD and indicated its sensitivity to light and glass vials [69]. Schneider et al. (1998) also reported on the difficulties of the direct analysis of LSD with GC/MS. LSD could irreversibly be adsorbed to the capillary column due to its low volatility and thermal instability. Thus, the authors emphasized the necessity of derivatizing the indole nitrogen in the LSD molecule prior to analysis [72,73].
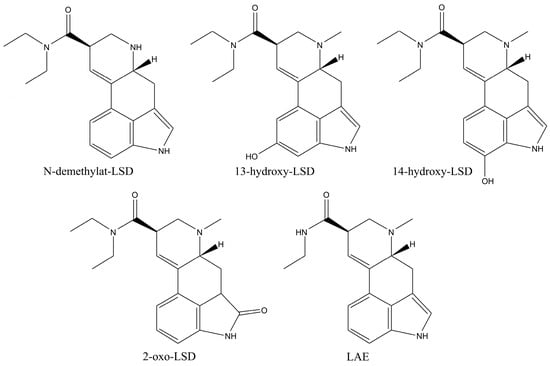
Figure 8.
Metabolites of LSD.
This group of illicit drugs contains both synthetic and natural psychoactive compounds. The most famous natural compounds in this group are psilocybin and psilocin. The analysis of these compounds is quite challenging due to their instability, i.e., psilocin oxidizes, while psilocybin loses the phosphoryl unit. Because of structural sensitivity, derivatization is highly recommended (reported with MSTFA). A simple extraction procedure using chloroform and an ultrasonic bath is suitable for seized samples. In the case of biological samples (like blood and urine), a combination of methanol and glucuronidase is necessary for the extraction of these compounds. Samples must be cleaned up using SPE and derivatized (e.g., MSTFA) prior to the analysis. Ketamine and its metabolites, NK and DHNK, could be analyzed in derivatized forms and without derivatization. However, both approaches must be validated when introducing the methods. Derivatization is generally more desirable because it enhances the MS response, making ion selectivity easier, and increases the stability and volatility of the analyzed compounds. The best derivatization agent in this case is PFBC. All mentioned factors increase the precision and accuracy of the analytical method. It has also been reported that acidic hydrolysis significantly increases the concentration of ketamine, NK, and DHNK, releasing them from the conjugated forms. Therefore, acidic hydrolysis should also be performed. Extraction of mescaline should be performed in an alkaline environment (blood, tissue, and urine) with solvents such as methylene chloride, isopropanol, or butyl chloride, followed by derivatization. On the other hand, hair samples are hydrolyzed in an acidic environment, followed by adjustment of the pH to 9. The PCP and its metabolites are analyzed without a derivatization step. However, the application of SPE for extraction and sample cleaning is recommended. The determination of LSD is also complicated by its instability in combination with extensive metabolism. Extraction should be conducted in an alkaline environment using butyl chloride. The derivatization with the MSTFA/pyridine mixture is necessary to avoid irreversible adsorption on the stationary phase. In all cases, non-polar columns should be used in the SIM mode in MS and with the application of ISTDs to follow the quality of the complete analytical procedure.
9. Determination of Gamma-Hydroxybutyric Acid (GHB) and Derivatives
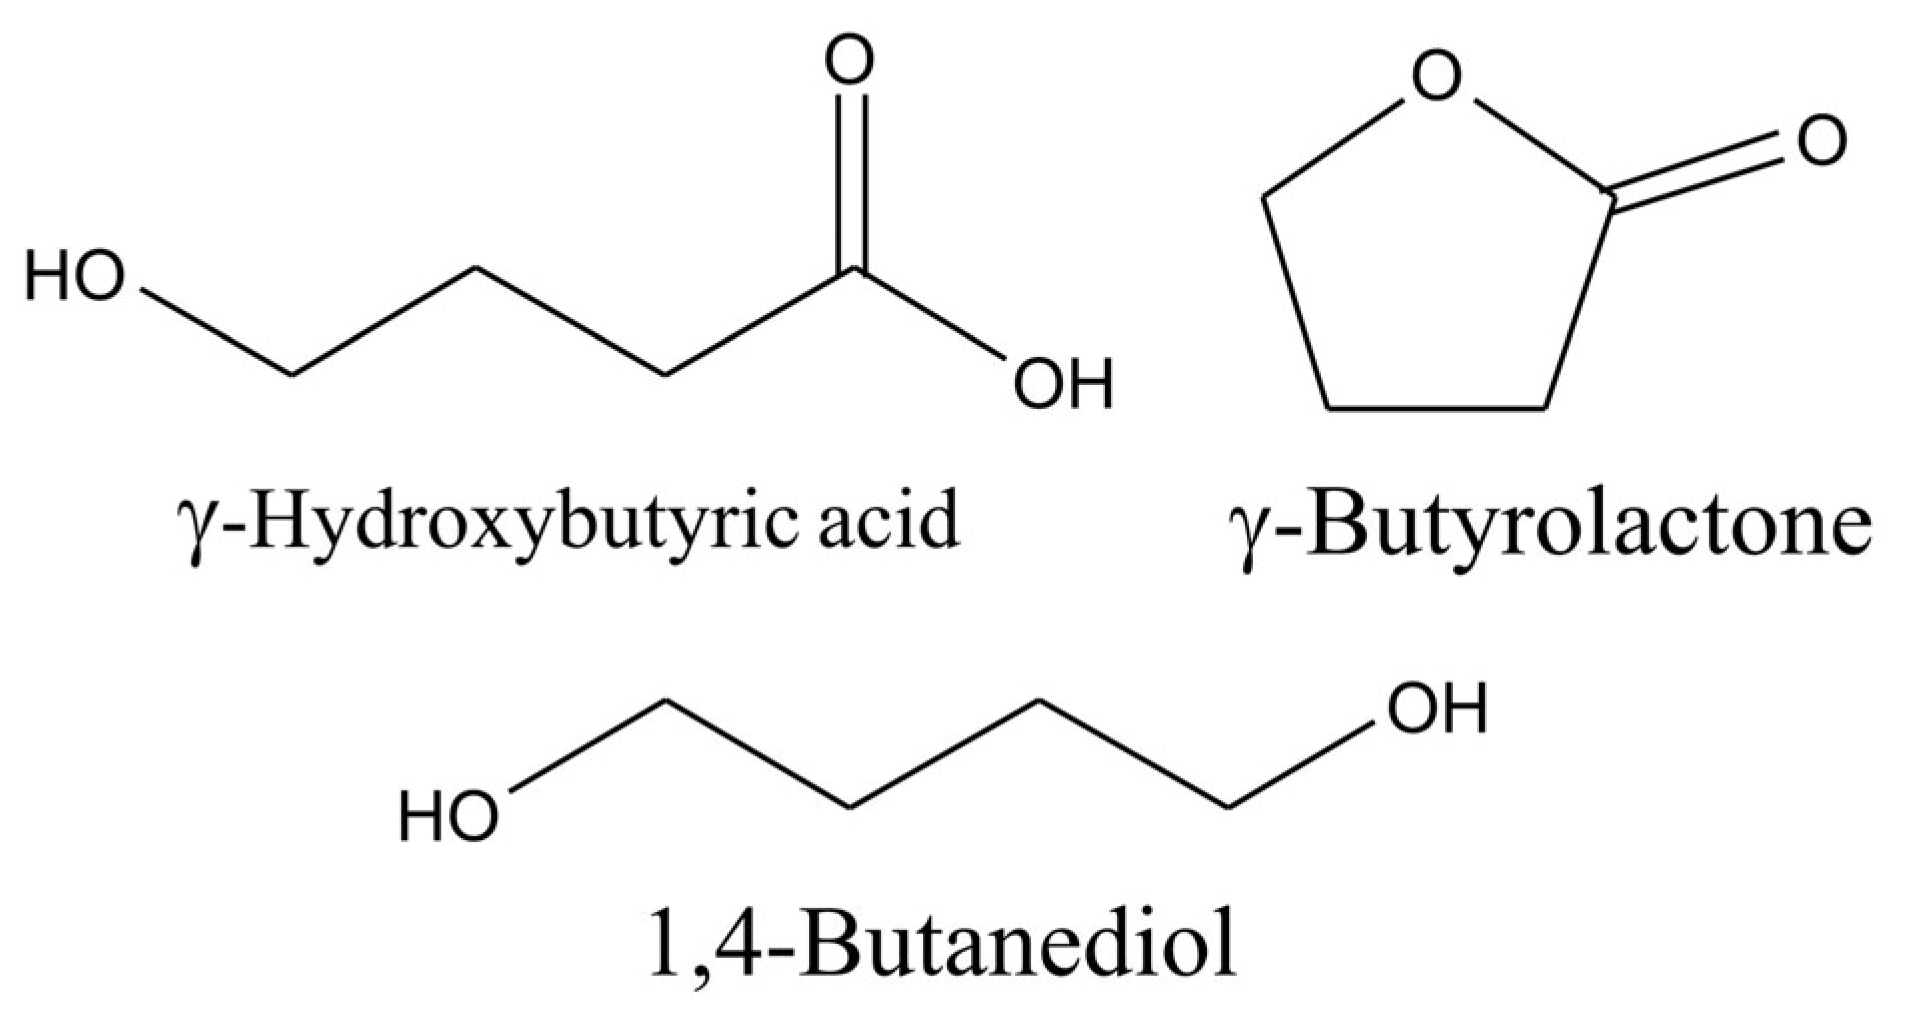
Compounds in this group are gamma-hydroxybutyric acid (GHB), gamma-butyrolactone (GBL), and 1,4-butanediol (BD) (Figure 9).
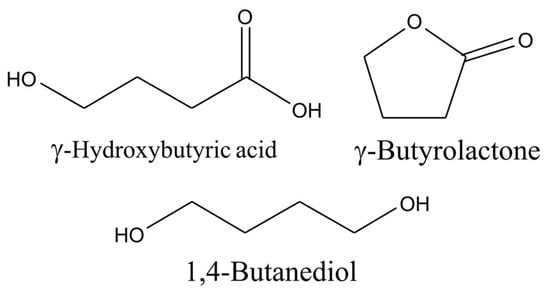
Figure 9.
Structures of gamma-hydroxybutyric acid (GHB) and derivates.
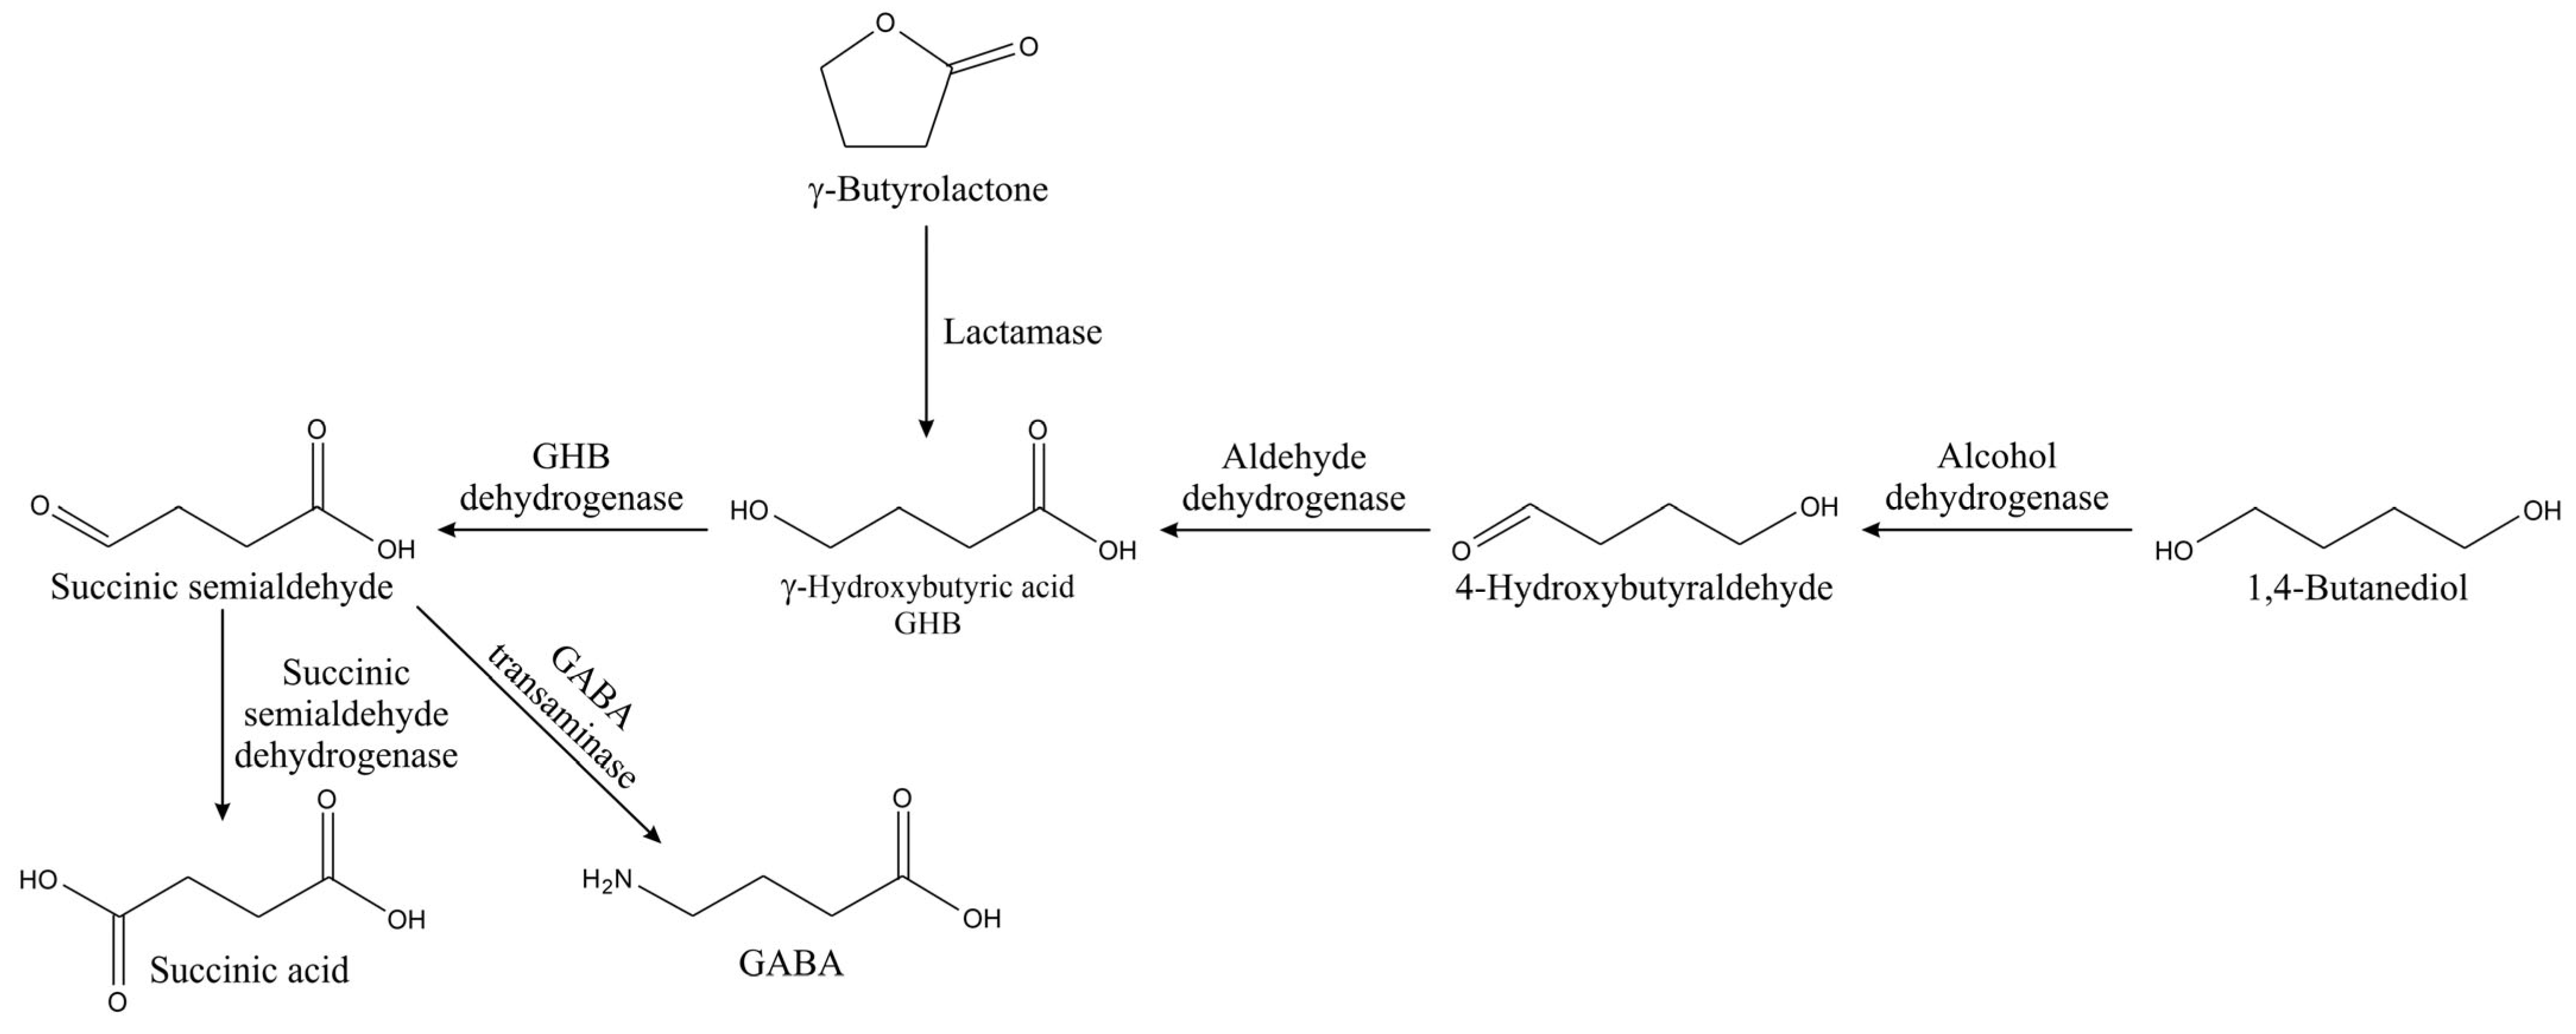
Gamma-hydroxybutyric acid (GHB) is an endogenous metabolic compound with a role as a neurotransmitter and acts on the GHB receptors and GABA-B receptors [74,75,76]. It has been synthesized to be an anesthetic, but due to unpredictable effects, it was discontinued [77]. The GHB becomes a very popular drug of abuse because of its stimulant, anxiolytic, and euphoric effects even at low concentrations [78]. GHB is metabolized by GHB dehydrogenase into succinic semialdehyde and further into succinic acid (Figure 10) [79]. Methods for analysis of these compounds include extraction, hydrolysis, and potential derivatization. A method for GHB analysis in urine has been reported, where the sample is prepared by mixing it with phosphate buffer and then run through an SPE column. After washing, separation, and evaporation of the solvent, DMF was added to the mixture, which was then centrifuged. The supernatant was separated and evaporated. The dry residue was mixed with ethyl acetate and BSTFA containing 1% TMCS, and then run through the GC. The HP-1MS (12 m × 0.25 ram, 0.25 µm) capillary column was used with helium as a carrier and a flow rate of 1.60 mL/min [77]. The authors concluded that the method is suitable for urine samples, but not readily applicable to blood samples.
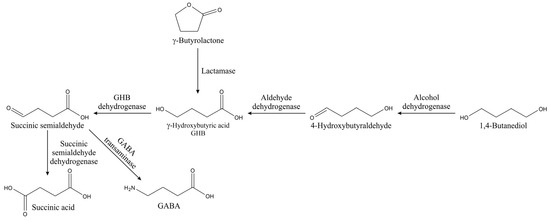
Figure 10.
Metabolic pathway of GHB and derivates.
Elian reported the method for GHB analysis in a blood sample [79]. GC/MS was equipped with an HP-1MS (12 m × 0.20 mm, 0.33 µm) capillary column. The MS was operated in the SIM mode with the following m/z values: 233, 234, and 235 for GHB and 239, 240, and 241 for d9-GHB (ISTD). The blood sample was mixed with the ISTD, saturated ammonium chloride buffer, and ethyl acetate. After mixing and centrifugation, the organic layer was separated, evaporated, and derivatized with BSTFA and 1% TMCS. The sample was then analyzed after the completion of the derivatization process. The authors reported excellent validation parameters, with CV and relative accuracy values of less than 5%. The authors concluded that the method is accurate, precise, and reproducible. It is simple, allowing single-step extraction and analysis of GHB without lactone conversion [79]. Bodson et al. (2008) developed a standard procedure for urine, serum, and gastric aspiration analysis. Briefly, samples were mixed with methanol, ISTD (d6-GHB), and diluted sulfuric acid. After the addition of ethyl acetate, the mixture was centrifuged. The organic layer was transferred, evaporated, and derivatized with the MSTFA/TMCS mixture. After finishing derivatization, the sample was injected into the GC for analysis [78]. The MS was operated in the SIM mode with the following m/z values: 233, 204, and 117 for GHB and 239 for d6-GHB (ISTD). The authors reported a CV of less than 9%, accuracy between 90.1% and 104.2%, a LOD of 1 mg/L, and a LOQ of 2.5 mg/L [78]. However, taking a closer look at the chromatogram, we might notice that the peaks of the compound (GHB) and ISTD are very close to each other, i.e., the resolution is not good; however, it should be usable at lower concentration levels.
10. Determination of Benzodiazepines
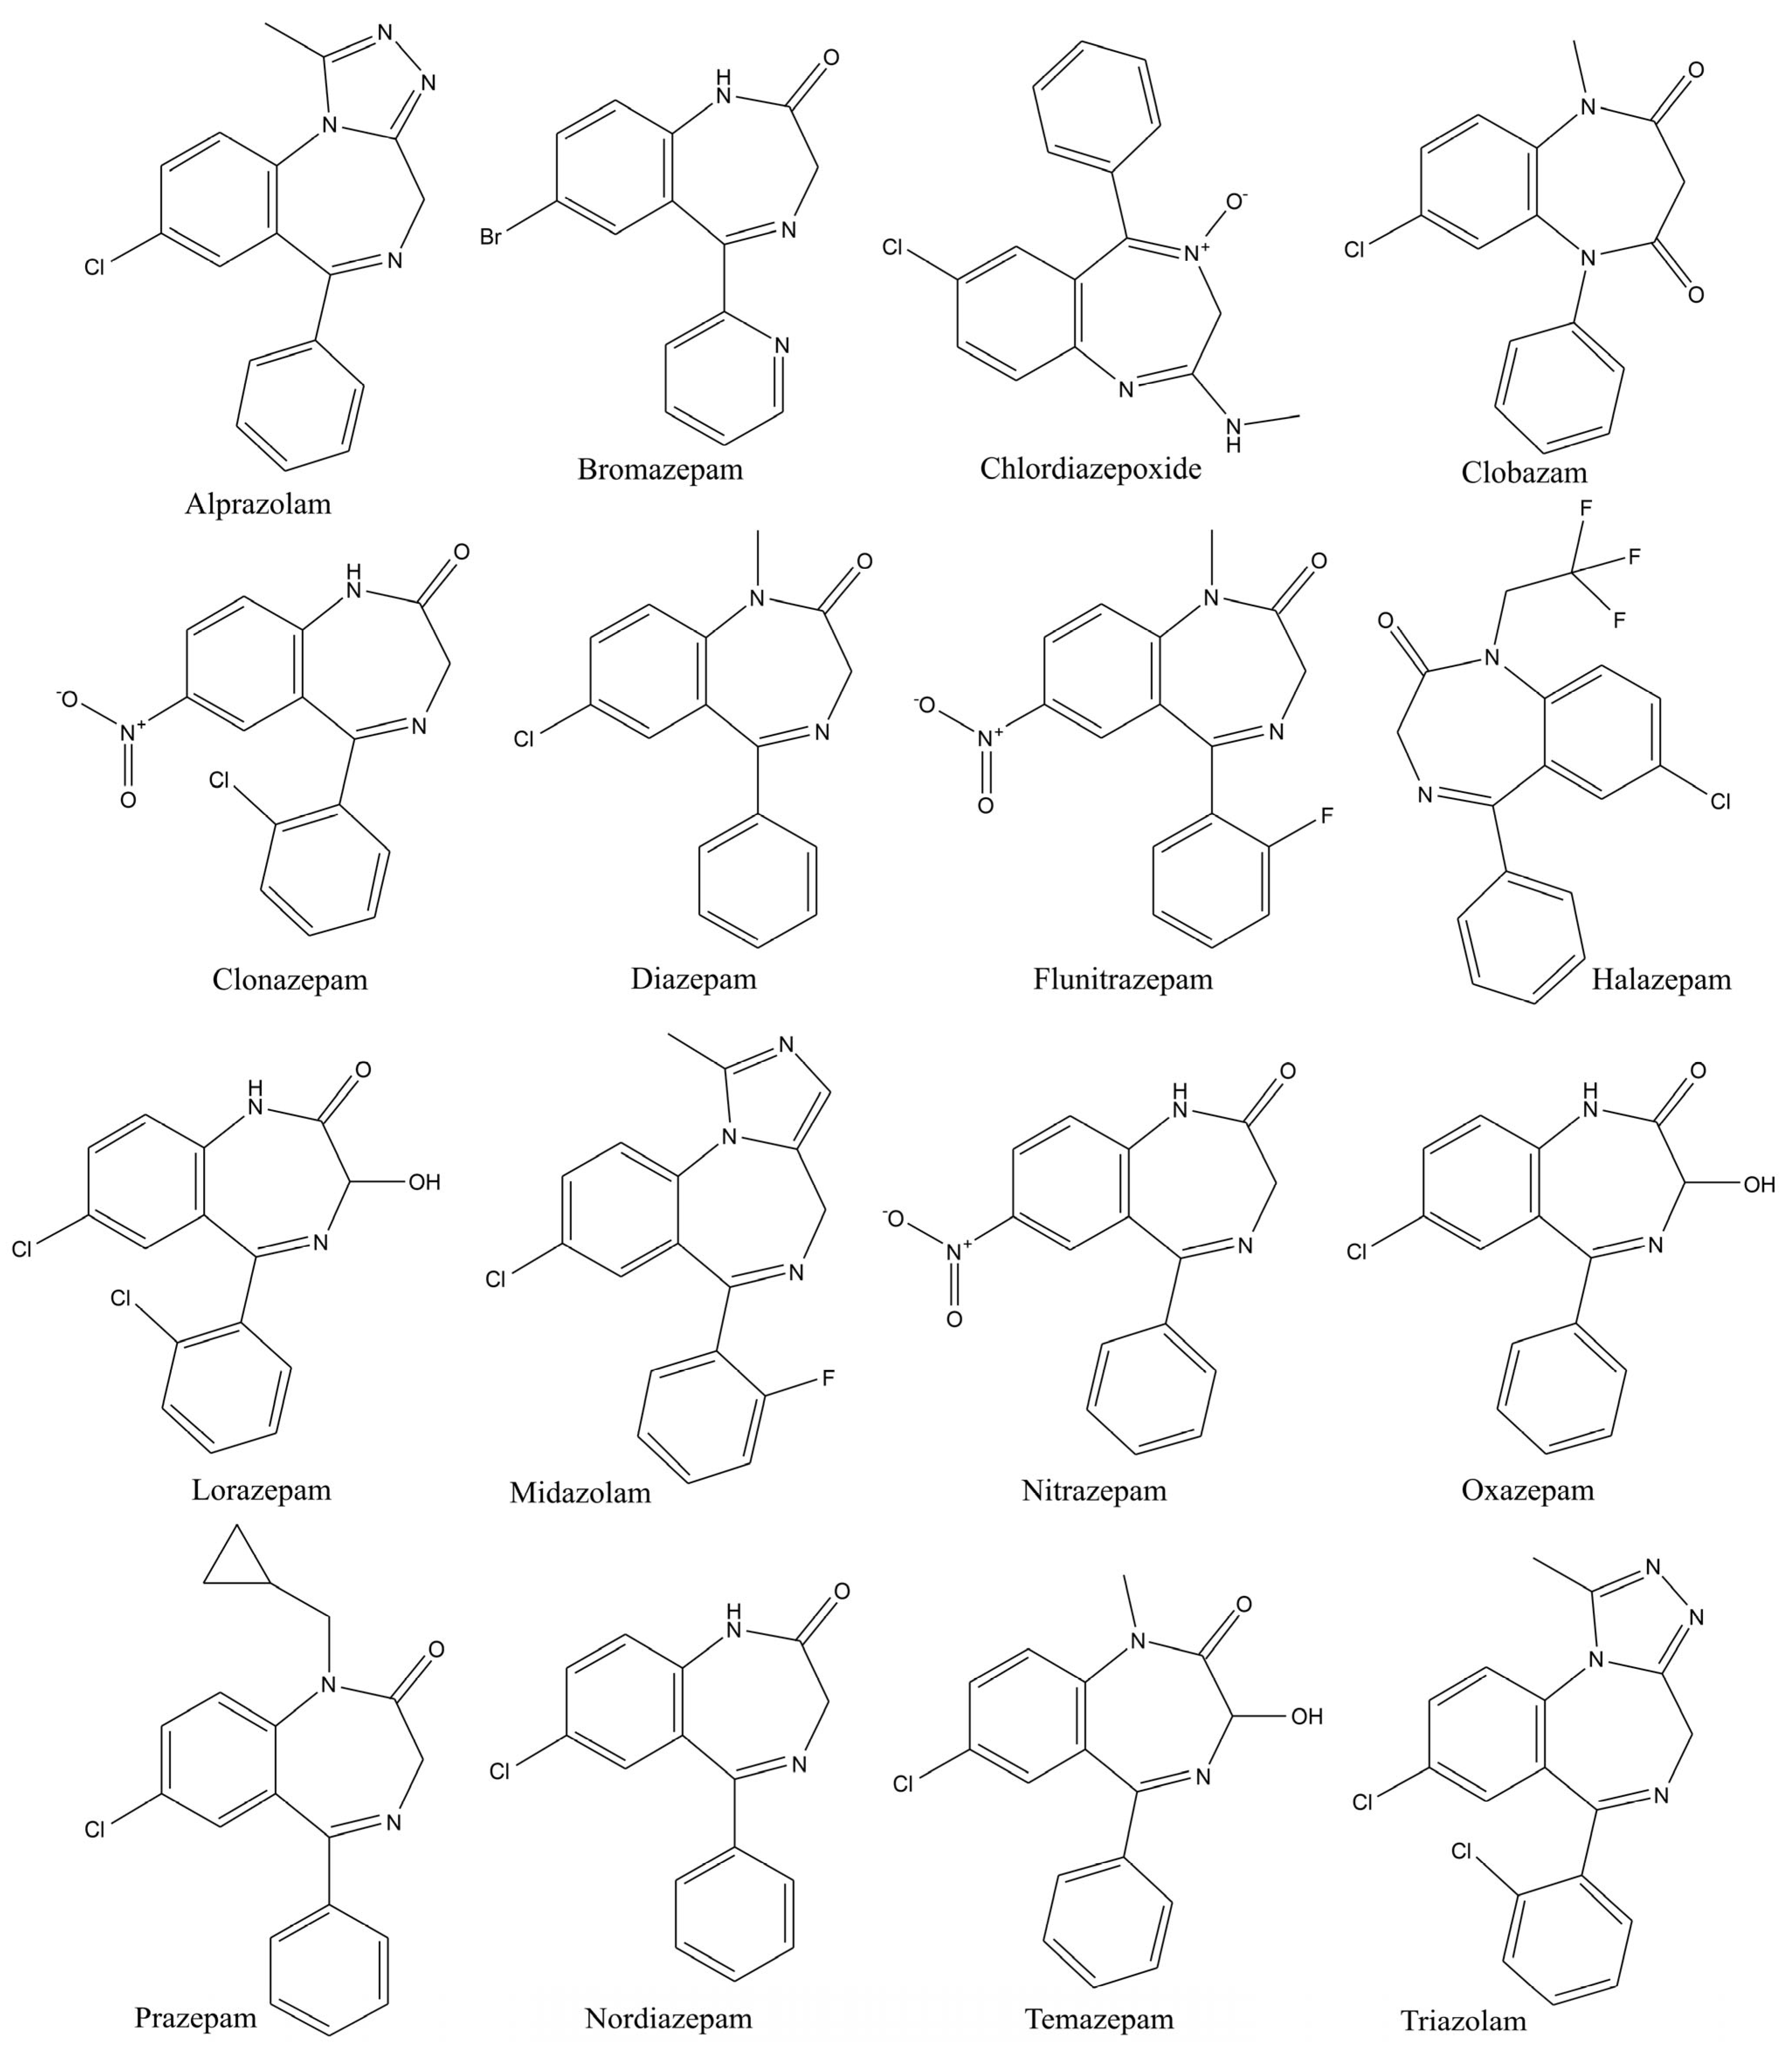
Benzodiazepines are one of the largest groups of compounds containing CNS depressants known for their anxiolytic, sedative–hypnotic, anticonvulsant, muscle relaxant, and amnesic properties [80]. It contains the following compounds: alprazolam, bromazepam, chlordiazepoxide, diazepam, clonazepam, lorazepam, and many others (Figure 11). Long-term use of these compounds induces physical dependence with different withdrawal symptoms such as insomnia, agitation, irritability, muscle tension, and, in more severe cases, hallucinations, psychosis, and seizures [80,81]. The analysis of these compounds with GC/MS includes extraction, enzymatic hydrolysis of the conjugates, application of the SPE, and derivatization in some cases [82,83,84]. Thus, Goldberger et al. (2010) reported a validated method for the determination of alprazolam, diazepam, nordiazepam, oxazepam, temazepam, lorazepam, α-hydroxyalprazolam, and α-hydroxytriazolam in blood and urine samples. Samples were mixed with the ISTD, phosphate buffer, and β-glucuronidase. After incubation and the addition of a fresh amount of phosphate buffer, the mixture was run through the SPE column. After elution and sonication, the sample was dried and mixed with MTBSTFA for derivatization [80].
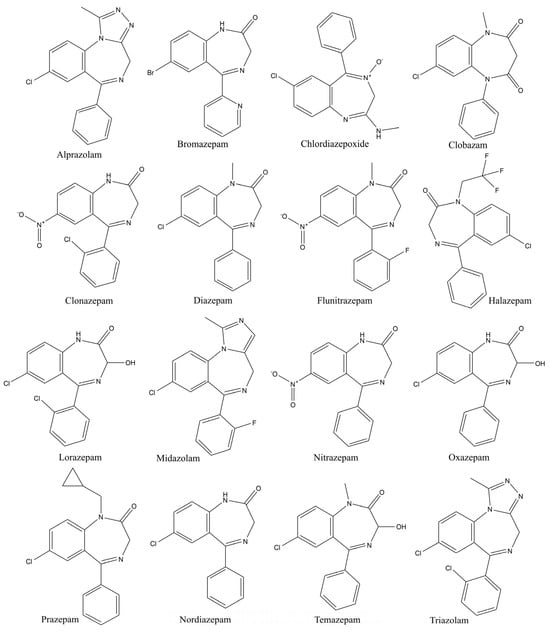
Figure 11.
Structures of benzodiazepines.
Papoutsis et al. (2010) also reported a method for determining benzodiazepines and their metabolites in blood samples [85]. The authors developed and validated a method for the determination of 23 benzodiazepines, e.g., diazepam, nordiazepam, oxazepam, bromazepam, alprazolam, lorazepam, medazepam, flurazepam, fludiazepam, tetrazepam, chlordiazepoxide, clobazam, midazolam, flunitrazepam, 7-amino-flunitrazepam, triazolam, prazepam, nimetazepam, nitrazepam, temazepam, lormetazepam, clonazepam, and camazepam. The samples were prepared by mixing them with the internal standard (d5-oxazepam) and phosphate buffer. Then, liquid–liquid extraction was performed using chloroform, followed by centrifugation and separation of the organic layer. The organic solvent was evaporated, and the resin was dissolved in acetonitrile. It was then derivatized in two steps using propylation and propionylation. Propylation was conducted by adding TMAH and propyliodide, while propionylation was performed with a mixture of triethylamine and propionic anhydride. For GC/MS analysis, an HP-5MS column (30 m × 0.25 mm, 0.25 µm) was used, with helium as the carrier gas at a flow rate of 1 mL/min. The MS was operated in the SIM mode, with the selected ions and derivatization steps are summarized in Table 6. The authors reported LOD and LOQ in the ranges of 0.60–5.47 ng/mL and 1.83–177.20 ng/mL, respectively, while the absolute recovery ranged from 74% to 119% [85].

Table 6.
Derivatization methods for analyzed benzodiazepines, selected ions for the SIM method, and retention times published by Papoutsis et al. [85].
Yegles et al. (1997) reported a method for determining benzodiazepines in human hair samples. The authors stated that the application of acidic and alkaline hydrolysis is not suitable for extracting these compounds due to decomposition and the formation of new compounds. They first decontaminated the sample with hot water and acetone. After drying, hair samples were cut and pulverized. After pulverization, the samples were mixed with acetate buffer and deuterated ISTD. Hydrolysis was conducted with β-glucosidase and arylsulfatase. After centrifugation and separation of supernatant, SPE extraction was performed on a C18 column. Elution is performed with a mixture of methylene chloride and acetone. The eluted solvent was evaporated and reconstituted with ethyl acetate for analysis without a derivatization step. MS was operated in the SIM mode, while LOD was in the range from 0.01 to 2 ng/mg [86]. Acikkol et al. (2009) developed a method for analyzing benzodiazepines and ketamine in alcoholic and nonalcoholic beverages using simple sample preparation via liquid–liquid extraction with a chloroform–isopropanol mixture (1:1, v/v). After evaporation, the resin was reconstituted and analyzed by GC/MS. An HP-5MS column (30 m × 0.25 mm, 0.25 µm) was used with a helium flow of 1.2 mL/min. MS was operated in the EI mode with full scan in the m/z range of 50–600. Validation and verification were performed at two concentration levels (100 µg/mL and 250 µg/mL), with a recovery range of 73.0–112.6% and an accuracy range of 0.04–27.0%. The LOD ranged from 1.3 µg/mL to 34.2 µg/mL, while the LOQ ranged from 3.9 µg/mL to 103.8 µg/mL. The CV was below 5% in most cases except for clonazepam in beer (5.90%) and alprazolam in peach juice (13.6%) [87].
11. Conclusions
This review article aimed to present available GC/MS and GC/FID methods for the analysis of different types of drug abuse. A literature search revealed that authors have successfully developed methods for the simultaneous analysis of various drug types. However, investigators should be aware of the issues and difficulties that may occur. Structural differences within the drug classes lead to variations in the physicochemical properties of the investigated compounds, including volatility and stability, which are crucial for gas chromatography. Therefore, due to the lower volatility and certain instability, various approaches have been suggested, such as derivatization. Derivatization enhances the volatility and stability of the compounds, resulting in a more robust signal in the mass spectrometer.
Another issue is the complexity of the analyzed matrix. Drugs are analyzed for different sample types. The easiest method is analysis after seizure, where the analyst obtains the tablets or powder as the starting material. When the matrix is a biological sample, such as blood, urine, or hair, various approaches have been developed. Samples must be decontaminated, homogenized, and then extracted with a solvent or buffer. The following steps include hydrolysis, solid-phase extraction cleaning, centrifugation, evaporation, derivatization, and reconstitution with the desired solvent prior to analysis. The selection of the preparation procedure remains on the analyst’s shoulders, who should bear in mind that sample amounts are usually tiny (such as milligrams or droplets). Moreover, the analysis of the biological sample typically requires methods that are suitable for both the starting compound (drug of abuse) and its metabolites, which are likely to be present in the samples. Therefore, forensic science is not an easy field, presenting numerous challenges.
Although other methods provide faster results (such as FTIR or TLC) or more accurate results and proved to be more suitable for biological samples (for example, liquid chromatography), gas chromatography will remain one of the most significant methods for the analysis of drugs of abuse and their metabolites due to its robustness (especially compared to HPLC), precision, and accuracy. The modern upgrade of the GC-MS system into GC-MS/MS and coupling it with different mass spectrometers ensures the higher precision and accuracy of this technique with significantly lower LODs and LOQs.
Author Contributions
Conceptualization, S.D.Đ.; writing—original draft preparation, I.K., V.M.Đ., Y.A.S., N.B., A.E.S., A.V.V., K.S. and S.D.Đ.; writing—review and editing, I.K., V.M.Đ., Y.A.S., N.B., A.E.S., A.V.V., K.S. and S.D.Đ.; visualization, I.K. and A.E.S.; supervision, S.D.Đ. All authors have read and agreed to the published version of the manuscript.
Funding
The authors are grateful to the Ministry of Science, Technological Development and Innovation of the Republic of Serbia for its financial support of this study (contract no. 451-03-136/2025-03/200051, 451-03-136/2025-03/200168, and 451-03-136/2025-03/200288).
Acknowledgments
The authors are grateful to the Ministry of Science, Technological Development and Innovation of the Republic of Serbia for its financial support of this study (contract no. 451-03-136/2025-03/200051, 451-03-136/2025-03/200168, and 451-03-136/2025-03/200288). This article is related to the UN Sustainable Development Goal (SDG) numbers 4 and 17.
Conflicts of Interest
The authors declare no conflicts of interest.
References
- Brettell, T.A.; Lum, B.J. Analysis of Drugs of Abuse by Gas Chromatography–Mass Spectrometry (GC-MS). In Methods in Molecular Biology; Humana Press Inc.: Totowa, NJ, USA, 2018; Volume 1810, pp. 29–42. [Google Scholar]
- Negrusz, A.; Cooper, G. Clarke’s Analytical Forensic Toxicology; Pharmaceutical Press: London, UK, 2013. [Google Scholar]
- Levine, B.S.; Kerrigan, S. Principles of Forensic Toxicology; Levine, B.S., Kerrigan, S., Eds.; Springer International Publishing: Cham, Switzerland, 2020. [Google Scholar] [CrossRef]
- Smith, F.; Athanaselis, S. Handbook of Forensic Drug Analysis; Elsevier Academic Press: London, UK, 2005. [Google Scholar]
- Đurović, S.D.; Brkljača, N.; Srećkov, Z.; Mrkonjić, Z.; Panković, D. Development, Validation, and Verification of the Gas Chromatography-Mas Spectrometry Method for Detecting and Quantifying Major Cannabinoids in the Inflorescence of Cannabis sativa L. Talanta Open 2025, 11, 100455. [Google Scholar] [CrossRef]
- Toth, J.A.; Stack, G.M.; Cala, A.R.; Carlson, C.H.; Wilk, R.L.; Crawford, J.L.; Viands, D.R.; Philippe, G.; Smart, C.D.; Rose, J.K.C.; et al. Development and Validation of Genetic Markers for Sex and Cannabinoid Chemotype in Cannabis sativa L. GCB Bioenergy 2020, 12, 213–222. GCB Bioenergy 2020, 12, 213–222. [Google Scholar] [CrossRef]
- Cardenia, V.; Gallina Toschi, T.; Scappini, S.; Rubino, R.C.; Rodriguez-Estrada, M.T. Development and Validation of a Fast Gas Chromatography/Mass Spectrometry Method for the Determination of Cannabinoids in Cannabis sativa L. J. Food Drug Anal. 2018, 26, 1283–1292. [Google Scholar] [CrossRef]
- Campbell, B.J.; Berrada, A.F.; Hudalla, C.; Amaducci, S.; McKay, J.K. Genotype × Environment Interactions of Industrial Hemp Cultivars Highlight Diverse Responses to Environmental Factors. Agrosystems Geosci. Environ. 2019, 2, 1–11. [Google Scholar] [CrossRef]
- UNODC. Recommended Methods for the Identification and Analysis of Cannabis and Cannabis Products; United Nations Office on Drugs and Crime: New York, NY, USA, 2009. [Google Scholar]
- Citti, C.; Russo, F.; Sgrò, S.; Gallo, A.; Zanotto, A.; Forni, F.; Vandelli, M.A.; Laganà, A.; Montone, C.M.; Gigli, G.; et al. Pitfalls in the Analysis of Phytocannabinoids in Cannabis Inflorescence. Anal. Bioanal. Chem. 2020, 412, 4009–4022. [Google Scholar] [CrossRef] [PubMed]
- Capriotti, A.L.; Cannazza, G.; Catani, M.; Cavaliere, C.; Cavazzini, A.; Cerrato, A.; Citti, C.; Felletti, S.; Montone, C.M.; Piovesana, S.; et al. Recent Applications of Mass Spectrometry for the Characterization of Cannabis and Hemp Phytocannabinoids: From Targeted to Untargeted Analysis. J. Chromatogr. A 2021, 1655, 462492. [Google Scholar] [CrossRef] [PubMed]
- Strano-Rossi, S.; Bermejo, A.M.; De La Torre, X.; Botrè, F. Fast GC-MS Method for the Simultaneous Screening of THC-COOH, Cocaine, Opiates and Analogues Including Buprenorphine and Fentanyl, and Their Metabolites in Urine. Anal. Bioanal. Chem. 2011, 399, 1623–1630. [Google Scholar] [CrossRef]
- Gallardo, E.; Queiroz, J.A. The Role of Alternative Specimens in Toxicological Analysis. Biomed. Chromatogr. 2008, 22, 795–821. [Google Scholar] [CrossRef]
- Pragst, F.; Balikova, M.A. State of the Art in Hair Analysis for Detection of Drug and Alcohol Abuse. Clin. Chim. Acta 2006, 370, 17–49. [Google Scholar] [CrossRef]
- Kintz, P. Drug Testing in Addicts: A Comparison between Urine, Sweat, and Hair. Ther. Drug Monit. 1996, 18, 450–455. [Google Scholar] [CrossRef]
- Emídio, E.S.; de Menezes Prata, V.; Dórea, H.S. Validation of an Analytical Method for Analysis of Cannabinoids in Hair by Headspace Solid-Phase Microextraction and Gas Chromatography–Ion Trap Tandem Mass Spectrometry. Anal. Chim. Acta 2010, 670, 63–71. [Google Scholar] [CrossRef] [PubMed]
- Merola, G.; Gentili, S.; Tagliaro, F.; MacChia, T. Determination of Different Recreational Drugs in Hair by HS-SPME and GC/MS. Anal. Bioanal. Chem. 2010, 397, 2987–2995. [Google Scholar] [CrossRef] [PubMed]
- Lemos, N.P.; Anderson, R.A.; Robertson, J.R. Nail Analysis for Drugs of Abuse: Extraction and Determination of Cannabis in Fingernails by RIA and GC-MS. J. Anal. Toxicol. 1999, 23, 147–152. [Google Scholar] [CrossRef] [PubMed]
- Sharma, S.P.; Lahiri, S.C. Chemical Characterization and Quantitative Estimation of Narcotic Drugs in the Seized Illicit Samples by GC-MS and GC-FTIR, Identification of Source and Possibility of Isotopic Substitution. J. Indian. Chem. Soc. 2016, 93, 1299–1312. [Google Scholar]
- Sharma, S.P.; Purkait, B.C.; Lahiri, S.C. Qualitative and Quantitative Analysis of Seized Street Drug Samples and Identification of Source. Forensic Sci. Int. 2005, 152, 235–240. [Google Scholar] [CrossRef]
- Badria, F.A.; El-Neketi, M.; Saad, H.A. Forensic Analysis of a Confiscated Illicit Heroin Sample. Curr. Res. Bioorganic Org. Chem. 2018, 2018. [Google Scholar] [CrossRef]
- Askar, A.M.; Al Ali, A.Y.; Khalifa, M.K.; Salem, A.A.; Alkhuwaildi, B.M.; Shah, I. Rapid GC-MS Method for Screening Seized Drugs in Forensic Investigations: Optimization and Validation. Front. Chem. 2025, 13, 1559279. [Google Scholar] [CrossRef]
- Galynker, I.; Schlyer, D.J.; Dewey, S.L.; Fowler, J.S.; Logan, J.; Galley, S.J.; MacGregor, R.R.; Ferrieri, R.A.; Holland, M.J.; Brodie, J.; et al. Opioid Receptor Imaging and Displacement Studies with [6-O-[11C]Methyl]Buprenorphine in Baboon Brain. Nucl. Med. Biol. 1996, 23, 325–331. [Google Scholar] [CrossRef]
- Hsu, M.-C.; Chen, D.; Liu, R.H.; Hsu, M.-C.; Chen, D.; Liu, R.H. Detection of Abused Drugs in Urine by GC-MS. J. Food Drug Anal. 2020, 17, 6. [Google Scholar] [CrossRef]
- Wu, C.H.; Yang, S.C.; Wang, Y.S.; Chen, B.G.; Lin, C.C.; Liu, R.H. Evaluation of Various Derivatization Approaches for Gas Chromatography–Mass Spectrometry Analysis of Buprenorphine and Norbuprenorphine. J. Chromatogr. A 2008, 1182, 93–112. [Google Scholar] [CrossRef]
- Chen, B.G.; Wang, S.M.; Liu, R.H. GC-MS Analysis of Multiply Derivatized Opioids in Urine. J. Mass Spectrom. 2007, 42, 1012–1023. [Google Scholar] [CrossRef]
- Zhang, X.; Chen, M.; Cao, G.; Hu, G. Determination of Morphine and Codeine in Human Urine by Gas Chromatography-Mass Spectrometry. J. Anal. Methods Chem. 2013, 2013, 151934. [Google Scholar] [CrossRef] [PubMed]
- Santhosh, S.; Sampath, S.; Gupta, A.; Kumar, A.; Santhosh, S.; Sampath, S.; Gupta, A.; Kumar, A. Simultaneous Analysis of Ten Drugs of Abuse in Blood and Urine Matrix by Gas Chromatography–Mass Spectrometry: Implications for Air Crash Investigation. Indian J. Aerosp. Med. 2020, 63, 65–70. [Google Scholar] [CrossRef]
- Orfanidis, A.; Krokos, A.; Mastrogianni, O.; Gika, H.; Raikos, N.; Theodoridis, G. Development and Validation of a Single Step GC/MS Method for the Determination of 41 Drugs and Drugs of Abuse in Postmortem Blood. Forensic Sci. 2022, 2, 473–491. [Google Scholar] [CrossRef]
- Yasien, S.; Ali, E.; Javed, M.; Iqbal, M.M.; Iqbal, S.; Alrbyawi, H.; Aljazzar, S.O.; Elkaeed, E.B.; Dera, A.A.; Pashameah, R.A.; et al. Simultaneous Quantification of Opioids in Blood and Urine by Gas Chromatography-Mass Spectrometer with Modified Dispersive Solid-Phase Extraction Technique. Molecules 2022, 27, 6761. [Google Scholar] [CrossRef] [PubMed]
- Salem, M.Y.; Ross, S.A.; Murphy, T.P.; ElSohly, M.A. GC-MS Determination of Heroin Metabolites in Meconium: Evaluation of Four Solid-Phase Cartridges. J. Anal. Toxicol. 2001, 25, 93–98. [Google Scholar] [CrossRef] [PubMed]
- Azlina Awang, N.; Lee, K.; Koon Teoh, W.; Kunalan, V.; Fahmi Lim Abdullah, A.; Haw Chang, K. Physical And Chemical Discrimination Of Methamphetamine Tablets For Forensic Intelligence (Diskriminasi Fizikal Dan Kimia Bagi Pil Metamfetamin Untuk Perisikan Forensik). Malays. J. Anal. Sci. 2022, 26, 130–151. [Google Scholar]
- Czyż, A.; Pawlak, K.; Waraksa, E.; Bieńkowski, T. Comprehensive Profiling of Illicit Amphetamines Seized in Poland: Insights from Gas Chromatography–Mass Spectrometry and Chemometric Analysis. Molecules 2025, 30, 579. [Google Scholar] [CrossRef]
- UNODC. Recommended Methods for the Identification and Analysis of Amphetamine, Methamphetamine and Their Ring-Substituted Analogues in Seized Materials; UNODC: New York, NY, USA, 2006. [Google Scholar]
- Al-Salman, H.N.K.; Jasim, E.Q. Analytical Methods for Diagnosis a Mixture of Narcotic Substances in Seized Materials. Int. J. Green Pharm. (IJGP) 2018, 12, 216. [Google Scholar] [CrossRef]
- Frinculescu, A.; Shine, T.; Ramsey, J.; Couchman, L.; Frascione, N.; Abbate, V. Analysis of Drugs Seized from Amnesty Bins at Two Major United Kingdom Summer Music Festivals Using Two Portable Gas Chromatography-Mass Spectrometry (GC–MS) Instruments. Drug Test. Anal. 2024, 16, 1241–1253. [Google Scholar] [CrossRef]
- Tseng, Y.L.; Lin, C.T.; Wang, S.M.; Liu, R.H. Famprofazone as the Source of Methamphetamine and Amphetamine in Urine Specimen Collected during Sport Competition. J. Forensic Sci. 2007, 52, 479–486. [Google Scholar] [CrossRef] [PubMed]
- Wang, S.M.; Lin, C.C.; Li, T.L.; Shih, C.Y.; Giang, Y.S.; Liu, R.H. Distribution Characteristics of Methamphetamine and Amphetamine in Urine and Hair Specimens Collected from Alleged Methamphetamine Users in Northern Taiwan. Anal. Chim. Acta 2006, 576, 140–146. [Google Scholar] [CrossRef] [PubMed]
- Huei, R.L.; Lua, A.C. Simultaneous Determination of Amphetamines and Ketamines in Urine by Gas Chromatography/Mass Spectrometry. Rapid Commun. Mass Spectrom. 2006, 20, 1724–1730. [Google Scholar] [CrossRef]
- Lin, D.L.; Chang, W.T.; Kuo, T.L.; Liu, R.H. Chemical Derivatization and the Selection of Deuterated Internal Standard for Quantitative Determination—Methamphetamine Example. J. Anal. Toxicol. 2000, 24, 275–280. [Google Scholar] [CrossRef]
- Tzing, S.H.; Ghule, A.; Liu, J.Y.; Ling, Y.C. On-Line Derivatization Gas Chromatography with Furan Chemical Ionization Tandem Mass Spectrometry for Screening of Amphetamines in Urine. J. Chromatogr. A 2006, 1137, 76–83. [Google Scholar] [CrossRef]
- Wang, S.M. Enantiomeric Determination of Amphetamines: Exploring a Novel One-Step Solid-Phase Microextraction-Based Approach. J. Chromatogr. B 2005, 825, 79–87. [Google Scholar] [CrossRef]
- Wang, S.M.; Giang, Y.S.; Ling, Y.C. Simultaneous Supercritical Fluid Extraction and Chemical Derivatization for the Gas Chromatographic–Isotope Dilution Mass Spectrometric Determination of Amphetamine and Methamphetamine in Urine. J. Chromatogr. B Biomed. Sci. Appl. 2001, 759, 17–26. [Google Scholar] [CrossRef]
- Lin, D.L.; Yin, R.M.; Liu, R.H. Gas Chromatography-Mass Spectrometry (GC-MS) Analysis of Amphetamine, Methamphetamine, 3,4-Methylenedioxy-Amphetamine and 3,4-Methylenedioxymethamphetamine in Human Hair and Hair Sections. J. Food Drug Anal. 2005, 13, 193–200. [Google Scholar] [CrossRef]
- Denia, A.; Esteve-Turrillas, F.A.; Armenta, S. Analysis of Drugs Including Illicit and New Psychoactive Substances in Oral Fluids by Gas Chromatography-Drift Tube Ion Mobility Spectrometry. Talanta 2022, 238, 122966. [Google Scholar] [CrossRef]
- Office of Chief Medical Examiner City of New York. Cocaine, Ethylbenzoylecgonine, Benzoylecgonine, Codeine, 6-Mam and Morphine by Solid Phase Extraction and Gas Chro-Matography/Mass Spectrometry (Selective Ion Monitoring) Principle. New York. 2015. Available online: https://www.nyc.gov/assets/ocme/downloads/pdf/GCMS%20-%20I%20-%20Opiates%20and%20BE%20by%20GCMS%20SIM.pdf (accessed on 22 May 2025.).
- Wang, S.M.; Wu, M.Y.; Liu, R.H.; Lewis, R.J.; Canfield, D.V. Evaluation of Isotopically Labeled Internal Standards and Methods of Derivatization for Quantitative Determination of Cocaine and Related Compounds. Forensic Toxicol. 2006, 24, 23–35. [Google Scholar] [CrossRef]
- Hofmann, A.; Heim, R.; Brack, A.; Kobel, H.; Frey, A.; Ott, H.; Petrzilka, T.; Troxler, F. Psilocybin Und Psilocin, Zwei Psychotrope Wirkstoffe Aus Mexikanischen Rauschpilzen. Helv. Chim. Acta 1959, 42, 1557–1572. [Google Scholar] [CrossRef]
- Zhou, L.; Xiang, P.; Wen, D.; Shen, B.; Wang, X.; Li, L.; Deng, H.; Chen, H.; Yan, H.; Shen, M.; et al. Sensitive Quantitative Analysis of Psilocin and Psilocybin in Hair Samples from Suspected Users and Their Distribution in Seized Hallucinogenic Mushrooms. Forensic Toxicol. 2021, 39, 464–473. [Google Scholar] [CrossRef]
- Saito, K.; Toyo’oka, T.; Fukushima, T.; Kato, M.; Shirota, O.; Goda, Y. Determination of Psilocin in Magic Mushrooms and Rat Plasma by Liquid Chromatography with Fluorimetry and Electrospray Ionization Mass Spectrometry. Anal. Chim. Acta 2004, 527, 149–156. [Google Scholar] [CrossRef]
- Keller, T.; Schneider, A.; Regenscheit, P.; Dirnhofer, R.; Rücker, T.; Jaspers, J.; Kisser, W. Analysis of Psilocybin and Psilocin in Psilocybe Subcubensis GUZMÁN by Ion Mobility Spectrometry and Gas Chromatography–Mass Spectrometry. Forensic Sci. Int. 1999, 99, 93–105. [Google Scholar] [CrossRef] [PubMed]
- Sticht, G.; Käferstein, H. Detection of Psilocin in Body Fluids. Forensic Sci. Int. 2000, 113, 403–407. [Google Scholar] [CrossRef]
- Grieshaber, A.; Moore, K.; Levine, B. The Detection of Psilocin in Human Urine. J. Forensic Sci. 1972-2005 2001, 46, 627–630. [Google Scholar] [CrossRef]
- White, P.F.; Way, W.L.; Trevor, A.J. Ketamine—Its Pharmacology and Therapeutic Uses. Anesthesiology 1982, 56, 119–136. [Google Scholar] [CrossRef]
- Jansen, K.L.R. A Review of the Nonmedical Use of Ketamine: Use, Users and Consequences. J. Psychoact. Drugs 2000, 32, 419–433. [Google Scholar] [CrossRef]
- Clements, J.A.; Nimmo, W.S. Pharmacokinetics and Analgesic Effect Of Ketamine in Man. Br. J. Anaesth. 1981, 53, 27–30. [Google Scholar] [CrossRef]
- Wu, C.H.; Huang, M.H.; Wang, S.M.; Lin, C.C.; Liu, R.H. Gas Chromatography-Mass Spectrometry Analysis of Ketamine and Its Metabolites-A Comparative Study on the Utilization of Different Derivatization Groups. J. Chromatogr. A 2007, 1157, 336–351. [Google Scholar] [CrossRef]
- Chou, S.L.; Yang, M.H.; Ling, Y.C.; Giang, Y.S. Gas Chromatography-Isotope Dilution Mass Spectrometry Preceded by Liquid-Liquid Extraction and Chemical Derivatization for the Determination of Ketamine and Norketamine in Urine. J. Chromatogr. B Anal. Technol. Biomed. Life Sci. 2004, 799, 37–50. [Google Scholar] [CrossRef]
- Lin, H.-R.; Lua, A.-C. A Fast GC-MS Screening Procedure for Ketamine and Its Metabolites in Urine Samples. J. Food Drug Anal. 2005, 13, 107–111. [Google Scholar] [CrossRef]
- Lin, H.R.; Lua, A.C. Detection of Acid-Labile Conjugates of Ketamine and Its Metabolites in Urine Samples Collected from Pub Participants. J. Anal. Toxicol. 2004, 28, 181–186. [Google Scholar] [CrossRef] [PubMed]
- Cheng, P.S.; Lee, C.H.; Liu, C.; Chien, C.S. Simultaneous Determination of Ketamine, Tramadol, Methadone, and Their Metabolites in Urine by Gas Chromatography-Mass Spectrometry. J. Anal. Toxicol. 2008, 32, 253–259. [Google Scholar] [CrossRef] [PubMed]
- Cheng, P.S.; Fu, C.Y.; Lee, C.H.; Liu, C.; Chien, C.S. GC–MS Quantification of Ketamine, Norketamine, and Dehydronorketamine in Urine Specimens and Comparative Study Using ELISA as the Preliminary Test Methodology. J. Chromatogr. B 2007, 852, 443–449. [Google Scholar] [CrossRef]
- Gambelunghe, C.; Marsili, R.; Aroni, K.; Bacci, M.; Rossi, R. GC-MS and GC-MS/MS in PCI Mode Determination of Mescaline in Peyote Tea and in Biological Matrices. J. Forensic Sci. 2013, 58, 270–278. [Google Scholar] [CrossRef]
- Halpern, J.H. Hallucinogens and Dissociative Agents Naturally Growing in the United States. Pharmacol. Ther. 2004, 102, 131–138. [Google Scholar] [CrossRef]
- Halpern, J.H.; Sherwood, A.R.; Hudson, J.I.; Yurgelun-Todd, D.; Pope, H.G. Psychological and Cognitive Effects of Long-Term Peyote Use among Native Americans. Biol. Psychiatry 2005, 58, 624–631. [Google Scholar] [CrossRef]
- Beyer, J.; Drummer, O.H.; Maurer, H.H. Analysis of Toxic Alkaloids in Body Samples. Forensic Sci. Int. 2009, 185, 1–9. [Google Scholar] [CrossRef]
- Henry, J.L.; Epley, J.; Rohrig, T.P. The Analysis and Distribution of Mescaline in Postmortem Tissues. J. Anal. Toxicol. 2003, 27, 381–382. [Google Scholar] [CrossRef]
- Ferguson, A.M.; Garg, U. Quantitation of Phencyclidine (PCP) in Urine and Blood Using Gas Chromatography-Mass Spectrometry (GC-MS). In Clinical Applications of Mass Spectrometry. Methods in Molecular Biology; Garg, U., Hammett-Stabler, C., Eds.; Humana Press: Totowa, NJ, USA, 2010; Volume 603, pp. 461–467. ISBN 978-1-60761-459-3. [Google Scholar]
- Elsohly, M.A.; Little, T.L.; Mitchell, J.M.; Paul, B.D.; Mell, L.D.; Irving, J. GC/MS Analysis of Phencyclidine Acid Metabolite in Human Urine. J. Anal. Toxicol. 1988, 12, 180–182. [Google Scholar] [CrossRef] [PubMed]
- Musshoff, F.; Daldrup, T. Gas Chromatographic/Mass Spectrometric Determination of Lysergic Acid Diethylamide (LSD) in Serum Samples. Forensic Sci. Int. 1997, 88, 133–140. [Google Scholar] [CrossRef] [PubMed]
- Axelrod, J.; Brady, R.O.; Witkop, B.; Evarts, E.V. The Distribution and Metabolism of Lysergic Acid Diethylamide. Ann. N. Y Acad. Sci. 1957, 66, 435–444. [Google Scholar] [CrossRef] [PubMed]
- Schneider, S.; Kuffer, P.; Wennig, R. Determination of Lysergide (LSD) and Phencyclidine in Biosamples. J. Chromatogr. B Biomed. Sci. Appl. 1998, 713, 189–200. [Google Scholar] [CrossRef]
- Paul, B.D.; Mitchell, J.M.; Burbage, R.; Moy, M.; Sroka, R. Gas Chromatographic-Electron-Impact Mass Fragmentometric Determination of Lysergic Acid Diethylamide in Urine. J. Chromatogr. B Biomed. Sci. Appl. 1990, 529, 103–112. [Google Scholar] [CrossRef]
- Roth, R.H.; Giarman, N.J. Natural Occurrence of Gamma-Hydroxybutyrate in Mammalian Brain. Biochem. Pharmacol. 1970, 19, 1087–1093. [Google Scholar] [CrossRef]
- Carai, M.A.M.; Colombo, G.; Brunetti, G.; Melis, S.; Serra, S.; Vacca, G.; Mastinu, S.; Pistuddi, A.M.; Solinas, C.; Cignarella, G.; et al. Role of GABAB Receptors in the Sedative/Hypnotic Effect of γ-Hydroxybutyric Acid. Eur. J. Pharmacol. 2001, 428, 315–321. [Google Scholar] [CrossRef]
- Lingenhoehl, K.; Brom, R.; Heid, J.; Beck, P.; Froestl, W.; Kaupmann, K.; Bettler, B.; Mosbacher, J. γ-Hydroxybutyrate Is a Weak Agonist at Recombinant GABA(B) Receptors. Neuropharmacology 1999, 38, 1667–1673. [Google Scholar] [CrossRef]
- McCusker, R.R.; Paget-Wilkes, H.; Chronister, C.W.; Goldberger, B.A.; Elsohly, M.A. Analysis of Gamma-Hydroxybutyrate (GHB) in Urine by Gas Chromatography- Mass Spectrometry. J. Anal. Toxicol. 1999, 23, 301–305. [Google Scholar] [CrossRef]
- Bodson, Q.; Denooz, R.; Serpe, P.; Charlier, C. Gamma-Hydroxybutyric Acid (GHB) Measurement by GC-MS in Blood, Urine and Gastric Contents, Following an Acute Intoxication in Belgium. Acta Clin. Belg. 2008, 63, 200–208. [Google Scholar] [CrossRef]
- Elian, A.A. GC–MS Determination of Gamma-Hydroxybutyric Acid (GHB) in Blood. Forensic Sci. Int. 2001, 122, 43–47. [Google Scholar] [CrossRef] [PubMed]
- Goldberger, B.A.; Chronister, C.W.; Merves, M.L. Quantitation of Benzodiazepines in Blood and Urine Using Gas Chromatography-Mass Spectrometry (GC-MS). In Clinical Applications of Mass Spectrometry. Methods in Molecular Biology; Garg, U., Hammett-Stabler, C., Eds.; Humana Press: Totowa, NJ, USA, 2010; Volume 603, pp. 75–87. ISBN 978-1-60761-459-3. [Google Scholar]
- Drummer, O.H. Benzodiazepines—Effects on Human Performance and Behavior. Forensic Sci. Rev. 2002, 14, 1–14. [Google Scholar] [PubMed]
- Gunnar, T.; Ariniemi, K.; Lillsunde, P. Determination of 14 Benzodiazepines and Hydroxy Metabolites, Zaleplon and Zolpidem as Tert-Butyldimethylsilyl Derivatives Compared with Other Common Silylating Reagents in Whole Blood by Gas Chromatography–Mass Spectrometry. J. Chromatogr. B 2005, 818, 175–189. [Google Scholar] [CrossRef] [PubMed]
- Drummer, O.H. Methods for the Measurement of Benzodiazepines in Biological Samples. J. Chromatogr. B Biomed. Sci. Appl. 1998, 713, 201–225. [Google Scholar] [CrossRef]
- Tiscione, N.B.; Shan, X.; Alford, I.; Yeatman, D.T. Quantitation of Benzodiazepines in Whole Blood by Electron Impact-Gas Chromatography-Mass Spectrometry. J. Anal. Toxicol. 2008, 32, 644–652. [Google Scholar] [CrossRef]
- Papoutsis, I.I.; Athanaselis, S.A.; Nikolaou, P.D.; Pistos, C.M.; Spiliopoulou, C.A.; Maravelias, C.P. Development and Validation of an EI–GC–MS Method for the Determination of Benzodiazepine Drugs and Their Metabolites in Blood: Applications in Clinical and Forensic Toxicology. J. Pharm. Biomed. Anal. 2010, 52, 609–614. [Google Scholar] [CrossRef]
- Yegles, M.; Mersch, F.; Wennig, R. Detection of Benzodiazepines and Other Psychotropic Drugs in Human Hair by GC/MS. Forensic Sci. Int. 1997, 84, 211–218. [Google Scholar] [CrossRef]
- Acikkol, M.; Mercan, S.; Karadayi, S. Simultaneous Determination of Benzodiazepines and Ketamine from Alcoholic and Nonalcoholic Beverages by GC-MS in Drug Facilitated Crimes. Chromatographia 2009, 70, 1295–1298. [Google Scholar] [CrossRef]
Disclaimer/Publisher’s Note: The statements, opinions and data contained in all publications are solely those of the individual author(s) and contributor(s) and not of MDPI and/or the editor(s). MDPI and/or the editor(s) disclaim responsibility for any injury to people or property resulting from any ideas, methods, instructions or products referred to in the content. |
© 2025 by the authors. Licensee MDPI, Basel, Switzerland. This article is an open access article distributed under the terms and conditions of the Creative Commons Attribution (CC BY) license (https://creativecommons.org/licenses/by/4.0/).

