Article

SiO2-Al2O3-ZrO2-Ag Composite and Its Signal Enhancement Capacity on Raman Spectroscopy

by
Jesús Alberto Garibay-Alvarado
1,
Pedro Pizá-Ruiz
2,
Armando Erasto Zaragoza-Contreras
2,
Francisco Espinosa-Magaña
2 and
Simón Yobanny Reyes-López
1,*
1
Laboratorio de Materiales Híbridos Nanoestructurados, Departamento de Ciencias Químico Biológicas, Instituto de Ciencias Biomédicas, Universidad Autónoma de Ciudad Juárez, Av. Benjamin Franklin 4651, Juárez 32310, Mexico
2
Centro de Investigación en Materiales Avanzados, SC. Av. Miguel de Cervantes 120 Complejo Industrial Chihuahua, Chihuahua 31136, Mexico
*
Author to whom correspondence should be addressed.
Chemosensors 2025, 13(7), 266; https://doi.org/10.3390/chemosensors13070266
Submission received: 12 June 2025 / Revised: 11 July 2025 / Accepted: 14 July 2025 / Published: 21 July 2025
(This article belongs to the Special Issue Spectroscopic Techniques for Chemical Analysis)

Abstract

A ceramic–metal composite was synthesized using sol–gel and electrospinning methods to serve as a SERS substrate. The precursors used were tetraethyl orthosilicate, aluminum nitrate, and zirconium, and polyvinylpyrrolidone was added to electrospun nonwoven fibrous membranes. The membranes were sintered, decorated with silver nanoparticles. The enhancement substrates were made of fibers of cylindric morphology with an average diameter of approximately 190 nm, a smooth surface, and 9 nm spherical particles decorating the surface of the fibers. The enhancement capacity of the substrates was tested using pyridine, methyl orange, methylene blue, crystal violet, and Eriochrome black T at different concentrations with Raman spectroscopy to determine whether the size and complexity of the analyte has an impact on the enhancement capacity. Enhancement factors of 2.53 × 10², 3.06 × 101, 2.97 × 10³, 4.66 × 10³, and 1.45 × 10³ times were obtained for the signal of pyridine, methyl orange, methylene blue, crystal violet, and Eriochrome black T at concentrations of 1 nM.

Graphical Abstract

1. Introduction

Surface-Enhanced Raman Spectroscopy (SERS) has emerged as a transformative analytical technique, offering unparalleled sensitivity for probing the molecular realm. Unlike conventional Raman spectroscopy, which relies on the weak scattering of light by molecules, SERS leverages a phenomenon known as plasmon resonance to significantly amplify these signals. This amplification arises from the collective oscillation of electrons within metallic nanoparticles, essentially acting as miniature antennae to dramatically boost the feeble Raman signal emanating from nearby molecules. However, achieving this remarkable enhancement hinges on a critical factor: the proximity of the target molecules to the metal surface, typically within a mere 10 nanometers. This requirement presents a significant challenge for practical applications, necessitating the development of ingenious strategies to ensure efficient adsorption of the molecules onto the metal surface, thereby maximizing the SERS effect [1].
The cornerstone of SERS lies in metallic nanostructures, the tiny architects responsible for generating signal enhancement. These nanostructures come in a wide variety of shapes and sizes, ranging from freely dispersed metallic colloids in solution to meticulously crafted nanoparticles and intricately designed substrates fabricated using advanced techniques such as nanolithography or self-assembly [2]. Each type of nanostructure boasts unique advantages and caters to specific applications. A crucial aspect of SERS is the magnitude of the signal enhancement, quantified by the enhancement factor (EF). A high EF translates to a significantly stronger Raman signal, enabling researchers to detect minute traces of molecules with exceptional sensitivity. This enhanced sensitivity is not only invaluable for practical applications but also plays a vital role in elucidating the underlying physical mechanisms of SERS, ultimately allowing for the refinement and optimization of this powerful technique [3].
The key ingredient behind SERS is the phenomenon of plasmon resonance. When light interacts with metallic nanoparticles smaller than the wavelength of light, these nanoparticles absorb the light and induce a collective oscillation of electrons. This synchronized movement of electrons creates a strong localized electric field around the nanoparticle. This enhanced electric field acts as a magnifying glass, significantly amplifying the weak Raman signal generated by nearby molecules. It is paramount to remember that plasmon resonance is the cornerstone of SERS. Without this crucial interaction between light and metal, the observed Raman scattering cannot be classified as SERS. It is the presence of this localized electric field enhancement that differentiates SERS from traditional Raman spectroscopy. To maximize the plasmon resonance effect and achieve optimal SERS performance, scientists typically employ enhancement substrates. These substrates are often constructed from a dielectric material, a non-conducting material that serves as a base, and coated with a layer of nanostructured metal. This combination allows for a synergistic effect the dielectric material provides a platform for the metal nanoparticles while potentially influencing the interaction with the target molecules, and the metal layer generates the plasmonic enhancement. When it comes to the choice of metal, noble metals like silver, gold, and copper are typically preferred due to their well-defined plasmon resonance properties. In the realm of nanostructures, nanoparticles and nanoparticle arrays are popular choices due to their ability to generate strong localized electromagnetic fields at the nanoscale, precisely where the target molecules reside. Recent advancements in SERS research have focused on harnessing the power of nanogaps, the tiny spaces between neighboring nanoparticles. These gaps have been shown to offer several advantages, including the ability to precisely control the position of adsorbed molecules, leading to a more uniform enhancement effect. Additionally, nanogaps can significantly increase the enhancement factor, improve signal stability, and enhance the overall reproducibility of SERS measurements [3,4].
While plasmon resonance remains the dominant mechanism in SERS, researchers are actively exploring alternative pathways for achieving signal enhancement. One such mechanism involves charge transfer between the target molecule and the metal surface or the underlying substrate. This charge transfer can further amplify the Raman signal, opening doors for the development of novel SERS materials beyond traditional plasmonic metals. This exploration has led to the investigation of promising materials like MgAl2O4, a compound with a spinel structure, and ZrO2, a semiconductor material [4]. These materials exhibit properties that can contribute to SERS enhancement through mechanisms beyond just plasmon resonance. Understanding and harnessing these alternative mechanisms paves the way for the development of even more powerful and versatile SERS substrates in the future [5,6,7]. Mullite has is known for its great mechanical strength, excellent thermal properties, as well as its resistance to corrosion [8]. Mullite has been used in the fabrication SERS substrates as a nanostructure array, and nanoparticles, where mullite works as a dielectric base [9]. As a ceramic, mullite not only is a non-conductive material, but it can also be used in capacitors [10]. The dielectric constant of mullite is approximately 6, which allows for significant energy storage, and the dielectric loss is between 0.009 and 0.003, which makes it a low energy dissipation material [11]. Zirconia has great mechanical strength, chemical inertness, and photocatalytic activity, and it has been used in the production of Raman probes and substrates [12]. Zirconia possesses low phonon energy and a high host absorption coefficient, making it useful for the addition of metal nanoparticles [13]. Mullite and zirconia have high adsorption capacity, increasing the availability of the analytes on the substrates. Both ceramics can greatly scatter light due to the formation of grain boundaries when sintered, and have a high refraction index, characteristics that could enhance plasmonic materials [14].
By unveiling the intricate interplay between light, metal nanostructures, and molecules, SERS offers a powerful window into the molecular world [15,16,17,18,19]. With continuous advancements in nanofabrication techniques, exploration of novel materials, and a deeper understanding of the underlying mechanisms, SERS promises to revolutionize various fields, from biomedical diagnostics and disease detection to material science and environmental monitoring [18,19,20,21]. In this article the results of Raman signal enhancement using the SiO2-Al2O3-ZrO2-Ag substrate are presented. The substrates were fabricated using the technique published on previous reports, where ceramic precursors were obtained by the sol–gel method and processed through electrospinning to form a ceramic nanofiber mat decorated with silver nanoparticles (AgNps) for SEIRAS [22]. The Raman enhancement capability of the substrate was evaluated using five different compounds: pyridine, methyl orange, methylene blue, crystal violet, and Eriochrome black T in a range of concentrations.

2. Experimental Section

2.1. Materials

Tetraethyl orthosilicate (99.0%, Sigma-Aldrich© USA, St. Louis, MO, USA), Al(NO3)3⋅9H2O (99.9%, Meyer© USA, Alameda, CA, USA), zirconium (IV) butoxide (99.0%, Sigma-Aldrich© USA), polyvinyl pyrrolidone (M.W. 1,300,000, Alfa Aesar© USA, Ward Hill, MA, USA), ethanol absolute (99.9%, Sigma-Aldrich© USA), silver nitrate (99%, Sigma-Aldrich© USA), and gallic acid (97.5−102.5% (titration), Sigma-Aldrich© USA).

2.2. Synthesis of Ceramic Membranes

The material was prepared using a modified version of the method by Garibay-Alvarado et al., previously published for use in surface-enhanced infrared spectroscopy (SEIRAS) [22]. The substrate precursor solution was prepared using TEOS (tetraethyl orthosilicate), Al(NO3)3·9H2O, and zirconium (IV) butoxide in a molar ratio of 3.5:1:0.4, respectively, dissolved in ethanol. The precursor solution was sonicated at a power of 24 W for 30 min to promote hydrolysis. The resulting gel was mixed at 40% v/v with a 5% polyvinylpyrrolidone (PVP) solution in ethanol. The gels were electrospun onto a collector. The parameters used for electrospinning included a positive potential of 9 kV, a negative potential of −13 kV, and 18 cm between the origin of the precursor solution and the collector. The resulting membranes were dried at 100 °C and sintered at 1500 °C. To determine the average diameter of the fibers, the diameter of 500 fibers was measured using the Fiji application on five different micrographs of the fibers at ×10.0 k.
The silver nanoparticles were synthesized using chemical reduction, in which silver nitrate used as a metal precursor, gallic acid as a reducing agent, and sodium hydroxide as a stabilizing agent. The silver nitrate aqueous solution with a concentration of 10 mM was stirred vigorously, to which the aqueous reducing agent solution was added, and a sodium hydroxide (1 M) solution was immediately added dropwise until a pH of 11 was achieved. The particle size and distribution were calculated by dynamic light scattering (DLS) in a Nanoparticle Analyzer SZ-100 (Horiba, Irvine, CA, USA).
The fibers were submerged in a 10 mM silver nanoparticle (AgNP) solution, allowed to settle until saturation, then washed with water and ethanol, and subsequently dried at 100 °C. Four treatments were applied to decorate the fibers: once, twice, and three times consecutively to increase the density of deposited nanoparticles. In the final treatment, the fibers were decorated four times consecutively without washing to remove the excess AgNP solution. Finally, a heat treatment at 500 °C for 2 h was applied to eliminate organic components from the material.

2.3. Characterization

Pyridine in concentrations of 1 × 10⁻³, 1 × 10⁻⁶, and 1 × 10⁻⁹ was used to test the substrates qualitatively using 5 types, ceramic only, and decorated 1, 2, 3, and 4 times. The substrate with the highest enhancement factor was selected to carry out an amplification test. The amplification tests were performed with concentrations ranging from 1 × 10⁻² to 1 × 10⁻¹¹ of pyridine (Py), methyl orange (MO), methylene blue (MB), crystal violet (CV), and Eriochrome black T (EB). For the amplification test, 20 μL of each compound solution were deposited on the substrates, and they were left to dry under a 40 W incandescent lamp to later be analyzed under the Raman microscope (commercially available Horiba LabRam HR VIS-633). The analysis was carried out in a wavelength range from 400 to 2000 cm−1. The excitation source used in the present experiments was a red 632 nm HeNe laser at 50% power. An objective lens with 10× magnification and NA = 0.7 numerical aperture was used throughout the Raman experiments to focus the laser beam on the free surface of the sample, as well as to successively collect the scattered Raman light. Ten successive (cumulative) 0.5 s acquisitions were made in three areas of the substrate. The spectra obtained were processed using the Fytik software package (version 1.54p) for spectra deconvolution and the bands located at 1021, 1118, 1174, and 449 cm−1 were selected to calculate the amplification factor for Py, MO, MB, and CV, respectively, measuring the area under the curve of the band and calculating the enhancement factor (EF) using Equation (1). GraphPad © Prism™ software (version 9) was used for spectra graphing and comparison of results.
E F = I S E R S I S o l N S o l N S E R S .
where I is the intensity of a band of the infrared spectrum of the solution ( I S o l ) or of the SERS spectrum ( I S E R S ), and N is the adsorbate concentration in the solution ( N S o l ) or in the substrate ( I S E R S ).
To determine if there were differences between the means of the enhancement factor for the different analytes, a one-way ANOVA was conducted, followed by the Tukey test to determine which of the enhancement factor means were different with 95% confidence. Linear regression was carried out to determine if there was a linear relationship between the concentration of the analyte and the enhancement factor. The statistical analysis was performed using Graphad © Prism™ software (version 9).

3. Results and Discussion

According to the FT-IR spectrum of the fibers (Figure 1), the bands corresponding to a broad shoulder after approximately 3396 cm−1 correspond to hydroxyl groups originating from the stretching vibration of the structural water in the hydroxyl group (O-H). An asymmetric stretching (CH2) of the pyrrole ring is observed at 2950 cm−1, methyl groups (CH3) at 2900 cm−1, a band at approximately 1385 cm−1 due to the stretching vibrations of NO3, a carbonyl (C=O) stretching vibration at 1690 cm−1, and C-N bonds at 1290 cm−1 corresponding to the polymer (PVP) used as a carrier for electrospinning. A band at approximately 1200 cm−1 corresponds to the stretching vibrations of the t-butyl group. A band at approximately 660 cm−1 is attributed to Al-O stretching in AlO6, and a band at approximately 800 cm−1 corresponds to Al-O bond vibrations.
After sintering at various temperatures, the bands corresponding to the polymer gradually disappear. The bands associated with the ceramic precursors also disappear, and at 600 °C, only two shoulders can be seen: one between 400 and 1000 cm−1, corresponding to Al-O bonds, and another between 3000 and 3800 cm−1, corresponding to hydroxyl groups. From that point on, the material transitions to mullite as the temperature increases. A broad shoulder between 810 and 473 cm−1 is assigned to Si-O-Si stretching and Si-O-Si bending, respectively. A small shoulder between the bands at 1112 cm−1 and 1124 cm−1 is due to siloxane vibrations of (SiO)n groups and the bending vibration of hydroxyl groups attached to zirconium oxide, respectively. Spectroscopic bands appear at approximately 640, 556, and 470 cm−1, which are identified as the characteristic absorption bands of α-Al2O3.
An X-ray diffraction analysis of the composites sintered at different temperatures showed that crystallinity progressively increases. Figure 2a presents the diffractogram of the composite at 400 °C, which appears amorphous. The analysis using the Profex refinement software package 5.5.1 indicates that the material is undergoing a transitional phase with the incipient formation of mullite. Peaks emerging at approximately 12°, 22°, 32°, 43°, 47°, and 54° align with the diffraction pattern of cristobalite (JCPDS 39-1425), a crystalline polymorph of silica. However, the pattern mainly corresponds to amorphous silica.
Due to the amorphous nature of the material at this stage and the noise observed in the diffraction pattern, it is not possible to determine whether some of the peaks correspond to the monoclinic and tetragonal phases of zirconia. However, it is expected that these two phases begin to appear at approximately 800 °C for the monoclinic phase and 1100 °C for the tetragonal phase. Additionally, due to the use of the sol–gel technique, these temperatures may decrease by about one-third from their original formation range, which is from 500 to 1170 °C for the monoclinic phase and from 1170 to 2200 °C for the tetragonal phase.
After sintering at 800 °C (Figure 2b), planes corresponding to monoclinic zirconia (JCPDS 81-1314) and tetragonal zirconia (JCPDS 81-1314) are observed. The former fully forms at approximately 1100 °C, while the latter is less evident but begins to form. Additionally, planes corresponding to mullite 3/2 (3Al2O3 2SiO2) (JCPDS 15-0776) start to appear, along with noise due to the amorphous nature of the material.
The XRD pattern of the ceramic fibers sintered at 1500 °C in Figure 2c shows four distinct crystalline phases related to mullite 3/2, and monoclinic and tetragonal zirconia, respectively. The strongest peaks for mullite indicate planes at 60.7° (331), 40.9° (121), 35.0° (111), 26.2° (210), 25.9° (120), and 16.4° (110). For zirconia, the planes located at 50.0° (220), 31.4° (111), and 28.2° (11-1) correspond to the monoclinic phase, while for the tetragonal phase, the planes are at 60.1° (211), 50.6° (200), 50.1° (112), 35.2° (110), and 30.1° (101). Finally, there is a sharp and intense peak at 21.7° corresponding to the (101) plane of cristobalite. This mixture of monoclinic and tetragonal zirconia phases indicates the end of the phase transition during thermal treatment, which occurs between 1150 °C and below 2000 °C. Since the sintering was performed at 1500 °C, the tetragonal phase is predominant.
Figure 3 shows the ceramic SiO2-Al2O3-ZrO2 fibers, with a cylindric morphology and randomly oriented. The surface of the fibers appears homogeneous and is covered in AgNps. Some areas on the fibers show agglomeration of the AgNps, but overall, the particles are distributed regularly. The diameter of the fibers was measured as 180 ± 12 nm, the fibers were decorated with AgNps of 8.8 ± 1.1 nm, and the interparticle gap was measured as 45 ± 12 nm.
Figure 4 shows the results of Raman spectroscopy amplification of pyridine at concentrations of 1 mM, 1 μM, and 1 nM in the different materials. It can be seen from left to right that material “b” (ceramic only) has a very small contribution to the amplification, and as the silver is deposited in the different stages, the signal increases. The maximum amplification factor obtained for pyridine of 1 nM concentration was 4.4 × 10⁸ times. The material named as “n” was the most successful at enhancing the Raman signal. Because of this, the “n” material was used for the amplification test using 4 compounds at different concentrations.
Figure 5a show the SERS spectra of different concentrations of pyridine solutions. The green circle represents the vibrational mode corresponding to the band at 1021 cm−1 identified as ring breathing (Figure 5(a1)). Other bands visible on the spectra are the ring deformation (~770 cm−1) and the ring stretch (1205 cm−1) [23,24]. From the highest concentration of 1 × 10⁻², the spectrum appears very detailed and with sharp and intense bands. As the concentration is reduced, the bands begin to decrease in intensity, until at a concentration of 1 × 10⁻⁹ only two bands, 978 cm−1 and 1021 cm−1, are still visible. The band at 1021 cm−1 is related to the chemisorption of the pyridine on the rough surface of the substrate and is likely result of a bond formed between the N atom and Ag of the nanoparticles. It has been speculated that pyridine forms a complex with the nanoparticles, using nitrogen as an anchor, and that N has a vibrational motion along to the axis of the bond; also, stretching vibrations of C-C towards the particle are a result of the propagation of the movement. Since there is a simultaneous enhancement between the electromagnetic and chemical effects, the band appears very intense on the spectra [25]. Figure 5b shows the characteristic peaks of MO at wavenumbers of ~1111, 1146, 1192, 1374, and 1590 cm−1, corresponding to the C-C bending; C-S stretching, which was used to determine the enhancement factor (Figure 5(b1)); N=N in-plane bending; C-C stretching; and C-C in-plane bending modes, respectively [26,27,28]. The strong bands related to the N=N and S-ring and N-ring could be the result of the perpendicular or almost perpendicular position of the analyte on the surface of the substrate. As with pyridine, the MO molecule could form a complex between the S atom and the Ag of the nanoparticles, favoring the perpendicular position of the analyte, according to some authors, there is an electrostatic repulsion occurring between the ring [27,28,29,30]. Figure 5c shows the characteristic peaks of MB at Raman shifts of ~449 and ~502 cm−1 of the C-N-C skeletal bending mode (Figure 5(c1)), ~1181 cm−1 of the C-N stretching mode, ~1400 cm−1 due to the deformation of CH3, and ~1624 cm−1 due to the stretching vibration of the ring, respectively. The band located at 449 cm−1 was used to determine the enhancement factor [31]. Due to the structure of the analyte, the electromagnetic effect could be the main cause of enhancement, since there is an impediment for the formation of bonds between the N atoms (N3 and N7) at the ends and the MB molecule and Ag, and the S5 atom and Ag, and as a result the molecule should be positioned parallel to the substrate. The electromagnetic enhancement is a result of an electromagnetic field formed between the metal–ceramic junction, and the closeness of the particles, forming multiple interacting hot spots. A slight shift in the bands towards lower wavenumbers indicates that a chemical bond could also be formed between Ag and the N10 atom and the band at ~600 cm−1 is a result of this, helping to the adsorption on the surface, while the chemical effect is not as responsible for the enhancement as the electromagnetic one [32].
Figure 5d shows the characteristic peaks of CV at Raman shifts of ~420, 523, 803, 910, 1174, 1383, and 1581 cm−1, corresponding to the phenyl-C-phenyl out-of-plane bending, C-N-C bending, phenyl-H out-of-plane bending, phenyl ring breathing, C-H in-plane ring deformation (Figure 5(d1)), C-N stretching, and phenyl ring stretching vibration, respectively [33,34]. The strong enhancement could be a result of the position of the molecule. Because of steric hinderance between ortho-hydrogen atoms, the phenyl rings turn approximately 33° around the central C atom; thus, the position of the molecule is parallel to the surface of the substrate and perpendicular to the light source, and, consequently, the enhancement is a product of the electromagnetic effect. While charge transfer can occur, it is most likely that the contribution to amplification is minimal [35]. The spectrum of EB is shown in Figure 5e, where bands located at 1070 cm−1 are related to in-plane bending (CH ring2), in-plane bending (C21N23), in-plane ring2 deformation; 1296 cm−1 to asymmetric stretching (CC ring2), in-plane bending (O27H), in-plane bending (O26H), stretching (C13N12), in-plane bending (CH ring2); 1343 cm−1 to asymmetric stretching (CC ring2), in-plane bending (C14O27H), in-plane bending (O26H), stretching (N12N11), stretching (C13N12), in-plane bending (CH ring2); 1374 cm−1 to asymmetric stretching (CC ring2), in-plane bending (C14O27H), stretching (N12N11) (Figure 5(e1)), in-plane bending (CH ring2); 1415 cm−1 to stretching (N12N11), stretching (CC ring2), in-plane bending (CH ring1, ring2), in-plane bending (O26H), stretching (C7O26H); and 1465 cm−1 to in-plane bending (CH ring1, ring2), in-plane bending (C14O27H), stretching (N12N11), and stretching (CC ring1, ring2). Enhancement of the EB signal could be the result of charge transfer due to different interactions. A Metal–EB coordination can happen between a negative charge, which could be present on the O26, O27, and N11 atoms and the Ag of the nanoparticles. Adsorption of the EB molecule on the surface of the substrate is due to the NO3 and SO3H groups, resulting on a perpendicular position. This could mean that most of the EB molecule is away from the surface, and the electromagnetic field produced at the metal–ceramic does interface not have much influence on the enhancement. This is related to the EB spectra, showing weak and diffuse bands, unlike the rest of the analytes [36,37,38,39].
Figure 6 shows the trend of the enhancement factor according to the compound analyzed and the concentration. At the highest concentrations complex molecules are apparently detected easily, and as the concentration is reduced the detection is lower as well. The values for enhancement factors calculated are present on Table 1. Even at concentrations of 10−11 enhancement is still possible in the tens, and for concentrations of 10−9, which would be considered under the detection limits or ppb for the Raman spectroscopy, enhancement factors in the thousands are still obtainable.
Linear regression (Figure 7) was calculated for each of the compounds analyzed resulting in R2 = 0.9881 for Py, R2 = 0.9957 for MO, R2 = 0.9932 for MB, R2 = 0.9969 for CV, and R2 = 0.7804 for EB. The approximation to 1 indicates how deviated or not is the enhancement in relation to the concentration of the compounds. All the regressions indicate a proportional increase between detection and concentration of the analytes, which can be interpreted as a reproducible behavior of the substrates.
To determine if there is a difference in the amplification behavior in relation to each of the molecules analyzed, a one-way ANOVA was carried out. There is no significant difference between the means of MO, MB, and CV, or the enhancement capacity is equal for all three dyes. However, Py appears to be an outlier, and its meaning is significantly different than the other three compounds (Figure 8). The theory proposed is that the more complex and larger a molecule is, the more probability there is to be detected, since there is a higher chance for vibrations of bonds and functional groups to occur. Because all the molecules used in the experiment present delocalized electrons or conjugated states, this phenomenon can interact with the surface plasmon resonance of the substrate to improve the localized electromagnetic fields; thus, the more delocalized electrons there are, the more enhancement is expected. Starting from pyridine, only one ring is present, and each molecule is bigger; methyl orange has two rings, methylene blue and crystal violet have three rings, and Eriochrome black T has four rings.
A quick review on the materials proposed for surface-enhanced spectroscopy (Table 2) shows the consistent use of molecules with delocalized electrons as analytes.
The morphologies of the substrates generally have an array-like structure; otherwise, the particles are dispersed in a colloidal solution. Although colloids are capable of amplifying concentrations smaller than pM, the enhancement is limited to the use of liquids. Arrays, on the other side, provide a more “universal” approach regarding the kind of analyte used and the physical state of the medium, either solid or liquid. Solid arrays are capable of amplifying just as well as colloids, and most of the examples cited on the table have structures smaller than 100 nm; however, the relationship between the size of the structures and the enhancement factor are not directly related. What could be directly related is the complexity of the molecule and how it is positioned on the substrate or the interaction it has with the nanostructure [39,40,41,42,43,44,45,46,47,48,49,50,51,52,53,54,55]. Larger molecules such as R6G are very complex, and the enhancement may only be related to the electromagnetic mechanism due to the fact that steric impediment and the lack of groups capable of forming complexes with the metal used on the substrate reduce the possibility of enhancement through the chemical effect; also, a larger molecule may be in contact with the substrate, but it does not guarantee a full interaction between the molecule and the electromagnetic field, causing a large part of the molecule to be distant from said field. On the contrary, smaller molecules where functional groups can form complexes with the metal are more exposed, and a smaller molecule may also be surrounded by the electromagnetic field, allowing for enhancement by both the electromagnetic and the chemical effects. The capacity of enhancement of the substrates obtained in this work could be considered competitive. At the start of Table 2, the enhancement results obtained for a concentration of 1 × 10⁻⁹ of each one of the analytes are shown in comparison with results from different authors. In three out of the four molecules, it is possible to enhance the signal thousands of times, the largest amount being 4.66 × 10³ for crystal violet.

4. Conclusions

The obtained substrates can detect and enhance signals of Py, MO, MB, CV, and EB in concentrations of 1 × 10⁻⁹ M in the thousands of times, the highest EF being 4.7 × 10³ times; however, the substrates can enhance signals for concentrations of 1 × 10⁻¹¹ M for all five compounds. A one-way ANOVA indicates that there is no significant difference in the detection of the four dyes used; however, the detection of pyridine is significantly different from the other three compounds. The concentrations of pyridine shown in the Raman spectra are noticeably higher in comparison with the rest of the analytes. This could be associated with the size, complexity, and availability of delocalized electrons in the molecules used. Larger and more complex molecules are more susceptible to not being in full contact with the electromagnetic field, while also preventing its functional groups to be exposed. Although charge transfer contribution may be existent, most authors agree that the charge transfer mechanism has a very low influence on the enhancement of signals in Raman spectroscopy; thus, most of the amplification should be the result of the electromagnetic enhancement mechanism. A linear regression analysis shows the reproducibility regarding the enhancement, since a reproducible substrate can be fabricated with a relatively simple technique and economically accessible materials such as high-strength, chemically inert, and temperature-resistant ceramics, the materials obtained could decrease the cost of using the SERS technique, without compromising the detection capacity, since the detection capacity achieved can be comparable if not better than the capacity of commercially available substrates.

Author Contributions

Conceptualization, J.A.G.-A. and S.Y.R.-L.; Methodology, J.A.G.-A., P.P.-R., A.E.Z.-C., F.E.-M. and S.Y.R.-L.; Software, S.Y.R.-L.; Validation, J.A.G.-A., A.E.Z.-C., F.E.-M. and S.Y.R.-L.; Formal analysis, J.A.G.-A., P.P.-R., A.E.Z.-C., F.E.-M. and S.Y.R.-L.; Investigation, J.A.G.-A., P.P.-R., A.E.Z.-C., F.E.-M. and S.Y.R.-L.; Resources, S.Y.R.-L.; Data curation, J.A.G.-A. and S.Y.R.-L.; Writing—original draft, J.A.G.-A., P.P.-R., A.E.Z.-C., F.E.-M. and S.Y.R.-L.; Writing—review & editing, J.A.G.-A. and S.Y.R.-L.; Visualization, J.A.G.-A., P.P.-R. and S.Y.R.-L.; Supervision, J.A.G.-A., P.P.-R. and S.Y.R.-L.; Project administration, S.Y.R.-L. All authors have read and agreed to the published version of the manuscript.

Funding

This research received no external funding.

Institutional Review Board Statement

Not applicable.

Informed Consent Statement

Not applicable.

Data Availability Statement

The data presented in this study is available on request from the corresponding author.

Acknowledgments

Thanks to PRODEP, Universidad Autónoma de Ciudad Juárez, and CONACHYT.

Conflicts of Interest

The authors declare no conflicts of interest.

Abbreviations

Pypyridine
MOmethyl orange
MBmethylene blue
CVcrystal violet
EBEriochrome black T

References

  1. Cao, Y.; Zhang, J.; Yang, Y.; Huang, Z.; Long, N.V.; Fu, C. Engineering of SERS Substrates Based on Noble Metal Nanomaterials for Chemical and Biomedical Applications. Appl. Spectrosc. Rev. 2015, 50, 499–525. [Google Scholar] [CrossRef]
  2. Tong, L.; Xu, H.; Käll, M. Nanogaps for SERS applications. MRS Bull. 2014, 39, 163–168. [Google Scholar] [CrossRef]
  3. Kim, J.; Sim, K.; Cha, S.; Oh, J.; Nam, J. Single-Particle Analysis on Plasmonic Nanogap Systems for Quantitative SERS. J. Raman Spectrosc. 2020, 52, 375–385. [Google Scholar] [CrossRef]
  4. Kanzaki, S.; Tabata, H.; Kumazawa, T.; Ohta, S. Sintering and Mechanical Properties of Stoichiometric Mullite. J. Am. Ceram. Soc. 1985, 68, C‐6. [Google Scholar] [CrossRef]
  5. Bagchi, B.; Das, S.; Bhattacharya, A.; Basu, R.; Nandy, P. Nanocrystalline Mullite Synthesis at a Low Temperature: Effect of Copper Ions. J. Am. Ceram. Soc. 2009, 92, 748–751. [Google Scholar] [CrossRef]
  6. Zhang, Y.; Ding, Y.; Gao, J.; Yang, J. Mullite fibres prepared by sol–gel method using polyvinyl butyral. J. Eur. Ceram. Soc. 2009, 29, 1101–1107. [Google Scholar] [CrossRef]
  7. Kong, L.B.; Zhang, T.S.; Ma, J.; Boey, F.Y.C. Mullitization behavior and microstructural development of B2O3–Al2O3–SiO2 mixtures activated by high-energy ball milling. Solid State Sci. 2009, 11, 1333–1342. [Google Scholar] [CrossRef]
  8. Ribeiro, M.J.; Tulyagavov, D.U.; Ferreira, J.M.; Labrincha, J.A. High temperature mullite dissolution in ceramic bodies derived from Al-rich sludge. J. Eur. Ceram. Soc. 2005, 25, 703–710. [Google Scholar] [CrossRef]
  9. Yang, T.; Wang, E.; Wang, F.; Chou, K.; Hou, X. Fabrication of Ordered Mullite Nanowhisker Array with Surface Enhanced Raman Scattering Effect. Sci. Rep. 2015, 5, 9690. [Google Scholar] [CrossRef]
  10. Camerucci, M.A.; Urretavizcaya, G.; Castro, M.S.; Cavalieri, A.L. Electrical properties and thermal expansion of cordierite and cordierite-mullite materials. J. Eur. Ceram. Soc. 2001, 21, 2917–2923. [Google Scholar] [CrossRef]
  11. da Silva, V.J.; de Almeida, E.P.; Gonçalves, W.P.; da Nóbrega, R.B.; de Araújo Neves, G.; de Lucena Lira, H.; Menezes, R.R.; de Lima Santana, L.N. Mineralogical and dielectric properties of mullite and cordierite ceramics produced using wastes. Ceram. Ceram. Int. 2019, 45, 4692–4699. [Google Scholar] [CrossRef]
  12. Kumar, N.; Wondergem, C.S.; Wain, A.J.; Weckhuysen, B.M. In Situ Nanoscale Investigation of Catalytic Reactions in the Liquid Phase Using Zirconia-Protected Tip-Enhanced Raman Spectroscopy Probes. J. Phys. Chem. Lett. 2019, 10, 1669–1675. [Google Scholar] [CrossRef] [PubMed]
  13. Sato, K.; Abe, H.; Ohara, S. Selective Growth of Monoclinic and Tetragonal Zirconia Nanocrystals. J. Am. Chem. Soc. 2010, 132, 2538–2539. [Google Scholar] [CrossRef] [PubMed]
  14. Guo, T.; Karim, M.N.; Ghosh, K.; Murshed, M.M.; Rezwan, K.; Maas, M. Plasmonic porous ceramics based on zirconia-toughened alumina functionalized with silver nanoparticles for surface-enhanced Raman scattering. Open Ceram. 2022, 9, 100228. [Google Scholar] [CrossRef]
  15. Zhang, T.S.; Kong, L.B.; Du, Z.H.; Ma, J.; Li, S. In situ interlocking structure in gel-derived mullite matrix induced by mechanoactivated commercial mullite powders. Scr. Mater. 2010, 63, 1132–1135. [Google Scholar] [CrossRef]
  16. Zhang, P.; Liu, J.; Du, H.; Li, Z.; Li, S.; Li, S.; Xu, R. Molten salt synthesis of mullite whiskers from various alumina precursors. J. Alloys Compd. 2010, 491, 447–451. [Google Scholar] [CrossRef]
  17. Fischer, R.X.; Schneider, H.; Schmucker, M. Crystal structure of Al-rich mullite. Am. Mineral. 1994, 79, 983–990. [Google Scholar]
  18. Lazic, B.; Krueger, H.; Kaindl, R.; Perfler, L.; Kremenovic, A.; Cvetkovic, V.; Withers, R.L. ChemInform Abstract: Superstructure of Mullite-Type KAl9O14. ChemInform 2013, 44, 496–502. [Google Scholar] [CrossRef]
  19. Durai, L.; Badhulika, S. Spinel structured MgAl2O4 nanoparticles as a low-cost and stable SERS substrate for rapid simultaneous detection of neurological drugs in biofluids. Ceram. Int. 2022, 48, 18667–18675. [Google Scholar] [CrossRef]
  20. Shi, T.; Tang, Z.; Liang, P.; Zhang, X.; Zhang, D.; Shao, Q.; Huang, J.; Yu, Z.; Xu, Y.; Chen, H. ZrO2@Ag@SiO2 Sandwich Structure with High SERS Enhancement Effect and Stability. J. Phys. Chem. C 2020, 124, 25967–25974. [Google Scholar] [CrossRef]
  21. Sitjar, J.; Liao, J.D.; Lee, H.; Liu, B.H.; Fu, W.E. SERS-active substrate with collective amplification design for trace analysis of pesticides. Nanomaterials 2019, 9, 664. [Google Scholar] [CrossRef]
  22. Garibay-Alvarado, J.A.; Ruiz-Esparza-Rodríguez, M.A.; Zaragoza-Contreras, E.A.; Reyes-López, S.Y. Ag Nanoparticle-Decorated SiO2–Al2O3–ZrO2 Composites as a Low-Cost Substrate for Enhanced Signal Infrared Spectroscopy. ACS Appl. Nano Mater. 2024, 7, 4658–4666. [Google Scholar] [CrossRef]
  23. Wojdyr, M. Fityk: A general-purpose peak fitting program. J. Appl. Crystallogr. 2010, 43, 1126–1128. [Google Scholar] [CrossRef]
  24. Gao, Y.; Chen, L.; Dai, X.; Song, R.; Wang, B.; Wang, Z. A strong charge-transfer effect in surface-enhanced Raman scattering induced by valence electrons of actinide elements. RSC Adv. 2015, 5, 32198–32204. [Google Scholar] [CrossRef]
  25. Chen, L.; Gao, Y.; Xu, H.; Wang, Z.; Li, Z.; Zhang, R.Q. The mechanism of N–Ag bonding determined tunability of surface-enhanced Raman scattering of pyridine on MAg (M = Cu, Ag, Au) diatomic clusters. Phys. Chem. Phys. 2014, 16, 20665–20671. [Google Scholar] [CrossRef] [PubMed]
  26. Liu, C.; Li, B.; Chen, C.; Peng, J.; Lee, S. Enhancement in SERS intensities of azo dyes adsorbed on ZnO by plasma treatment. J. Raman Spectrosc. 2014, 45, 332–337. [Google Scholar] [CrossRef]
  27. Yu, T.; Ho, C.; Wu, C.; Chien, C.; Lin, C.; Lee, S. Metal–organic frameworks: A novel SERS substrate. J. Raman Spectrosc. 2013, 44, 1506–1511. [Google Scholar] [CrossRef]
  28. Tian, L.; Tadepalli, S.; Farrell, M.E.; Liu, K.K.; Gandra, N.; Pellegrino, P.M.; Singamaneni, S. Multiplexed charge-selective surface enhanced Raman scattering based on plasmonic calligraphy. J. Mater. Chem. C 2014, 2, 5438. [Google Scholar] [CrossRef]
  29. Nguyen, T.V.; Vu, D.C.; Pham, V.H.; Pham, T.B.; Pham, V.H.; Bui, H. Improvement of SERS for detection of ultra-low concentration of methyl orange by nanostructured silicon decorated with Ag nanoparticles. Optik 2021, 231, 166431. [Google Scholar] [CrossRef]
  30. Zhang, A.; Fang, Y. Influence of adsorption orientation of methyl orange on silver colloids by Raman and fluorescence spectroscopy: pH effect. Chem. Phys. 2006, 331, 55–60. [Google Scholar] [CrossRef]
  31. Santos Ede, B.; Lima, E.C.N.L.; Oliveira CSde Sigoli, F.A.; Mazali, I.O. Fast detection of paracetamol on a gold nanoparticle–chitosan substrate by SERS. Anal. Methods 2014, 6, 3564–3568. [Google Scholar] [CrossRef]
  32. Pham, T.T.; Vu, X.H.; Dien, N.D.; Trang, T.T.; Chi, T.T.; Phuong, P.H.; Nghia, N.T. Ag nanoparticles on ZnO nanoplates as a hybrid SERS-active substrate for trace detection of methylene blue. RSC Adv. 2022, 12, 7850–7863. [Google Scholar] [CrossRef]
  33. Meng, W.; Hu, F.; Jiang, X.; Lu, L. Preparation of silver colloids with improved uniformity and stable surface-enhanced Raman scattering. Nanoscale Res. Lett. 2015, 10, 34. [Google Scholar] [CrossRef]
  34. Zhang, Y.; Wang, B.; Yang, S.; Li, L.; Guo, L. Facile synthesis of spinous-like Au nanostructures for unique localized surface plasmon resonance and surface-enhanced Raman scattering. New J. Chem. 2015, 39, 2551–2556. [Google Scholar] [CrossRef]
  35. Meng, W.; Hu, F.; Zhang, L.Y.; Jiang, X.H.; Lu, L.D.; Wang, X. SERS and DFT study of crystal violet. J. Mol. Struct. 2013, 1035, 326–331. [Google Scholar] [CrossRef]
  36. Szabó, L.; Herman, K.; Leopold, N.; Buzumurgă, C.; Chiş, V. Surface-enhanced Raman scattering and DFT investigation of Eriochrome Black T metal chelating compound. Spectrochim. Acta Part A Mol. Biomol. Spectrosc. 2011, 79, 226–231. [Google Scholar] [CrossRef]
  37. Kaur, Y.; Jasrotia, T.; Kumar, R.; Chaudhary, G.R.; Chaudhary, S. Adsorptive removal of eriochrome black T (EBT) dye by using surface active low cost zinc oxide nanoparticles: A comparative overview. Chemosphere 2021, 278, 130366. [Google Scholar] [CrossRef] [PubMed]
  38. Nahali, L.; Miyah, Y.; Mejbar, F.; Benjelloun, M.; Assila, O.; Fahoul, Y.; Nenov, V.; Zerrouq, F. Assessment of Brilliant Green and Eriochrome Black T dyes adsorption onto fava bean peels: Kinetics, isotherms and regeneration study. Desalination Water Treat. 2022, 245, 255–269. [Google Scholar] [CrossRef]
  39. Cañamares, M.V.; Garcia-Ramos, J.V.; Sanchez-Cortes, S.; Castillejo, M.; Oujja, M. Comparative SERS effectiveness of silver nanoparticles prepared by different methods: A study of the enhancement factor and the interfacial properties. J. Colloid Interface Sci. 2008, 326, 103–109. [Google Scholar] [CrossRef] [PubMed]
  40. Ciou, S.H.; Cao, Y.W.; Huang, H.C.; Su, D.Y.; Huang, C.L. SERS Enhancement Factors Studies of Silver Nanoprism and Spherical Nanoparticle Colloids in The Presence of Bromide Ions. J. Phys. Chem. C 2009, 113, 9520–9625. [Google Scholar] [CrossRef]
  41. Camargo, P.H.C.; Au, L.; Rycenga, M.; Li, W.; Xia, Y. Measuring the SERS enhancement factors of dimers with different structures constructed from silver nanocubes. Chem. Phys. Lett. 2010, 484, 304–308. [Google Scholar] [CrossRef]
  42. Lin, W.C.; Huang, S.H.; Chen, C.L.; Chen, C.C.; Tsai, D.P.; Chiang, H.P. Controlling SERS intensity by tuning the size and height of a silver nanoparticle array. Appl. Phys. A 2010, 101, 185–189. [Google Scholar] [CrossRef]
  43. Babich, E.; Raskhodchikov, D.; Redkov, A.; Hmima, A.; Nashchekin, A.; Lipovskii, A. Dendritic structures by glass electrolysis: Studies and SERS capability. Curr. Appl. Phys. 2021, 24, 54–59. [Google Scholar] [CrossRef]
  44. Jana, D.; Mandal, A.; De, G. High Raman Enhancing Shape-Tunable Ag Nanoplates in Alumina: A Reliable and Efficient SERS Technique. ACS Appl. Mater. Interfaces 2012, 4, 3330–3334. [Google Scholar] [CrossRef] [PubMed]
  45. Xu, Z.; Chen, Y.; Gartia, M.R.; Jiang, J.; Liu, G.L. Surface plasmon enhanced broadband spectrophotometry on black silver substrates. Appl. Phys. Lett. 2011, 98, 241904. [Google Scholar] [CrossRef]
  46. Cheng, L.; Ma, C.; Yang, G.; You, H.; Fang, J. Hierarchical silver mesoparticles with tunable surface topographies for highly sensitive surface-enhanced Raman spectroscopy. J. Mater. Chem. A 2014, 2, 4534–4542. [Google Scholar] [CrossRef]
  47. Rekha, C.R.; Nayar, V.U.; Gopchandran, K.G. Synthesis of highly stable silver nanorods and their application as SERS substrates. J. Sci. Adv. Mater. Devices 2018, 3, 196–205. [Google Scholar] [CrossRef]
  48. Sun, K.; Meng, G.; Huang, Q.; Zhao, X.; Zhu, C.; Huang, Z.; Qian, Y.; Wang, X.; Hu, X. Gap-tunable Ag-nanorod arrays on alumina nanotip arrays as effective SERS substrates. J. Mater. Chem. C 2013, 1, 5015. [Google Scholar] [CrossRef]
  49. Xie, Y.; Jin, Y.; Zhou, Y.; Wang, Y. SERS activity of self-cleaning silver/titania nanoarray. Appl. Surf. Sci. 2014, 313, 549–557. [Google Scholar] [CrossRef]
  50. Lee, H.; Liao, J.D.; Sivashanmugan, K.; Liu, B.H.; Fu, W.E.; Chen, C.C.; Chen, G.D.; Juang, Y.D. Gold Nanoparticle-Coated ZrO2-Nanofiber Surface as a SERS-Active Substrate for Trace Detection of Pesticide Residue. Nanomaterials 2018, 8, 402. [Google Scholar] [CrossRef]
  51. Pal, A.K.; Pagal, S.; Prashanth, K.; Chandra, G.K.; Umapathy, S.; Mohan, D.B. Ag/ZnO/Au 3D hybrid structured reusable SERS substrate as highly sensitive platform for DNA detection. Sens. Actuators B Chem. 2019, 279, 157–169. [Google Scholar] [CrossRef]
  52. Zhao, H.; Hasi, W.; Li, N.; Sha, X.; Han, S. Preparation of a high-performance thermally shrinkable polystyrene SERS substrate via Au@Ag nanorods self-assembled to detect pesticide residues. J. Raman Spectrosc. 2019, 50, 1679–1690. [Google Scholar] [CrossRef]
  53. Francis, M.K.; Sahu, B.K.; Bhargav, P.B.; Ahmed, N.; Das, A.; Dhara, S. Ag nanowires based SERS substrates with very high enhancement factor. Phys. E Low-Dimens. Syst. Nanostruct. 2022, 137, 115080. [Google Scholar] [CrossRef]
  54. Le Ru, E.C.; Blackie, E.; Meyer, M.; Etchegoin, P.G. Surface Enhanced Raman Scattering Enhancement Factors:  A Comprehensive Study. J. Phys. Chem. C 2007, 111, 13794–13803. [Google Scholar] [CrossRef]
  55. Silva-Holguín, P.N.; Garibay-Alvarado, J.A.; Reyes-López, S.Y. Silver nanoparticles: Multifunctional tool in environmental water remediation. Materials 2024, 17, 1939. [Google Scholar] [CrossRef]
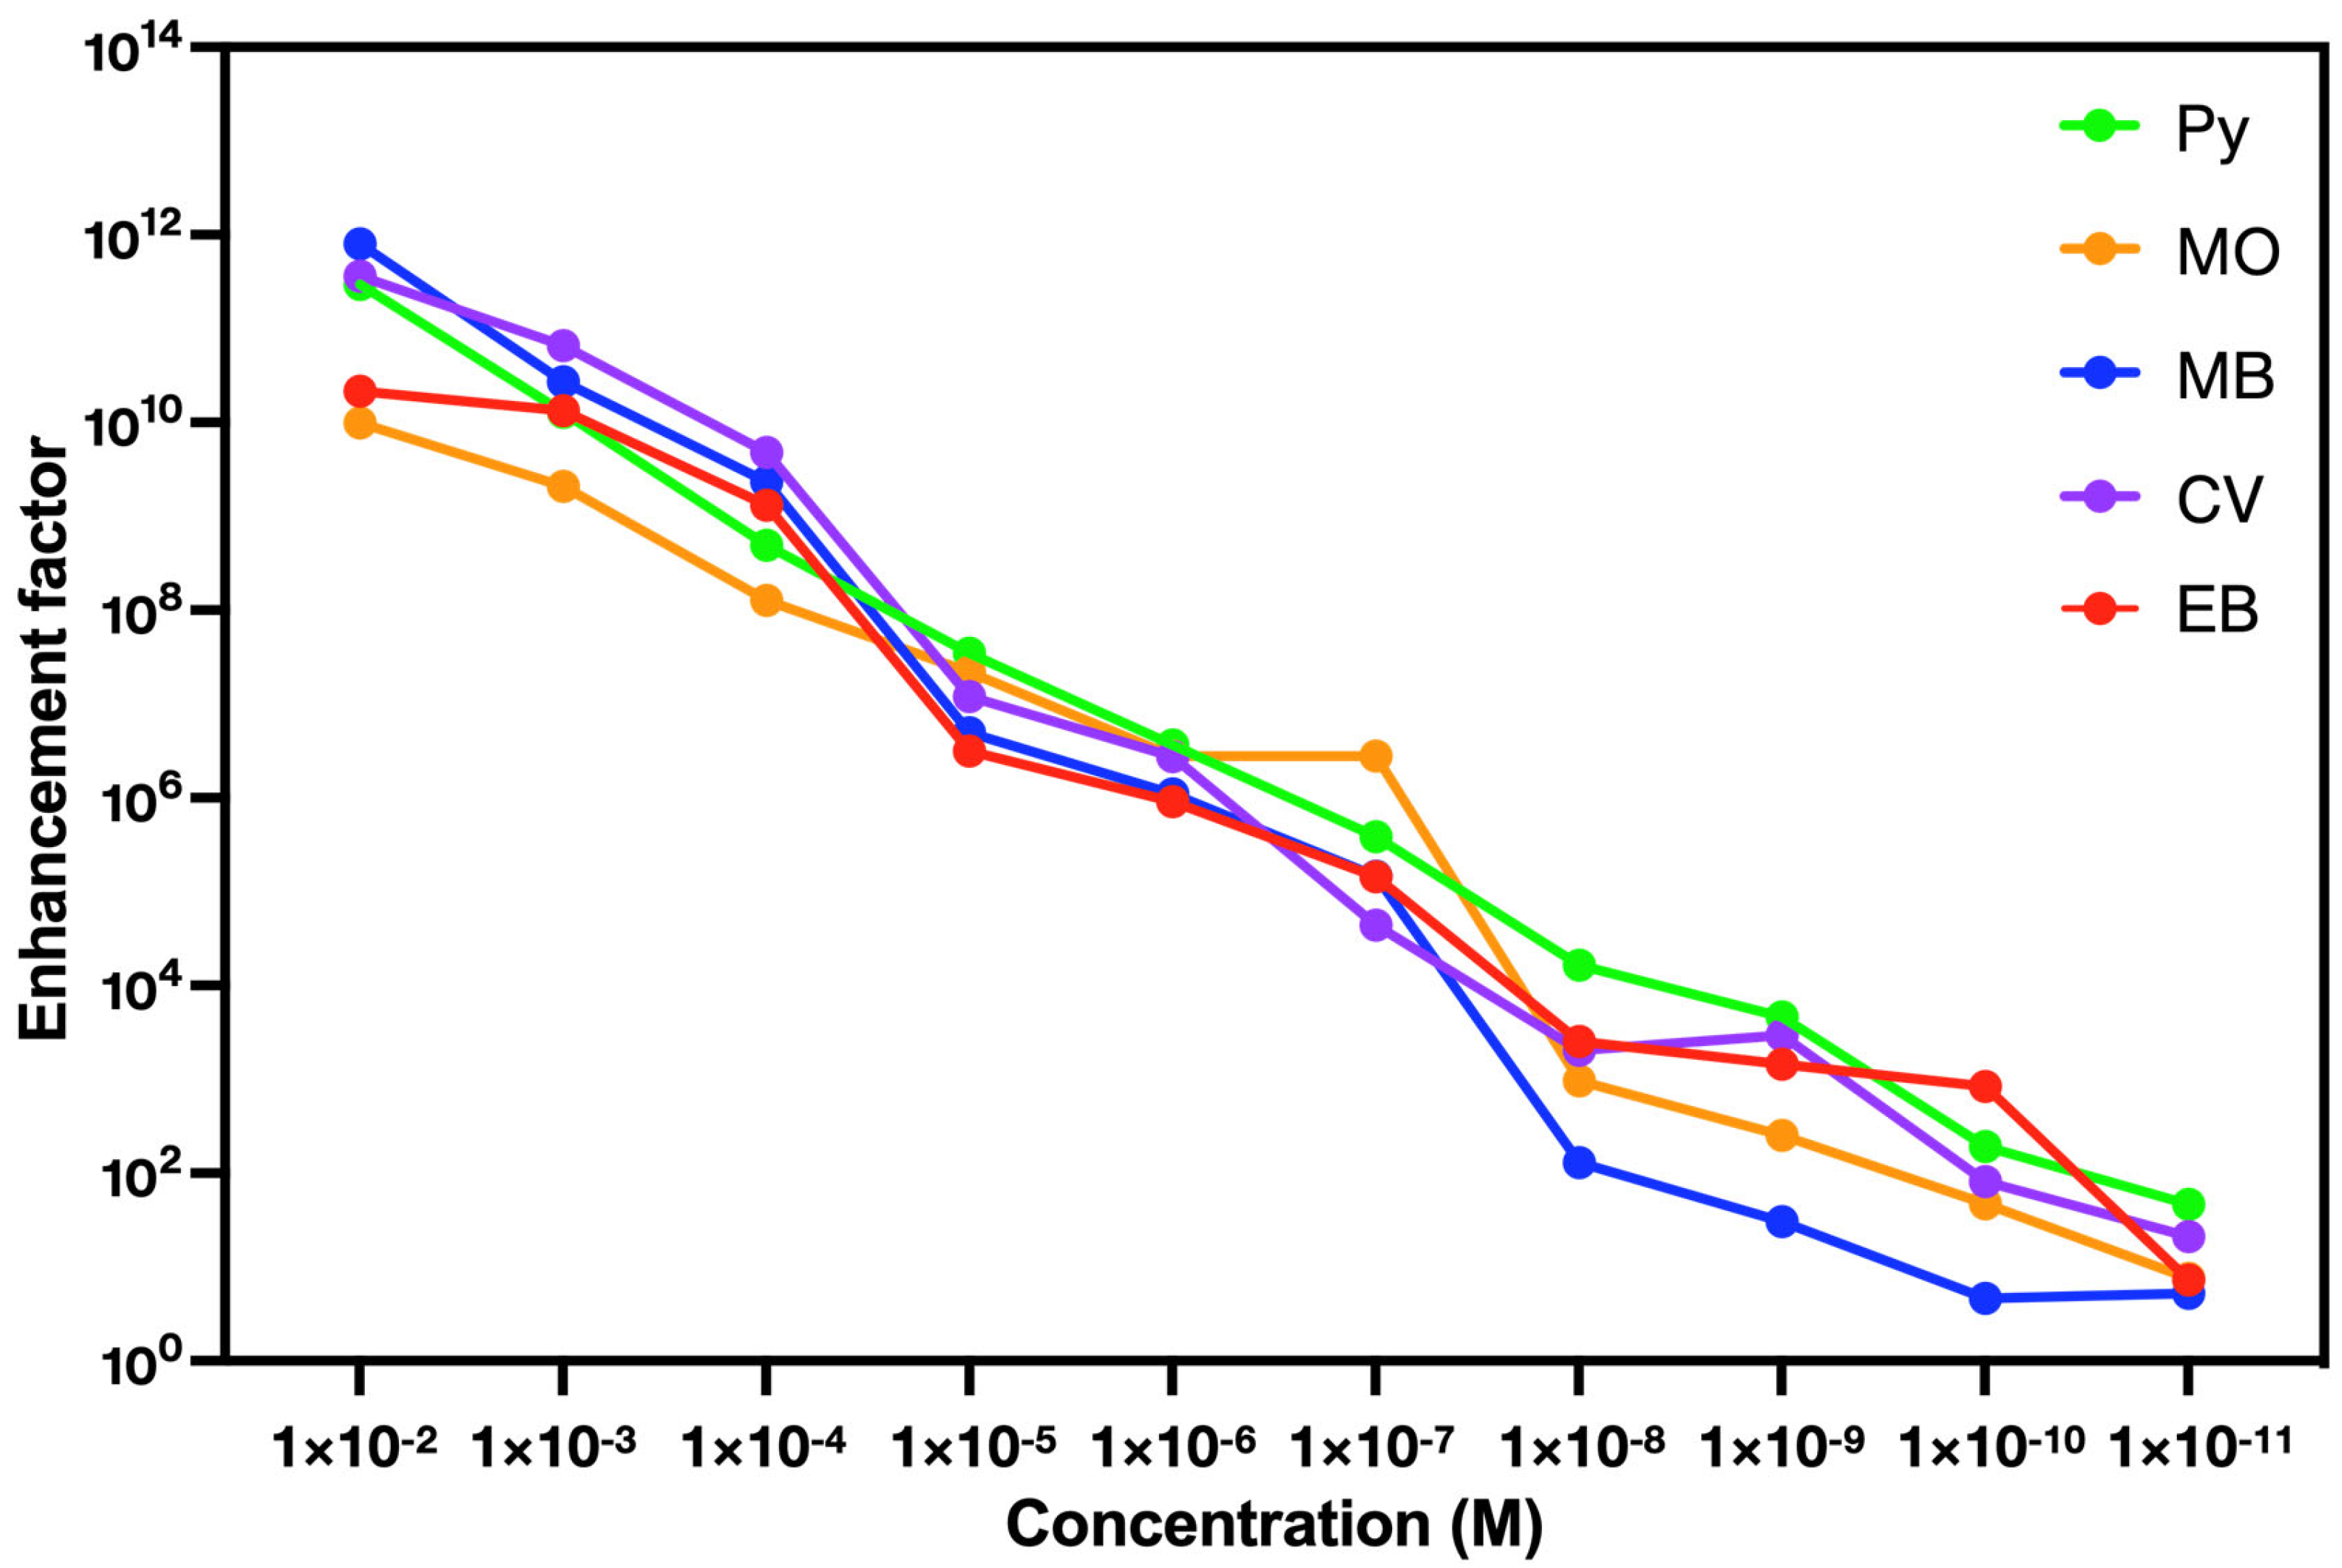
Figure 1. Thermal evolution of the material from green state to ceramic through ATR-FTIR.
Chemosensors 13 00266 g001
Figure 2. Diffraction pattern of SiO2-Al2O3-ZrO2 fibrous membranes sintered at (a) 400, (b) 800, and (c) 1500 °C.
Chemosensors 13 00266 g002
Figure 3. SEM micrography of the SiO2/Al2O3/ZrO2 ceramic composite decorated with AgNps.
Chemosensors 13 00266 g003
Figure 4. Substrate enhancement behavior based on the number of decorating stages: b (ceramic only), I (one stage), II (two stages), III (three stages), and n (four stages-no excess removed).
Chemosensors 13 00266 g004
Figure 5. Raman spectra of (a) Py, (b) MO, (c) MB, (d) CV, and (e) EB at different concentrations obtained using the enhancement substrates, each color band at 1021, 1146, 449, 1174, and 1465 cm−1 were used to calculate the enhancement factor of each compound. Insets (a1e1) show the selected vibrational modes corresponding to Py, MO, MB, CV, and EB, respectively.
Chemosensors 13 00266 g005
Figure 6. Enhancement factors calculated for Py, MO, MB, CV, and EB at different concentrations.
Chemosensors 13 00266 g006
Figure 7. Linear regression of the enhancement factor of the different dyes vs. the concentration, where (a) Py, (b) MO, (c) MB, (d) CV, and (e) EB.
Chemosensors 13 00266 g007
Figure 8. Difference between group means from the ANOVA.
Chemosensors 13 00266 g008
Table 1. Enhancement factors calculated for Py, MO, MB, CV, and EB at different concentrations. The table below shows the enhancement factor achieved for each analyte at each concentration analyzed.
Concentration (M)1 × 10−21 × 10−31 × 10−41 × 10−51 × 10−61 × 10−71 × 10−81 × 10−91 × 10−101 × 10−11
Py9.97 × 1092.08 × 1091.28 × 1082.19 × 1072.80 × 1062.80 × 1069.68 × 1022.53 × 1024.71 × 1017.58
MO7.98 × 10112.73 × 10102.32 × 1094.94 × 1061.10 × 1061.46 × 1051.30 × 1023.06 × 1014.665.26
MB3.65 × 10116.65 × 10104.83 × 1091.20 × 1072.74 × 1064.39 × 1042.03 × 1032.97 × 1038.16 × 1012.10 × 101
CV2.95 × 10111.29 × 10104.91 × 1083.47 × 1073.67 × 1063.86 × 1051.64 × 1044.66 × 1031.92 × 1024.69 × 101
EB2.15 × 10101.34 × 10101.31 × 1093.16 × 1069.13 × 1051.44 × 1052.54 × 1031.45 × 1038.36 × 1027.28
Table 2. Other attempts at producing enhancement substrates for Raman spectroscopy using silver nanostructures.
MaterialMorphologyMethodStructure SizeMaximum Enhancement FactorAnalyteAnalyte ConcentrationAuthor
SilverSpherical NPsArray~10 nm2.53 × 102Pyridine1 × 10−9This article
SilverSpherical NPsArray~10 nm3.06 × 101Methyl orange1 × 10−9This article
SilverSpherical NPsArray~10 nm2.97 × 103Methylene blue1 × 10−9This article
SilverSpherical NPsArray~10 nm4.66 × 103Crystal violet1 × 10−9This article
SilverSpherical NPsArray~10 nm1.45 × 103Eriochrome black T1 × 10−9This article
SilverSpherical NPsColloid100 nm1.8 × 105Alizarin10−6[39]
SilverNanoprisms
Spherical NPs
Colloid70 nm
10 nm
1.6 × 10⁵, 3.2 × 10⁵R6G4.5 × 10−9[40]
SilverNanocubesColloid100 nm2 × 1074-MBT1 × 10−1[41]
SilverNanospheresArray96 nm2 × 106R6G10−5[42]
SilverDendritesFilm100 nm106, 107BPE6 × 10−12[43]
SilverPlatesColloid180 nm1 × 109Methylene blue1 × 10−12[44]
SilverNanoconesArray180 nm6.38 × 107R6G1 × 10−4[45]
SilverNanoparticlesColloid100 nm4.1 × 109Crystal violet1 × 10−12[46]
SilverNanorodsArray~600 nm1.44 × 108Nile blue chloride4.2 × 10−7[47]
SilverNanorodsArray60 nm3.2 × 1074-MBN10−6[48]
SilverTiO2Nanorod NPsArray75 nm7.8 × 105PMBA5 × 10−12[49]
Gold, ZrO2Nanofiber NPsMesh50 nm2.1 × 107Phosmet10−8[50]
Silver, Gold, ZnONanorod NanoparticlesArray1380 nm1 × 1010R6G10−16[51]
Gold, SilverNanorodsColloid18.3 nm1.25 × 1064-MBA10−5[52]
SilverNanowiresColloid1000 nm6.93 × 1013R6G10−14[53]
Disclaimer/Publisher’s Note: The statements, opinions and data contained in all publications are solely those of the individual author(s) and contributor(s) and not of MDPI and/or the editor(s). MDPI and/or the editor(s) disclaim responsibility for any injury to people or property resulting from any ideas, methods, instructions or products referred to in the content.

