Article

Flexible Polymer-Based Electrodes for Detecting Depression-Related Theta Oscillations in the Medial Prefrontal Cortex

1
Biosensor National Special Laboratory, Key Laboratory for Biomedical Engineering of Education Ministry, Department of Biomedical Engineering, Zhejiang University, Hangzhou 310027, China
2
State Key Lab of Brain-Machine Intelligence, Zhejiang University, Hangzhou 310027, China
3
The MOE Frontier Science Center for Brain Science and Brain-Machine Integration, Zhejiang University, Hangzhou 310027, China
4
Innovation Center for Smart Medical Technologies & Devices, Binjiang Institute of Zhejiang University, Hangzhou 310053, China
*
Authors to whom correspondence should be addressed.
These authors contributed equally to this work.
Chemosensors 2024, 12(12), 258; https://doi.org/10.3390/chemosensors12120258
Submission received: 31 October 2024 / Revised: 22 November 2024 / Accepted: 2 December 2024 / Published: 10 December 2024
(This article belongs to the Special Issue Advancements of Chemosensors and Biosensors in China—2nd Edition)

Abstract

:
This study investigates neural activity changes in the medial prefrontal cortex (mPFC) of a lipopolysaccharide (LPS)-induced acute depression mouse model using flexible polymer multichannel electrodes, local field potential (LFP) analysis, and a convolutional neural network-long short-term memory (CNN-LSTM) classification model. LPS treatment effectively induced depressive-like behaviors, including increased immobility in the tail suspension and forced swim tests, as well as reduced sucrose preference. These behavioral outcomes validate the LPS-induced depressive phenotype, providing a foundation for neurophysiological analysis. Flexible polymer-based electrodes enabled the long-term recording of high-quality LFP and spike signals from the mPFC. Time-frequency and power spectral density (PSD) analyses revealed a significant increase in theta band (3–8 Hz) amplitude under depressive conditions. Using theta waveform features extracted via empirical mode decomposition (EMD), we classified depressive states with a CNN-LSTM model, achieving high accuracy in both training and validation sets. This study presents a novel approach for depression state recognition using flexible polymer electrodes, EMD, and CNN-LSTM modeling, suggesting that heightened theta oscillations in the mPFC may serve as a neural marker for depression. Future studies may explore theta coupling across brain regions to further elucidate neural network disruptions associated with depression.

1. Introduction

Depression is a prevalent and complex mental health disorder that severely impacts social functioning and quality of life, affecting millions globally [1]. Characterized by a persistent depressed mood and a loss of interest in pleasurable activities, depression arises from a complex interplay of psychological, biological, and environmental factors, including adverse life events [2,3]. Recent research increasingly links depression to neural network dysfunction, specifically involving disruptions in the balance between excitatory and inhibitory neurons within key brain regions.
Neural oscillations, particularly theta rhythms, play essential roles in regulating emotional and cognitive processes. In major depressive disorder (MDD), disruptions in theta oscillations are strongly associated with emotional dysregulation and cognitive impairments, suggesting their potential role as neural markers for depressive states [4]. Changes in the amplitude and coupling of theta oscillations have been observed in individuals with depression, potentially reflecting underlying neural mechanisms of altered information processing and emotional response regulation [5].
The medial prefrontal cortex (mPFC), a critical center for emotional regulation, is closely associated with depression’s pathogenesis [6]. In both human and rodent models, the mPFC demonstrates alterations in theta oscillations under depressive conditions, which are linked to behavioral manifestations of depression such as reduced motivation and increased anxiety. Studies have shown that variations in theta waves in the mPFC are closely linked to depression and anxiety, highlighting their central role in emotional regulation [6]. Particularly, theta wave activity often exhibits abnormalities in patients with depression and animal models, characterized by enhanced theta rhythms or changes in synchrony, which may relate to disruptions in information processing and emotional response regulation mechanisms within neural networks [7]. Additionally, treatments such as deep brain stimulation (DBS) and transcranial magnetic stimulation (TMS) that target the mPFC’s descending pathways have shown promise in alleviating depressive symptoms [8]. DBS interventions that inhibit gamma oscillations and enhance theta-gamma coupling may exert effects through activating inhibitory circuits in the subcallosal cingulate gyrus (SCG) and enhancing plasticity in the frontal cortex [9]. These alterations in theta oscillations during depression are closely linked with cognitive impairments, particularly in attention and memory, where changes in theta-gamma phase coupling may represent a neural mechanism underlying cognitive deficits [5]. Understanding changes in theta oscillations of mPFC field potentials is crucial for further elucidating the neural network dysfunctions associated with depression.
Lipopolysaccharide (LPS), a component of Gram-negative bacterial walls, is frequently used to induce depressive-like behaviors in rodents as a model for acute depression. LPS triggers an immune response, leading to increased production of pro-inflammatory cytokines that affect brain function. This inflammatory process is linked to the development of depressive symptoms, such as anhedonia, anxiety, and behavioral despair, making LPS an effective model for studying acute depressive states in animals [10,11].
To study mPFC neural activity under depressive conditions, various electrode types have been used for neural recordings. In recent studies, various neural signal recording techniques have been used to monitor mPFC activity in both healthy and pathological conditions. Silicon-based electrodes, including traditional rigid probes and microelectrode arrays, have been widely used due to their high spatial resolution and electrode density [12]. However, their rigidity often leads to tissue damage during implantation and long-term recordings, limiting their effectiveness for chronic studies [13]. Microelectrode arrays (MEAs), including microwire electrodes, have also been employed for their ability to record single-unit activity. While microwire electrodes provide good tissue integration and chronic recording capabilities, they still face challenges regarding consistent signal quality and tissue reactions over time [14].
Flexible polymer electrodes have recently emerged as a promising alternative to both traditional silicon electrodes and microwire MEAs. These electrodes exhibit better conformability to brain tissue, resulting in reduced chronic inflammatory responses, minimized tissue damage, and improved long-term stability [15,16]. The superior adaptability of flexible electrodes also allows for higher channel density and smaller electrode footprints, making them ideal for capturing fine neural oscillations and multi-channel recordings in the mPFC [17]. In particular, flexible polymer-based microelectrode arrays have proven effective in monitoring neural oscillatory activity, which is crucial for understanding dynamic brain functions in disorders like depression [18].
To accurately capture these oscillatory changes, this study employed custom-designed flexible polymer electrodes, which offer advantages over traditional silicon electrodes, such as enhanced tissue adaptability, higher signal stability, and minimal tissue damage. Additionally, we utilized EMD, a powerful technique for analyzing non-linear and non-stationary signals [19], to isolate theta band components. Theta oscillations have been consistently reported as a key marker in mPFC activity, with increased theta power indicating functional network reorganization in response to stress and inflammation, as often seen in depression [20]. Furthermore, we employed CNN-LSTM model to classify depressive states in mice. Theta oscillatory features were used to train the model, which achieved a classification accuracy of 91.4% after training, demonstrating the effectiveness of using theta rhythms for recognizing depressive states.
This study aimed to investigate changes in mPFC theta oscillations in an LPS-induced depression model, using flexible polymer electrodes to achieve high-fidelity neural recordings. By integrating EMD and CNN-LSTM, we aimed to identify distinct theta oscillatory markers associated with depressive states, enhancing our understanding of the neural dynamics underlying depression.

2. Materials and Methods

2.1. Animals

Mice were housed under controlled conditions with a 12 h light/dark cycle (lights on from 7:00 to 19:00), at a temperature of 22 ± 1°C and humidity maintained at 55 ± 5%. They had ad libitum access to food and water. All behavioral testing was carried out on adult male C57BL/6J mice, aged 2–4 months, during the light phase of the cycle. These mice were bred on a C57BL/6J background for over 10 generations. All animal procedures were in strict accordance with the ethical guidelines set by the Zhejiang University Animal Experimentation Committee and conformed to their regulations for the care and use of laboratory animals.

2.2. Electrode Fabrication and EIS Testing

Polymer-based microelectrode arrays (MEA) were fabricated through a multi-step process. First, an aluminum layer was deposited onto a silicon substrate via magnetron sputtering system (Kurt J. Lesker, Jefferson Hills, PA, USA). A 1.5 μm thick layer of SU-8 (MicroChem Inc., Adel, GA, USA) was spin-coated onto the aluminum as a base layer, followed by photolithographic patterning to define the electrode area. Next, a 3 μm thick negative photoresist RN218 (Fujifilm, Tokyo, Japan) was spin-coated to form a base protective layer. Metal deposition and patterning were then performed using a lift-off process to form the desired electrode layout, using nickel/gold as the conductive material. A 10 μm thick SU-8 insulation layer was subsequently spin-coated onto the electrode structure to ensure electrode stability and insulation. Finally, release etching was performed to complete the planar microelectrode array, resulting in an SU-8 flat integrated microelectrode array.
Electrochemical impedance spectroscopy (EIS) was carried out using an electrochemical workstation (CHI700e, CH Instruments, Inc., Bee Cave, TX, USA). The flexible electrodes were integrated into a three-electrode setup, which included an Ag/AgCl reference electrode (CHI111, CH Instruments, Inc.) and a platinum counter electrode, all immersed in a 0.1 M phosphate-buffered saline (PBS) solution. The experiment was conducted with an applied voltage of 10 mV, covering a frequency range from 10 Hz to 5 kHz [21,22]. The impedance values were recorded at 1 kHz as a standard point of comparison, as the impedance at 1 kHz is particularly significant for evaluating electrode–tissue coupling in many electrophysiological applications [21,23,24]. This frequency is typical for neural signals, and the impedance at this frequency reflects the electrode’s responsiveness to neural signals and the efficiency of signal transmission, which is especially important for recording rapid potential changes. Impedance data were analyzed on a logarithmic scale to assess the stability and consistency of electrode performance across the frequency spectrum.

2.3. In Vivo Electrophysiology

2.3.1. Electrode Implantation Surgery

Electrode implantation was performed to target the mPFC. Mice were anesthetized with isoflurane (induction at 3–4% and maintenance at 1–2%) and placed in a stereotaxic frame. After ensuring stable anesthesia, a small craniotomy was performed above the mPFC using stereotaxic coordinates. A polymer-based microelectrode array was carefully lowered into the mPFC region, and the electrode was secured to the skull using dental cement. Post-surgical care included administering analgesics and monitoring until recovery.

2.3.2. Signal-to-Noise Ratio (SNR) Calculation

SNR of neural recordings was calculated to evaluate the quality of the recorded signals. SNR was determined using the following formula:
S N R = μ s i g n a l σ n o i s e
μsignal represents the mean amplitude of the recorded neural signal, and σnoise is the standard deviation of the noise in a segment without active neural signals. Higher SNR values indicated better signal quality and reduced background noise.

2.3.3. Power Spectral Density (PSD) Analysis

PSD analysis was performed to examine the frequency components of LFP signals. PSD was calculated using Welch’s method, with a specified window length and overlap, to obtain a smooth estimate of the power distribution across frequency bands (0–30 Hz). PSD data were used to compare baseline and LPS-treated conditions, with frequency bands of interest defined for detailed analysis.

2.3.4. Time–Frequency Analysis

Time–frequency analysis was conducted to examine changes in spectral power across different frequencies (0.1–12 Hz) over time, comparing baseline and LPS-treated conditions. LFP signals were analyzed using continuous wavelet transform (CWT) to decompose the signal into its time–frequency components. This approach provided a high-resolution view of spectral power variations across the 300 s time window. Power was averaged within frequency bands of interest, and the color intensity in the time–frequency plot represented power amplitude, with higher power shown in warmer colors.

2.4. Behavioral Assays

Mice were handled by the experimenter for at least three days prior to testing to ensure acclimation. Before each test, they were allowed to habituate to the testing room for 30 min. All behavioral chambers were cleaned with 75% ethanol between tests. To induce an immune challenge, mice were administered an intraperitoneal injection of 1 mg/kg lipopolysaccharide (LPS, Sigma, St. Louis, MO, USA), with saline used as a vehicle control. Behavioral assessments were conducted 24 h following the LPS or saline injection.

2.4.1. Open Field Test (OFT)

Mice were placed in the center of a 40 × 40 cm arena under dim lighting for 10 min. The central zone was defined as a 20 × 20 cm area within the arena. Movements were recorded with a video camera and analyzed using ANY-maze software (Version 7.35, Stoelting Co., Wood Dale, IL, USA). Total distance traveled was measured to assess locomotor activity, while time spent in the center was used as an indicator of anxiety-like behavior.

2.4.2. Elevated Plus Maze Test (EPM)

The maze consisted of four arms (two open and two closed) positioned 50 cm above the ground. Mice were placed at the center of the platform and allowed to explore freely for 5 min. Their positions were tracked using ANY-maze software, and anxiety-like behavior was assessed based on time spent in the open arms.

2.4.3. Tail-Suspension Test (TST)

The mouse tail was taped to a hook, suspending the animal approximately 30 cm above the surface in an upside-down position. The mice were video recorded for 6 min, and the immobility time during the last 4 min was manually counted offline by an observer who was blinded to the experimental conditions.

2.4.4. Forced Swim Test (FST)

Mice were individually placed in a transparent cylinder (12 cm diameter, 25 cm height) filled with water at 20–24 °C. The water depth was adjusted to prevent the mice from touching the bottom with their tails or hind limbs. Behavior was recorded from a side view under standard lighting. Immobility time during the final 4 min of the 6 min test was scored offline by an observer blinded to treatment. Immobility was defined as the time when the mouse floated without movement, except for the minimal motions required to maintain balance.

2.4.5. Sucrose Preference Test (SPT)

Mice were single-housed and acclimated to two 50 mL bottles of water for two days, with bottle positions switched daily to prevent side preference. After acclimation, one bottle was filled with water and the other with a 2% sucrose solution, and positions were swapped after 24 h. The bottles were weighed at several intervals to measure consumption. Sucrose preference was calculated as the ratio of sucrose solution intake to the total fluid intake over the two testing days.

2.5. Statistics and Data Visualization

Data visualization and statistical analyses were performed using MATLAB (version 2020b), GraphPad Prism 6, Python (version 3.8.10). Custom scripts were developed to process raw data, generate visualizations, and conduct statistical analyses for electrophysiological datasets. For all plots, mean values were calculated, and error bars represent the standard error of the mean (SEM). Statistical significance was tested using MATLAB’s built-in statistical functions, with significance levels set at * p < 0.05, ** p < 0.01, and *** p < 0.001, as appropriate. Animal behavior was recorded using a video camera and analyzed with ANY-maze software (Stoelting).

3. Results

3.1. Behavioral Validation of the LPS-Induced Acute Depression Model in Mice

Depression is a complex emotional disorder, and establishing animal models is crucial for understanding its pathophysiology and developing new treatments. In this study, we induced acute depressive-like behavior in mice by intraperitoneal injection of 1 mg/kg lipopolysaccharide (LPS). As a classic model of acute depression, LPS triggers an immune response within 24 h, leading to behavioral changes associated with depression. Previous studies have confirmed the effectiveness of this model in inducing significant depressive-like phenotypes—such as anxiety, anhedonia, and behavioral despair—without affecting basic motor functions [10,25].
To systematically and effectively assess LPS-induced depressive-like behaviors in mice, we conducted a series of behavioral tests 24 h after LPS injection, including the open field test (OFT), elevated plus maze (EPM), sucrose preference test (SPT), tail suspension test (TST), and forced swim test (FST). In the OFT (Figure 1b–d), which assesses spontaneous activity and anxiety-like behavior, the results showed no significant difference in the total distance traveled between the LPS-treated and control groups (Figure 1c), indicating unaffected locomotor ability. However, LPS-treated mice spent significantly less time in the center zone of the arena (Figure 1d, p < 0.01). Spending less time in the center suggests increased anxiety-like behavior and reduced exploratory activity, as mice naturally prefer the periphery of an open field to avoid potential threats [25].
The EPM further supported these findings. This test involves a plus-shaped apparatus elevated above the ground with two open arms and two closed arms. Mice with increased anxiety tend to spend more time in closed arms. LPS-treated mice spent significantly less time in the open arms compared to controls (Figure 1f, p < 0.05), reinforcing the presence of LPS-induced anxiety-like behavior. In the SPT, LPS-treated mice showed a significant reduction in sucrose intake (Figure 1h, p < 0.01), indicating an increase in anhedonia response, a core symptom of depression. Both the TST and FST are standard tests for assessing behavioral despair, analogous to feelings of helplessness in depression. In these tests, mice are placed in an inescapable but non-harmful situation (suspended by the tail in TST or placed in water in FST), and increased immobility time is interpreted as a measure of despair or resignation [25]. LPS-treated mice showed a significant increase in immobility time during both the TST and FST (Figure 1j,l, p < 0.05), reflecting enhanced helplessness- a key indicator of depressive-like behavior.

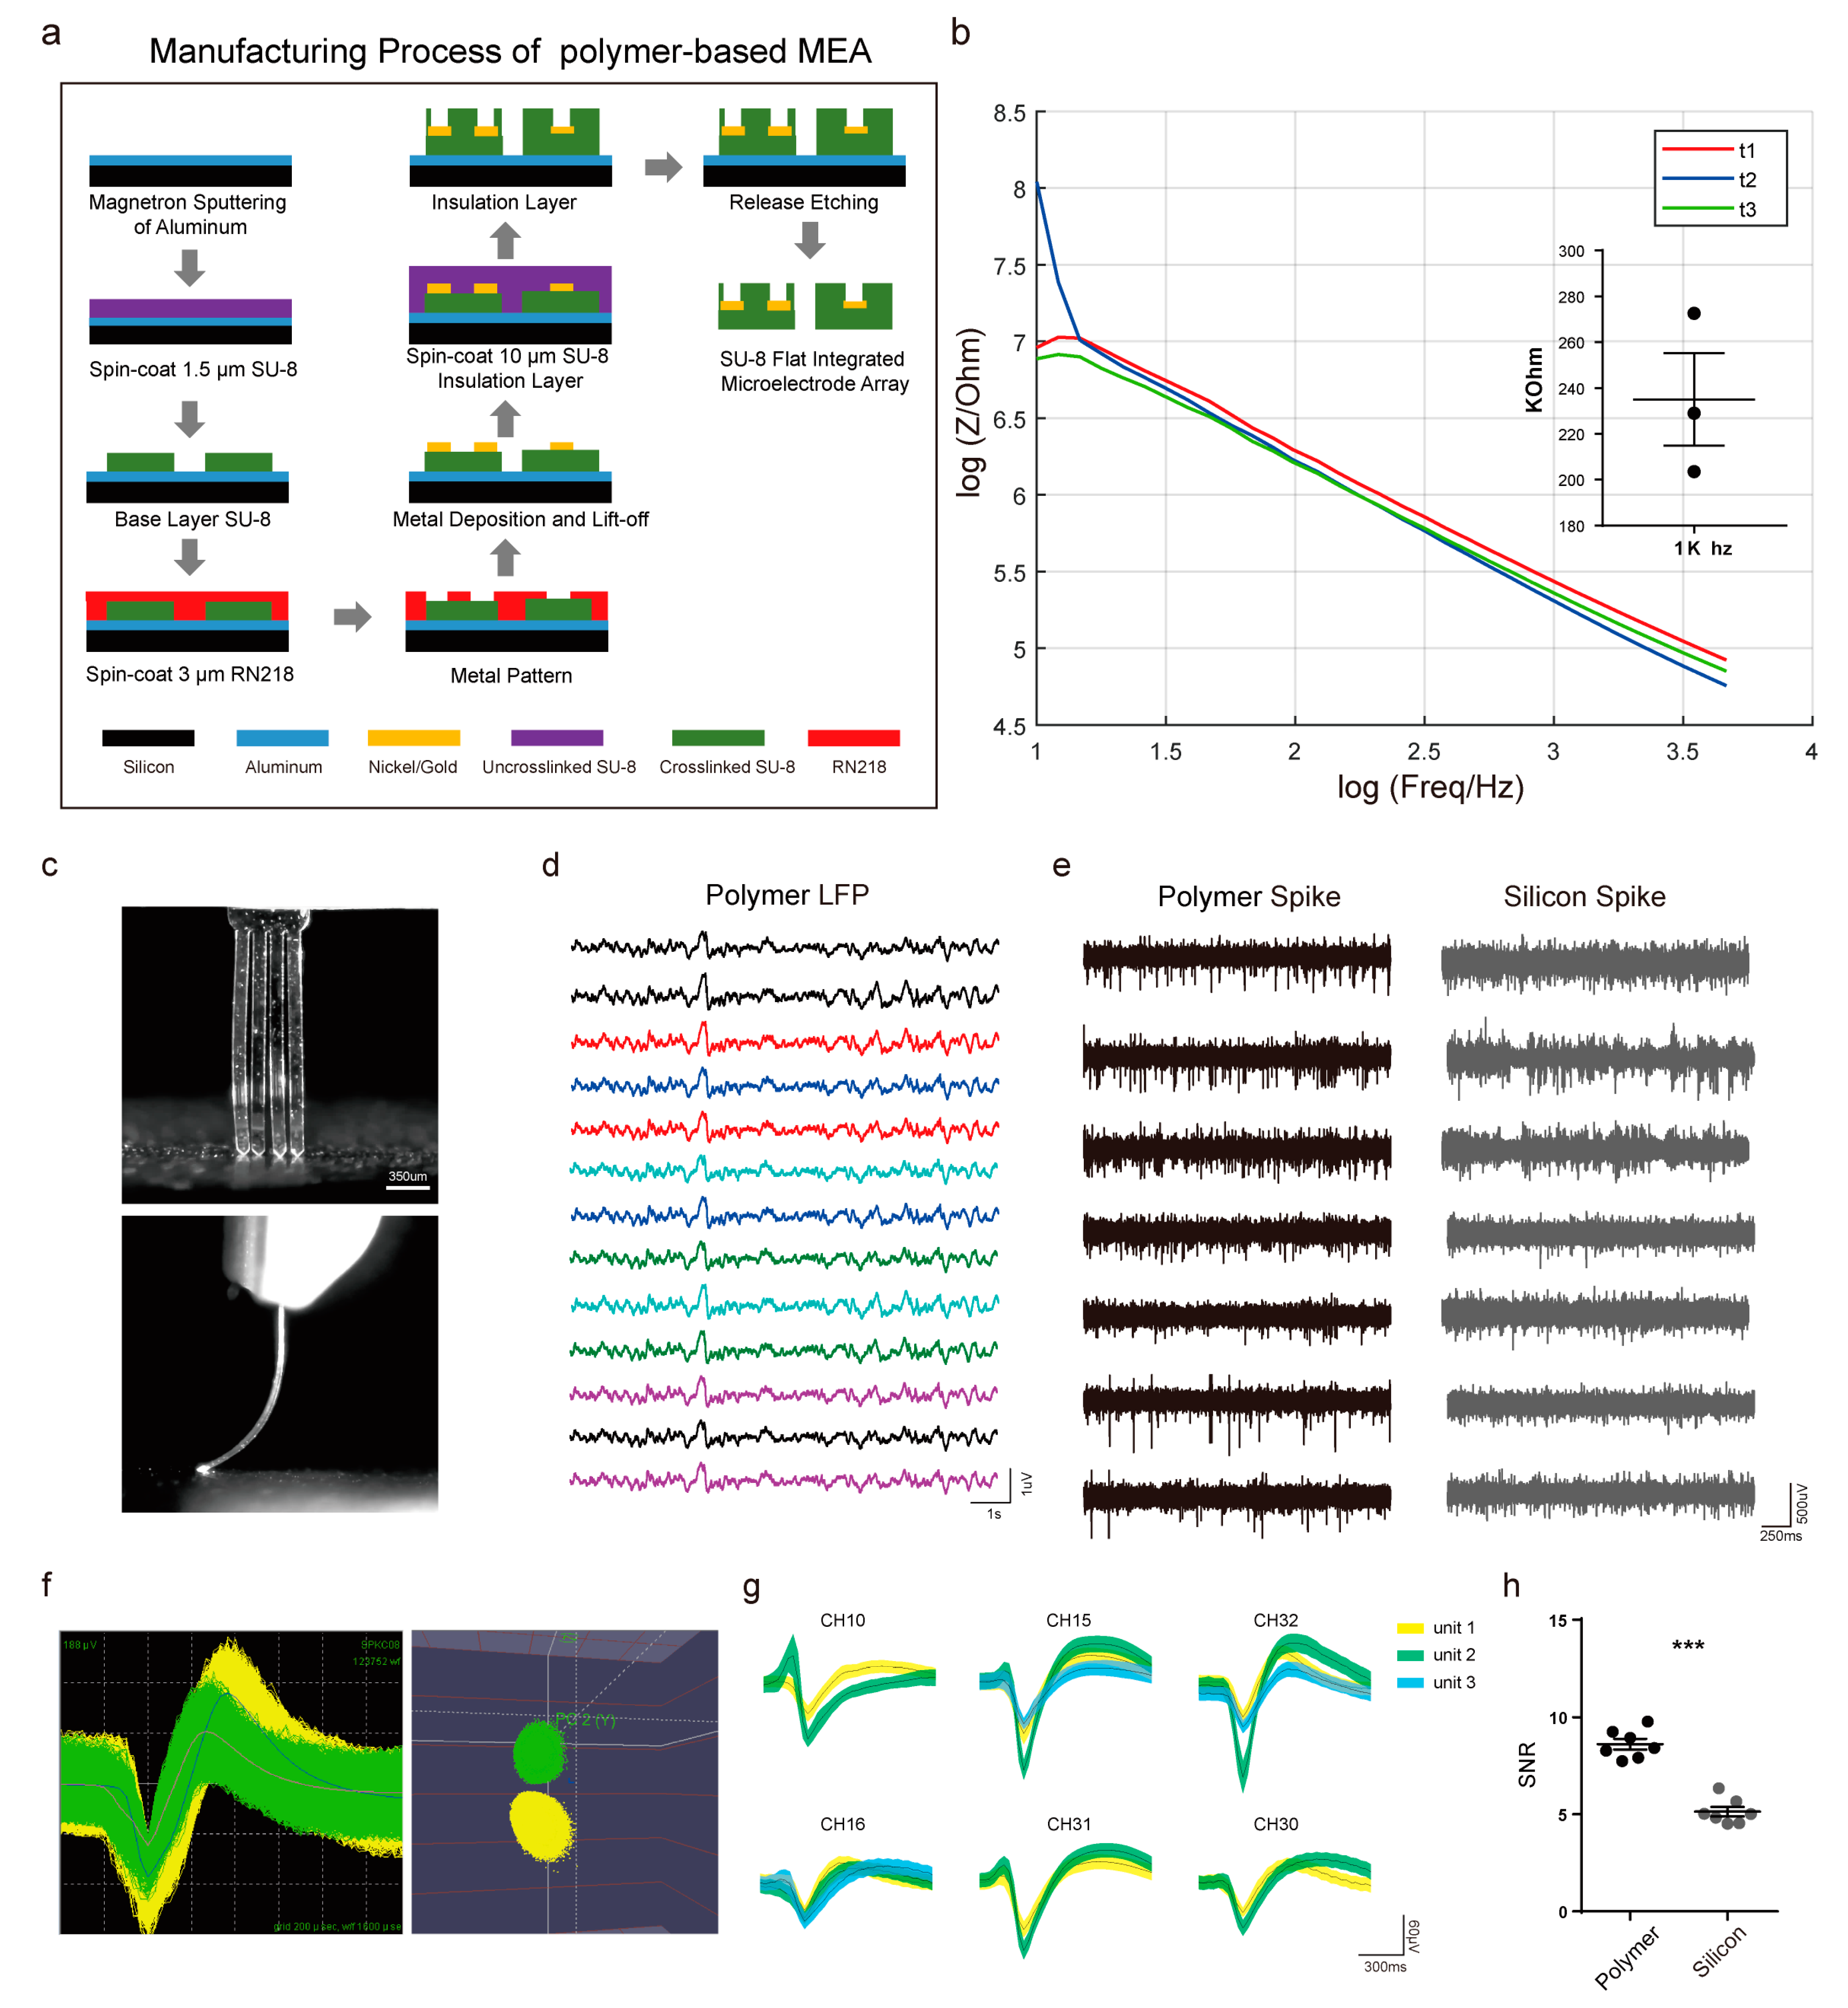
3.2. Fabrication and Performance Evaluation of Flexible Polymer Multichannel Electrodes

In this study, we designed and fabricated a flexible polymer-based multichannel microelectrode array to facilitate in vivo neural recordings. Compared to traditional rigid silicon electrodes, polymer-based flexible electrodes offer greater adaptability, allowing them to better conform to brain tissue, thereby minimizing potential tissue damage and achieving more stable, long-term recordings. Additionally, these polymer electrodes can be miniaturized and support higher channel density, making them suitable for compact, multichannel neural recording applications. The fabrication process (Figure 2a) includes aluminum sputtering, spin-coating of insulation and base layers, metal deposition and patterning, and final release etching to create a planar multichannel microelectrode array.
To evaluate the performance of the polymer electrodes, we conductedEIS testing (Figure 2b). Impedance was measured across a frequency range from 10 Hz to 5 kHz for three different electrodes (t1, t2, and t3) [21,22]. The results showed a gradual decrease in impedance as frequency increased, consistent with the expected capacitive behavior at the electrode–electrolyte interface. The impedance at 1 kHz is considered a standard parameter for evaluating neural electrode performance, as this frequency approximates the center of the neural signal power spectrum and reflects the electrode’s ability to detect neural activity while minimizing noise [21,23,24]. At the 1 kHz measurement point, the electrodes exhibited consistent impedance values, indicating reproducibility in the fabrication process and ensuring uniform performance across electrodes (Figure 2b).
We further assessed the effectiveness of the polymer electrodes in real neural recordings by capturing LFP and spike signals. Multichannel LFP recordings obtained using polymer electrodes (Figure 2d) show clear waveforms across all channels, indicating high sensitivity and low noise levels. Comparative analysis of spike recordings from polymer and traditional silicon electrodes reveals that polymer electrodes exhibit lower noise levels (Figure 2e) and significantly higher SNR (Figure 2h, *** p < 0.001). These findings highlight the superior performance of polymer electrodes in reducing interference from tissue displacement or motion artifacts and improving signal clarity in neural recordings.
The photographs of the flexible electrodes in a bent configuration are shown in both front and side views (Figure 2c). Typical spike waveforms and PCA clustering results (Figure 2f) demonstrate effective unit classification using polymer electrodes. Furthermore, multi-channel spike recordings reveal clear separation of units (Figure 2g), illustrating the capability of polymer electrodes for high-resolution electrophysiological recordings.

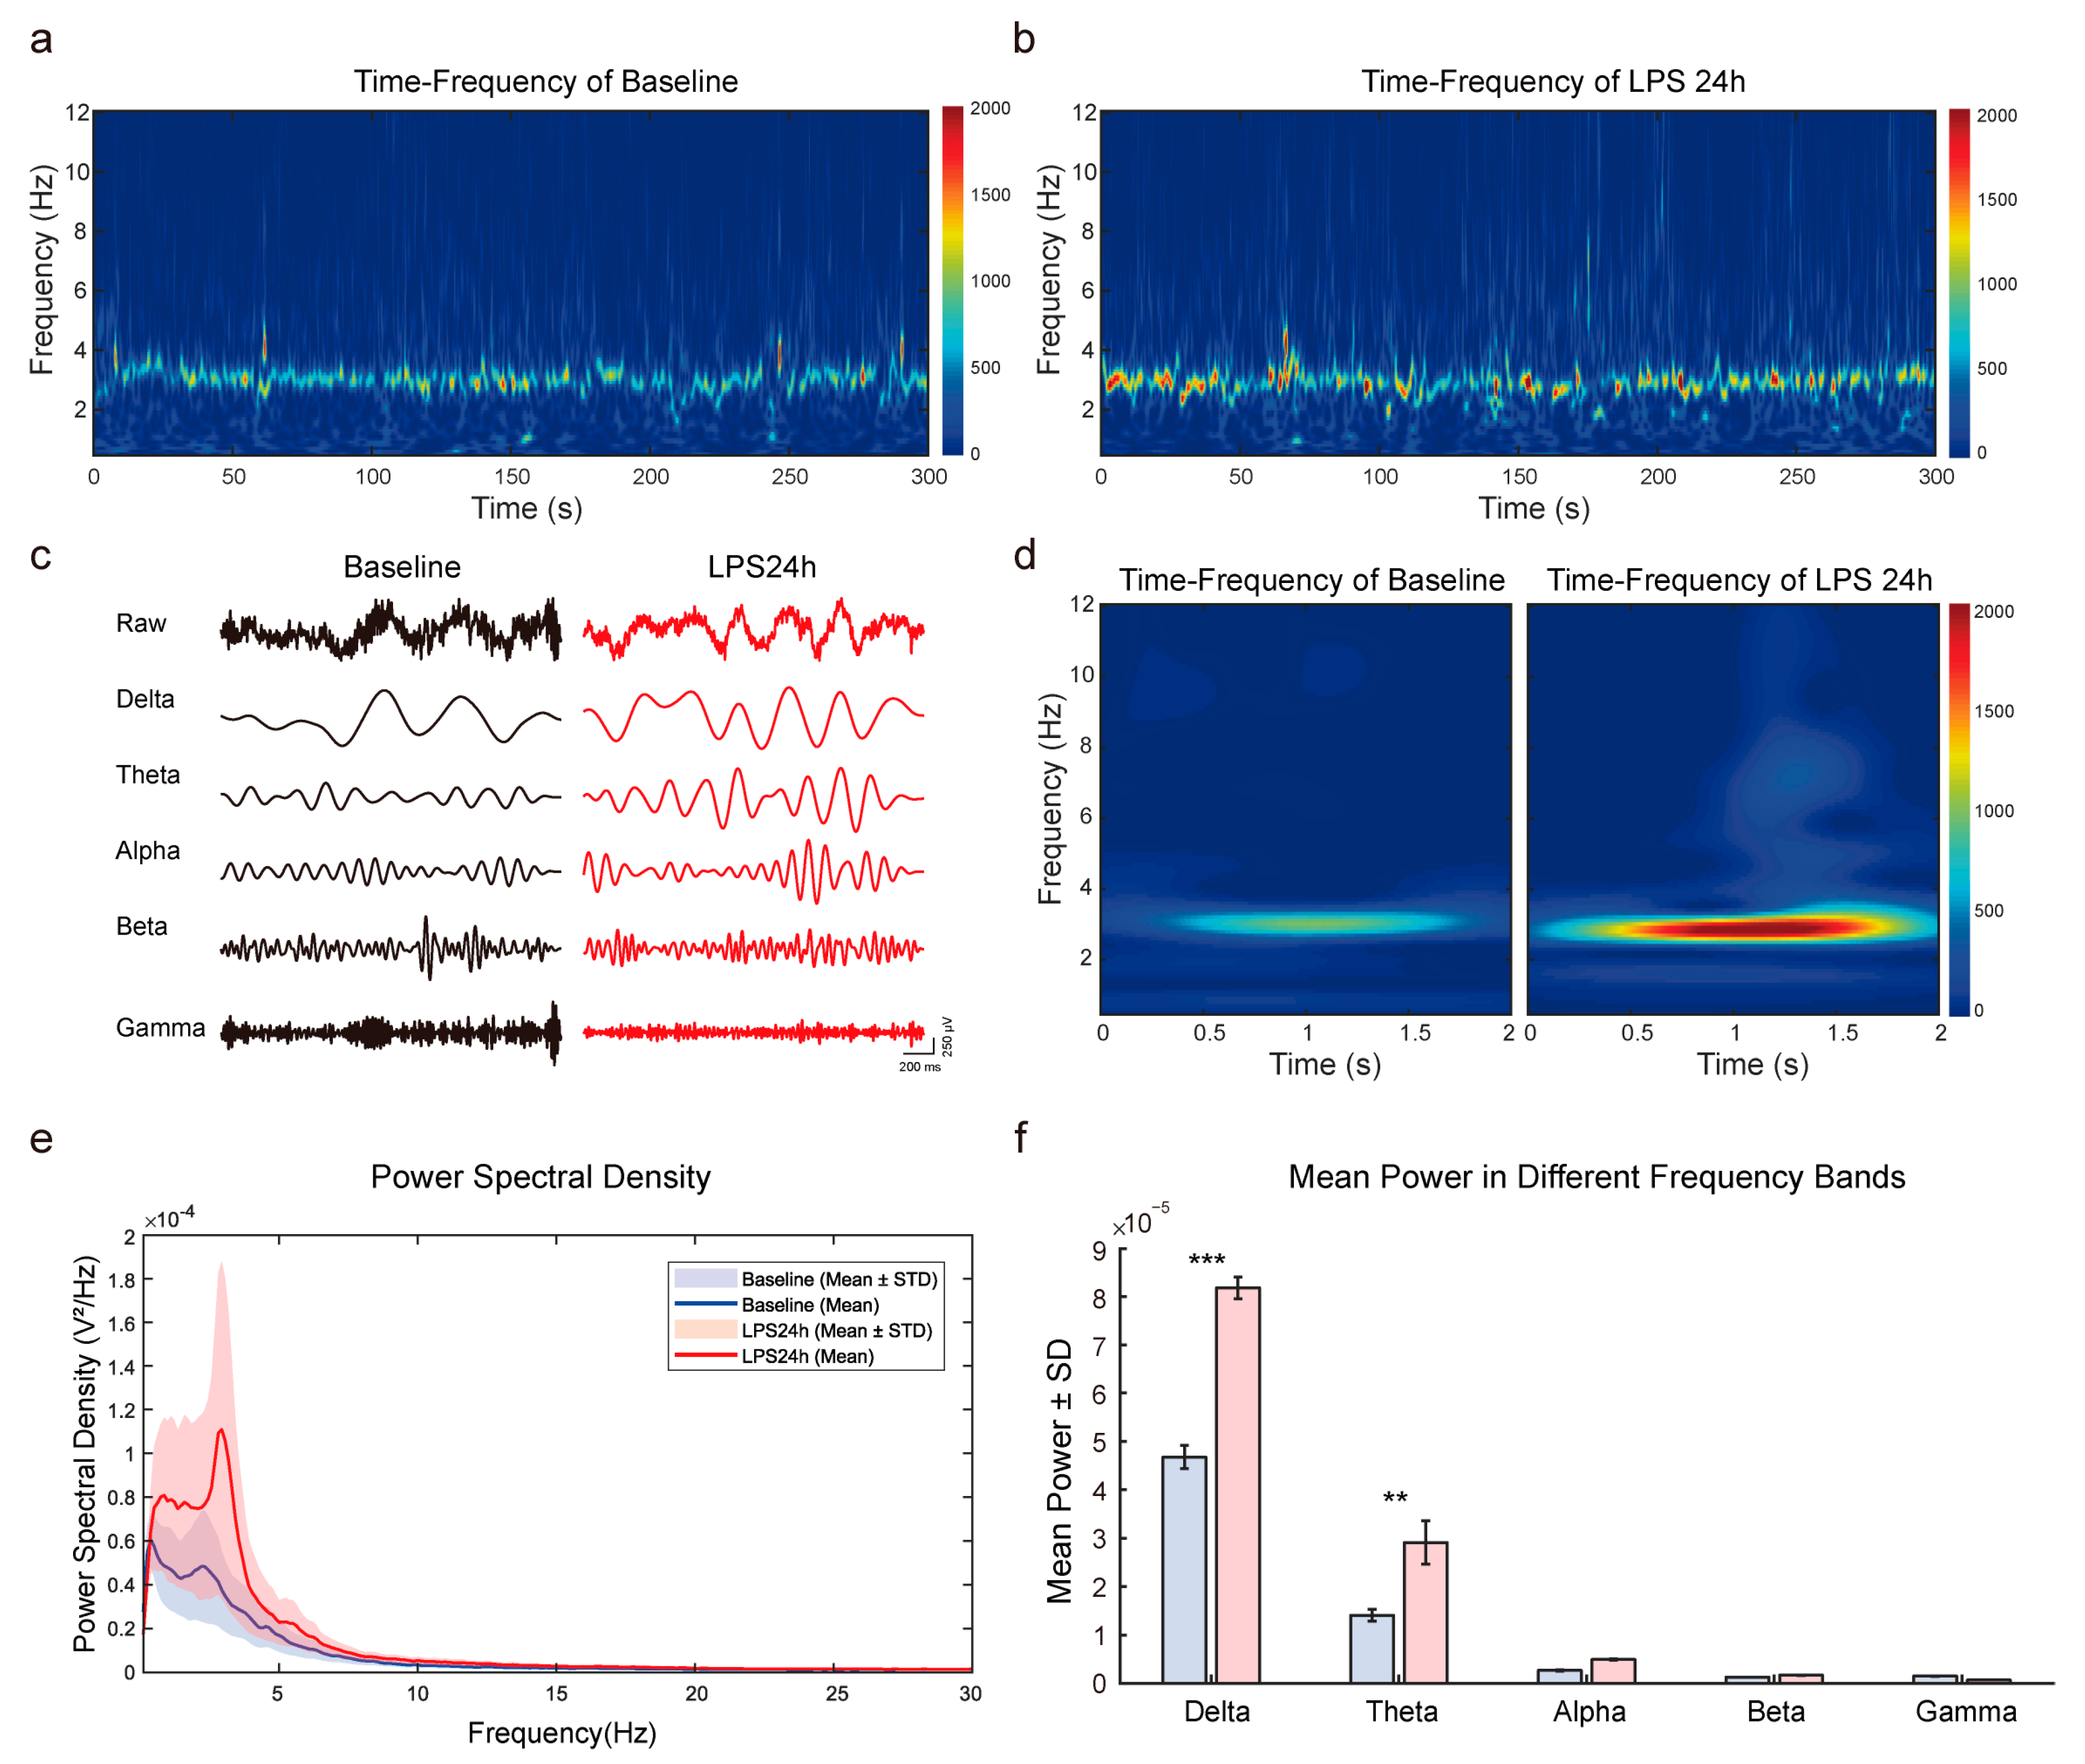
3.3. Enhanced Theta Oscillations in the mPFC of LPS-Induced Depressive Mice

To assess the impact of LPS-induced depressive states on neural activity in the mPFC of mice, we conducted time-frequency and spectral analyses of LFP signals under both normal and depressive conditions. A significant increase in power within the 0–12 Hz range was observed under depressive conditions (Figure 3a,b), particularly in the theta band (3–8 Hz), suggesting that LPS treatment impacts low-frequency neural oscillations, with enhanced theta activity likely reflecting alterations in emotional regulation.
Using band-pass filtering, we extracted the delta, theta, alpha, beta, and gamma frequency bands from the LFP signals (Figure 3c). Under depressive conditions, both delta and theta band amplitudes were elevated, with a pronounced increase in the theta band. Previous research has demonstrated that theta activity in the mPFC is associated with emotional and cognitive regulation [6,7,26]. In individuals with depression, enhanced theta activity in the mPFC may reflect increased emotional processing and cognitive demands [6,27]. Therefore, theta band activity is considered an important electrophysiological biomarker for emotional disorders, whereas delta band changes, though present, are more related to sleep and other brain states with less direct relevance to depression. Thus, our analysis primarily focused on changes in the theta band.
Further analysis of LFP signals at a higher resolution showed a significant increase in theta band amplitude under depressive conditions (Figure 3d). PSD analysis revealed a general increase in power within the 0–12 Hz range, with a pronounced enhancement in the theta band (Figure 3e). Statistical analysis of average power further confirmed this trend, showing a significant increase in theta power under depressive states (Figure 3f), suggesting a redistribution of neural activity associated with emotional regulation. Overall, LPS-induced depression led to enhanced theta activity, indicating altered neural network function in the mPFC related to emotional regulation.

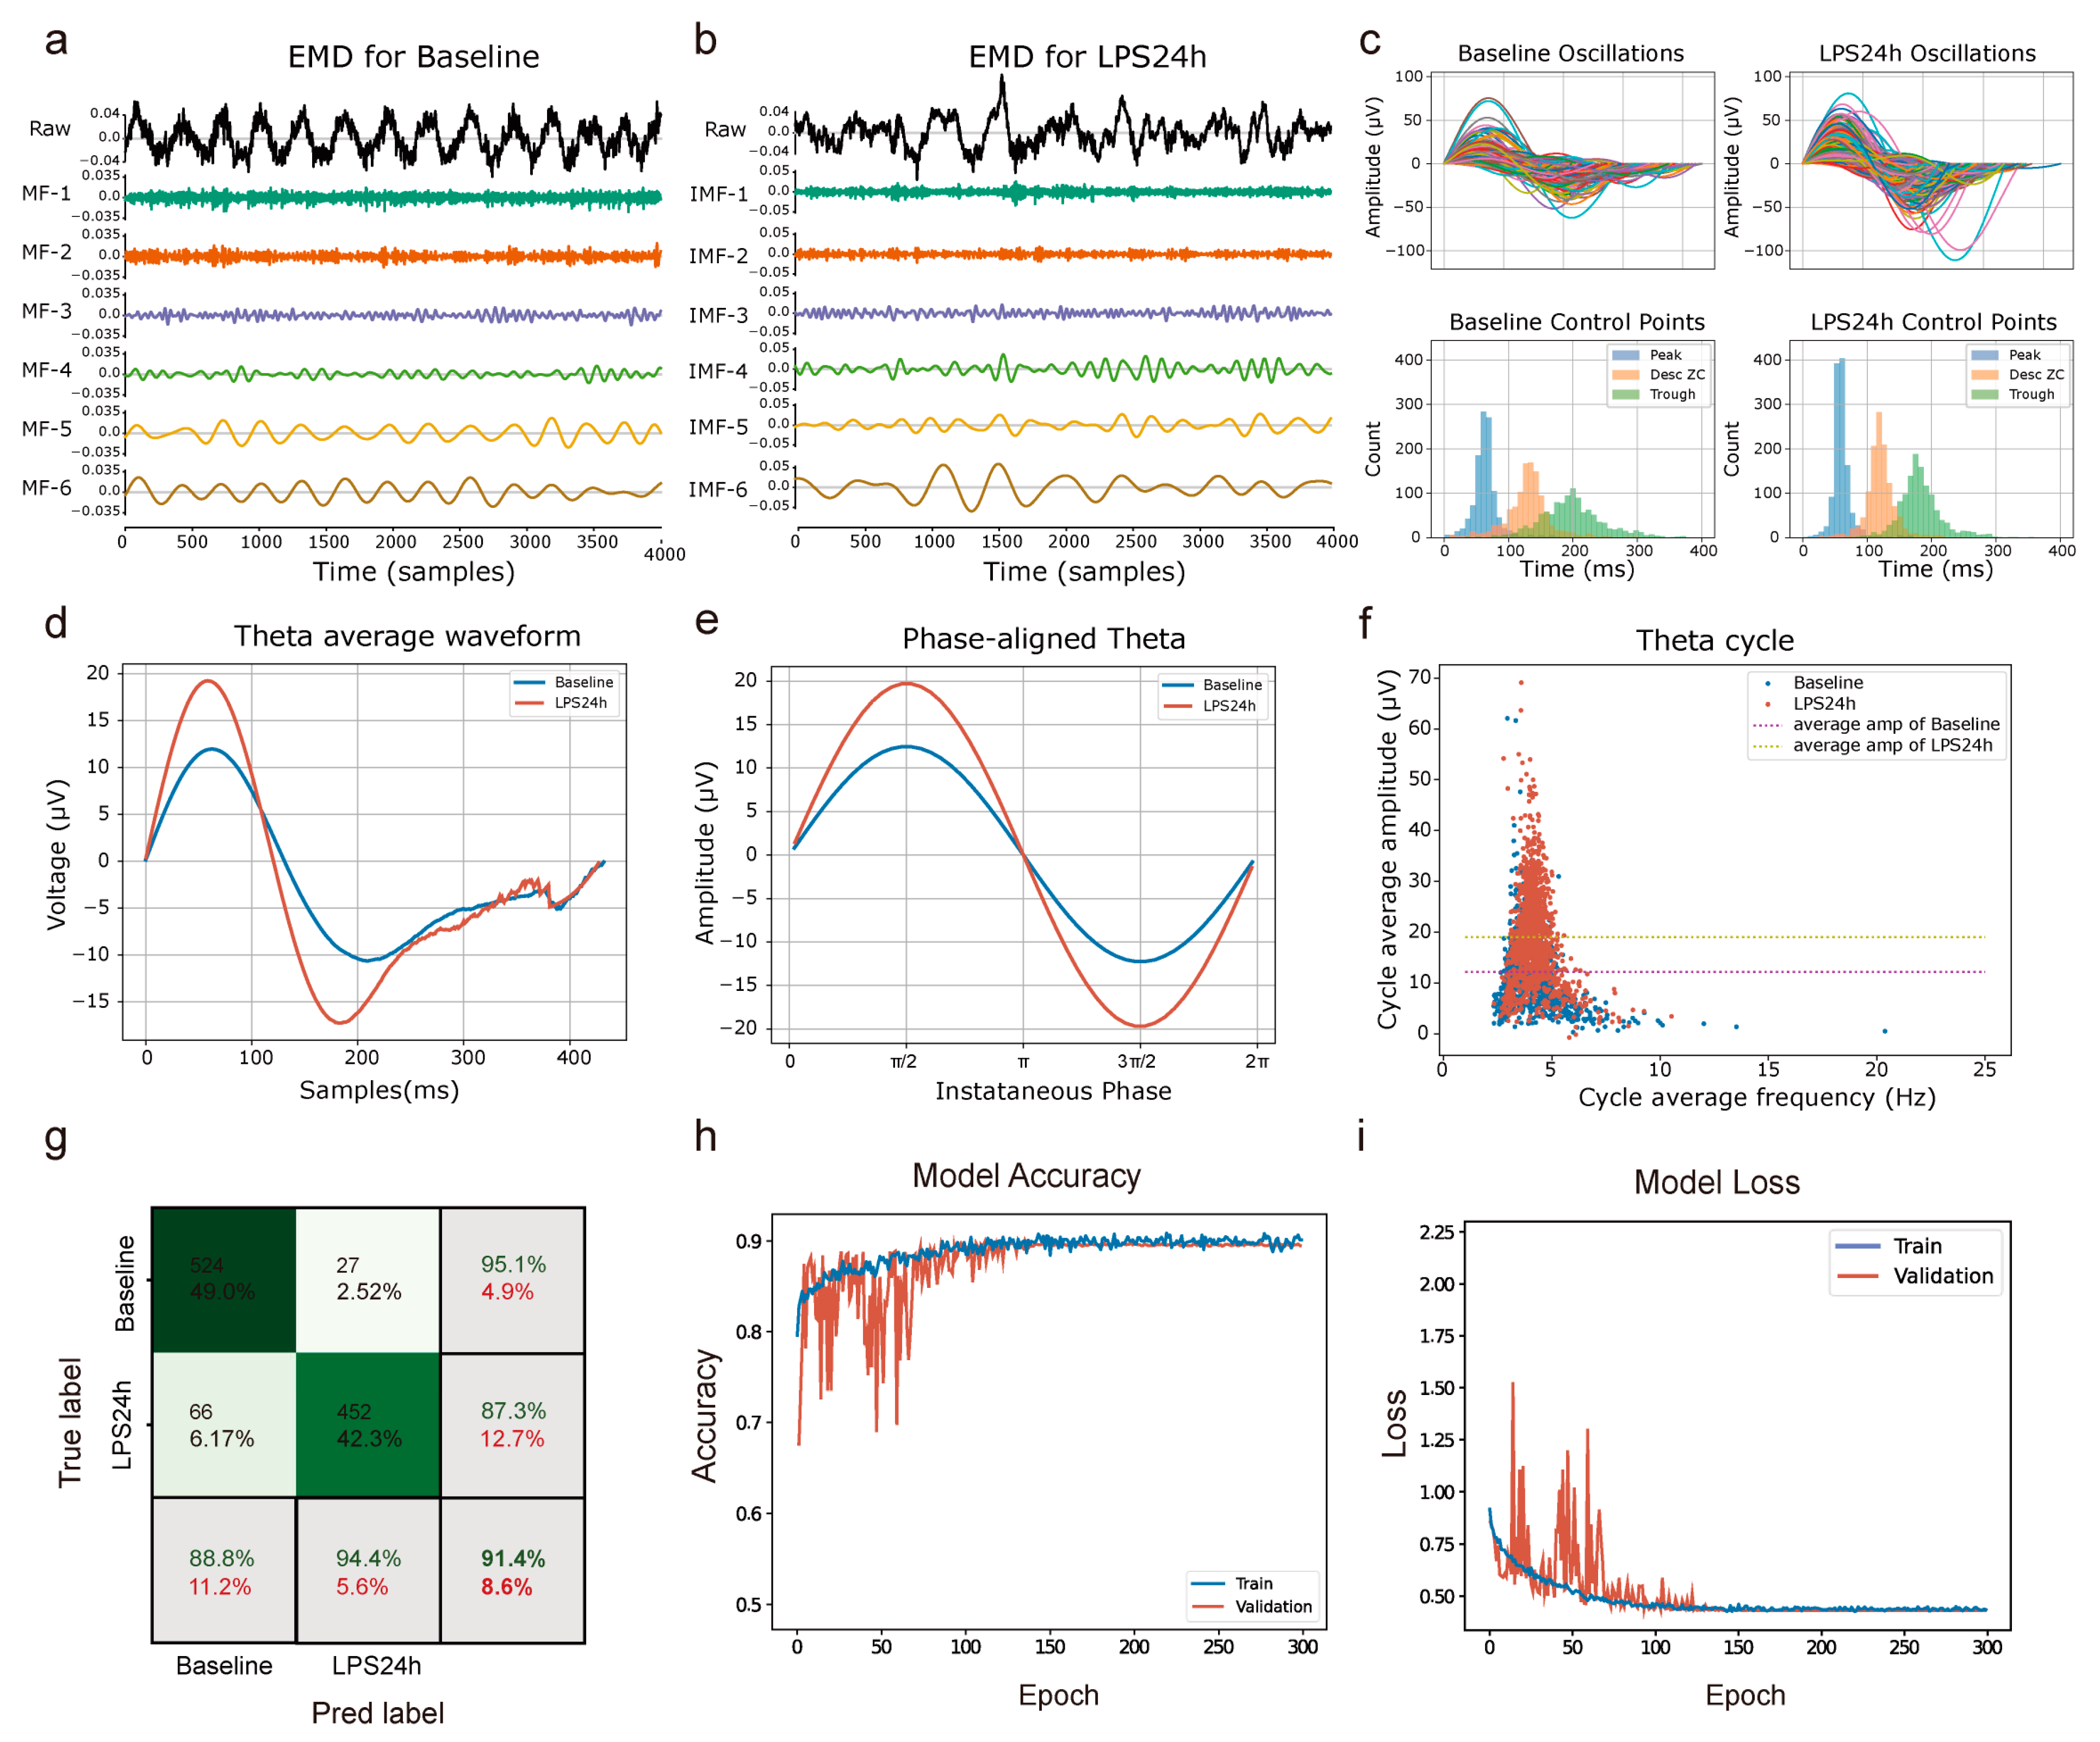
3.4. Depression State Recognition Based on EMD and CNN-LSTM Machine Learning Model

To further analyze the neural activity characteristics of the mPFC in depressive states, we applied EMD to the LFP signals. EMD, introduced by Norden E. Huang et al. in 1998, is a method for analyzing non-linear and nonstationary signals [19]. This adaptive decomposition method enables the breakdown of complex LFP signals (0–200 Hz) into different intrinsic mode functions (IMFs), allowing for better extraction of oscillatory features. In our study, the LFP signals were adaptively decomposed into multiple IMFs, among which IMF-5 effectively captured the characteristics of theta band oscillations (Figure 4a,b).
IMF-5 from 300-s segments of baseline and LPS24h conditions were divided by cycles for analysis. Overlaying all extracted cycles revealed significant differences in waveform shape and critical point distribution under depressive conditions (Figure 4c). The comparison of average theta waveforms across cycles and the phase alignment analysis both showed a significant increase in theta amplitude under depressive conditions, along with noticeable differences in waveform shape, highlighting the impact of depressive states on theta rhythms. The theta cycle average amplitude is higher compared to baseline, particularly at lower frequencies. The data points in the depressive state are more clustered in the higher amplitude range, highlighting increased theta oscillatory activity in the depressive state (Figure 4d–f).
To validate the efficacy of these theta waveform features in recognizing depressive states, we employed a CNN-LSTM neural network model. Unlike traditional machine learning algorithms, the CNN-LSTM model combines the advantages of convolutional neural networks (CNNs) and long short-term memory (LSTM) networks, providing both automatic feature extraction and handling of temporal sequence data. We segmented LFP signals from three mice into 2 s samples, generating 3600 samples, which were split into training and testing sets in a 7:3 ratio, with an additional 0.3 proportion of the training set randomly selected as a validation set. The trained model achieved a classification accuracy of 91.4% on the testing set (Figure 4g). Confusion matrix results indicated that the model achieved high accuracy in distinguishing between baseline and depressive states. The accuracy and loss curves for the training and validation sets (Figure 4h,i) further demonstrated good convergence and classification performance of the model.
In summary, this study successfully identified mPFC neural activity characteristics under depressive conditions through the combined use of EMD and CNN-LSTM, offering new insights for neural signal analysis in depression research.

4. Discussion

In this study, we systematically investigated the neural activity characteristics of the mPFC in an LPS-induced depression model in mice using custom-made flexible polymer multichannel electrodes, combined with LFP signal analysis and machine learning methods. Our results demonstrated significant depressive-like behavioral changes induced by LPS, such as increased immobility time in theFST and TST [10,11], as well as reduced sucrose preference in theSPT [28]. These behavioral indicators confirmed that LPS successfully induces a depressive-like phenotype, providing a foundation for subsequent neurophysiological analysis.
The flexible polymer electrodes used in this study exhibited several advantages over traditional silicon electrodes, including better tissue compatibility and reduced invasiveness, which facilitated high-quality, long-term recordings. Impedance measurements demonstrated consistent and low impedance across frequencies, enhancing the SNR for LFP and spike signals [16]. Compared to traditional rigid electrodes, polymer electrodes showed improved adaptability to tissue movement, which could help in reducing noise levels and improving the reliability of neural recordings [29]. However, it is important to note that further studies comparing specific parameters, such as long-term impedance stability and other mechanical properties, are necessary to comprehensively validate these findings.
Our neural signal analyses revealed significant alterations in theta band activity (3–8 Hz) under depressive conditions [30]. The theta oscillations showed enhanced amplitude, which aligns with previous studies that have linked depression to abnormalities in low-frequency oscillations, particularly in the mPFC [31,32]. Theta activity has been implicated in emotional and cognitive regulation, and changes in its amplitude and synchrony are thought to reflect disruptions in these functions. The increase in theta power observed under depressive conditions suggests that the mPFC undergoes functional reorganization, potentially reflecting a heightened burden in processing emotional and cognitive tasks during depressive states.
Previous studies have demonstrated that altered theta oscillations are associated with impaired cognitive and emotional regulation in depression. Theta rhythms, particularly in the mPFC, are thought to play a key role in the coordination of neural networks responsible for emotional processing. The observed increase in theta power under depressive conditions is consistent with findings from both human and animal studies, which have reported enhanced theta activity in depressive patients and animal models, potentially as a compensatory mechanism to manage increased emotional and cognitive loads [33,34]. Despite changes in the delta band also being observed, these are generally more closely associated with sleep and pathological states rather than directly linked to emotional regulation, which is why our analysis primarily focused on theta activity [35].
Through EMD, IMF-5 was identified as the component representing theta oscillations. The CNN-LSTM model was employed to classify depressive and normal states based on theta features, achieving high classification accuracy. The selection of CNN-LSTM for this purpose was motivated by its ability to leverage both local feature extraction (via CNN) and temporal sequence learning (via LSTM). This approach provides a robust method for recognizing subtle temporal dynamics in neural signals that are indicative of depressive states. The combination of EMD and CNN-LSTM modeling offers a novel approach to understanding and classifying neural changes in depression, demonstrating its effectiveness in phenotype identification [36].
Our findings highlight the importance of theta oscillations as potential electrophysiological markers for depression [37,38]. Enhanced theta activity in the mPFC may reflect neural network dysfunctions related to emotional regulation. Future research should explore theta rhythm coupling mechanisms across different brain regions to further elucidate the role of network-wide theta synchrony in depression [39]. Understanding the interplay between theta oscillations in the mPFC and other brain regions could provide insights into the broader neural network alterations that underpin depressive disorders, offering potential targets for therapeutic intervention.

Author Contributions

R.S.: Conceptualization, study design, experiment execution, data analysis, figure preparation, manuscript writing, editing, and overall project management. S.S.: EMD and CNN analysis, editing, and manuscript revision. Q.Y.: Electrode fabrication and production, editing, and manuscript revision. P.W. and L.Z.: Supervision, project administration, and critical manuscript revision. All authors have read and agreed to the published version of the manuscript.

Funding

This research was funded by the National Key Research and Development Project of China (No. 2021YFF1200803), National Natural Science Foundation of China (No. 82330064, 62271443, 32250008).

Institutional Review Board Statement

All animal procedures were conducted in accordance with Zhejiang University’s guidelines for the care and use of laboratory animals, with protocols approved by the Zhejiang University Animal Experimentation Committee (Approval No. ZJU20240774).

Informed Consent Statement

Not applicable.

Data Availability Statement

The raw data supporting the conclusions of this article will be made available by the authors on request.

Acknowledgments

I extend my sincere gratitude to Qunchen Yuan for his invaluable assistance in fabricating flexible polymer-based electrodes and conducting experimental tests. I also wish to thank Shunuo Shang, Yingqian Shi, and Yan Duan for their significant contributions to code development and data analysis. Furthermore, I am deeply grateful to Yi Zhu, Chunyue Li, and Hong Lian for their continuous support in both my academic endeavors and personal life.

Conflicts of Interest

The authors declare no conflicts of interest.

References

  1. Malhi, G.S.; Mann, J.J. Depression. Lancet 2018, 392, 2299–2312. [Google Scholar] [CrossRef] [PubMed]
  2. Marwaha, S.; Palmer, E.; Suppes, T.; Cons, E.; Young, A.H.; Upthegrove, R. Novel and emerging treatments for major depression. Lancet 2023, 401, 141–153. [Google Scholar] [CrossRef] [PubMed]
  3. Zhang, X.; Qiao, Y.; Wang, M.; Liang, X.; Zhang, M.; Li, C.; Cairang, J.; Wang, J.; Bi, H.; Gao, T. The influence of genetic and acquired factors on the vulnerability to develop depression: A review. Biosci. Rep. 2023, 43, BSR20222644. [Google Scholar] [CrossRef] [PubMed]
  4. Smart, O.L.; Tiruvadi, V.R.; Mayberg, H.S. Multimodal approaches to define network oscillations in depression. Biol. Psychiatry 2015, 77, 1061–1070. [Google Scholar] [CrossRef] [PubMed]
  5. Zheng, C.; Zhang, T. Alteration of phase-phase coupling between theta and gamma rhythms in a depression-model of rats. Cogn. Neurodyn. 2013, 7, 167–172. [Google Scholar] [CrossRef]
  6. Hare, B.D.; Duman, R.S. Prefrontal cortex circuits in depression and anxiety: Contribution of discrete neuronal populations and target regions. Mol. Psychiatry 2020, 25, 2742–2758. [Google Scholar] [CrossRef]
  7. Csicsvari, J.; Hirase, H.; Czurkó, A.; Mamiya, A.; Buzsáki, G. Oscillatory coupling of hippocampal pyramidal cells and interneurons in the behaving Rat. J. Neurosci. 1999, 19, 274–287. [Google Scholar] [CrossRef]
  8. Kumar, S.; Black, S.J.; Hultman, R.; Szabo, S.T.; DeMaio, K.D.; Du, J.; Katz, B.M.; Feng, G.; Herbert, E.C., III; Dzirasa, K. Cortical control of affective networks. J. Neurosci. 2013, 33, 1116–1129. [Google Scholar] [CrossRef]
  9. Sun, Y.; Giacobbe, P.; Tang, C.W.; Barr, M.S.; Rajji, T.; Kennedy, S.H.; Fitzgerald, P.B.; Lozano, A.M.; Wong, W.; Daskalakis, Z.J. Deep Brain Stimulation Modulates Gamma Oscillations and Theta-Gamma Coupling in Treatment Resistant Depression. Brain Stimul. 2015, 8, 1033–1042. [Google Scholar] [CrossRef]
  10. Dantzer, R.; O’connor, J.C.; Freund, G.G.; Johnson, R.W.; Kelley, K.W. From inflammation to sickness and depression: When the immune system subjugates the brain. Nat. Rev. Neurosci. 2008, 9, 46–56. [Google Scholar] [CrossRef]
  11. O’Connor, J.C.; Lawson, M.A.; Andre, C.; Moreau, M.; Lestage, J.; Castanon, N.; Kelley, K.W.; Dantzer, R. Lipopolysaccharide-induced depressive-like behavior is mediated by indoleamine 2,3-dioxygenase activation in mice. Mol. Psychiatry 2009, 14, 511–522. [Google Scholar] [CrossRef] [PubMed]
  12. Normann, R.A.; Fernandez, E. Clinical applications of penetrating neural interfaces and Utah Electrode Array technologies. J. Neural Eng. 2016, 13, 061003. [Google Scholar] [CrossRef] [PubMed]
  13. Kipke, D.R.; Shain, W.; Buzsáki, G.; Fetz, E.; Henderson, J.M.; Hetke, J.F.; Schalk, G. Advanced Neurotechnologies for Chronic Neural Interfaces: New Horizons and Clinical Opportunities. J. Neurosci. 2008, 28, 11830–11838. [Google Scholar] [CrossRef] [PubMed]
  14. Zorzos, A.N.; Boyden, E.S.; Fonstad, C.G. Multiwaveguide implantable probe for light delivery to sets of distributed brain targets. Opt. Lett. 2010, 35, 4133–4135. [Google Scholar] [CrossRef]
  15. Jeong, J.W.; Yeo, W.H.; Akhtar, A.; Norton, J.J.; Kwack, Y.J.; Li, S.; Jung, S.Y.; Su, Y.; Lee, W.; Xia, J.; et al. Materials and optimized designs for human-machine interfaces via epidermal electronics. Adv. Mater. 2013, 25, 6839–6846. [Google Scholar] [CrossRef]
  16. Kim, D.H.; Viventi, J.; Amsden, J.J.; Xiao, J.; Vigeland, L.; Kim, Y.S.; Blanco, J.A.; Panilaitis, B.; Frechette, E.S.; Contreras, D.; et al. Dissolvable films of silk fibroin for ultrathin conformal bio-integrated electronics. Nat. Mater. 2010, 9, 511–517. [Google Scholar] [CrossRef]
  17. Luan, L.; Wei, X.; Zhao, Z.; Siegel, J.J.; Potnis, O.; Tuppen, C.A.; Lin, S.; Kazmi, S.; Fowler, R.A.; Holloway, S.; et al. Ultraflexible nanoelectronic probes form reliable, glial scar-free neural integration. Sci. Adv. 2017, 3, e1601966. [Google Scholar] [CrossRef]
  18. Kozai TD, Y.; Langhals, N.B.; Patel, P.R.; Deng, X.; Zhang, H.; Smith, K.L.; Lahann, J.; Kotov, N.A.; Kipke, D. Ultrasmall implantable composite microelectrodes with bioactive surfaces for chronic neural interfaces. Nat. Mater 2012, 11, 1065–1073. [Google Scholar] [CrossRef]
  19. Quinn, A.J.; Lopes-dos-Santos, V.; Dupret, D.; Nobre, A.C.; Woolrich, M.W. EMD: Empirical Mode Decomposition and Hilbert-Huang Spectral Analyses in Python. J. Open Source Softw. 2021, 6, 2977. [Google Scholar] [CrossRef]
  20. Okonogi, T.; Sasaki, T. Theta-Range Oscillations in Stress-Induced Mental Disorders as an Oscillotherapeutic Target. Front. Behav. Neurosci. 2021, 15, 698753. [Google Scholar] [CrossRef]
  21. Ward, M.P.; Rajdev, P.; Ellison, C.; Irazoqui, P.P. Toward a comparison of microelectrodes for acute and chronic recordings. Brain Res. 2009, 1282, 183–200. [Google Scholar] [CrossRef] [PubMed]
  22. Guo, L. (Ed.) Recording Electrodes. In Principles of Electrical Neural Interfacing: A Quantitative Approach to Cellular Recording and Stimulation; Springer International Publishing: Berlin/Heidelberg, Germany, 2022; pp. 17–31. [Google Scholar]
  23. Neto, J.P.; Baião, P.; Lopes, G.; Frazão, J.; Nogueira, J.; Fortunato, E.; Barquinha, P.; Kampff, A.R. Does Impedance Matter When Recording Spikes With Polytrodes? Front. Neurosci. 2018, 12, 715. [Google Scholar] [CrossRef] [PubMed]
  24. Nam, Y. Material considerations for in vitro neural interface technology. MRS Bull. 2012, 37, 566–572. [Google Scholar] [CrossRef]
  25. Sun, R.; Tang, M.Y.; Yang, D.; Zhang, Y.Y.; Xu, Y.H.; Qiao, Y.; Yu, B.; Cao, S.X.; Wang, H.; Huang, H.Q. C3aR in the medial prefrontal cortex modulates the susceptibility to LPS-induced depressive-like behaviors through glutamatergic neuronal excitability. Prog. Neurobiol. 2024, 236, 102614. [Google Scholar] [CrossRef] [PubMed]
  26. Rho, Y.-A.; Sherfey, J.; Vijayan, S. Emotional Memory Processing during REM Sleep with Implications for Post-Traumatic Stress Disorder. J. Neurosci. 2023, 43, 433–446. [Google Scholar] [CrossRef]
  27. Zhang, W.; Liu, W.; Liu, S.; Su, F.; Kang, X.; Ke, Y.; Ming, D. Altered fronto-central theta-gamma coupling in major depressive disorder during auditory steady-state responses. Clin. Neurophysiol. 2023, 146, 65–76. [Google Scholar] [CrossRef]
  28. Porsolt, R.D. Behavioral Despair Revisited—A Citation-Classic Commentary on Depression—A New Animal-Model Sensitive to Antidepressant Treatments; Porsolt, R.D., Lepichon, M., Jalfre, M., Eds.; Institute For Scientific Information: Philadelphia, PA, USA, 1993; Volume 20, p. 9. [Google Scholar]
  29. Khodagholy, D.; Gelinas, J.N.; Thesen, T.; Doyle, W.; Devinsky, O.; Malliaras, G.G.; Buzsáki, G. NeuroGrid: Recording action potentials from the surface of the brain. Nat. Neurosci. 2015, 18, 310–315. [Google Scholar] [CrossRef]
  30. Mitchell, D.J.; McNaughton, N.; Flanagan, D.; Kirk, I.J. Frontal-midline theta from the perspective of hippocampal “theta”. Prog. Neurobiol. 2008, 86, 156–185. [Google Scholar] [CrossRef]
  31. Knyazev, G.G. Motivation, emotion, and their inhibitory control mirrored in brain oscillations. Neurosci. Biobehav. Rev. 2007, 31, 377–395. [Google Scholar] [CrossRef]
  32. Olbrich, S.; Arns, M. EEG biomarkers in major depressive disorder: Discriminative power and prediction of treatment response. Int. Rev. Psychiatry 2013, 25, 604–618. [Google Scholar] [CrossRef]
  33. LeCun, Y.; Bengio, Y.; Hinton, G. Deep learning. Nature 2015, 521, 436–444. [Google Scholar] [CrossRef] [PubMed]
  34. Wang, J.; Redmond, S.J.; Bertoux, M.; Hodges, J.R.; Hornberger, M. A Comparison of Magnetic Resonance Imaging and Neuropsychological Examination in the Diagnostic Distinction of Alzheimer’s Disease and Behavioral Variant Frontotemporal Dementia. Front. Aging Neurosci. 2016, 7, 119. [Google Scholar] [CrossRef] [PubMed]
  35. Canolty, R.T.; Knight, R.T. The functional role of cross-frequency coupling. Trends Cogn. Sci. 2010, 14, 506–515. [Google Scholar] [CrossRef] [PubMed]
  36. Buzsaki, G.; Draguhn, A. Neuronal oscillations in cortical networks. Science 2004, 304, 1926–1929. [Google Scholar] [CrossRef]
  37. Bland, B.H.; Oddie, S.D. Theta band oscillation and synchrony in the hippocampal formation and associated structures: The case for its role in sensorimotor integration. Behav. Brain Res. 2001, 127, 119–136. [Google Scholar] [CrossRef]
  38. Jacobs, J.; Hwang, G.; Curran, T.; Kahana, M.J. EEG oscillations and recognition memory: Theta correlates of memory retrieval and decision making. Neuroimage 2006, 32, 978–987. [Google Scholar] [CrossRef]
  39. Fell, J.; Axmacher, N. The role of phase synchronization in memory processes. Nat. Rev. Neurosci. 2011, 12, 105–118. [Google Scholar] [CrossRef]
Figure 1. Behavioral assessment of depressive-like symptoms in mice following LPS injection. (a) Experimental timeline depicting saline or LPS injection, followed by behavioral tests at 24 h post-injection. (bd) Open field test (OFT): (c) total distance traveled, and (d) time spent in the center zone. (e,f) Elevated plus maze (EPM): time spent in the open arms. (g,h) Sucrose preference test (SPT): percentage of sucrose preference. (i,j) Tail suspension test (TST): immobility time significantly increased in the LPS group. (k,l) Forced swim test (FST): immobility time significantly increased in the LPS group. All data are presented as means ± s.e.m. * p < 0.05; ** p < 0.01; n.s., no significance.
Chemosensors 12 00258 g001
Figure 2. Manufacturing and performance evaluation of MEA. (a) Schematic of the manufacturing process for MEA. (b) Impedance frequency sweep results of three electrodes (t1, t2, t3); inset shows the average impedance at 1 kHz. (c) Top: front view of the electrode demonstrating its flexibility; Bottom: side view showing the electrode bending. (d) LFP signals recorded using polymer electrodes, with consistent signals across different channels. (e) Comparison of neural spike signals recorded by polymer and silicon electrodes. (f) Spike waveforms recorded by polymer electrodes and PCA clustering results. (g) Spike waveforms from six channels, with different colors representing distinct unit clusters identified through clustering. (h) SNR comparison between polymer and silicon electrodes; SNR of polymer electrodes is significantly higher than that of silicon electrodes (*** p < 0.001).
Chemosensors 12 00258 g002
Figure 3. Enhanced theta oscillations in the mPFC of LPS-induced depressive mice. (a,b) Time–frequency representations of LFP signals in the mPFC, comparing (a) baseline and (b) LPS conditions over a 300 s period in the 0–12 Hz frequency range. (c) Raw signals and band-pass filtered LFP signals under baseline (left) and LPS (right) conditions. (d) High-resolution 2 s time-frequency spectrograms in the 0–12 Hz range for baseline (left) and LPS (right) conditions. (e) PSD comparison plot (0–30 Hz). (f) Mean power across different frequency bands, with significantly elevated power in the delta and theta bands in the LPS-treated depressive group (p < 0.01). All data are presented as means ± s.e.m. ** p < 0.01; *** p < 0.001; n.s., no significance.
Chemosensors 12 00258 g003
Figure 4. Depression state recognition based on EMD and machine learning. (a,b) EMD of LFP signals in baseline and LPS24h depression states in 4s, yielding multiple IMFs, with IMF-5 adaptively capturing theta band oscillations. (c) Averaged overlay of theta cycle waveforms (top) and distribution histogram of critical points (bottom) extracted through EMD, based on data collected within 300 s. (d) Comparison of averaged theta waveforms between the two states. (e) Phase-aligned theta waveforms. (f) Scatter plot of cycle average frequency versus average amplitude. (g) Confusion matrix of the machine learning classification model based on theta waveform features. (h,i) Classification accuracy and loss curves for the machine learning model on the training and validation sets.
Chemosensors 12 00258 g004
Disclaimer/Publisher’s Note: The statements, opinions and data contained in all publications are solely those of the individual author(s) and contributor(s) and not of MDPI and/or the editor(s). MDPI and/or the editor(s) disclaim responsibility for any injury to people or property resulting from any ideas, methods, instructions or products referred to in the content.

