Article

Sensitive and Reversible Ammonia Gas Sensor Based on Single-Walled Carbon Nanotubes

1
Division of Natural Sciences, Technology and Environment, Universidad Ana G. Méndez-Cupey Campus, San Juan, PR 00926, USA
2
Nanomaterials Research Group, Department of Natural Sciences and Technology, Division of Natural Sciences, Technology and Environment, Universidad Ana G. Méndez-Gurabo Campus, Gurabo, PR 00778, USA
3
Department of Applied Physics, Autonomous University of Madrid and Instituto de Ciencia de Materiales Nicolás Cabrera, 28049 Madrid, Spain
4
IFToMM-ARoTMM, Bucharest Polytechnic University, 060042 Bucharest, Romania
*
Authors to whom correspondence should be addressed.
Chemosensors 2023, 11(4), 247; https://doi.org/10.3390/chemosensors11040247
Submission received: 16 March 2023 / Revised: 8 April 2023 / Accepted: 14 April 2023 / Published: 16 April 2023

Abstract

:
The present study reports on the fabrication and performance of ammonia sensors based on single-walled carbon nanotubes (SWCNTs) coated with gold nanoparticles (AuNPs). The AuNPs were incorporated onto the SWCNTs using two different methods: sputtering and chemical deposition. The sensors were exposed to controlled concentrations of ammonia at two temperatures, namely, 25 °C and 140 °C, and their response was monitored through successive cycles of ammonia exposure (0.5 ppm and 1.0 ppm) and nitrogen purging. The results demonstrate that the sputtering-based deposition of the AuNPs on SWCNTs led to the best sensor performance, characterized by a rapid increase in resistance values (tresp = 12 s) upon exposure to ammonia and an efficient recovery at 140 °C (trec = 52 s). By contrast, the sensor with chemically impregnated AuNPs exhibited a slower response time (tresp = 25 s) and the same recovery time (trec = 52 s). Additionally, a novel device was developed that combined MoS2-AuNPs (sputtering)-SWCNTs. This sensor was obtained by impregnating nanosheets of MoS2 onto AuNPs (sputtering)-SWCNTs showing improved sensor performance compared to the devices with only AuNPs. In this case, the sensor exhibited a better behavior with a faster recovery of resistance values, even at room temperature. Overall, the study provides valuable insights into the fabrication and optimization of SWCNT-based ammonia sensors for various applications, particularly in detecting and quantifying small amounts of ammonia (concentrations below 1 ppm).

1. Introduction

Ammonia, a colorless and toxic gas, is a versatile chemical with numerous industrial applications, including refrigeration, agriculture, pharmaceuticals, the production of fertilizers, plastics, and power generation, among others [1,2,3]. The safe and effective use of ammonia requires the accurate and reliable monitoring of its concentration in various environments. This is where sensors play a crucial role. In recent years, there has been significant progress in the development of sensors for the detection and measurement of ammonia [4,5,6]. However, the development of ammonia sensors that present high sensitivity and selectivity, and those that are capable of working at room temperature, is of special relevance. Exposure to ammonia, even at low concentrations, poses a significant risk to human health. To address this concern, the Occupational Safety and Health Administration (OSHA) developed guidelines for maximum exposure times and dose limits in workplace environments that ammonia may be present in [7]. The recommended maximum exposure time for workers is 8 h, with a dose limit of approximately 25 parts per million (ppm) for an 8 h workday. If the concentration of ammonia exceeds this limit, then the recommended exposure time is much shorter. These guidelines aim to safeguard workers from the harmful effects of ammonia exposure, which can cause irritation of the eyes, nose, and throat, as well as respiratory difficulties, pulmonary edema, and, in severe cases, even death. Compliance with these regulations is critical for maintaining a safe working environment and preventing the adverse health outcomes associated with ammonia exposure [7]. In this sense, different approaches have been developed using a long list of sensing materials to detect ammonia [8,9,10,11,12]. One popular type of sensors for ammonia detection is electrochemical sensors [13]. These sensors rely on the detection of an electrochemical reaction to measure ammonia concentrations. They are well-known for their high sensitivity, fast response time, and the ability to perform real-time monitoring, making them a suitable choice for many industrial applications [13]. For instance, a study by Yavarinasab et al. [14] describes the development of a polypyrrole-modified electrode for the electrochemical detection of ammonium ions in aqueous media. The sensor showed high selectivity and sensitivity for ammonium ions, with a detection limit of 2 ppm. Another study, by Veluswamy et al. [15], describes the sonosynthesis of reduced graphene oxide (rGO), and its performance for ammonia vapor detection at room temperature, with a minimum detection limit of 1 ppm and a detection range from 1 ppm to 100 ppm.
Infrared sensors are another type of sensors used for ammonia detection [16]. These sensors detect ammonia through the absorption of infrared radiation. They are widely used due to their fast response time, sensitivity, and ease of use. For example, a midinfrared laser-based absorption sensor was developed for the in situ and simultaneous detection of ammonia, water, and temperature [16]. This ammonia sensor type showed a detection limit of 7 ppb [16]. In another piece of research, a microfiber Bragg grating (MFBG) was used to detect ammonia gas directly with ultrahigh sensitivity and without the possible interference of volatile organic compounds [17].
Optical sensors are another type of sensors used for ammonia detection [18]. These sensors use the absorption or fluorescence of light to detect ammonia, making them highly selective and sensitive [19]. These sensors can also detect signals through changes in light scattering patterns [20]. Maierhofer et al. described the development of optical ammonia sensors based on fluorescent aza-BODIPY dyes, suitable for environmental, bioprocess, and reaction monitoring, capable of detecting ammonia levels of the order of 1 μg/L [21]. In another piece of research, Lu et al. developed a sensor based on the reversible color change of an indicator of bromothymol blue loaded in a porous glass membrane, induced by ammonia gas released from an alkalinized water sample [22]. In this case, the behavior of the detector was linear with concentrations below 0.2 mg/L, and with detection levels in the microgram range.
Other sensors are based on the resistance changes of active materials exposed to gas [23,24]. In this sense, various sensors based on metal oxides have been developed, generally characterized by their low cost and sensitivity [23,24]. Among these materials, it is worth highlighting In2O3, CuO, NiO, Fe2O3, or V2O5, among others, with different dimensions and morphologies [25]. In this regard, 3D-hierarchical n-ZnO/p-NiO heterostructures were used for the development of ammonia sensors. In this investigation, detection levels were reached in the ppb range, although high working temperatures were required [26]. In another investigation, an ammonia sensor based on V2O5 nanosheets was developed [27]. In this case, the sensor was able to work at room temperature, showing high sensitivity and a low detection limit even in the presence of interfering gases, such as methanol, ethanol, and others. The use of other materials for the development of resistance sensors, such as single-walled carbon nanotubes (SWCNTs), has been described in different investigations. In general, pristine SWCNTs have shown low ammonia detection efficiencies, so this type of material has been modified by incorporating metallic nanoparticles [28], polymers [29,30], or different nanostructures [31,32]. In other investigations, ammonia sensors were developed based on the chemical modification of SWCNTs through functionalization with carboxylic acids [33]. The behavior observed in these materials was attributed to the formation of hydrogen bonds between the ammonia and oxygen present on the surface of the functionalized nanotubes.
In general, different types of ammonia sensors have certain characteristics, and the selection of a sensor for a specific application depends on factors such as sensitivity, the required response time, measurement range, cost, and complexity.
In this research study, we developed sensors based on hybrid structures formed with SWCNTs grown vertically through a catalytic chemical vapor deposition (CCVD) process, using TiN-SiO2-Si substrates as support. These materials were, subsequently, modified by incorporating Au nanoparticles and MoS2 nanosheets. The different materials used for the fabrication of these heterostructures were characterized using electron microscopy (SEM/TEM), Raman spectroscopy, and X-ray photoelectron spectroscopy (XPS). The devices prepared from these materials were subjected to ammonia detection tests at room temperature and 140 °C, with ammonia concentrations of 0.5 and 1 ppm, showing linear behavior.

2. Materials and Methods

2.1. Preparation of Substrates for SWCNTs Growth

Silicon wafers (100) from El-CAT Inc. were used as the substrates. The substrates were cleaned with isopropyl alcohol and then dried in an oven at 70 °C before use. In order to obtain different thicknesses of SiO2 on the Si, the substrates were subjected to a heat treatment at 200 °C for 5, 10, and 15 min under vacuum (10−3 mb). Under these treatment conditions, layers of thermal silicon oxide (SiO2) of ca. 200, 320, and 440 nm, respectively, were obtained. These SiO2@Si substrates were then coated with TiN through physical vapor deposition (PVD). For this, a TiN target was used. The deposition temperature used was 110 °C, with a deposition time of 30 min and a TiN thickness of ca. 60 nm. The obtained materials were then treated to obtain a specific pattern of alternative TiN and SiO2 zones. For this, an ion gun (Ion Tech Inc., Pasig, Philippines, 600 V and 10−4 mb pressure) was used, using a micrometer-sized patterned mask.
SWNTs were grown using a catalytic process. For this, the substrates obtained, with alternating zones of TiN and SiO2, were used as the catalyst support. The catalyst consisted of a mixture of Co-Mo, deposited on the substrates through dip coating, using the following procedure: dilute solutions of Co(CH3COO)2·4H2O and Mo(CH3COO)2 in absolute ethanol were used as the catalyst sources. Normally, to prepare 100 mL of the corresponding acetate solution, 0.02 g of MoII salt or 0.04 g of CoII salt was used. Both solutions were sonicated for 20 min and shaken for 2 h. Acetate solutions were kept in the dark to avoid photodecomposition. In the first step, the substrates were immersed into the MoII acetate solution for 10 s. They were then subsequently calcined in an oven in air at 673 K for 20 min. After that, the substrates were allowed to cool to room temperature and the dip-coating process was repeated using the CoII acetate solution. The substrates were then recalcined in an oven at 673 K for 20 min. As a result, organic compounds were removed from the surface, giving rise to metals (Co and Mo) in their oxidized forms. As already verified in other investigations, the metals were mainly deposited in the zones corresponding to SiO2, fundamentally due to the much more polar behavior of SiO2 than TiN, which acted as a physical barrier.

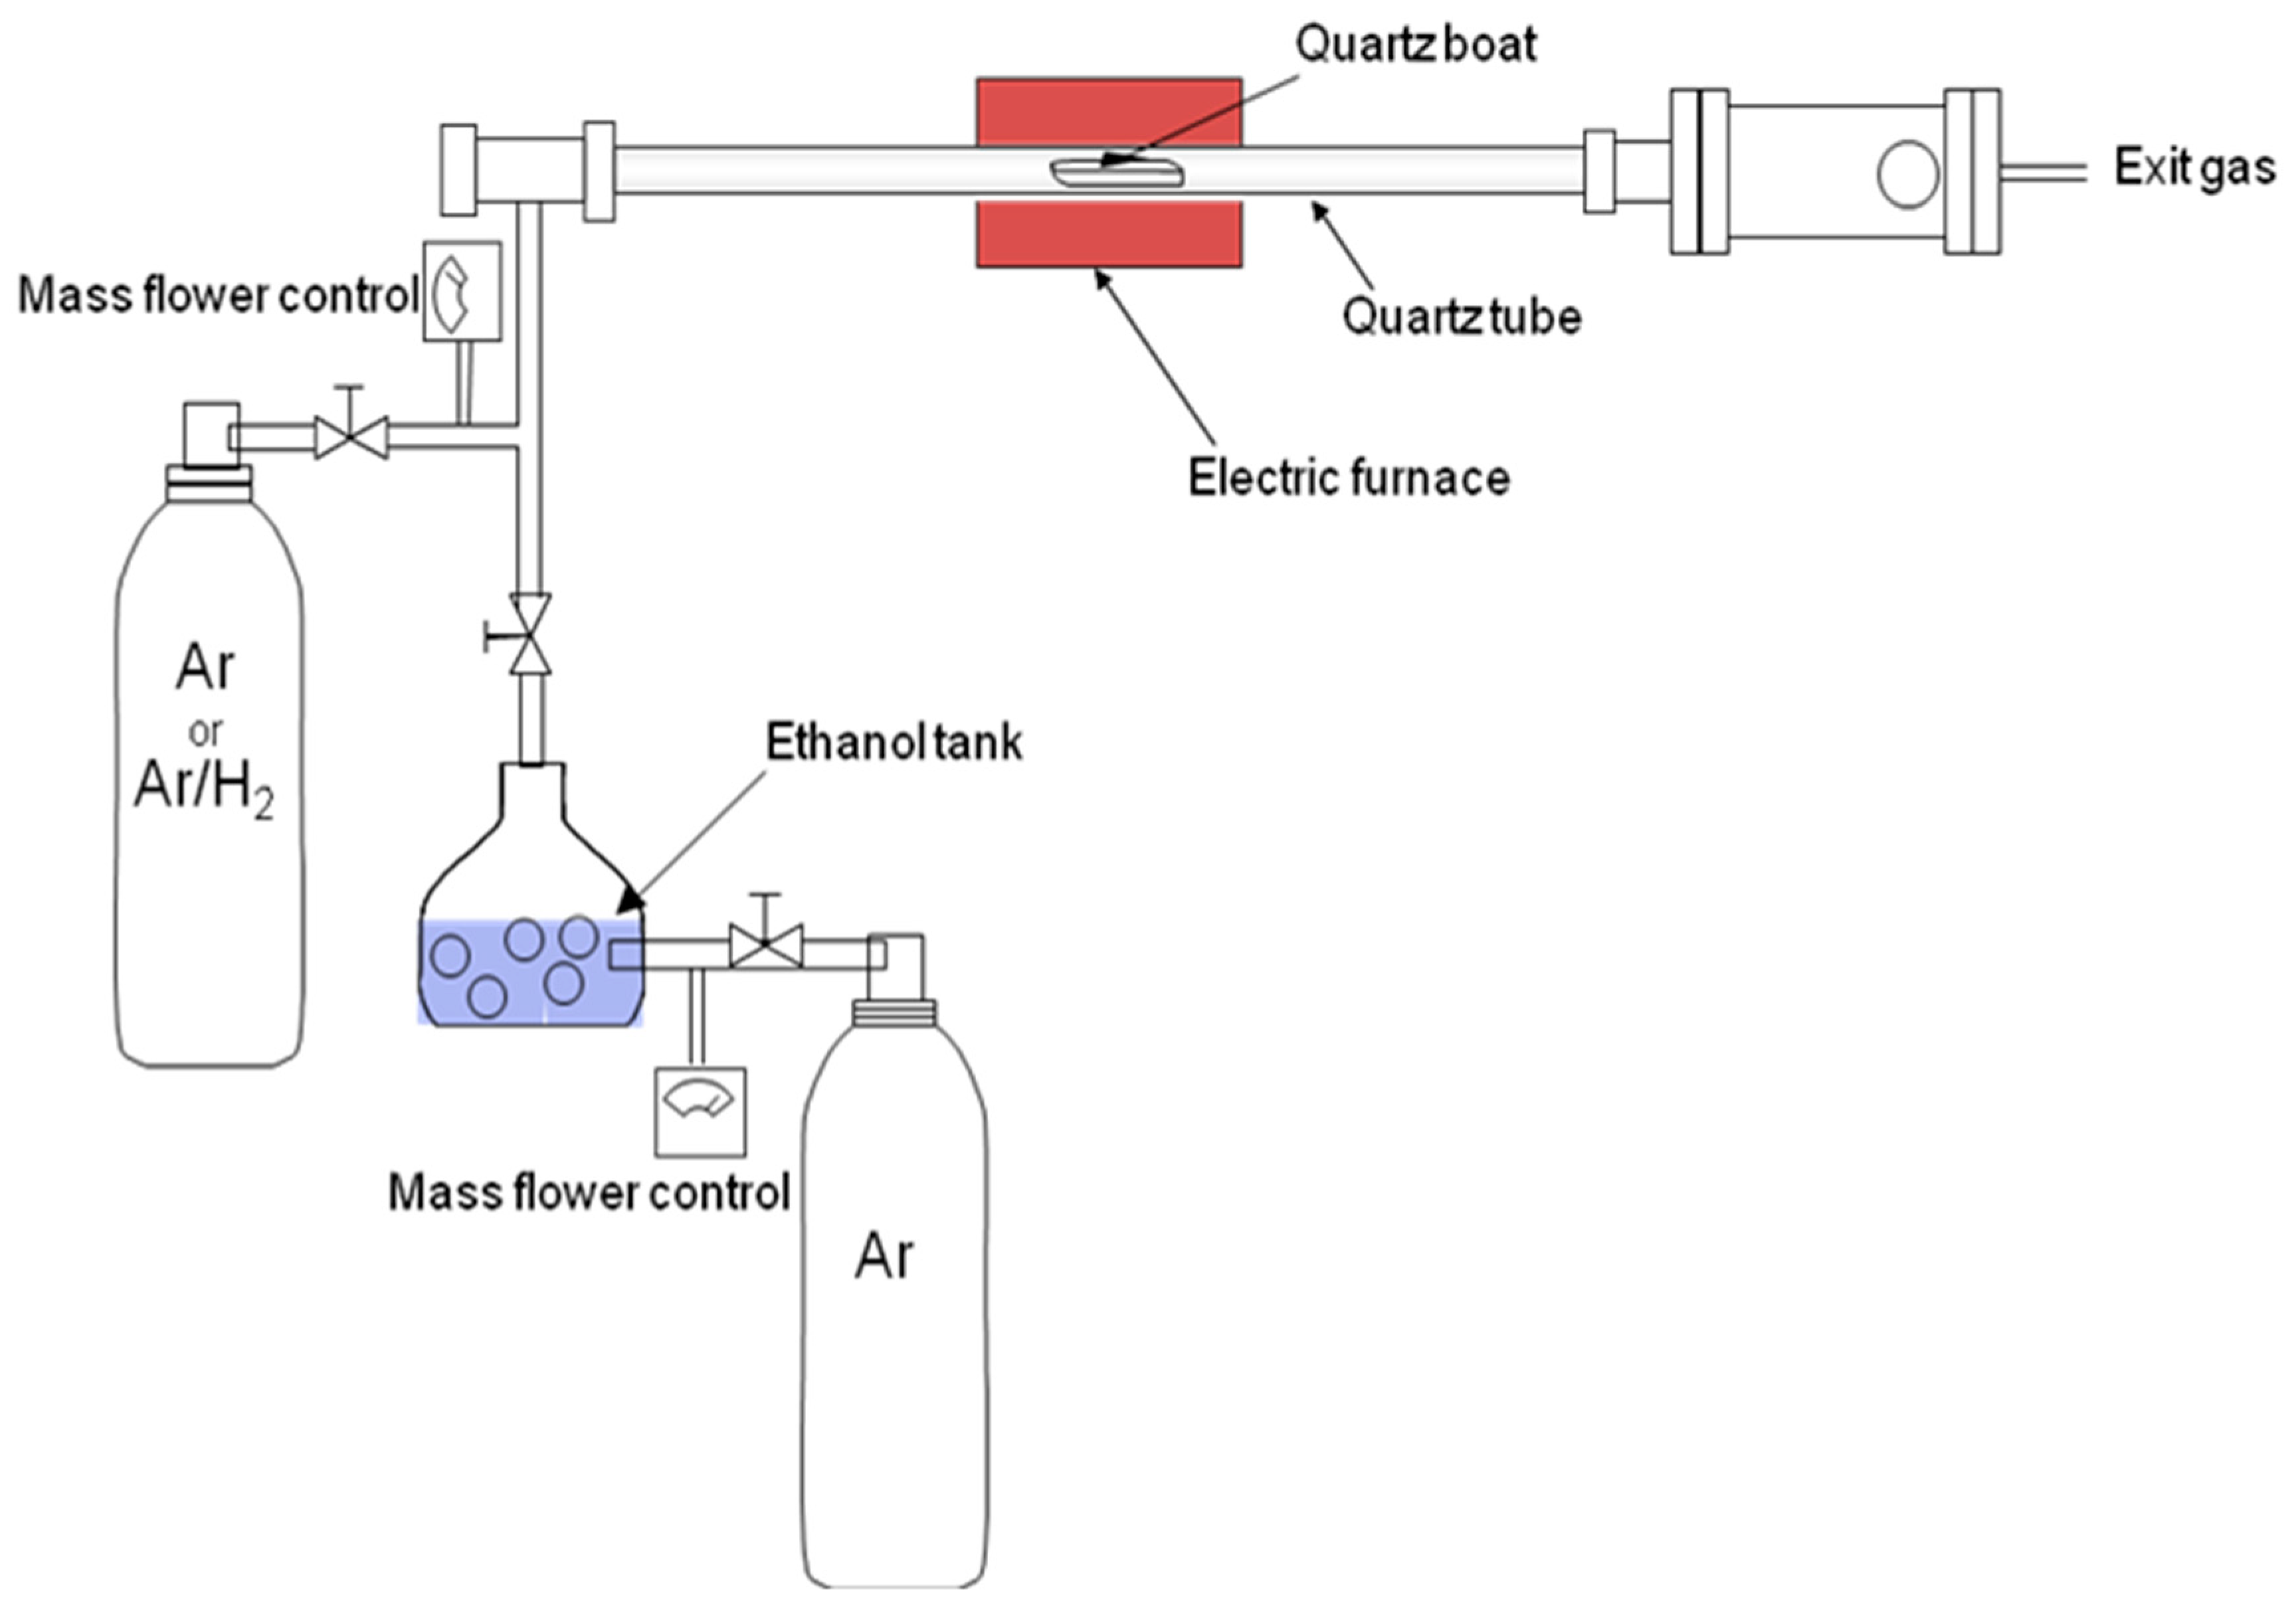
2.2. Synthesis of SWCNTs-SiO2-Si

The substrates obtained as described above were used for the growth of the SWCNTs. For this, a homemade catalytic CVD piece of equipment was used, composed of a three-entry system (see Figure 1). A cylindrical quartz reactor with an inner diameter of 25 mm and a length of 1 m was installed inside a tube furnace. Substrates in a ceramic boat were introduced inside the quartz reactor. Next, the system was closed and evacuated to 10−2 Pa using a mechanical pump. After 15 min, the mechanical pump was stopped and a mixture consisting of 90% Ar and 10% H2 gas was added to the reactor (300 sccm flow rate). Simultaneously, the reactor was heated up to 1173 K (10 Kmin−1), which allowed for the reduction of the Mo and Co oxides, giving rise to the appearance of Mo° and Co° nanoclusters, which were the true catalysts necessary for the synthesis of the SWNTs. Once the synthesis temperature was reached, the flow of Ar–H2 was stopped and a mixture of 10% H2 and 90% Ar with ethanol (99.5%) vaporized in the Ar current was introduced into the chamber at a flow rate of 200 sccm. The ethanol introduced was the carbon source for the synthesis of the SWCNTs, for which a growth time of a typical 5 min was used. The growth ended when the gas mixture was changed to Ar (300 sccm), with the cooling of the furnace beginning simultaneously.

2.3. Synthesis of Au@SWCNTs-SiO2-Si

The SWNTs grown according to the procedure described above were located exclusively on the areas corresponding to SiO2. The presence of TiN, although it inhibited the growth of carbon nanotubes, was necessary to facilitate the growth of vertically organized SWCNTs in the more polar regions of SiO2 (see Figure 2). The SWNTs were then partially coated with Au using a sputtering system. The process was carried out under a vacuum of 5 × 10⁻² mb and with a sputtering time of 20 s. The material obtained (Au@SWCNTs-SiO2/Si) was then subjected to a heat treatment at 400 °C in flowing Ar (300 sccm) for 15 min. The amount of gold deposited using this procedure was estimated at ca. 5% (% at), based on the EDS measurements.
To study the influence of the type of impregnation of the SWCNTs with gold on the behavior of the sensors, a new experiment was carried out, in which the SWCNTs were impregnated with Au through a chemical process. This procedure consisted of incorporating 0.2 mL of the Au precursor (0.005 g of HAuCl4 in 2 mL of water) on the Si substrate with the SWCNTs grown on the surface (SWCNTs@Si). After 15 min, the substrate impregnated with the gold reagent was immersed in a NaBH4 solution (10 mg in 10 mL of H2O) and allowed to react for 20 min at room temperature. Subsequently, the substrate was extracted and immersed in deionized water to remove the reducing agent. This process was repeated 3 times and, finally, the substrates were dried overnight in a vacuum oven at 60 °C. The amount of gold deposited through this chemical method was evaluated with EDS and estimated to be ca. 4% (% at), similar to the result obtained through the sputtering deposition (5%).

2.4. Synthesis of MoS2-Au@SWCNTs-SiO2-Si

MoS2 nanosheets were incorporated onto the Au@SWCNTs-SiO2-Si, and their behavior in the detection of ammonia was studied. To perform this, commercial MoS2 was subjected to an exfoliation process, which consisted of mixing 1 g of commercial MoS2 with 50 mL of ethylenediamine. The mixture was kept under constant stirring for 48 h and then centrifuged to remove excess ethylenediamine. The solid obtained was redispersed in dimethylformamide and then sonicated for 3 h using a Tip Sonicator (Sonics Vibra-Cell VCX 750 Ultrasonic Processor) in the pulsed mode (30% amplitude, pulse on 10 s, pulse off 10 s). Subsequently, the solution was left to rest for 4 h and the supernatant was extracted and centrifuged for 30 min at 5000 rpm. Finally, the product was dried and sealed for later use.
The deposition of the exfoliated MoS2 on the Au@SWCNTs-SiO2-Si was carried out using impregnation, dispersing 20 mg of the previously exfoliated MoS2 nanosheets in 20 mL of ethanol. The mixture was sonicated for 1 h using a Tip Sonicator (Sonics Vibra-Cell VCX 750 Ultrasonic Processor) in the pulsed mode (10% amplitude, pulse on 5 s, pulse off 10 s). The Au@SWCNTs-SiO2-Si substrates were immersed in this solution for 5 min. Subsequently, the substrates were extracted from the solution and placed in a deionized water bath, repeating this last process 3 times. The substrates were subsequently dried in a vacuum oven at 60 °C overnight. The amount of MoS2 deposited through this chemical impregnation method was evaluated with the EDS analysis of Mo and estimated to be ca. 6% (% at).

2.5. Characterization

The morphology of the materials was characterized with field emission scanning electron microscopy (FESEM) using a JEOL JSM-6010PLUS/LV, equipped with an INCA EDS XMAXN analyzer (Oxford Instruments, Abingdon, Oxfordshire, UK), and a FEI Verios 460 L, equipped with a Quantax EDS Analyzer (Thermo Fisher Scientific, Hillsboro, OR, USA). Characterization using high-resolution transmission electron microscopy was carried out using a JEM 3000F microscope (JEOL, Peabody, MA, USA). Raman spectroscopy was carried out using a DXR Thermo Raman Microscope with a 532 nm laser source at 5 mW power and a resolution of 5 cm−1 (Waltham, MA, USA). X-ray photoelectron spectroscopy (XPS) was carried out using an ESCALAB 220i-XL spectrometer with nonmonochromatic Mg Kα (1253.6 eV) radiation operating at 20 mA and 12 kV (Waltham, MA, USA).

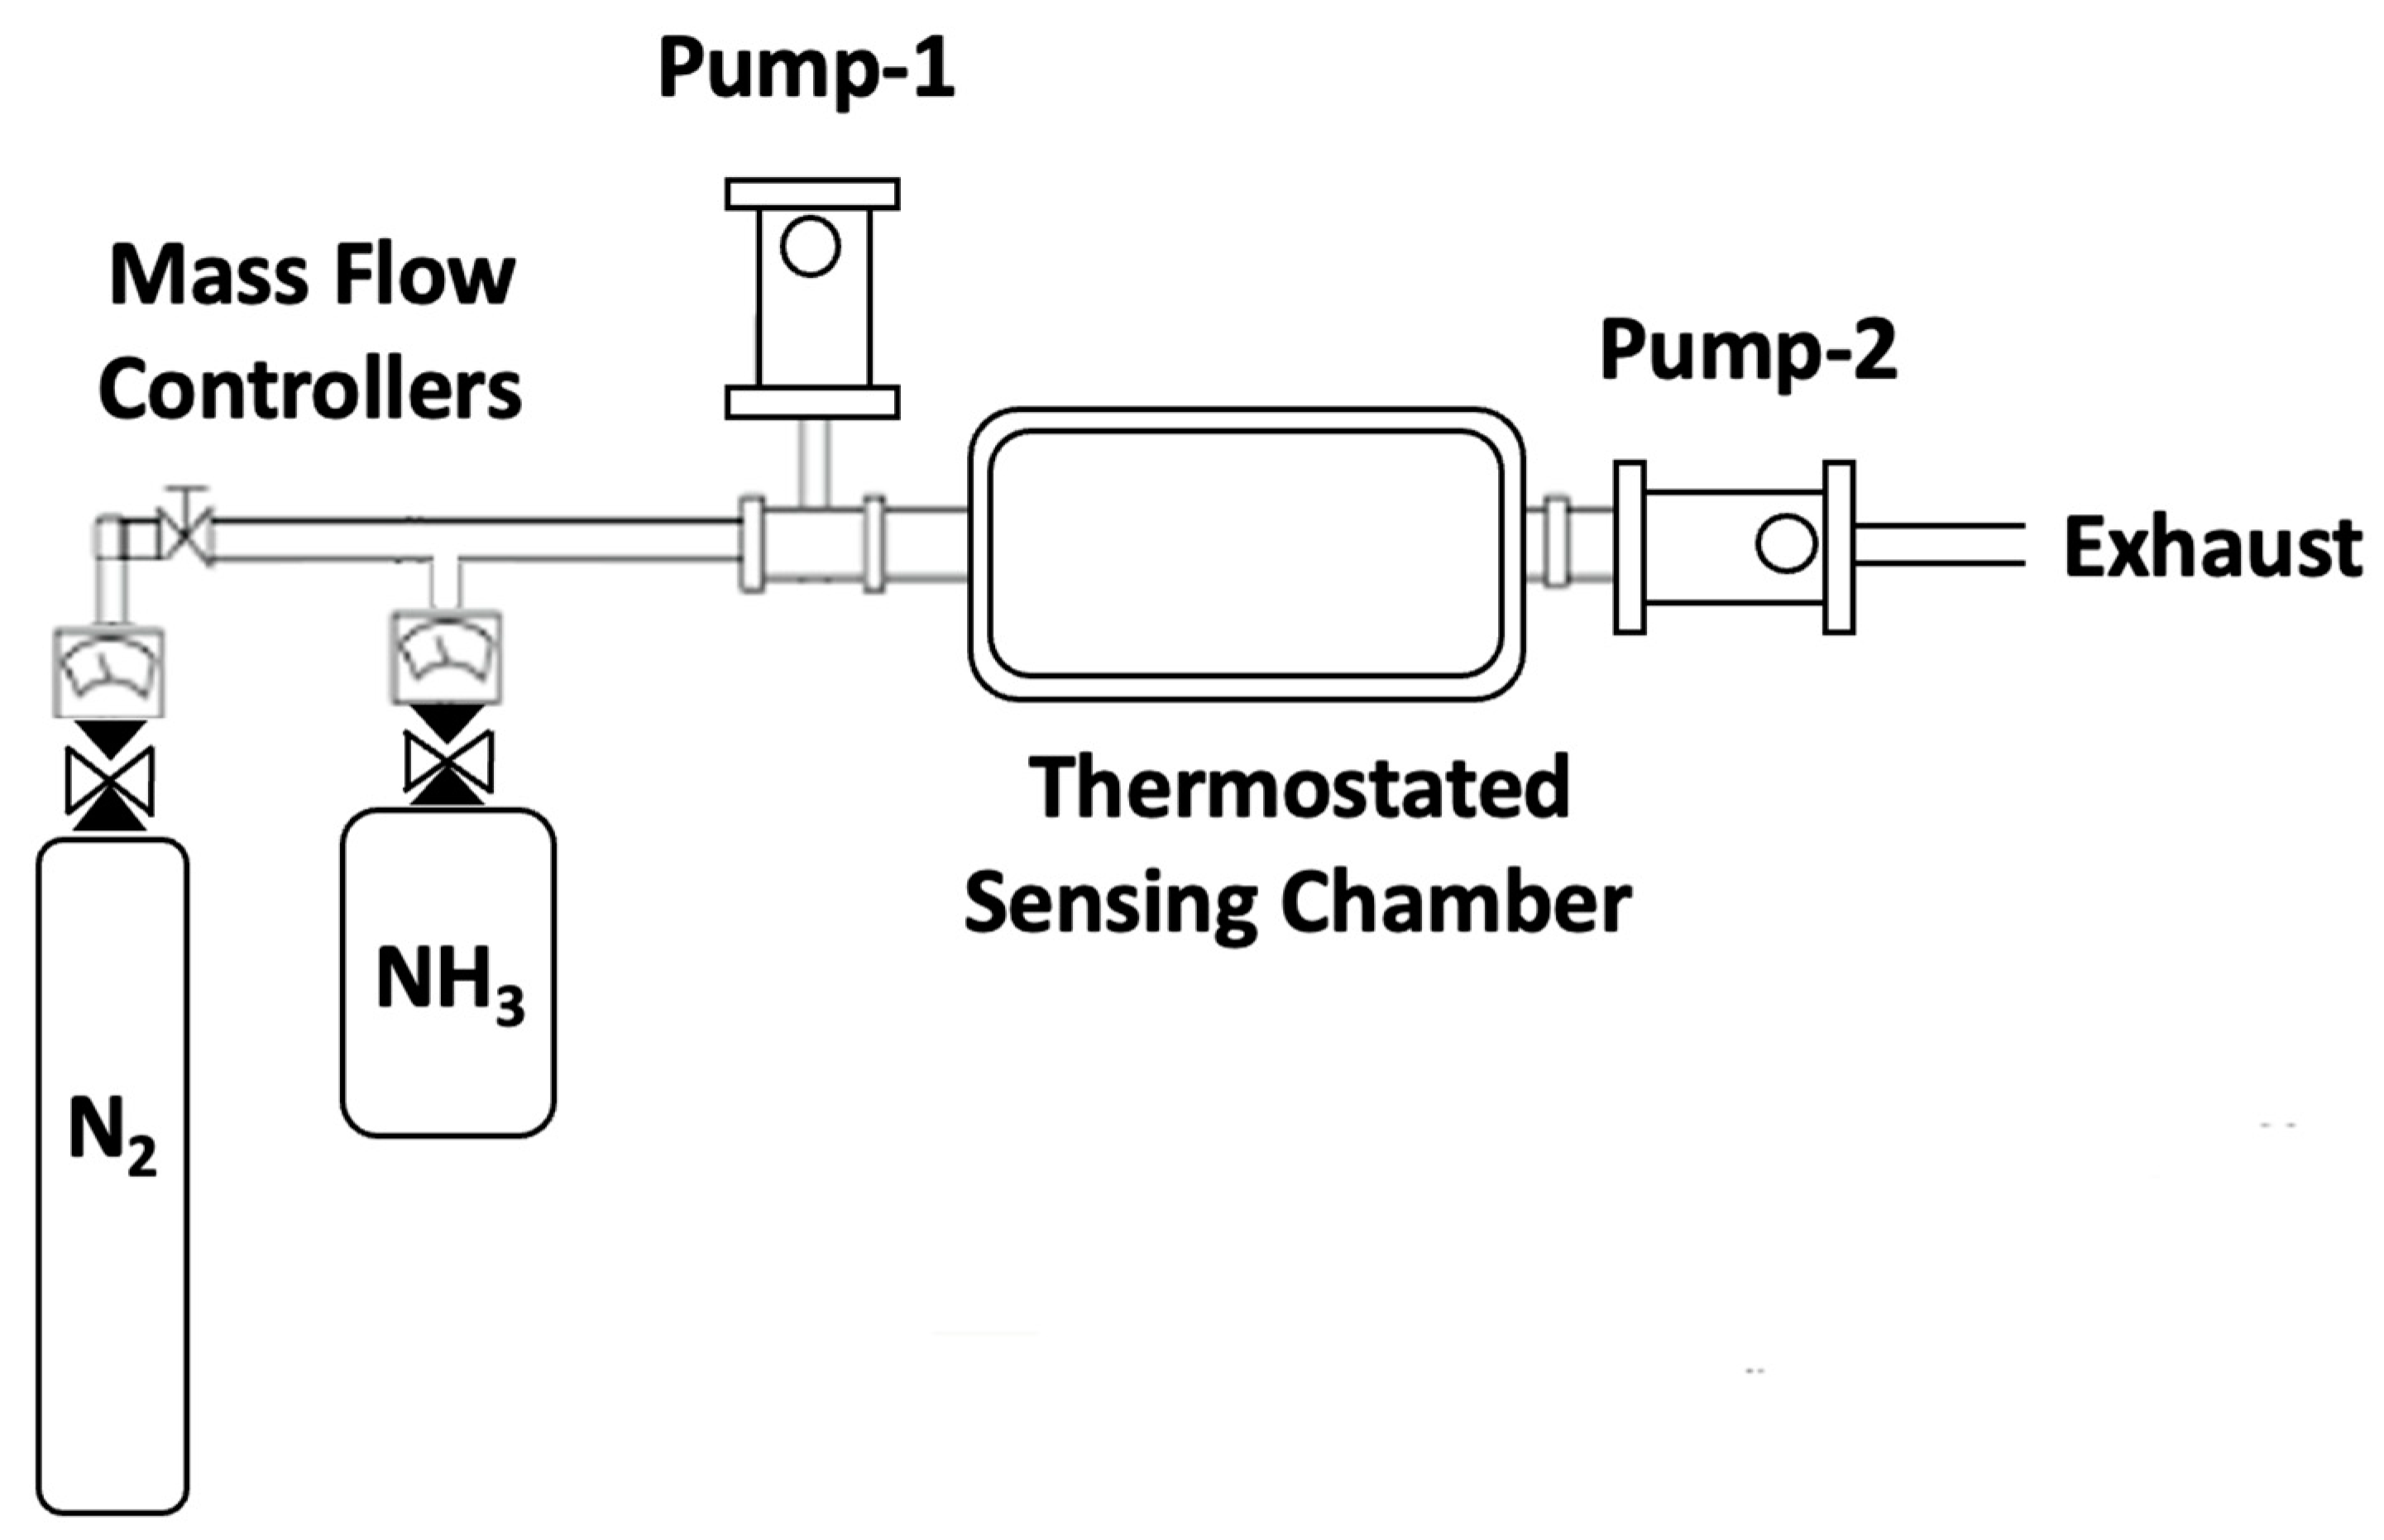
2.6. Target Gas Exposure

An in-house designed sensing chamber of 1 L capacity was used (see Figure 2), capable of working at different temperatures through a thermostating system. The manufactured sensor was inserted into the chamber, with the terminals conveniently connected. The chamber was then evacuated to remove any possible contamination. For this, two vacuum pumps were used, one of them to eliminate possible contamination in the gas lines and an additional pump connected directly to the sensing chamber to remove any residual gas molecules. The system had an ammonia line (Gasco, 5 ppm ammonia diluted in nitrogen) and a second UHP nitrogen line (5.0). Both lines were connected to the sensing chamber through flowmeters that allowed for controlled amounts of gas to be introduced. Resistivity measurements were carried out using a two-probe conductivity cell.

3. Results and Discussion

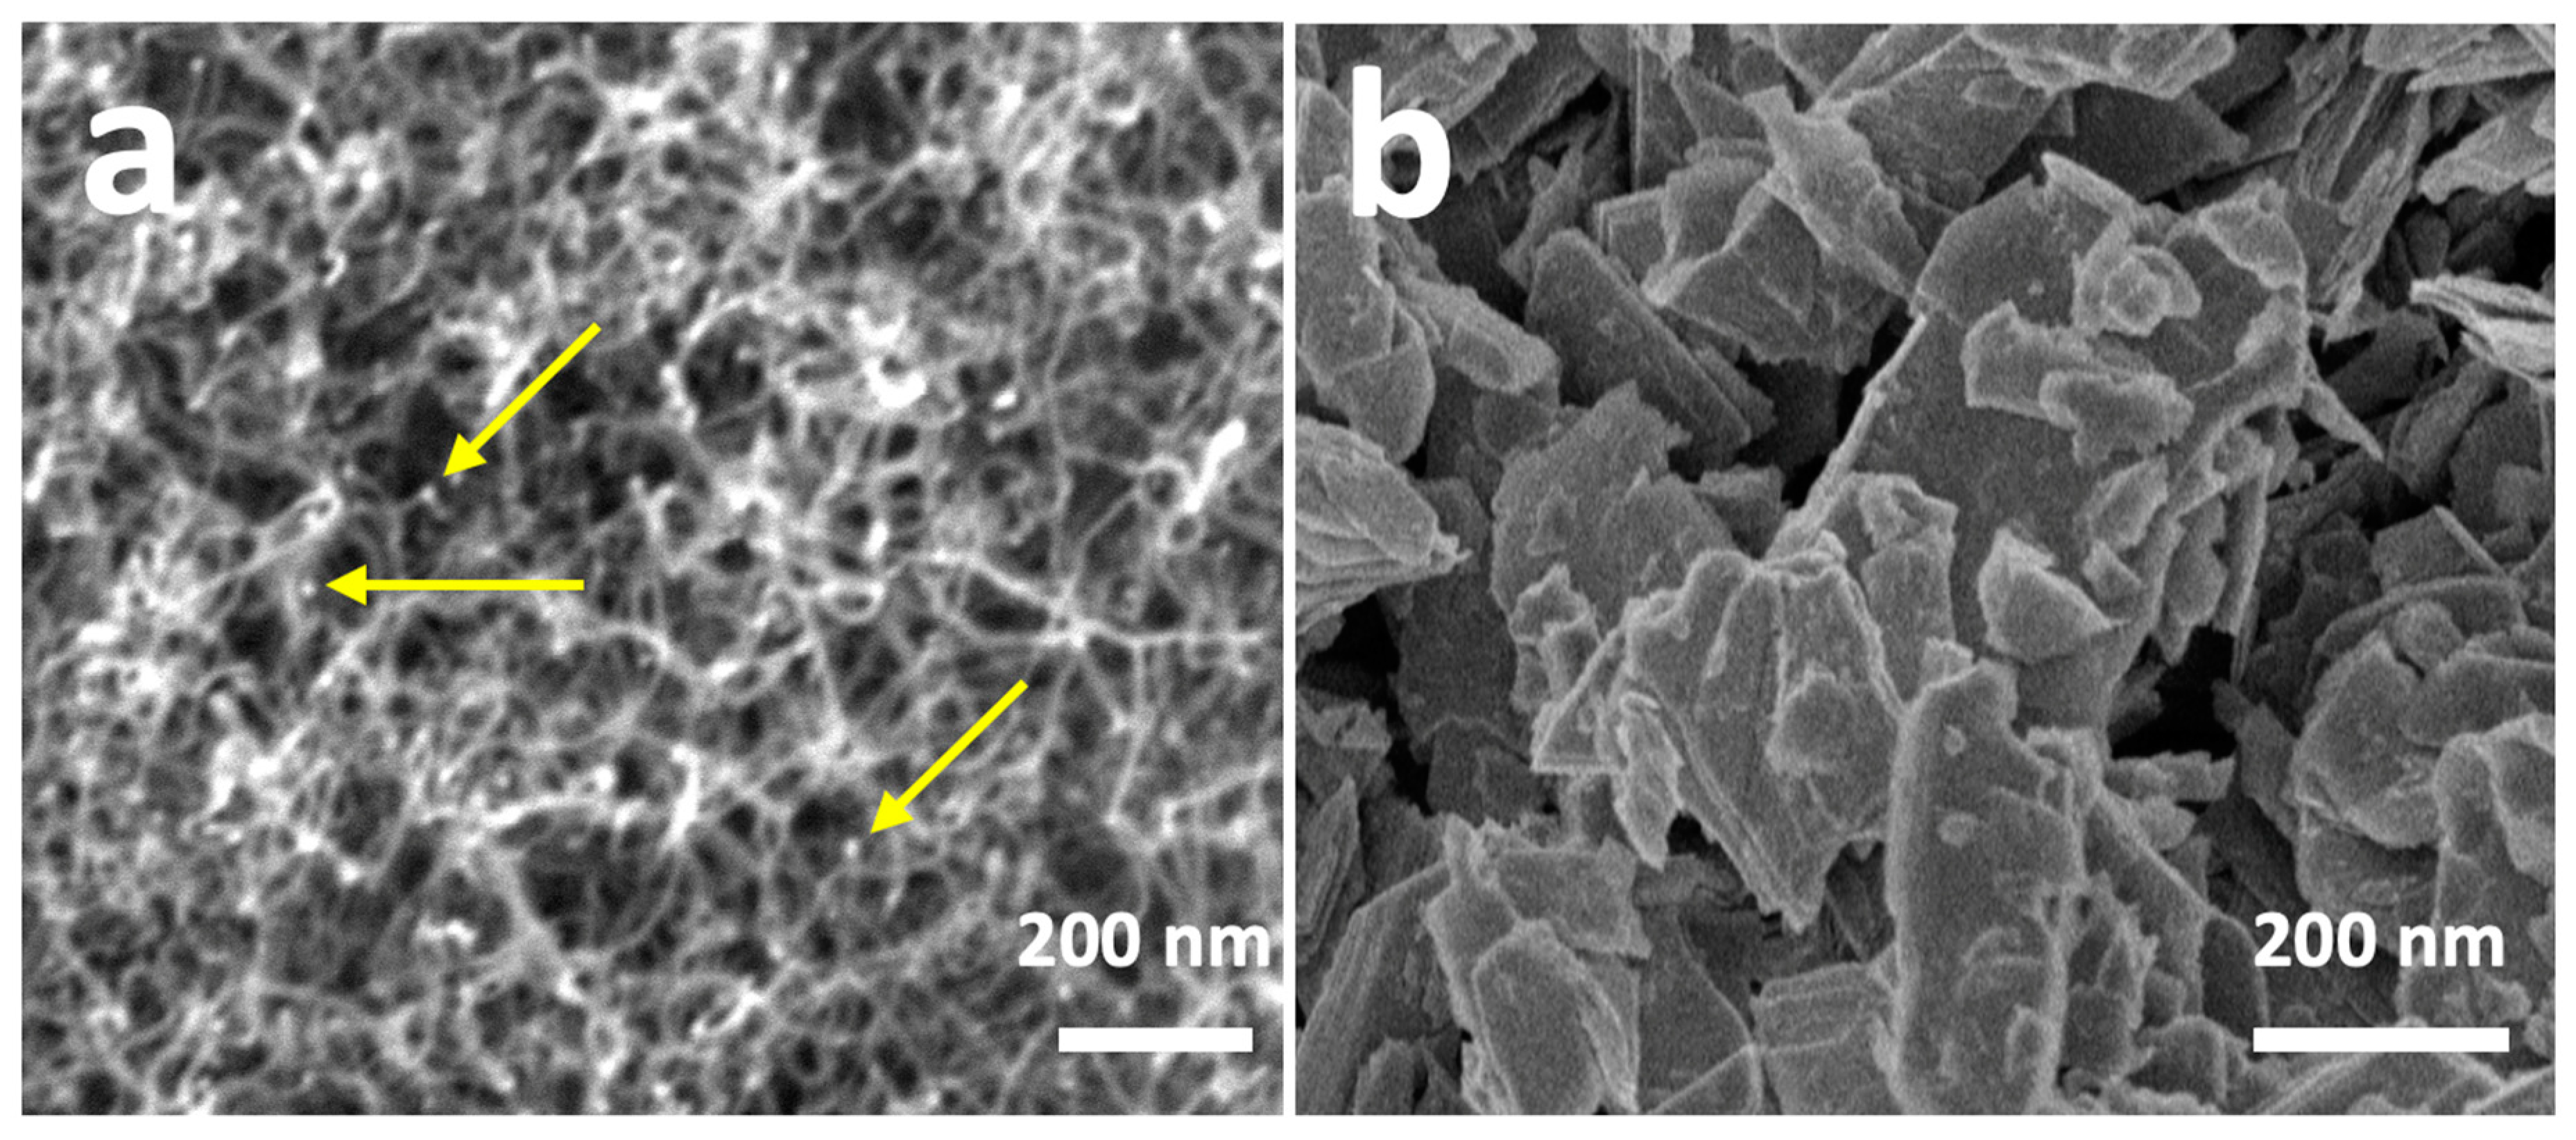
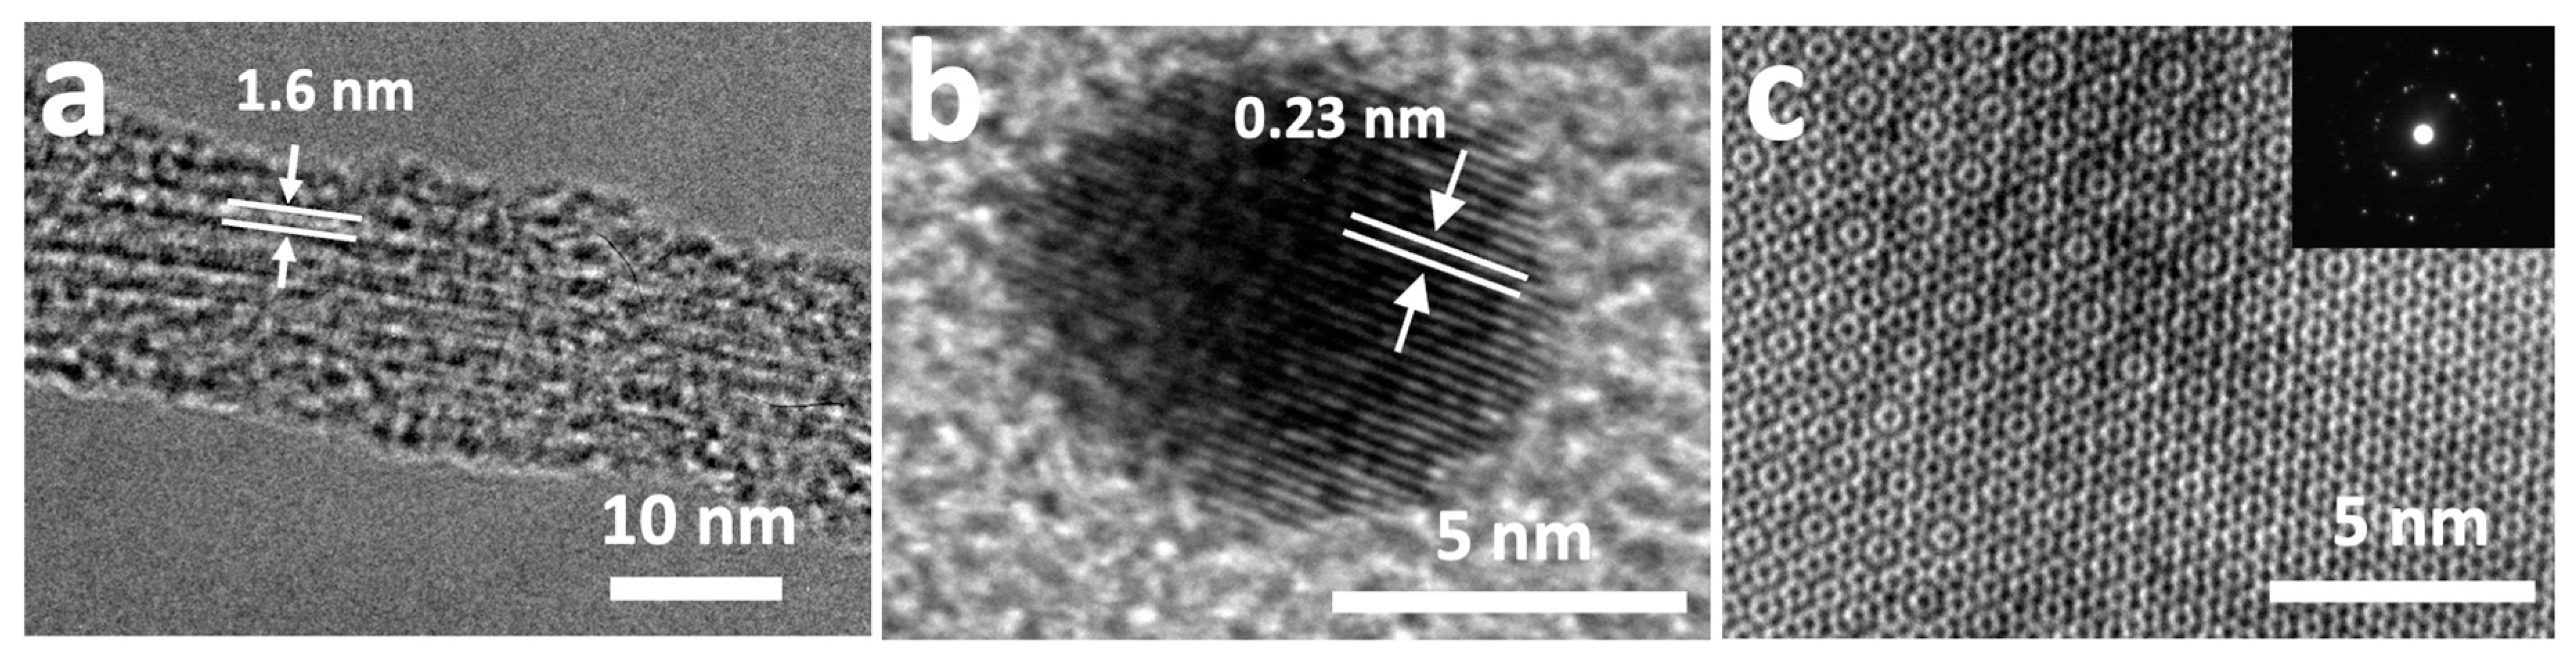
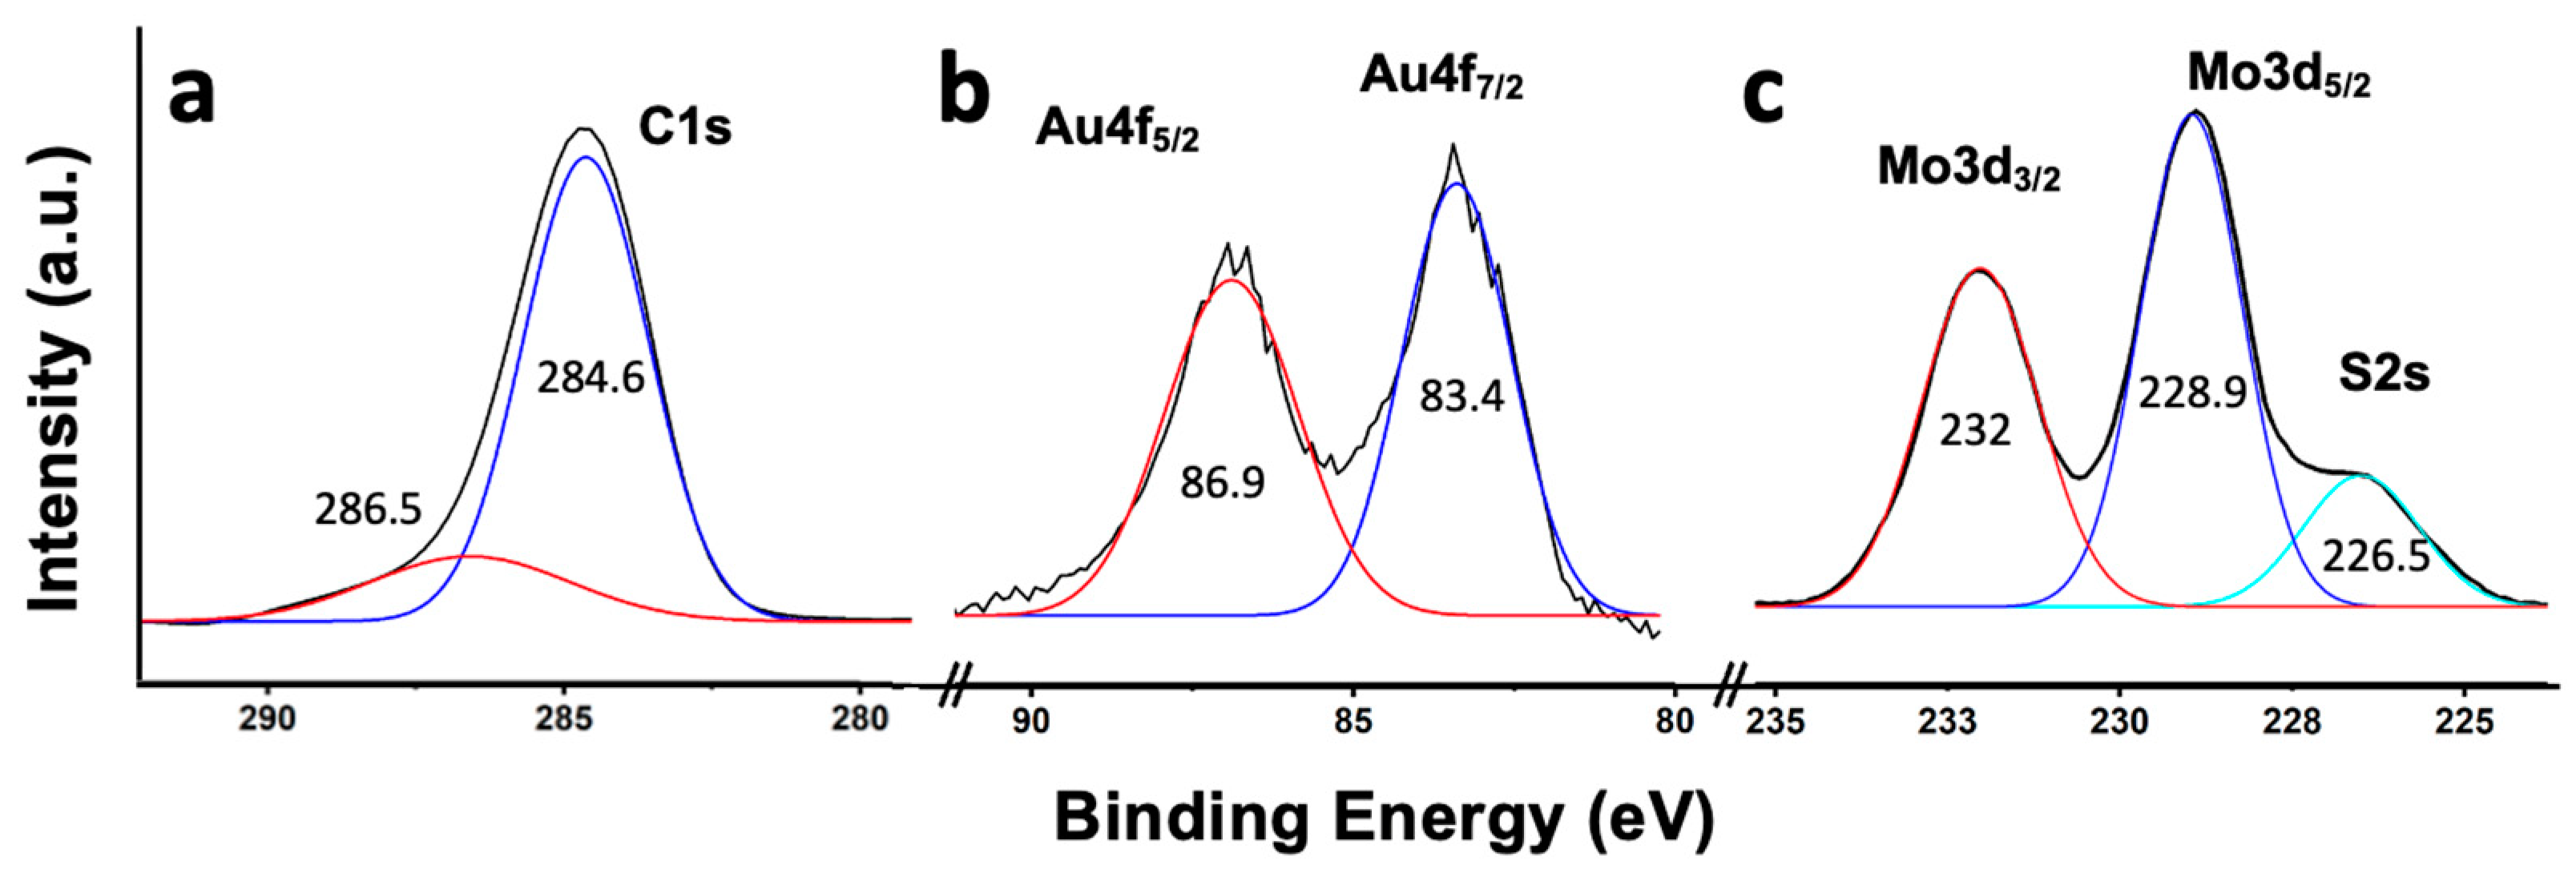
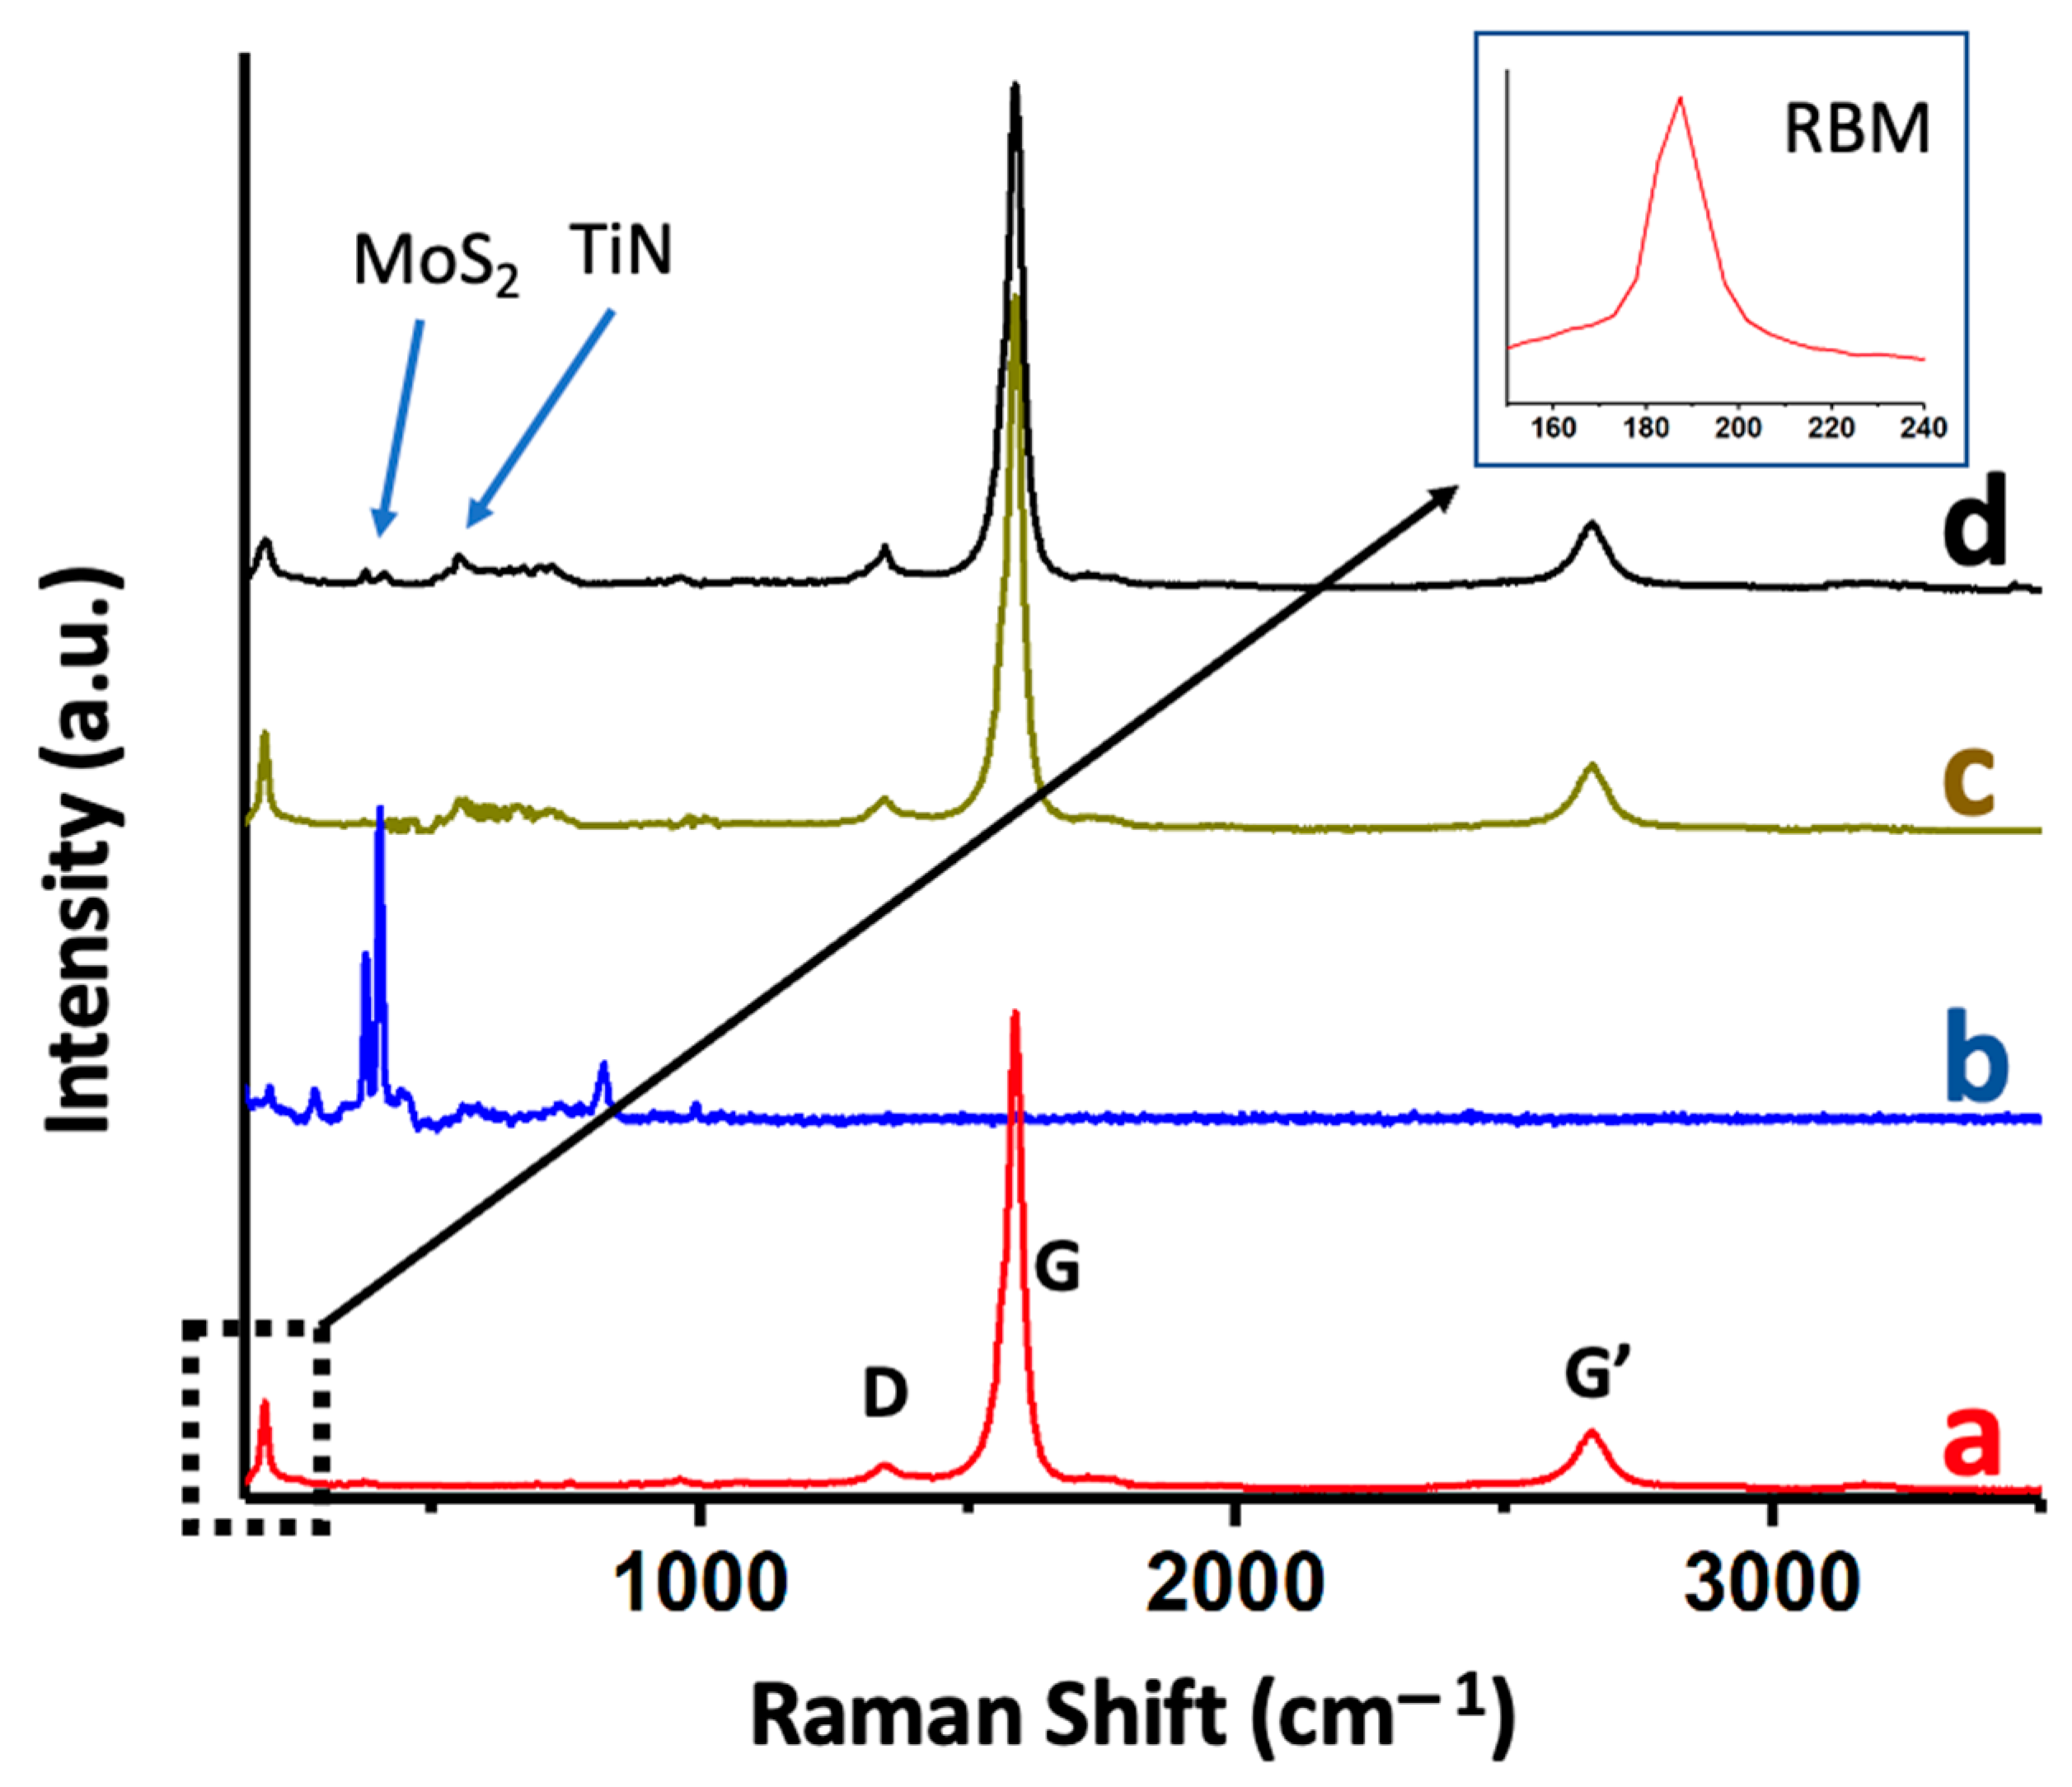
3.1. Characterization of Nanomaterials

Figure 3 shows the SEM images of the different nanomaterials used in the manufacture of the different ammonia sensors developed in this research. Figure 3a shows the SEM image of vertically grown SWCNTs on TiN-SiO2-Si substrates, on which Au nanoparticles were deposited. The SWCNTs were characterized through being grouped in bundles, with diameter ranging between 10 and 15 nm (see below) and adhered to each other thanks to the presence of amorphous carbon. As can be seen, the distribution of the Au nanoparticles was quite homogeneous, with diameters ranging between 5 and 8 nm. Figure 3b shows the SEM image of the previously delaminated MoS2. As can be seen, the delamination allowed for the obtainment of structures of limited size, with average diameters below 200 nm. Figure 4 shows the HRTEM results of the different nanomaterials used. Figure 4a shows a bundle of SWCNTs. As can be seen, the fiber diameter was ca. 15 nm, and was formed by the grouping of individual SWCNTs with an approximate diameter of 1.6 nm. These SWCNTs remained grouped forming these fibers thanks to the presence of an amorphous carbon that maintained their integrity. Similar results were already previously observed [34]. Figure 4b shows a gold nanoparticle obtained through chemical synthesis. As observed, the nanoparticle showed a diameter of ca. 7 nm and was highly crystalline with the interplanar spacing of ca. 0.23 nm indexed to the (111) crystal plane of Au. Figure 4c presents the HRTEM image of MoS2 that underwent ultrasonication-assisted exfoliation. The exfoliation process revealed the fine details of the atomic monolayer, as evident in the image. As previously reported in publications by our research group [35], MoS2 exhibited a high degree of crystallinity, corroborated by the inset in Figure 4c. Additionally, the material contained structural defects that may have potentially influenced its properties and behavior.
The different nanomaterials were also characterized with X-ray photoelectron spectroscopy (XPS). The transition corresponding to C1s (Figure 5a) was clearly asymmetric and deconvoluted into two components at ca. 285.5 eV and 287.4 eV. The most intense peak (284.6 eV) was assigned to the hybridized graphite-like carbon atoms (sp2 carbon) [36], characteristic of nanotubes. The peak at 286.5 eV was assigned to possible structural defects of the SWCNTs, specifically to the presence of -C-O groups in the nanotube structure [36]. The presence of these defects in the nanotubes was relevant, since they had the potential to serve as interaction zones with ammonia. Figure 5b shows the Au4f transition, with peaks at 83.4 eV and 86.9 eV and a characteristic spin–orbit splitting of ca. 3.5 eV, typical in the presence of metallic gold [37]. Figure 5c shows the Mo3d and S2s transitions corresponding to MoS2. Mo3d showed two peaks at 232.0 eV and 228.9 eV, which were attributed to the Mo3d3/2 and Mo3d5/2 doublet, respectively, and which were assigned to the Mo4+ state in MoS2 [37,38]. At 226.5 eV, a peak corresponding to the S2s transition, characteristic of MoS2, was shown [37].
The different materials were characterized using Raman spectroscopy (Figure 6). Figure 6a corresponds to the Raman spectrum of the SWCNTs grown using CCVD after being detached from the substrate and showing an intense peak at 1594 cm−1 (G-band) and a much less intense band (D-band) at ca. 1342 cm−1 [39]. Additionally, a band was observed at 2665 cm−1 (G’-band). The intensity ratio of the G/D bands was unequivocally related to the high purity of the SWCNTs. Below 300 cm−1, the RBM region was shown, whose position could be empirically correlated with the diameter of the nanotubes. For this, the formula d = 284/νRBM was used, where νRBM is the Raman shift corresponding to the RBM peak and d is the diameter of the SWCNT (nm) [40]. The diameter determined with this approximation was 1.52 nm, which agreed with the dimensions determined through HRTEM (ca. 1.60 nm). The Raman spectrum of MoS2 (Figure 6b) was characterized by two bands at 375 cm−1 and 404 cm−1 that were assigned to the E12g and A1g modes, respectively [41]. The position of these bands varied with the level of exfoliation applied to the material; therefore, these values indicated that exfoliation led to the generation of MoS2 nanosheets with few layers [42,43]. As observed in Figure 6c,d, the incorporation of gold nanoparticles (through sputtering) on the nanotubes did not produce apparent changes in the Raman spectrum. Figure 6d shows the Raman spectrum of the surface of the material subsequently used as a sensor (SWCNTs grown on a TiN-SiO2-Si substrate, with gold nanoparticles and MoS2 nanosheets on the surface). As observed, the Raman spectrum showed two small peaks assigned to MoS2 and one peak at ca. 550 cm−1, which was due to TiN, coming from the support.

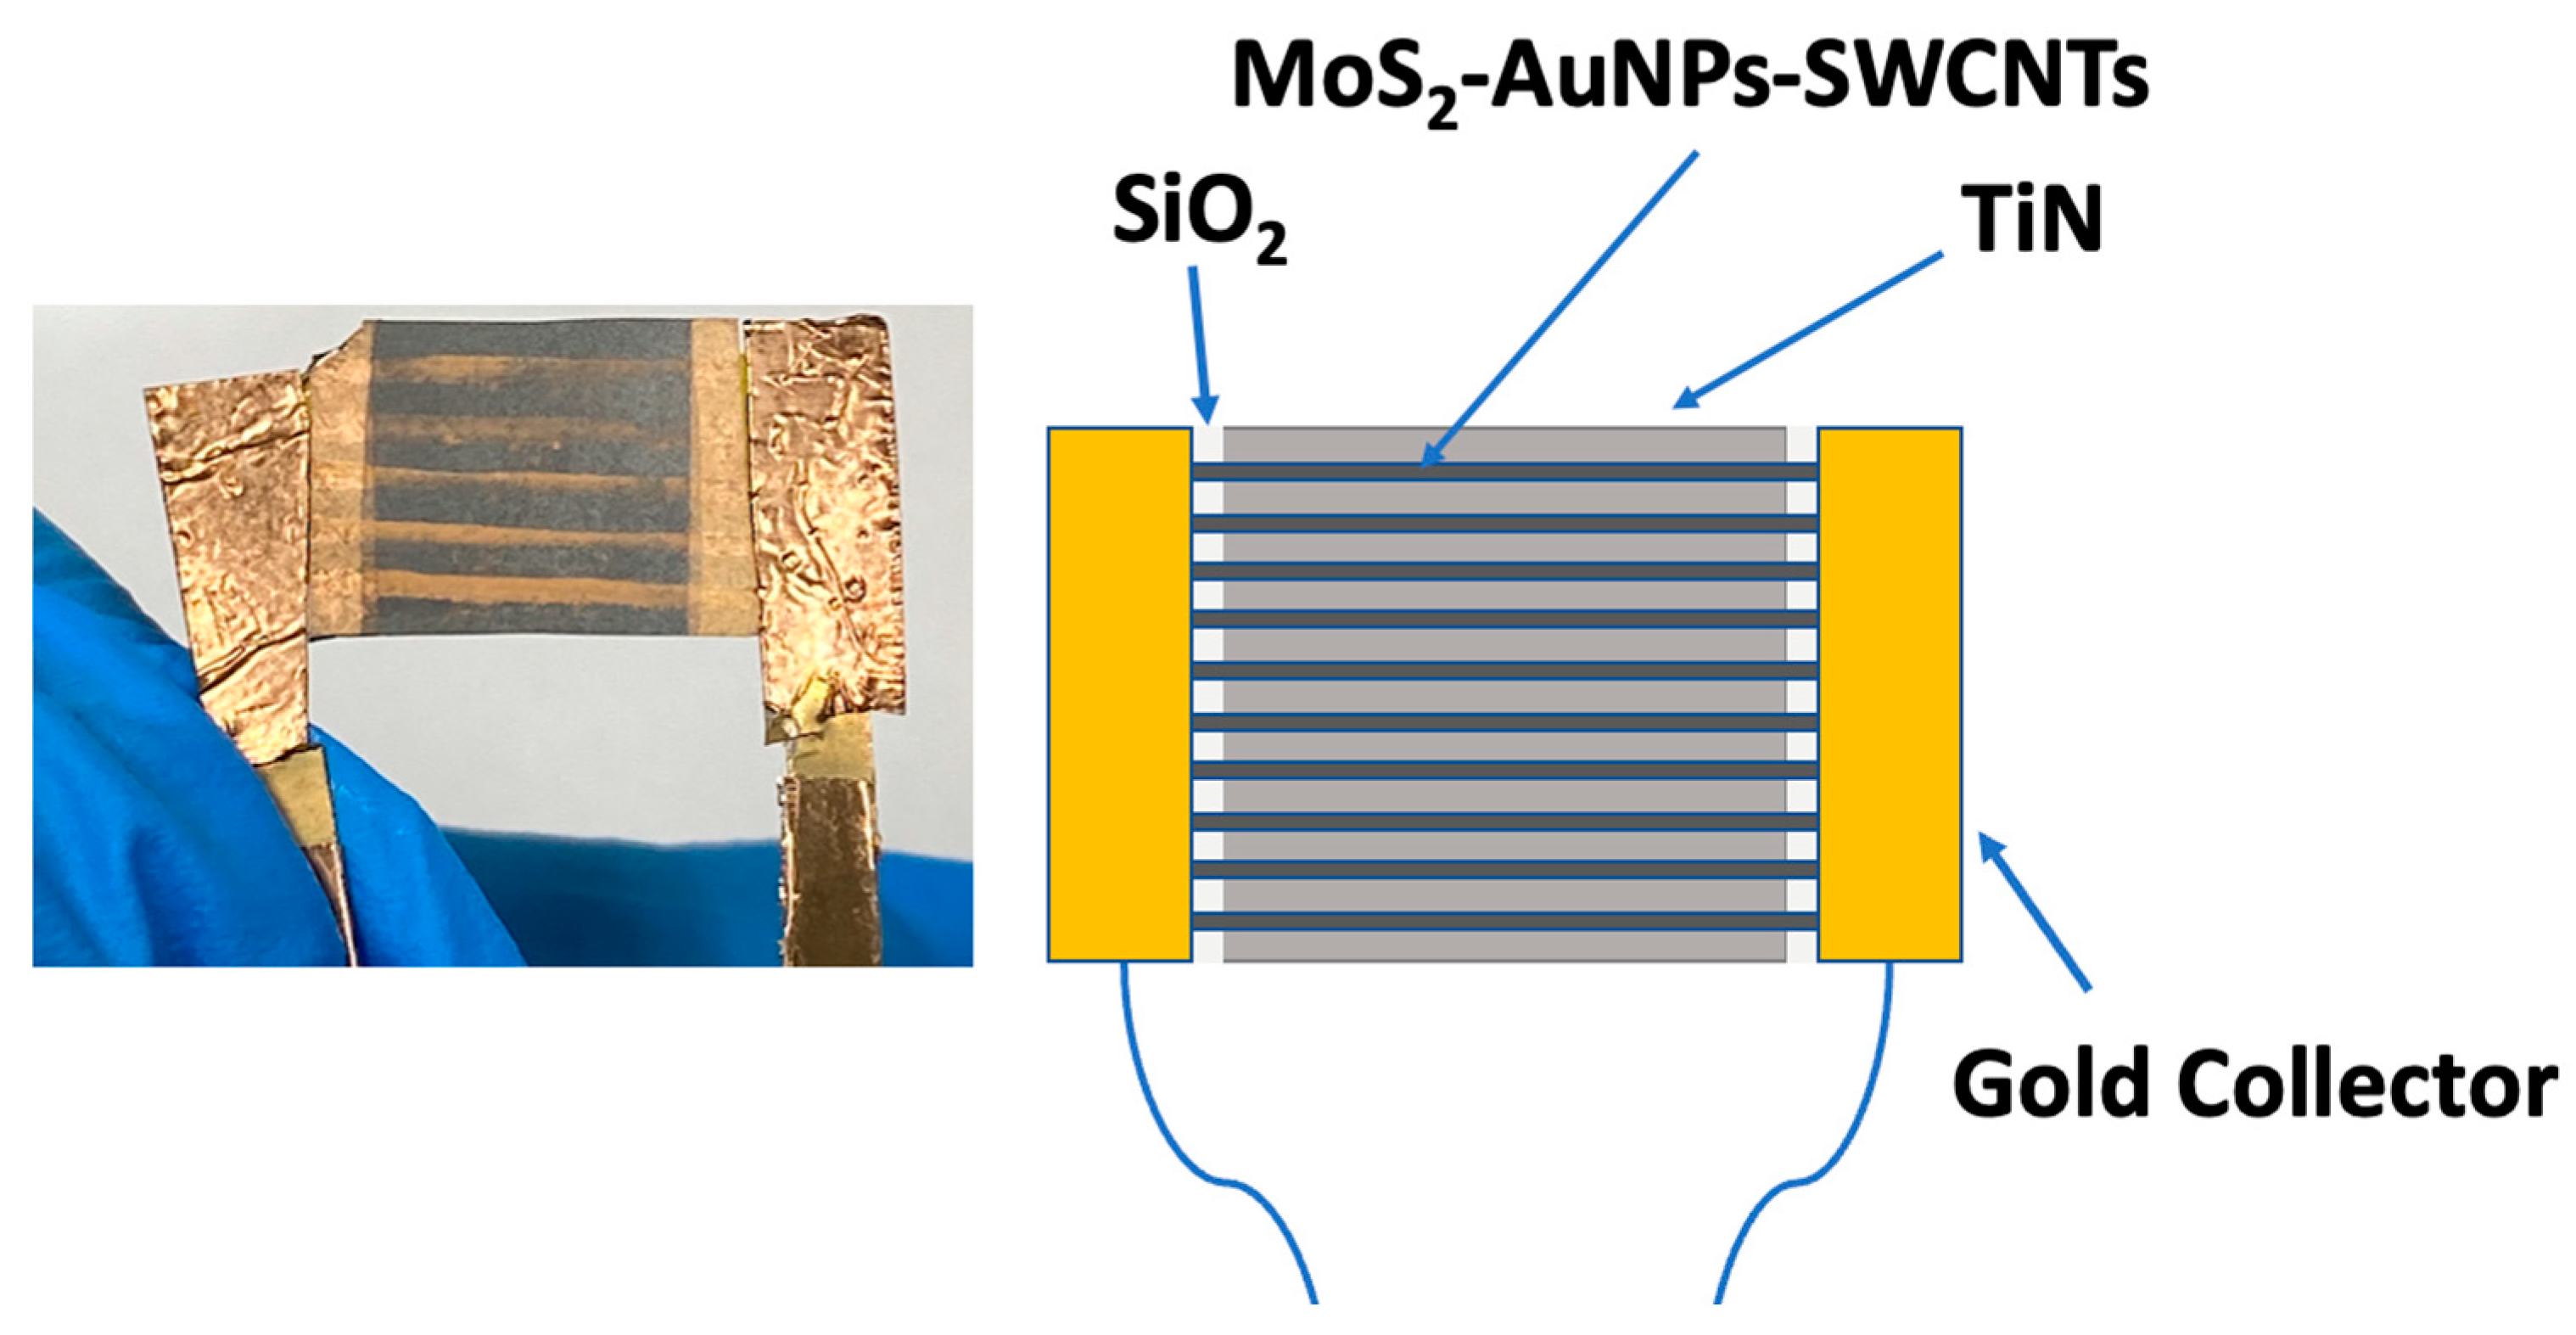
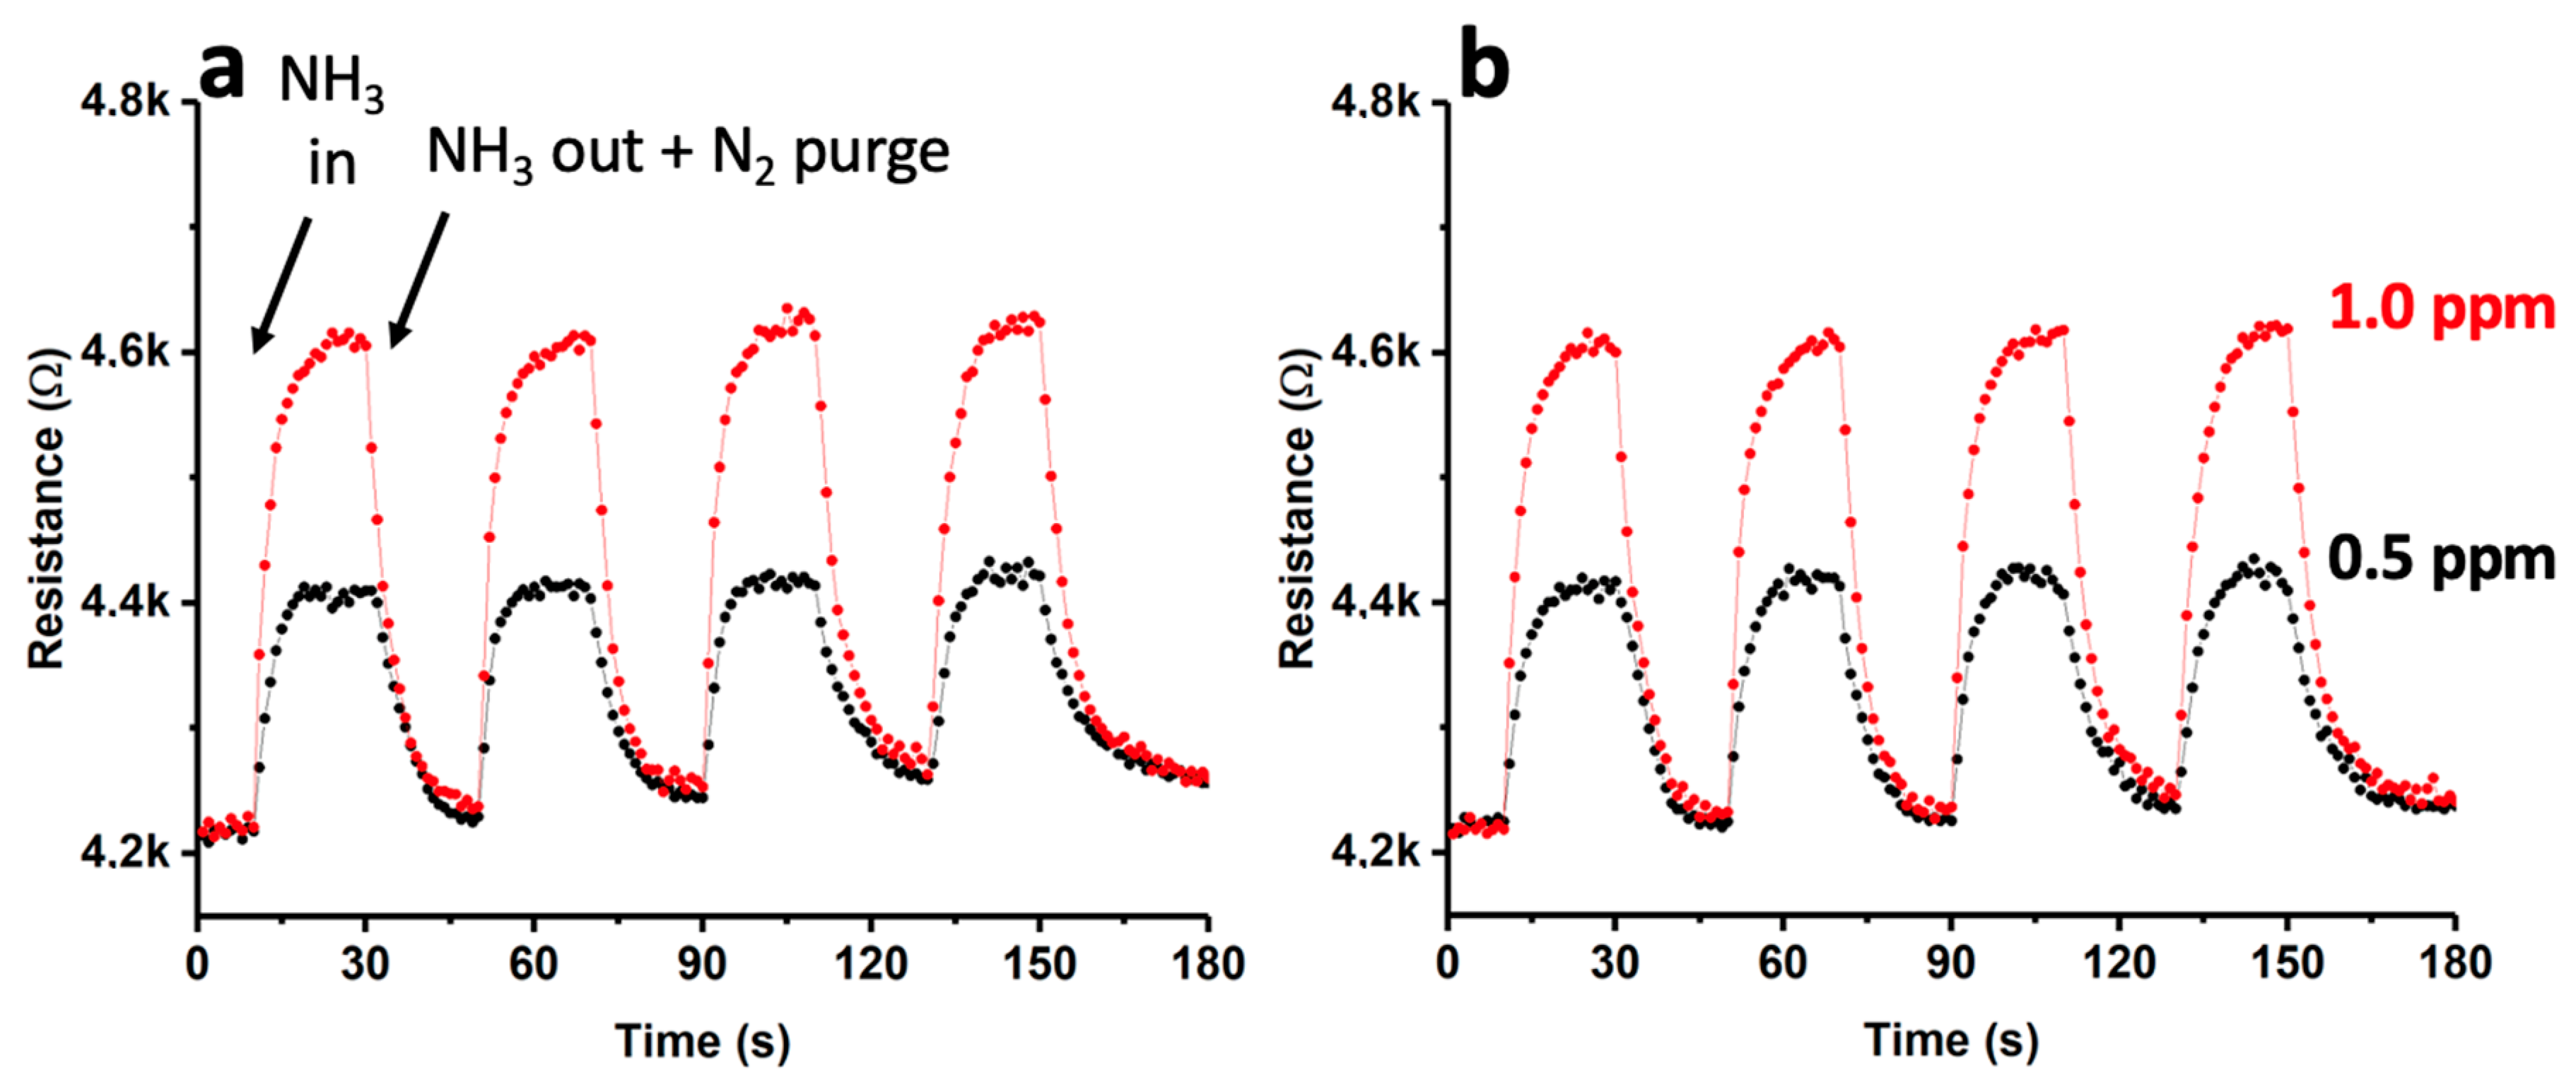
3.2. Assembly of the Device and Gas Sensing Properties

The manufacture of the ammonia sensors is described in Section 2 (Materials and Methods). The different stages are summarized in Figure 7. As a result, three types of sensors were obtained: (i) Au@SWCNTs with AuNPs deposited through sputtering, (ii) Au@SWCNTs with AuNPs deposited through chemical impregnation and subsequent reduction, and (iii) MoS2-Au@SWCNTs with AuNPs deposited through sputtering and MoS2 through impregnation. The results obtained with the sensors based on the chemical impregnation of the gold were less efficient than those obtained through sputtering, so the incorporation of MoS2 was only performed in sensors with AuNPs deposited through sputtering. Figure 8 shows an image of the sensor based on lines of MoS2-Au@SWCNTs, together with its schematic. The manufactured devices were tested using exposure to low concentrations of ammonia (0.5 ppm and 1 ppm). The measurements were carried out at two temperatures (25 °C and 140 °C) and using short cycles of exposure to ammonia followed by purging with nitrogen for a total time of 90 min.
In this study, a single-walled carbon nanotube (SWNT)-based device with gold nanoparticles (AuNPs) deposited on its surface via sputtering (type-1) was exposed to controlled concentrations of ammonia dissolved in nitrogen, specifically, 0.5 ppm and 1 ppm. The behavior of this sensor was analyzed at two different temperatures, 25 °C and 140 °C, using short cycles of ammonia input followed by purging with nitrogen. The results of these experiments are presented in Figure 9. Notably, the response of the material was found to be consistent, with resistance values (R) that remained constant over the four cycles. At 25 °C (as shown in Figure 9a), a rapid increase in R was observed upon the introduction of ammonia. Even when the ammonia flow was terminated and the detection chamber was purged with N2, R did not fully return to its initial values. The observed effect of increasing resistance values (R) upon exposure to ammonia was found to become more pronounced throughout the multiple cycles studied. Interestingly, at a higher temperature of 140 °C, the recovery of R was more efficient. The results obtained at 25 °C may suggest that a portion of the ammonia that interacted with the sensor remained adsorbed on the surface even after purging with N2. However, when the same process was carried out at a higher temperature (140 °C), the N2 purge was found to be more effective, resulting in R values that returned to almost their initial values. The interaction energy between the sensor and ammonia could be responsible for this effect, requiring the use of high temperatures to promote the desorption of ammonia [44]. These findings were further supported by conducting the X-ray photoelectron spectroscopy (XPS) analysis (see Figure S1). Specifically, Figure S1 shows the spectra corresponding to N1s after ammonia adsorption on the SWCNTs at 25 °C and 140 °C, followed by purging with N2. As shown in Figure S1a, at 25 °C, a clear signal from ammonia was still observed. However, at 140 °C (Figure S1b), this signal was significantly reduced, indicating a more efficient removal of ammonia from the sensor’s surface. For the comparative analysis, we contrasted the obtained results with those from a SWCNT-based sensor (without the presence of AuNPs). The outcomes are presented in Figure S2, demonstrating a less linear response with a considerably smaller change in R compared to the sensor with AuNPs. This justified the necessity of incorporating AuNPs to enhance the device’s response. To further investigate the response of the AuNPs-SWCNT-based sensor, we conducted an extensive study with a single cycle of exposure to ammonia, as shown in Figure S3. The initial R value of the device before the exposure to ammonia was approximately 4.2 kΩ. Upon exposure to 1 ppm ammonia at 25 °C, a rapid increase in R was observed, peaking at approximately 4.6 kΩ. The response time (tresp) was determined to be 12 s under the given conditions. Upon the cessation of ammonia input and subsequent purging with N2, the recovery time (trec) of R was approximately 52 s, although it did not attain the initial values, as evidenced in Figure 9. Figure S3 reveals that the recovered R value (ΔR) was approximately 19% greater than the initial R.
To investigate the impact of the gold impregnation method on the sensor’s behavior, a new experiment was conducted. Herein, AuNPs were deposited using a chemical impregnation method and reduction process, as described in Section 2.3. Figure 10 depicts the outcomes achieved using this material under experimental conditions equivalent to those delineated earlier.
As illustrated in Figure 10, the performance of this sensor exhibited a resemblance to that observed in the case of AuNP deposition through sputtering. Nevertheless, the response times (tresp) experienced a significant increase, reaching nearly 25 s, which was twice that of the sensor fabricated via sputtering. Conversely, it is worth noting that the recovery of R, at both 25 °C and 140 °C, was similar to that observed in a sensor produced through sputtering.
Based on the outcomes obtained using different materials, and considering the sensor exhibited the best performance due to AuNPs deposition through sputtering, a novel device was prepared using MoS2-Au(sputtering)-SWCNTs. To achieve this, a fresh material composed of Au(sputtering)-SWCNTs was generated and, subsequently, MoS2 was incorporated onto it, following the procedure delineated in Section 2.5. Subsequently, this device underwent identical ammonia exposure trials, with the findings illustrated in Figure 11.
In this study, it could be observed that the trend of the sensor under analysis was similar to that of other sensors that were previously analyzed. At a temperature of 25 °C, the retention of ammonia was still evident due to the fact that the sensor did not recover its previous values. However, at a temperature of 140 °C, the recovery of the sensor was more efficient. Comparing the results of this sensor with those obtained in the absence of MoS2, a greater stability and better behavior were observed, as shown in Figure 9. The reason for this behavior is still unclear, although it was initially suggested that both AuNPs and MoS2 may have had a potential effect on the flow and movement of electrons throughout the device, representing active zones for interactions with ammonia.
In order to study the behavior of the sensor based on MoS2-Au(sputtering)-SWCNTs under alternating cycles of exposure to different concentrations of ammonia at 140 °C, an additional study was conducted (see Figure 12). As could be observed, the device performed efficiently at these concentrations, with a recovery of R similar to that observed in previous exposures.
Finally, the same device was subjected to increasing concentrations of ammonia to investigate the proportionality of the response (see Figure 13). The sensor was exposed to concentrations of 0.5, 1, 5, and 10 ppm. It could be observed that exposure to concentrations higher than those previously studied (e.g., 5 and 10 ppm) resulted in a clearly nonlinear response, indicating device saturation. At an ammonia concentration of 25 ppm (not shown), the maximum resistance (R) measured did not surpass 7 kΩ, providing evidence of the device’s saturation. The reason for this behavior could be attributed to the relatively low quantity of single-walled carbon nanotubes (SWCNTs) grown on the device’s lanes, inevitably limiting the sensor’s practicality.
The results obtained in the present study were certainly relevant, because they demonstrated the use of these sensors for detecting low concentrations of ammonia. Table 1 shows a state-of-the-art comparison of some of the most representative ammonia sensors developed in recent years. From the perspective of environmental sustainability, all components used in the development of these sensors are environmentally friendly. The gold nanoparticles, MoS2, and Si have no environmental implications at the concentrations used. Additionally, the economic cost of these materials is minimal, even in the case of gold, since the amounts used for manufacturing are indeed negligible. This clearly represents a great advantage over other current or in-development sensors.

4. Conclusions

In this study, several ammonia chemical sensors based on carbon nanotubes were developed. The carbon nanotubes were successfully synthesized on Si(100) substrates, which were coated with thermal SiO2. The support was subsequently patterned to facilitate the growth of vertically aligned single-walled carbon nanotubes (SWCNTs) using a catalytic method. The resistance of the resulting composite materials, including those generated through the deposition of AuNPs and MoS2, was evaluated before and after exposure to ammonia. The sensitivity of the sensors was found to be temperature-dependent, with greater efficiency observed at 140 °C compared to 25 °C. However, the results indicated that the saturation of the sensor occurred at relatively low concentrations (above 1 ppm) for the devices manufactured, and the response at 5 and 10 ppm was clearly nonlinear, which could be attributed to the limited number of SWCNTs grown on the devices. The results of this study show promise and provide the foundation for future research aimed at detecting trace amounts of ammonia in the ppb concentration range. Although the sensors developed in this study required several preparation steps, they were obtained easily, which could facilitate their potential application. The next phase of this research, which is already underway, is to involve the interconnection of several sensors, evaluating the selectivity of these sensors towards ammonia, and studying other factors that can significantly affect the device’s sensitivity, such as humidity or the presence of other chemicals.

Supplementary Materials

The following supporting information can be downloaded at: https://www.mdpi.com/article/10.3390/chemosensors11040247/s1, Figure S1: XPS transition of N1s from SWCNTs exposed to 1 ppm ammonia at 25 °C (a) and 140 °C (b), followed by N2 purging; Figure S2: dynamic response curve for SWCNTs towards NH3 (0.5 ppm and 1 ppm) at 25 °C (a) and 140 °C (b); Figure S3: the response time and recovery time of the sensor based on Au-SWCNTs to an exposure of 1 ppm ammonia concentration at 25 °C.

Author Contributions

Conceptualization, F.M.; methodology, F.M. and A.M.; formal analysis, F.M.; investigation, A.M., C.M., M.C., J.D. and F.I.P.; resources, A.M., F.M., C.M. and F.I.P.; writing—original draft preparation, F.M.; writing—review and editing, A.M., C.M., M.C., J.D. and F.I.P.; supervision, F.M.; project administration, F.M.; funding acquisition, A.M., F.M., M.C., J.D., C.M. and F.I.P. All authors have read and agreed to the published version of the manuscript.

Funding

Financial support from the NSF Center for the Advancement of Wearable Technologies-CAWT (grant 1849243), from the Consortium of Hybrid Resilient Energy Systems (DE-NA0003982), and from the Spanish Ministry of Economy and Competitiveness, under NanoCat-Com Project (PID2021-124667OB-I00) are gratefully acknowledged.

Institutional Review Board Statement

Not applicable for studies not involving humans or animals.

Informed Consent Statement

Not applicable for studies not involving humans.

Data Availability Statement

The data are contained in the article and are available from the corresponding authors on reasonable request.

Acknowledgments

The facilities provided by the National Center for Electron Microscopy at Complutense University of Madrid (Spain), by “Instituto de Micro y Nanotecnología IMN-CNM, CSIC, CEI UAM + CSIC”, and by the Materials Characterization Center at University of Puerto Rico are gratefully acknowledged.

Conflicts of Interest

The authors declare no conflict of interest.

References

  1. Li, X.; Li, X.; Li, Z.; Wang, J.; Zhang, J. WS2 Nanoflakes Based Selective Ammonia Sensors at Room Temperature. Sens. Actuators B Chem. 2017, 240, 273–277. [Google Scholar] [CrossRef]
  2. Wang, Y.; Liu, J.; Cui, X.; Gao, Y.; Ma, J.; Sun, Y.; Sun, P.; Liu, F.; Liang, X.; Zhang, T.; et al. NH3 Gas Sensing Performance Enhanced by Pt-Loaded on Mesoporous WO3. Sens. Actuators B Chem. 2017, 238, 473–481. [Google Scholar] [CrossRef]
  3. Kanan, S.; El-Kadri, O.; Abu-Yousef, I.; Kanan, M. Semiconducting Metal Oxide Based Sensors for Selective Gas Pollutant Detection. Sensors 2009, 9, 8158–8196. [Google Scholar] [CrossRef] [PubMed]
  4. Kwak, D.; Lei, Y.; Maric, R. Ammonia Gas Sensors: A Comprehensive Review. Talanta 2019, 204, 713–730. [Google Scholar] [CrossRef]
  5. Verma, A.; Gupta, R.; Verma, A.S.; Kumar, T. A Review of Composite Conducting Polymer-Based Sensors for Detection of Industrial Waste Gases. Sens. Actuators Rep. 2023, 5, 100143. [Google Scholar] [CrossRef]
  6. Baek, S.; Khazi, M.I.; Kim, J.-M. Colorimetric and Fluorometric Ammonia Sensor Based on Protonated Bipyridyl-Containing Polydiacetylene. Dye. Pigment. 2023, 215, 111254. [Google Scholar] [CrossRef]
  7. Toxic FAQ Sheet of Ammonia; Agency for Toxic Substances and Disease Registry (ATSDR); 2004; CAS 7664-41-7. Available online: https://www.atsdr.cdc.gov/toxfaqs/tfacts126.pdf (accessed on 14 January 2023).
  8. Tai, H.; Duan, Z.; He, Z.; Li, X.; Xu, J.; Liu, B.; Jiang, Y. Enhanced Ammonia Response of Ti3C2T Nanosheets Supported by TiO2 Nanoparticles at Room Temperature. Sens. Actuators B Chem. 2019, 298, 126874. [Google Scholar] [CrossRef]
  9. Tai, H.; Duan, Z.; Wang, Y.; Wang, S.; Jiang, Y. Paper-Based Sensors for Gas, Humidity, and Strain Detections: A Review. ACS Appl. Mater. Interfaces 2020, 12, 31037–31053. [Google Scholar] [CrossRef]
  10. Panes-Ruiz, L.A.; Shaygan, M.; Fu, Y.; Liu, Y.; Khavrus, V.; Oswald, S.; Gemming, T.; Baraban, L.; Bezugly, V.; Cuniberti, G. Toward Highly Sensitive and Energy Efficient Ammonia Gas Detection with Modified Single-Walled Carbon Nanotubes at Room Temperature. ACS Sens. 2018, 3, 79–86. [Google Scholar] [CrossRef] [PubMed]
  11. Mackin, C.; Schroeder, V.; Zurutuza, A.; Su, C.; Kong, J.; Swager, T.M.; Palacios, T. Chemiresistive Graphene Sensors for Ammonia Detection. ACS Appl. Mater. Interfaces 2018, 10, 16169–16176. [Google Scholar] [CrossRef]
  12. Tai, H.; Wang, S.; Duan, Z.; Jiang, Y. Evolution of Breath Analysis Based on Humidity and Gas Sensors: Potential and Challenges. Sens. Actuators B Chem. 2020, 318, 128104. [Google Scholar] [CrossRef]
  13. Ryu, H.; Thompson, D.; Huang, Y.; Li, B.; Lei, Y. Electrochemical Sensors for Nitrogen Species: A Review. Sens. Actuators Rep. 2020, 2, 100022. [Google Scholar] [CrossRef]
  14. Yavarinasab, A.; Janfaza, S.; Tahmooressi, H.; Ghazi, M.; Tasnim, N.; Hoorfar, M. A Selective Polypyrrole-Based Sub-ppm Impedimetric Sensor for the Detection of Dissolved Hydrogen Sulfide and Ammonia in a Mixture. J. Hazard. Mater. 2021, 416, 125892. [Google Scholar] [CrossRef] [PubMed]
  15. Veluswamy, P.; Sathiyamoorthy, S.; Karunakaran, G.; Lee, C.W.; Kuznetsov, D.; Kadarkaraithangam, J.; Ikeda, H. Sono-Synthesis Approach of Reduced Graphene Oxide for Ammonia Vapour Detection at Room Temperature. Ultrason. Sonochem. 2018, 48, 555–566. [Google Scholar] [CrossRef] [PubMed]
  16. Ji, Y.; Duan, K.; Lu, Z.; Ren, W. Mid-Infrared Absorption Spectroscopic Sensor for Simultaneous and in-Situ Measurements of Ammonia, Water and Temperature. Sens. Actuators B Chem. 2022, 371, 132574. [Google Scholar] [CrossRef]
  17. Fu, H.; Zhang, J.; Ding, J.; Wang, Q.; Li, H.; Shao, M.; Liu, Y.; Liu, Q.; Zhang, M.; Zhu, Y.; et al. Ultra Sensitive NH3 Gas Detection Using Microfiber Bragg Grating. Opt. Commun. 2018, 427, 331–334. [Google Scholar] [CrossRef]
  18. Passaro, V.; Dell’Olio, F.; De Leonardis, F. Ammonia Optical Sensing by Microring Resonators. Sensors 2007, 7, 2741–2749. [Google Scholar] [CrossRef]
  19. Abdelaziz, O.A.; Abdallah, R.M.; Khater, R.A.; Abo Dena, A.S.; El-Sherbiny, I.M. Optical Ammonia-Sensing Probe Based on Surface-Plasmon Resonance of Silver-Nanoparticle-Decorated Superparamagnetic Dendritic Nanoparticles. Plasmonics 2023, 18, 201–212. [Google Scholar] [CrossRef]
  20. Ahmed, S.; Park, Y.; Okuda, H.; Ono, S.; Korposh, S.; Lee, S.-W. Fabrication of Humidity-Resistant Optical Fiber Sensor for Ammonia Sensing Using Diazo Resin-Photocrosslinked Films with a Porphyrin-Polystyrene Binary Mixture. Sensors 2021, 21, 6176. [Google Scholar] [CrossRef]
  21. Maierhofer, M.; Rieger, V.; Mayr, T. Optical Ammonia Sensors Based on Fluorescent Aza-BODIPY Dyes-a Flexible Toolbox. Anal. Bioanal. Chem. 2020, 412, 7559–7567. [Google Scholar] [CrossRef]
  22. Lu, D.; Qi, Z. Optical Ammonia-Nitrogen Sensor with Wide Dynamic Measurement Range. In Proceedings of the 2019 IEEE SENSORS, Montreal, QC, Canada, 27–30 October 2019; pp. 1–4. [Google Scholar]
  23. Fernández-Ramos, M.D.; Capitán-Vallvey, L.F.; Pastrana-Martínez, L.M.; Morales-Torres, S.; Maldonado-Hódar, F.J. Chemoresistive NH3 Gas Sensor at Room Temperature Based on the Carbon Gel-TiO2 Nanocomposites. Sens. Actuators B Chem. 2022, 368, 132103. [Google Scholar] [CrossRef]
  24. Nunes Simonetti, E.A.; Cardoso de Oliveira, T.; Machado, Á.; Coutinho Silva, A.A.; Silva dos Santos, A.; de Simone Cividanes, L. TiO2 as a Gas Sensor: The Novel Carbon Structures and Noble Metals as New Elements for Enhancing Sensitivity—A Review. Ceram. Int. 2021, 47, 17844–17876. [Google Scholar] [CrossRef]
  25. Pereira, P.F.M.; de Sousa Picciani, P.H.; Calado, V.; Tonon, R.V. Electrical Gas Sensors for Meat Freshness Assessment and Quality Monitoring: A Review. Trends Food Sci. Technol. 2021, 118, 36–44. [Google Scholar] [CrossRef]
  26. Zhao, Z.; Yang, H.; Wei, Z.; Xue, Y.; Sun, Y.; Zhang, W.; Li, P.; Gong, W.; Zhuiykov, S.; Hu, J. NH3 Sensor Based on 3D Hierarchical Flower-Shaped n-ZnO/p-NiO Heterostructures Yields Outstanding Sensing Capabilities at Ppb Level. Sensors 2020, 20, 4754. [Google Scholar] [CrossRef]
  27. Van Duy, L.; Nguyet, T.T.; Le, D.T.T.; Van Duy, N.; Nguyen, H.; Biasioli, F.; Tonezzer, M.; Di Natale, C.; Hoa, N.D. Room Temperature Ammonia Gas Sensor Based on P-Type-like V2O5 Nanosheets towards Food Spoilage Monitoring. Nanomaterials 2022, 13, 146. [Google Scholar] [CrossRef]
  28. Star, A.; Joshi, V.; Skarupo, S.; Thomas, D.; Gabriel, J.-C.P. Gas Sensor Array Based on Metal-Decorated Carbon Nanotubes. J. Phys. Chem. B 2006, 110, 21014–21020. [Google Scholar] [CrossRef]
  29. Datta, K.; Ghosh, P.; More, M.A.; Shirsat, M.D.; Mulchandani, A. Controlled Functionalization of Single-Walled Carbon Nanotubes for Enhanced Ammonia Sensing: A Comparative Study. J. Phys. D Appl. Phys. 2012, 45, 355305. [Google Scholar] [CrossRef]
  30. Chen, X.; Chen, X.; Ding, X.; Yu, X.; Yu, X. Enhanced Ammonia Sensitive Properties and Mechanism Research of PANI Modified with Hydroxylated Single-Walled Nanotubes. Mater. Chem. Phys. 2019, 226, 378–386. [Google Scholar] [CrossRef]
  31. Mubeen, S.; Lai, M.; Zhang, T.; Lim, J.-H.; Mulchandani, A.; Deshusses, M.A.; Myung, N.V. Hybrid Tin Oxide-SWNT Nanostructures Based Gas Sensor. Electrochim. Acta 2013, 92, 484–490. [Google Scholar] [CrossRef]
  32. Freddi, S.; Emelianov, A.V.; Bobrinetskiy, I.I.; Drera, G.; Pagliara, S.; Kopylova, D.S.; Chiesa, M.; Santini, G.; Mores, N.; Moscato, U.; et al. Development of a Sensing Array for Human Breath Analysis Based on SWCNT Layers Functionalized with Semiconductor Organic Molecules. Adv. Healthc. Mater. 2020, 9, 2000377. [Google Scholar] [CrossRef]
  33. Santra, S.; Sinha, A.K.; Ray, S.K. A Flexible Room Temperature Ammonia Sensor Based on Large Area, Transparent Single Wall Carbon Nanotube Thin Film. In Proceedings of the 2018 IEEE SENSORS, New Delhi, India, 28–31 October 2018; pp. 1–4. [Google Scholar]
  34. Márquez, F.; López, V.; Morant, C.; Roque-Malherbe, R.; Domingo, C.; Elizalde, E.; Zamora, F. Structure and Characterization of Vertically Aligned Single-Walled Carbon Nanotube Bundles. J. Nanomater. 2010, 2010, 1–7. [Google Scholar] [CrossRef]
  35. Fontánez, K.; García, D.; Ortiz, D.; Sampayo, P.; Hernández, L.; Cotto, M.; Ducongé, J.; Díaz, F.; Morant, C.; Petrescu, F.; et al. Biomimetic Catalysts Based on Au@TiO2-MoS2-CeO2 Composites for the Production of Hydrogen by Water Splitting. Int. J. Mol. Sci. 2022, 24, 363. [Google Scholar] [CrossRef]
  36. Lee, S.; Lee, B. XPS Investigation and Field Emission Property of the Ar Plasma Processed Carbon Nanotube Films. Trans. Electr. Electron. Mater. 2008, 9, 52–56. [Google Scholar] [CrossRef]
  37. Briggs, D.; Seah, M. Practical Surface Analysis; Wiley: New York, NY, USA, 1994. [Google Scholar]
  38. Ma, J.; Xing, M.; Yin, L.; San Hui, K.; Hui, K.N. Porous Hierarchical TiO2/MoS2/rGO Nanoflowers as Anode Material for Sodium Ion Batteries with High Capacity and Stability. Appl. Surf. Sci. 2021, 536, 147735. [Google Scholar] [CrossRef]
  39. Park, Y.; Hembram, K.P.S.S.; Yoo, R.; Jang, B.; Lee, W.; Lee, S.-G.; Kim, J.-G.; Kim, Y.-I.; Moon, D.J.; Lee, J.-K.; et al. Reinterpretation of Single-Wall Carbon Nanotubes by Raman Spectroscopy. J. Phys. Chem. C 2019, 123, 14003–14009. [Google Scholar] [CrossRef]
  40. Jorio, A.; Saito, R.; Hafner, J.H.; Lieber, C.M.; Hunter, M.; McClure, T.; Dresselhaus, G.; Dresselhaus, M.S. Structural (n,m) Determination of Isolated Single-Wall Carbon Nanotubes by Resonant Raman Scattering. Phys. Rev. Lett. 2001, 86, 1118–1121. [Google Scholar] [CrossRef] [PubMed]
  41. Wieting, T.J.; Verble, J.L. Infrared and Raman Studies of Long-Wavelength Optical Phonons in Hexagonal MoS2. Phys. Rev. B 1971, 3, 4286–4292. [Google Scholar] [CrossRef]
  42. Li, H.; Zhang, Q.; Yap, C.C.R.; Tay, B.K.; Edwin, T.H.T.; Olivier, A.; Baillargeat, D. From Bulk to Monolayer MoS2: Evolution of Raman Scattering. Adv. Funct. Mater. 2012, 22, 1385–1390. [Google Scholar] [CrossRef]
  43. Castellanos-Gomez, A.; Quereda, J.; van der Meulen, H.P.; Agraït, N.; Rubio-Bollinger, G. Spatially Resolved Optical Absorption Spectroscopy of Single- and Few-Layer MoS2 by Hyperspectral Imaging. Nanotechnology 2016, 27, 115705. [Google Scholar] [CrossRef] [PubMed]
  44. Arshad, M.; Arshad, S.; Majeed, M.K.; Frueh, J.; Chang, C.; Bilal, I.; Niaz, S.I.; Khan, M.S.; Tariq, M.A.; Yasir Mehboob, M. Transition Metal-Decorated Mg12O12 Nanoclusters as Biosensors and Efficient Drug Carriers for the Metformin Anticancer Drug. ACS Omega 2023, 8, 11318–11325. [Google Scholar] [CrossRef]
  45. Zeng, Y.; Lou, Z.; Wang, L.; Zou, B.; Zhang, T.; Zheng, W.; Zou, G. Enhanced Ammonia Sensing Performances of Pd-Sensitized Flowerlike ZnO Nanostructure. Sens. Actuators B Chem. 2011, 156, 395–400. [Google Scholar] [CrossRef]
  46. Su, P.-G.; Yang, L.-Y. NH3 Gas Sensor Based on Pd/SnO2/rGO Ternary Composite Operated at Room-Temperature. Sens. Actuators B Chem. 2016, 223, 202–208. [Google Scholar] [CrossRef]
  47. Hwang, J.Y.; Lee, Y.; Lee, G.H.; Lee, S.Y.; Kim, H.-S.; Kim, S.; Park, H.J.; Kim, S.-J.; Lee, B.Z.; Choi, M.S.; et al. Room-Temperature Ammonia Gas Sensing via Au Nanoparticle-Decorated TiO2 Nanosheets. Discov. Nano 2023, 18, 47. [Google Scholar] [CrossRef]
  48. Shooshtari, M.; Salehi, A. Ammonia Room-Temperature Gas Sensor Using Different TiO2 Nanostructures. J. Mater. Sci. Mater. Electron. 2021, 32, 17371–17381. [Google Scholar] [CrossRef]
  49. Das, B.; Riyajuddin, S.; Ghosh, K.; Ghosh, R. Room-Temperature Ammonia Detection Using Layered Bi2Se3/Bi2O3: A Next-Generation Sensor. ACS Appl. Electron. Mater. 2023, 5, 948–956. [Google Scholar] [CrossRef]
  50. Le, Q.T.; Shikoh, A.S.; Kang, K.; Lee, J.; Kim, J. Room-Temperature Sub-Ppm Detection and Machine Learning-Based High-Accuracy Selective Analysis of Ammonia Gas Using Silicon Vertical Microwire Arrays. ACS Appl. Electron. Mater. 2023, 5, 357–366. [Google Scholar] [CrossRef]
  51. Zhou, Y.; Wang, Y.; Wang, Y.; Yu, H.; Zhang, R.; Li, J.; Zang, Z.; Li, X. MXene Ti3C2Tx -Derived Nitrogen-Functionalized Heterophase TiO2 Homojunctions for Room-Temperature Trace Ammonia Gas Sensing. ACS Appl. Mater. Interfaces 2021, 13, 56485–56497. [Google Scholar] [CrossRef]
  52. Renganathan, B.; Rao, S.K.; Ganesan, A.R.; Deepak, A.; Kannapiran, N. Investigation of the Room Temperature Gas-Detecting Potential of CeO2-Doped ZnO at Different Ratios Using Clad-Modified Fiber Optic Gas Sensor. J. Mater. Sci. Mater. Electron. 2022, 33, 23974–23985. [Google Scholar] [CrossRef]
Figure 1. Diagram of the catalytic CVD system used for the growth of SWCNTs.
Chemosensors 11 00247 g001
Figure 2. Schematic diagram of the setup for ammonia gas sensing.
Chemosensors 11 00247 g002
Figure 3. SEM micrographs of SWCNTs-AuNPs (a) and MoS2 nanosheets (b). The arrows in (a) indicate the presence of AuNPs.
Chemosensors 11 00247 g003
Figure 4. HR-TEM micrographs of the different components of the synthesized bundles of SWCNTs showing the diameter of an isolated nanotube (a); Au NP, showing the characteristics of face-centered-cubic (fcc) Au (111) (d = 0.23 nm) (b); and MoS2 single layer with the corresponding selected area electron diffraction (SAED) pattern (c).
Chemosensors 11 00247 g004
Figure 5. XPS core level spectra for C1s (a); Au4f (b); and Mo3d/S2s (c).
Chemosensors 11 00247 g005
Figure 6. Raman spectra of as-synthesized SWCNTs (a); MoS2 nanosheets (b); AuNPs-SWCNTs on TiN-SiO2-Si substrates (c); and MoS2-AuNPs-SWCNTs on TiN-SiO2-Si substrates (d).
Chemosensors 11 00247 g006
Figure 7. Schematic illustration of the substrate preparation process and the synthesis of SWCNTs: (i) obtaining thermal SiO2 (1); (ii) TiN deposition and subsequent patterning of the substrate (24); (iii) catalyst deposition (5); and (iv) growth of SWCNTs through CCVD (6).
Chemosensors 11 00247 g007
Figure 8. Picture of the device based on MoS2-Au@SWCNTs and schematic illustration of the different components.
Chemosensors 11 00247 g008
Figure 9. Dynamic response curve for the Au(sputtering)-SWCNT composite gas sensor towards NH3 (0.5 ppm and 1 ppm) at 25 °C (a) and 140 °C (b).
Chemosensors 11 00247 g009
Figure 10. Dynamic response curves for the Au(chemical)-SWCNT composite gas sensor towards NH3 (0.5 ppm and 1 ppm) at 25 °C (a) and 140 °C (b).
Chemosensors 11 00247 g010
Figure 11. Dynamic response curves for the MoS2-Au(sputtering)-SWCNT composite gas sensor towards NH3 (0.5 ppm and 1 ppm) at 25 °C (a) and 140 °C (b).
Chemosensors 11 00247 g011
Figure 12. Dynamic response curves for the MoS2-Au(sputtering)-SWCNT composite gas sensor towards alternating exposure to NH3 (0.5 ppm and 1 ppm) at 140 °C.
Chemosensors 11 00247 g012
Figure 13. Dynamic response curves for the MoS2-Au(sputtering)-SWCNT composite gas sensor towards exposure to NH3 (0.5, 1, 5, and 10 ppm) at 140 °C.
Chemosensors 11 00247 g013
Table 1. Comparison of the results obtained in the present research with other ammonia sensors.
Sensing MaterialAmmonia Detection LevelsReferences
Polypyrrole-modified electrode0.5–5.0 ppm[14]
Reduced Graphene Oxide (rGO)1–100 ppm[15]
Pd-doped ZnO >5 ppm[45]
Pd-SnO2-rGO5–150 ppm[46]
Au-TiO21–20 ppm[47]
TiO250 ppm[48]
Bi2Se3/Bi2O35–180 ppm[49]
Si2–500 ppm[50]
Ti3C2Tx-TiO2>200 ppb[51]
CeO2-ZnO10–100 ppm[52]
MoS2-Au(sputtering)-SWCNTs0.5 ppmThis research
Disclaimer/Publisher’s Note: The statements, opinions and data contained in all publications are solely those of the individual author(s) and contributor(s) and not of MDPI and/or the editor(s). MDPI and/or the editor(s) disclaim responsibility for any injury to people or property resulting from any ideas, methods, instructions or products referred to in the content.

