Article

Sensitive Evanescence-Field Waveguide Interferometer for Aqueous Nitro-Explosive Sensing

1
Key Laboratory of Icing and Anti/De-icing, China Aerodynamics Research and Development Center, Mianyang 621000,China
2
College of Chemistry and Life Science, Institute of Functional Molecules, Chengdu Normal University, Chengdu 610000, China
3
School of Optoelectronic Science and Engineering, University of Electronic Science and Technology of China, Chengdu 610000, China
*
Author to whom correspondence should be addressed.
Chemosensors 2023, 11(4), 246; https://doi.org/10.3390/chemosensors11040246
Submission received: 16 February 2023 / Revised: 22 March 2023 / Accepted: 13 April 2023 / Published: 15 April 2023
(This article belongs to the Collection Advances of Chemical and Biosensors in China)

Abstract

:
The development of novel chemical nitro-explosive sensors with high sensitivity, low cost and a compact size is essential for homeland security, environmental protection and addressing military challenges. Polymeric optical waveguides based on refractive index sensing are widely used in biochemical detection due to their advantages of large-scale integration, low cost, high sensitivity and anti-electromagnetic interference. In this study, we designed and fabricated a polymer waveguide Mach–Zehnder interferometer (MZI) sensor to detect 2,4-dinitrotoluene (DNT) in water. One phase shifter of the MZI waveguide was functionalized by coating a thin cladding layer of polycarbonate with dipolar chromophores and used as the sensing arm; the other arm was coated with passive epoxy resin cladding and used as the reference arm. The phase difference between the two arms of the MZI was modulated using the refractive index (RI) change in the polycarbonate cladding when dipolar chromophores interacted with electro-deficient DNT. The theoretical sensitivity of the designed MZI can reach up to 24,696 nm/RIU. When used for explosive detection, our fabricated sensor had a maximum wavelength shift of 4.465 nm and good linear relation, with an R2 of 0.96 between the wavelength shift and a concentration ranging from 3.5 × 10⁻⁵ to 6.3 × 10⁻⁴ mol/L. The sensitivity of our device was 6821.6 nm/(mol/L). The design of an unbalanced MZI sensor, together with the sensing material, provides a new approach to using low-cost, compact and highly sensitive devices for in-field explosive detection.

1. Introduction

2,4-dinitrotoluene (DNT) is an energetic material that can be used in synthetic pesticide and plastic explosives [1]. Improper use of DNT could have serious consequences for homeland security, ecology and human health. In recent years, the reliable and accurate detection of energetic materials has become an issue of international concern and is crucial for homeland security, environmental protection and military challenges. The recent rise in global terrorism means that the use of these methods to detect explosives should be both sensitive and low cost. Trained bees [2], sniffer dogs [3], surface-enhanced Raman spectroscopy [4,5], mass spectroscopy [6], X-ray imaging [7], thermal neutron analysis [8] and microwave-induced thermoacoustic imaging [9] have been proposed as suitable methods for the detection of these explosives. Although all of the abovementioned methods offer advantages, there are many improvements to be made to the response speed, cost, sensitivity and in-field applications of explosive sensors [10,11]. Although most studies focus on explosive vapor detection, relatively few studies consider the importance of explosive detection in an aqueous solution [12]. Nitro-explosives dissolved in water can cause water pollution and plant contamination. Considering the environment and food safety, detecting the concentration of explosives in water is also an urgent need [13].
In order to detect explosives, tremendous efforts have been made in the fields of materials and devices engineering. Novel functional materials, such as metal–organic frameworks [14,15,16,17], carbon nanomaterials [12,18,19,20,21,22], and organic/polymeric-conjugated materials [23,24,25,26,27,28,29,30] have been extensively investigated for their use in practical explosive sensors. Due to their flexible synthetic process, organic/polymeric materials are particularly popular in the design of optical sensors [31]. After interaction with explosives, the optical or electronic properties of functional material change [32]. In device engineering, optical fiber and waveguide sensors based on refractive index (RI) changes in functional materials are regarded as a new approach to detecting explosives [33]. Specifically, long-period fiber grating, Bragg grating and tapper fiber sensors coated with fluorescent materials or nanomaterials have been developed for real-time explosive detection [34,35,36,37,38,39]. Optical waveguide explosive vapor sensors with different structures and materials have been successfully demonstrated due to the advantages of large-scale integration, low cost, high sensitivity and anti-electromagnetic interference [33,40,41,42]. However, optical waveguide sensors for explosive detection in water are less extensively studied [43] because the refractive index of water is much smaller than most waveguide materials, making it difficult to use high-sensitivity refractive index sensors in water [44,45].
In this paper, we focus on the design of an optical waveguide device for highly sensitive refractive index sensing in an aqueous solution. Specifically, we carefully tuned the group refractive index difference and the intensity of the evanescent field using numerical analysis; we also designed an unbalanced Mach–Zehnder interferometer (MZI) by choosing two phase shifters with different waveguide width and cladding materials. The sensitivity of such an MZI in refractive index change is exceptionally high, reaching up to 24,696 nm/RIU (refractive index unit). For device fabrication, we selected an inexpensive photosensitive epoxy resin and explosive-sensitive polycarbonate material. The MZI waveguide was fabricated using two photolithography and development processes. The final test results show that an MZI sensor operating at infrared wavelengths (C+L band, 1520–1610 nm) can detect explosive DNT in water.

2. Materials and Methods

2.1. Materials and Instruments

Commercial epoxy resins EpoCore (n = 1.5743 at 1538 nm) and EpoClad (n = 1.5595 at 1538 nm) from Micro Resist Technology were used to form the core and cladding of the waveguide in the device fabrication, respectively. These polymeric materials can be directly patterned using a photolithography/development process to form different structures without dry etching. Dipolar chromophore DTCPC was synthesized according to [20,21,22]. Nitro-explosive DNT and other necessary materials were purchased from Sigma Aldrich (St. Louis, MO, USA). Additionally, the molecular weights of the sensing dipolar polycarbonate (DPC) were obtained using gel permeation chromatography with tetrahydrofuran (THF) eluent and polystyrene standards. Scanning electronic microscopy (SEM) images were taken by Inspect F (FEI, Hillsboro, Ok, USA). The refractive indices of polymer films were measured using a commercial prism coupler (Metricon 2010, Metricon Corporation, Pennington, NJ, USA) at 1538 nm.

2.2. Synthesis of the Sensing Dipolar Polycarbonate

The side-chain polycarbonate containing dipolar chromophore, which is shown in Figure 1, was synthesized by esterification. Specifically, 20 mL of dichloroethane, containing 220 mg of bisphenol A (0.96 mmol), 100 mg of DTCPC (0.22 mmol) and 0.2 mL of pyridine was heated to reflux. Then, 5 mL of dichloroethane with 500 mg of bisphenol A bis (chloroformate) (1.42 mmol) in dichloroethane was added dropwise to the refluxed solution. The solution was stirred for 3 h under reflux. After cooling to room temperature, the solution was poured into 200 mL methanol, thus yielding a large amount of green precipitate. The precipitates were collected via filtration. After that, the precipitates were redissolved in a minimum quantity of CH2Cl2 and reprecipitated in methanol. The products were finally purified via extraction using a Soxhlet extractor in ethyl ether and dried in vacuum at 80 degrees C. The final polymer product DPC was obtained as a green solid (0.55 g, 84%). The molecular weight of DPC measured using gel permeation chromatography was 18,235.

2.3. Refractive-Index-Sensing Principle of DNT Detection

As shown in Figure 1, DPC contains a donor–acceptor dipolar chromophore (DTCPC). This chromophore consists of an electron donor and an electron acceptor linked by an electronic bridge ethylene. Such asymmetry in intramolecular electron distribution results in a large dipole moment of about 21 Debye for a DTCPC. Therefore, this dipole is prone to dipole–dipole interactions between DTCPCs and other dipolar molecules. Because DNT is also a dipolar molecule with a dipole moment of 4.4 Debye, it is believed that there is a strong chromophore–DNT dipole–dipole interaction. In our previous study, it was found that the refractive index of such dipolar polycarbonate film increased by 1 × 10⁻³ after exposure to DNT vapor [42]. In this study, the sensing scenario was an aqueous solution, and the sensing DPC was spin-coated as hydrophobic cladding film of the waveguide device. When an aqueous solution was dropped onto the film, a strong dipole–dipole interaction between DNT and electro-optic polycarbonate (EOPC) occurred at the solid–liquid sensing interface. As a result, DNT was adsorbed by the DPC surface and changed the refractive index of DPC. This refractive index change was then converted to an optical output signal by the optical waveguide sensor. Specifically, in this study, we used a Mach–Zehnder interferometer (MZI) waveguide; therefore, the output optical signal drifted in the central wavelength of the interference spectrum. Different concentrations of DNT absorbed by DPC result in different levels of refractive index change and correspond to different wavelength drifts, which can then be used to quantitatively detect DNT concentration in aqueous solutions.

2.4. MZI Waveguide Design

Polymer waveguides have attracted a lot of interest due to their low cost, tunable refractive index, simple preparation process and ease of constructing three-dimensional structures. Combining polymer waveguides with DPC films can help to construct low-cost and easy-to-fabricate all-polymer explosive sensors. The main polymer waveguide materials used in this paper are commercial epoxy resins, namely EpoCore and Epoclad, which are used as core and cladding materials, respectively. The sensing medium is an aqueous solution with a refractive index of about 1.32. The measured refractive index of the DPC film is 1.5796 @ 1538 nm, which is larger than EpoCore (waveguide core) and EpoClad (lower cladding). Such a refractive index contrast means that the effective refractive index of the waveguide is smaller than the refractive index of the sensitive DPC film, which is not able to support the guide mode in the core. To conquer this challenge, we propose evanescent wave sensing via the use of thin-film DPC with a thickness ten times smaller than that of the waveguide core. Additionally, the sensor structure is an unbalanced Mach–Zehnder interferometer waveguide with a distinct width and upper cladding.
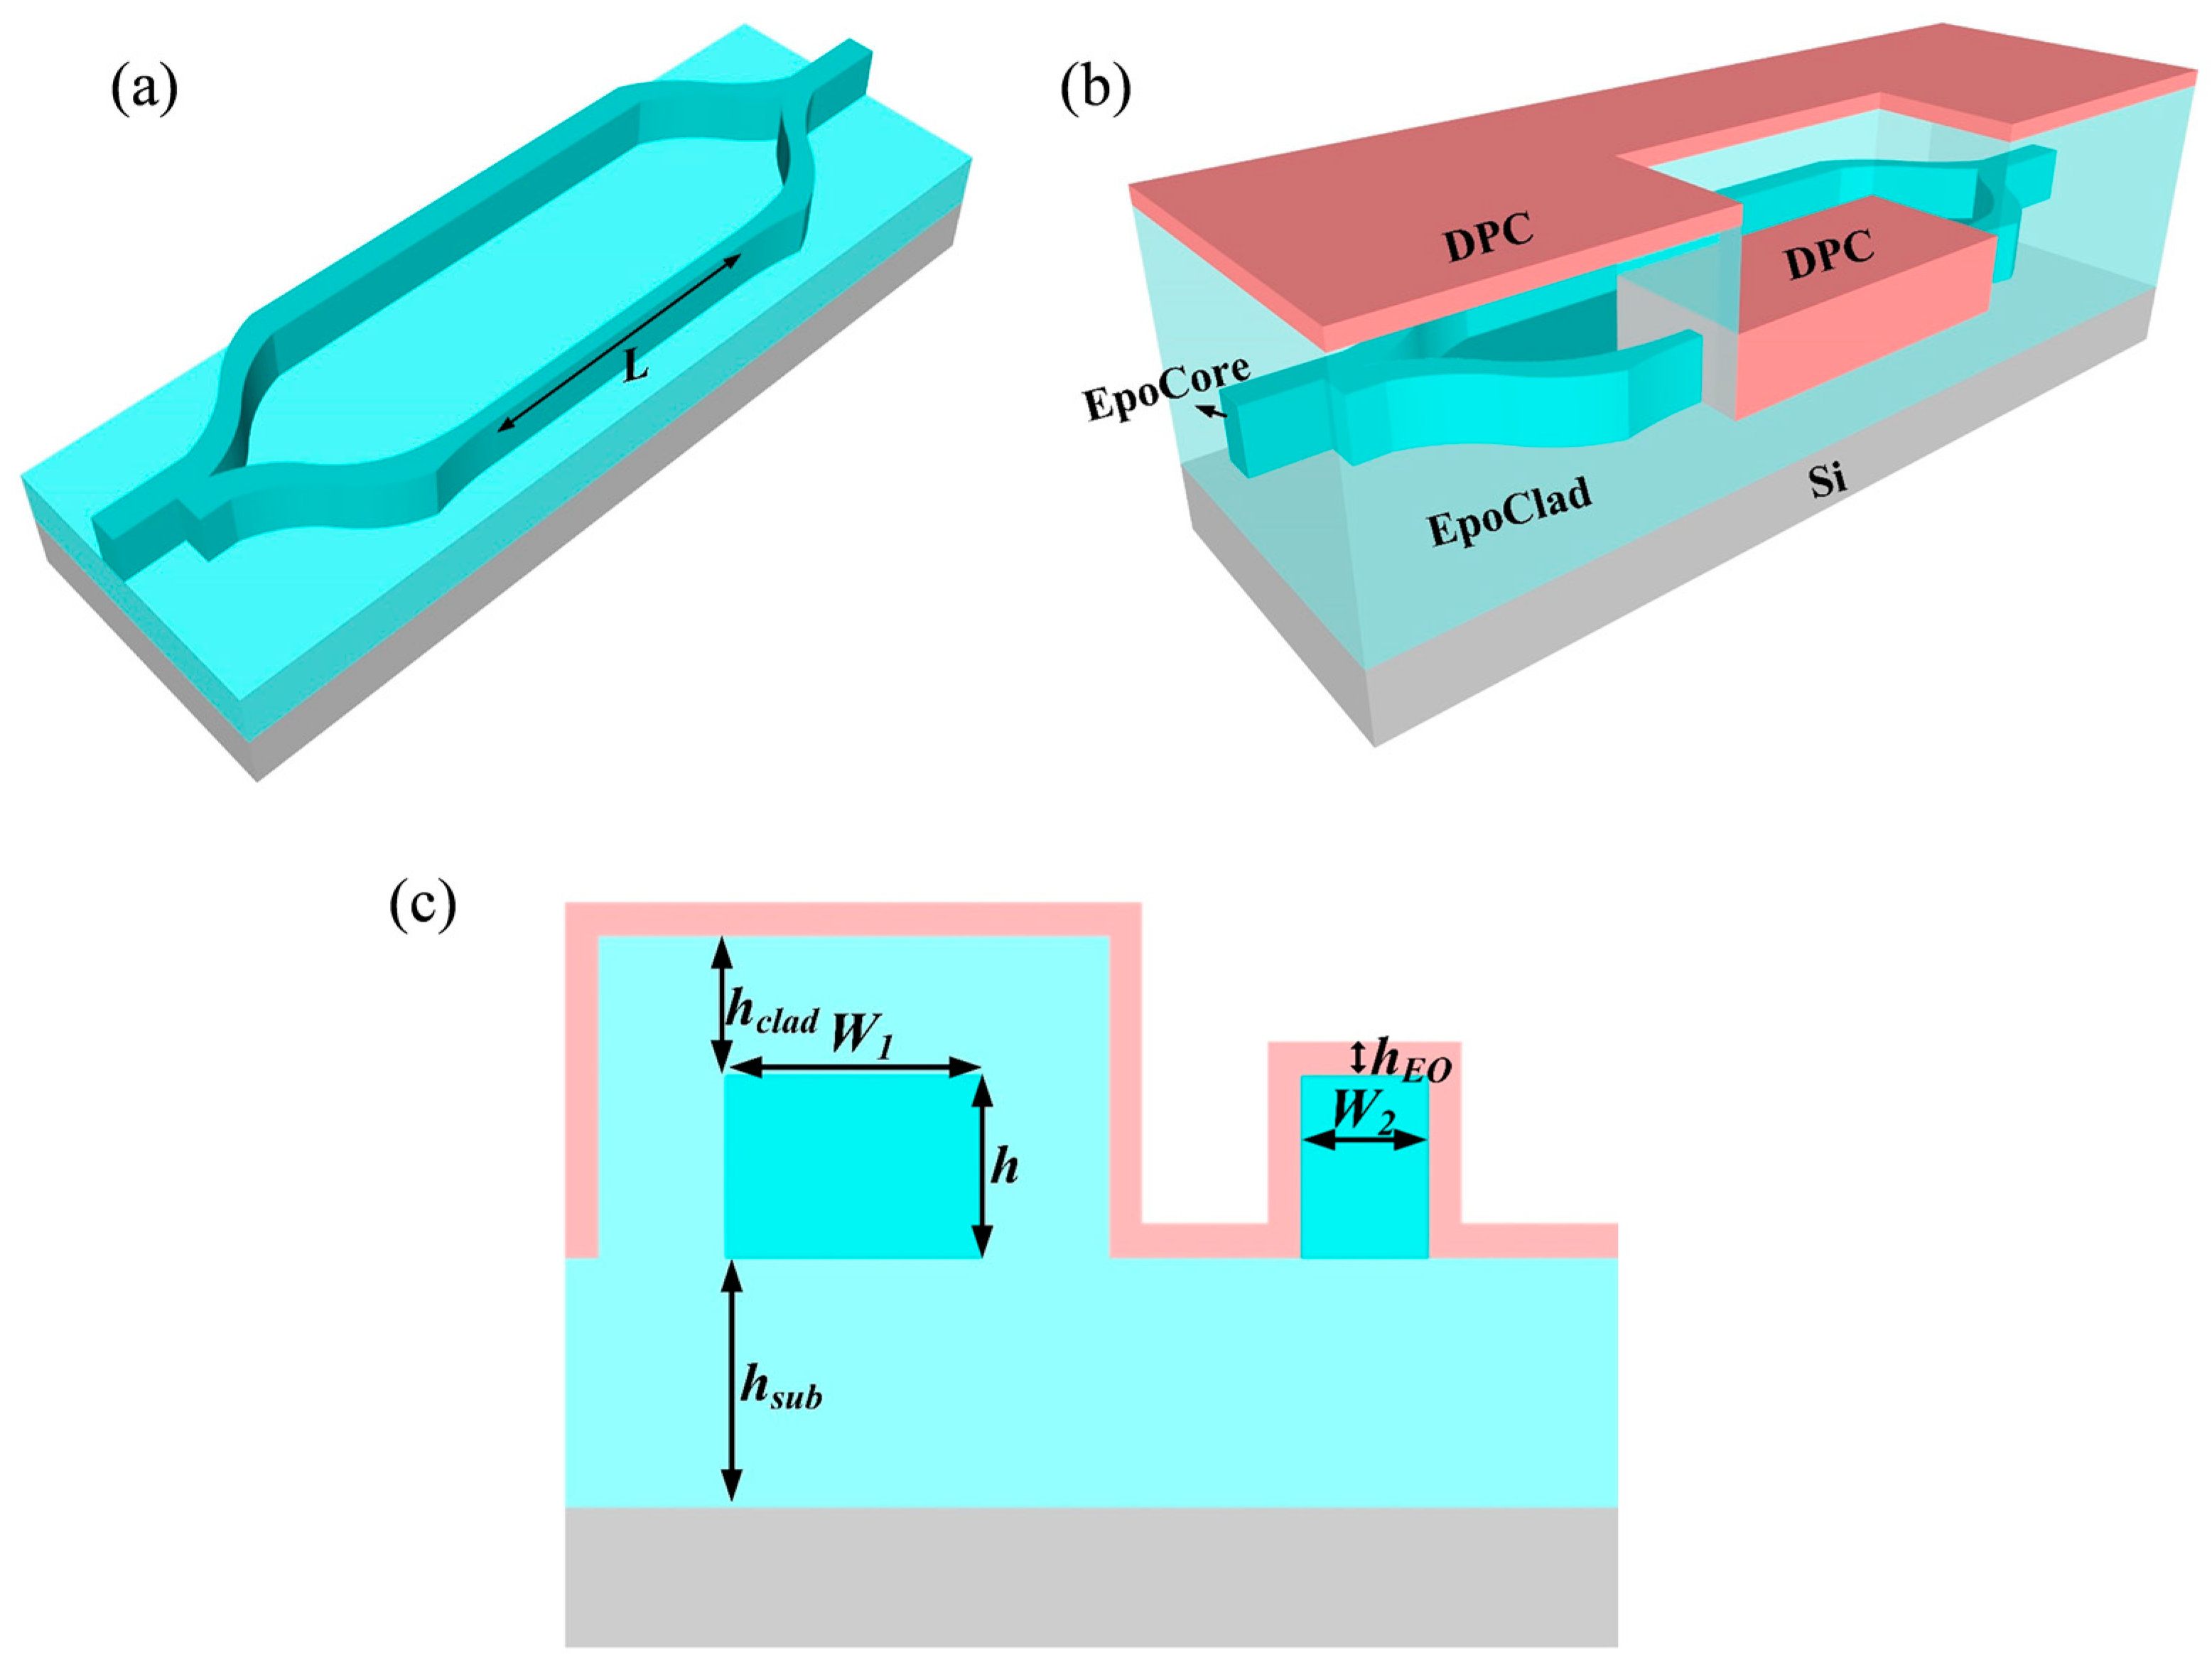
The MZI waveguide (Figure 2a,b) contains two phase shifters of different sizes. As shown in Figure 2c, the two phase shifters share the same arm length and height, but their widths are different. Additionally, the wider phase shifter is covered by EpoClad and DPC, while the narrow arm is covered by a very thin layer of DPC. Due to the differences in waveguide dimensions and cladding materials, the two phase shifters have intrinsic phase differences. The change in the RI of the DPC film (nc) caused by the absorption of targeted DNT molecules in water can cause a change in phase difference between two arms. The transmission dip of the MZI at which the phase difference between the two arms is equal to (2m + 1) π is given by:
λ = 2 ( n e f f 1 n e f f 2 ) L 2 m + 1
In Equation (1), the terms neff1 and neff2 represent the effective indices of the guided modes in the wider arm with width W1 and the narrow arm with width W2, respectively. The length of each arm is L, m is an integer and λ is the optical wavelength. The sensitivity (S) of the MZI refers to the wavelength shift (Δλ) caused by the refractive index change in DPC (Δnc):
S = Δ λ Δ n c = | λ ( n g 1 n g 2 ) | | d n e f f 1 d n c d n e f f 2 d n c |
In Equation (2), ng1 and ng2 are the group refractive indices of the guided modes of the two phase shifters with different widths, W1 and W2, respectively. The sensitivity (S) of the MZI is determined by the differences in ng1 and ng2 and the differences in waveguide sensitivity between the two arms (dneff/dnc). To obtain a higher refractive-index-sensing sensitivity, ng of the two arms of the waveguide should be reduced, and the difference in waveguide sensitivity between the two arms should be increased, while the other parameters remain unchanged.
For optical waveguide devices, the group refractive index takes into account the effect of a non-single frequency light on the refractive index due to dispersion. It is defined as follows:
n g = n e f f λ d n e f f d λ
In Equation (3), neff is the effective refractive index of the waveguide, which is also wavelength-dependent. Additionally, dneff/dλ is the dispersion of the waveguide, which is related to the waveguide dimension and material dispersion. In this study, because material dispersion is not available under our experiment conditions and is much smaller than waveguide dispersion, we ignored material dispersion and only considered the dispersion effect of the waveguide dimensions. According to Equation (3), to achieve high sensitivity, the difference in ng between the two arms should be small, and the difference in waveguide sensitivity should be large. Such a contradiction requires us to choose a suitable waveguide structure to balance the ng difference and sensitivity difference. Hence, the parameters of the MZI waveguide should be carefully engineered to achieve high sensitivity. Due to the small refractive index contrast between EpoCore and EpoClad, the height of the cores h is set to 5.0 μm, which ensures single-mode transmission. In order to realize the high sensitivity irrelevant to polarization, the width of the waveguide is also set to 5.0 μm, except the evanescent wave interaction region. The thickness of the sensitive cladding is also very important. In gas sensing, sensitivity and response speed are optimal if the gas can quickly penetrate into the interface between the core and the cladding where the evanescent field is strongest [42]. Therefore, we prefer to construct thin sensitive cladding to improve sensitivity and response speed. In this design, the thickness of the DPC cladding is set at hEO = 500 nm. Additionally, the thickness of both the lower cladding (hsub) and upper cladding (hclad) is set to 8 μm, which is thick enough to isolate the wide core from the substrate and the solution on the cladding.
Because the thickness of the upper cladding (hclad) above the wide arm is 8.0 μm, the change in the refractive index of the DPC coating does not affect the effective refractive index of the guided mode in wide arm. Therefore, dneff1/dnc remains unchanged, and MZI sensitivity is simplified to:
S = Δ λ Δ n c = | λ ( n g 1 n g 2 ) | | d n e f f 2 d n c |
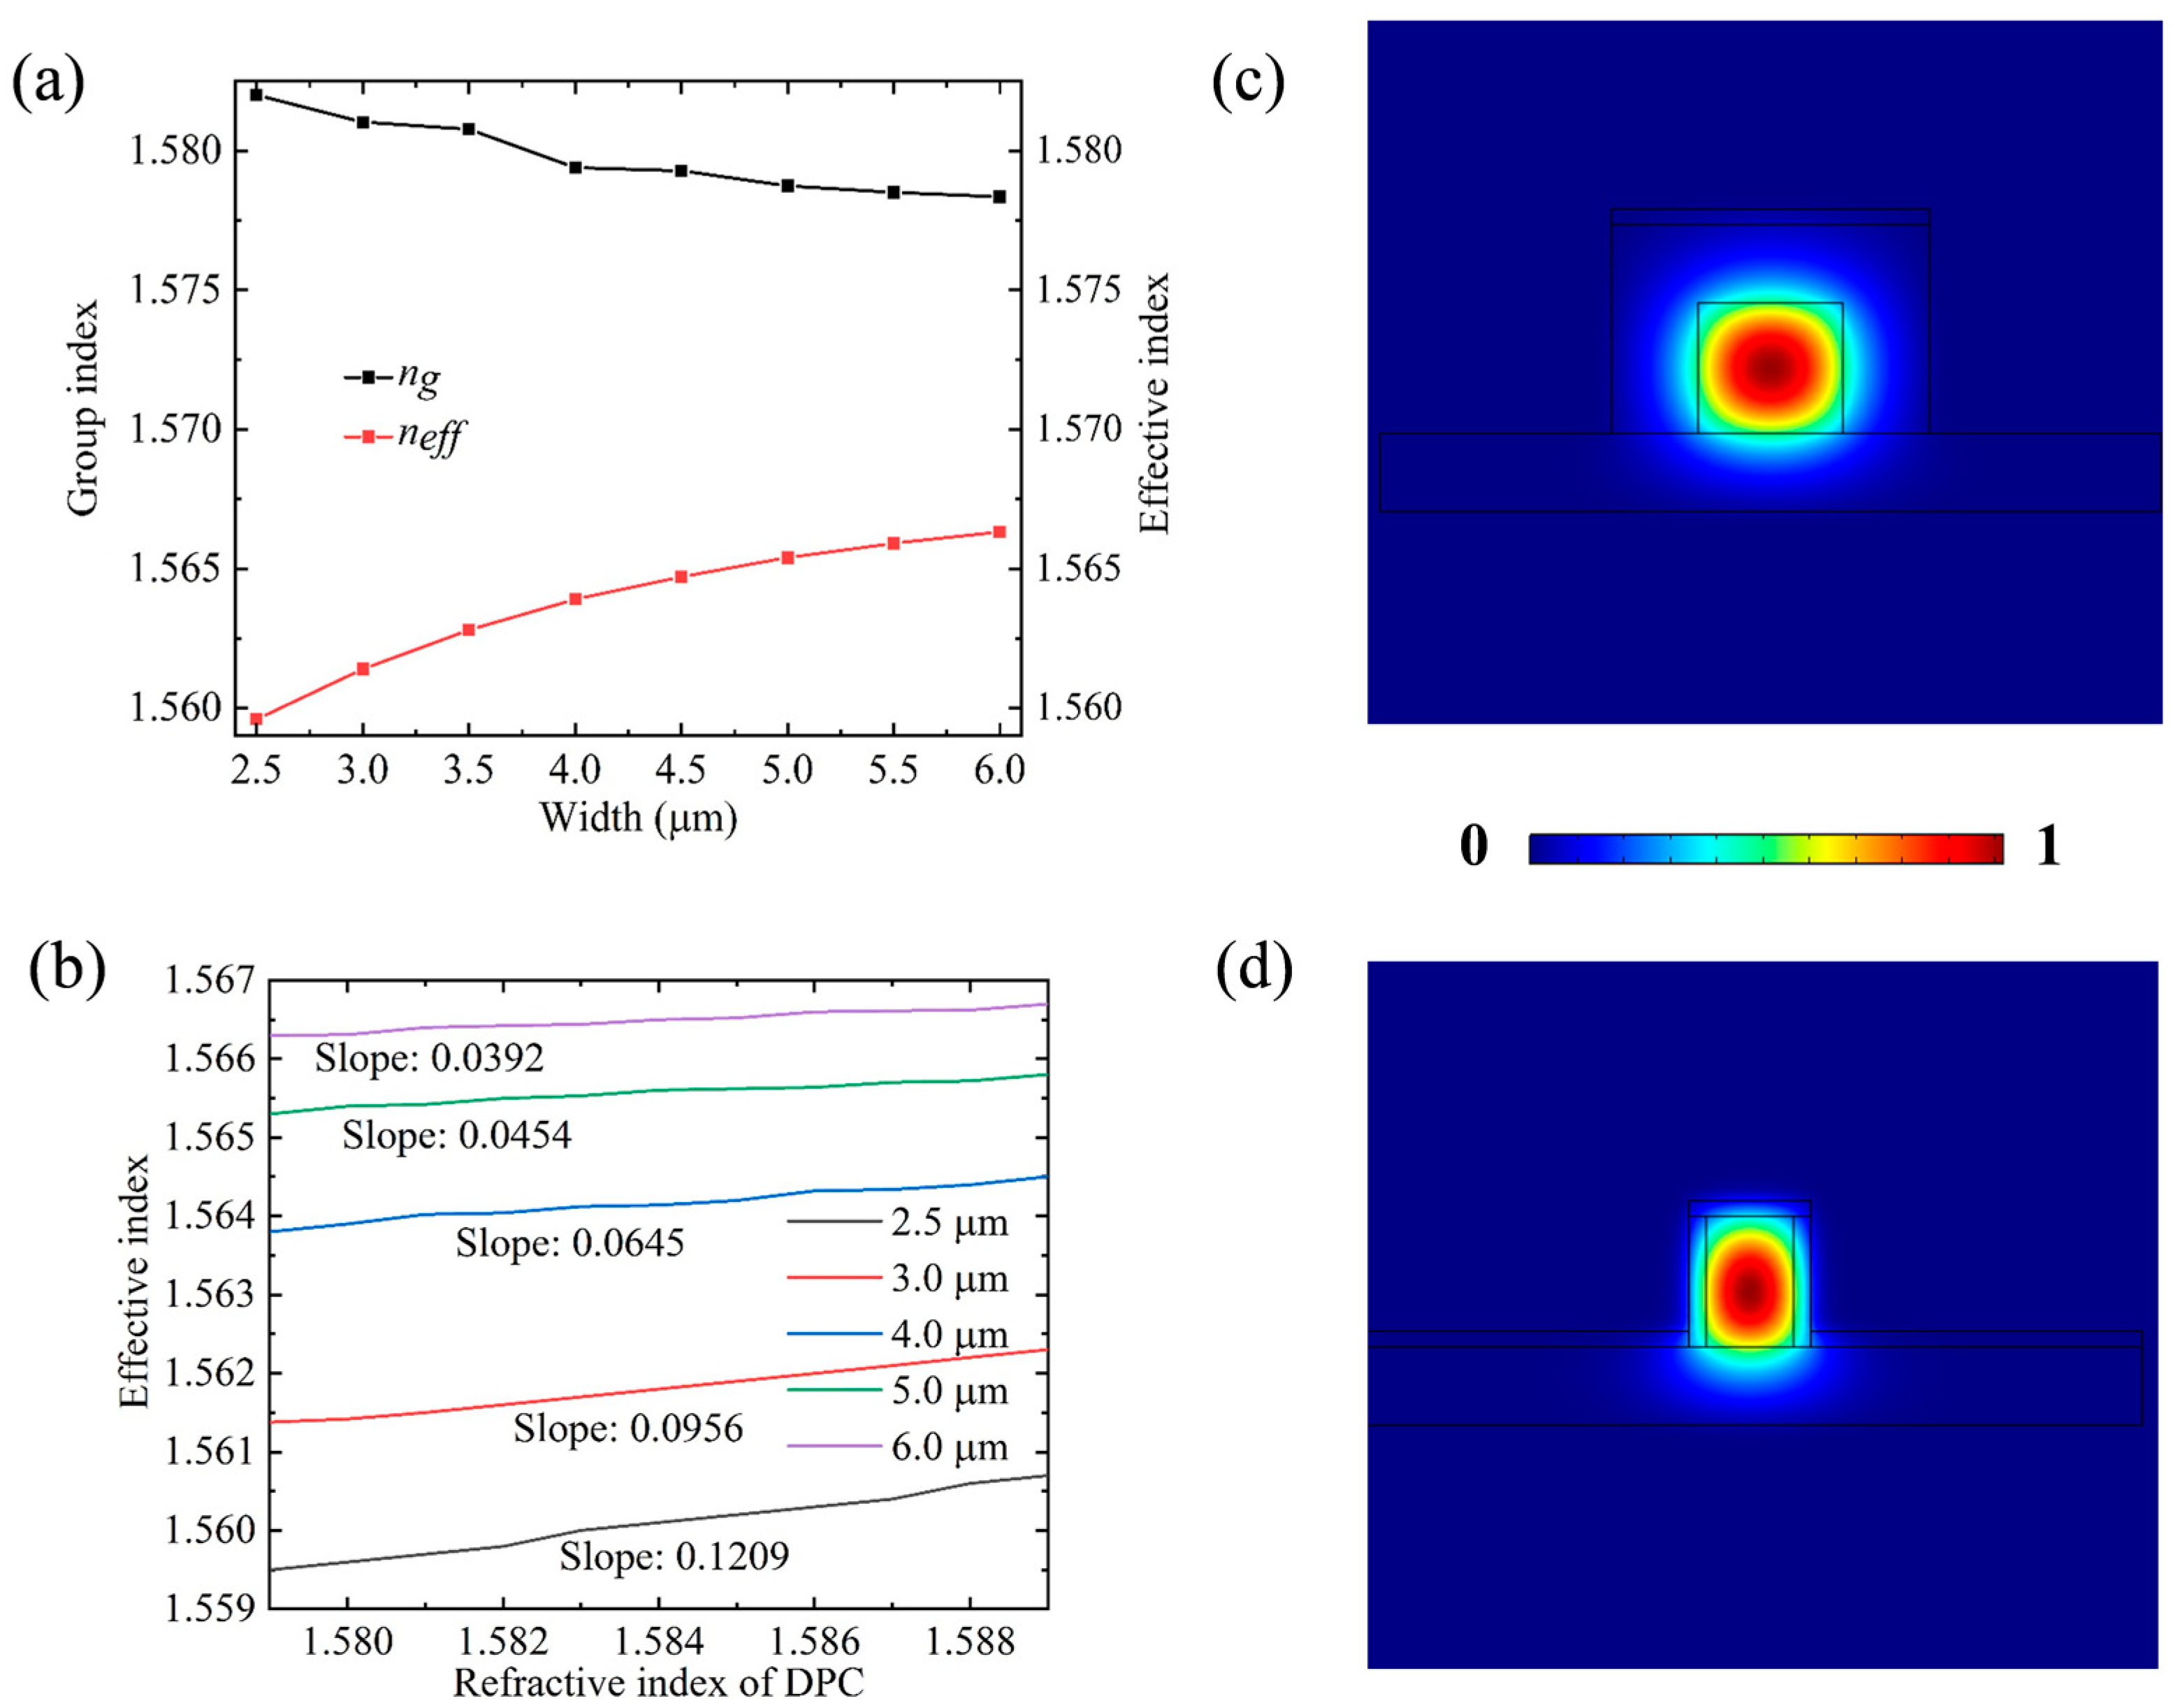
In this design, the finite element algorithm of COMSOL Multiphysics software was used to calculate the effective refractive index and group refractive index of the narrower arm of the MZI waveguide in the width range of 2.5–6.0 μm, and the results are shown in Figure 3a. As the width of waveguide increased, the effective refractive index increased and the group refractive index decreased. However, the intensity of the evanescent field decreased with the increase in waveguide width, resulting in decreased sensitivity of the waveguide, as shown in Figure 3b. When the waveguide width changed from 2.5 μm to 6.0 μm, waveguide sensitivity significantly changed from 0.1209 to 0.0392. For optimal design, the difference in ng between narrower and wider arms should be small, and the waveguide sensitivity of the narrower arm should be large, resulting in the high sensitivity of the MZI. ng of the wider arm with 5.0 μm × 5.0 μm was 1.5750. If we chose the width of the narrower arm with ng close to 1.5740, waveguide sensitivity was small. However, when we chose a smaller waveguide width to improve waveguide sensitivity, the group refractive index difference between the two arms increased. Therefore, a trade-off must be made between waveguide sensitivity and the group refractive index difference between the two arms to design an MZI with high sensitivity. After a comprehensive calculation, we chose the size of a narrower arm with a width of 3.0 μm and height of 5.0 μm and a wider arm with 5.0 μm × 5.0 μm. Hence, the group refractive indices of the wider arm and narrower arm are 1.5750 and 1.5810, respectively, and the waveguide sensitivity of the narrower arm is 0.0956. Their optical field distributions are shown in Figure 3c,d, illustrating a strong evanescent field of the narrower arm in strong light–analyte interactions. For the interaction length of 1 cm, the sensitivity of the MZI sensor is as high as 24,696 nm/RIU.

2.5. Device Fabrication

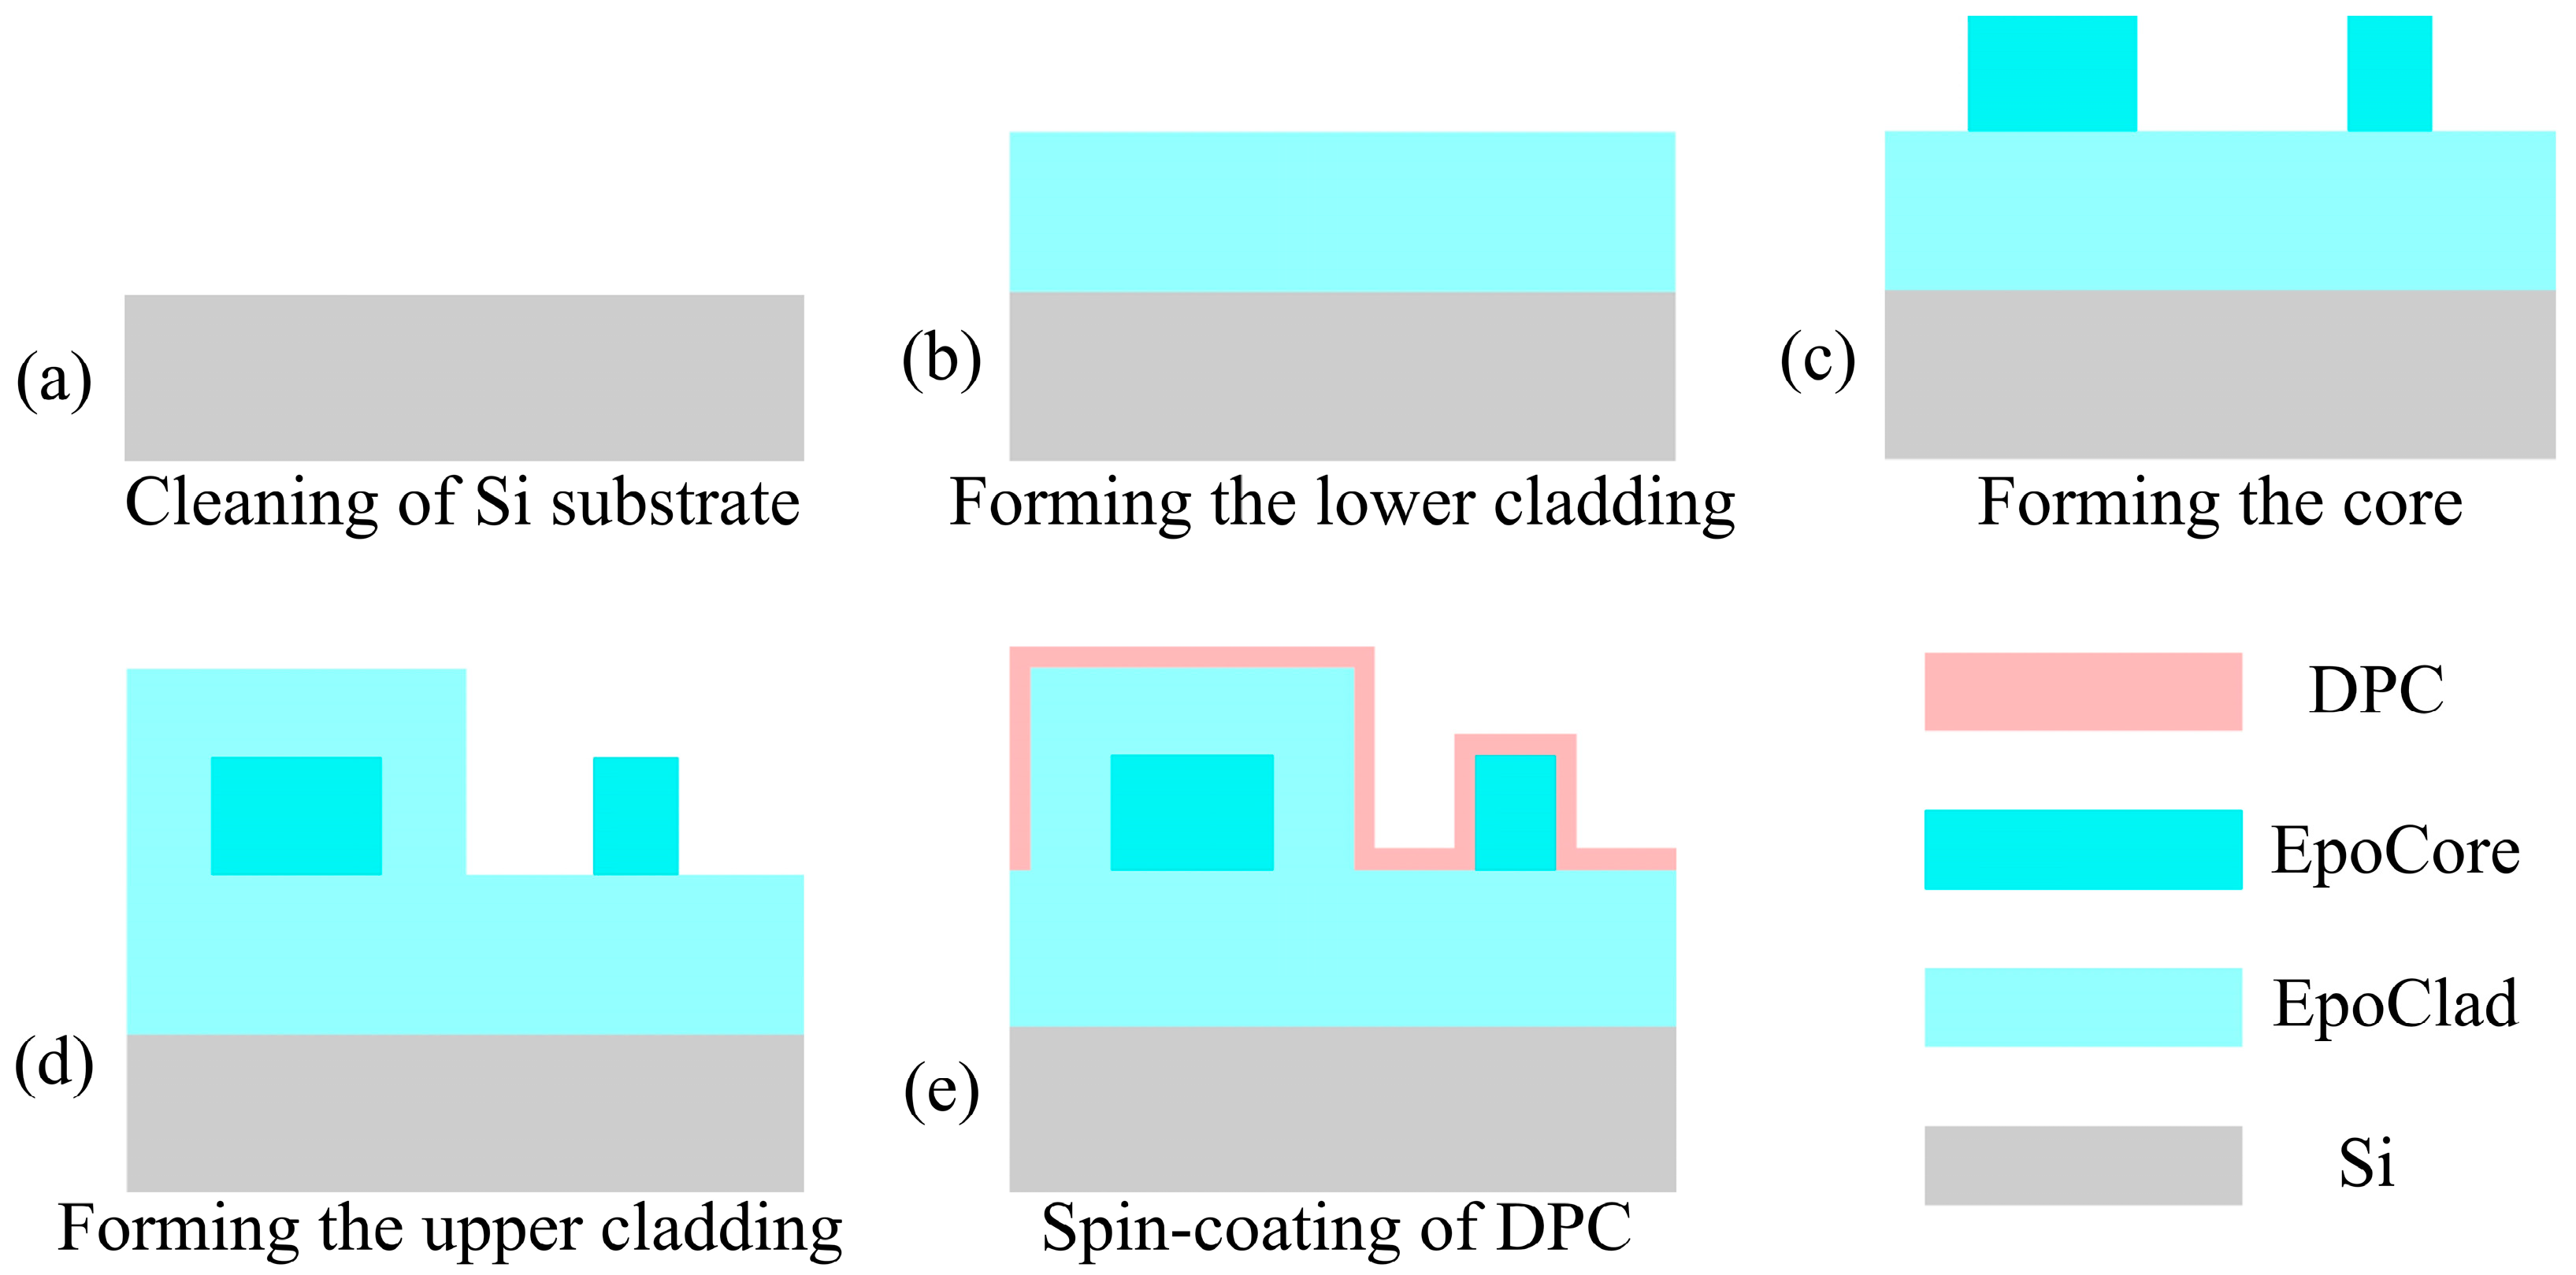
The utilization of polymers for waveguide sensors offers significant advantages. First, polymer waveguide materials are solution-processable and are compatible with CMOS processes. In particular, some polymers are sensitive to UV light and can be directly patterned using UV photolithography and development, eliminating the need for an etching step, which can significantly simplify the fabrication process. Secondly, polymer materials have a relatively low refractive index in comparison with silicon and silicon nitride, and a polymeric waveguide with suitable core and cladding polymer materials with large waveguide sizes is beneficial for low coupling loss using a standard single-mode optical fiber. Finally, due to the successful development of polymer science, a large number of functional polymers are available for waveguide fabrication and sensing. In this study, we used UV-light-sensitive epoxy resin and functional polycarbonates sensitive to explosive materials to prepare waveguides. The fabrication process of the designed polymer waveguide sensor is shown in Figure 4. The detailed process is presented as follows:
  • An 8.0 μm thick EpoClad film was spin-coated on a O2-plasma-treated silicon substrate and then pre-baked at 50 °C for 10 min and 90 °C for 10 min. After cooling down to room temperature, the chip was exposed to UV light for 1 min to initiate the cross-linking of epoxy and then baked at 120 °C for 3 h.
  • A 5.0 μm thick EpoCore film was spin-coated onto the Epoclad film and then pre-baked at 50 °C for 10 min and 90 °C for 10 min. Then, the pattern of the waveguide was transferred from mask to chip using UV photolithography, followed by heating at 50 °C for 10 min and 90 °C for 35 min, cooling and developing in a special developing solution to obtain the waveguide pattern. Finally, the waveguide was cured by baking at 140 °C for 3 h.
  • An 8.0 μm thick EpoClad film was spin-coated on the EpoCore waveguide and then pre-baked at 50 °C for 10 min and 90 °C for 10 min. After cooling down to room temperature, the pattern of the cladding was transferred from another mask to chip by UV photolithography, followed by heating at 50 °C for 10 min and 90 °C for 35 min, cooling and developing in a special developing solution to obtain the cladding pattern. Then, the chip was baked at 120 °C for 3 h. In this state, the MZI waveguide was covered by EpoClad, leaving the narrower arm with air cladding.
  • Finally, the DPC was spin-coated onto the sample to form a 500 nm thick sensing coating, and the chip was cured at 80 °C in vacuum for 12 h. After the device was cooled down to room temperature, the ends of the device were cut off and deconstructed using a diamond knife to obtain a flat waveguide end surface for edge coupling.

3. Results

3.1. Waveguide Characterization

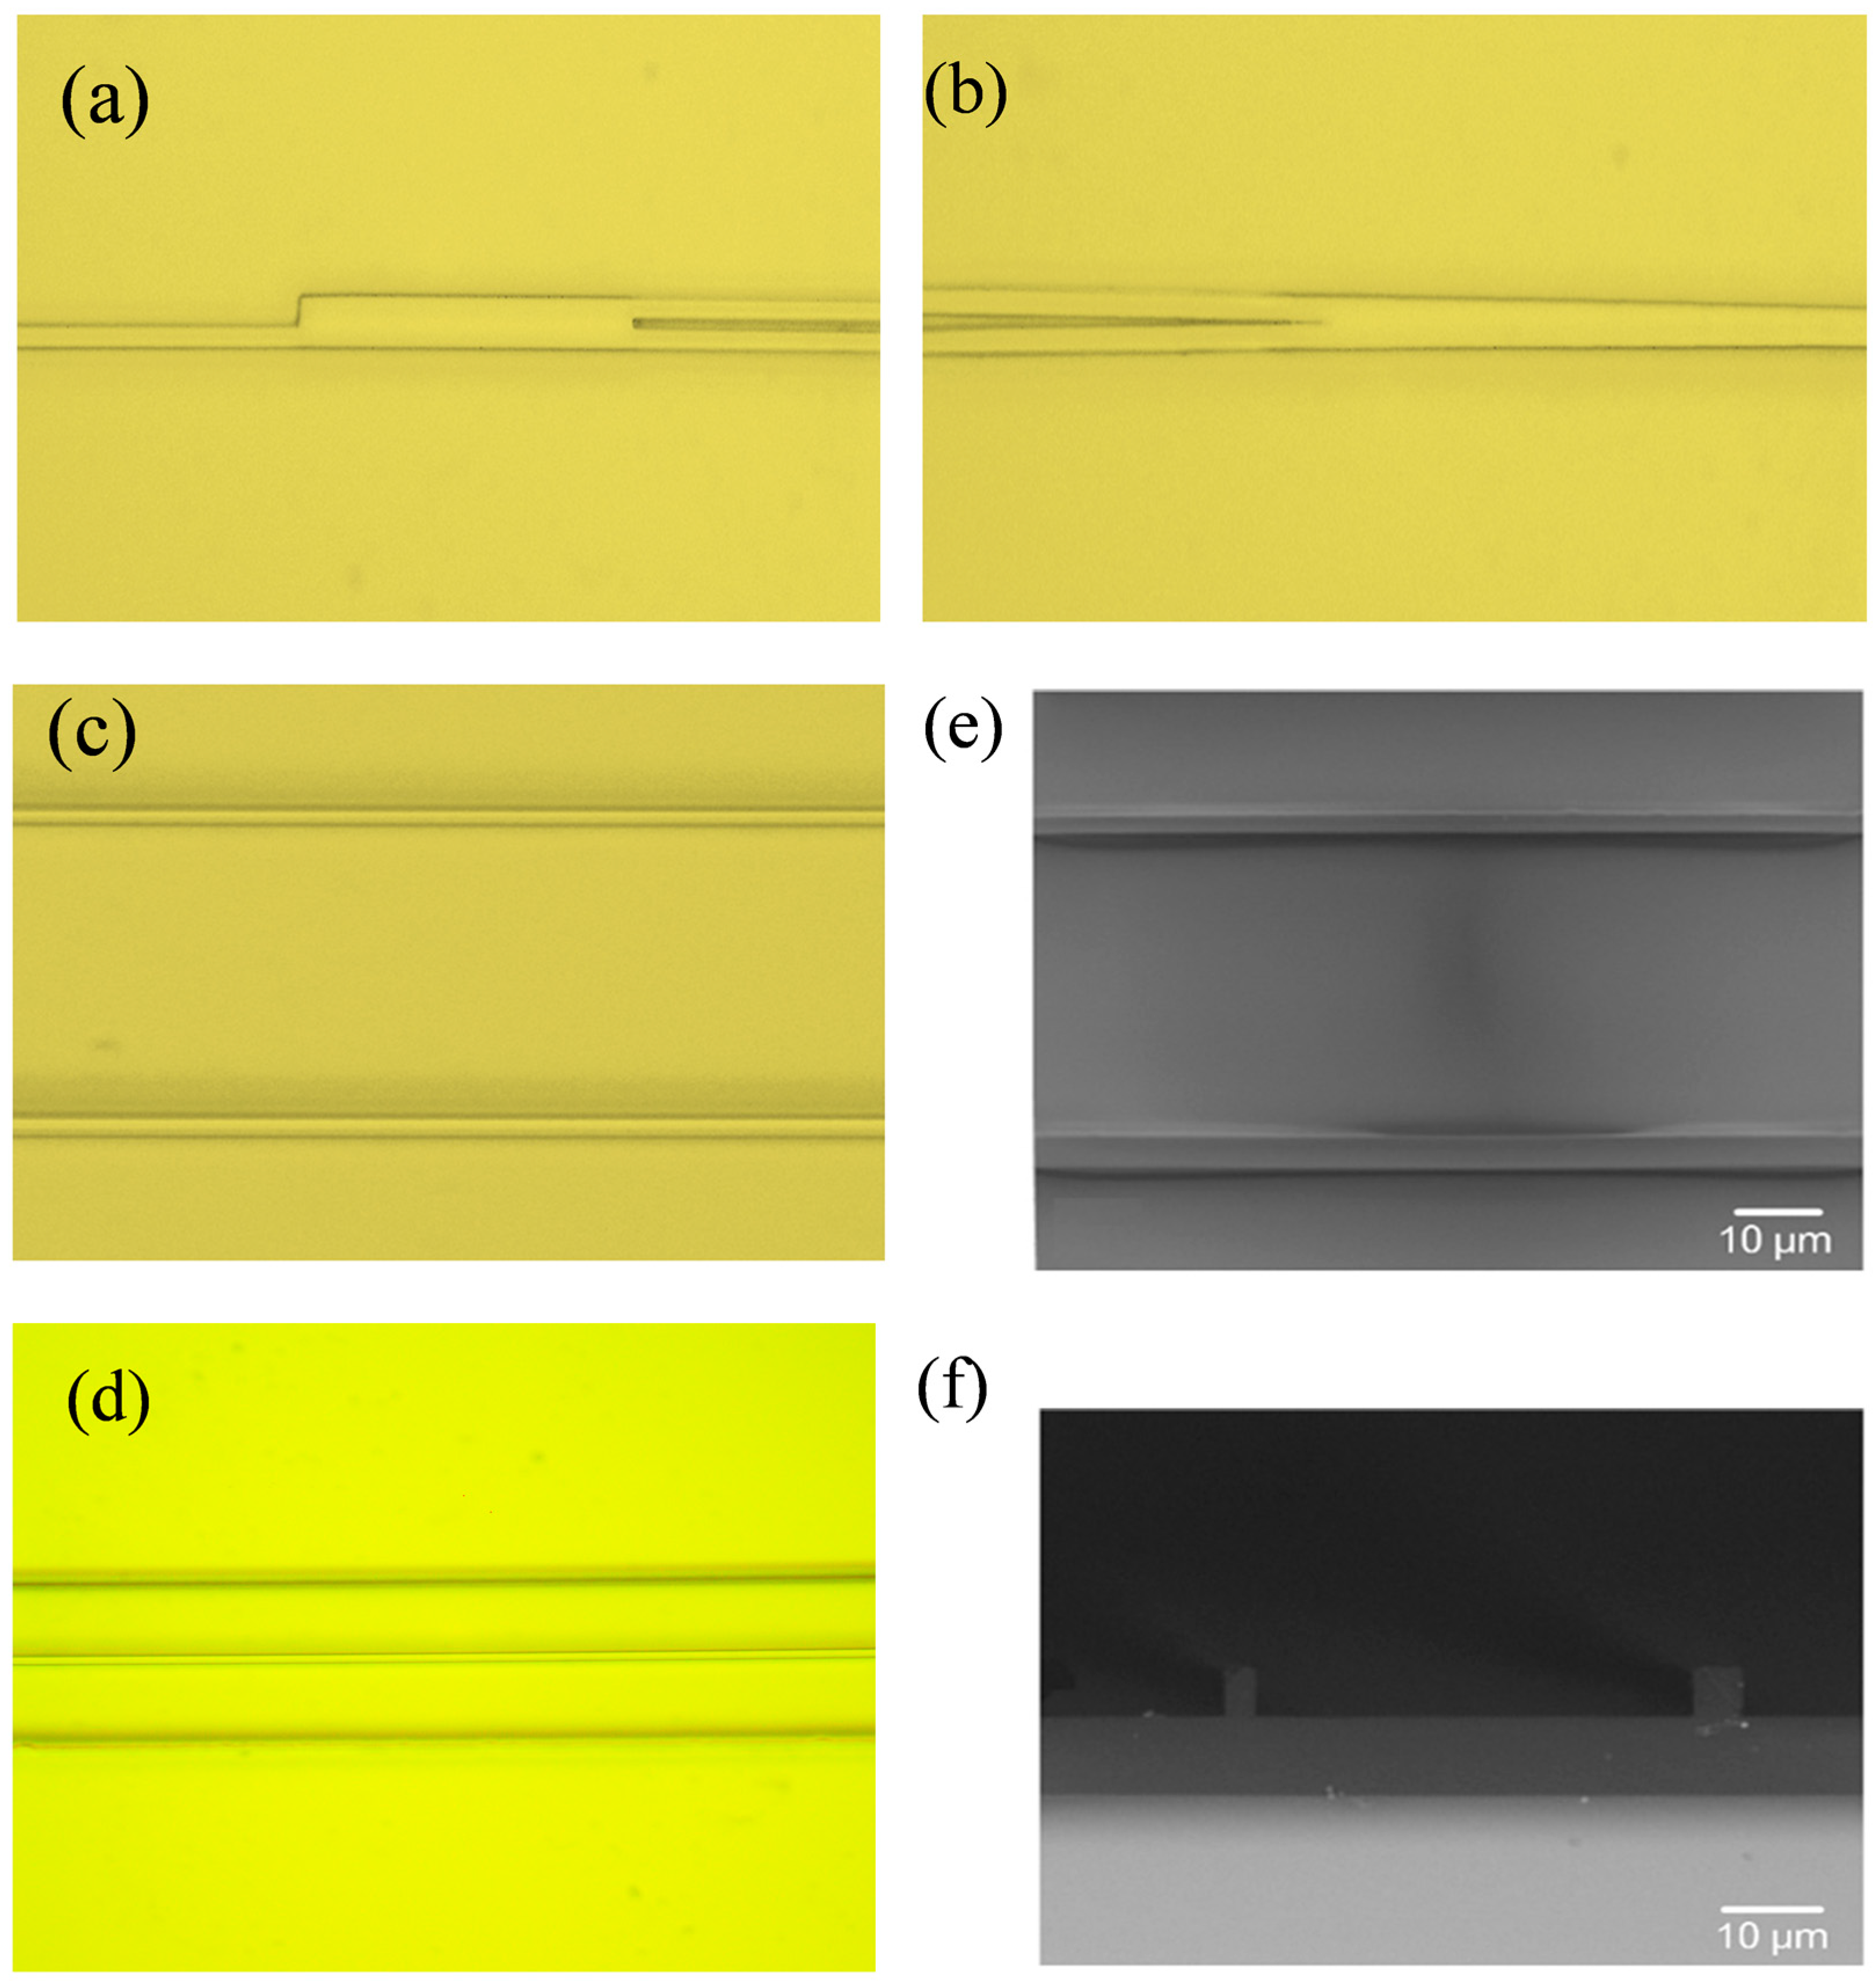
The total length of the fabricated MZI sensor was 1.7 cm. Figure 5 shows the optical and SEM images of MZI waveguide without DPC cladding. The optical splitter is a two-mode interferometer with dimensions of 9.5 μm × 71.3 μm, as shown in Figure 5a. Additionally, Figure 5b shows the Y-junction optical combiner. The difference in the width of the two arms is clearly illustrated in Figure 5c,e,f, and the distance between the two arms is 40 μm. The widths of the two arms measured using SEM are 3.0 μm and 5.0 μm. After the formation of the upper cladding EpoClad, the wider arm is invisible and leaves a 20 μm wide window for the coating of the DPC sensing film, as shown in Figure 5d. Note that DPC material has high absorption loss in the visible wavelength band, so it is difficult to find the waveguide under the microscope when coated with DPC material. Therefore, it is not possible to obtain the optical microscope image of a waveguide after coating DPC.
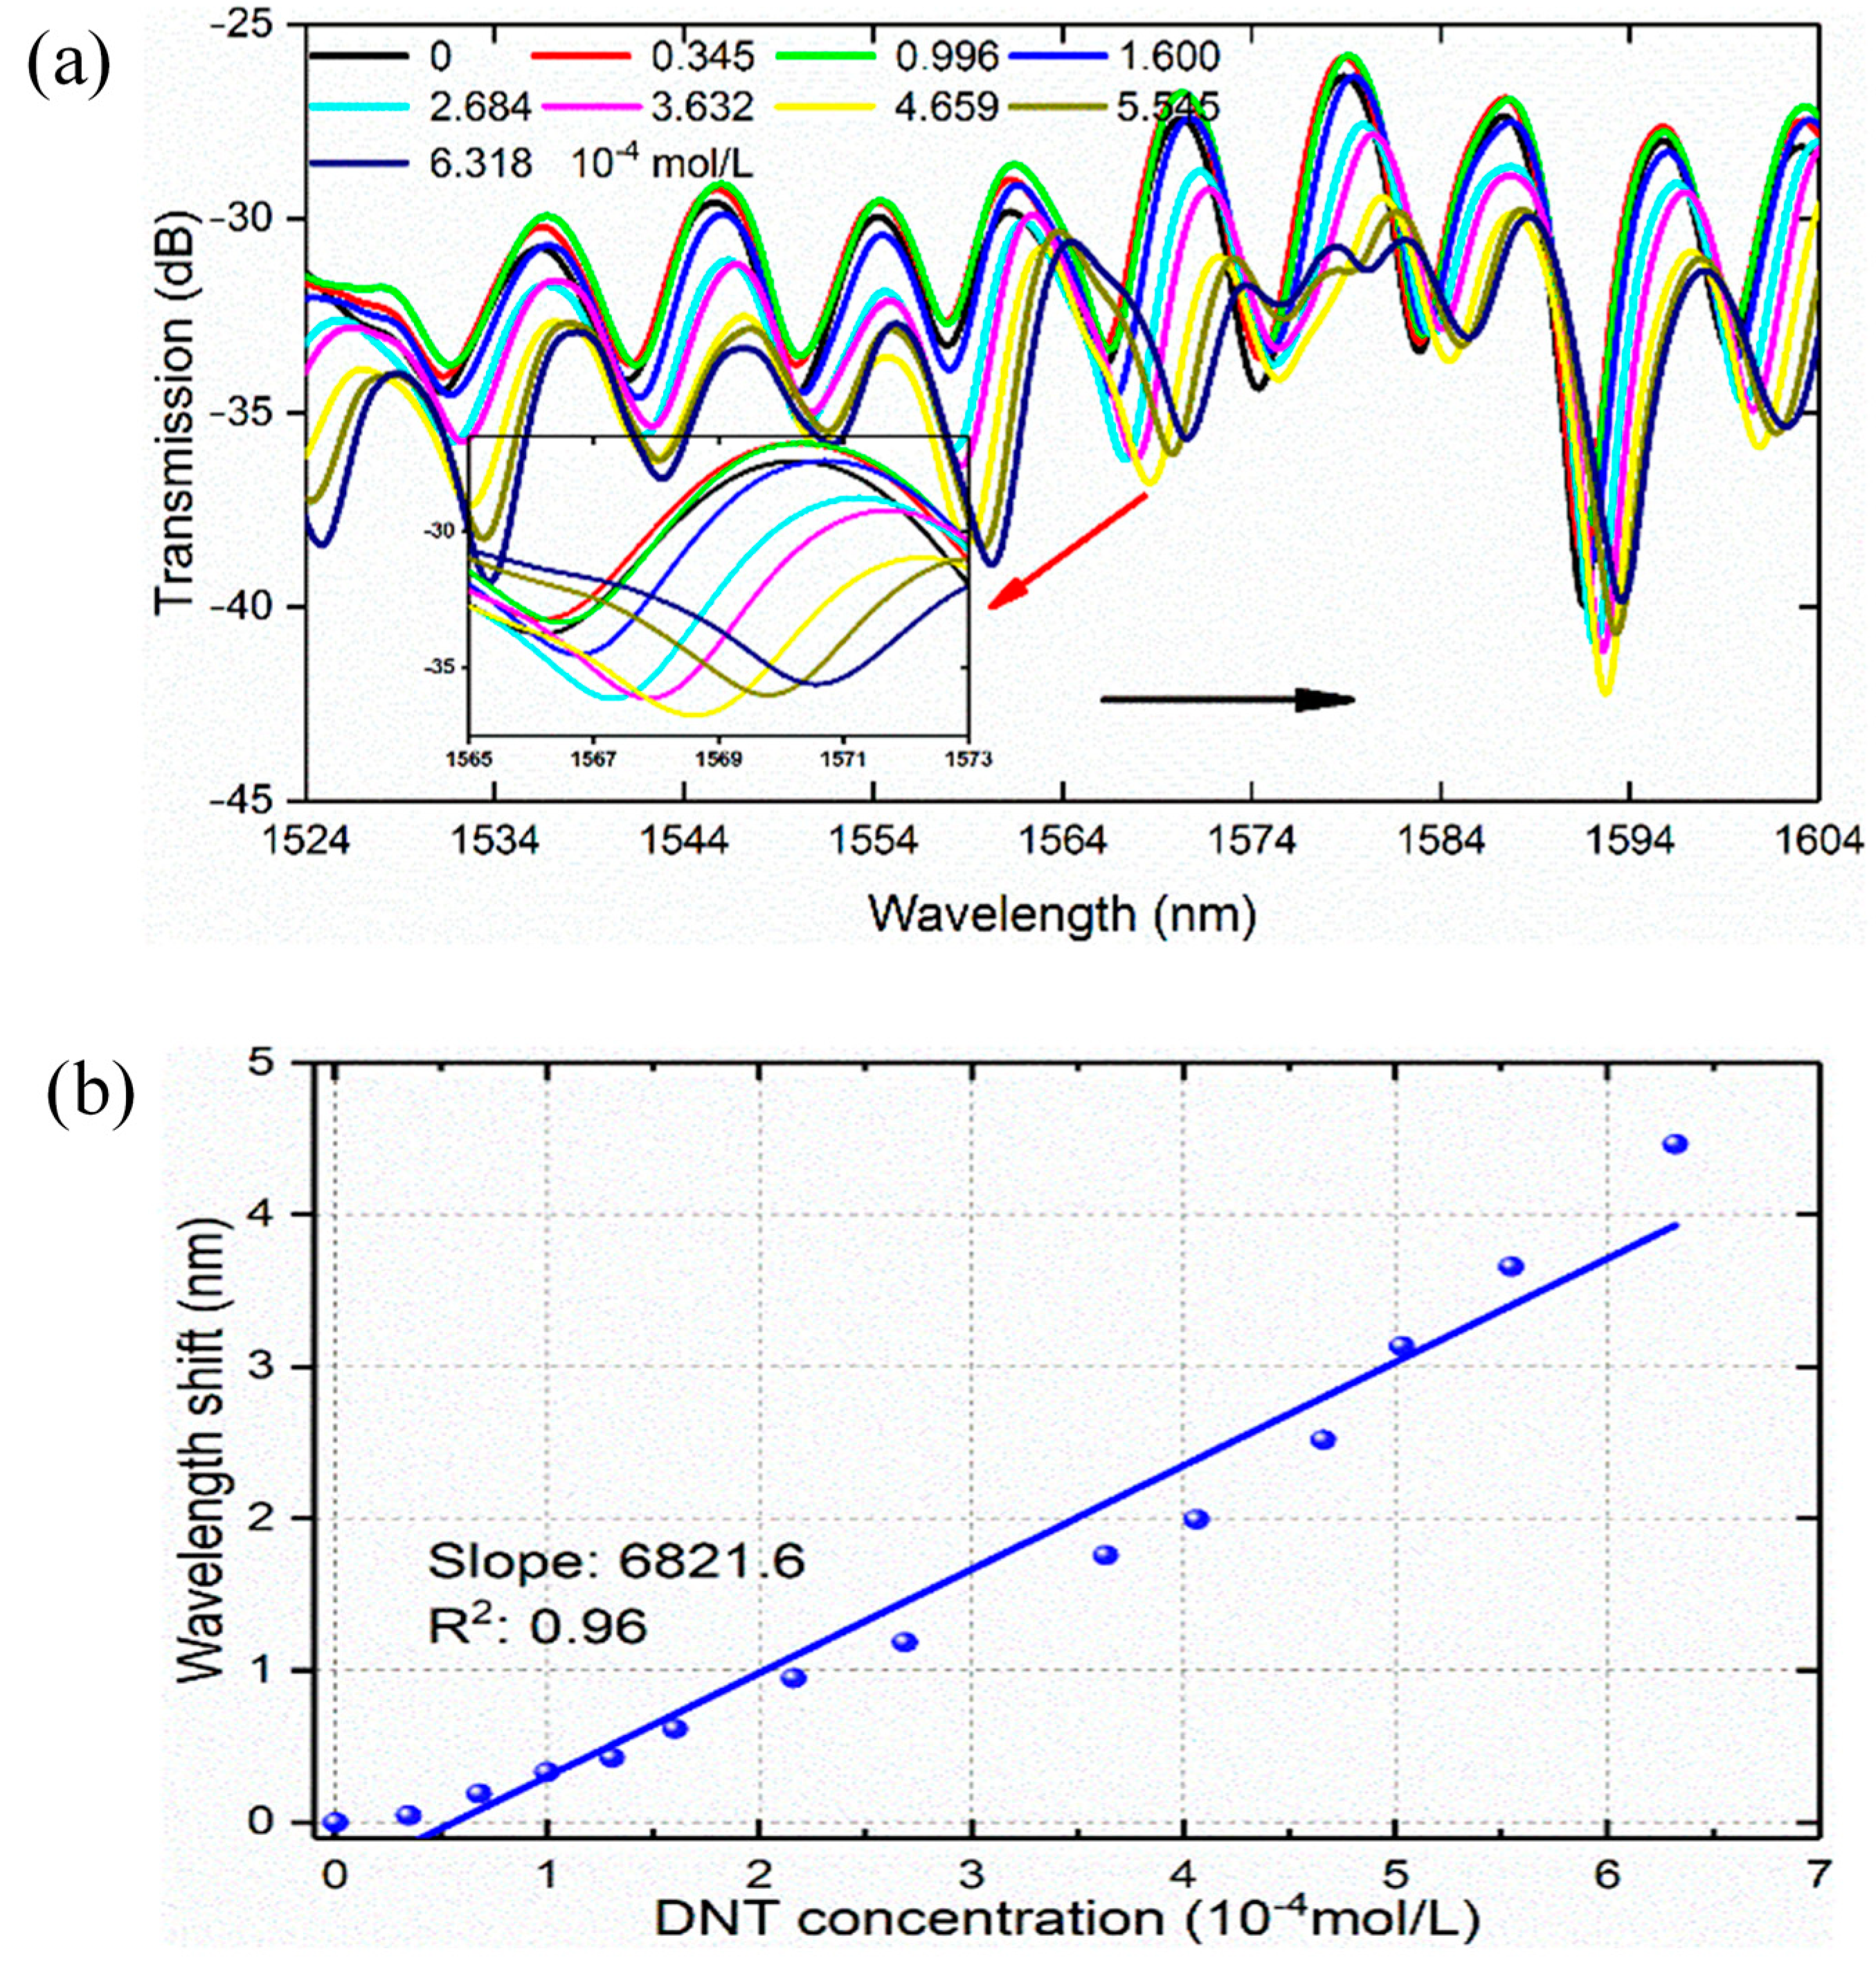
The fabricated MZI sensor was first characterized using the end-fire coupling technique to obtain the transmission spectrum. Figure 6 shows the optical setup for optical characterization and DNT detection in solution. Broadband light (B&A Technology AS4600, Shanghai B&A Technology, Shanghai, China) was launched into the MZI chip from one end with a lensed fiber, and the transmitted light at the other end was collected using a single-mode optical fiber connected to an optical spectrum analyzer (OSA, Anritsu MS9740A, Anritsu Technology, Atsugi-shi, Kanagawa, Japan). As shown in Figure 7a, the insertion loss of the MZI sensor was about 28 dB, which includes a fiber–waveguide coupling loss of 15 dB. The on-chip insertion loss was 13 dB. Such a high loss was mainly attributed to the large absorption loss and scattering loss of the thin DPC coating, as well as the absorption loss of epoxy resin. For our fabricated sensor, the transmission dip is located at 1565 nm before exposure to the DNT solution, which is determined by the waveguide parameters and the central wavelength of the broadband light source. From the output spectrum, Figure 7a shows that the free spectral region is about 8.9 nm, and the largest extinction ratio is 10 dB.

3.2. DNT Detection

To facilitate testing of explosive liquids, a 1 cm × 1 cm sealed chamber was fixed to the waveguide chip by UV glue. The blank solution without DNT was used as a reference solution to observe the change in the optical spectrum. Different DNT solutions with concentrations ranging from 3.450 × 10⁻⁵ mol/L to 6.318 × 10⁻⁴ mol/L were prepared by diluting the DNT solution with DI water and were then injected into a sealed chamber to measure the output interference spectra. Figure 7a shows the output transmission spectra of the sensor measured at different concentrations (from 0 to 6.318 × 10⁻⁴ mol/L). When concentration increased from 0 to 6.318 × 10⁻⁴ mol/L, the central wavelength shift increased to a maximum value of 4.465 nm. We also calculated the relationship between the DNT concentration and wavelength shift to obtain a sensitivity of 6821.6 nm/(mol/L) with a good linear relationship R2 = 0.96.
It is also essential to verify the selectivity of the fabricated sensor. For this purpose, we tested the sensor interference spectral changes under common interfering agents, including ethanol, acetone, ethyl acetate, benzene and saline (concentration of 5 × 10⁻⁴ mol/L). It was found that the central wavelength changes were all less than 0.2 nm. This contrast indicated that our MZI sensor with DPC sensing material can specifically absorb dipolar DNT in water. The DNT molecules in the solution were enriched around the DPC due to the dipole–dipole interaction between DNT and DTCPC on the interface of DPC, thus resulting in a large refractive index change in DPC and the phase difference between the two arms. Therefore, the output optical spectrum of the MZI shifted. A higher concentration induced a stronger interaction between DNT molecules and DPC film. The good linearity between DNT concentration and wavelength shift means that our MZI sensor can precisely detect a wide range of concentrations of DNT solution.

4. Discussion

Because optical waveguide devices for the sensing of hazardous explosive compounds in aqueous solutions are less intensively reported than that of explosive vapor detection, it is necessary to emphasize the novelty and significance of this study. Because the refractive index of aqueous solutions is lower than most waveguide materials, it is difficult to concentrate on the evanescent field in aqueous solutions. This leads to weak light–analyte interactions and difficult design of high-sensitivity waveguide sensors. We designed and fabricated asymmetric MZI waveguides for explosive vapor sensing in our previous research [42]. The sensitive material that we used was EOPC1, a polycarbonate material with a refractive index of 1.5470, which is close to the core layer EpoCore. Because the smaller refractive index difference between the core and cladding layers enhances the evanescent field distributed in the EOPC1 cladding layer and the explosive gas penetrates into the cladding layer faster, we achieved efficient and highly sensitive explosive vapor detection. However, when we carried out the detection of explosives in an aqueous solution, we found that it was difficult for the DNT in the liquid to penetrate into the core and EOPC1 cladding interface where the evanescent field was the strongest; the sensitivity was low, and the response was slow. Therefore, light–analyte interactions can only be enhanced by the strategy of thinning the sensitive cladding; however, this weakens the evanescent field and reduces the sensitivity of the waveguide. In this study, our innovation is to use a sensitive cladding DPC with a higher refractive index (n = 1.5796) than the core layer while passivating the reference arm, so that the waveguide sensitivity difference between the two phase shifter arms of the MZI reaches 0.0956, which is a higher value than the previous gas sensor (0.094) [42]. Then, the sensitivity of the MZI is 24,696 nm/RIU, which is much higher than that of the gas sensor MZI (~7000 nm/RIU).

5. Conclusions

The study of high-sensitivity waveguide sensors for the detection of explosive molecules in water is difficult due to the relatively low refractive index of this solution. In this study, we ultimately designed an MZI sensor with a sensitivity of up to 24,696 nm/RIU by weighing the group refractive index difference between the two arms of the interferometer and the waveguide sensitivity difference via the rational design of waveguide dimensions. We fabricated a device using only polymeric materials. The sensing material that we used was a self-synthetic polycarbonate DCP with side-chain donor–π–acceptor dipolar chromophores. The asymmetry in intramolecular electron distribution resulted in strong chromophore–DNT dipole–dipole interactions. The DNT molecules in the solution enriched around the DPC change in the refractive index of the DPC film, and then induced the spectrum shift of the MZI sensor. Our fabricated sensor had a maximum wavelength shift of 4.465 nm when DNT concentration increased to 6.318 × 10⁻⁴ mol/L with a high sensitivity of 6821.6 nm/(mol/L). The design of the unbalanced MZI sensor, together with the sensing material, provides a new approach to using low-cost, compact and highly sensitive devices for in-field explosive detection. Additionally, our MZI sensor can be employed for the detection of DNT molecules in industrial wastewater and explosive flues.

Author Contributions

Conceptualization, J.W. and K.C.; methodology, J.W. and G.D.; software, W.W.; formal analysis, W.W., K.C. and J.W.; resources, G.D.; data curation, W.W. and J.W.; writing—original draft preparation, W.W. and Z.H.; writing—review and editing, W.W. and J.W.; funding acquisition, Z.H. and K.C. All authors have read and agreed to the published version of the manuscript.

Funding

This research is funded in part by the National Natural Science Foundation of China (U20A20165, 62275042), the National Science and Technology Major Project (Grant No. J2019-III-0017) and the Fundamental Research Funds for the Central Universities (ZYGX2019Z005).

Institutional Review Board Statement

Not applicable.

Informed Consent Statement

Not applicable.

Data Availability Statement

Not applicable.

Conflicts of Interest

The authors declare no conflict of interest.

References

  1. Shanmugaraju, S.; Mukherjee, P.S. Pi-Electron rich small molecule sensors for the recognition of nitroaromatics. Chem. Commun. 2015, 51, 16014–16032. [Google Scholar] [CrossRef]
  2. Simić, M.; Gillanders, R.; Avramović, A.; Gajić, S.; Jovanović, V.; Stojnić, V.; Risojević, V.; Glackin, J.; Turnbull, G.; Filipi, J.; et al. Honeybee Activity Monitoring in a Biohybrid System for Explosives Detection. IFMBE Proc. 2020, 73, 185–192. [Google Scholar] [CrossRef]
  3. Lazarowski, L.; Waggoner, L.P.; Krichbaum, S.; Singletary, M.; Haney, P.S.; Rogers, B.; Angle, C. Selecting Dogs for Explosives Detection: Behavioral Characteristics. Front. Veter- Sci. 2020, 7, 597. [Google Scholar] [CrossRef] [PubMed]
  4. Sharma, M.; Sharma, B.; Gupta, A.K.; Pandey, D. Recent developments of image processing to improve explosive detection methodologies and spectroscopic imaging techniques for explosive and drug detection. Multimedia Tools Appl. 2022, 82, 6849–6865. [Google Scholar] [CrossRef]
  5. Roy, E.G.; Dentinger, C.; Robotham, C. Detection of homemade explosives using Raman excitation at 1064 nm. In Detection and Sensing of Mines, Explosive Objects, and Obscured Targets Xx; SPIE: Bellingham, WA, USA, 2015; Volume 9454, pp. 297–301. [Google Scholar] [CrossRef]
  6. Mayhew, C.; Sulzer, P.; Petersson, F.; Haidacher, S.; Jordan, A.; Märk, L.; Watts, P.; Märk, T. Applications of proton transfer reaction time-of-flight mass spectrometry for the sensitive and rapid real-time detection of solid high explosives. Int. J. Mass Spectrom. 2010, 289, 58–63. [Google Scholar] [CrossRef]
  7. Wells, K.; Bradley, D. A review of X-ray explosives detection techniques for checked baggage. Appl. Radiat. Isot. 2012, 70, 1729–1746. [Google Scholar] [CrossRef] [PubMed] [Green Version]
  8. McFee, J.E.; Faust, A.A.; Andrews, H.R.; Kovaltchouk, V.; Clifford, E.T.; Ing, H. A Comparison of Fast Inorganic Scintillators for Thermal Neutron Analysis Landmine Detection. IEEE Trans. Nucl. Sci. 2009, 56, 1584–1592. [Google Scholar] [CrossRef]
  9. Wang, X.; Qin, T.; Qin, Y.; Abdelrahman, A.H.; Witte, R.S.; Xin, H. Microwave-Induced Thermoacoustic Imaging for Embedded Explosives Detection in High-Water Content Medium. IEEE Trans. Antennas Propag. 2019, 67, 4803–4810. [Google Scholar] [CrossRef]
  10. Hallowell, S.F. Screening people for illicit substances: A survey of current portal technology. Talanta 2001, 54, 447–458. [Google Scholar] [CrossRef]
  11. Caygill, J.S.; Davis, F.; Higson, S.P. Current trends in explosive detection techniques. Talanta 2012, 88, 14–29. [Google Scholar] [CrossRef] [Green Version]
  12. Akhgari, F.; Fattahi, H.; Oskoei, Y.M. Recent advances in nanomaterial-based sensors for detection of trace nitroaromatic explosives. Sens. Actuators B Chem. 2015, 221, 867–878. [Google Scholar] [CrossRef]
  13. Woodka, M.D.; Shpil, J.C.; Schnee, V.P.; Polcha, J.M.P. Sensor array and preconcentrator for the detection of explosives in water. In Detection and Sensing of Mines, Explosive Objects, and Obscured Targets XVII; SPIE: Bellingham, WA, USA, 2012; Volume 8357, pp. 594–603. [Google Scholar] [CrossRef]
  14. Moscoso, F.G.; Almeida, J.; Sousaraei, A.; Lopes-Costa, T.; Silva, A.M.G.; Cabanillas-Gonzalez, J.; Cunha-Silva, L.; Pedrosa, J.M. A lanthanide MOF immobilized in PMMA transparent films as a selective fluorescence sensor for nitroaromatic explosive vapours. J. Mater. Chem. C 2020, 8, 3626–3630. [Google Scholar] [CrossRef]
  15. Firtat, B.; Moldovan, C.; Brasoveanu, C.; Muscalu, G.; Gartner, M.; Zaharescu, M.; Chesler, P.; Hornoiu, C.; Mihaiu, S.; Vladut, C.; et al. Miniaturised MOX based sensors for pollutant and explosive gases detection. Sens. Actuators B Chem. 2017, 249, 647–655. [Google Scholar] [CrossRef]
  16. Singha, D.K.; Majee, P.; Mondal, S.K.; Mahata, P. A Eu-Doped Y-Based Luminescent Metal–Organic Framework as a Highly Efficient Sensor for Nitroaromatic Explosives. Eur. J. Inorg. Chem. 2015, 8, 1390–1397. [Google Scholar] [CrossRef]
  17. Banerjee, D.; Hu, Z.; Li, J. Luminescent metal–organic frameworks as explosive sensors. Dalton Trans. 2014, 43, 10668–10685. [Google Scholar] [CrossRef] [PubMed]
  18. Wu, W.; Shi, N.; Zhang, J.; Wu, X.; Wang, T.; Yang, L.; Yang, R.; Ou, C.; Xue, W.; Feng, X.; et al. Electrospun fluorescent sensors for the selective detection of nitro explosive vapors and trace water. J. Mater. Chem. A 2018, 6, 18543–18550. [Google Scholar] [CrossRef]
  19. Campos, B.B.; Contreras-Cáceres, R.; Bandosz, T.J.; Jiménez-Jiménez, J.; Rodríguez-Castellón, E.; da Silva, J.C.E.; Algarra, M. Carbon dots as fluorescent sensor for detection of explosive nitrocompounds. Carbon 2016, 106, 171–178. [Google Scholar] [CrossRef]
  20. Yang, L.; Li, X.; Qin, C.; Shao, K.-Z.; Su, Z.-M. A fluorescent sensor for highly selective sensing of nitro explosives and Hg(ii) ions based on a 3D porous layer metal–organic framework. Crystengcomm 2016, 18, 4765–4771. [Google Scholar] [CrossRef]
  21. Spitzer, D.; Cottineau, T.; Piazzon, N.; Josset, S.; Schnell, F.; Pronkin, S.N.; Savinova, E.R.; Keller, V. Bio-Inspired Nanostructured Sensor for the Detection of Ultralow Concentrations of Explosives. Angew. Chem. Int. Ed. 2012, 51, 5334–5338. [Google Scholar] [CrossRef] [PubMed]
  22. Procek, M.; Stolarczyk, A.; Pustelny, T.; Maciak, E. A Study of a QCM Sensor Based on TiO2 Nanostructures for the Detection of NO2 and Explosives Vapours in Air. Sensors 2015, 15, 9563–9581. [Google Scholar] [CrossRef]
  23. Yu, P.; Chen, L.; Zhang, Y.; Zhao, S.; Chen, Z.; Hu, Y.; Liu, J.; Yang, Y.; Shi, J.; Yao, Z.; et al. Single-Molecule Tunneling Sensors for Nitrobenzene Explosives. Anal. Chem. 2022, 94, 12042–12050. [Google Scholar] [CrossRef]
  24. Sekar, S.; Gawas, P.; Bhat, S.V.; Nutalapati, V. Highly fluorescent 2D-BCNO sheets based chemical sensor for selective detection of the explosive Dunnite and 4-nitrophenol in aqueous medium. Environ. Sci. Nano 2021, 8, 2908–2919. [Google Scholar] [CrossRef]
  25. Barata, P.D.; Prata, J.V. Fluorescent Calix[4]arene-Carbazole-Containing Polymers as Sensors for Nitroaromatic Explosives. Chemosensors 2020, 8, 128. [Google Scholar] [CrossRef]
  26. Wu, J.; Fan, M.; Deng, G.; Gong, C.; Chen, K.; Luo, J.; Chiang, K.S.; Rao, Y.-J.; Gong, Y. Optofluidic laser explosive sensor with ultralow detection limit and large dynamic range using donor-acceptor-donor organic dye. Sens. Actuators B Chem. 2019, 298, 126830. [Google Scholar] [CrossRef]
  27. Wang, C.; Li, Q.; Wang, B.; Li, D.; Yu, J. Fluorescent sensors based on AIEgen-functionalised mesoporous silica nanoparticles for the detection of explosives and antibiotics. Inorg. Chem. Front. 2018, 5, 2183–2188. [Google Scholar] [CrossRef]
  28. Sodkhomkhum, R.; Masik, M.; Watchasit, S.; Suksai, C.; Boonmak, J.; Youngme, S.; Wanichacheva, N.; Ervithayasuporn, V. Imidazolylmethylpyrene sensor for dual optical detection of explosive chemical: 2,4,6-Trinitrophenol. Sens. Actuators B Chem. 2017, 245, 665–673. [Google Scholar] [CrossRef]
  29. Kumari, S.; Joshi, S.; Cordova-Sintjago, T.C.; Pant, D.D.; Sakhuja, R. Highly sensitive fluorescent imidazolium-based sensors for nanomolar detection of explosive picric acid in aqueous medium. Sens. Actuators B Chem. 2016, 229, 599–608. [Google Scholar] [CrossRef]
  30. Toal, S.J.; Trogler, W.C. Polymer sensors for nitroaromatic explosives detection. J. Mater. Chem. 2006, 16, 2871–2883. [Google Scholar] [CrossRef]
  31. Zhang, Y.; Fu, Y.-Y.; Zhu, D.-F.; Xu, J.-Q.; He, Q.-G.; Cheng, J.-G. Recent advances in fluorescence sensor for the detection of peroxide explosives. Chin. Chem. Lett. 2016, 27, 1429–1436. [Google Scholar] [CrossRef]
  32. Salinas, Y.; Martínez-Máñez, R.; Marcos, M.D.; Sancenón, F.; Costero, A.M.; Parra, M.; Gil, S. Optical chemosensors and reagents to detect explosives. Chem. Soc. Rev. 2012, 41, 1261–1296. [Google Scholar] [CrossRef]
  33. Carter, M.T.; Thomas, R.C.; Berton, M.E. Fiber waveguide chemical sensors for detection of explosive related vapors. In Detection and Remediation Technologies for Mines and Minelike Targets Vii; Society of Photo Optical: Bellingham, WA, USA, 2002; Volume 4742, pp. 509–520. [Google Scholar] [CrossRef]
  34. Ma, J.; Lv, L.; Zou, G.; Zhang, Q. Fluorescent Porous Film Modified Polymer Optical Fiber via “Click” Chemistry: Stable Dye Dispersion and Trace Explosive Detection. ACS Appl. Mater. Interfaces 2015, 7, 241–249. [Google Scholar] [CrossRef] [PubMed]
  35. Liu, F.; Cui, M.; Ma, J.; Zou, G.; Zhang, Q. An optical fiber taper fluorescent probe for detection of nitro-explosives based on tetraphenylethylene with aggregation-induced emission. Opt. Fiber Technol. 2017, 36, 98–104. [Google Scholar] [CrossRef]
  36. Eisner, L.; Flachenecker, G.; Schade, W. Doped silica sol layer coatings on evanescent field fiber Bragg gratings for optical detection of nitroaromate based explosives. Sens. Actuators A Phys. 2022, 343, 113687. [Google Scholar] [CrossRef]
  37. Chu, F.; Tsiminis, G.; Spooner, N.A.; Monro, T.M. Explosives detection by fluorescence quenching of conjugated polymers in suspended core optical fibers. Sens. Actuators B Chem. 2014, 199, 22–26. [Google Scholar] [CrossRef] [Green Version]
  38. Yang, J.; Yan, P.; Li, X.; Zhao, Z.; Qin, J.; Li, X. Optical fiber bundle fluorescence sensor for a triacetone triperoxide vapor detection of trace explosives. Sens. Actuators B Chem. 2022, 371, 132536. [Google Scholar] [CrossRef]
  39. Bhaduri, A.; Singh, S.; Thapa, K.B.; Yadav, B. Visible light-induced, highly responsive, below lower explosive limit (LEL) LPG sensor based on hydrothermally synthesized barium hexaferrite nanorods. Sens. Actuators B Chem. 2021, 348, 130714. [Google Scholar] [CrossRef]
  40. Zheng, Y.; Wu, J.; Qu, S.; Deng, G.; Li, Z.; Sun, K.; Jiang, L.; Chen, K.; Luo, J. Photo-bleaching of optical waveguide polymers with dipolar chromophores to improve their sensitivity for explosive vapor detection. J. Mater. Chem. C 2020, 8, 13010–13018. [Google Scholar] [CrossRef]
  41. Chen, A.; Sun, H.; Pyayt, A.; Zhang, X.; Luo, J.; Jen, A.; Sullivan, P.A.; Elangovan, S.; Dalton, L.R.; Dinu, R.; et al. Chromophore-Containing Polymers for Trace Explosive Sensors. J. Phys. Chem. C 2008, 112, 8072–8078. [Google Scholar] [CrossRef]
  42. Jiang, L.; Wu, J.; Chen, K.; Zheng, Y.; Deng, G.; Zhang, X.; Li, Z.; Chiang, K.S. Polymer waveguide Mach-Zehnder interferometer coated with dipolar polycarbonate for on-chip nitroaromatics detection. Sens. Actuators B Chem. 2019, 305, 127406. [Google Scholar] [CrossRef]
  43. Kostenko, K.V.; Kryukov, Y.S. Technique for detecting a direct signal pulse from an underwater explosive source in a waveguide. Acoust. Phys. 2016, 62, 112–116. [Google Scholar] [CrossRef]
  44. Upadhyay, A.; Yadav, C.S.; Sharma, G.; Kumar, S.; Singh, V. Common path interferometeric analysis of a planar polymer optical waveguide having adlayer of 2D materials for biosensing applications. Opt. Quantum Electron. 2021, 53, 1–11. [Google Scholar] [CrossRef]
  45. Upadhyay, A.; Yadav, C.S.; Maurya, R.; Sharma, G.; Singh, T.S.; Kumar, S.; Singh, V. Experimental detection of chlorpyrifos by MoS2 coated planar polymer waveguide sensor utilizing common path interferometric principle. Optik 2023, 276, 170668. [Google Scholar] [CrossRef]

Figure 1. Synthetic route of dipolar polycarbonate (DPC) and chemical structure of nitro-explosive DNT. Note that the moiety highlighted in red and blue shows the electron donor and electron acceptor, respectively *.
Chemosensors 11 00246 g001
Figure 2. (a) Structure of the MZI waveguide without upper cladding; (b) structure of the MZI core with upper cladding; (c) cross-section of the two arms of the MZI.
Chemosensors 11 00246 g002
Figure 3. (a) Effective refractive index (neff) and group refractive index (ng) of sensitive narrower waveguide as functions of core widths; (b) effective refractive index as a function of the refractive index of DPC for five core widths; (c) electrical field distribution of optical mode for the 5 μm wide core and (d) 3 μm wide core.
Chemosensors 11 00246 g003
Figure 4. The process of device fabrication. (a). Cleaning of Si substrate; (b). Forming the lower cladding; (c). Forming the core; (d). Forming the upper cladding; and (e). Spin-coating of DPC.
Chemosensors 11 00246 g004
Figure 5. Optical microscopic and SEM images of the MZI waveguide before coating DPC. (a) Input TMI; (b) output Y-junction; (c) two arms of MZI; (d) two arms of MZI after coating EpoClad, without cladding on narrower arm; (e) SEM images of two arms; (f) cross-sectional view of the two arms.
Chemosensors 11 00246 g005
Figure 6. Measurement setup for explosive detection.
Chemosensors 11 00246 g006
Figure 7. (a) Output transmission spectra of MZI sensor with different concentrations of DNT; (b) the central wavelength shift as a function of DNT concentration.
Chemosensors 11 00246 g007
Disclaimer/Publisher’s Note: The statements, opinions and data contained in all publications are solely those of the individual author(s) and contributor(s) and not of MDPI and/or the editor(s). MDPI and/or the editor(s) disclaim responsibility for any injury to people or property resulting from any ideas, methods, instructions or products referred to in the content.