Article

Application of a Single-Type eNose to Discriminate the Brewed Aroma of One Caffeinated and Decaffeinated Encapsulated Espresso Coffee Type

Robotics Laboratory, Universitat de Lleida, Jaume II 69, 25001 Lleida, Spain
*
Author to whom correspondence should be addressed.
Chemosensors 2022, 10(10), 421; https://doi.org/10.3390/chemosensors10100421
Submission received: 14 September 2022 / Revised: 6 October 2022 / Accepted: 10 October 2022 / Published: 13 October 2022

Abstract

:
This paper assesses a custom single-type electronic nose (eNose) applied to differentiate the complex aromas generated by the caffeinated and decaffeinated versions of one encapsulated espresso coffee mixture type. The eNose used is composed of 16 single-type (identical) metal–oxide semiconductor (MOX) gas sensors based on microelectromechanical system (MEMS). This eNose proposal takes advantage of the small but inherent sensing variability of MOX gas sensors in order to provide a multisensorial description of volatiles or aromas. Results have shown that the information provided with this eNose processed using LDA is able to successfully discriminate the complex aromas of one caffeinated and decaffeinated encapsulated espresso coffee type.

1. Introduction

Coffee is one of the hot beverages most consumed worldwide. The scent produced by coffee after its brewing process can provide useful information to assess the quality of its industrial production. Despite the large quantity of information that can be extracted from analyzing the aroma that recently brewed coffee emanates, its large number of complex, volatile compounds usually requires the use of large, expensive spectrometer devices to analyze it [1,2]. This paper addresses this problem by assessing the application of a custom low-cost electronic nose (eNose) to discriminate between the aromas of encapsulated caffeinated and decaffeinated expresso coffee varieties after being brewed.
In general, an eNose consists of an array of nonspecific, low-selective electrochemical sensors with high stability and cross-selectivity toward volatile compounds, odors, or aromas. The information gathered by the array of sensors is processed with pattern recognition algorithms [3] in order to generate a fingerprint of the perceived volatile compound, odor, or aroma [4]. The continuous evolution of low-cost metal–oxide (MOX) gas sensors is currently fostering the development of compact arrays [5,6], which are able to provide the multivariate information required to implement an eNose. In general, low-cost MOX gas sensors suffer from drift in sensitivity and low specificity [5,7,8,9,10] that can be compensated [11] by applying signal processing techniques or by implementing specific calibration procedures [12]. Despite these known drawbacks, the recent advances and growing popularity of eNoses equipped with MOX gas sensors are promoting their use in areas in which traditional spectroscopy was deemed unviable because of its high cost, power consumption, and size, such as waste management [13,14] and disease detection [15]. In general, the number of gas sensors used in an eNose used to be lower than 20 [16]. As recent examples, Teixeira et al. [17] proposed the development of a custom eNose composed of 9 different MOX gas sensor types, and Burgués et al. [18] applied a custom eNose composed of 27 MOX from five family types.
Alternatively, this paper is based on the use of a custom eNose composed of 16 single-type (identical type) miniature MOX gas sensors implemented as a low-cost microelectromechanical system (MEMS). The underlying idea of this alternative eNose proposal was to take advantage of the small but inherent sensing variability of the 16 identical MOX gas sensors [5] to provide a multivariate description of volatile compounds, odors, or aromas. This custom eNose proposal, named Osmee One, has been proven capable of distinguishing between two [16,19] or three [20] single volatile compounds, and this paper presents the first assessment with complex aromas such as the ones generated by caffeinated and decaffeinated coffee after being brewed.
Buratti et al. [21] stated that “the espresso coffee overall quality is affected by many factors related to coffee (variety, roasting conditions and storage conditions) [22,23,24,25], to water composition [26] and to the parameters of the percolation (temperature and pressure of water, grinding grade, dose of coffee, coffee/water ratio, pressure on the upper surface of coffee cake, extraction time) [27,28,29,30]”. In this first eNose application example with complex aromas, these factors will be controlled by using an encapsulated espresso ground coffee, using soft mineral water to brew the coffee, and using a new semiautomatic coffee machine in order to guarantee similar brewing conditions that do not affect the aroma of the coffee.
At this moment, the specific problem of discriminating between caffeinated and decaffeinated coffee is addressed using expensive laboratory equipment. Souto et al. [31] used Ultraviolet–Visible (UV-VIS) spectroscopy and chemometric techniques to classify the type (caffeinated or decaffeinated) and the conservation state (expired or nonexpired) of aqueous extracts of Brazilian ground roast coffee. Yulia et al. [32] discriminated between caffeinated and decaffeinated coffee using UV-VIS spectroscopy. Zou et al. [33] analyzed caffeinated and decaffeinated coffee using a headspace solid-phase microextraction two-dimensional gas chromatography time-of-flight mass spectrometry (HS-SPME-GC×GC-TOFMS), identifying 20 discriminatory features and specific markers that could enable a distinct classification between caffeinated and decaffeinated coffee. Specifically, eNoses have also been applied to evaluate bean ripening and to detect bean defects [34], classify different coffee brands [35], discriminate geographical origin and roasting degree of the coffee [36], evaluate the aromatic profile [37], and to estimate coffee intensity [38]. Brudzewski et al. [39] proposed the recognition of high-quality arabica coffee specie using a differential eNose composed of two identical eNoses [40]. Greco et al. [41] compared four kinds of powder and encapsulated espresso coffees with an eNose in order to provide a user-friendly tool that can be used in the food quality control chain.
The new contribution of this paper is the demonstration that a low-cost eNose based on 16 single-type commercial MOX gas sensors can be applied to discriminate the aromas of encapsulated caffeinated and decaffeinated expresso brewed coffee. At this moment, this challenging discrimination can be made with spectrometers that cost 100 times more than the eNose used in this paper, a fact that limits their application to quality control in laboratory facilities. Therefore, the complete development of inexpensive eNoses has the potential to decentralize and improve the quality control of different industrial productions, such as goods and commodities. Regarding the eNose application presented in this paper, caffeine is a soluble and nonvolatile compound that does not directly affects the aroma but its presence indirectly affects the generation of other volatile substances originally present in the aroma of coffee [42], so its presence should be detectable from the aroma of the brewed coffee. The experimental analysis conducted in this work has demonstrated that an eNose using 16 single-type commercial and low-cost MOX gas sensors has enough multisensory information and enough sensitivity to successfully discriminate the complex aroma of the coffee by applying a linear discriminant analysis (LDA) to the raw resistance information gathered from the eNose.
In the future, this low-cost eNose will be deployed either as a fixed net of multiple sensors or embedded in autonomous omnidirectional mobile robots [43,44,45] in order to compare its gas and odor detection performances.

2. Background: Brewed Coffee Beverage

The brewed coffee beverage is prepared from roasted and ground coffee beans harvested from coffee plants cultivated around the world. The brewing of coffee is a process that extracts the volatile compounds and soluble and insoluble compounds from the ground coffee [28]. The volatile compounds are responsible for the aroma and are composed of ketones, aldehydes, pyrazines, and many other volatiles [46]. The soluble and nonvolatile compounds define the taste of coffee and are composed of caffeine, acids, phenolic compounds, sugars, and many other substances [46]. The insoluble molecules affect the body and foam of coffee and are composed of proteins, polysaccharides, lipids, melanoidins, and many other molecules [46]. The main characteristics of green coffee beans depend on the origin, location, and climate where coffee is cultivated (altitude, land composition, and temperature) and the processing method of each coffee variety.
The coffee beans are seeds of trees belonging to the botanical family Rubiaceae, genus Coffea. Currently, there are around 100 coffee species within the genus Coffea [47]; however, only two of them are widely cultivated and commercialized on a large scale: the arabica coffee (Coffea Arabica) and the robusta coffee (Coffea Canephora), representing the 58.61% and the 41.39% of the coffee cultivated and commercialized worldwide [48].
These two coffee species are very different. Arabica is cultivated on the slopes of mountains at high altitudes, mainly in Eastern Africa and Central and South America, and its beans have a sweet and delicate flavor, with an average of 0.9–1.4% of caffeine [46]. Alternatively, robusta is cultivated on lower altitudes, mainly in West Africa and South-East Asia, because it is resistant to hot and humid tropical climates, and its beans have a strong flavor with around 1.5–2.6% of caffeine [46]. Belitz et al. [46] reported that of the 850 volatile compounds identified in the aroma of coffee, only 40 contribute to generating the characteristic aroma of coffee.
In general, any commercialized coffee beverage type is composed of a mixture of arabica and robusta beans from different origins. This mixture is usually strictly supervised in order to maintain the characteristic aroma profile and coffee intensity of a commercial coffee type. The coffee beans can be processed to significantly reduce their caffeine content, allowing the simultaneous commercialization of the same coffee mixture type in caffeinated and decaffeinated versions. In general, the decaffeination processes are usually applied to arabica rather than robusta because arabica has lower initial caffeine content and requires less processing [49].

3. Materials and Methods

The materials and methods used in this paper are an eNose-based coffee measurement setup, one selected caffeinated and decaffeinated encapsulated espresso coffee type, one semiautomatic coffee machine, the mineral water used to brew the coffee, the procedure for espresso coffee brewing and aroma measurement, and the linear discriminant analysis (LDA) method applied for dimensional reduction and classification.

3.1. eNose-Based Coffee Measurement Setup

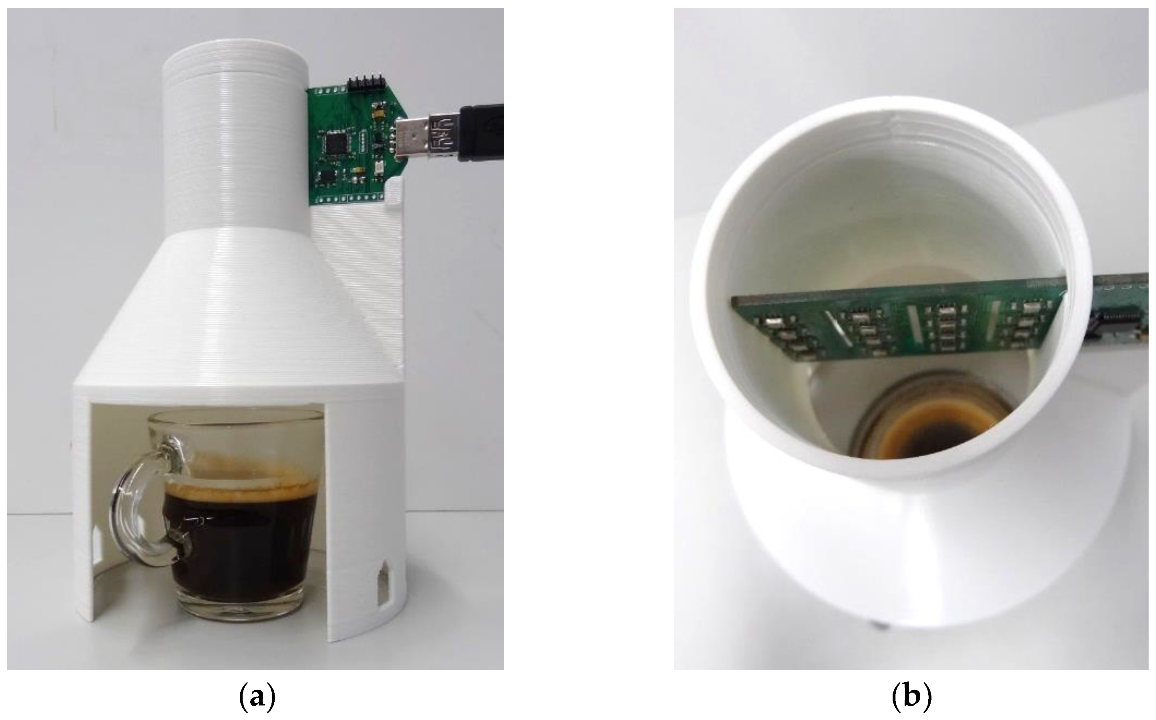
Figure 1 shows two images of the eNose-based coffee measurement setup used in this paper to discriminate between encapsulated caffeinated and decaffeinated espresso coffee. The measurement setup (Figure 1a) consists of a support structure and the Osmee One eNose composed of an array of 16 single-type (identical) metal–oxide semiconductor (MOX) gas sensors embedded as a microelectromechanical system (MEMS) in the commercially available BME680 sensor device (Bosch Sensortec, Reutlingen, Germany). The parameter used to modulate the array is the working temperature of the 16 different sensors. As reported in Table 5 of the previous publication [16], the targeted heating temperature is varied from 200 °C to 400 °C. This eNose was designed with 16 sensors in order to be suitable in size for the intended applications. The support structure is 3D printed with polylactic acid (PLA), with the shape of a circular pipe with a variable section. The lower part of the pipe is laid on the ground and has the widest circular section in order to allow a cup to be placed inside. The upper part of the pipe has the minimum circular section in order to hold the MOX gas sensors of the electronic board of the eNose inside the pipe (Figure 1b) and in close contact with the coffee aromas. The lower part of the support structure has an aperture to slide a cup of espresso coffee inside the pipe. This lower part also has a set of holes to allow the generation of natural convection and the circulation of the coffee aroma inside the pipe.

3.2. Caffeinated and Decaffeinated Encapsulated Espresso Coffee Type

The caffeinated and decaffeinated encapsulated espresso coffee types analyzed in this work are Volluto and Volluto Decaffeinato. These two encapsulated espresso coffee types are manufactured by Nespresso (Nestlé Nespresso, Lausanne, Switzerland) using a proprietary single-dose sealed aluminum capsule that has the advantage of preserving the freshness and aromas of the ground coffee [50].
Table 1 summarizes the main features of the Volluto and Volluto Decaffeinato types. In both cases, the coffee specie is arabica, but their specific aromatic profile and notes result from a mixture sourced from different locations and roasting processes. The intensity of each type is quantified with a scale ranging from 1 to 13, and the acidity, bitterness, and roast level are quantified using scales from 1 to 5. According to the manufacturer, the features that define the intensity of a coffee are its body, bitterness, and the degree of roasting, which are strongly related to the origin and type of beans used in the coffee mixture. The coffee intensity is also dependent on the concentration of the coffee, and it does not refer to the amount of caffeine it has.
Table 1 also provides an unverified estimation of the caffeine contained in each capsule, which does not correspond to the caffeine extracted during the brewing, nor the caffeine ingested. Then, according to the information shown in Table 1, the difference between these two coffee types is the decaffeination process that has been applied during the manufacturing of the Volluto Decaffeinato type. So, it must be expected that a generation of very similar aromas during the brewing of these two coffee types will make discrimination difficult.

3.3. Coffee Machine

The semiautomatic coffee machine used in this paper is a brand-new Nespresso C40 Inissia coffee machine (Nestlé Nespresso, Lausanne, Switzerland). This machine brews coffee from Nespresso aluminum capsules that contain roasted ground coffee mixtures. This coffee machine is able to brew espresso (40 mL) or lungo (110 mL) coffee brews. The capsules are inserted into the machine, and then they are pierced in order to inject hot pressurized water through them and obtain the brewed coffee. According to the manufacturer specifications, the brewing pressure is 19 MPa, and the temperature of the extracted coffee at the coffee outlet is between 83 and 86 °C, although it might cool quickly if the cup where it is brewed is cold. The recommended cup size of the coffee types analyzed in this paper is espresso or 40 mL, which corresponds to the default espresso volume setting already programmed in the coffee machine (standard preset espresso), which is selected and automatically initiated by pressing a button on the coffee machine.

3.4. Natural Mineral Water

The water used to brew the coffee samples analyzed in this paper is the Font Boix natural mineral water [51] manufactured by Aguas Minerales de Caldas de Bohi S.A (La Vall de Boí, Crta. De Caldes, Km 18.5, 25528 Caldes de Boí, Lleida, Spain). This natural mineral water comes from the Aigüestortes National Park, in the Catalan part of the Pyrenees, at an altitude of 1500 m. The water has been provided in a set of 8 L bottles made of transparent Polyethylene Terephthalate (PET) plastic, with a cap made of high-density polyethylene (HDPE).
Navarini et al. [52] analyzed the effect of water composition on the quality of espresso coffee beverages. In particular, they analyzed the interactions between water and coffee components during the brewing process and discussed the role played by alkalinity and selected cations on sensory properties. In general, about 98% of brewed coffee is water, and the use of hard or saturated water prevents the correct extraction of the aromatic components during the coffee brew.
Table 2 shows the chemical composition of the bottled water used in the experiments, which was externally provided and certified by the laboratory of Dr. Oliver Rodés (c/de les Moreres 21, 08820 El Prat de Llobregat, Barcelona, Spain). In our country, Spain, this natural mineral water is classified as very low mineralized water, a category that can have up to 50 mg/L of dry residue at 180 °C. Additionally, the amounts of calcium (6.8 mg/L) and magnesium (0.7 mg/L) in this water generate a permanent total hardness of 19.9 mg/L (or ppm) of calcium carbonate ( CaCO 3 ), allowing its classification as soft water (range up to 60 mg/L of CaCO 3 ).

3.5. Procedure for Espresso Coffee Brewing Aroma Measurement

The complete procedure used in this paper for espresso coffee brewing aroma measurement has 17 steps:
  • Insert the eNose in the coffee measurement setup;
  • Power the eNose with an external power supply for at least 12 h in order to guarantee that the MOX gas sensors are at their ideal working temperature;
  • Connect the eNose to a computer using a USB connection in order to record the data gathered during the experiment;
  • Revise the level of the water tank of the coffee machine, refill if necessary;
  • Turn on the coffee machine (the coffee machine reaches the operating temperature after approximately one minute);
  • Place an espresso-sized glass cup on the cup tray of the coffee machine;
  • Insert the coffee capsule into the coffee machine;
  • Initiate the registering of the data provided by the eNose;
  • Press the espresso button of the coffee machine, and when the water reaches the correct temperature, the espresso coffee is brewed;
  • Remove the cup of coffee without sudden movements from the cup tray of the coffee machine and place it inside the coffee measurement setup;
  • Continue registering the data provided by the eNose for another 10 min from the insertion of the cup inside the coffee measurement setup;
  • After these 10 min, stop the recording of data;
  • Weigh the coffee cup of coffee with a precision scale;
  • Rinse the cup with tap water and dry it with a single-use paper cloth;
  • Remove the used capsule from the coffee machine and prepare to recycle it;
  • If this is the last experiment of a planned sequence, or if the next experiment will brew a different coffee type, brew espresso without a capsule (with only water) to clean the coffee machine, pull up the lever, and rinse the drip tray and the capsule container with tap water;
  • Ventilate the room for at least 10 min.
During the brewing of the coffee cups performed in this paper, the amount of water used to make an espresso coffee was 49.73 g with a standard deviation of ±0.34 g, and the mean temperature of the water measured after coffee extraction was 72.76 °C with a standard deviation of ±0.41 °C.

3.6. Linear Discriminant Analysis (LDA)

The linear discriminant analysis (LDA) [53] is a supervised statistical method for dimensionality reduction that computes the eigenvectors and the covariance matrix of a set of data. The LDA procedure assumes that the different classes included in the set of data are based on different Gaussian distributions and looks for linear combinations of the features that best explain the classes of data while maximizing the variance and separation between them. The result of the computation of the LDA is a projection that reduces the dimensionality of the data. The discriminant analysis part of the LDA procedure also predicts the class of a new sample by computing its proximity to the centroid of the original classes evaluated in the projected space [54].

4. eNose Data

4.1. Example Espresso Volluto and Volluto Decaffeinato eNose Measurements

Figure 2a,b show the typical profile of the raw resistance measured by the 16 MOX gas sensors of the eNose exposed to the complex aromas generated by brewed coffee. The MOX gas sensors used by the Osmee One eNose are embedded into a digital sensor that directly provides a measurement of the resistance of the thin layer of the MOX gas sensors, so each time-point depicted in Figure 2 is a digital value representing the resistance of the thin layer of one of the 16 MOX gas sensors obtained after completing one measurement [16]. The evolution of the digital profiles displayed in Figure 2 is similar to the profiles obtained when using analog MOX gas sensors [55].
Figure 2a shows the resistance of the thin layers of the 16 MOX gas sensors of the eNose in one measurement experiment performed with a cup of Volluto espresso coffee and Figure 2b in one measurement experiment performed with a cup of Volluto Decaffeinato espresso coffee. The profile displayed in Figure 2 shows that the resistance of the MOX gas sensors suddenly drops when a cup of coffee is inserted into the coffee measurement setup. The areas highlighted in Figure 2 correspond to the eNose measuring AIR (before inserting the cup of coffee) and the eNose measuring the SAMPLE of coffee. At this moment, the AIR and SAMPLE areas are manually selected and used to create reference training and validation datasets.

4.2. Creation of a Training Dataset for Air, Hot Water, and Caffeinated and Decaffeinated Coffee

The use of an eNose to discriminate different volatiles or aromas require the creation of a training dataset. In this paper, the training dataset is proposed to lately discriminate the aromas of brewed Volluto and Volluto Decaffeinato espresso coffee varieties, as well as air and hot water. The creation of this training dataset is based on the information gathered in 17 measurements with the coffee measurement setup. The experiments have been conducted on alternate days and at alternate scheduling times in order to obtain representative information on the influence of the ambient conditions in the measurements. The training dataset is composed of the following:
  • The results of eight experiments in which the eNose was exposed to the aroma of Volluto espresso brewed coffee. In each measurement, the areas of AIR and SAMPLE have been manually selected (see Figure 2a) and then subsampled in order to limit the number of samples available in each selection to 30 data points (or raw resistance vectors). In summary, these experiments have generated eight clusters of AIR containing 30 data points per cluster (with a total of 240 AIR data points) and eight clusters of VOLLUTO coffee containing 30 data points per cluster (with a total of 240 VOLLUTO data points);
  • The results of eight experiments in which the eNose was exposed to the aroma of Volluto Decaffeinato espresso brewed coffee. In each measurement, the areas of AIR and SAMPLE have been manually selected (see Figure 2b) and then subsampled in order to limit the number of samples to 30 data points. In summary, these experiments have generated eight additional clusters of AIR containing 30 data points per cluster (with a total of 240 additional AIR data points) and eight clusters of VOLLUTO DECAFFEINATO coffee containing 30 data points per cluster (with a total of 240 VOLLUTO DECAFFEINATO data points);
  • The result of one long measurement experiment in which the eNose was exposed to the vapor generated by a cup filled with only hot water for 15 min. Hot water has been obtained from the coffee machine brewing an espresso without any capsule of coffee in the machine. In this measurement, a long SAMPLE area has been manually selected and then subsampled in order to limit the number of samples to 240 data points. In summary, this experiment generated one cluster of HOT WATER containing 240 data points.
Finally, Figure 3 compares two different eNose measures of the classes AIR, HOT WATER, VOLLUTO, and VOLLUTO DECAFFEINATO. Figure 3 shows the comparative evolution of some normalized samples of the resistance of the thin layer of the 16 MOX gas sensors. Each individual data sample is scaled from 0.0 (minimum resistance measured in the sample) to 1.0 (maximum resistance measured in the sample). In previous works [16], this normalized representation of the information provided by the eNose revealed common patterns that allowed the discrimination of isolated volatiles. However, in this application case with complex coffee aromas, this normalized representation reveals substantial differences between the aroma of the VOLLUTO clusters (V-1 and V-2) and also strong differences between the aroma of the VOLLUTO DECAFFEINATO clusters (VD-1 and VD-2). In fact, according to this normalized representation, the maximum visual similarities are between the aromas of the two different coffee classes, V-1 and VD-1 and V-2 and VD-2, anticipating that the discrimination between coffee and air or hot water will be simple and that the discrimination between decaffeinated and caffeinated coffee type will pose more difficulty.

4.3. Creation of a Validation Dataset for Caffeinated and Decaffeinated Coffee Discrimination

The dataset used in this paper to validate the performance of the classifiers has been obtained by performing 10 new measurement experiments with Volluto and Volluto Decaffeinato brewed espresso coffees using the coffee measurement setup. These experiments have also been conducted on alternating days and different scheduling times to assess the classifier in different sensor drift and ambient conditions. The validation dataset is composed of the following:
  • The results of five experiments measuring the aroma of Volluto espresso brewed coffee. In each measurement, the representative SAMPLE section has been manually selected (see Figure 2a) and then subsampled in order to limit the number of samples to 30 data points (or raw resistance vectors). In summary, these experiments have generated five clusters of VOLLUTO (caffeinated coffee) containing 30 data points per cluster (with a total of 150 VOLLUTO data points);
  • The results of five experiments measuring the aroma of Volluto Decaffeinato espresso brewed coffee. In each measurement, the representative SAMPLE section has been manually selected (see Figure 2b) and then subsampled in order to limit the number of samples to 30 data points. In summary, these experiments have generated five clusters of VOLLUTO DECAFFEINATO (decaffeinated coffee) containing 30 data points per cluster (with a total of 150 VOLLUTO DECAFFEINATO data points).

5. eNose Aroma Classification Based on LDA

This section describes the different strategies followed in computing the LDA projection based on the class information included in the training dataset. The LDA projection looks for a linear combination of the original information provided by the MOX gas sensors of the eNose that maximizes the variance and separation between the clusters. In previous works [16,19,20] dealing with simple volatile compounds, the projection performance of PCA and LDA were exhaustively described and compared, but in this case, focused on the discrimination of the complex aromas of the coffee, the LDA yields better classification results.

5.1. LDA Projection Computed for AIR, HOT WATER, and COFFEE Classes

Figure 4 shows the LDA projection computed in the case of defining three target classes: AIR, HOT WATER, and COFFEE (grouping the VOLLUTO and VOLLUTO DECAFFEINATO original training classes). Figure 4 shows the best LDA projection results that have been obtained when processing the information of the training dataset using the raw resistance as a feature. The labels LD1 and LD2 represent the direction of maximal variance and better separation obtained with the LDA projection. Figure 4 includes in the background the colored 2D class map representation (presented in [20]), which is obtained by defining a 2D grid in the 2D space defined by the LD1 and LD2 axis and by classifying each point of the grid with the discriminant part of the LDA procedure. The boundaries defined in the class maps of the LDA are straight because the discriminant analysis uses the centroid of the clusters for classification. Table 3 shows the statistics obtained with the LDA classification of the training dataset in which all data points have been successfully classified. The value of the LDA projection matrix and the centroids generated to create the 2D class map are provided in Appendix A as Equation (A2) and Table A1.
The advantage of this LDA projection is that it allows the automatic discrimination between AIR and COFFEE, so there is no need for a triggering strategy to specifically start a coffee aroma measurement. At this point, the HOT WATER class was just proposed as a complementary test class to evaluate the sensitivity of the eNose with hot air saturated with humidity in order to ensure that the eNose is detecting the aroma of the coffees and not only the effects of hot temperature and high humidity. In practice, the discrimination between HOT WATER and COFFEE is a classification feature that can be used to detect situations where an automatic brewing coffee machine has run out of ground coffee or coffee is not being poured into the cup because of a mechanical malfunction.

5.2. LDA Projection for AIR, HOT WATER, VOLLUTO, and VOLLUTO DECAF Classes

Figure 5 shows the alternative LDA projection computed in the case of using the four original classes: AIR, HOT WATER, VOLLUTO, and VOLLUTO DECAFFEINATO. Figure 5 shows the best projection results that have also been obtained when processing the information of the training dataset as raw resistance. Figure 5 also includes a colored 2D class map representation [20]. Table 4 shows the statistics obtained with the LDA classification of the training dataset in which the data points of VOLLUTO and VOLLUTO DECAFFEINATO have not been successfully classified, probably because of the similarities between the aroma of these two coffee types and the influence of the information from the other classes in the LDA computation.

5.3. LDA Projection Computed for VOLLUTO and VOLLUTO DECAF Classes

Figure 6 shows the LDA projection computed specifically to discriminate the aromas of the classes of VOLLUTO and VOLLUTO DECAFFEINATO. Figure 6 shows the projection results obtained when processing the information of the training dataset as raw resistance and a colored 2D class map representation of the classification [20]. Table 5 shows the statistics obtained with this LDA classification applied to the training dataset which, in this case, has been able to successfully discriminate between VOLLUTO and VOLLUTO DECAFFEINATO coffee varieties. The value of the LDA projection matrix and the centroids used are provided in Appendix A as Equation (A3) and Table A2.

6. Validation Experiments

This section validates the different LDA projections proposed in the previous section to classify the caffeinated and decaffeinated (Volluto and Volluto Decaffeinato) espresso coffee varieties.

6.1. Validation of the Classification of AIR, HOT WATER, and COFFEE

This section shows the classification of the validation dataset using the LDA projection computed previously to differentiate between three classes (described in Figure 4) of AIR, HOT WATER, and COFFEE (without discriminating between caffeinated or decaffeinated coffee). Figure 7 shows the classification class map for these three classes in the background of the figure and the projection of all the validation data points (caffeinated and decaffeinated) that have been classified successfully as COFFEE samples and represented with a brown circular point. Table 6 summarizes the statistics of this classification, showing that the proposed classifier does not confuse the coffee samples with hot water.

Case Example of a Complete Classification Result

This section shows, as a case example, the classification of a complete transitory measurement. Figure 8a shows the evolution of a complete raw transitory resistance provided by the eNose exposed to the aromas of Volluto Decaffeinato brewed espresso coffee. The transitory has been manually divided into four sections: VD-S1 when the eNose is measuring air, VD-S2 when the cup is inserted in the measurement setup, VD-S3 when the information provided by the eNose is stable, and VD-S4 when the cup starts to cool. In each section, the raw resistance information provided by the 16 MOX gas sensors of the eNose has been colored with an identifying color. Figure 8b shows the classification results of the transitory using the LDA projection computed previously to differentiate between three classes (see Figure 4) of AIR, HOT WATER, and COFFEE.
Figure 9 shows the details of the classification; the initial section, VD-S1, has been successfully classified as AIR; the second section, VD-S2, obtained when inserting the cup in the measurement setup, has been classified as AIR for a brief period of time before being correctly classified as COFEE; the third steady-state section, VD-S3, has been successfully classified as COFFEE and its projection surrounds the centroid of the COFEE class; the final fourth section, VD-S4, is already classified as COFFEE although the projection is moving in the direction of the air zone. In conclusion, the presence of the aroma of the coffee is successfully detected shortly after the insertion of the cup in the measurement setup, revealing the high sensitivity of the MOX gas sensors of the eNose to the coffee aromas.

6.2. Validation of the Classification of AIR, HOT WATER, VOLLUTO, and VOLLUTO DEC

This section shows the classification of the validation dataset using the LDA projection computed previously to differentiate between four classes (described in Figure 5) of AIR, HOT WATER, VOLLUTO, and VOLLUTO DECAFFEINATO. Figure 10 shows the classification class map for these four classes in the background of the figure and the projection of the validation data points labeled with a unique color in case of being classified successfully and with a different inner (classification class) and outer (real class) color in case of misclassification.
Figure 10 shows that this LDA projection is not able to successfully discriminate between caffeinated and decaffeinated coffee types, probably because of crossed effects with air and hot water in the LDA computation rather than the presumably similar Gaussian distribution of the caffeinated and decaffeinated coffee types. Finally, Table 7 summarizes the statistics of this classification.

6.3. Validation of the Classification of VOLLUTO and VOLLUTO DECAFFEINATO

This section shows the final classification of the validation dataset using the LDA projection computed to differentiate between the two coffee types (described in Figure 6) of VOLLUTO and VOLLUTO DECAFFEINATO (or caffeinated and decaffeinated coffee). Figure 11a,b represents the class map generated with this two-class LDA projection in the background of the figure. The projection of the validation data points is labeled with a unique color in cases being successfully classified and with a different inner (classification class) and outer (real class) color in case of misclassification.
Figure 11a shows the projection of the 150 data points representing the caffeinated coffee type and 150 data points of the decaffeinated coffee type. In this case, three samples of caffeinated coffee have been misclassified as decaffeinated. This misclassification effect is caused by the discriminant analysis of the LDA procedure, which is based on representing the classes with a centroid, so the boundaries between classes are always summarized with a line that, in this case, is not able to fully successfully classify the concave distribution of the Volluto Decaffeinato data points. Table 8 summarizes the statistics of the classification displayed in Figure 11a that successfully classified 99% of the validation data points.
Alternatively, Figure 11b shows that the misclassification effect can be avoided by averaging the clusters included in the validation dataset. Then, each validation measurement composed of the original 30 data points is summarized in only one average data point: five average data points are used to represent the caffeinated coffee and five to represent the decaffeinated coffee. These average data points are listed in Table A3 and Table A4 in the Appendix of this paper. Finally, Table 9 shows the statistics of the classification displayed in Figure 11b, which was able to successfully discriminate between caffeinated and decaffeinated coffee types because the use of one average value to represent a measurement has the effect of reducing the variance of the data measured.

7. Discussion and Conclusions

This paper has assessed the performance of a single-type electronic nose design applied to differentiate between the complex aromas of caffeinated and decaffeinated espresso coffee varieties. The eNose used in this paper is composed of 16 single-type (identical) metal–oxide semiconductor (MOX) gas sensors embedded as a microelectromechanical system (MEMS) in a versatile digital sensor. The hypothesis explored with this eNose is that the small but inherent variability of MOX gas sensors can be exploited to provide the multisensorial description required to identify a volatile or aroma. In previous works, this eNose was assessed with different single volatile compounds, and in this paper, this eNose has been first exposed to the chemistry of a complex coffee aroma, composed of more than 850 mixed volatile compounds, although it is known that the characteristic aroma of coffee is dominated by fewer compounds [46].
This paper has assessed the discrimination of the aromas of a caffeinated and decaffeinated Volluto and Volluto Decaffeinato encapsulated espresso coffee variety manufactured by Nespresso. The use of a single-dose sealed aluminum encapsulated ground coffee has the advantage of preserving the constant freshness and aroma of the coffee [50]. These two coffee types are based on the arabica specie and are almost identical, the only difference being their caffeine content. The caffeine is not a volatile, so it should not affect the aroma of the brewed coffee, but the coffee aroma can be affected by the procedure used to extract the caffeine from the beans, which can affect the formation of other volatiles during the brewing [42]. Discriminating between caffeinated and decaffeinated coffee has so far been approached using expensive laboratory equipment [31,32,33], so analyzing the complex aromas of brewed coffee has been considered an ideal, challenging application for the low-cost Osmee One eNose.
The aroma measurement experiments conducted in this paper have been performed in a controlled environment [21] using a specific measurement setup to facilitate the circulation of the aromas of the brewed coffee around the eNose. The raw resistance data gathered by the eNose have been analyzed with LDA because the achieved supervised dimensional reduction maximizes the variance and separation between the analyzed classes.
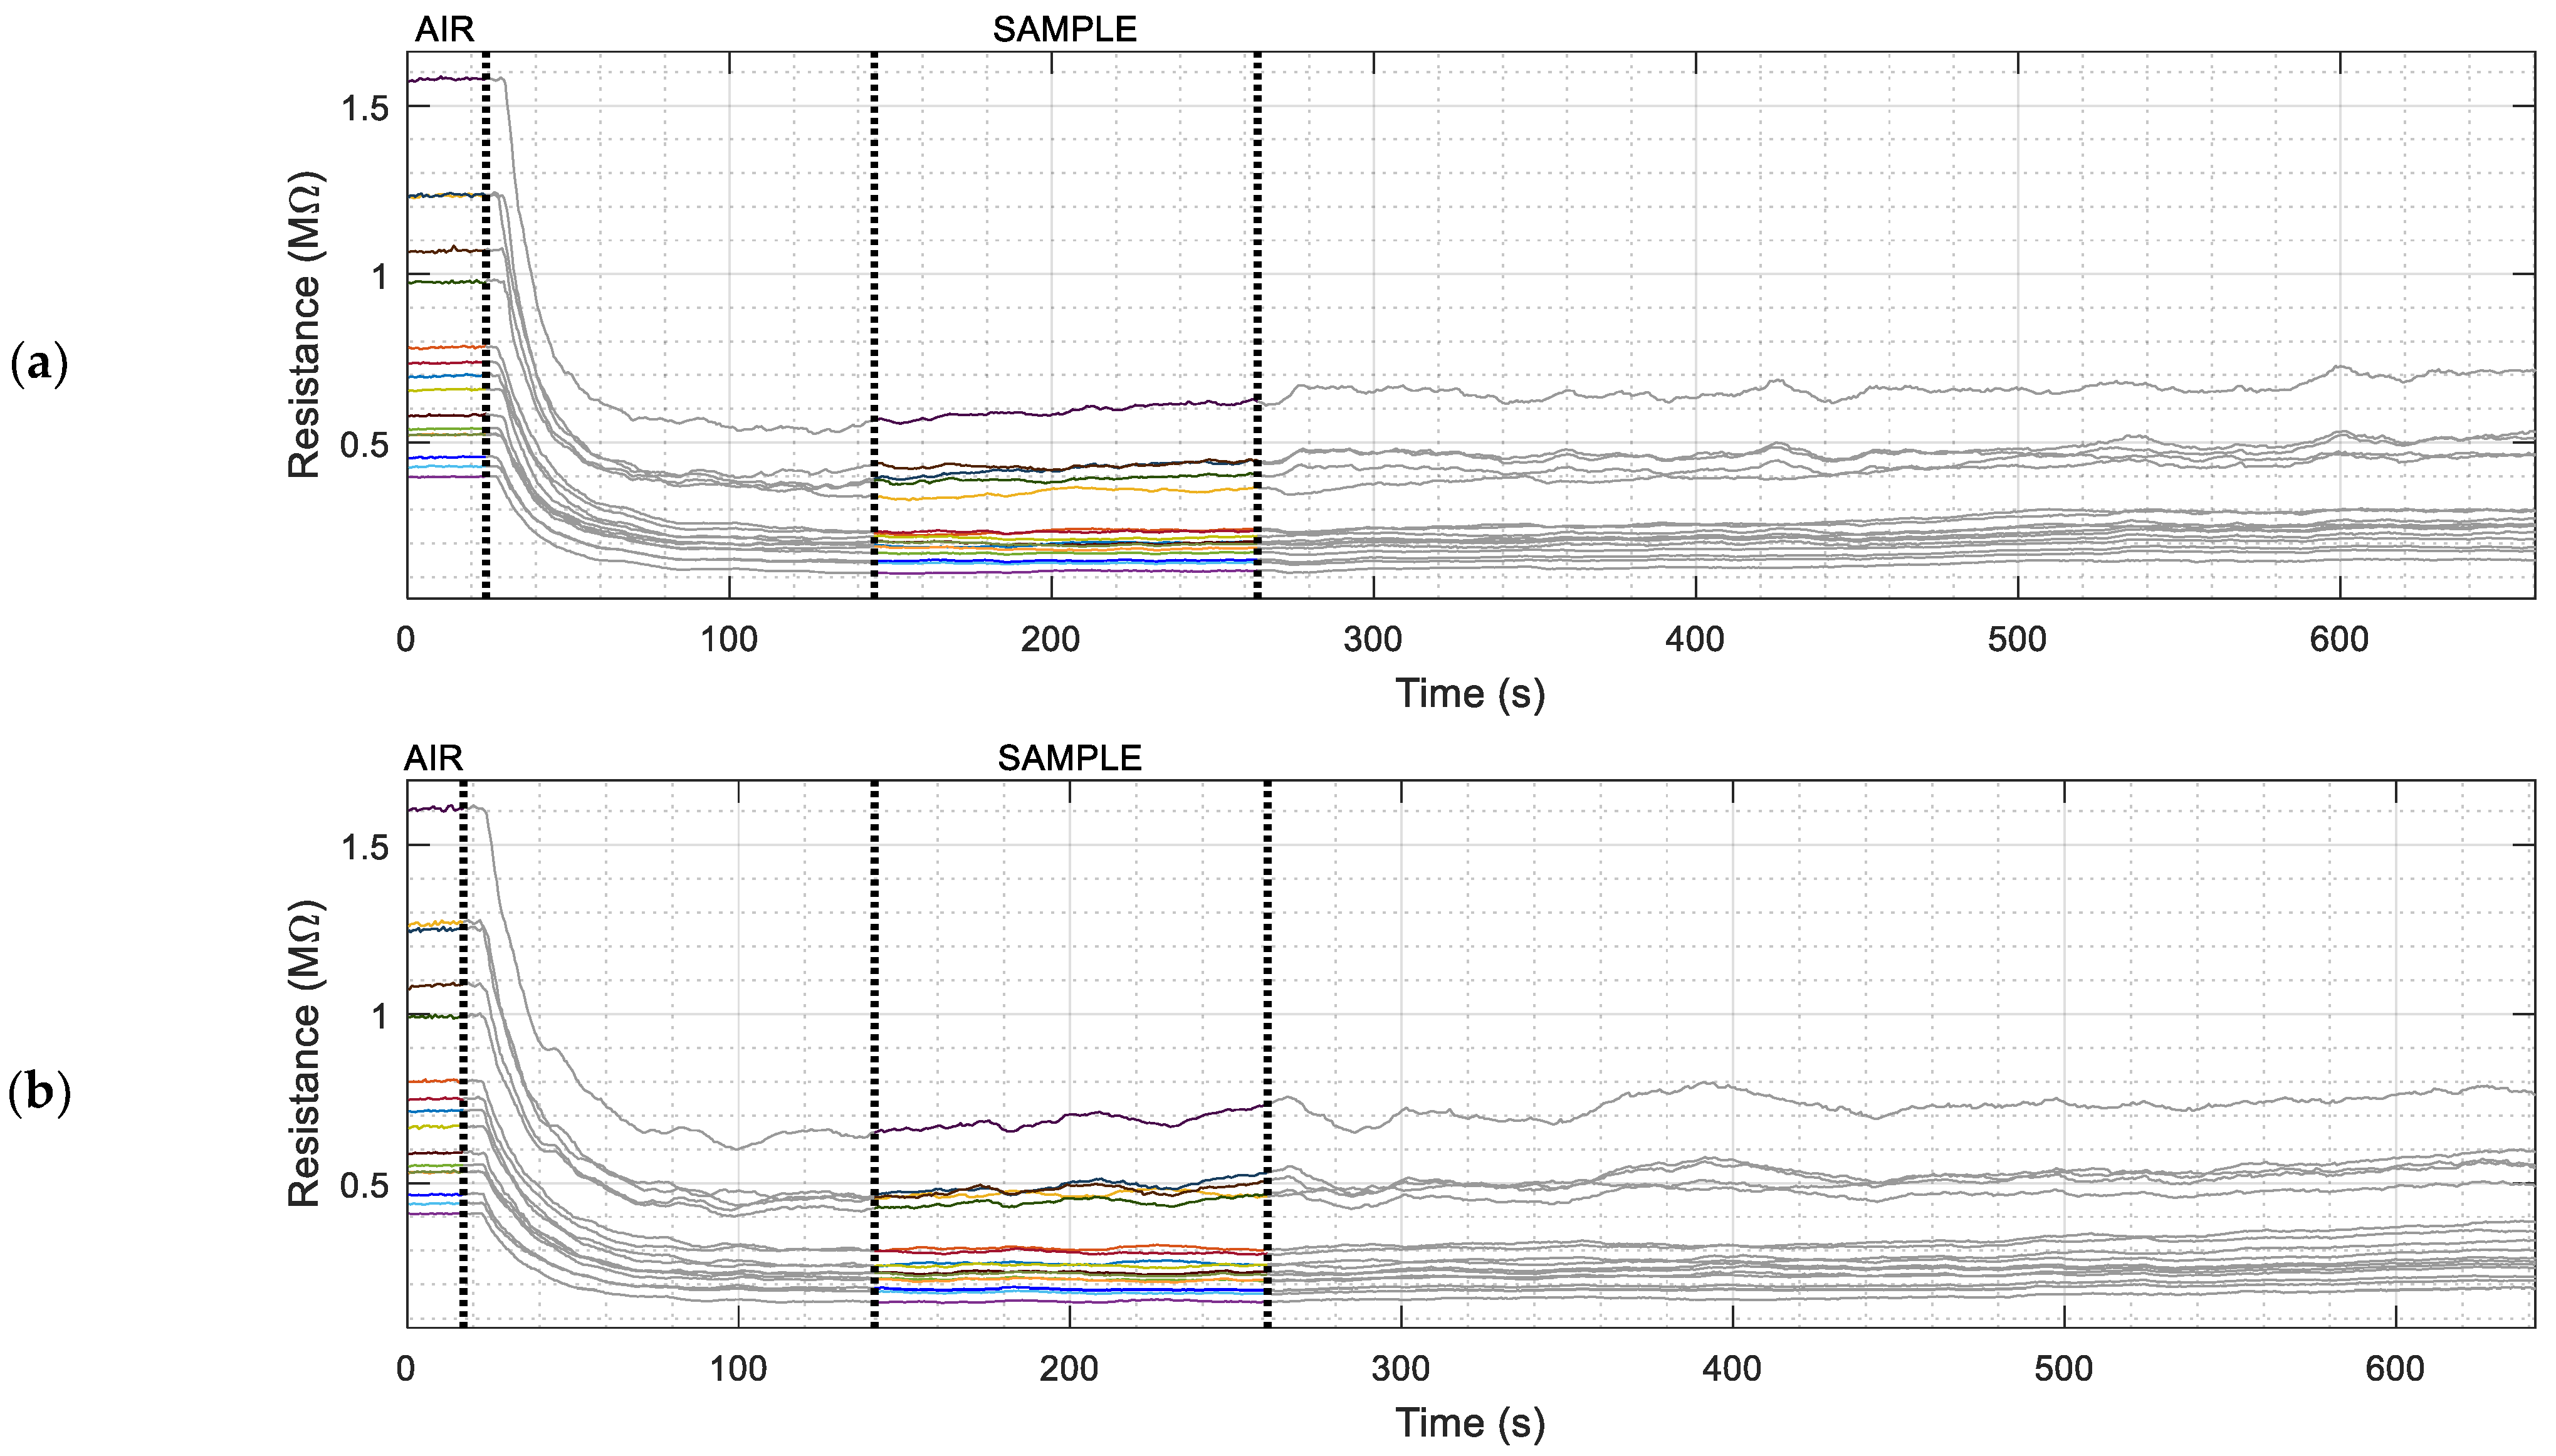
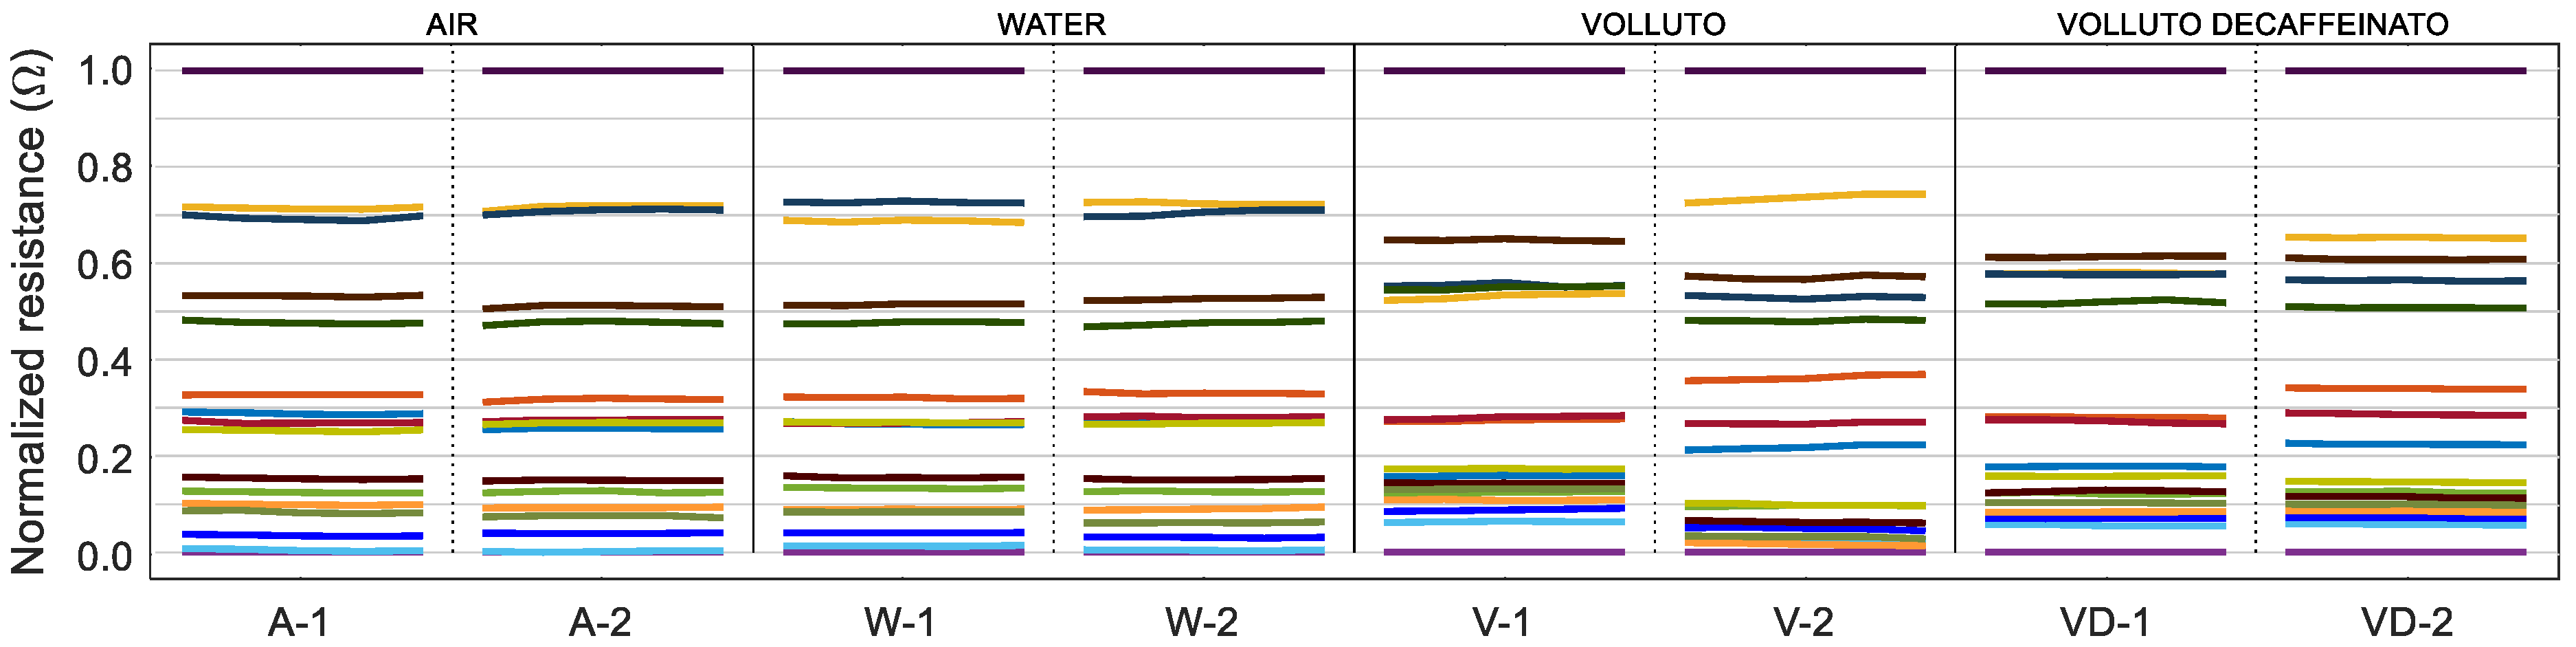
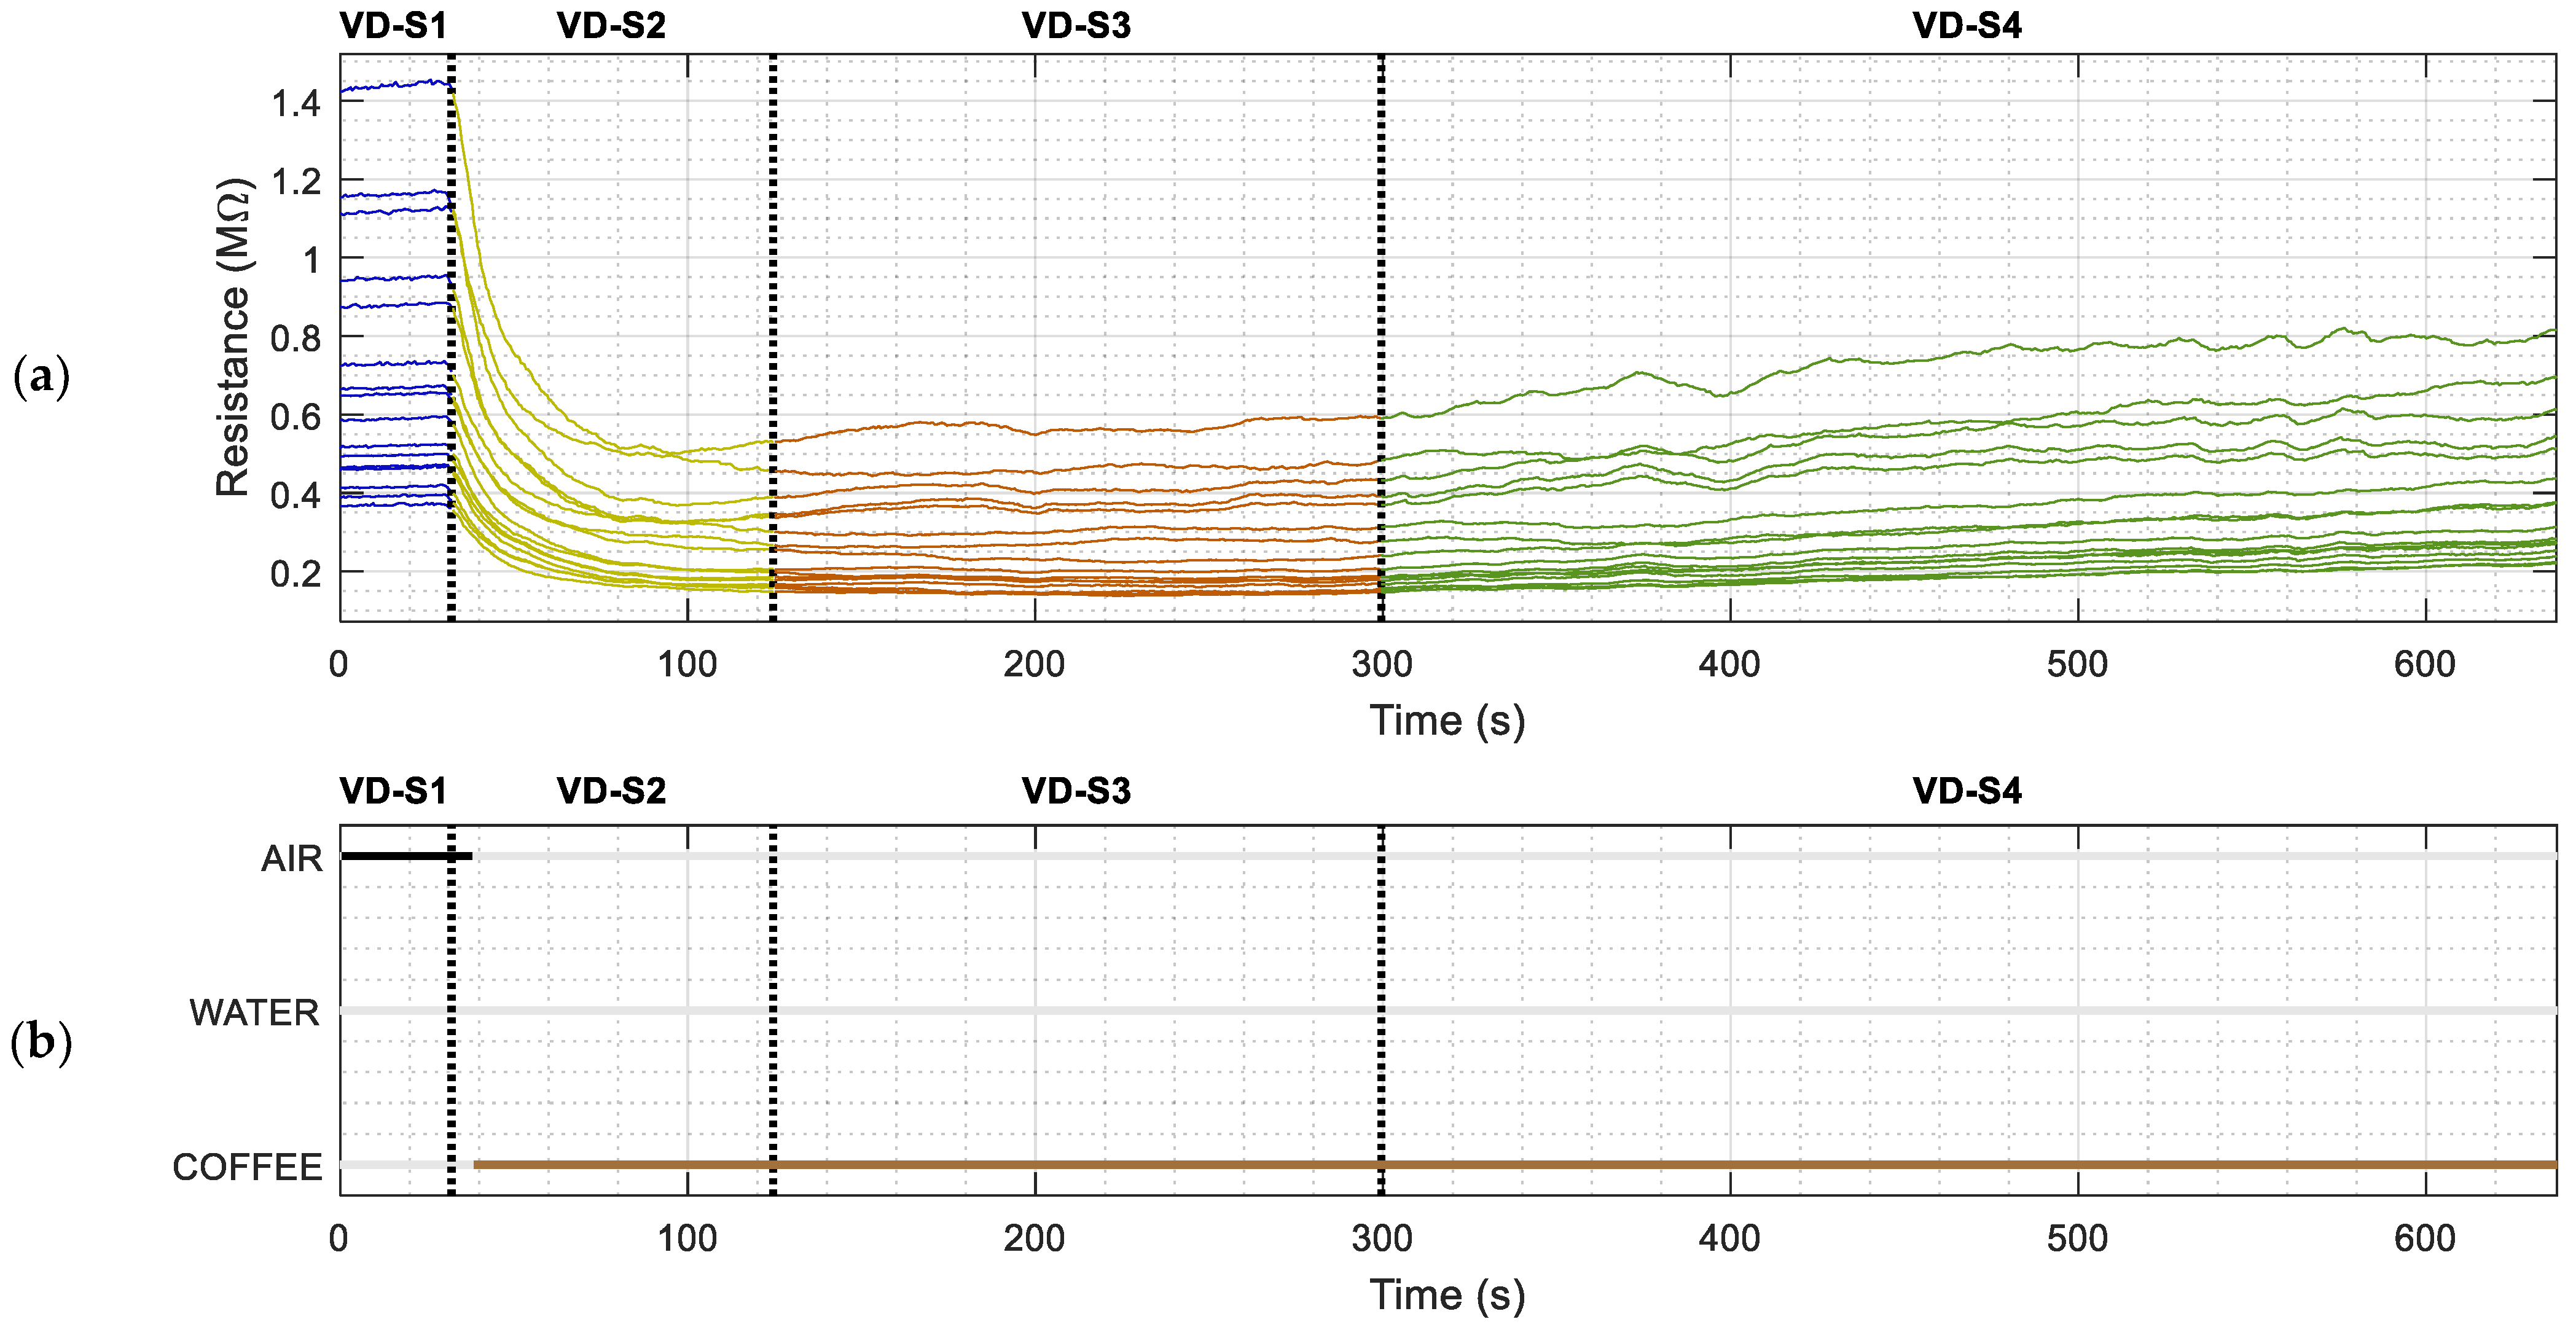
In this application with complex coffee aromas, the use of the raw resistance of the MOX gas sensors as a classification feature has provided better classification results than the use of the raw resistance normalized according to the resistance of reference air samples. This is probably because all the MOX gas sensors are of the same type, so the homogenization of their resistance has no effect on the classification. The evolution of the aroma profiles gathered during the brewed coffee experimentation has shown that exposing the eNose to the coffee aromas causes a significant drop in the MOX gas sensors, followed by a characteristic stable zone, which has been used to identify the aroma of each experiment.
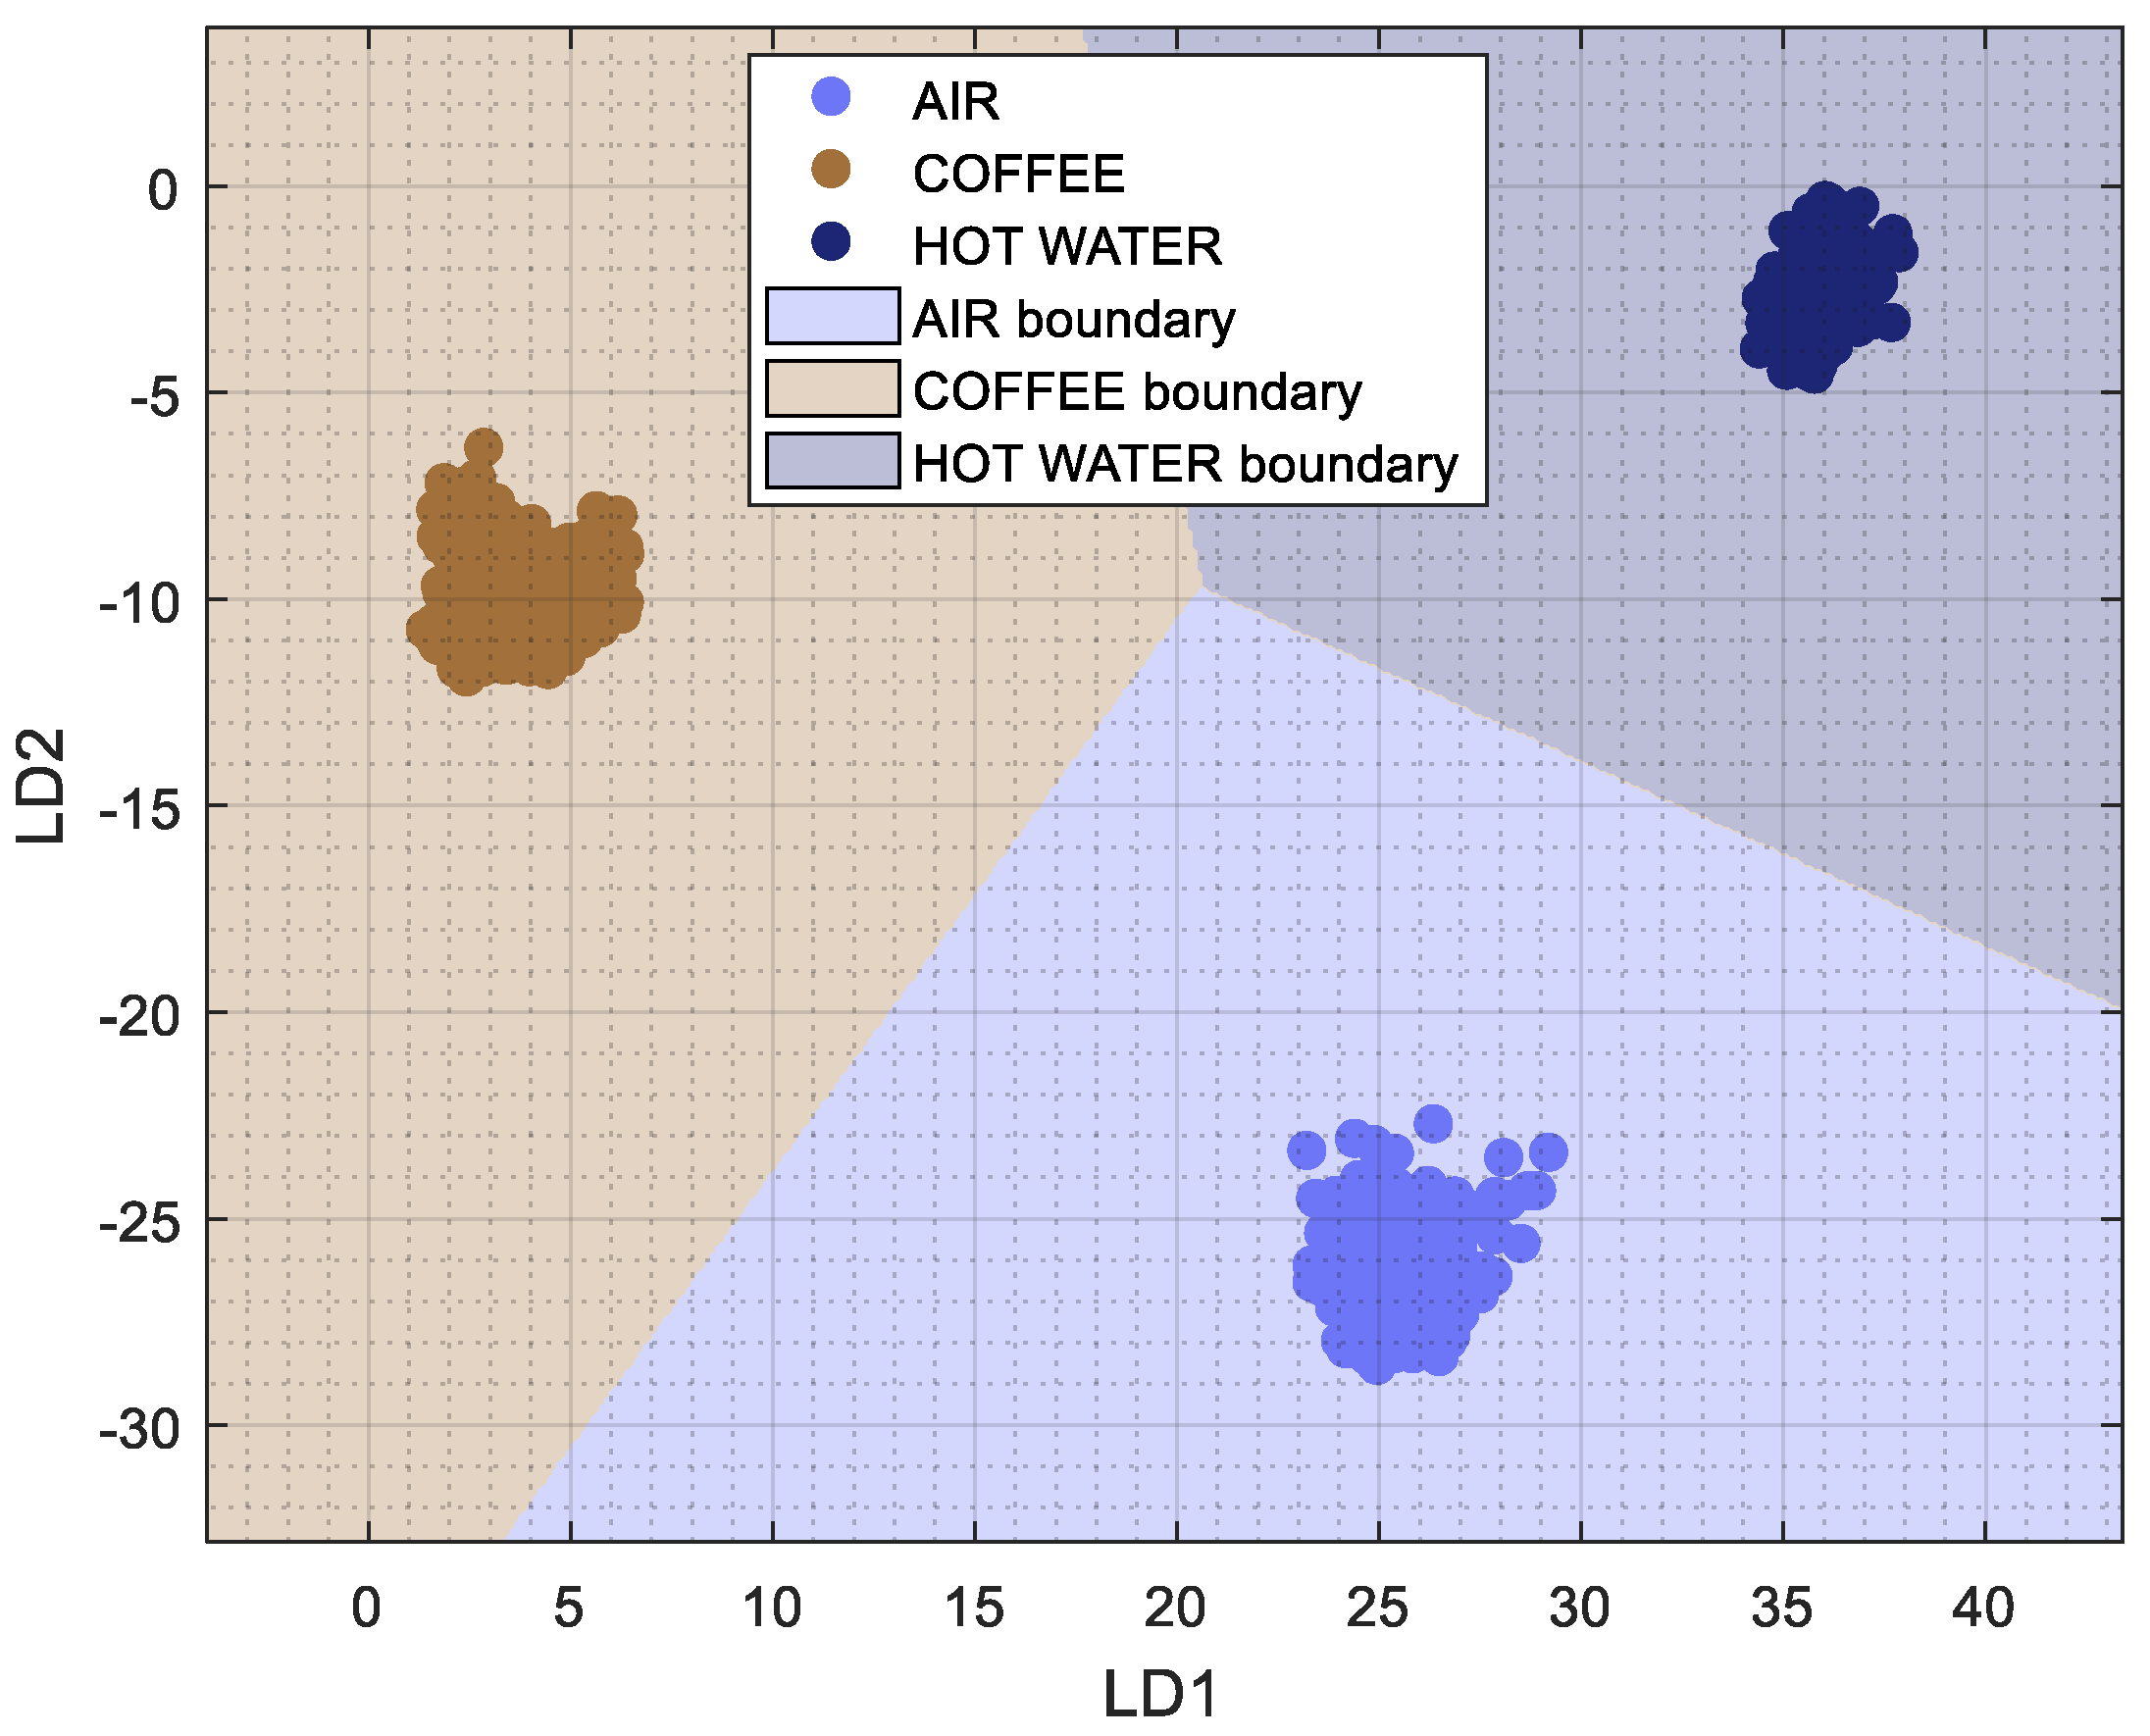
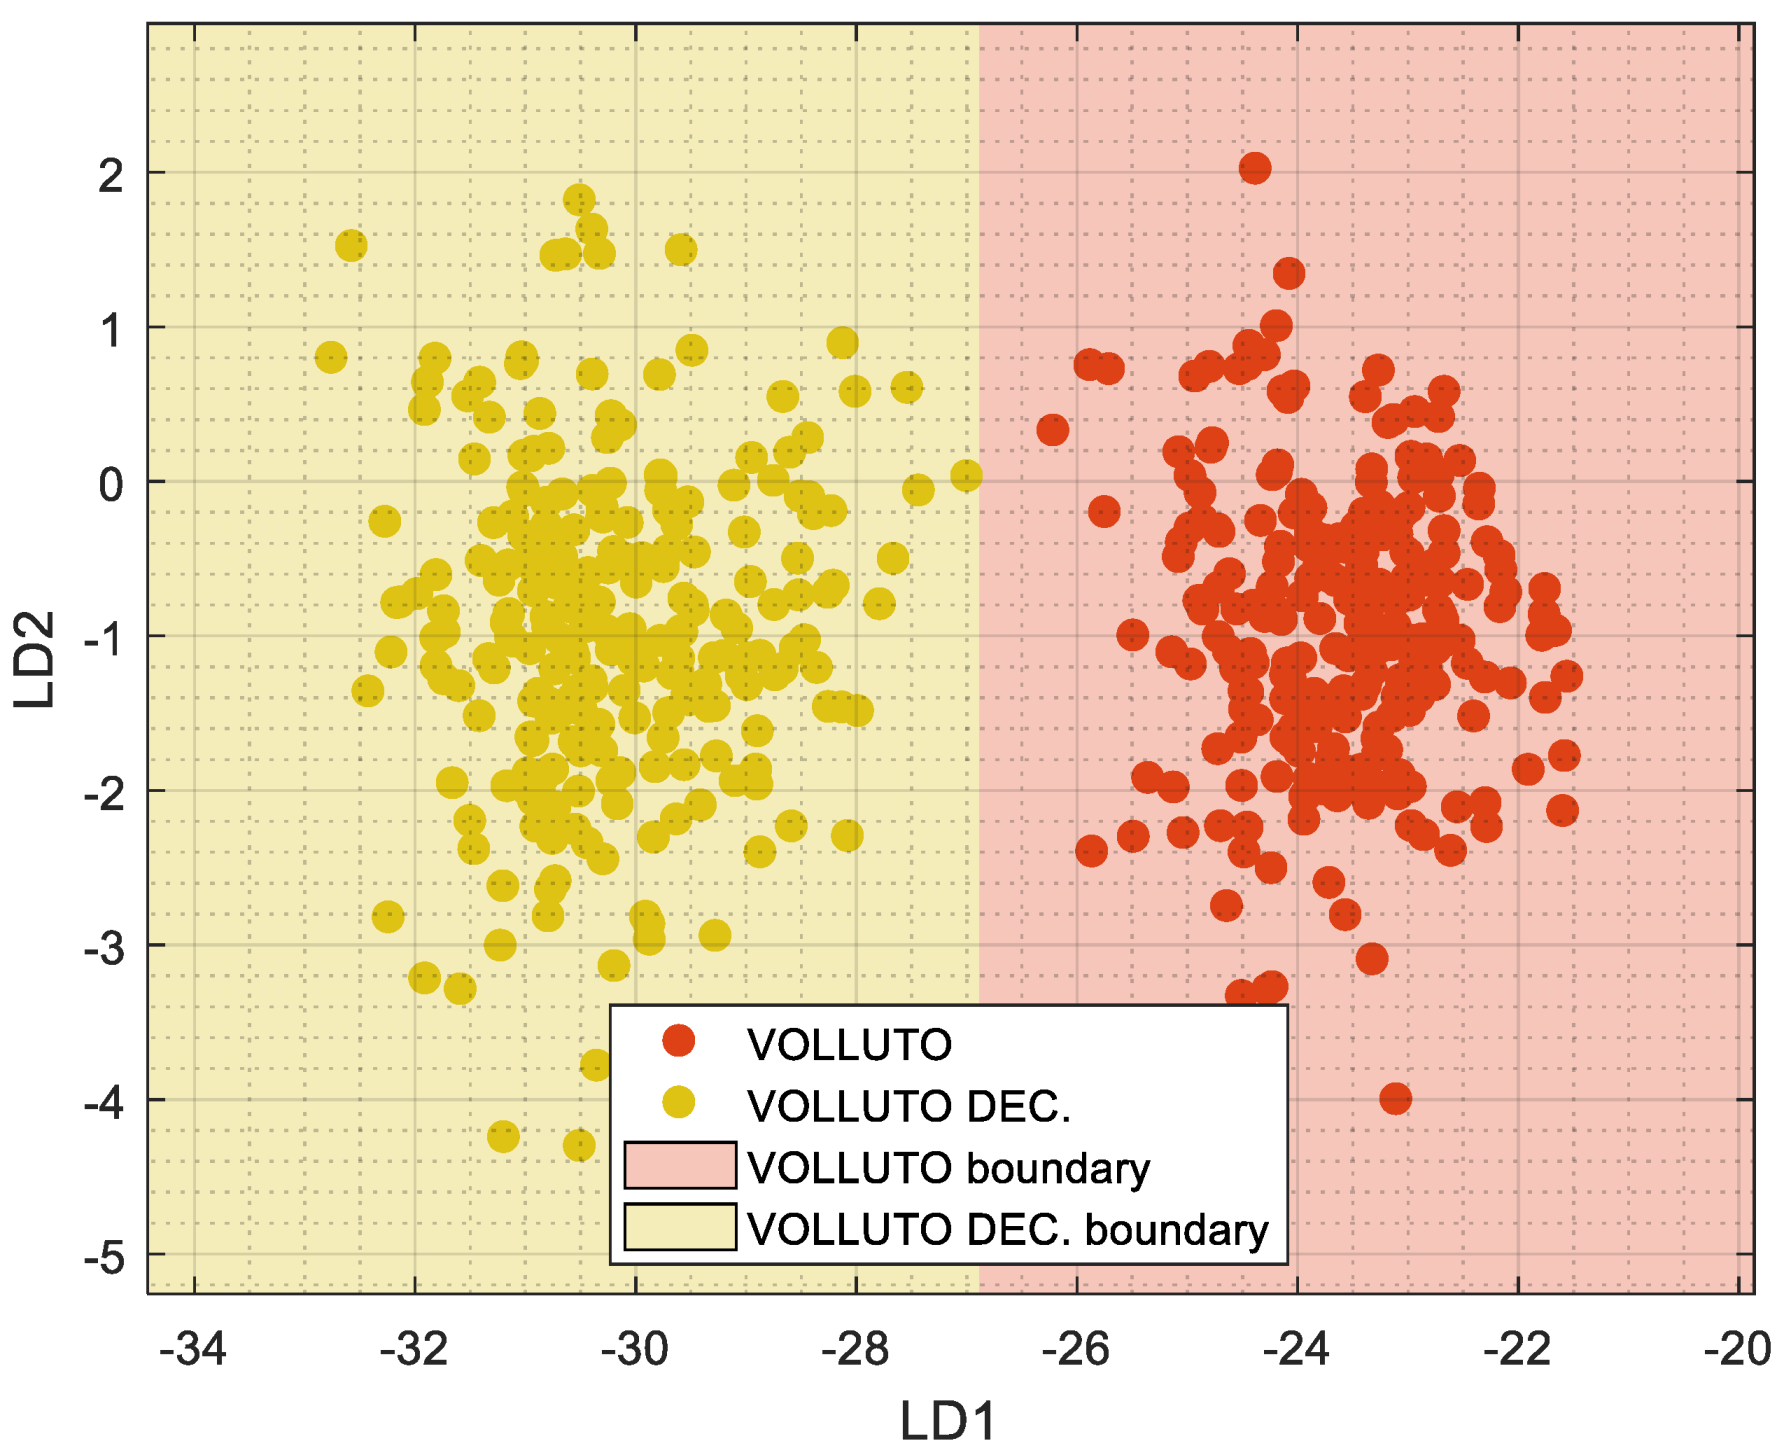
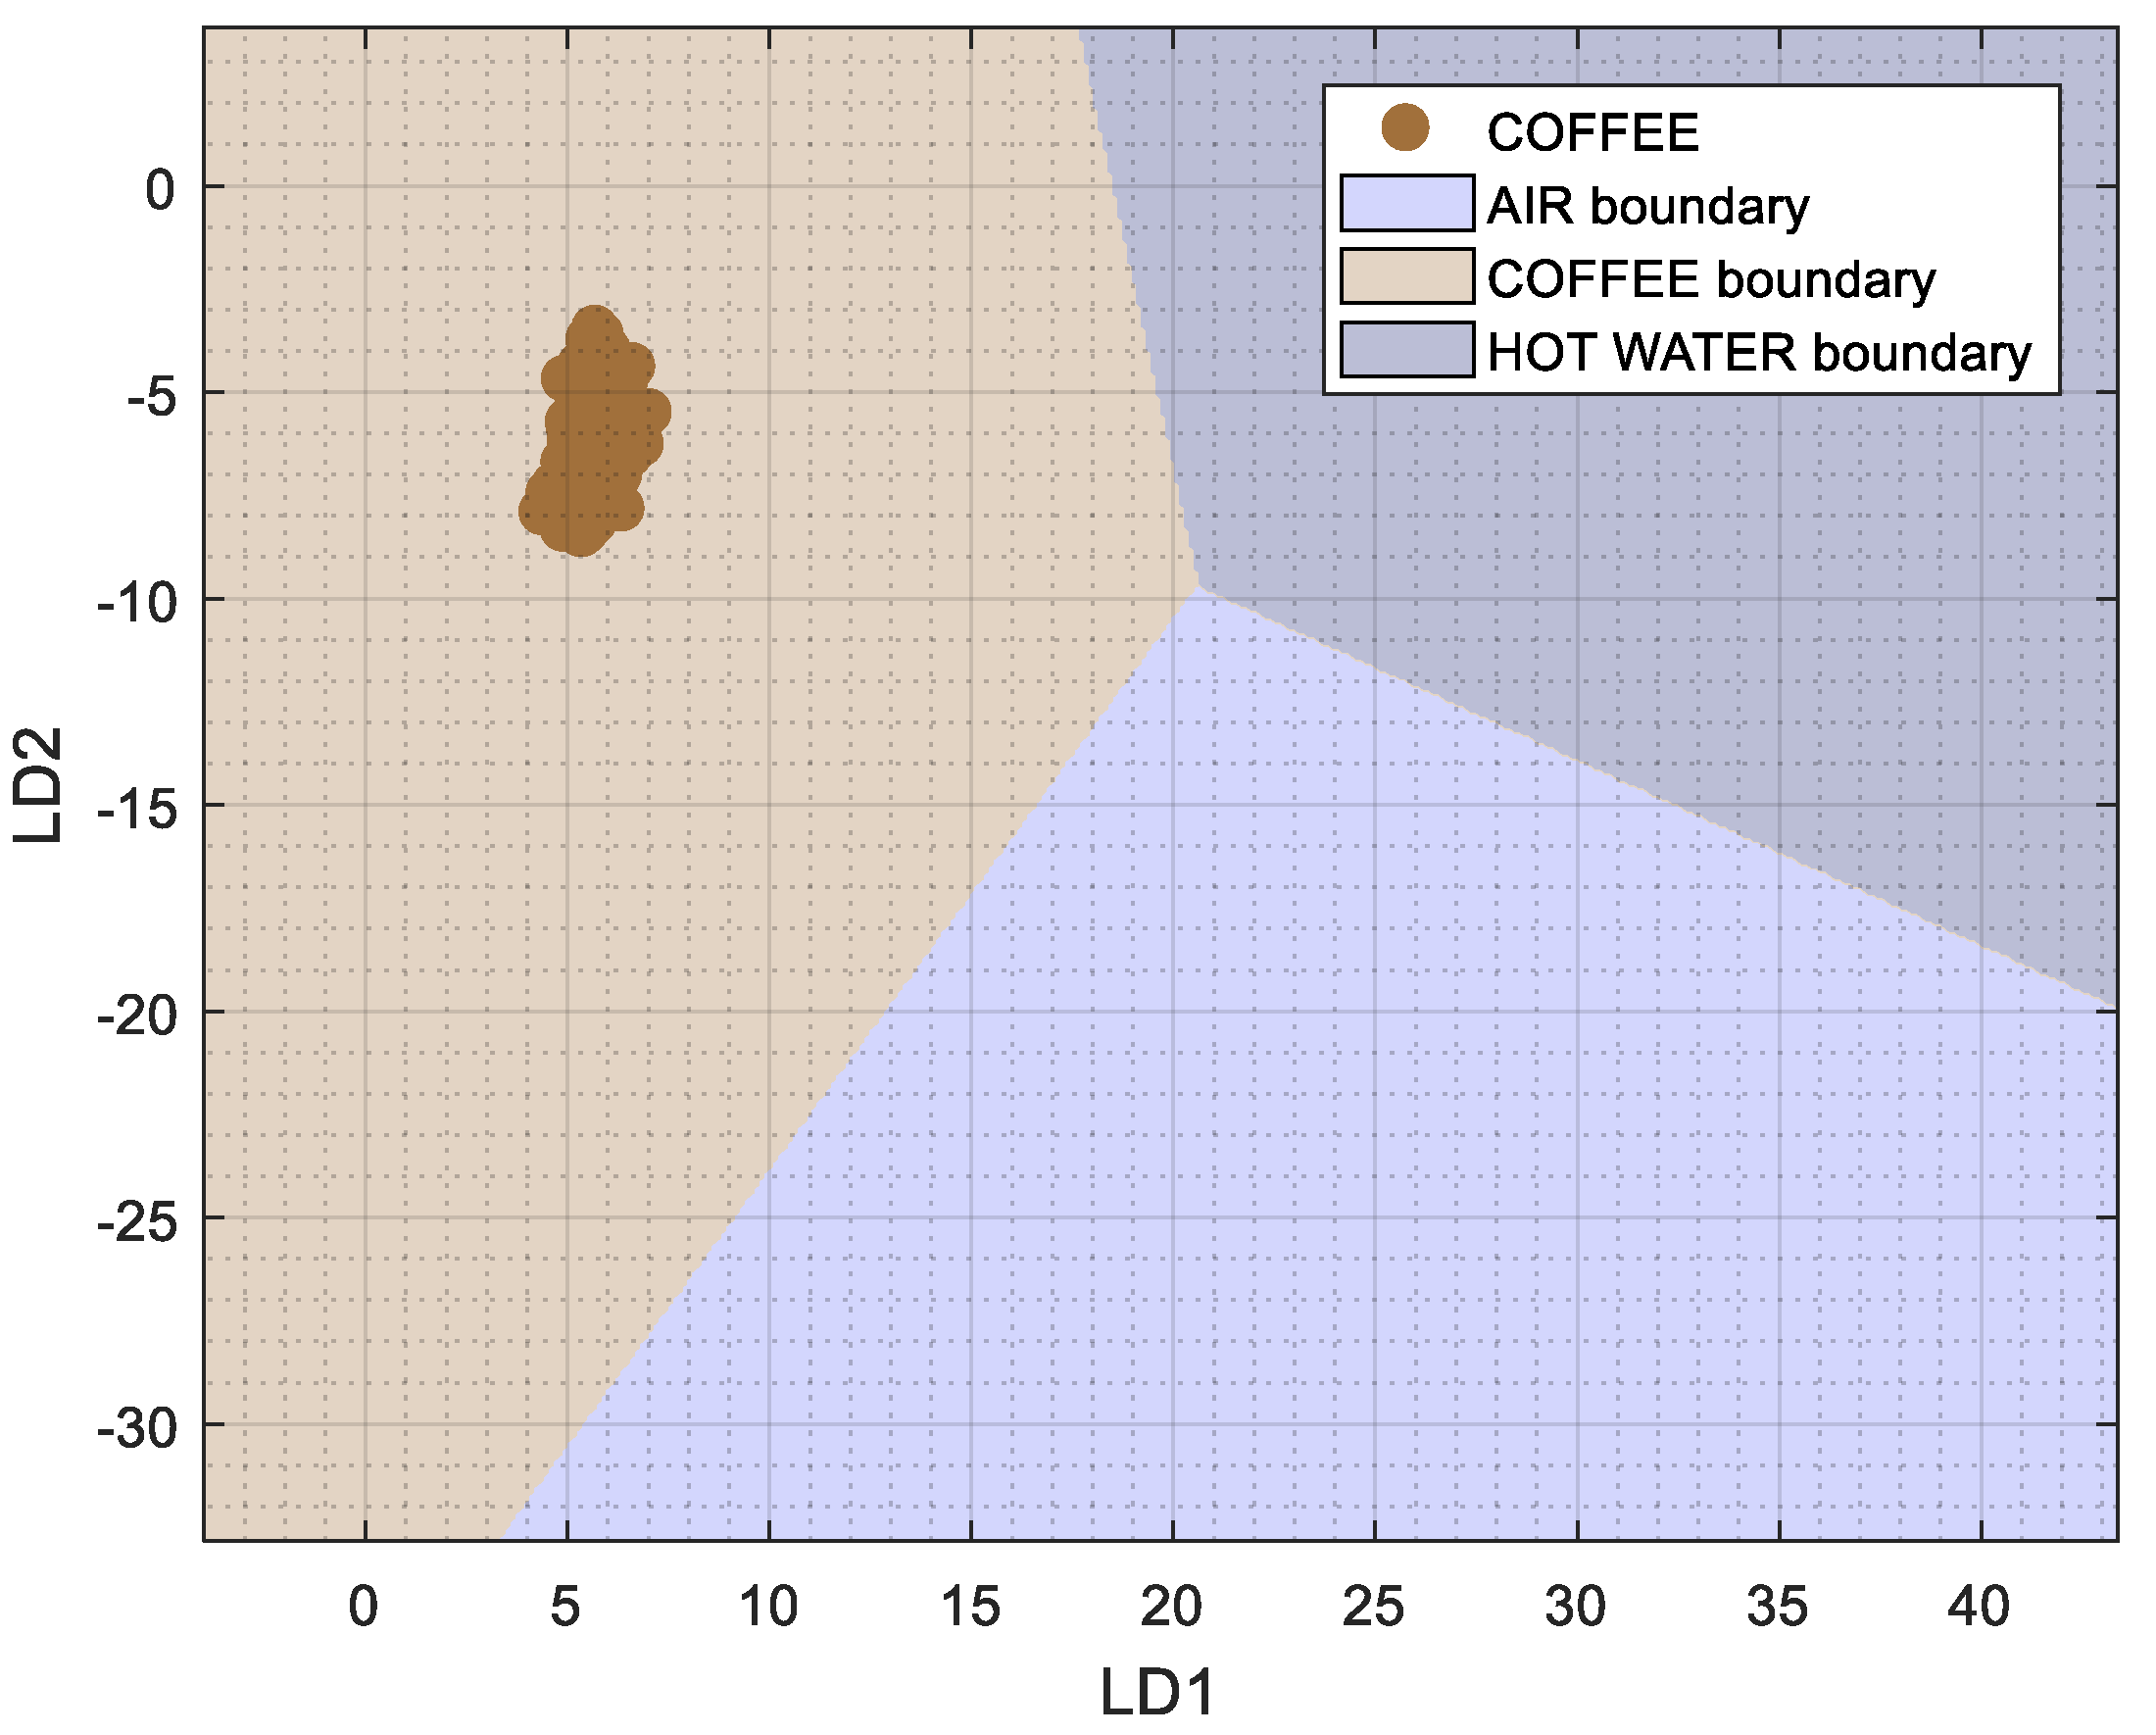
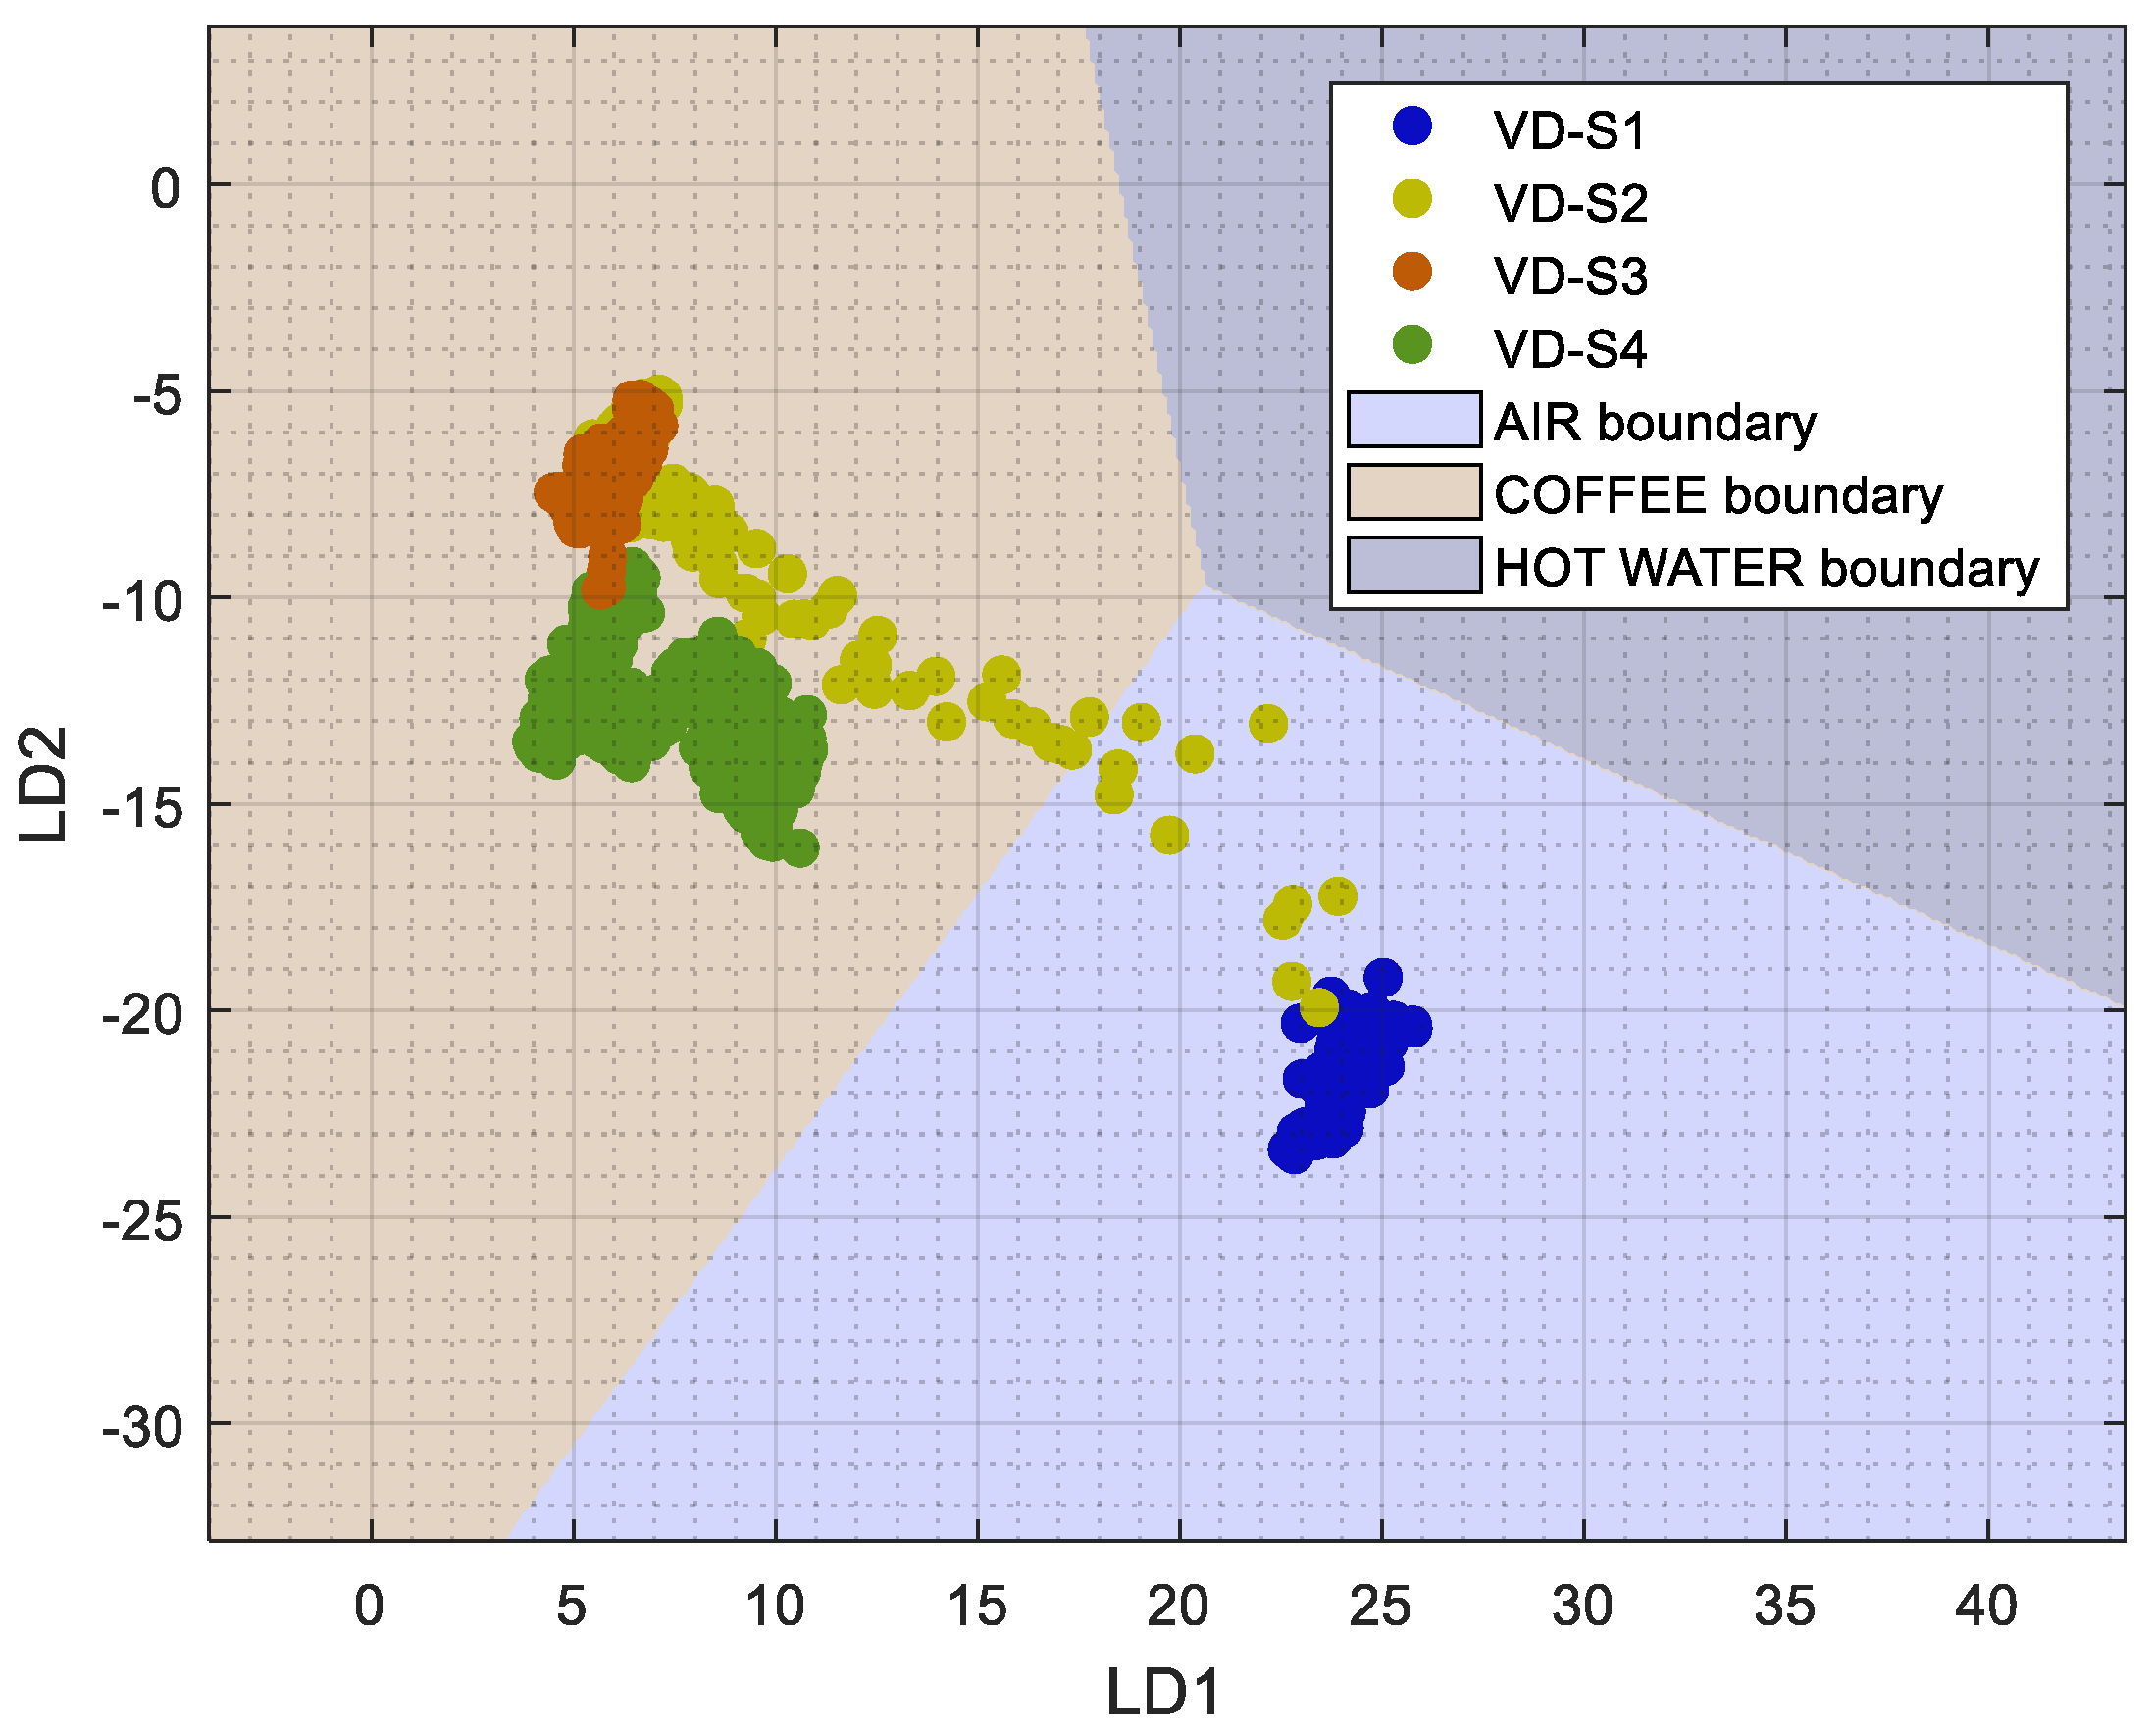
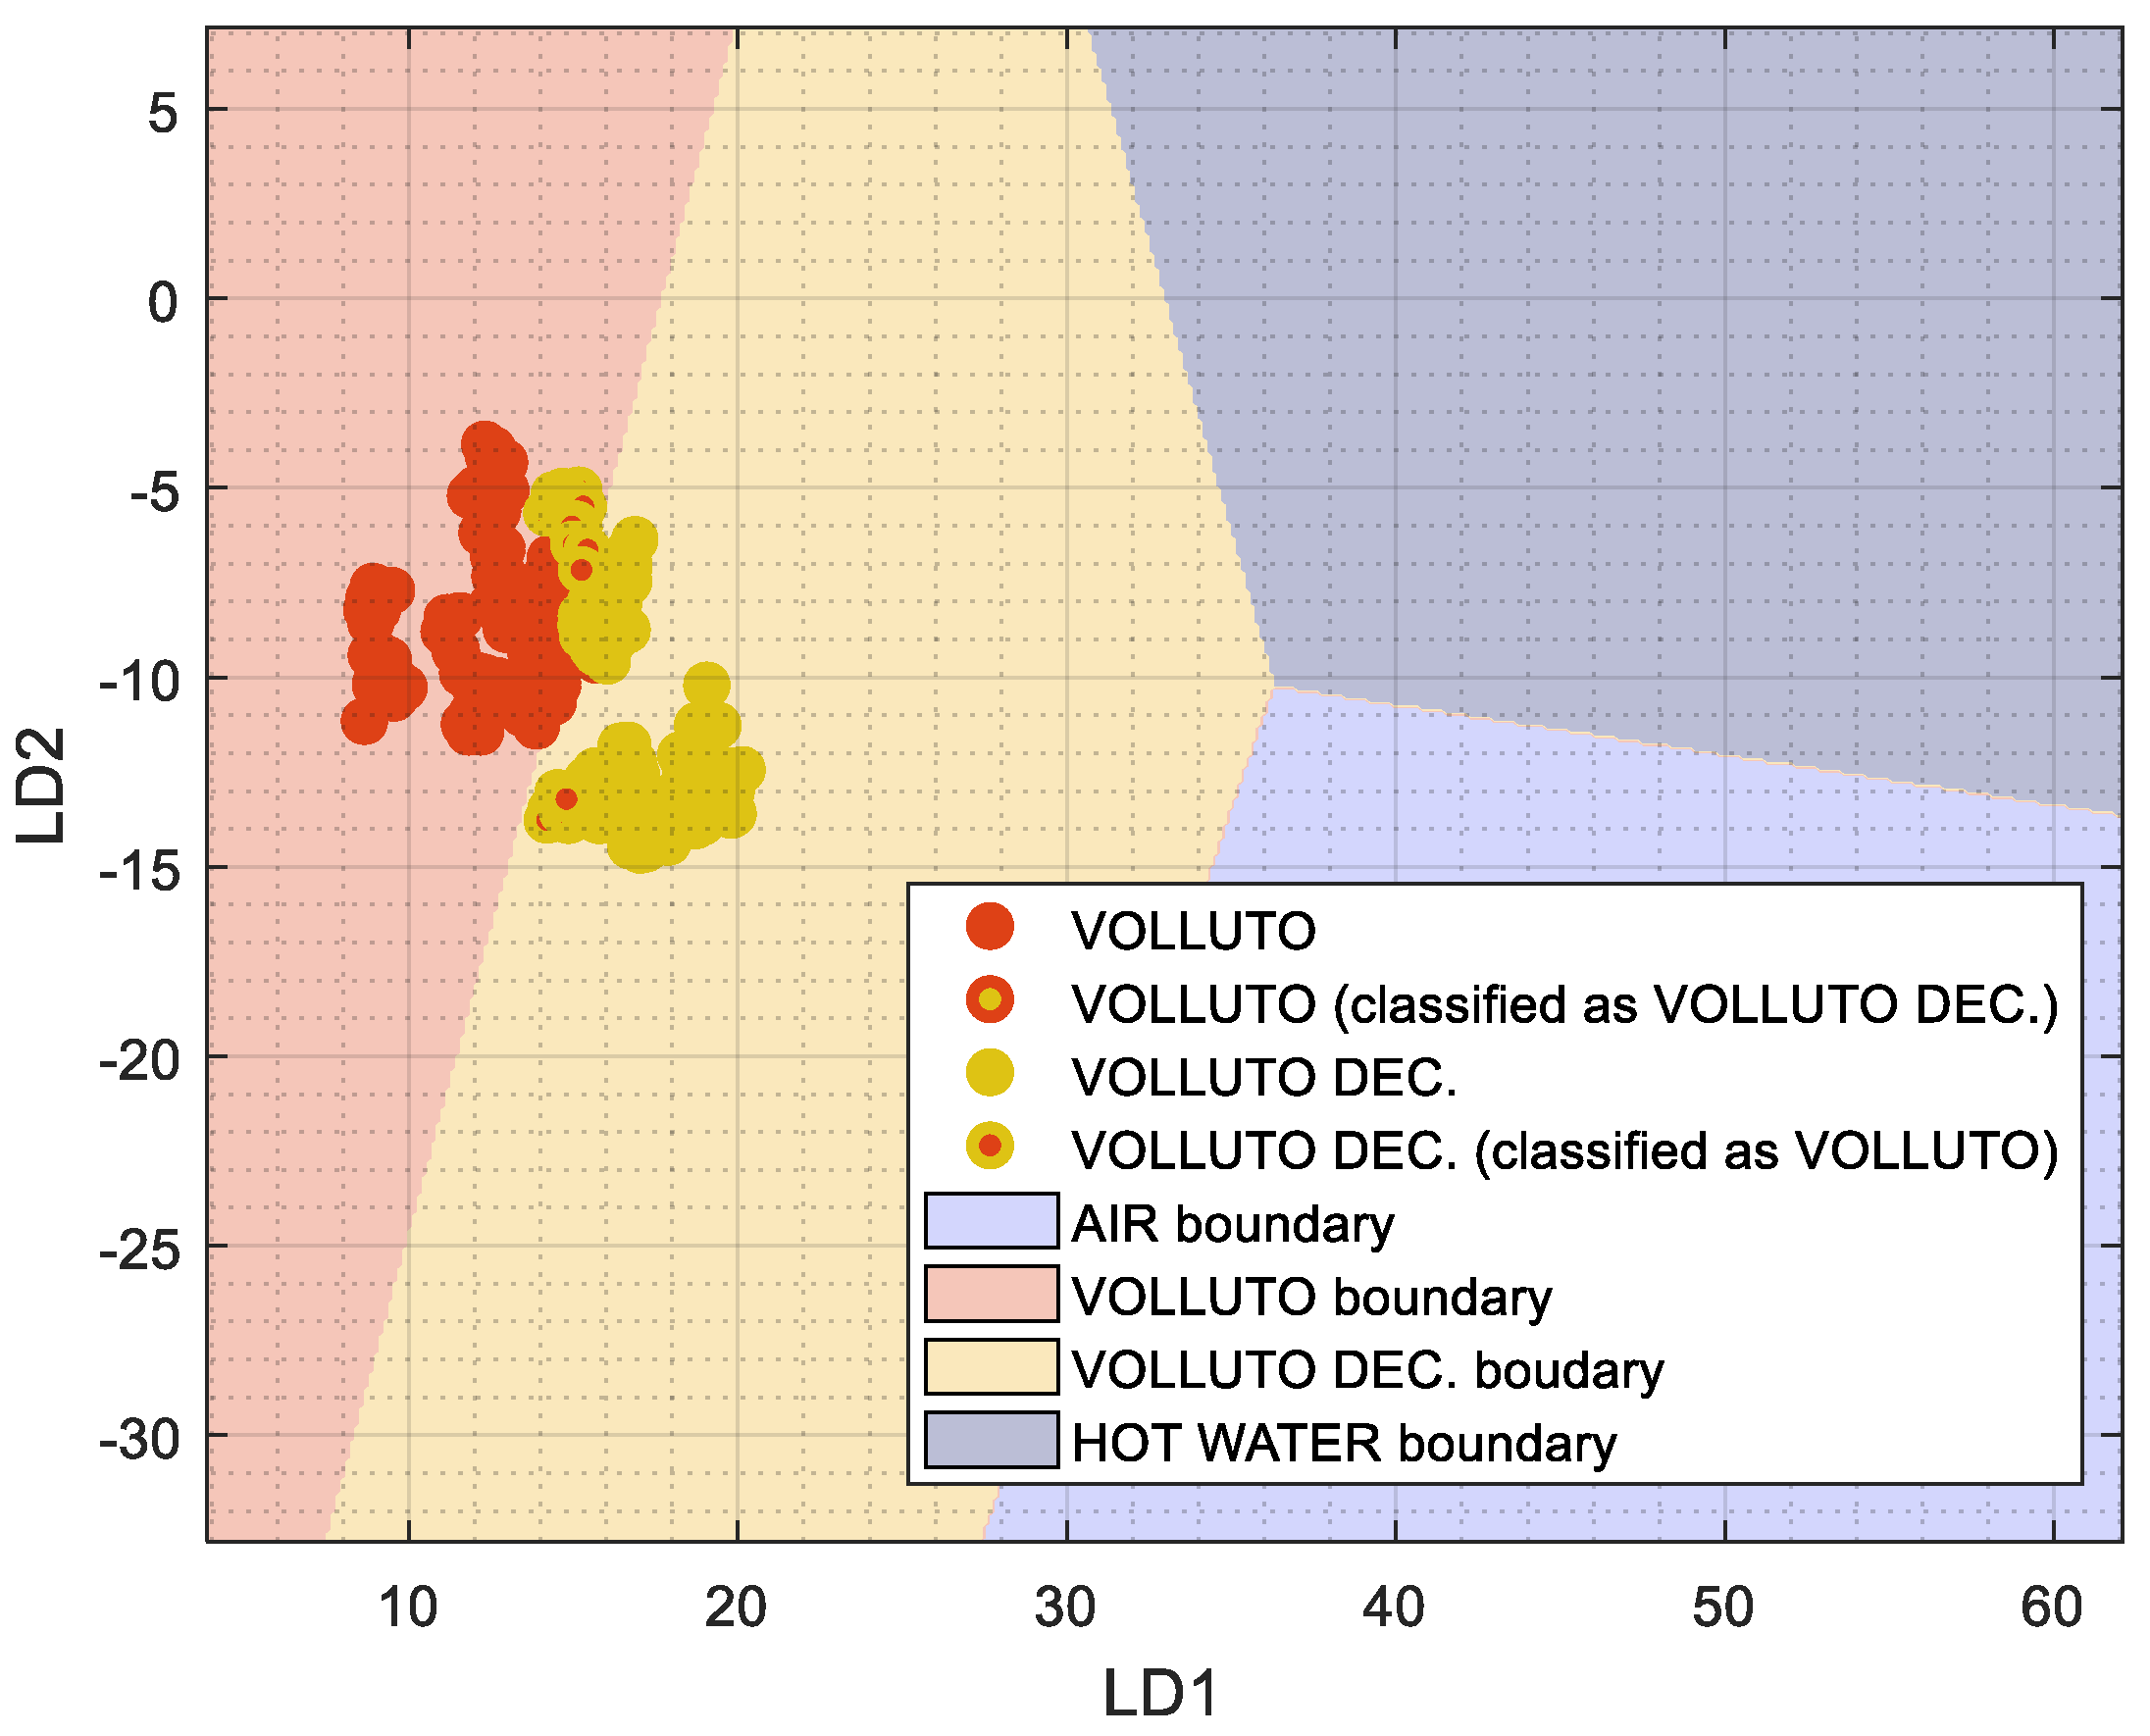
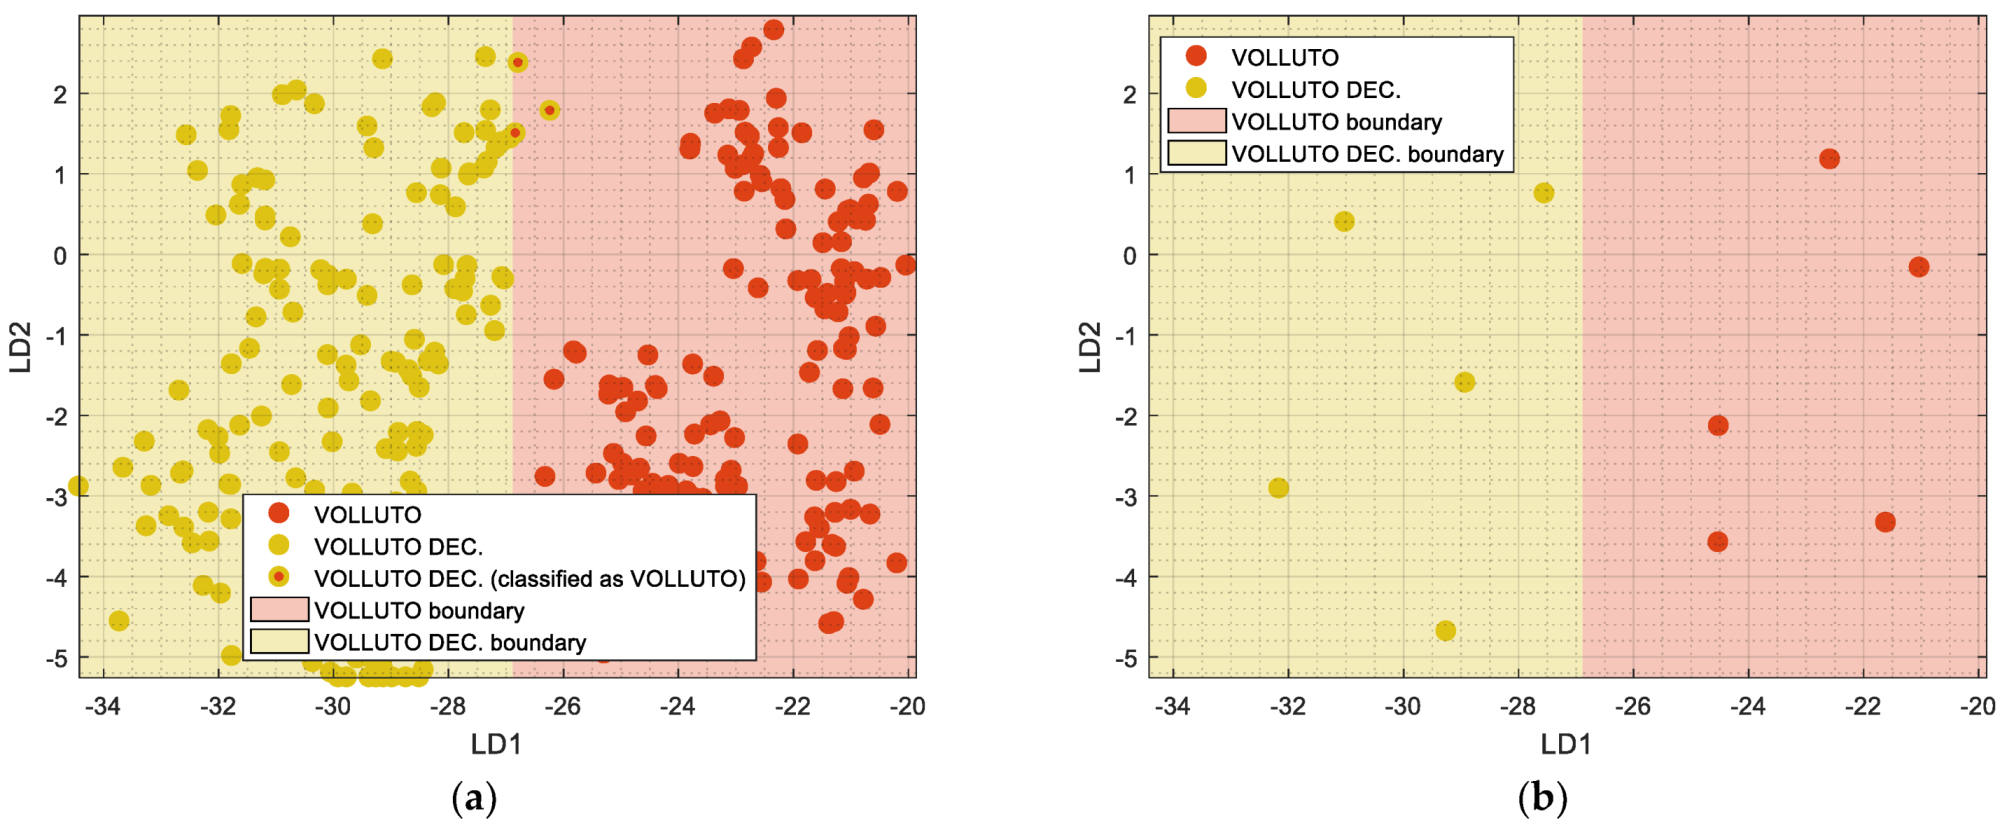
Different LDA projections have been computed using a training dataset and validated using an additional validation dataset. The LDA projection trained to discriminate between AIR, HOT WATER, and COFFEE has proven that the eNose is able to differentiate the humidity generated by hot water from the aroma of coffee samples. This LDA projection provides feasible and logical projection trajectories when analyzing its complete transitory evolution. The LDA projection trained to discriminate between AIR, HOT WATER, VOLLUTO, and VOLLUTO DECAFFEINATO has shown some difficulties in the discrimination of the caffeinated and decaffeinated aromas, probably because the effort required to model the air and hot water hides some differences between the caffeinated and decaffeinated aromas. Finally, the LDA projection computed to discriminate between VOLLUTO and VOLLUTO DECAFFEINATO has yielded a superior validation classification performance—100% for the caffeinated coffee data points and 98% for the decaffeinated coffee data points, although this classification rises to 100% when classifying the average value of one measurement instead of classifying sequentially all the points obtained during a measurement.
The conclusion of this paper is that an eNose composed of single-type MOX gas sensors is able to differentiate the aromas of caffeinated and decaffeinated encapsulated espresso coffee types. This conclusion agrees with Zou et al. [33], who also discriminated between caffeinated and decaffeinated coffee from the volatile point of view using gas chromatography techniques. According to the results obtained, a practical application of the Osmee One eNose in the detection of caffeinated and decaffeinated encapsulated espresso coffee types first applied an LDA dimensional reduction optimized to differentiate between coffee aroma, air, and hot water, and second, in case of detecting a coffee aroma, to discriminate between caffeinated and decaffeinated coffee varieties. The first LDA projection can have a direct application in detecting machine malfunctions in automatic brewing machines. The second LDA projection computes a dimensional reduction that is able to successfully discriminate caffeinated and decaffeinated coffee types, although the training data used to compute the dimensional reduction performed by the LDA need to be as representative as possible of the variability of the response of the eNose in different temperature and humidity conditions.
In future work, this low-cost eNose will be deployed either as a fixed net of multiple sensors or embedded in autonomous omnidirectional mobile robots in order to compare its dynamic and static gas and odor detection performances in a large building.

Author Contributions

Data curation, E.C.; formal analysis, E.C.; investigation, J.P., E.R. and E.C.; resources, J.P.; software, E.C.; writing—original draft, E.C.; writing—review and editing, J.P. and E.R. All authors have read and agreed to the published version of the manuscript.

Funding

This research received no external funding.

Informed Consent Statement

Not applicable.

Conflicts of Interest

The authors declare no conflict of interest.

Appendix A

This Appendix contains the projection matrix of the different LDA analyses computed in this paper. The LDA transformation applied to an individual data sample provided by the eNose, composed of the resistance of the thin layer of the 16 MOX gas sensors of the eNose (S1 … S16), is computed using:
P r o j e c t e d D a t a =   S 1 , , 16   x   ω
The LDA projection matrix, ω , computed in Section 5.1 to discriminate between AIR, HOT WATER, and COFFEE is:
ω = [ 0.0096 0.0845 0.0023 0.2148 0.1150 0.0861 0.0018 0.0304 0.0082 0.0116 0.0700 0.0207 0.1651 0.0319 0.0410 0.0210 0.1216 0.0242 0.0562 0.2325 0.0428 0.1278 0.0134 0.0117 0.0285 0.0288 0.0150 0.0133 0.0161 0.0797 0.1643 0.1755 0.0014 0.0345 0.1206 0.0321 0.0888 0.1143 0.0286 0.0965 0.0024 0.0650 0.0493 0.0110 0.0023 0.0696 0.0912 0.0096 0.2409 0.4329 0.3171 0.0377 0.2240 0.0960 0.0720 0.1293 0.0010 0.0501 0.0557 0.1102 0.3032 0.0424 0.0280 0.2036 0.0108 0.2421 0.0803 0.0418 0.1502 0.3436 0.1025 0.1547 0.0056 0.0483 0.0493 0.4306 0.0149 0.0379 0.2581 0.0229 0.1186 0.0289 0.2857 0.0498 0.0861 0.1939 0.0283 0.1163 0.0797 0.0063 0.0922 0.4608 0.0166 0.0577 0.1593 0.0273 0.1312 0.1032 0.0438 0.0226 0.0107 0.1998 0.1544 0.0765 0.0093 0.0478 0.0520 0.0179 0.0935 0.1451 0.0411 0.1023 0.0380 0.0096 0.2019 0.1000 0.2662 0.0870 0.1886 0.0347 0.0098 0.0082 0.0129 0.1899 0.2199 0.2052 0.0978 0.0587 0.0365 0.0826 0.2286 0.0519 0.0304 0.0456 0.0171 0.0833 0.0359 0.0289 0.0769 0.1496 0.0218 0.1089 0.0306 0.0560 0.1057 0.2679 0.2679 0.0393 0.0393 0.0395 0.0272 0.0828 0.0119 0.0669 0.0363 0.0414 0.0721 0.2859 0.2367 0.1121 0.0935 0.2307 0.2031 0.1661 0.1482 0.0508 0.1344 0.0207 0.0374 0.0183 0.0769 0.1217 0.0400 0.0901 0.1105 0.3471 0.0067 0.0627 0.1399 0.0005 0.2185 0.0096 0.0867 0.0280 0.0147 0.0004 0.0762 0.0517 0.0527 0.1935 0.0470 0.0262 0.0864 0.0278 0.0214 0.0124 0.0184 0.0239 0.0035 0.0086 0.0133 0.0058 0.0250 0.0558 0.1000 0.0982 0.0662 0.0856 0.0270 0.0211 0.0257 0.0015 0.0709 0.0079 0.0086 0.0512 0.0124 0.0340 0.0188 0.0263 0.0253 0.0161 0.0898 0.1502 0.0933 0.0212 0.1599 0.0896 0.1603 0.0724 0.0785 0.0293 0.0133 0.0095 0.0170 0.0675 0.0605 0.1181 0.0812 0.0968 0.0265 0.0096 0.1024 0.0885 0.0028 0.0537 0.0379 0.0568 0.0320 0.0424 0.0111 0.0774 0.0637 0.0184 0.0449 0.0878 ] × 10 3
Complementarily, Table A1 provides the centroids computed by the LDA procedure to discriminate the classes AIR, HOT WATER, and COFFEE.
Table A1. Centroids for the discrimination of the classes AIR, HOT WATER, and COFFEE.
ClassLD1LD2
AIR25.450−26.118
HOT WATER36.072−2.437
COFFEE3.452−9.672
The LDA projection matrix, ω , computed in Section 5.2 to discriminate between VOLLUTO and VOLLUTO DECAF is:
ω = [ 0.2795 0.0558 0.3370 0.1614 0.1059 0.0702 0.0417 0.0207 0.0311 0.0244 0.1761 0.0922 0.1050 0.1594 0.0781 0.0495 0.3419 0.1215 0.1472 0.1784 0.1954 0.0284 0.2194 0.0077 0.0566 0.0800 0.0742 0.0881 0.1667 0.3686 0.1334 0.0726 0.0232 0.0994 0.3247 0.1320 0.1878 0.0597 0.1064 0.0093 0.0046 0.0224 0.1632 0.0091 0.0103 0.2283 0.1263 0.0944 0.2700 0.1534 0.6831 0.2213 0.9907 0.1557 0.1489 0.2050 0.0253 0.0620 0.1220 0.1615 0.1031 0.4776 0.3019 0.3572 0.2012 0.0684 0.4793 0.3784 0.0786 0.3271 0.1463 0.0218 0.0611 0.0740 0.0296 0.1082 0.4908 0.5345 0.5780 0.0450 0.4031 0.4528 0.6795 0.1892 0.0984 0.0210 0.2118 0.0548 0.0849 0.0141 0.0768 0.1405 0.0074 0.1512 1.0733 0.4009 0.1469 0.3253 0.2121 0.1110 0.2236 0.1026 0.0883 0.0561 0.0562 0.0085 0.0615 0.0967 0.5965 0.3673 0.5024 0.3808 0.0392 0.2692 0.4470 0.2575 0.1789 0.4565 0.1715 0.1125 0.1259 0.0879 0.1169 0.3635 0.3549 0.4123 0.3139 0.0972 0.1728 0.4556 0.1133 0.3723 0.2469 0.2890 0.0918 0.0124 0.0017 0.0138 0.1789 0.0465 0.3953 0.0319 0.0357 0.0239 0.2016 0.6073 0.1891 0.6683 0.0916 0.2335 0.0863 0.0133 0.0090 0.0670 0.0953 0.0408 0.0698 0.1070 0.4176 0.0448 0.4362 0.3955 0.2153 0.0164 0.0661 0.0258 0.1548 0.0173 0.0938 0.0397 0.0369 0.3075 0.1869 0.4217 0.1889 0.5365 0.1889 0.3674 0.1949 0.3407 0.1863 0.0743 0.0619 0.0354 0.0132 0.0296 0.0012 0.1126 0.1949 0.0426 0.1517 0.6513 0.0987 0.2581 0.0095 0.1650 0.0205 0.0638 0.0236 0.0231 0.0114 0.0193 0.0228 0.1707 0.0158 0.0278 0.0738 0.0716 0.1200 0.2725 0.0998 0.1597 0.1020 0.0589 0.0466 0.0083 0.0099 0.0171 0.0573 0.0772 0.0132 0.0671 0.0991 0.0690 0.0504 0.1065 0.1582 0.0168 0.1413 0.0187 0.0588 0.0066 0.0194 0.0184 0.0677 0.0063 0.0013 0.0878 0.1390 0.4010 0.0509 0.2389 0.0176 0.0734 0.0731 0.0228 0.0447 0.0094 0.0121 0.0024 0.0356 0.0228 0.0221 0.0873 0.0852 0.1676 ] × 10 3  
Complementarily, Table A2 provides the centroids computed by the LDA procedure to discriminate the classes VOLLUTO and VOLLUTO DECAF. Finally, Table A3 and Table A4 provide the average sensor values displayed in Figure 11b computed from the validation dataset obtained when the eNose was exposed to five cups of Volluto coffee (Table A3) and five cups of Volluto Decaffeinato coffee (Table A4).
Table A2. Centroids for the discrimination of the classes VOLLUTO and VOLLUTO DECAF.
ClassLD1LD2
VOLLUTO−23.583−0.956
VOLLUTO DECAF−30.189−0.956
Table A3. Average sensor values (raw resistance) computed in the five Volluto coffee experiments used in the validation dataset (all sensor values in kΩ).
S1S2S3S4S5S6S7S8S9S10S11S12S13S14S15S16
V1233.6197272.9935417.5866134.1410177.2392143.5308234.0895150.4707186.6248169.7982152.8316163.2184365.9558505.9365324.2241340.1474
V2222.1514255.2601385.6286123.2908151.4932121.6720195.8795125.0791144.7964131.4272119.3213126.1655266.5443369.5040242.8072252.0324
V3209.6339259.4666398.0393131.5514175.1309142.3251232.4512153.7200188.3102174.5404155.8522167.1309329.6669465.0260302.3931309.5499
V4162.3197200.1100310.7178105.7822154.4905126.0300206.3464137.3099183.8869169.4927152.2238164.8267327.4478457.4220300.7659313.5123
V5220.0600266.8982401.2258132.7363182.2781148.3930242.3956155.3336203.8987185.7505168.1786177.2128385.9134524.2297338.5421347.6896
Table A4. Average sensor values (raw resistance) computed in the five Volluto Decaffeinato coffee experiments used in the validation dataset (all sensor values in kΩ).
S1S2S3S4S5S6S7S8S9S10S11S12S13S14S15S16
VD1270.0999301.4718457.1092146.8990182.4756145.8404236.3724150.4246203.8154185.0321166.0505178.1799407.8162559.7236355.0178369.0275
VD2239.2935271.7979406.5265129.4665170.4763137.5019224.4115143.9452201.3473184.1641166.0086177.6931407.6212560.1162354.3992371.1771
VD3295.5279352.6312541.8739178.1242245.1693197.6698331.1741206.8063262.1753237.0994215.6835227.8538464.7114629.1617412.2043421.8158
VD4233.9675282.9196436.0366143.8689200.7087167.3685279.8349178.8581242.2865223.8612203.1181214.9443454.1638623.7118406.6007429.5396
VD5246.8511298.0711471.0274154.5690202.8527165.9621275.8510176.1835230.2137211.8414188.1960194.4607448.3422606.2981382.4480407.6461

References

  1. Piotr Konieczka, P.; Aliaño-González, M.J.; Ferreiro-González, M.; Barbero, G.F.; Palma, M. Characterization of Arabica and Robusta Coffees by Ion Mobility Sum Spectrum. Sensors 2020, 20, 3123. [Google Scholar] [CrossRef]
  2. Herron, R.; Lipphardt, A.; Euler, L.; Nolvachai, Y.; Marriott, P.J. Person-portable gas chromatography-toroidal ion trap mass spectrometry analysis of coffee bean volatile organic compounds. Int. J. Mass Spectrom. 2022, 473, 116797. [Google Scholar] [CrossRef]
  3. Kaushal, S.; Nayi, P.; Rahadian, D.; Chen, H.-H. Applications of Electronic Nose Coupled with Statistical and Intelligent Pattern Recognition Techniques for Monitoring Tea Quality: A Review. Agriculture 2022, 12, 1359. [Google Scholar] [CrossRef]
  4. Sliwinska, M.; Wisniewska, P.; Dymerski, T.; Namiesnik, J.; Wardencki, W. Food analysis using artificial senses. J. Agric. Food Chem. 2014, 62, 1423–1448. [Google Scholar] [CrossRef]
  5. Liu, H.; Zhang, L.; Li, K.H.H.; Tan, O.K. Microhotplates for Metal Oxide Semiconductor Gas Sensor Applications—Towards the CMOS-MEMS Monolithic Approach. Micromachines 2018, 9, 557. [Google Scholar] [CrossRef] [Green Version]
  6. Borowik, P.; Adamowicz, L.; Tarakowski, R.; Siwek, K.; Grzywacz, T. Odor Detection Using an E-Nose with a Reduced Sensor Array. Sensors 2020, 20, 3542. [Google Scholar] [CrossRef]
  7. Wang, C.; Yin, L.; Zhang, L.; Xiang, D.; Gao, R. Metal Oxide Gas Sensors: Sensitivity and Influencing Factors. Sensors 2010, 10, 2088–2106. [Google Scholar] [CrossRef] [Green Version]
  8. Chiu, S.-W.; Tang, K.-T. Towards a Chemiresistive Sensor-Integrated Electronic Nose: A Review. Sensors 2013, 13, 14214–14247. [Google Scholar] [CrossRef] [Green Version]
  9. Clements, A.L.; Griswold, W.G.; RS, A.; Johnston, J.E.; Herting, M.M.; Thorson, J.; Collier-Oxandale, A.; Hannigan, M. Low-cost air quality monitoring tools: From research to practice (A workshop Summary). Sensors 2017, 17, 2478. [Google Scholar] [CrossRef] [Green Version]
  10. Matthews, T.; Iqbal, M.; Gonzalez-Velez, H. Non-linear machine learning with active sampling for MOX drift compensation. In Proceedings of the 2018 IEEE/ACM 5th International Conference on Big Data Computing Applications and Technologies (BDCAT), Zurich, Switzerland, 17–20 December 2018; pp. 61–70. [Google Scholar]
  11. Wenzel, M.J.; Mensah-Brown, A.; Josse, F.; Yaz, E.E. Online drift compensation for chemical sensors using estimation theory. IEEE Sens. J. 2011, 11, 225–232. [Google Scholar] [CrossRef]
  12. Marco, S.; Gutierrez-Galvez, A. Signal and data processing for machine olfaction and chemical sensing: A review. IEEE Sens. J. 2012, 12, 3189–3214. [Google Scholar] [CrossRef]
  13. Burgués, J.; Deseada-Esclapez, M.; Doñate, S.; Marco, S. RHINOS: A lightweight portable electronic nose for real-time odorquantification in wastewater treatment plants. IScience 2021, 24, 103371. [Google Scholar] [CrossRef] [PubMed]
  14. Jońca, J.; Pawnuk, M.; Arsen, A.; Sówka, I. Electronic Noses and Their Applications for Sensory and Analytical Measurements in the Waste Management Plants—A Review. Sensors 2022, 22, 1510. [Google Scholar] [CrossRef]
  15. Freire, R.; Mego, M.; Oliveira, L.F.; Mas, S.; Azpiroz, F.; Marco, S.; Pardo, A. Quantitative GC–TCD Measurements of Major Flatus Components: A Preliminary Analysis of the Diet Effect. Sensors 2022, 22, 838. [Google Scholar] [CrossRef] [PubMed]
  16. Palacín, J.; Rubies, E.; Clotet, E.; Martínez, D. Classification of Two Volatiles Using an eNose Composed by an Array of 16 Single-Type Miniature Micro-Machined Metal-Oxide Gas Sensors. Sensors 2022, 22, 1120. [Google Scholar] [CrossRef]
  17. Teixeira, G.G.; Peres, A.M.; Estevinho, L.; Geraldes, P.; Garcia-Cabezon, C.; Martin-Pedrosa, F.; Rodriguez-Mendez, M.L.; Dias, L.G. Enose Lab Made with Vacuum Sampling: Quantitative Applications. Chemosensors 2022, 10, 261. [Google Scholar] [CrossRef]
  18. Burgués, J.; Hernández, V.; Lilienthal, A.J.; Marco, S. Gas distribution mapping and source localization using a 3D grid of metal oxide semiconductor sensors. Sens. Actuators B Chem. 2020, 304, 127309. [Google Scholar] [CrossRef]
  19. Palacín, J.; Clotet, E.; Rubies, E. Assessing over Time Performance of an eNose Composed of 16 Single-Type MOX Gas Sensors Applied to Classify Two Volatiles. Chemosensors 2022, 10, 118. [Google Scholar] [CrossRef]
  20. Palacín, J.; Rubies, E.; Clotet, E. Classification of Three Volatiles Using a Single-Type eNose with Detailed Class-Map Visualization. Sensors 2022, 22, 5262. [Google Scholar] [CrossRef]
  21. Buratti, S.; Benedetti, S.; Giovanelli, G. Application of electronic senses to characterize espresso coffees brewed with different thermal profiles. Eur. Food Res. Technol. 2017, 243, 511–520. [Google Scholar] [CrossRef]
  22. Illy, A.; Illy, E.; Macrae, R.; Petracco, M.; Sondahl, M.R.; Valussi, S.; Viani, R. Espresso Coffee: The Chemistry of Quality, 1st ed.; Academic Press: London, UK, 1995. [Google Scholar]
  23. Nunes, F.M.; Coimbra, M.A.; Duarte, A.C.; Delgadillo, I. Foamability, foam stability, and chemical composition of espresso coffee as affected by the degree of roast. J. Agric. Food Chem. 1997, 45, 3238–3243. [Google Scholar] [CrossRef]
  24. Maeztu, L.; Andueza, S.; Ibañez, C.; Paz de Pena, M.; Bello, J.; Cid, C. Multivariate methods for characterization and classification of espresso coffees from different botanical varieties and types of roast by foam, taste, and mouthfeel. J. Agric. Food Chem. 2001, 49, 4743–4747. [Google Scholar] [CrossRef]
  25. Maeztu, L.; Sanz, C.; Andueza, S.; Paz de Pena, M.; Bello, J.; Cid, C. Characterization of espresso coffee aroma by static headspace GC-MS and sensory flavor profile. J. Agric. Food Chem. 2001, 49, 5437–5444. [Google Scholar] [CrossRef] [PubMed]
  26. Rivetti, D.; Navarini, L.; Cappuccio, R.; Abatangelo, A.; Petracco, M.; Suggi-Liverani, F. Effects of water composition and water treatment on espresso coffee percolation. In Proceedings of the 19th International Scientific Colloquium on Coffee (ASIC), Trieste, Italy, 14–18 May 2001. [Google Scholar]
  27. Andueza, S.; Maeztu, L.; Dean, B.; de Peña, M.P.; Bello, J.; Cid, C. Influence of water pressure on the final quality of arabica espresso coffee. Application of multivariate analysis. J. Agric. Food Chem. 2002, 50, 7426–7431. [Google Scholar] [CrossRef] [PubMed]
  28. Andueza, S.; Maeztu, L.; Pascual, L.; Ibanez, C.; Paz de Pena, M.; Cid, C. Influence of extraction temperature on the final quality of espresso coffee. J. Sci. Food Agric. 2003, 83, 240–248. [Google Scholar] [CrossRef]
  29. Andueza, S.; Vila, M.A.; Paz de Peña, M.; Cid, C. Influence of coffee/water ratio on the final quality of espresso coffee. J. Sci. Food Agric. 2007, 87, 586–592. [Google Scholar] [CrossRef]
  30. Albanese, D.; Di Matteo, M.; Poiana, M.; Spagnamusso, S. Espresso coffee (EC) by POD: Study of thermal profile during extraction process and influence of water temperature on chemical– physical and sensorial properties. Food Res. Int. 2009, 42, 727–732. [Google Scholar] [CrossRef]
  31. Souto, U.T.C.P.; Pontes, M.J.C.; Silva, E.C.; Galvão, R.K.H.; Araújo, M.C.U.; Sanches, F.A.C.; Cunha, F.A.S.; Oliveira, M.S.R. UV–Vis spectrometric classification of coffees by SPA–LDA. Food Chem. 2010, 119, 368–371. [Google Scholar] [CrossRef]
  32. Yulia, M.; Asnaning, A.R.; Suhandy, D. The Classification of Ground Roasted Decaffeinated Coffee Using UV-VIS Spectroscopy and SIMCA Method. In Proceedings of the 2nd International Conference on Agricultural Engineering for Sustainable Agricultural Production (AESAP 2017), Bogor, Indonesia, 23–25 October 2017. [Google Scholar]
  33. Zou, Y.; Gaida, M.; Franchina, F.A.; Stefanuto, P.-H.; Focant, J.-F. Distinguishing between Decaffeinated and Regular Coffee by HS-SPME-GC×GC-TOFMS, Chemometrics, and Machine Learning. Molecules 2022, 27, 1806. [Google Scholar] [CrossRef]
  34. Falasconi, M.; Pardo, M.; Sberveglieri, G.; Riccò, I.; Bresciani, A. The novel EOS 835 electronic nose and data analysis for evaluating coffee ripening. Sens. Actuators B 2005, 110, 73–80. [Google Scholar] [CrossRef]
  35. Pardo, M.; Niederjaufner, G.; Benussi, G.; Comini, E.; Faglia, G.; Sberveglieri, G.; Holmberg, M.; Lundstrom, I. Data preprocessing enhances the classification of different brands of Espresso coffee with an electronic nose. Sens. Actuator B 2000, 69, 397–403. [Google Scholar] [CrossRef]
  36. Michishita, T.; Akiyama, M.; Hirano, Y.; Ikeda, M.; Sagara, Y.; Araki, T. Gas chromatography/olfactometry and electronic nose analyses of retronasal aroma of espresso and correlation with sensory evaluation by an artificial neural network. J. Food Sci. 2010, 75, S477–S489. [Google Scholar] [CrossRef] [PubMed]
  37. Severini, C.; Ricci, I.; Marone, M.; Derossi, A.; De Pilli, T. Changes in the aromatic profile of espresso coffee as a function of the grinding grade and extraction time: A study by the electronic nose system. J. Agric. Food Chem. 2015, 63, 2321–2327. [Google Scholar] [CrossRef] [PubMed]
  38. Gonzalez Viejo, C.; Tongson, E.; Fuentes, S. Integrating a Low-Cost Electronic Nose and Machine Learning Modelling to Assess Coffee Aroma Profile and Intensity. Sensors 2021, 21, 2016. [Google Scholar] [CrossRef] [PubMed]
  39. Brudzewski, K.; Osowski, S.; Dwulit, A. Recognition of Coffee Using Differential Electronic Nose. IEEE Trans. Instrum. Meas. 2012, 61, 1803–1810. [Google Scholar] [CrossRef]
  40. Brudzewski, K.; Osowski, S.; Ulaczyk, J. Differential electronic nose of two chemo sensor arrays for odor discrimination. Sens. Actuators B Chem. 2010, 145, 246–249. [Google Scholar] [CrossRef]
  41. Greco, G.; Carmona, E.N.; Sberveglieri, G.; Genzardi, D.; Sberveglieri, V. A New Kind of Chemical Nanosensors for Discrimination of Espresso Coffee. Chemosensors 2022, 10, 186. [Google Scholar] [CrossRef]
  42. Farah, A.; de Paulis, T.; Moreira, D.P.; Trugo, L.C.; Martin, P.R. Chlorogenic Acids and Lactones in Regular and Water-Decaffeinated Arabica Coffees. J. Agric. Food Chem. 2006, 54, 374–381. [Google Scholar] [CrossRef]
  43. Palacín, J.; Martínez, D. Improving the Angular Velocity Measured with a Low-Cost Magnetic Rotary Encoder Attached to a Brushed DC Motor by Compensating Magnet and Hall-Effect Sensor Misalignments. Sensors 2021, 21, 4763. [Google Scholar] [CrossRef] [PubMed]
  44. Palacín, J.; Rubies, E.; Clotet, E.; Martínez, D. Evaluation of the Path-Tracking Accuracy of a Three-Wheeled Omnidirectional Mobile Robot Designed as a Personal Assistant. Sensors 2021, 21, 7216. [Google Scholar] [CrossRef]
  45. Palacín, J.; Rubies, E.; Clotet, E. Systematic Odometry Error Evaluation and Correction in a Human-Sized Three-Wheeled Omnidirectional Mobile Robot Using Flower-Shaped Calibration Trajectories. Appl. Sci. 2022, 12, 2606. [Google Scholar] [CrossRef]
  46. Belitz, H.D.; Grosch, W.; Schieberle, P. Coffee, Tea, Cocoa. In Food Chemistry, 4th ed.; Springer: Berlin/Heidelberg, Germany, 2009. [Google Scholar]
  47. Davis, A.P.; Tosh, J.; Ruch, N.; Fay, M.F. Growing coffee: Psilanthus (Rubiaceae) subsumed on the basis of molecular and morphological data; implications for the size, morphology, distribution and evolutionary history of Coffea. Bot. J. Linn. Soc. 2011, 167, 357. [Google Scholar] [CrossRef] [Green Version]
  48. International Coffee Organization (ICO), Trade Statistics (2020). Available online: www.ico.org/trade_statistics.asp (accessed on 21 July 2022).
  49. Ramalakshmi, K.; Raghavan, B. Caffeine in Coffee: Its Removal. Why and How? Crit. Rev. Food Sci. Nutr. 1999, 39, 441–456. [Google Scholar] [CrossRef] [PubMed]
  50. Greco, G.; Núñez-Carmona, E.; Abbatangelo, M.; Fava, P.; Sberveglieri, V. How Coffee Capsules Affect the Volatilome in Espresso Coffee. Separations 2021, 8, 248. [Google Scholar] [CrossRef]
  51. European Directive 2009/54/EC. Available online: http://data.europa.eu/eli/dir/2009/54/oj (accessed on 10 September 2022).
  52. Navarini, L.; Rivetti, D. Water quality for Espresso coffee. Food Chem. 2010, 122, 424–428. [Google Scholar] [CrossRef]
  53. Fisher, R.A. The Use of Multiple Measurements in Taxonomic Problems. Ann. Eugen. 1936, 7, 179–188. [Google Scholar] [CrossRef]
  54. Guo, Y.; Hastie, T.; Tibshirani, R. Regularized linear discriminant analysis and its application in microarrays. Biostatistics 2007, 8, 86–100. [Google Scholar] [CrossRef] [Green Version]
  55. Palacín, J.; Martínez, D.; Clotet, E.; Pallejà, T.; Burgués, J.; Fonollosa, J.; Pardo, A.; Marco, S. Application of an Array of Metal-Oxide Semiconductor Gas Sensors in an Assistant Personal Robot for Early Gas Leak Detection. Sensors 2019, 19, 1957. [Google Scholar] [CrossRef]
Figure 1. (a) Image of the coffee measurement setup while measuring the aroma generated by a cup of espresso coffee. (b) Detail of the Osmee One eNose placed inside and on top of the aroma concentration pipe (only the 16 MOX gas sensors of the eNose are housed inside the pipe).
Chemosensors 10 00421 g001
Figure 2. Raw transitory resistance response measured when the eNose is exposed to (a) one cup of Volluto espresso coffee and (b) to one cup of Volluto Decaffeinato expresso coffee. The AIR and SAMPLE areas have been labeled manually.
Chemosensors 10 00421 g002
Figure 3. Normalized representation of the evolution of some samples of the resistance of the thin layer of the 16 MOX gas sensors measured with the eNose. Each sample is scaled from 0.0 (minimum resistance measured in the sample) to 1.0 (maximum resistance measured in the sample). Each MOX gas sensor is identified with a unique color. Two random clusters of each class included in the training dataset are represented: A-1 and A-2 are AIR clusters, W-1 and W-2 are HOT WATER clusters, V-1 and V-2 are VOLLUTO clusters, and VD-1 and VD-2 are VOLLUTO DECAFFEINATO clusters.
Chemosensors 10 00421 g003
Figure 4. LDA projection computed from the training dataset to discriminate AIR, HOT WATER, and COFEE obtained when processing the information from the training dataset as raw resistance.
Chemosensors 10 00421 g004
Figure 5. LDA projection computed from the training dataset to discriminate AIR, HOT WATER, VOLLUTO, and VOLLUTO DECAFFEINATO, obtained when processing the information from the training dataset as raw resistance.
Chemosensors 10 00421 g005
Figure 6. LDA projection trained to discriminate VOLLUTO and VOLLUTO DECAFFEINATO, obtained when processing the information from the training dataset as raw resistance.
Chemosensors 10 00421 g006
Figure 7. Representation of the classification results obtained when projecting the validation dataset using the LDA trained to discriminate between AIR, HOT WATER, and COFFEE (described in Figure 4). The validation dataset has been processed as raw resistance.
Chemosensors 10 00421 g007
Figure 8. (a) Raw transitory resistance measured when the eNose is exposed to Volluto Decaffeinato espresso coffee. Four sections have been manually labeled as VD-S1 (blue) as the air section, VD-SD (yellow) as a decay transition section, VD-S3 (brown) as a stable or steady-state coffee section, and VD-S4 (green) as a final cooling section. (b) Classification results.
Chemosensors 10 00421 g008
Figure 9. Representation of the projection of the raw transitory resistance response displayed in Figure 8a obtained with the aromas of Volluto Decaffeinato espresso coffee. The LDA projection (described in Figure 4) was trained to discriminate three classes AIR, HOT WATER, and COFFEE. The transitory has been processed as raw resistance.
Chemosensors 10 00421 g009
Figure 10. Representation of the classification results obtained when projecting the validation dataset using the LDA trained to discriminate between AIR, HOT WATER, VOLLUTO, and VOLLUTO DECAFFEINATO (described in Figure 5). The validation dataset has been processed as raw resistance.
Chemosensors 10 00421 g010
Figure 11. Representation of the classification results obtained when projecting the validation dataset using the LDA trained to discriminate between VOLLUTO and VOLLUTO DECAFFEINATO (described in Figure 6): (a) projection of the 150 data points of the five clusters of Volluto and the 150 data points of the five clusters of Volluto Decaffeinato; (b) projection of the average values of the five clusters of Volluto and the five clusters of Volluto Decaffeinato.
Chemosensors 10 00421 g011
Table 1. The main features of the analyzed encapsulated coffees. Values are per capsule.
VollutoVolluto Decaffeinato
Net weight (g)4.94.9
Intensity (1–13 scale)44
Recommended cup (ml)4040–110
Aromatic profileSweet and lightSweet and light
Aromatic notesCereal
Sweet biscuit
Fruity (fresh)
Cereal
Sweet biscuit
Fruity (fresh)
Acidity (1–5 scale)33
Bitterness (1–5 scale)22
Roast level (1–5 scale)22
Estimated caffeine in capsule (mg)64 11.7 1
Bean type (origin)Arabica (Brazil, Colombia)Arabica (Brazil, Colombia)
1 Unverified public information.
Table 2. Chemical composition of the bottled water used in the brewing experiments.
DescriptionConcentration (mg/L)
Dry residue at 180 °C40.0
Bicarbonate ( HCO 3 )26.0
Sulfate ( SO 4 )2.6
Chloride ( Cl )3.0
Calcium ( Ca )6.8
Magnesium ( Mg )0.7
Sodium ( Na )3.2
Silica ( SiO 2 )8.3
Table 3. Statistics of the classification results shown in Figure 4 obtained with the training dataset classified with the LDA computed to discriminate between AIR, HOT WATER, and COFFEE classes.
Classified AsTrue Positives (%)False Positives (%)True Negatives (%)False Negatives (%)
AIR10001000
HOT WATER10001000
COFFEE (VOLLUTO)10001000
COFFEE (VOLLUTO DECAFFEINATO)10001000
Table 4. Statistics of the classification results shown in Figure 5 obtained with the training dataset classified with the LDA trained to discriminate between AIR, HOT WATER, VOLLUTO, and VOLLUTO DECAFFEINATO classes.
Classified AsTrue Positives (%)False Positives (%)True Negatives (%)False Negatives (%)
AIR10001000
HOT WATER10001000
VOLLUTO97.910.4199.582.08
VOLLUTO DECAF98.750.6999.301.25
Table 5. Statistics of the classification results shown in Figure 6 obtained with LDA trained to discriminate between VOLLUTO and VOLLUTO DECAFFEINATO classes.
Classified AsTrue Positives (%)False Positives (%)True Negatives (%)False Negatives (%)
VOLLUTO10001000
VOLLUTO DECAF10001000
Table 6. Statistics of the classification results shown in Figure 7 obtained with the LDA trained to discriminate between AIR, HOT WATER, and COFFE classes.
Classified AsTrue Positives (%)False Positives (%)True Negatives (%)False Negatives (%)
COFFEE (VOLLUTO)10001000
COFFEE (VOLLUTO DECAFFEINATO)10001000
Table 7. Statistics of the classification results shown in Figure 10 obtained with the LDA trained to discriminate between AIR, HOT WATER, VOLLUTO, and VOLLUTO DECAFFEINATO classes.
Classified AsTrue Positives (%)False Positives (%)True Negatives (%)False Negatives (%)
VOLLUTO98.0017.3382.662
VOLLUTO DECAF82.66298.0017.33
Table 8. Statistics of the classification results displayed in Figure 11a obtained with the LDA trained to discriminate between VOLLUTO and VOLLUTO DECAFFEINATO classes.
Classified AsTrue Positives (%)False Positives (%)True Negatives (%)False Negatives (%)
VOLLUTO1002980
VOLLUTO DECAF9801002
Table 9. Statistics of the classification results displayed in Figure 11b obtained with the average values of the clusters of the validation dataset classified with the LDA trained to discriminate between VOLLUTO and VOLLUTO DECAFFEINATO classes.
Classified AsTrue Positives (%)False Positives (%)True Negatives (%)False Negatives (%)
VOLLUTO10001000
VOLLUTO DECAF10001000
Publisher’s Note: MDPI stays neutral with regard to jurisdictional claims in published maps and institutional affiliations.

