During the learning process, mobile robots are allowed to learn along the wall in a simple environment. This training environment comprises of straight lines, right angles, and obtuse walls. A simple environment to train a mobile robot demonstrates that the incentive conditions effectively learn the wall-following behavior. It can also be completed along the wall in a more complex test environment. The Webot robotic simulation software is used to train the mobile robot to learn along the wall. At the same time, we compared this with the DS algorithm [
13] to optimize the FLC_R-DS. We used the chaotic DS algorithm [
14] to optimize the FLC_R-CDS.
Figure 6 shows the training environment. The proposed method has five parameters: a population size (PS), a number of rules, p1 and p2 and a learning success reward value. In general, the larger PS, the more robust the search will be, with increased computational cost. The number of rules depends on the complexity of the problem. In the IDS algorithm, there are two control parameters: p1 and p2. The self-adaptive parameters (p1 and p2) were adjusted on the different learning processes. A single performance measurement in terms of failure and success can be used to determine the control policy that produces a maximal learning success reward value by trial-and-error tests. However, the selection of these parameters will critically affect the simulation results. The population size, which uses the range [20, 50], the number of rules, which uses the range [5, 10], the p1 and p2, which use the range [0, 1], and the learning success reward value, which uses the range [5000, 8000], were carefully examined in extensive experiments.
Table 1 presents the initial parameters set before the learning process. Mobile robots will learn along the wall in a training environment. If the robot satisfies the reward conditions, the controller gets the reward. Conversely, the inability of the robot to satisfy the reward conditions is considered a failure. When a failure occurs, the accumulated value of the reward is used to evaluate the FLC.
4.2. Testing Results of Mobile Robot Wall-Following Control
To show the proposed FLC_R-IDS method, we describe the results of the wall-following control simulations performed using the Webots robotic simulation software and we compare the results of the performance with those of other algorithms. In the learning process, the FLC undergoes reinforcement learning to get the best controller. Then, the trained FLC will be tested in the three experimental environments used for the simulations. First, the controller performs the test in the original training environment. The terrain of the training environment is relatively simple. Most of the terrain is a straight line, right angle, and an obtuse angle. The second experimental environment terrain is a combination of a right angle and a straight line. The third experimental environment is more complex than the previous two environments. The terrain is a straight line, right angle, and acute angle. However, the acute angle never appeared in the training environment. The arc-shaped terrain is also used for the experiment. Several best controllers in the experimental environment for testing and analysis are discussed, which are used to compare the performance of the FLC_R-IDS method with those of other methods. This example aims to design and analyze the FLC for a wall-following task. With 30 independent trainings runs, we get 30 mobile robot wall-following controllers. Thirty wall-following controllers are tested one by one in the experimental environment.
- (1)
Comparison of results of various methods in testing environment 1
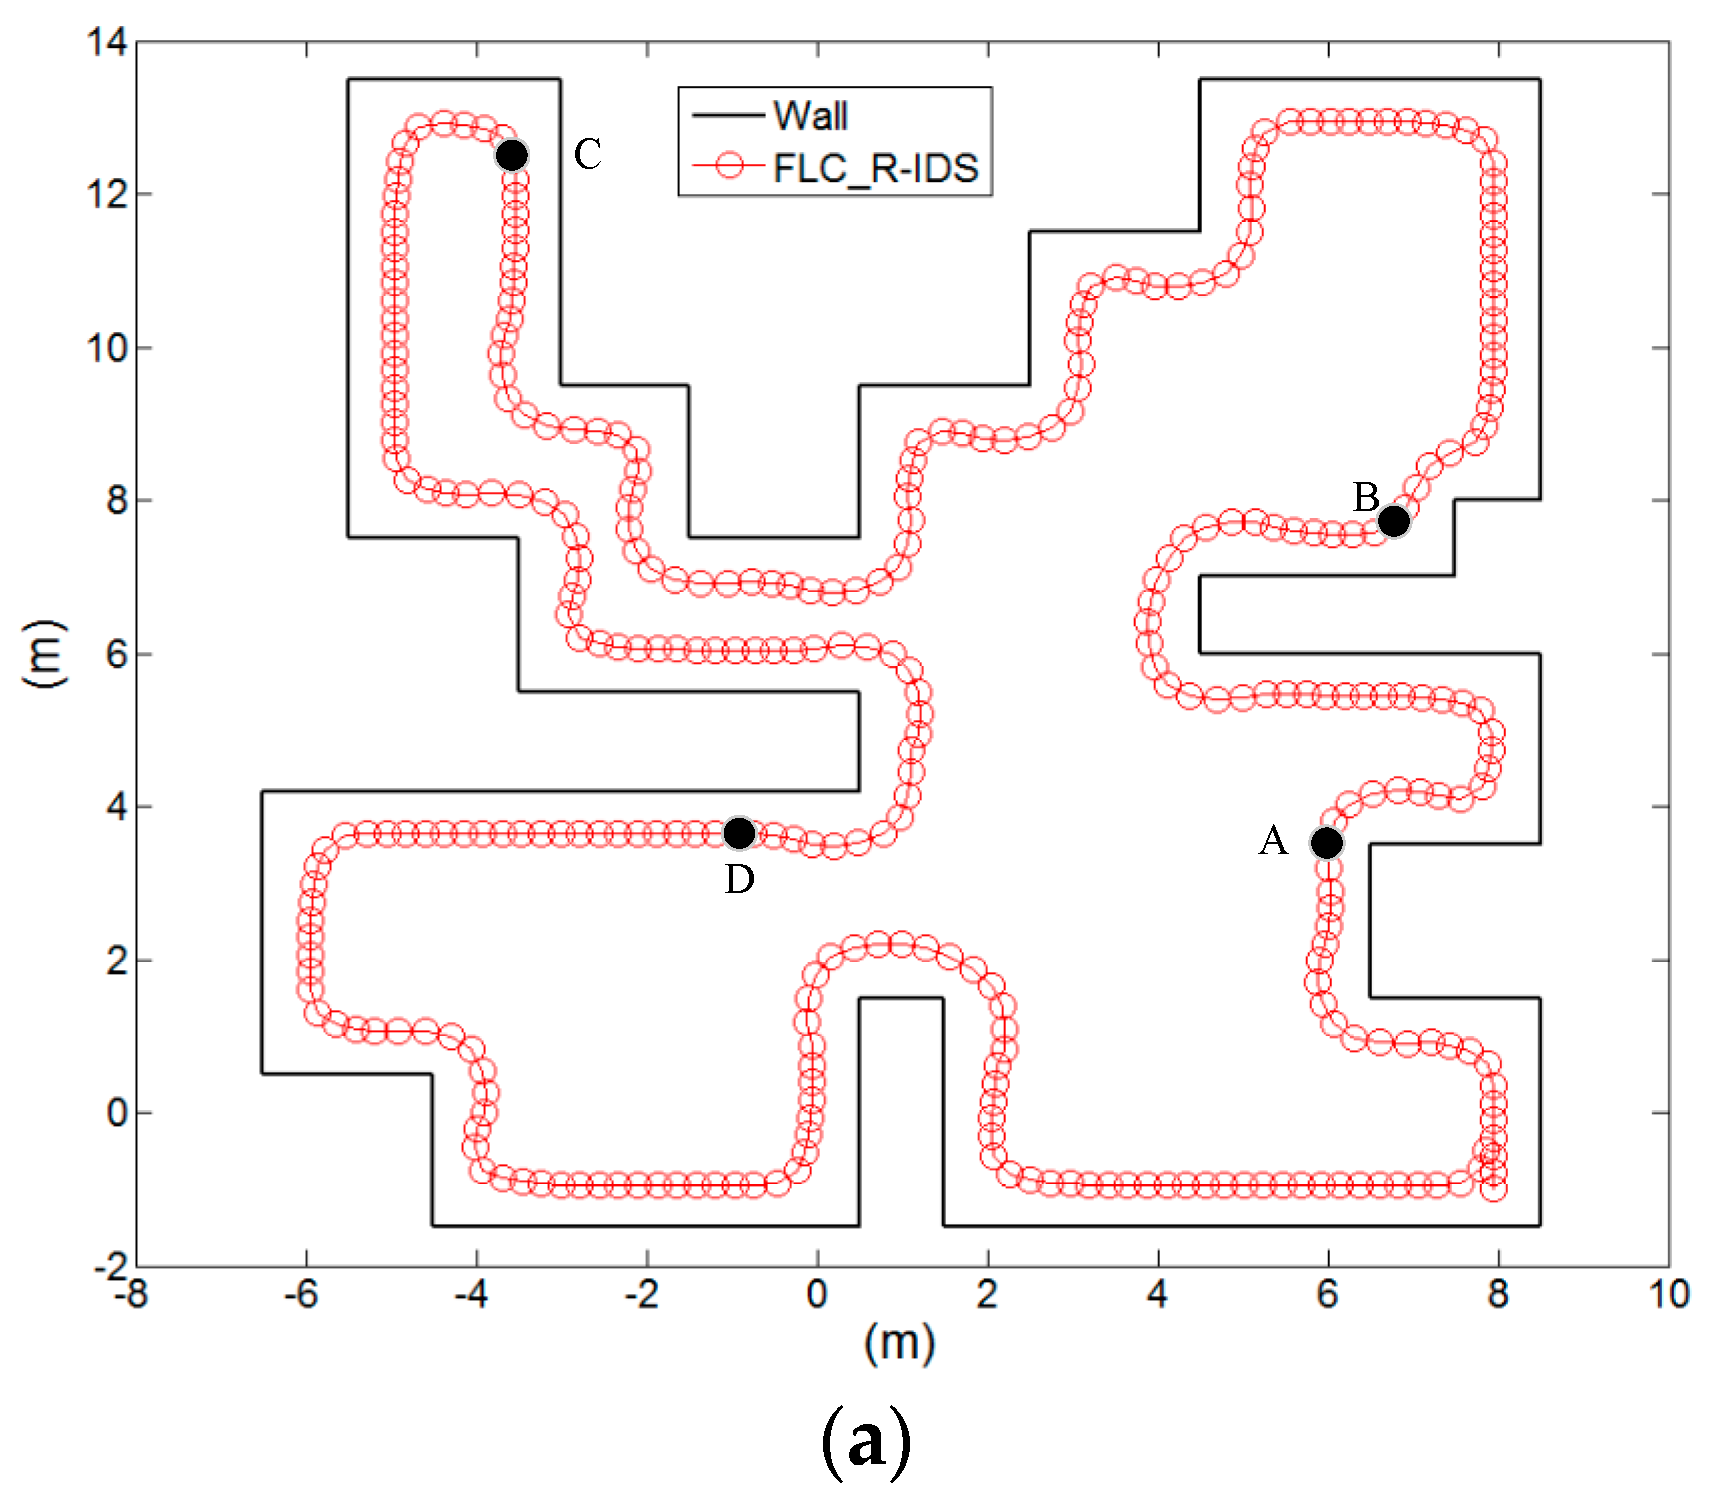
The experiment is performed to demonstrate the best-performing FLC_R-IDS controller in the training environment.
Figure 8a shows that the trained controller can complete the task of following the wall.
Figure 8b shows the distance values according to the ultrasonic sensors
S1,
S3, and
S4 and the left-wheel and right-wheel speeds of the robot. When the robot moved along the wall to point A, the robot encountered a right angle. To avoid collision with the wall, the robot quickly turned left. At this time, the ultrasonic sensor values of
S1,
S3, and
S4 were 0.78, 0.53, and 0.32, respectively. The left-wheel and right-wheel speeds were 1.76 and 2.94 m/s, respectively. When the robot moved to point B along the wall, the robot slowly turned left in a straight line. At this time, the ultrasonic sensor values of
S1,
S3, and
S4 were 0.76, 0.61, and 0.42 m, respectively. The left-wheel and right-wheel speeds were 1.83 and 3.25 m/s, respectively. When the robot in the C point environment was in a straight line, the robot continued to move straight ahead. At this time, the ultrasonic sensor values of
S1,
S3, and
S4 were 1.0, 0.42, and 0.3 m, respectively. The left-wheel and right-wheel speeds were 1.81 and 1.81 m/s, respectively. At point D, when the robot encountered the outer corner, the robot must turn right; otherwise, the robot will move away from the wall. In this case, the ultrasonic sensor values of
S1,
S3, and
S4 were 1.0, 1.0, and 1.0 m, respectively. The left-wheel and right-wheel speeds were 2.76 and 2.3 m/s, respectively. At point E, when the robot turned over the outer corner, the robot must continue along the wall. In this case, the ultrasonic sensor values of
S1,
S3, and
S4 were 1.0, 0.75, and 0.46 m, respectively. The left-wheel and right-wheel speeds were 2.64 and 2.1 m/s, respectively.
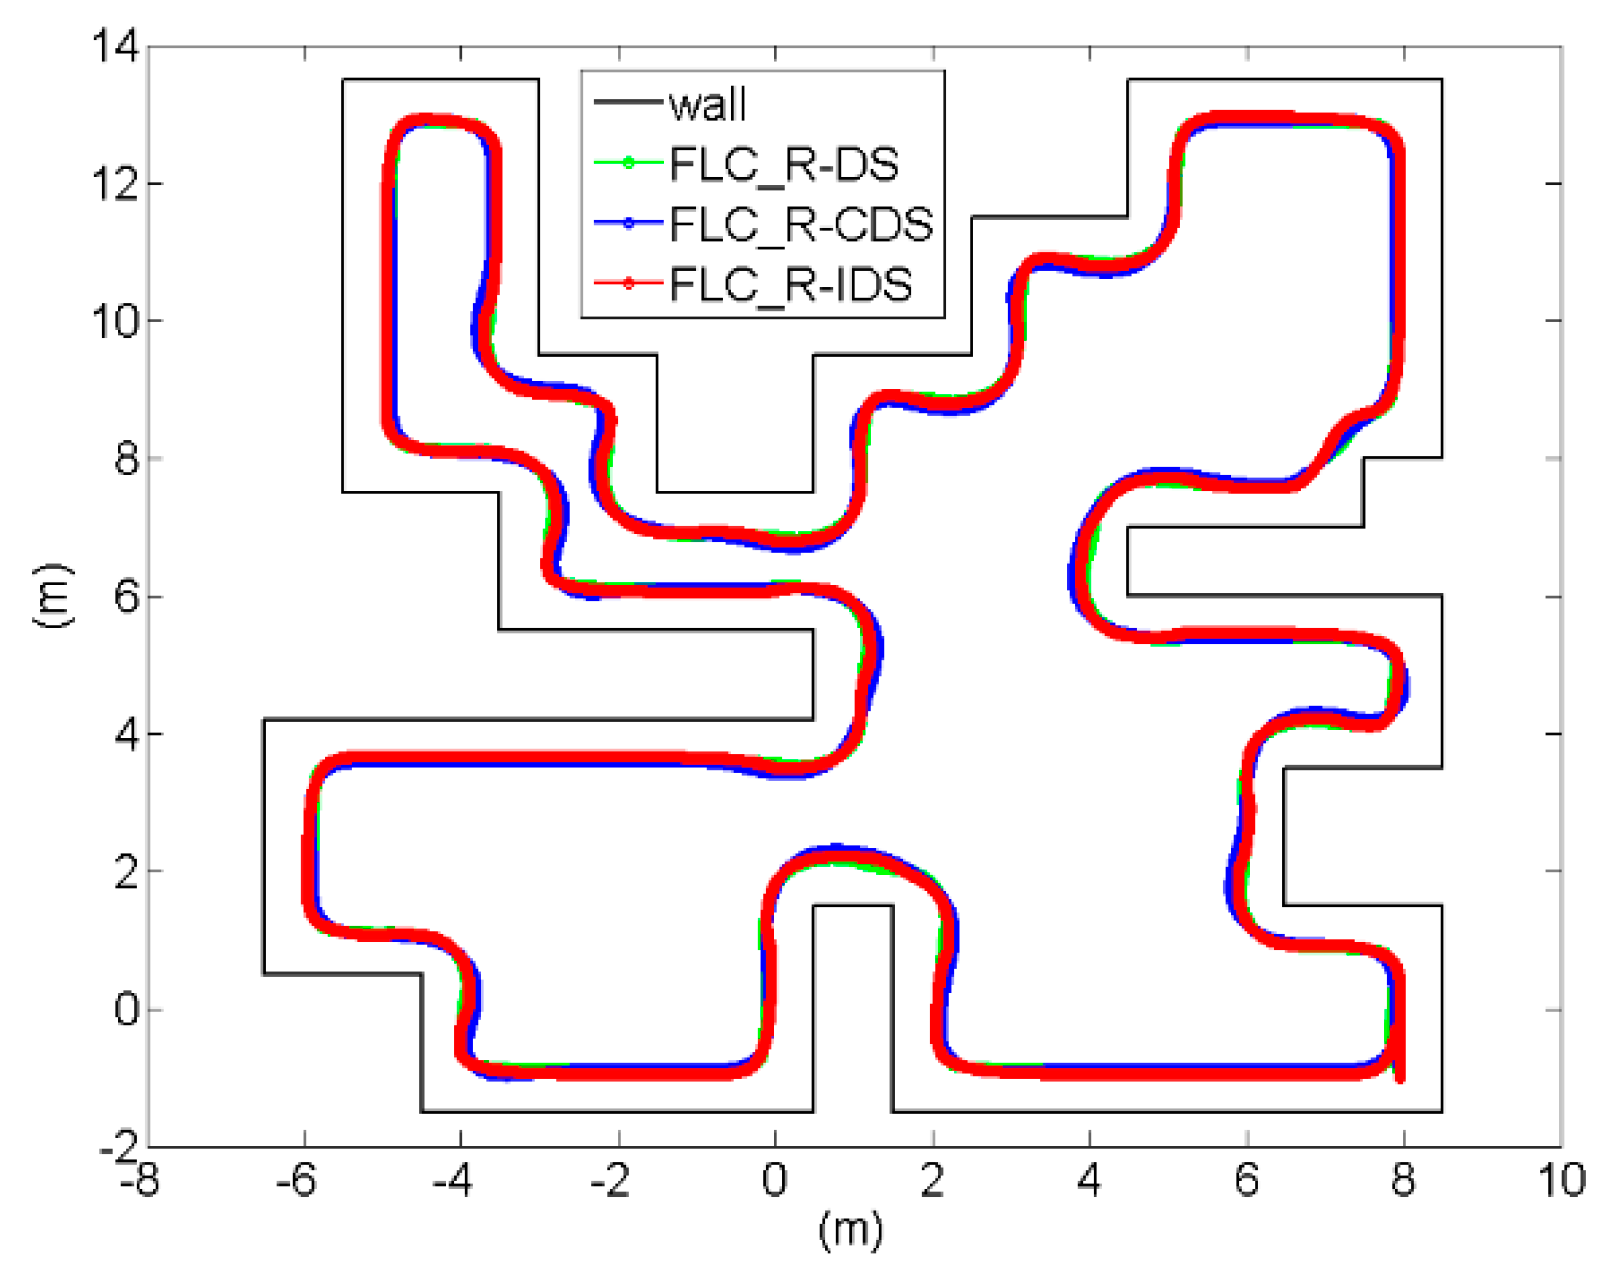
Figure 9 shows the comparison of the path tracking best performances of the proposed FLC_R-IDS, FLC_R-DS and FLC_R-CDS methods in test environment 1.
The mobile robots learn along the wall. The excellent performance along the wall is characterized by a robot’s capability to maintain a distance from the wall. Thus, we analyzed the distance between the robot and wall using the mean absolute error (MAE), which evaluates the performance of the FLC in the wall-following task. When the mobile robot’s
S4 sensor value is 0.3, the robot
dwall error is zero. The smaller the value of MAE, the better the performance of the controller:
where
S4(i) is the value of the
S4 sensor for each step of the robot; the
dwall is 0.3 of the distance between the robot and wall; the
Setptotal is the robot that completes the total number of steps to walking along the wall.
Table 4 represents the FLC_R-IDS, FLC_R-DS and FLC_R-CDS methods for 30 controllers and their MAE values in the test environment. This study also compared the performance of the FLC_R-IDS method with those of other methods. After 30 independent trainings runs, each algorithm got 30 controllers. In IDS, the FLC best controller performance is better than that of the DS and CDS. Regarding the average of 30 controllers, the FLC_R-IDS method performs better than the FLC_R-DS method and FLC_R-CDS algorithms.
The wall-following controller can train along the right wall using the fuzzy controller with evolutionary reinforcement learning. The mobile robot ultrasonic sensors are symmetrical. So, the inputs of the FLC replaced the mobile robot left ultrasonic sensors. (Sensor
S1 is replaced by
S5; sensor
S2 is replaced by
S6; sensor
S3 is replaced by
S7; sensor
S4 is replaced by
S8.) The mobile robot left- and right-wheel exchange show that mobile robots can complete the task that follows the left wall.
Figure 10 shows that the FLC input is replaced by the left side of the ultrasonic sensor. The FLC_R_IDS method is the path of the left wall in the test environment 1.
- (2)
Comparison of results of various methods in testing environment 2
The results of the mobile robot controller testing in test environment 2 are discussed. This experimental environment terrain is a combination of a right angle and straight line.
Figure 11a shows that the trained controller can complete the task in combination with the right angle and straight line environment.
Figure 11b shows the distance values according to the ultrasonic sensors
S1,
S3, and
S4 and the left-wheel and right-wheel speeds of the robot at the robot moving distances. When the robot moved along the wall to point A and encountered the outer corner, it must turn right; otherwise, the robot will move away from the wall. At this time, the ultrasonic sensor values of
S1,
S3, and
S4 were 1.0, 1.0, and 0.35 m, respectively. The left-wheel and right-wheel speeds were 2.78 and 2.27 m/s, respectively. When the robot moved along the wall to point B, the front area of the robot was a small corner; the robot must go left and then go right. At this time, the ultrasonic sensor values of
S1,
S3, and
S4 were 1.0, 0.36, and 0.38 m, respectively. The left-wheel and right-wheel speeds were 1.61 and 2.32 m/s, respectively. When the robot moved along the wall to point C, the robot encountered a right angle. To avoid collision with the wall, the robot quickly turned left. At this time, the ultrasonic sensor values of
S1,
S3, and
S4 were 0.68, 0.71, and 0.37 m, respectively. The left-wheel and right-wheel speeds were 2.11 and 3.39 m/s, respectively. When the robot at point D of the environment is travelling in a straight line, it continues to go straight. In this case, the ultrasonic sensor values of
S1,
S3, and
S4 were 1.0, 0.41, and 0.31 m, respectively. The left-wheel and right-wheel speeds were 1.81 and 1.82 m/s, respectively.
Figure 12 shows the comparison of the path tracking best performances of the proposed FLC_R-IDS, FLC_R-DS, and FLC_R-CDS methods in test environment 2. Similar to the previous experiment, Equation (23) is used to assess the performance of each FLC.
Table 5 represents the FLC_R-IDS method and the MAE values of other methods for the 30 controllers in the test environment 2. It also shows the comparison of the performance of the FLC_R-IDS method with those of the other methods. From
Table 5, several controllers failed in test environment 2 because the environment is more complex than the training environment. When the robot controller collides or stops in the test environment, this represents a failure. After 30 independent training runs, each algorithm got 30 controllers. The best controller performance in the FLC_R-IDS method is better than that in the FLC_R-DS and FLC_R-CDS methods. In the average of 30 controllers, the FLC_R-IDS method performs better than the FLC_R-DS and FLC_R-CDS methods. In the FLC_R-DS and FLC_R-CDS methods, a collision occurred while running test environment 2.
- (3)
Comparison of results of various methods in testing environment 3
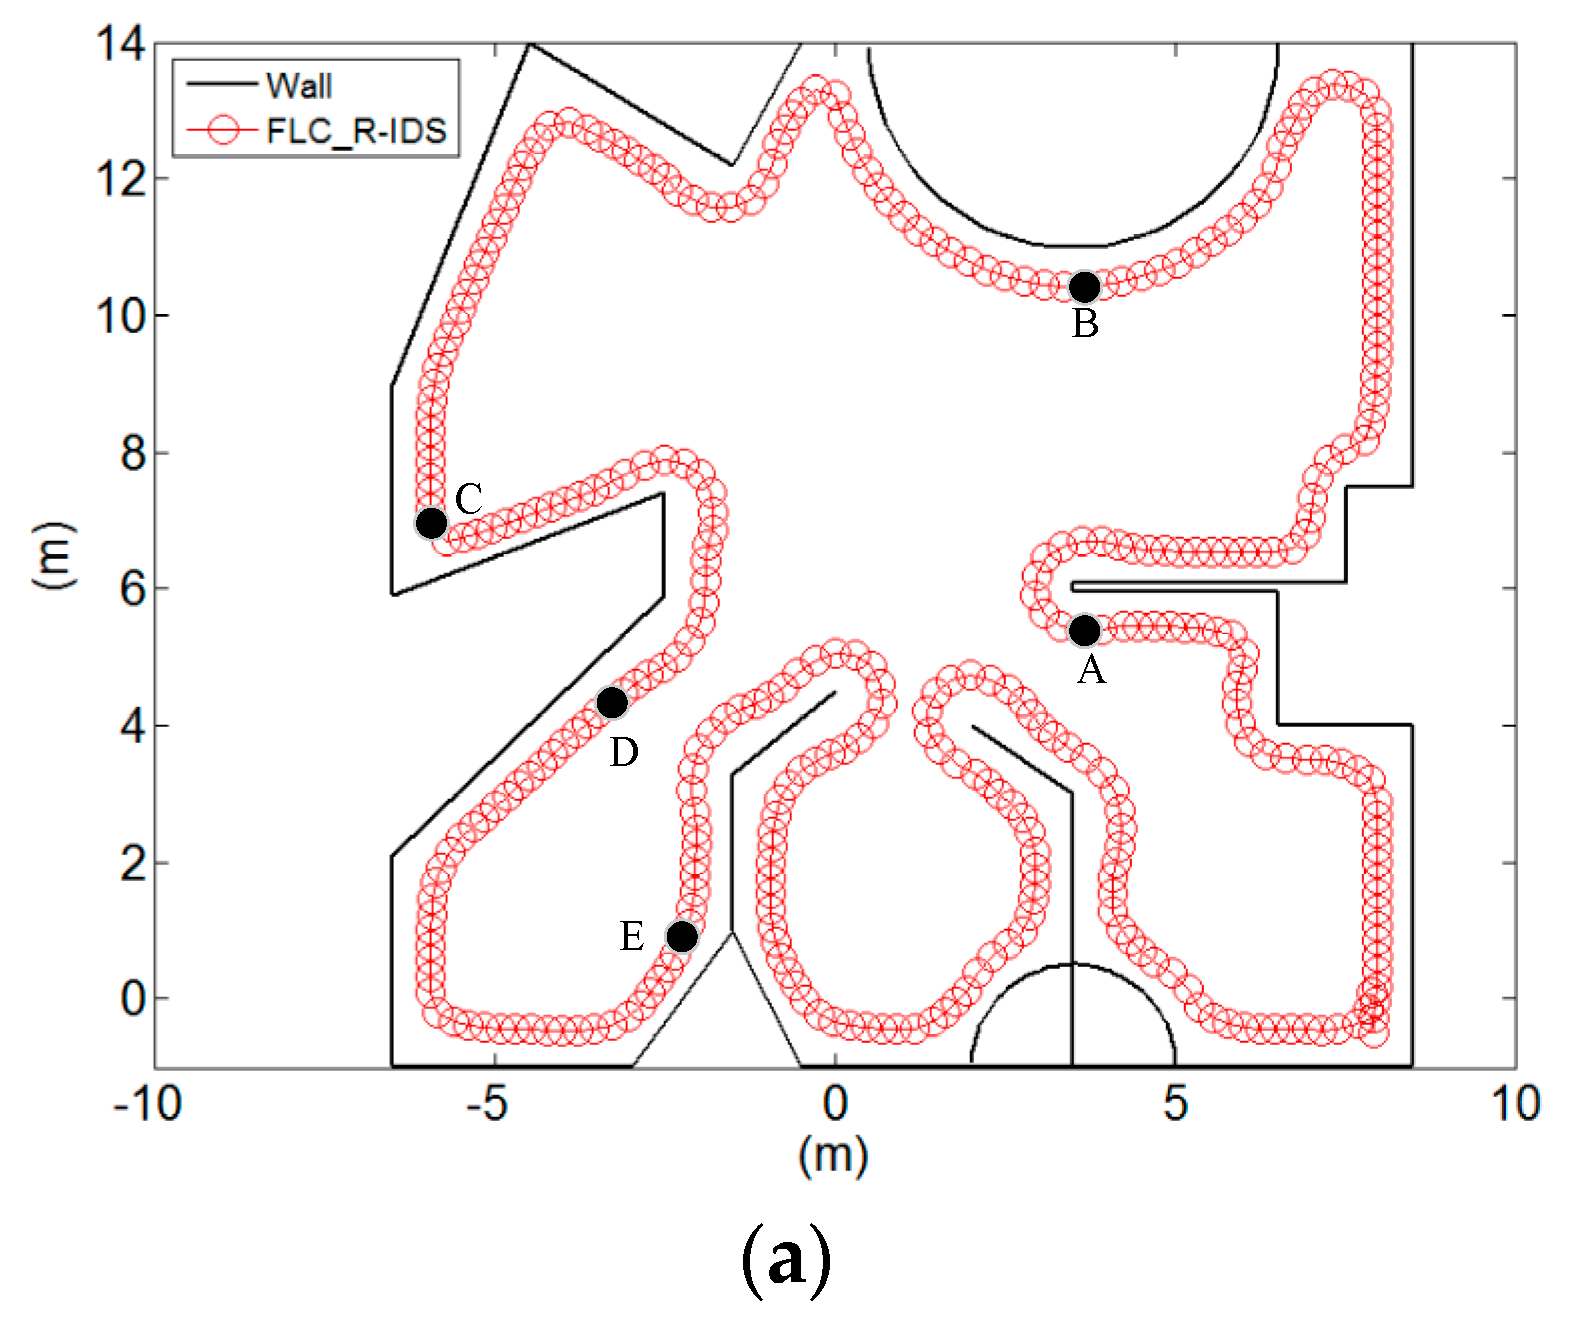
This test environment is more complex than the previous environments. The terrain is a straight line, right angle, and acute angle. The test environment is also a circular terrain.
Figure 13a shows that the FLC can complete the task in combination with the right angle, acute angle, straight line, and circular terrain environment.
Figure 13b shows the distance values according to the ultrasonic sensors
S1,
S3, and
S4 and the left-wheel and right-wheel speeds of the robot at the robot moving distances. When the robot moved along the wall to point A because the terrain of point A was a straight line, it must turn right over the straight terrain to continue the action along the wall. At this moment, the values of ultrasonic sensor values of
S1,
S3, and
S4 were 1.0, 1.0, and 0.36 m, respectively. The left-wheel and right-wheel speeds were 2.8 and 2.25 m/s, respectively. When the robot moved along the wall to point B, the robot was along the circular terrain. So, the robot must stay forward to the right front. At this time, the ultrasonic sensor values of
S1,
S3, and
S4 were 1.0, 0.68, and 0.44 m, respectively. The left-wheel and right-wheel speeds were 2.45 and 2.25 m/s, respectively. When the robot moved along the wall to point C, the robot would encounter the acute angle. To avoid collision with the wall, the robot quickly turned left. In this acute angle of the terrain, if the mobile robot turns left quickly, the robot will stay away from the wall. Conversely, if the mobile robot turns left too late, the robot collides with the wall. So, the robot must turn left in the appropriate range to continue the task along the wall. In this case, the ultrasonic sensor values of
S1,
S3, and
S4 were 0.69, 0.58, and 0.33 m, respectively. The left-wheel and right-wheel speeds were 1.7 and 3.5 m/s, respectively. When the robot in the D point of the environment is in a straight line, the robot will continue to go straight ahead. In this case, the ultrasonic sensor values of
S1,
S3, and
S4 were 1.0, 0.42, and 0.3 m, respectively. The left-wheel and right-wheel speeds were 1.81 and 1.82 m/s, respectively. When the robot moves along the wall to point E, the robot has just passed an obtuse angle. The robot is not parallel to the wall, so the robot must turn left to adjust the direction of the body. At this time, the ultrasonic sensor values of
S1,
S3, and
S4 were 1.0, 0.48, and 0.36 m, respectively. The left-wheel and right-wheel speeds were 1.86 and 2.1 m/s, respectively.
Figure 14 shows the comparison of the path tracking best performances of the proposed FLC_R-IDS method and other methods in test environment 3.
Table 6 represents the FLC_R-IDS method and other methods for the MAE values of 30 controllers in the test environment 3. It also compares the performance of the FLC_R-IDS method with those of the FLC_R-DS and the FLC_R-CDS methods.


