Article

CCO–XGBoost Hybrid Model for Prediction of Blasting-Induced Peak Particle Velocity in Open-Pit Mines: A SHAP-Driven Sensitivity Analysis

School of Resources and Safety Engineering, Central South University, Changsha 410083, China
*
Author to whom correspondence should be addressed.
Mathematics 2026, 14(4), 596; https://doi.org/10.3390/math14040596
Submission received: 19 January 2026 / Accepted: 6 February 2026 / Published: 9 February 2026
(This article belongs to the Special Issue Mathematical Modeling and Analysis in Mining Engineering)

Abstract

Accurate prediction of peak particle velocity (PPV) in open-pit mine blasting is critical for ensuring operational safety and effective vibration control. This study proposes a hybrid modeling approach that integrates the Centered Collision Optimization (CCO) algorithm with Extreme Gradient Boosting (XGBoost), enhanced by SHAP-based sensitivity analysis to improve model transparency and mechanistic interpretability. A comprehensive dataset was constructed based on 193 field-measured blasting records collected from the Panzhihua Iron Mine in China, incorporating nine key input parameters. Model performance was rigorously evaluated using four widely recognized metrics: coefficient of determination (R2), root mean square error (RMSE), mean absolute error (MAE), and variance accounted for (VAF). The results demonstrate that the CCO–XGBoost model achieves superior predictive performance, with R2 = 0.967, RMSE = 0.110, MAE = 0.067, and VAF = 96.35%, outperforming conventional approaches. SHAP-based sensitivity analysis reveals that blast-to-monitor distance (R) is the dominant negative predictor of PPV, contributing 43% to the total influence, with its vibration attenuation effect intensifying significantly when R exceeds 54 m. Charge per hole (q) and total charge per delay (Q) are identified as the primary positive influencing factors, accounting for 24% and 20% of the total contribution, respectively: the positive promoting effect of q on PPV strengthens markedly when q exceeds 17 kg, while Q exerts a continuous positive increasing influence on PPV when it exceeds 253 kg. Compared to existing hybrid models, the CCO–XGBoost uniquely avoids local optima and ensures higher global stability. This study fills the gap by providing quantifiable engineering thresholds for practical vibration control, making the model directly applicable to on-site blasting optimization.

1. Introduction

Open-pit mining, as one of the primary settings for mineral resource extraction, relies on the drilling and blasting method as its predominant technique due to its high efficiency in rock fragmentation. The scientific rationale behind blast parameters directly dictates blast outcomes and mining economics. Improper parameter design not only leads to resource waste and cost escalation but may also trigger a series of safety and environmental issues, among which the hazards of blast-induced vibration are particularly prominent [1]. The energy generated by blast vibration can compromise the structural integrity of nearby buildings and structures, slope stability, and the safety of personnel and equipment. Therefore, accurately predicting blast vibration intensity and scientifically evaluating its response indicators form the core link in optimizing blast design, preventing and controlling potential risks, and ensuring safe and efficient mining operations. This also represents a key driver for advancing the technological upgrade of the drilling and blasting method [2].
Peak Particle Velocity (PPV) serves as a crucial indicator for assessing blast-induced vibration effects, with its magnitude directly reflecting the degree of impact on the surrounding environment [3]. However, blast vibration is subject to the intertwined effects of multiple factors such as site geological conditions and blast parameter configurations, leading its intensity and distribution to exhibit notable uncertainty and randomness, which poses significant challenges for precise measurement [4]. Current PPV prediction predominantly relies on regression analysis combining field test data with empirical formulas based on expert experience. Yet, due to the complex, nonlinear, and anisotropic characteristics inherent in the interaction between explosive detonation and geomedia, compounded by dynamic variations over time and temperature as well as uncertainties in boundary conditions, traditional regression fitting results often deviate substantially from actual field conditions. Consequently, they struggle to meet the demands for prediction accuracy required in engineering practice [5,6].
With the advancement of computer technology, machine learning (ML) techniques have emerged as a research hotspot in blast vibration prediction [7,8]. Various methods, including Support Vector Machine (SVM), Extreme Learning Machine (ELM), and Backpropagation Neural Network (BPNN), have been applied in this domain [9,10,11,12]. However, these traditional methods often struggle to balance efficiency with accuracy due to complex parameter configurations and sensitivity to data noise [13].
Against this backdrop, the optimized Extreme Gradient Boosting (XGBoost) model, leveraging its efficient ensemble learning characteristics, has been introduced by researchers into blast vibration prediction studies [14]. XGBoost effectively mitigates the risk of overfitting by constructing an objective function with a regularization term, demonstrating unique advantages in predicting complex engineering problems [15]. To further enhance model performance, numerous studies have attempted to couple XGBoost with heuristic optimization algorithms. SUN et al. [16] integrated the Runge–Kutta optimization (RUN) algorithm with XGBoost to establish an RUN–XGBoost model, which further improved the prediction accuracy of blast vibration velocity. Zhou et al. [17] applied the Jaya algorithm to optimize the hyperparameters of XGBoost, constructing a Jaya-XGBoost model for PPV prediction. Their research indicated that this model is more reliable than traditional machine learning models and empirical formulas. Qiu et al. [18] systematically evaluated the performance of hybrid models combining XGBoost with the Whale Optimization Algorithm (WOA), Grey Wolf Optimizer (GWO), and Bayesian Optimization (BO), finding that WOA-XGBoost emerged as the most reliable model for predicting blast-induced ground vibration. These studies collectively demonstrate that XGBoost combined with optimization algorithms can achieve more accurate PPV predictions.
However, existing research primarily focuses on optimizing the prediction results of PPV and lacks a systematic analysis of how different prediction parameters influence the prediction process. This shortcoming makes it difficult to unveil the intrinsic interaction mechanisms between various parameters and PPV, thereby limiting the practical application value of such models in blast parameter optimization and vibration control.
To address these issues, this study introduces an optimized XGBoost model employing the Centered Collision Optimizer (CCO) for precise tuning of key parameters. Through comparative analysis with mainstream models, this research aims to identify a highly efficient method for PPV prediction. Furthermore, leveraging the SHAP interpretability model, a sensitivity analysis is conducted to uncover the core factors influencing PPV. This analysis provides a robust theoretical foundation and identifies quantifiable engineering thresholds for safety management and decision-making in blasting engineering.

2. Materials

2.1. Research Area

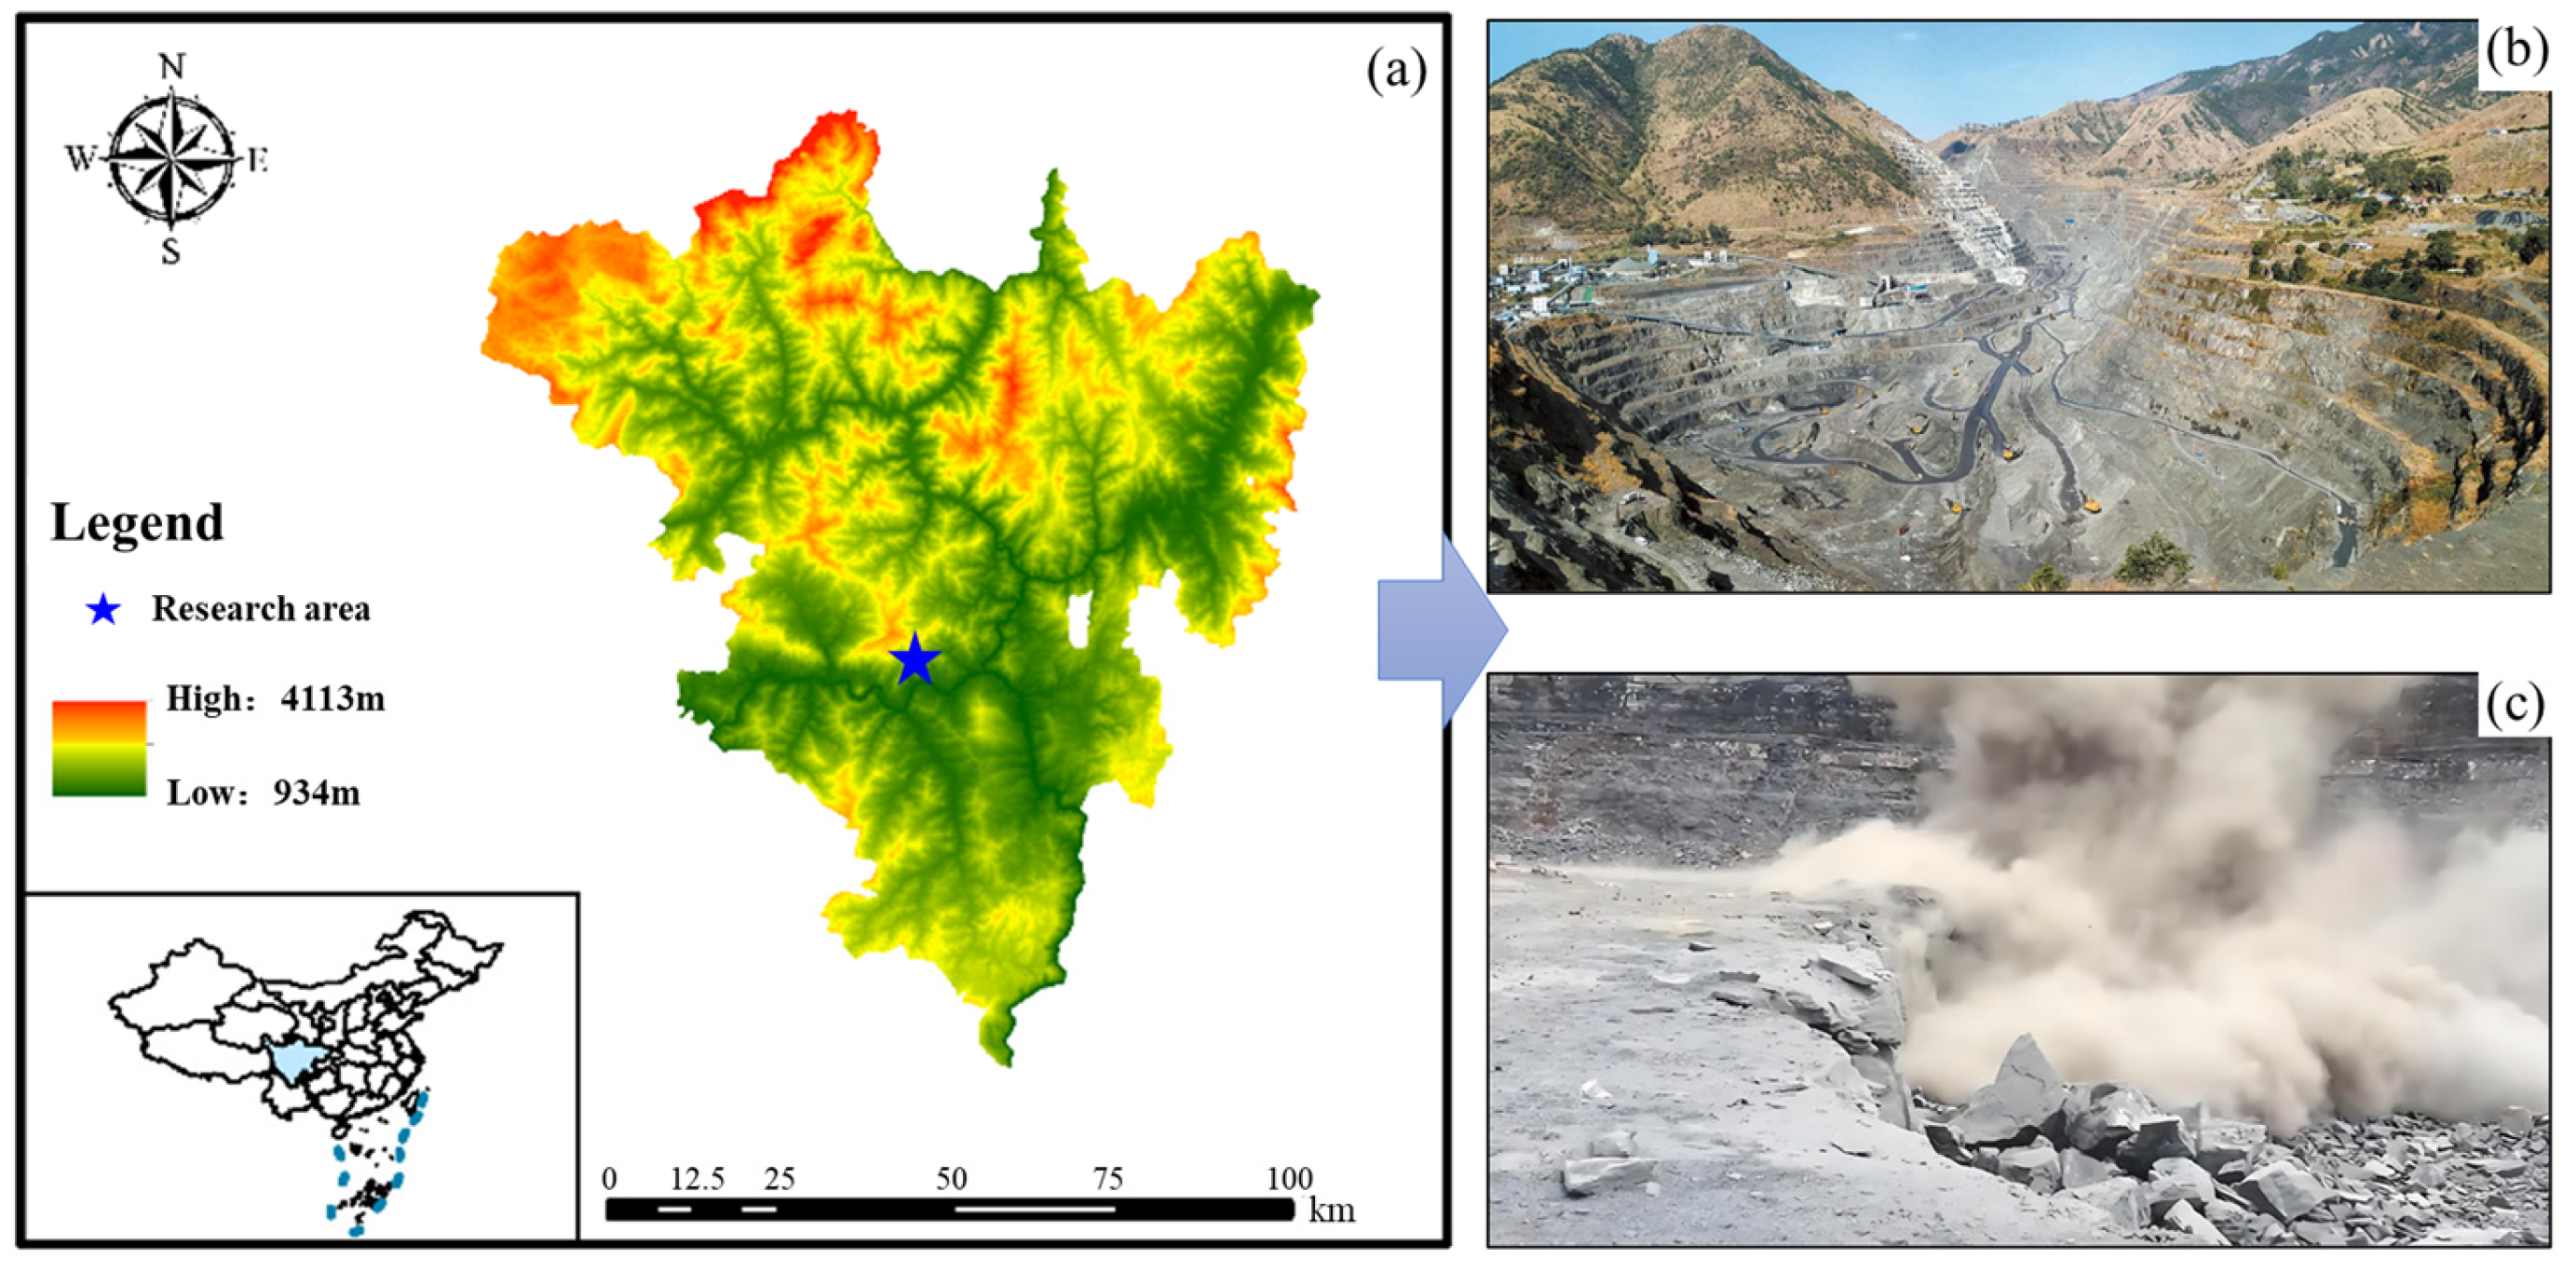
This study selects the Zhulan Iron Mine located in Panzhihua City, Sichuan Province, China, as the research area (Figure 1a). This mine is a large-scale open-pit iron ore operation characterized by complex and variable geological conditions and significant fissure development in the pit slopes. With the continuous increase in mining depth, the mine exhibits distinct features typical of large-scale open-pit operations. The pit bottom area is densely populated with large, fixed equipment that lacks mobility, imposing stringent requirements on the precision of fly rock control and the uniformity of blast fragmentation during blasting operations (Figure 1b). Furthermore, dust generated during open-pit blasting operations is prone to dispersion, causing regional pollution that not only damages the local ecological environment but also directly threatens the occupational health of personnel (Figure 1c).
The operational scenario of this mine embodies the typical characteristics of large-scale open-pit mining, including deep and extensive pits, high density of equipment, and stringent environmental standards. In response to the multiple technical challenges outlined above, there is an urgent need to develop a high-precision PPV prediction model based on machine learning technology. Such a model would provide quantitative support for the dynamic optimization of blasting parameters, thereby effectively addressing the compound technical challenges of vibration control and dust prevention in deep-hole blasting operations.

2.2. Traditional Measurement Methods and Selection of Influencing Indicators for PPV

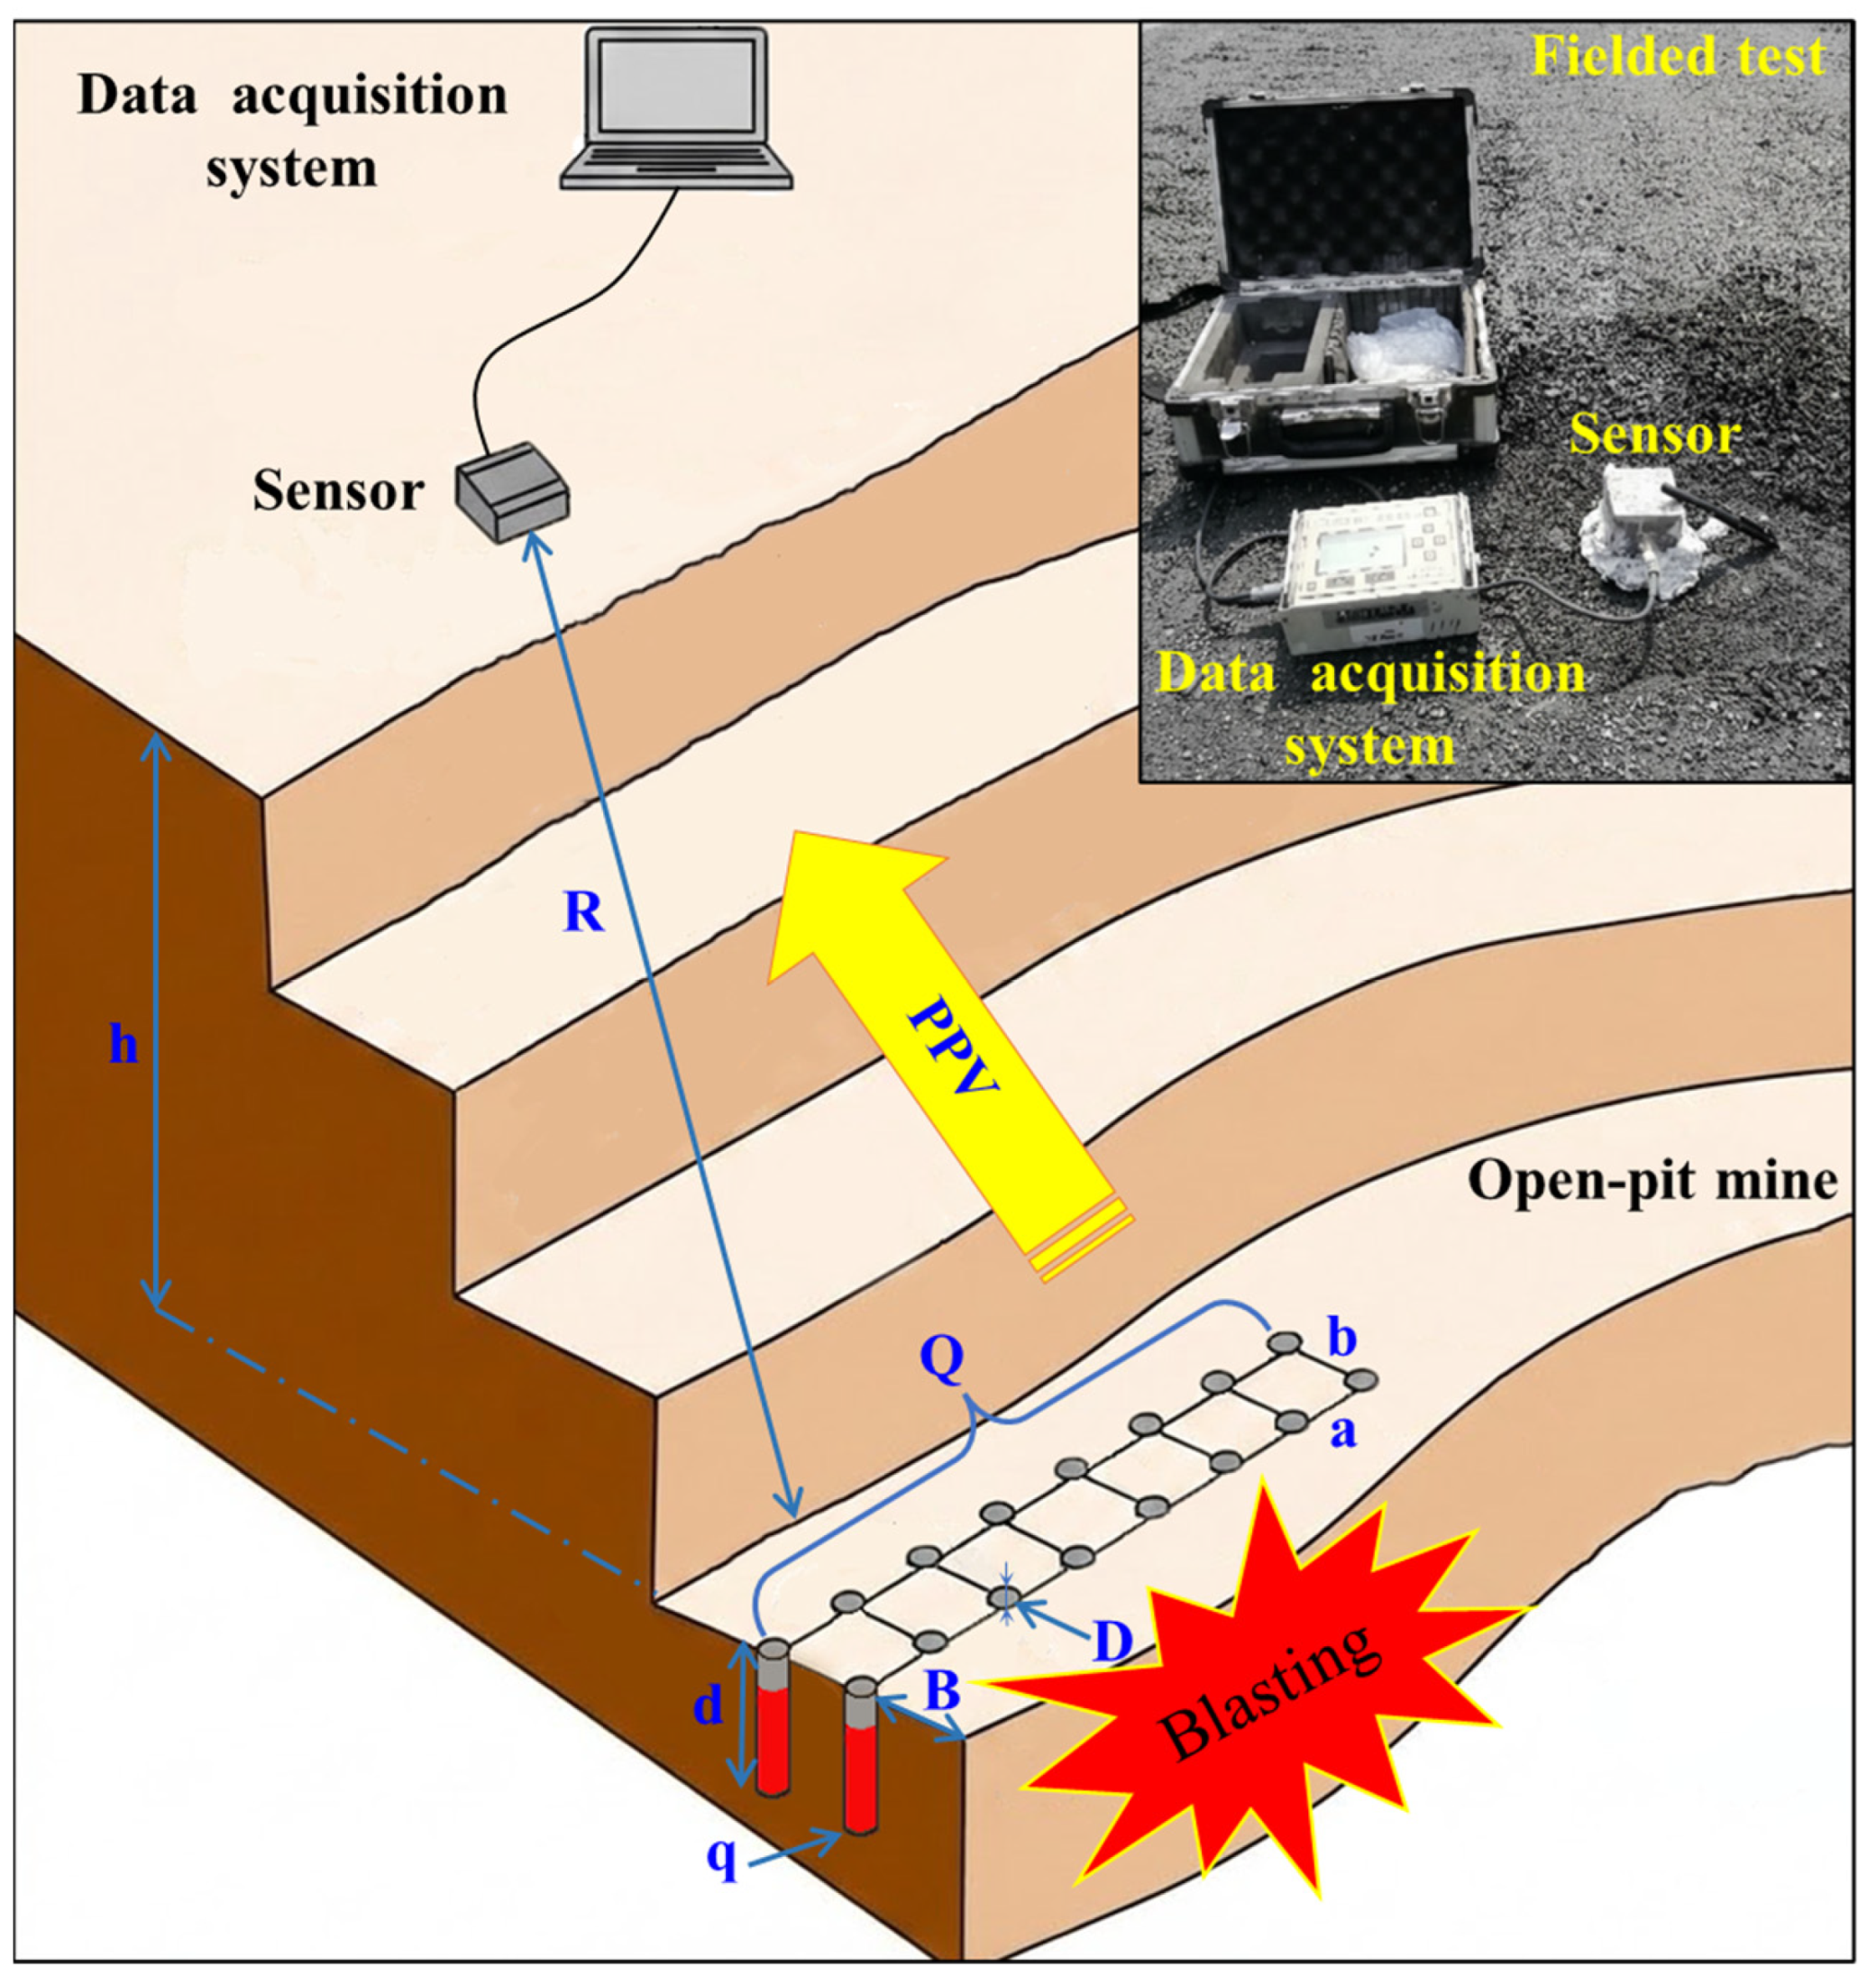
During open-pit mining operations, the measurement of PPV is primarily conducted using blast monitoring instruments. By setting specific measurement distances and with known explosive charge weights, the blast waveform diagram depicting particle vibration velocity at the moment of detonation is obtained, as illustrated in Figure 2. In engineering practice, the most commonly used method for blast vibration prediction involves deriving empirical formulas through regression analysis, which correlate blast vibration with charge quantity and distance. Traditional prediction formulas include the Sadovsky formula, the US Bureau of Mines (USBM) formula, and the Indian Standard Institution formula, among others, as listed in the Table 1. Among these, the Sadovsky empirical formula is the most frequently used for blast vibration prediction. However, due to the variable nature of blast sites, its prediction error is significant under topographic conditions involving elevation. Consequently, many researchers have introduced elevation factors to modify the traditional Sadovsky formula, thereby reducing prediction errors for blast vibrations under the influence of elevation. Although such improved prediction formulas can enhance accuracy, blast vibration is subject to the combined effects of multiple factors. These formulas fail to capture the complex nonlinear relationships between various influencing factors and blast vibration, resulting in prediction errors that remain substantial. Furthermore, they exhibit high dependency on site-specific coefficients and lack generalizability [19].
Given the complex influence mechanism of blast vibration, traditional prediction methods relying solely on charge quantity and distance are insufficient to fully characterize its nonlinear response characteristics. Numerous studies have confirmed that charge parameters, borehole layout parameters, and spatial geometric parameters all significantly affect the measurement accuracy of blast vibration [24]. Therefore, this study comprehensively selects nine key influencing parameters from open-pit blasting operations to construct a prediction index system (Figure 2). These parameters specifically include: charge per hole (q, kg), total charge per delay (Q, kg), blast-to-monitor distance (R, m, defined as the straight-line distance from the blast point to the measurement point), average borehole depth (d, m), average borehole diameter (D, mm), average borehole spacing (a, m), average borehole row spacing (b, m), minimum burden distance (W, m), and elevation difference between the measurement point and the blast point (h, m). Through multi-factor coupled modeling, this study aims to comprehensively capture the combined effects of these parameters on PPV, thereby providing data support for enhancing PPV prediction accuracy.

2.3. Construction of the Dataset

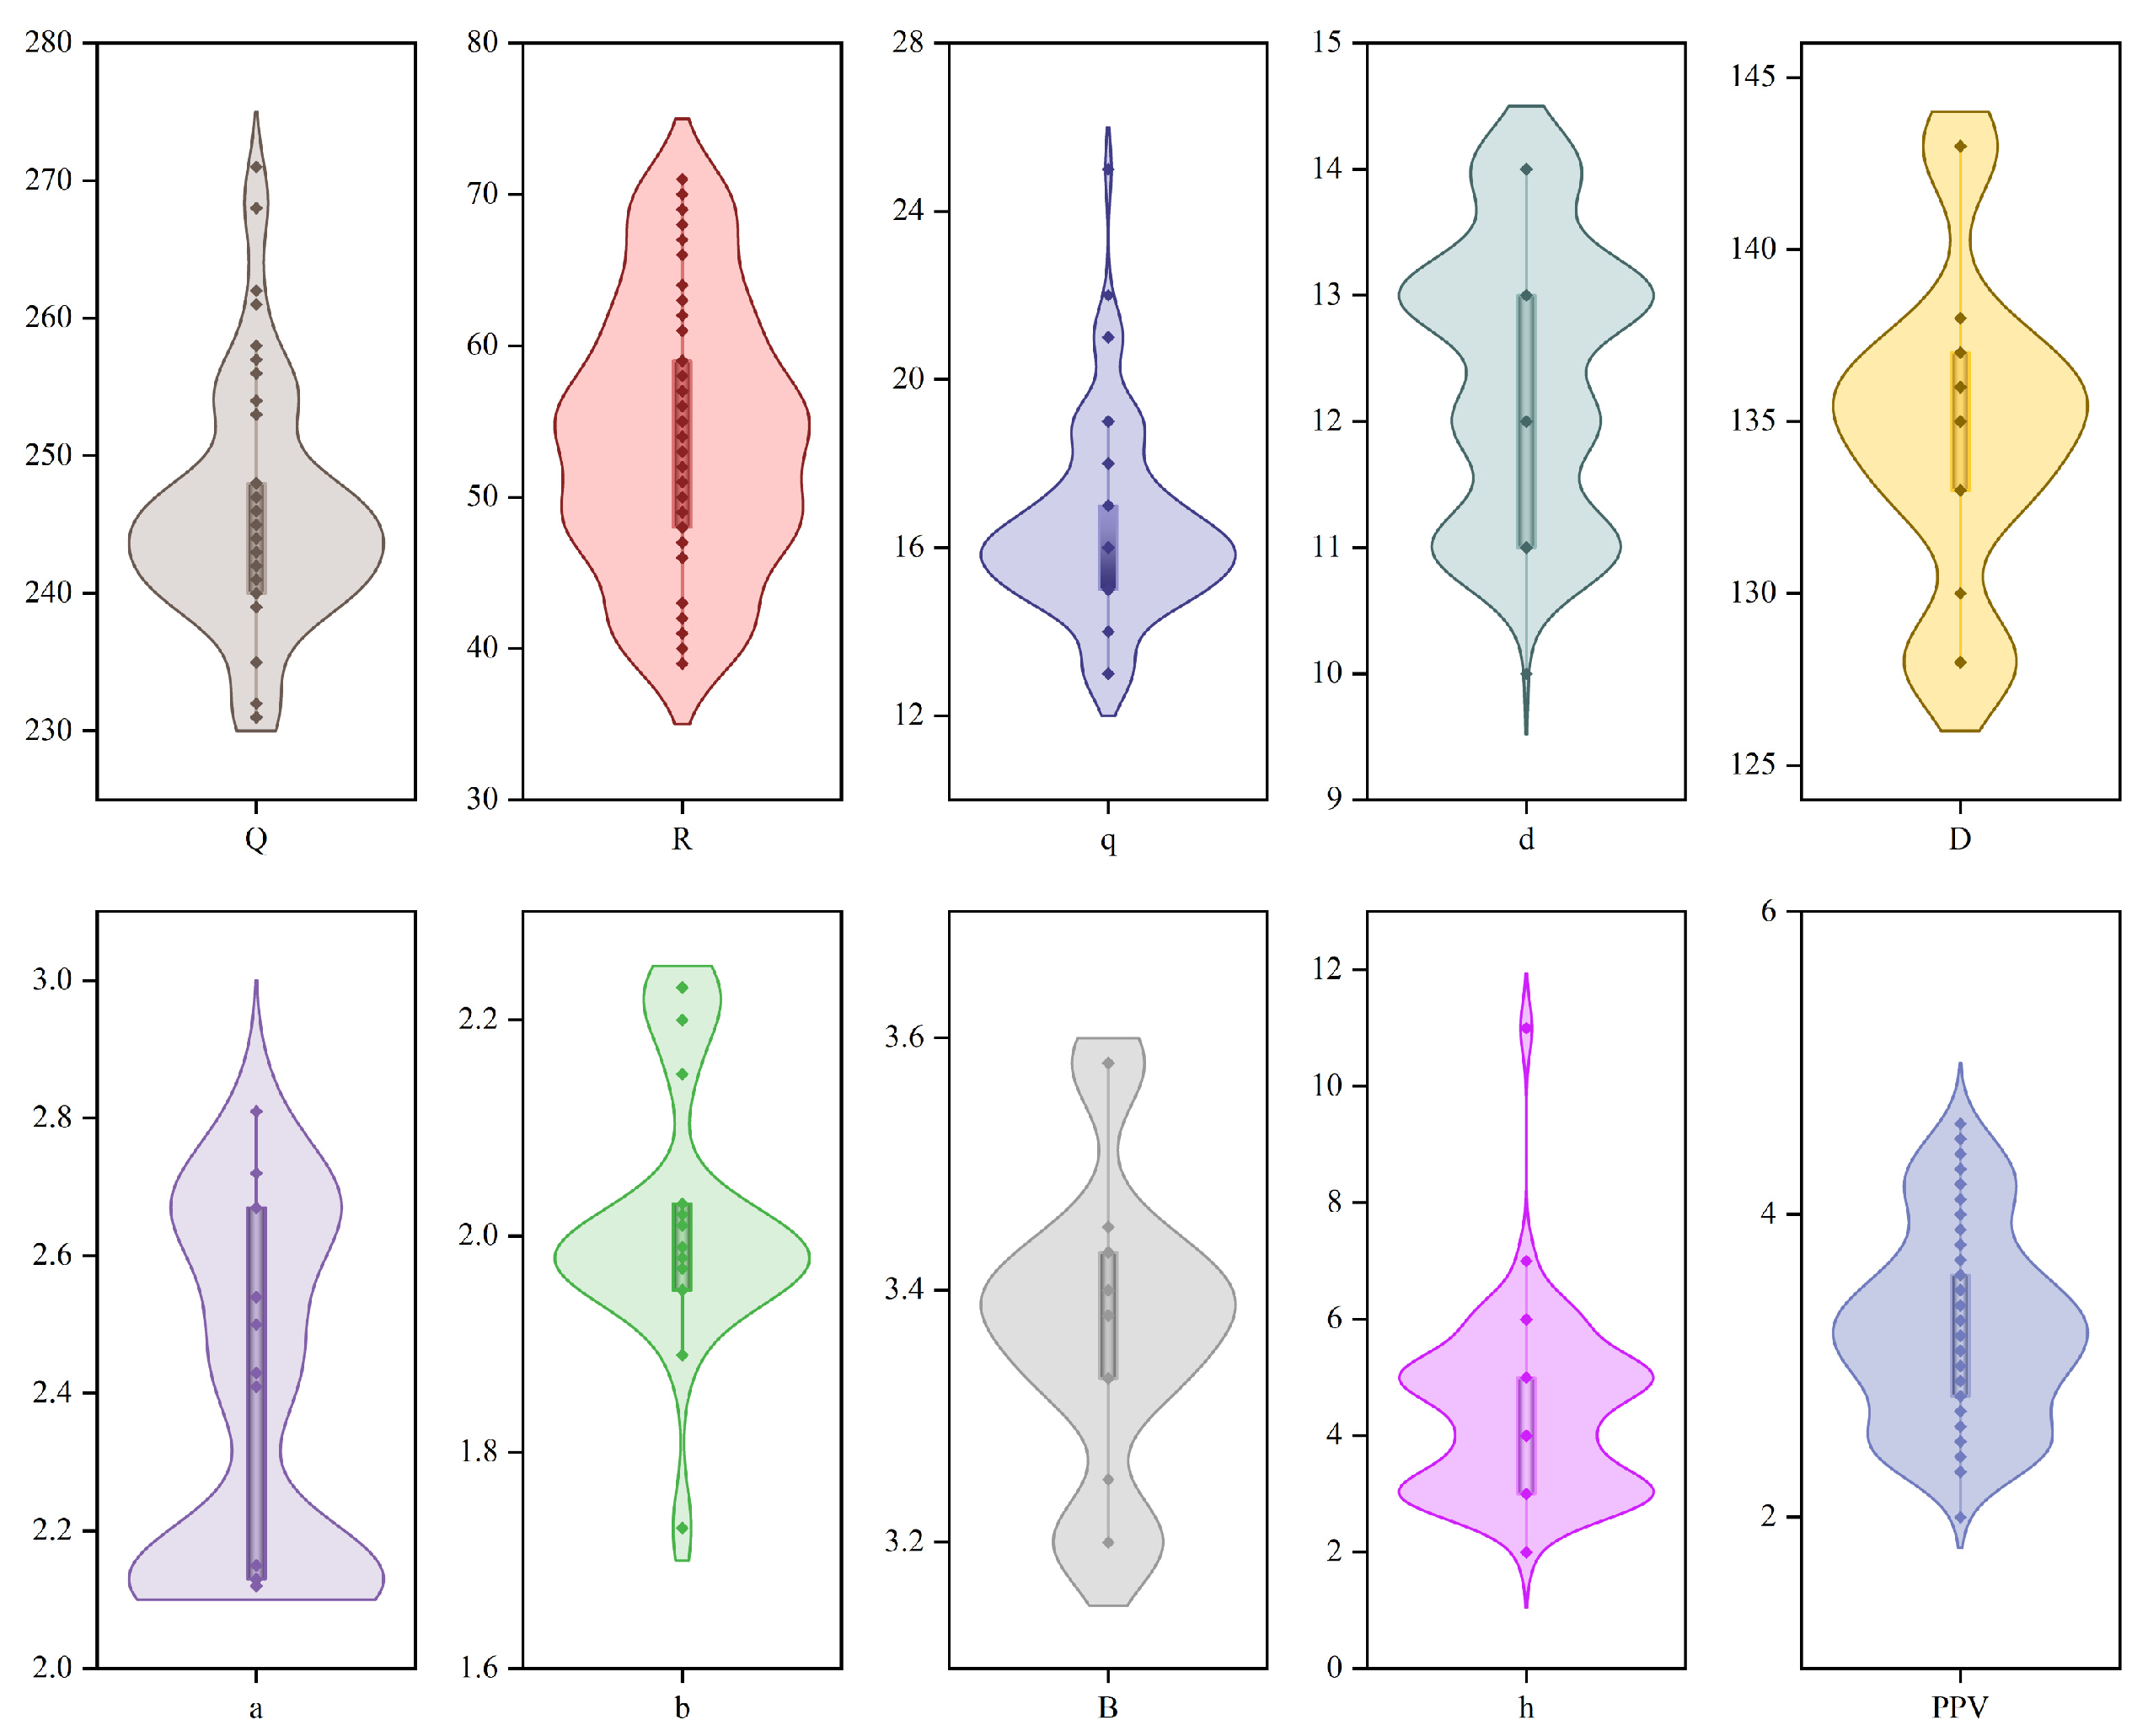
This study establishes an analytical dataset based on measured data from 193 field blasting operations. The distribution characteristics of the data are systematically represented using violin plots (Figure 3). The results show that the data exhibits a relatively uniform overall distribution, a phenomenon primarily attributable to the homogeneity of rock properties in the measurement area and the stable control of blasting operation parameters and construction outcomes. However, a small number of outliers still exist within the dataset, predominantly concentrated in the q and Q indicators, and they deviate significantly from the median level. The emergence of such outliers is mainly related to variations in explosive column structures within blast holes and fluctuations in drilling depths. These variations stem from human operational variability during charging and drilling activities. These data points were intentionally retained to reflect the authentic variability of field blasting operations, as the XGBoost algorithm possesses inherent robustness against outliers through its regularization mechanisms and tree-based structure.
Concurrently, differing blasting requirements across various production areas of the open-pit mine led to fluctuations in explosive consumption per blast, further contributing to the occurrence of outliers. The presence of these outliers not only reflects the complexity of actual blasting operations but also highlights the necessity of employing machine learning methods in this study. Such methods are capable of effectively modeling the complex nonlinear relationships between these outliers and PPV, thereby avoiding the limitations of traditional linear models in handling outliers.
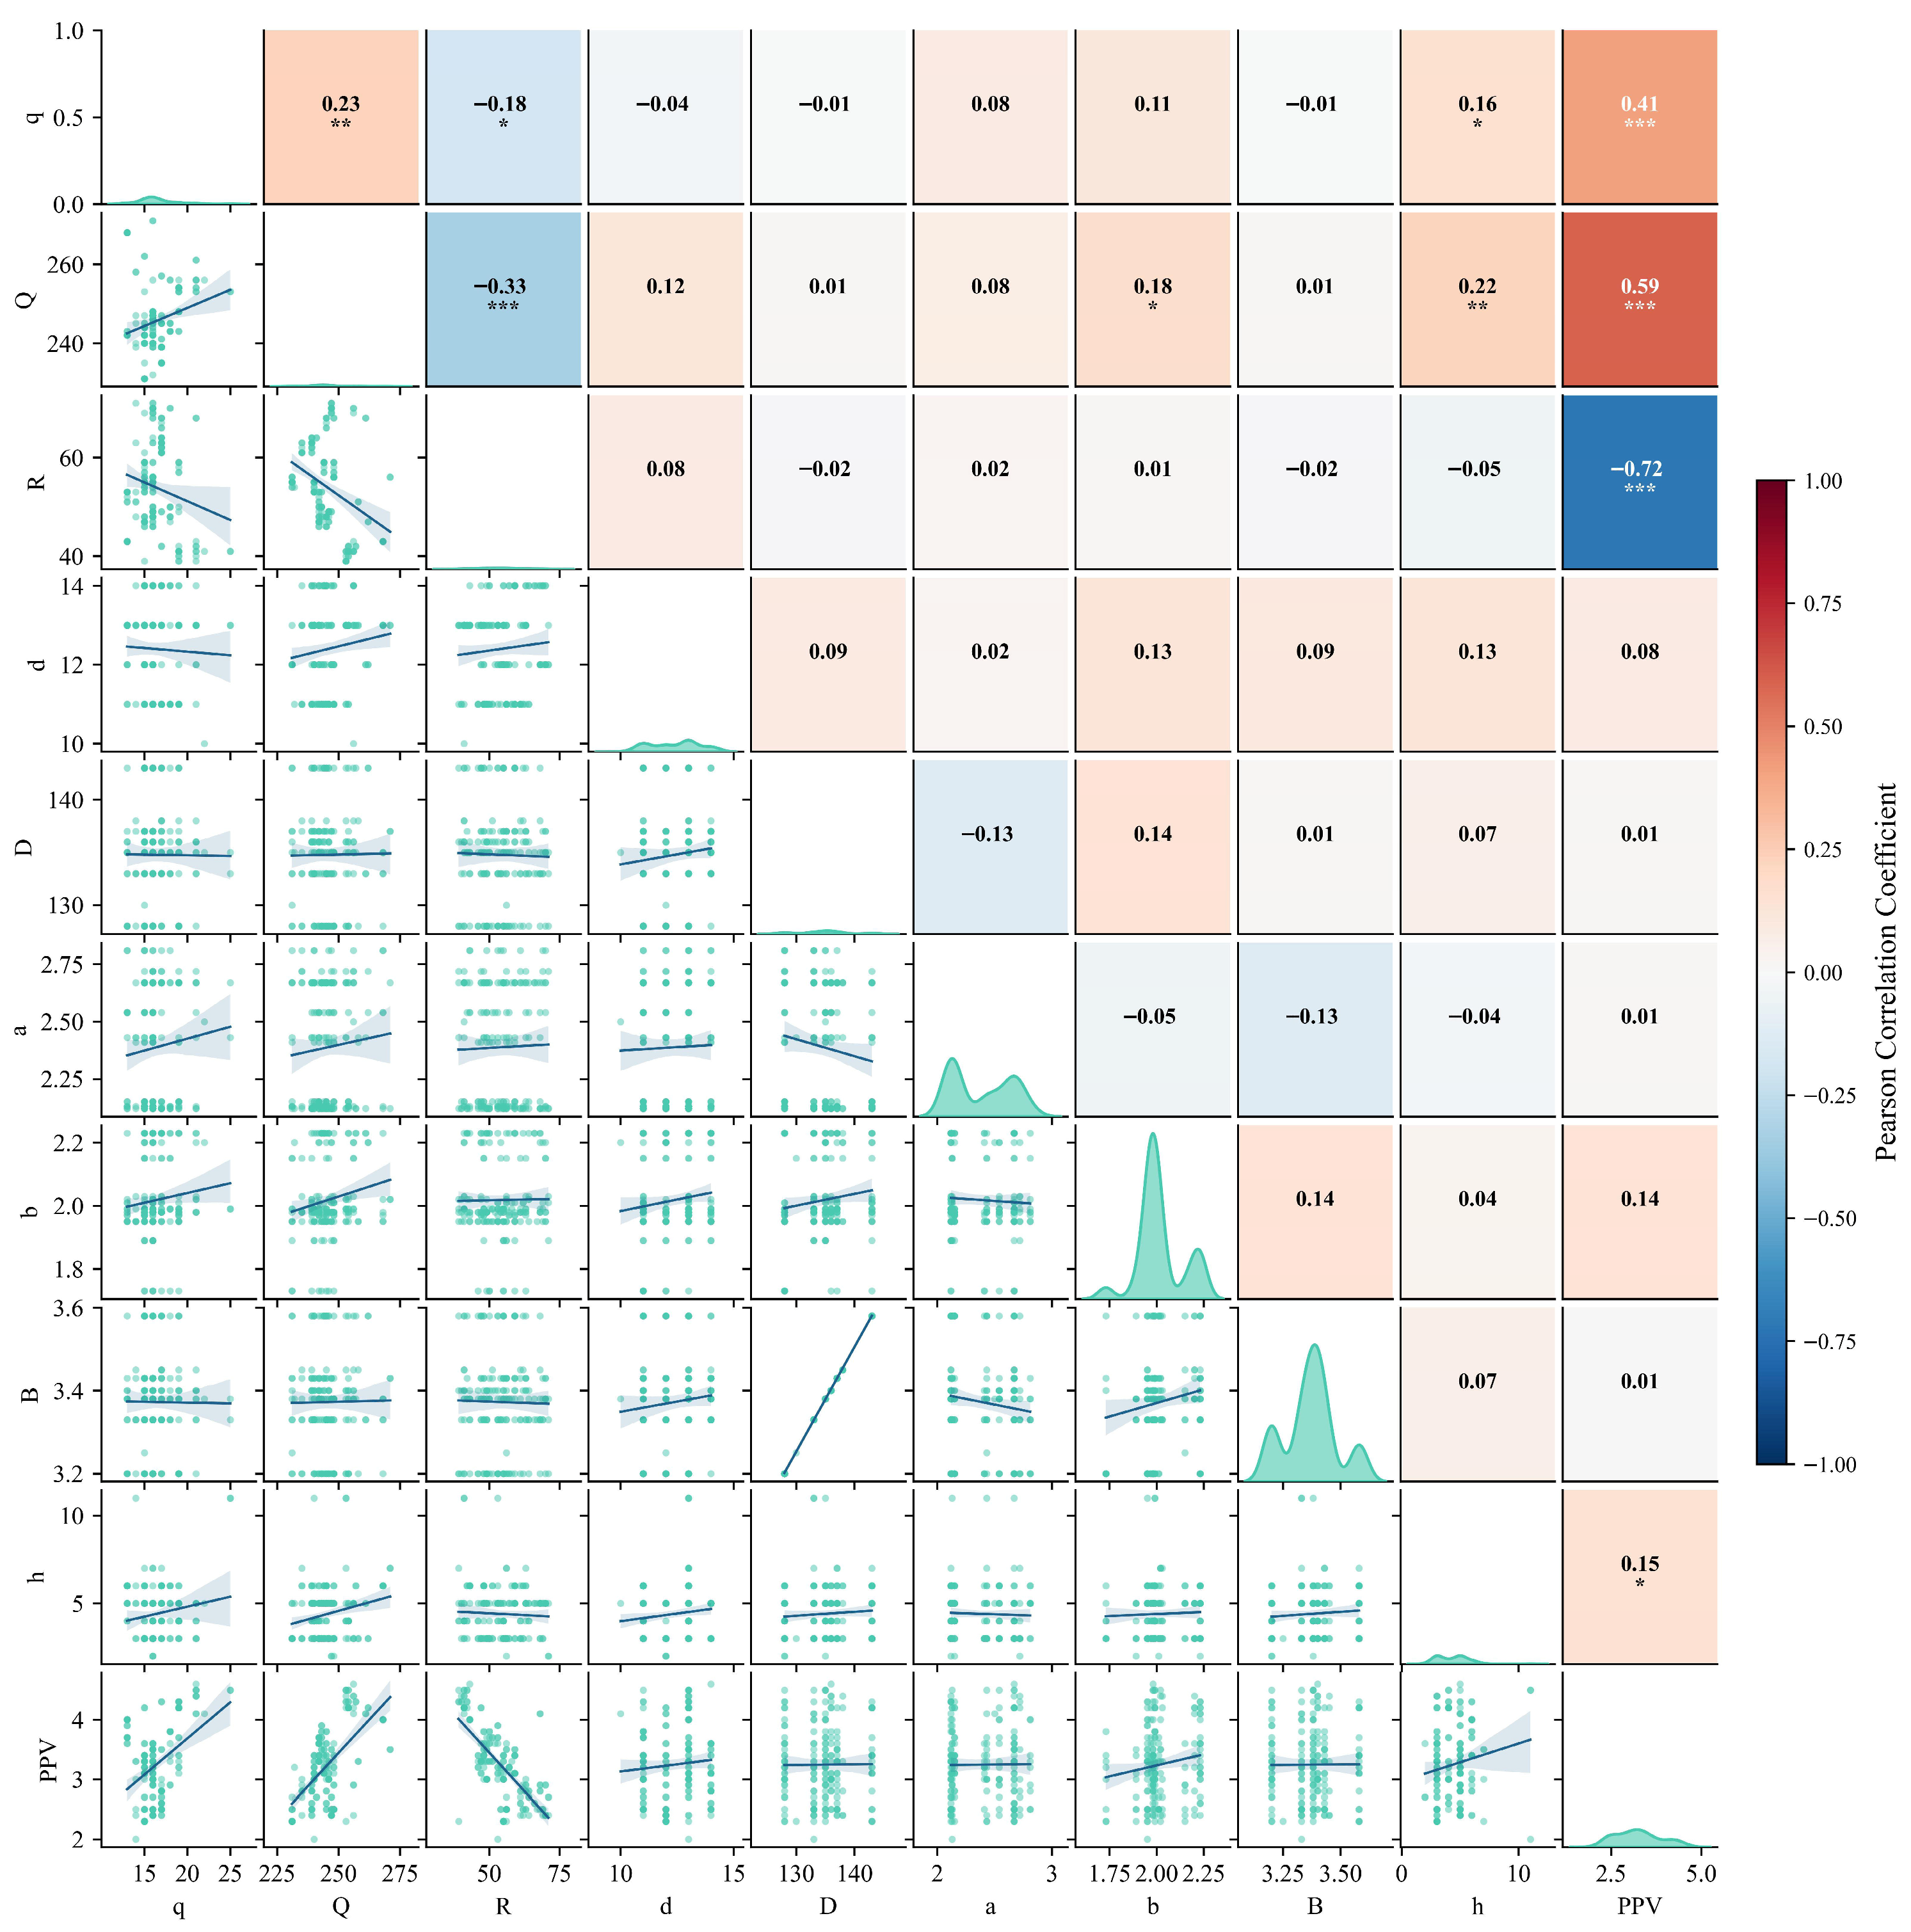
Figure 4 presents a correlation matrix heatmap for all variables in the dataset. The correlation analysis results reveal significant differential association characteristics among the variables: R shows a significant negative correlation with the PPV (r = −0.72), while both the q and the Q exhibit positive correlations with PPV (with correlation coefficients of r = 0.41 and r = 0.59, respectively). This indicates that an increase in charge weight significantly elevates blast vibration intensity. It is noteworthy that no high multicollinearity exists among all input variables. This outcome validates the reasonableness of the variable selection in this study. Simultaneously, it provides reliable data support for the subsequent feature engineering of machine learning models, laying a foundation for the models to accurately capture the intrinsic relationships between various influencing factors and PPV.
The dataset of 193 field records provides a sample-to-feature ratio exceeding 20:1 for the nine input variables, which is well above the recommended threshold for robust machine learning modeling. This sample size is consistent with established literature for site-specific blasting studies and ensures sufficient data density for the XGBoost algorithm to capture complex nonlinear relationships. The sufficiency of the sample size is further validated by the high predictive accuracy and stable convergence achieved on the independent test set, demonstrating that the information provided is adequate for effective generalization without overfitting.

3. Methodology

3.1. Extreme Gradient Boosting (XGBoost)

It should provide a concise and precise description of the experimental results, their interpretation, as well as the experimental conclusions that can be drawn.
Extreme Gradient Boosting (XGBoost) is a highly efficient machine learning algorithm based on a boosting integrated learning framework of decision trees. It has been widely applied in numerous engineering and data mining tasks such as classification and regression, owing to its powerful nonlinear fitting capabilities and numerical stability [25]. Its core building block is the decision tree model, which offers significant advantages: low computational complexity, enabling rapid training and prediction with limited computing resources; intuitive and easily interpretable outputs, facilitating engineers’ understanding of the model’s decision logic; inherent tolerance to missing values in data, allowing adaptation to incomplete datasets common in practical engineering without complex preprocessing steps; and the ability to automatically filter irrelevant features, reducing interference from redundant information on model performance. These characteristics provide an efficient foundation for modeling in subsequent complex scenarios [26].
The core innovation of the XGBoost algorithm lies in achieving a balance between model fitting capability and generalization performance by constructing an objective function that includes a regularization term. Its prediction process is realized by aggregating the outputs of multiple decision trees, mathematically expressed as in Equation (1):
O b j ( r ) = i = 1 m L ( y i , y ^ i ( r ) ) + k = 1 r Ω ( g r ) ,
where yi denotes the measured value. y ^ i ( r ) represents the prediction result after the r-th iteration, and gr denotes the function corresponding to the decision tree added in that iteration. The objective function for training is given by Equation (2):
Ω ( g r ) = γ T + 1 2 λ j T w 2 .
In this equation, T represents the number of leaf nodes in the decision tree, w denotes the weight of the j-th leaf node, and λ and γ are regularization coefficients with typical default values of λ = 1 and γ = 0.
For nonlinear regression tasks such as PPV prediction, the performance of the XGBoost model is highly dependent on the appropriate configuration of its key parameters [27]. Among these, three core parameters have a decisive impact on prediction accuracy and computational efficiency, with their specific characteristics summarized in Table 2. The selection of num_trees, max_depth, and eta as the primary hyperparameters for optimization is based on their decisive influence on the balance between the learning capacity and generalization performance of the model. While other parameters can influence results, these three core parameters typically provide the most significant improvements in predictive accuracy for nonlinear regression tasks while maintaining computational efficiency.
In traditional applications, parameters are often adjusted based on manual experience to optimize model fitting. However, this approach has significant limitations. On one hand, manual parameter tuning is prone to introducing subjective bias and often fails to comprehensively explore the parameter space, potentially leading the model to converge to a local rather than a global optimum. On the other hand, the coupled effects between parameters further increase the difficulty of tuning, making it challenging to balance prediction accuracy with computational efficiency. This underscores the necessity for subsequently introducing intelligent optimization algorithms to perform precise parameter optimization for XGBoost.

3.2. Centered Collision Optimizer (CCO)

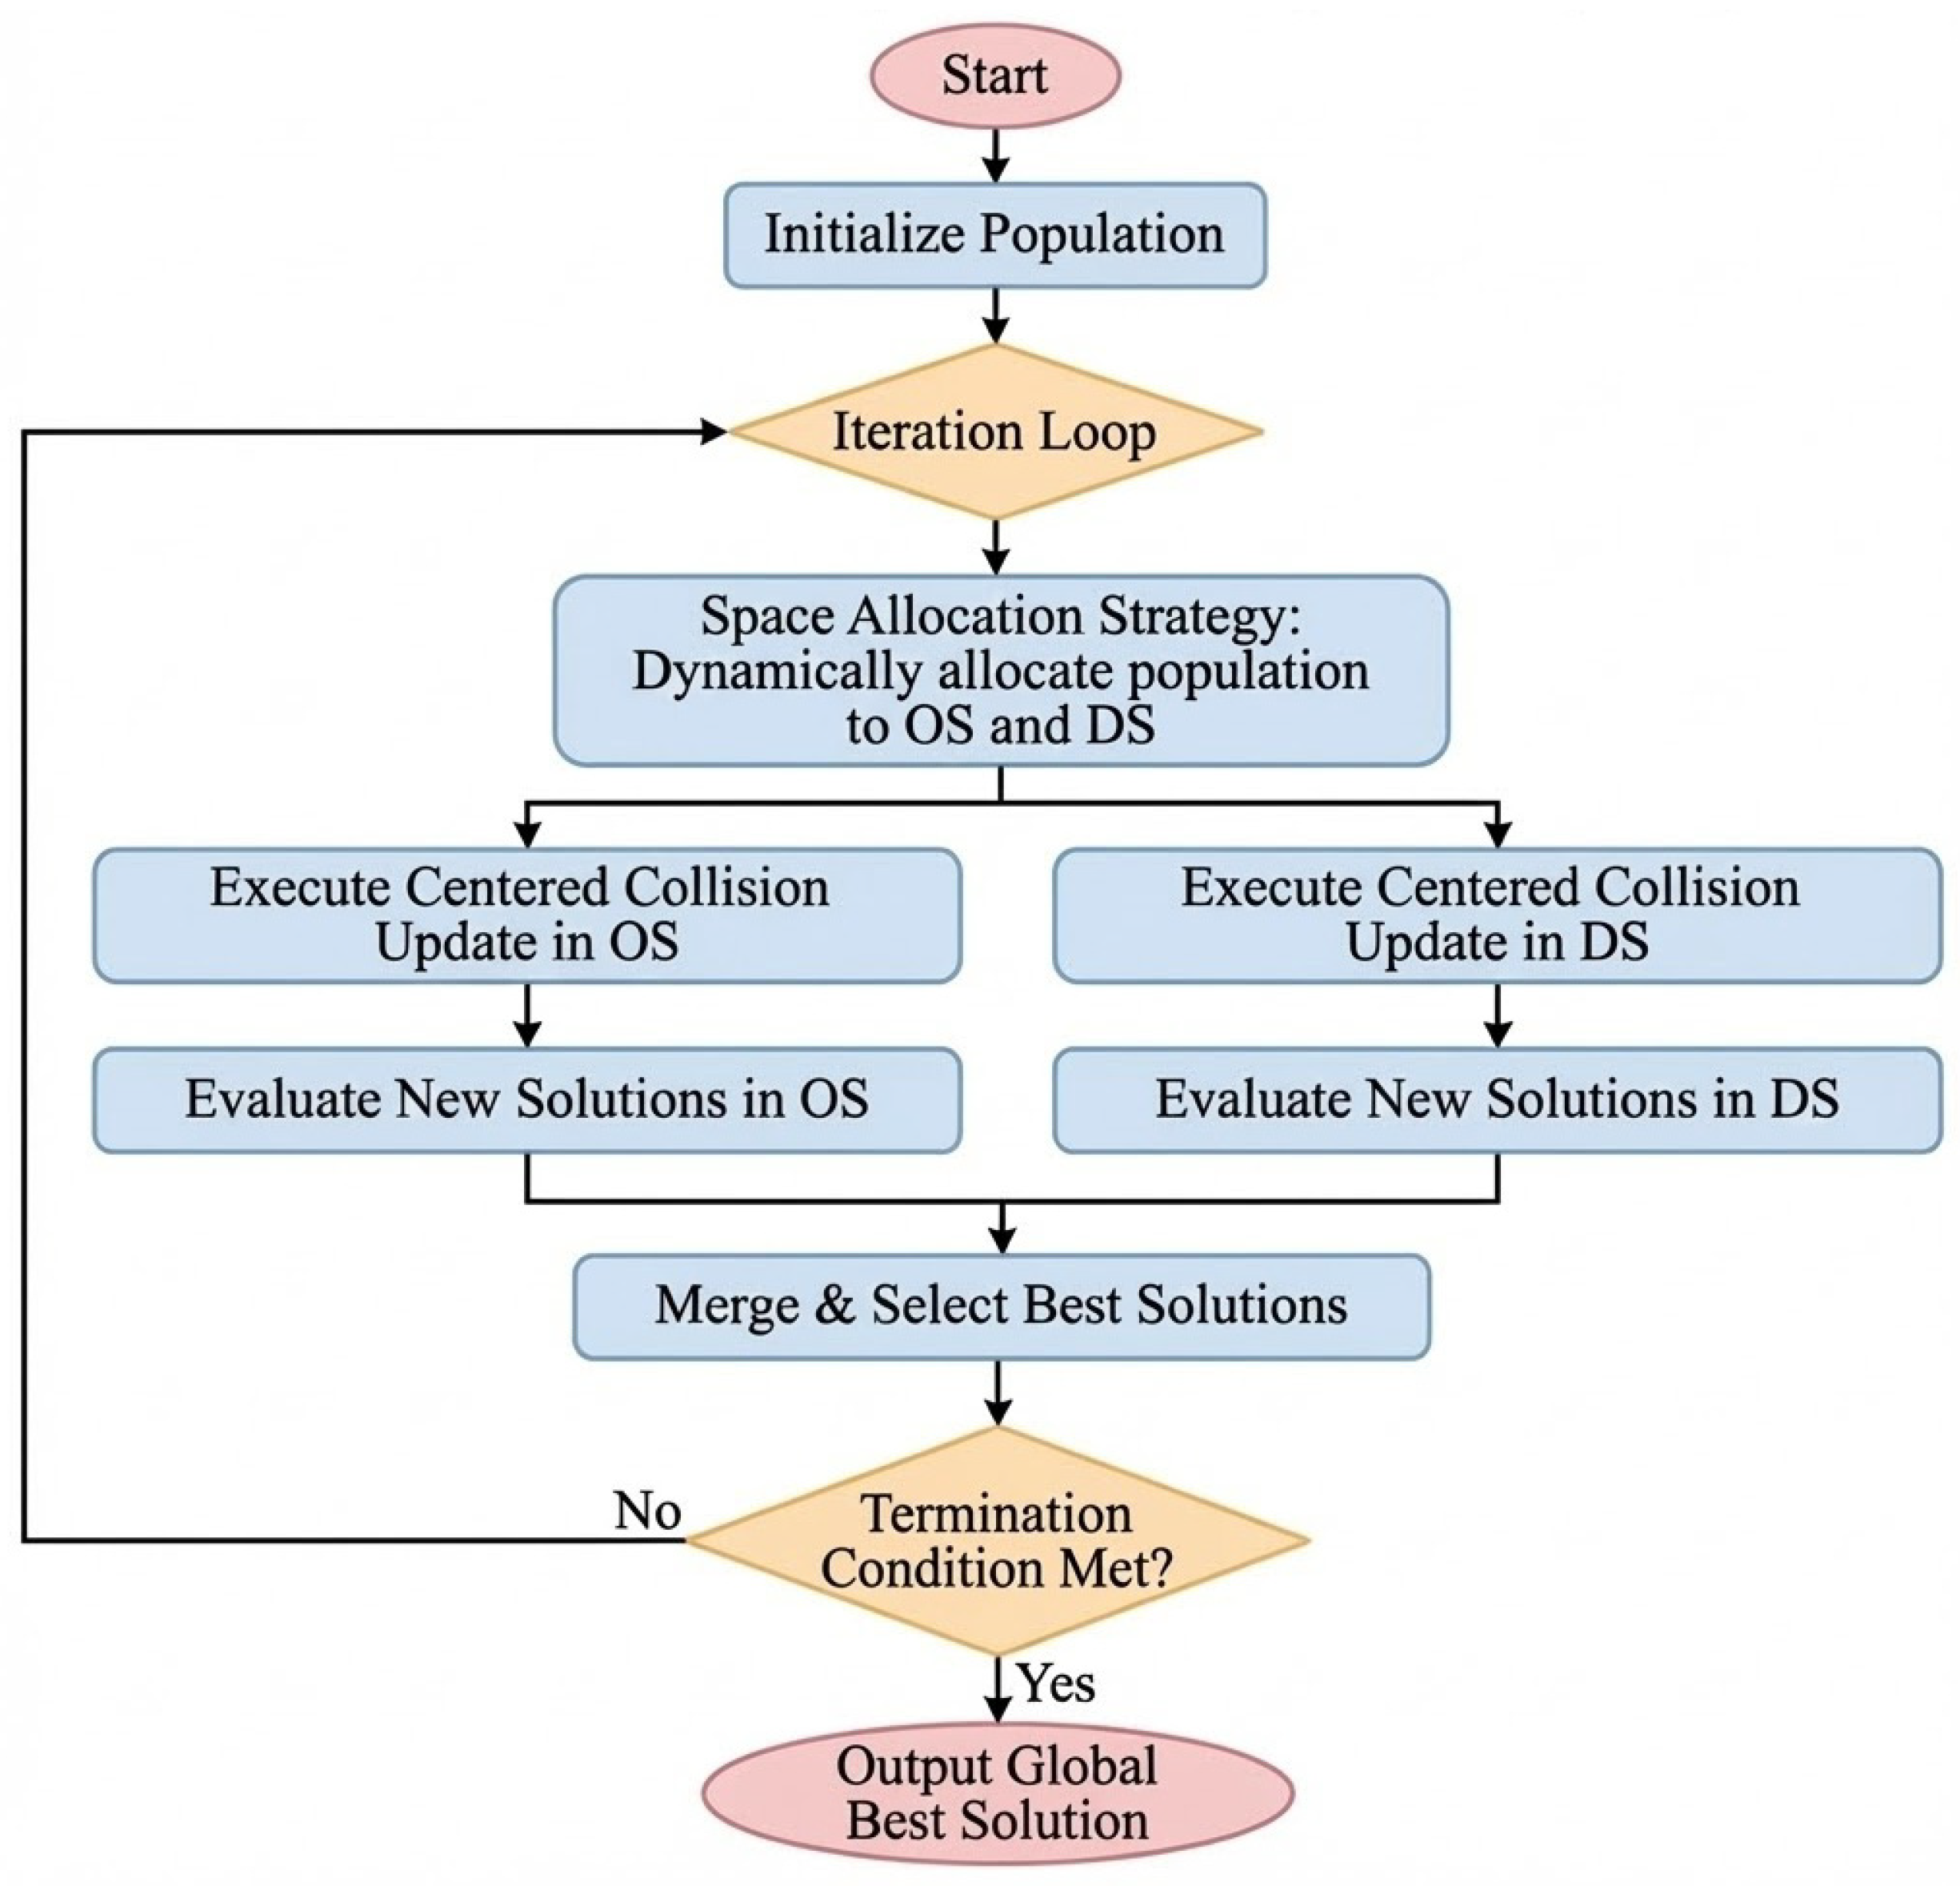
To mitigate the subjective bias inherent in the manual selection of XGBoost parameters described above, optimization algorithms are further introduced for parameter tuning. The Centered Collision Optimizer (CCO) is a novel meta-heuristic optimization algorithm [28]. Inspired by the dynamics equations of head-on collisions in classical physics, it employs a unified centered collision strategy, significantly enhancing global search capability and the ability to escape local optima. The detailed logical sequence and operational steps of the CCO algorithm, from initialization to the final output of optimal parameters, are systematically illustrated in the flowchart of Figure 5.
Its core principle is primarily based on three innovative strategies: the Unified Centered Collision Strategy, Decoupled Space Search, and Dynamic Space Allocation. In the centered collision strategy, the algorithm simulates the process where individuals collide with a central individual possessing superior fitness. Its position update formula integrates mechanisms from both completely elastic and completely inelastic collisions. A parameter that dynamically adjusts with the iteration count governs the selection of collision type, thereby guiding population evolution. To overcome the issue of premature convergence caused by high correlations among variables in the original search space, CCO introduces Decorrelation Space (DS) Search. This step involves performing eigenvalue decomposition on the covariance matrix of a subset of individuals to construct an orthogonal basis space. Position updates are then executed within this space to enhance the algorithm’s exploration capability. Finally, the algorithm employs a Dynamic Space Allocation strategy. This strategy adaptively adjusts the number of individuals allocated to the original space (OS) versus the DS based on the proportion of successful iterations that generated better solutions in each space during the optimization process, thereby efficiently distributing computational resources.

3.3. Prediction Evaluation Metrics

To comprehensively and objectively quantify the prediction accuracy, fitting performance, and generalization capability of the developed PPV prediction model, and to avoid a one-sided assessment of model performance based on a single metric, this study establishes a multi-dimensional evaluation framework. This framework incorporates the coefficient of determination (R2), root mean square error (RMSE), variance accounted for (VAF), and mean absolute error (MAE). It is designed not only to precisely characterize the numerical discrepancies between the predicted PPV values and the field-measured data but also to effectively reflect the model’s capability in fitting the high-dimensional nonlinear PPV data and the characteristics of its error distribution. This system provides quantitative feedback for hyperparameter optimization during the model training process and simultaneously establishes a unified standard for comparing the performance of different prediction models [29]. The corresponding computational formulas are given in Equations (3)–(6):
R 2 = 1 i = 1 N y i y i 2 / i = 1 N y i y ¯ i 2 ,
R M S E = i = 1 N y i y i 2 / N ,
V A F = 1 v a r y i y i / v a r y i × 100 % ,
M A E = i = 1 N y i y i / N ,
where y i is the w value, y i is the predicted PPV value of the model, y ¯ i is the average of the PPV values, and N denotes the number of samples in the training or testing stages.

3.4. SHAP Analysis

Machine learning models have achieved significant improvements in prediction accuracy when addressing complex nonlinear regression problems such as PPV prediction, owing to their powerful feature-fitting capabilities. However, these models are fundamentally black-box in nature. Their prediction processes rely on intricate internal feature interactions and weight allocations, making it difficult to intuitively reveal the intrinsic relationship mechanism between each input parameter and the final PPV prediction result [30]. These characteristic limits the practical application value of machine learning models in blasting engineering. Engineering technicians cannot use the model to clearly identify which parameters are the core factors influencing blast vibration, nor can they precisely quantify the impact of parameter adjustments on PPV. Consequently, the optimization of blasting parameters and vibration control lacks targeted scientific guidance. Therefore, conducting systematic sensitivity analysis to address the interpretability challenge of black-box models becomes an indispensable and critical component of this study.
Traditional sensitivity analysis methods, such as correlation analysis and the single-factor variable method, suffer from significant limitations. Correlation analysis can only reflect linear relationships between variables, failing to capture complex nonlinear interaction effects. The single-factor variable method requires fixing other parameters, which struggles to simulate real-world scenarios involving the coupled effects of multiple parameters in blasting, and it easily overlooks synergistic interactions between parameters. To overcome these shortcomings, this study introduces the Shapley additive explanations (SHAP) interpretability method based on Shapley value theory [31]. This method possesses three core advantages: First, rooted in the Shapley value from cooperative game theory, it can fairly and reasonably quantify the contribution of each feature to the prediction result, avoiding subjective bias. Second, it supports both global and local interpretation, enabling the identification of key influencing factors at an overall level while also dissecting the mechanism of each feature’s role within individual samples. Third, it is compatible with complex ensemble models, effectively capturing nonlinear interactions and threshold effects among features, which perfectly aligns with the predictive characteristics of the CCO–XGBoost model. The SHAP values are computed based on the Shapley value concept from cooperative game theory, as formally defined in Equation (7):
Φ i = S N \ i S ! ( N S 1 ) ! N ! q S i x S U i q S x S ,
where Φ i represents the importance of the i-th feature, N denotes the set of all features in the dataset, S represents a subset of N excluding the index i, denotes the input features in set S, and q indicates the marginal contribution function for the feature.

3.5. Research Workflow

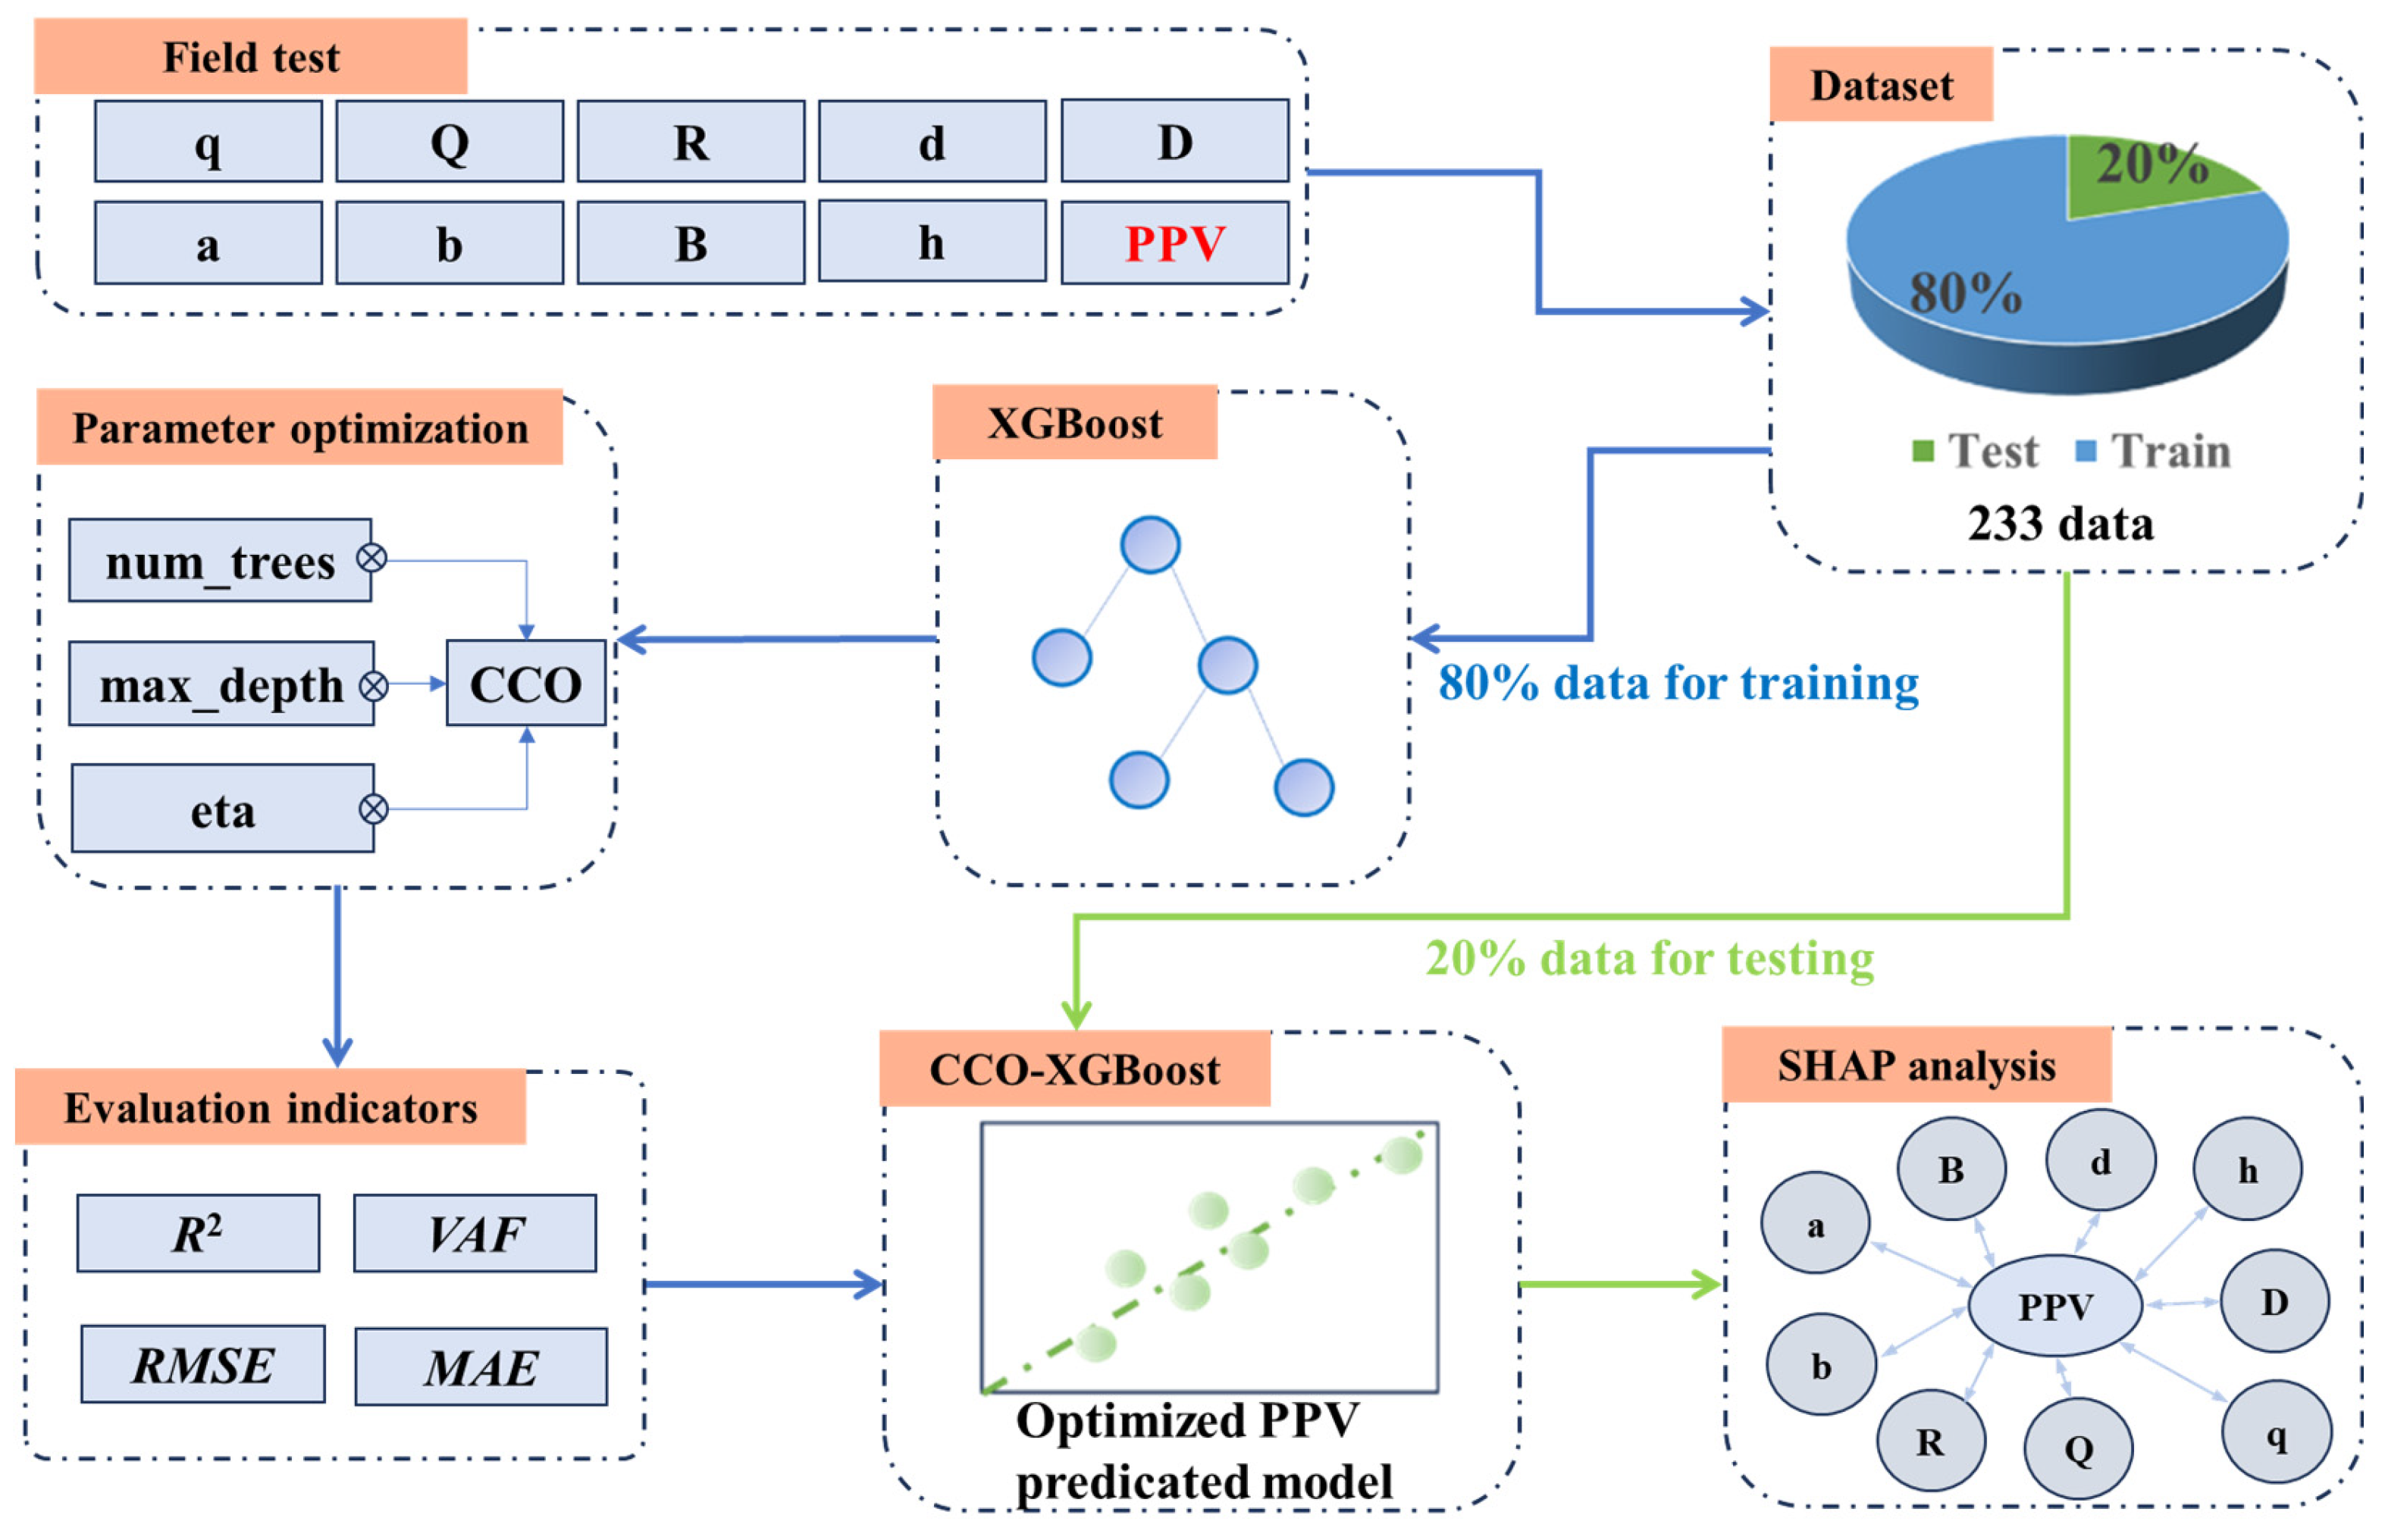
Building upon the aforementioned analytical methods, and in order to obtain more reasonable prediction results, the optimization principles of the CCO algorithm were integrated to optimize the parameter values of XGBoost (Table 1). This process established the CCO–XGBoost algorithm, the specific implementation flow of which is illustrated in Figure 6. The detailed procedure is as follows:
(1)
The input data for the algorithm consist of a dataset of 193 field-measured records from open-pit mine blasting operations. The dataset is partitioned into a training set (80%) and a test set (20%) to ensure a balanced distribution between model learning and independent validation. This ratio is a standard convention for datasets of this scale to provide sufficient training samples while maintaining a statistically representative testing set. To mitigate potential bias from a single random split, a cross-validation mechanism is integrated within the CCO process to ensure the robustness of the results.
(2)
A fitness function for XGBoost parameter optimization is constructed. The cross-validated score of the prediction model under different optimization iterations serves as the fitness evaluation metric for optimization. The CCO algorithm performs iterative optimization for the selection of optimal XGBoost parameters and evaluates the fitness of the selected parameter sets. The optimal parameters are output once the iteration termination criteria are met.
(3)
When the CCO algorithm satisfies its convergence criteria, it outputs the parameter combination with the highest fitness value from the current population, which represents the optimal hyperparameters for XGBoost. These optimal parameters are then assigned to the XGBoost model, constructing the final CCO–XGBoost hybrid prediction model. Subsequently, the nine input parameters from the test set are fed into this model to output the corresponding PPV predictions.
(4)
The optimized CCO–XGBoost model serves as the core foundational model for the subsequent SHAP sensitivity analysis. As this model has undergone global optimization via CCO, it possesses characteristics of high accuracy, low error, and strong stability. It can accurately capture the complex nonlinear relationship between the input parameters and PPV, thereby ensuring the reliability of feature contribution calculations and mechanistic analysis within the SHAP framework. This approach avoids potential misinterpretation of parameter influence patterns due to inherent model biases.

4. Results

4.1. Parameter Optimization Results

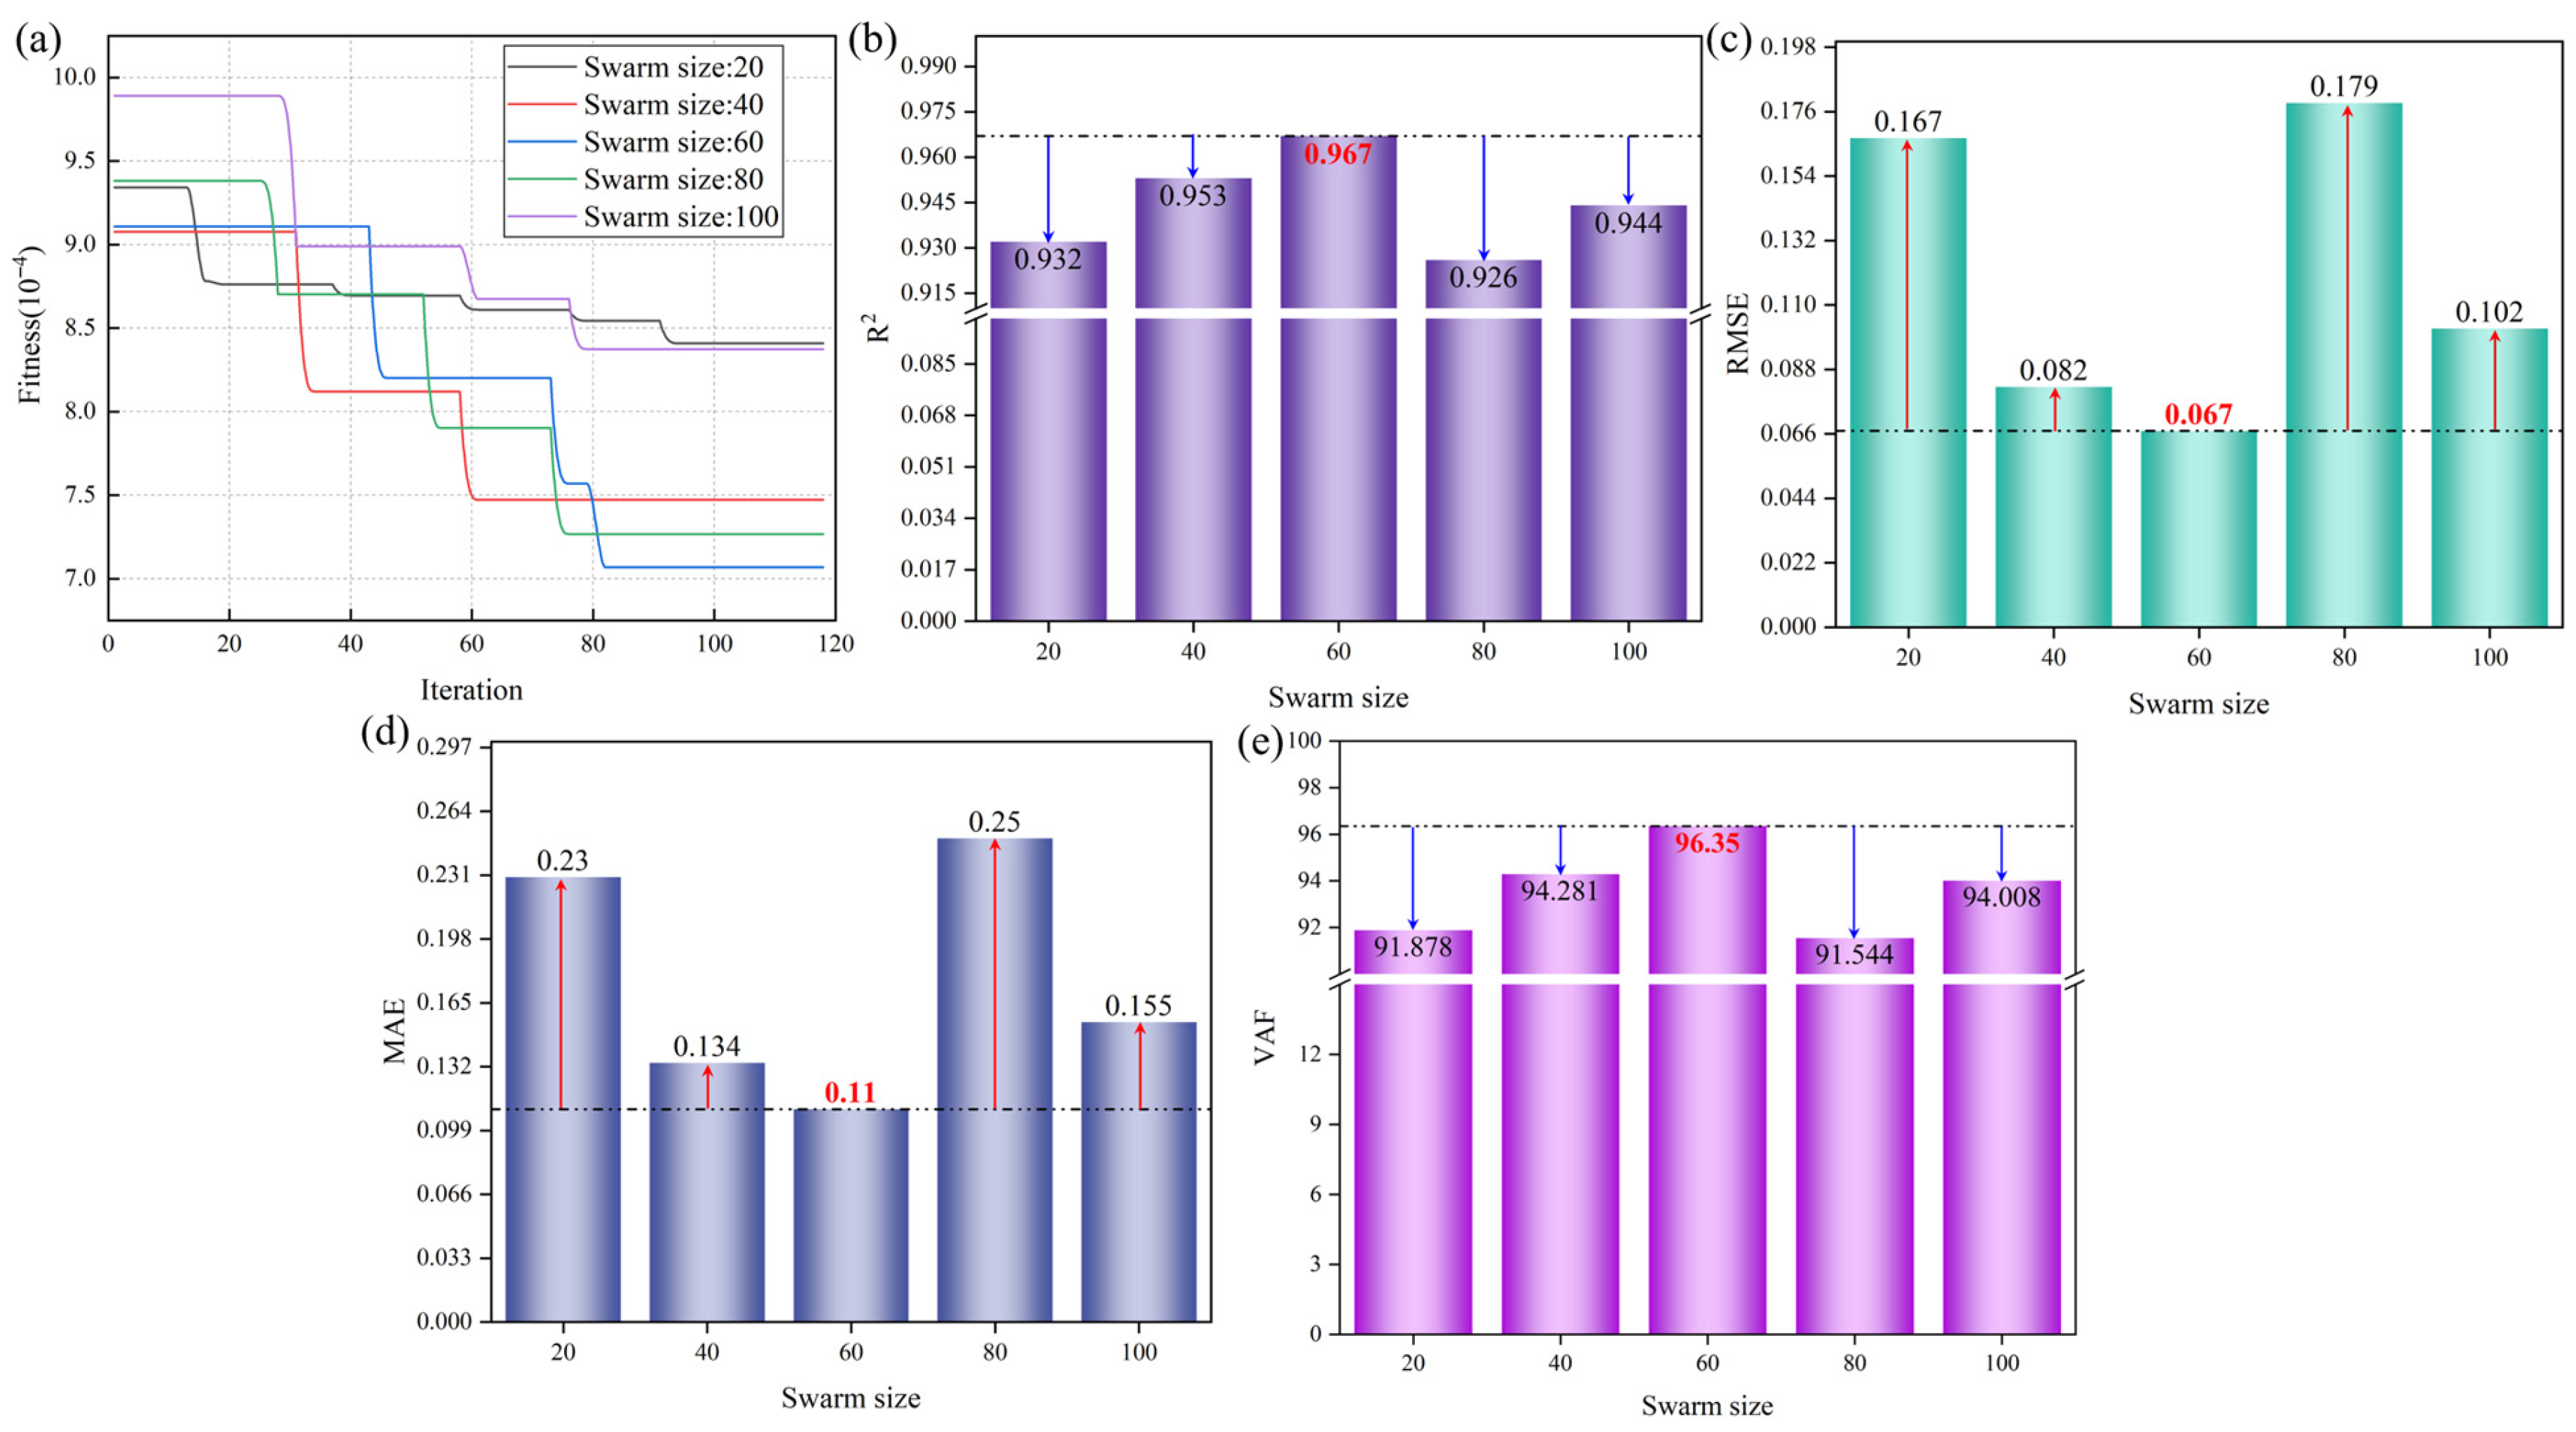
Parameter optimization constitutes the core phase in constructing the CCO–XGBoost hybrid model. Its objective is to achieve precise tuning of key XGBoost parameters (num_trees, max_depth, eta) by determining the optimal population size for the CCO algorithm, thereby establishing a sound balance among the model fitting accuracy, generalization capability, and computational efficiency. During the optimization process, the population size dictates the breadth and precision of the search, with optimization effectiveness varying under different settings; a population size within the range of 20 to 100 is typically recommended [32]. This study selected five configurations: 20, 40, 60, 80, and 100. With the iteration count fixed at 120, the CCO algorithm was employed to optimize and evaluate the PPV prediction performance of the XGBoost model under different parameter combinations. The results are presented in Figure 7.
The testing of swarm sizes from 20 to 100 was conducted to ensure a comprehensive search of the parameter space while maintaining computational efficiency. The iteration number was fixed at 120 because preliminary experimental results indicated that the fitness curves for all swarm sizes consistently reached a stable plateau before this limit, signifying that the global optimum had been successfully captured.
Figure 7a displays the fitness iteration curves of the CCO algorithm under different population sizes. It can be observed that the fitness values consistently decrease with increasing iterations across all configurations, stabilizing after approximately the 80th iteration without significant fluctuations or rebounds. This indicates that the CCO algorithm possesses good convergence and stability, effectively guiding the population towards the optimal solution region. Among the configurations, a population size of 60 yielded the lowest final fitness value, reaching 7.1 × 10⁻⁴, which is superior to other settings and demonstrates stronger optimization capability.
Figure 7b–e compares the key evaluation metrics (R2, MAE, RMSE, VAF) of the CCO–XGBoost model under different population sizes, respectively. The results show that with a population size of 60, R2 reaches its maximum value of 0.967, significantly higher than other configurations (the R2 values for population sizes 20, 40, 80, and 100 are 0.932, 0.945, 0.953, and 0.944, respectively). Concurrently, this configuration achieves the lowest MAE (0.067) and RMSE (0.110), representing optimal error control performance. In contrast, population size 20 exhibits the highest MAE (0.102) and RMSE (0.154), reflecting prediction bias due to insufficient search. Furthermore, the VAF metric reaches 96.35 for a population size of 60, substantially higher than that for population sizes 20 (91.878) and 100 (94.008), indicating that the model under this configuration has the strongest explanatory power for the variability in the measured data. In summary, a population size of 60 achieves the best balance among fitting accuracy, error suppression, and generalization performance.
Based on the experimental results above, the optimal XGBoost parameters identified by the CCO algorithm with a population size of 60 are presented in Table 3. Among them, the optimal value for num_trees is 9995, ensuring the model possesses sufficient learning capacity to capture complex feature patterns; max_depth is optimized to 5, effectively limiting the depth of individual trees to prevent overfitting; the optimal value for eta is 0.0956, which balances the convergence speed of the training process with the precision of the final solution, thereby achieving robustness in dynamic parameter tuning.

4.2. Comparison Analysis of Prediction Results

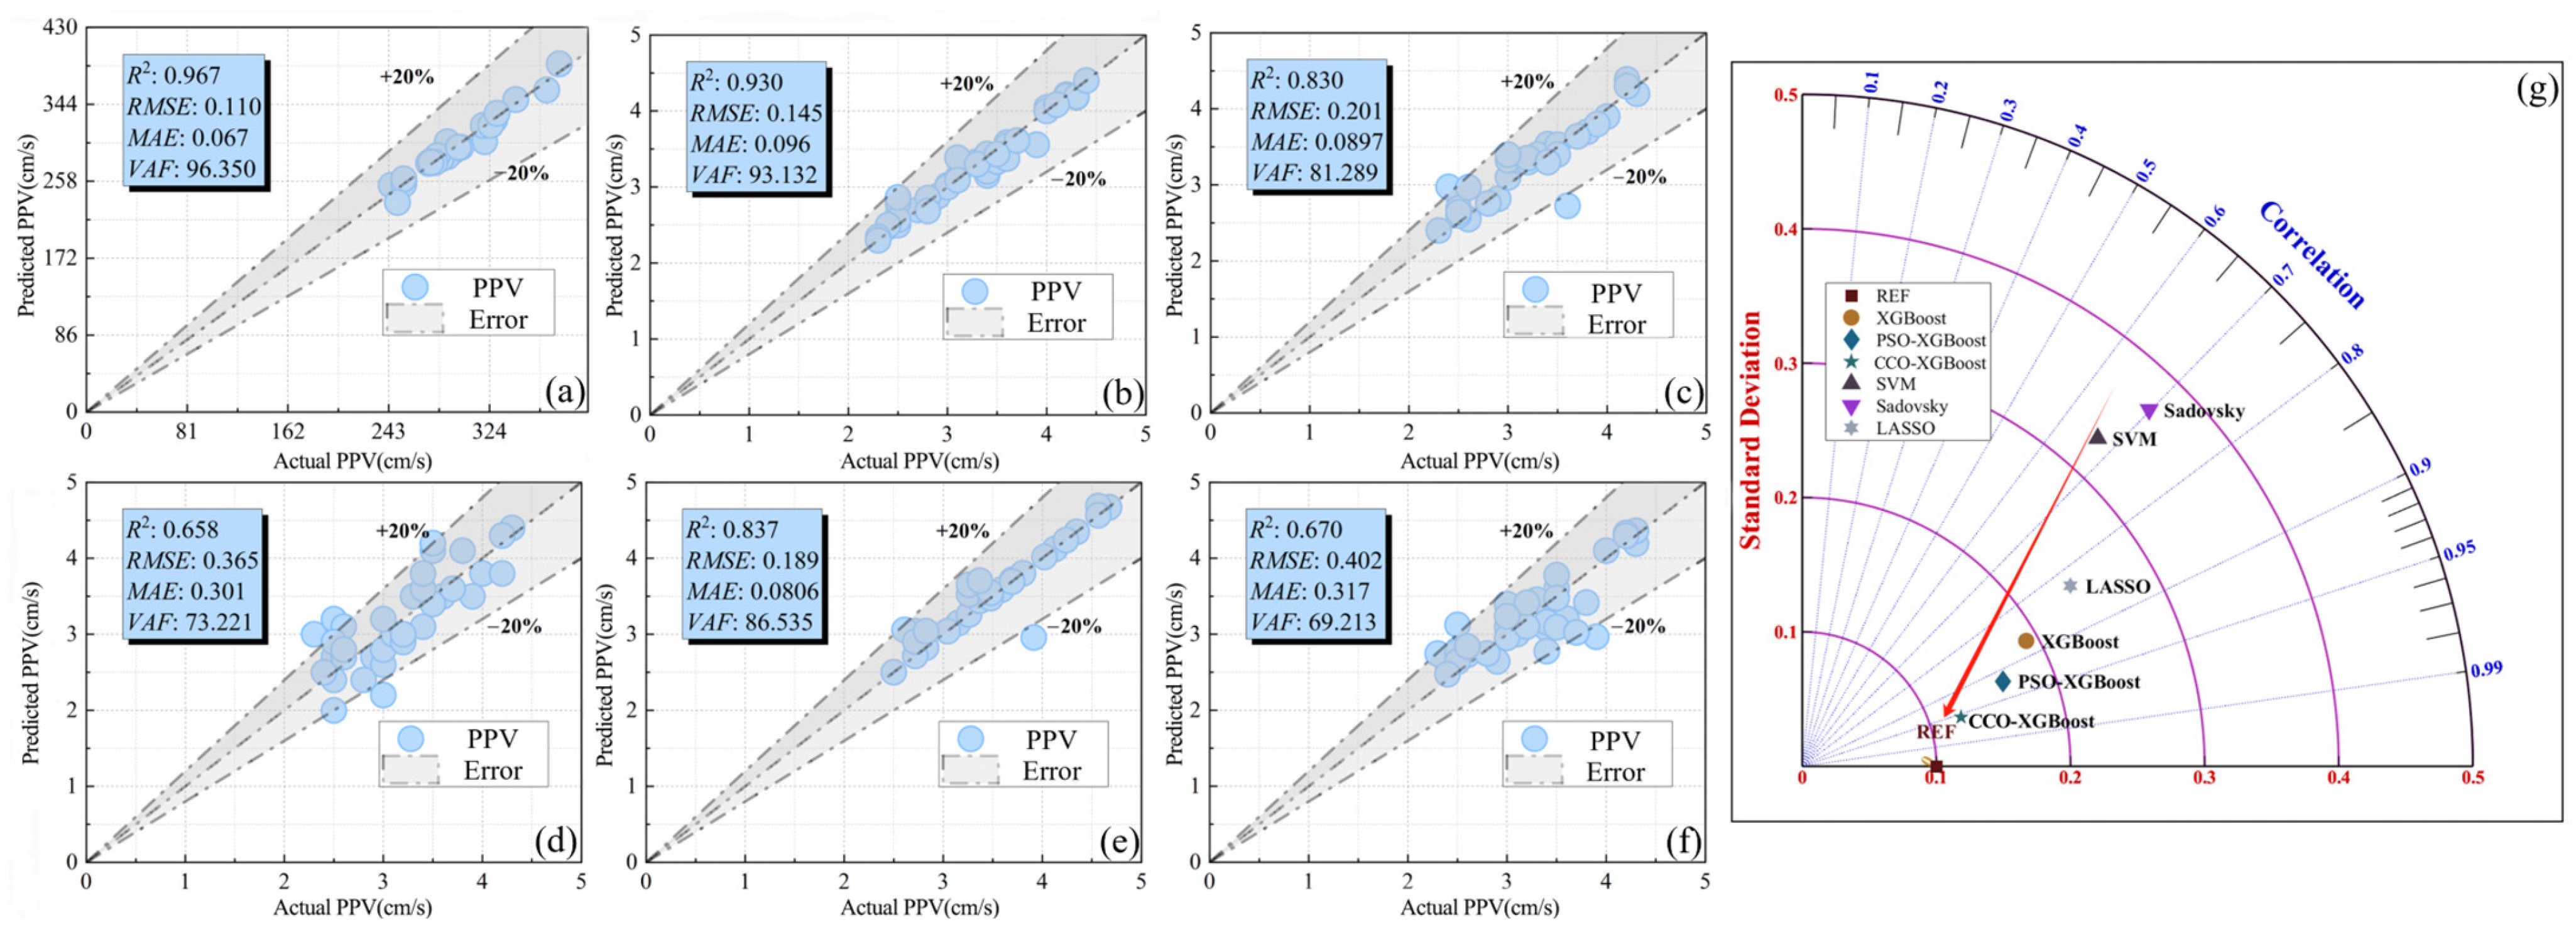
The prediction results for PPV were validated using the test set data. A comparative analysis of prediction performance and evaluation metrics was conducted between the optimal prediction results from the aforementioned optimized CCO–XGBoost model, the Sadovsky formula, the XGBoost model, the PSO-XGBoost model, and other commonly used regression machine learning algorithms (SVM, LASSO), as illustrated in Figure 8. To ensure a fair and consistent comparison, all benchmark models were subjected to rigorous hyperparameter optimization. Specifically, the parameters for SVM and LASSO were tuned using a five-fold cross-validated grid search, while the PSO-XGBoost model was configured with the same population size and iteration limits as the CCO algorithm to maintain a level playing field for all optimization-based methods.
It can be observed that predicted values align more closely with the 1:1 reference line, indicating smaller deviations between predicted and measured values. Overall, the CCO–XGBoost model demonstrates superior performance across all evaluation metrics compared to other machine learning models and empirical formula calculations (Figure 8a). Specifically, its R2 reaches 0.967, the highest value among all models, indicating an extremely strong correlation between its predicted PPV data and the measured values. Simultaneously, its VAF is 96.35, also ranking first among the models, signifying that the CCO–XGBoost model possesses the strongest explanatory power for the variability in the actual PPV data, with its predictions most closely aligning with the true observations. Further analysis of error metrics reveals that the CCO–XGBoost model achieves the lowest values for both MAE and RMSE. This demonstrates its excellent fitting effect on the nonlinear relationship of PPV, effective control over the dispersion of prediction results, and minimal overall error.
Notably, the prediction accuracy of both the CCO–XGBoost model and the PSO-XGBoost optimized model (Figure 8b) is significantly superior to that of the standard XGBoost model (Figure 8c). This indicates that population-based optimization algorithms play a positive role in parameter tuning for XGBoost, enabling more precise acquisition of optimal parameter combinations to enhance fitting accuracy. Furthermore, the effectiveness of different optimization algorithms on XGBoost varies. Judging by the degree of fit between predicted and measured values and the error levels, the PSO algorithm exhibits relatively poorer performance and slower convergence speed. In contrast, the CCO algorithm demonstrates stronger optimization capability. Considering the tendency of PSO to become trapped in local optima, it can be concluded that CCO possesses superior global search ability.
Compared to machine learning models, the PPV prediction results based on the Sadovsky empirical formula (Figure 8d) show greater dispersion, obvious errors, and a lower similarity in the distribution trend between predicted and measured values. This highlights that the approach of multi-factor input combined with machine learning modeling can significantly improve prediction accuracy. It is particularly suitable for highly nonlinear engineering problems such as PPV prediction, effectively overcoming the limitations of traditional empirical formulas, such as weak generalization capability and poor adaptability.
In comparison with other traditional machine learning models (Figure 8e,f), XGBoost-based models demonstrate significant advantages in both goodness-of-fit and error control. It can be argued that the integration of XGBoost with the CCO algorithm not only enhances PPV prediction accuracy but also proves more efficient and straightforward compared to traditional manual parameter tuning or grid search methods. This makes it more suitable for rapid prediction requirements at engineering sites, offering practical application advantages such as fast response, simple operation, and low cost.
To further compare the overall performance of the six prediction models, a Taylor diagram was constructed based on Standard Deviation (SD), RMSE, and R2 for a comprehensive evaluation (Figure 8g). The REF point (SD = 0.1, RMSE = 0, R2 = 1) was set as the ideal reference state. Models positioned closer to the REF point represent superior comprehensive prediction performance. The results show that the CCO–XGBoost model is located closest to the REF point, indicating it achieves the best balance among stability, accuracy, and correlation. Simultaneously, the XGBoost framework itself exhibits superior overall performance compared to other machine learning methods. In conclusion, for practical application scenarios in open-pit mines, the CCO–XGBoost model proposed in this study can achieve higher-accuracy PPV prediction, demonstrating good engineering applicability and promotion value.

4.3. Sensitivity Analysis

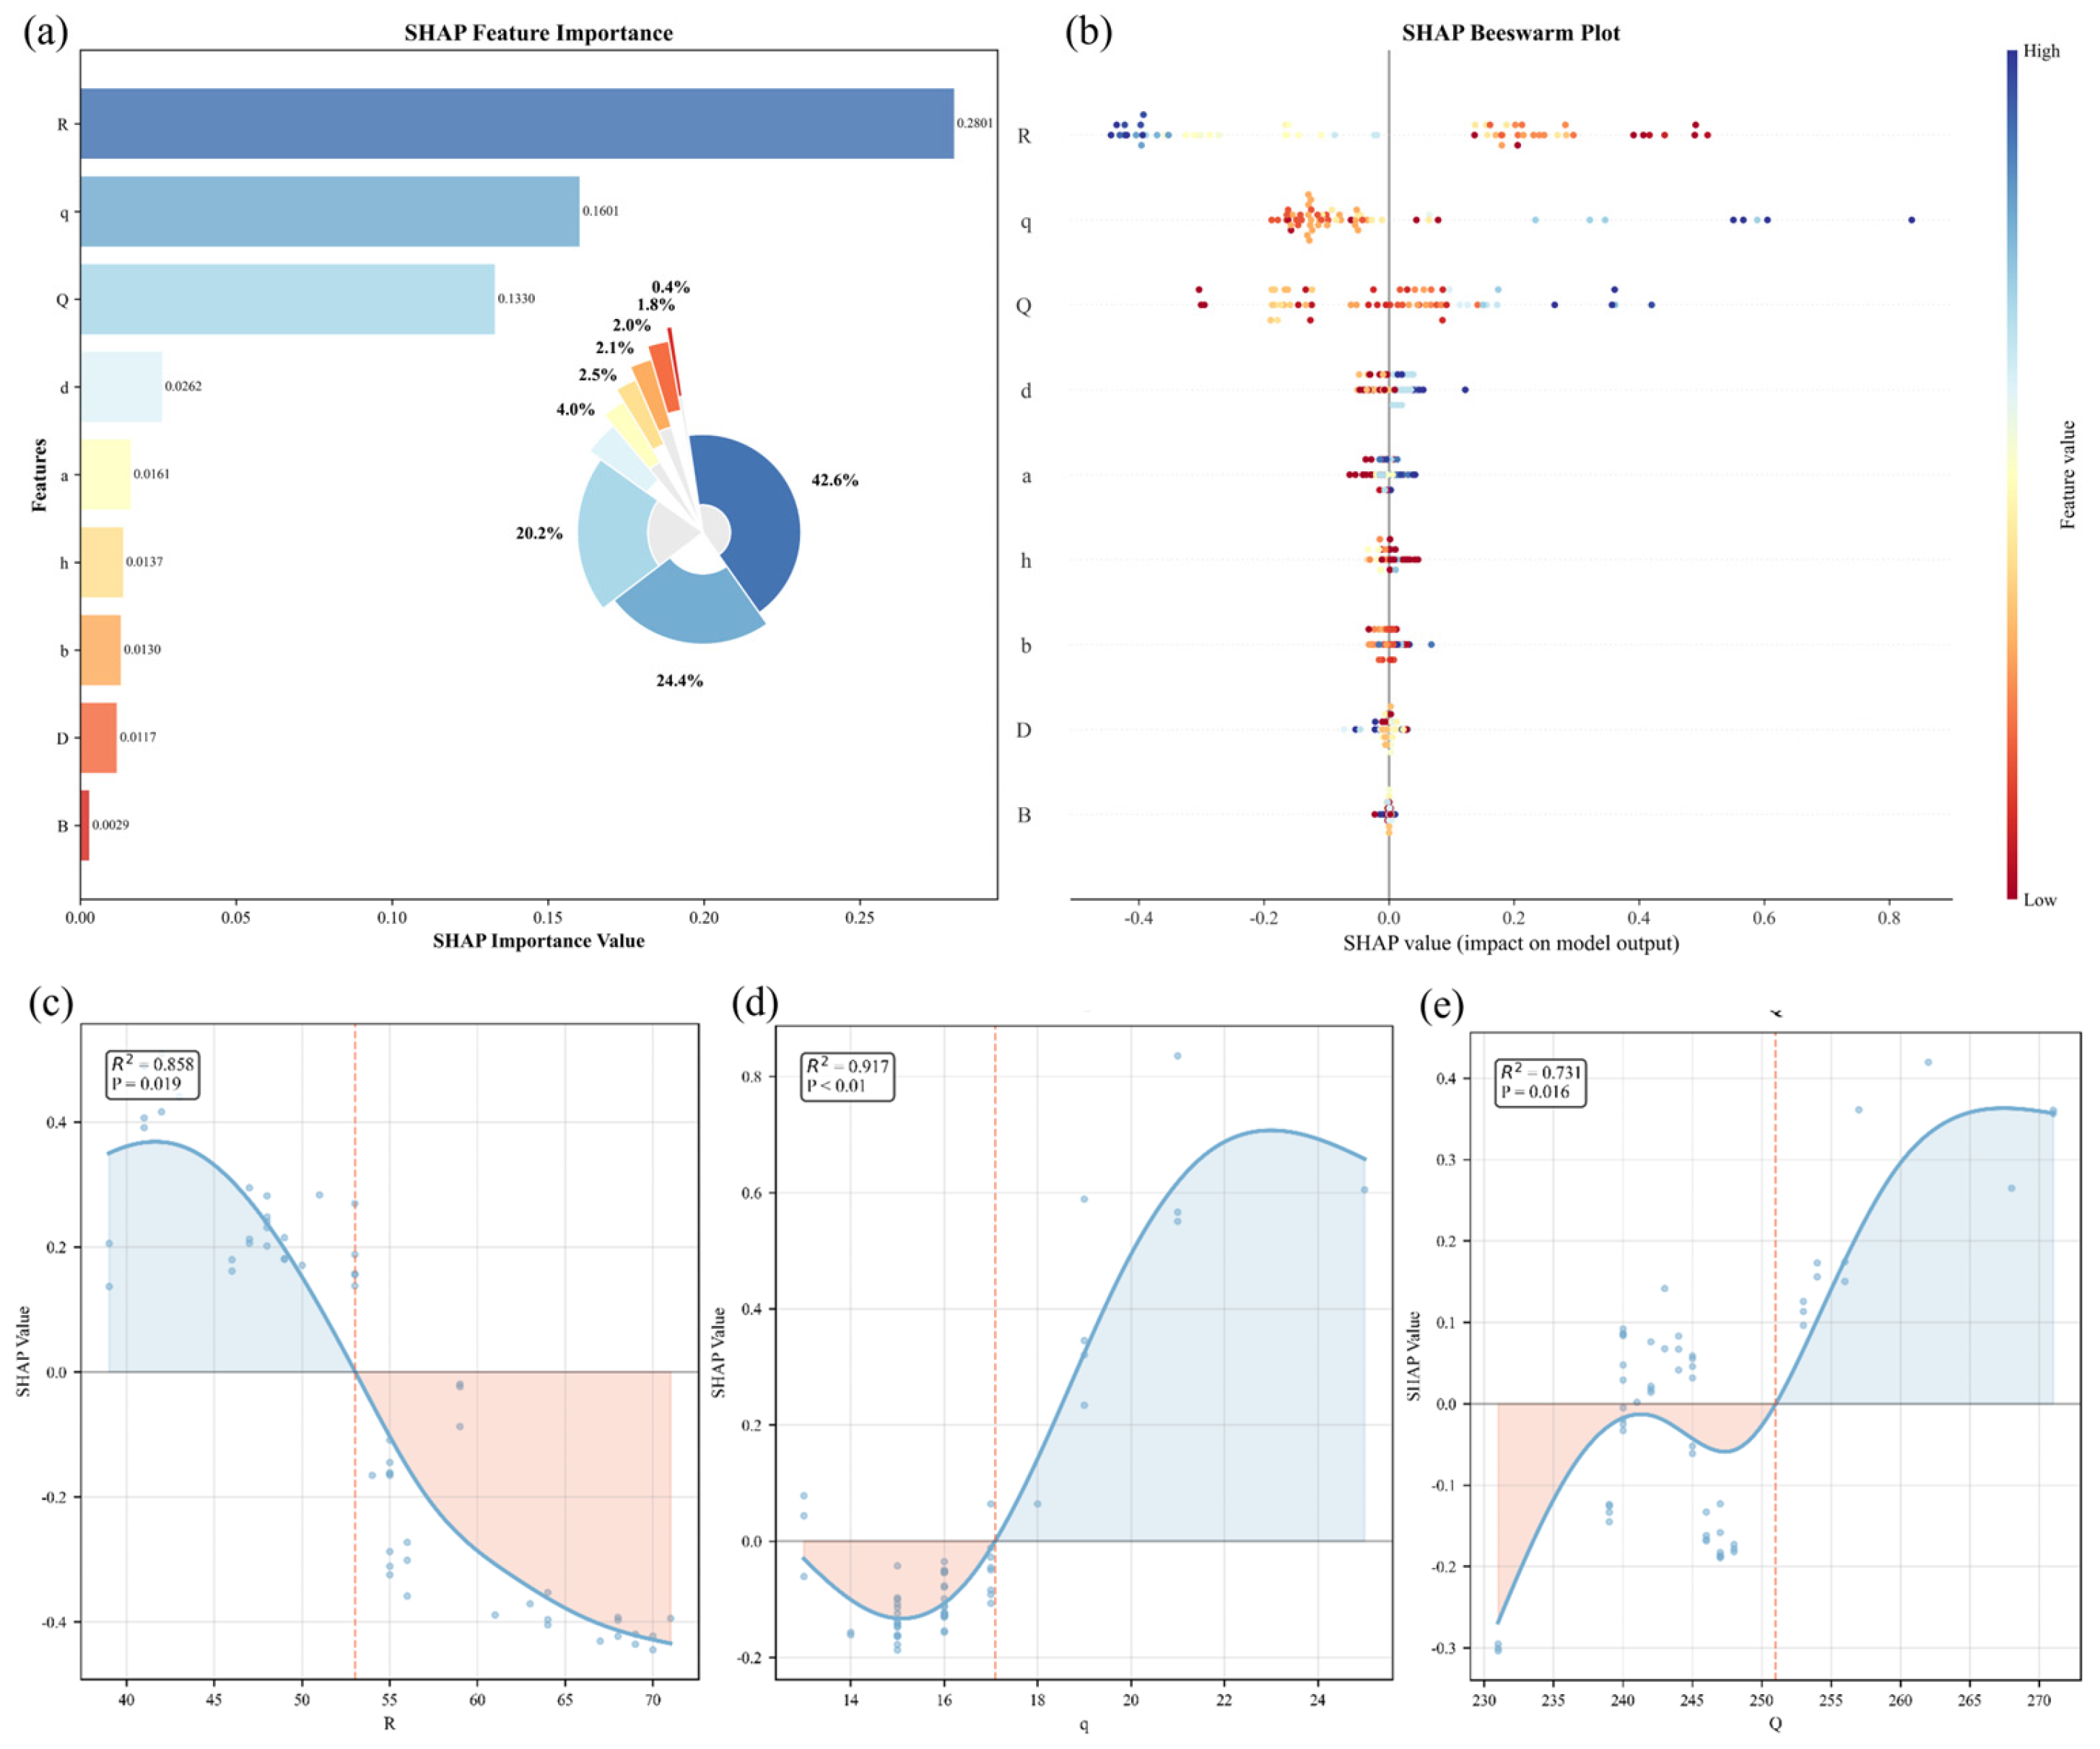
Previous studies have demonstrated that the CCO–XGBoost model can effectively capture the complex nonlinear relationships between influencing factors, such as drilling and charging parameters, and PPV, and establish a comprehensive and accurate regression prediction model. To further elucidate the mechanisms through which these influencing factors affect PPV, this study introduces the SHAP method to conduct a quantitative analysis of the contribution of each variable to the model output and clarify their relative contribution proportions (as shown in Figure 9).
A global sensitivity analysis is first performed. By calculating the mean of the absolute Shapley values for each feature across all samples, the relative importance of each input parameter to the PPV prediction results is quantified. This establishes a feature importance ranking system, identifies core controlling factors affecting PPV, clarifies the contribution proportion of each factor, and provides a priority basis for blasting parameter optimization. The results show that the top three influencing factors in terms of importance are R, q, and Q. Among them, R exerts the most significant overall influence on PPV, accounting for 43% of the total contribution. Specifically, when R increases, the corresponding SHAP values appear blue, indicating a negative suppressive effect on PPV. Conversely, when R decreases, the SHAP values turn red, demonstrating a negative promotional effect. This fully demonstrates that R is a key controlling factor for PPV. Furthermore, the contributions of q and Q to PPV are relatively similar, accounting for 24% and 20% of the total influence, respectively, with both exhibiting an overall positive influence. In contrast, other factors contribute minimally to PPV, each accounting for less than 5%.
To further dissect the specific action patterns of key factors on PPV, a local sensitivity analysis is conducted. Focusing on the three key features, R, q, and Q, identified in the global analysis, SHAP dependence plots are generated to deeply analyze the nonlinear relationships between changes in feature values and the predicted PPV results. The analysis results indicate that the influence of R on PPV consistently shows a negative trend, and PPV decreases significantly when its value exceeds 54 m. The effect patterns of q and Q on PPV exhibit obvious nonlinear characteristics. For q, within the range of 13.8 kg to 17 kg, PPV shows a brief trend of first decreasing and then increasing. Beyond 17 kg, its positive influence on PPV continues to strengthen. For Q, it exerts a positive increasing influence on PPV up to 238 kg. Between 243 kg and 253 kg, its positive influence on PPV shows a trend of first decreasing and then increasing. After 253 kg, it continues to exert a positive, increasing influence on PPV. Overall, the combined influence of q and Q on PPV is positive, indicating that an increase in blasting charge significantly elevates PPV levels.

5. Discussions

5.1. Limitations of the Analytical Model

By constructing the CCO–XGBoost machine learning model and the SHAP interpretability model, this study achieves high-precision prediction and mechanistic analysis of PPV in large-scale open-pit mine blasting. The related outcomes hold significant value in terms of theoretical method innovation and engineering practice guidance. To ensure the scientific validity of the model, several foundational assumptions are established. First, the 193 field-measured records are assumed to be statistically representative of the typical blasting characteristics and geological conditions of the Zhulan Iron Mine. Second, the nine selected input parameters are assumed to be the primary drivers of PPV, while other unmeasured variables, such as rock mass integrity or explosive detonation velocity, are considered to have a secondary influence. Finally, the rock properties and monitoring environments are assumed to remain relatively consistent during the data collection period. These assumptions define the boundary conditions for the model implementation.
From the perspective of data support, the dataset for this study originates from 193 field measurements of blasting operations at the Zhulan Iron Mine in Panzhihua City, Sichuan Province, China. The specific geological conditions, mining techniques, and equipment configuration of this mine introduce limitations associated with single-scenario data for model training. Significant differences exist among different open-pit mines regarding rock mass mechanical parameters, geological structural complexity, mining scale, and blasting methods. Consequently, the generalizability of the current CCO–XGBoost model has not yet been validated across multiple scenarios. Furthermore, while the dataset includes nine key influencing parameters, it does not encompass potential factors such as rock integrity coefficient, explosive detonation velocity, and initiation sequence. Existing research indicates that these factors can influence blast vibration, and their absence may limit the model’s adaptability to complex blasting scenarios. Additionally, although the 193 samples suffice for basic model training, for blast vibration prediction characterized by multi-parameter coupling and high nonlinearity, a larger-scale, more diverse sample dataset has the potential to further enhance model robustness and prediction accuracy.
From the model algorithm dimension, although the CCO algorithm demonstrates superior global optimization capability compared to the PSO algorithm in this study, there remains room for improvement. Its dynamic space allocation strategy, when handling high-dimensional parameter optimization, employs a relatively fixed adjustment mechanism for the population distribution ratio between the original space and the decorrelated space, lacking adaptive capability for different parameter types. While the XGBoost model itself is less sensitive to extreme outliers compared to traditional machine learning algorithms, outliers present in certain indicators within the dataset may still exert a minor influence on local prediction accuracy. Moreover, the model does not account for the time-varying coupling effects between parameters. In actual blasting, some parameters change dynamically over time, thereby affecting vibration propagation patterns. Specifically, measurement noise from instruments typically introduces an uncertainty of 5% to 10%, while inherent geological variability creates further stochasticity in vibration data. These factors contribute to the residual errors and fluctuations observed in the prediction results. The current static parameter modeling approach struggles to capture such dynamic features. Furthermore, although the SHAP interpretability analysis quantifies the contribution and action patterns of individual parameters, it does not delve deeply into the synergistic effects of multi-parameter interactions, leaving the analysis of complex coupling mechanisms insufficient.
From the perspective of engineering applicability, the current model focuses solely on predicting the single indicator of PPV, without concurrently addressing other critical engineering metrics such as fragmentation uniformity, explosive specific consumption, and dust emission levels. In practical open-pit mining operations, blasting activities must achieve a multi-objective balance encompassing vibration control, efficiency improvement, and environmental compliance. The current model has not yet developed a decision-support system for multi-objective collaborative optimization.

5.2. Implications for Blast Vibration Control in Mining Operations

The PPV influence mechanisms and threshold effects revealed by the SHAP sensitivity analysis provide multidimensional engineering insights for the precise control of blast vibration in open-pit mines. Combining these insights with the practical requirements of field operations enables the formulation of targeted quantitative control strategies.
Regarding the analysis of influencing factors, the SHAP analysis clearly delineates the key factors affecting PPV and their mechanisms of action. The results indicate that R exerts a negative influence on the PPV prediction outcome. The identified threshold of R > 54 m is of significant practical relevance. In large-scale open-pit operations like the Zhulan Iron Mine, this distance typically aligns with the minimum safe stand-off distance for critical stationary equipment and monitoring stations. When the distance exceeds this threshold, the vibration energy attenuates to a level that poses a significantly lower risk of structural fatigue or equipment malfunction. Employing the CCO–XGBoost machine learning method allows for a more holistic integration of various factors such as charge amount and drilling parameters, enabling a more precise assessment of blast vibration impact at different distances. This approach can provide a more scientifically justified safety assessment for protected objects located near regulatory boundaries, thereby enhancing the scientific rigor and applicability of safety evaluations.
Considering the limited mobility of large equipment in the study area, reducing the charge amount can be employed to minimize potential blast vibration damage to such equipment while simultaneously lowering on-site blasting dust pollution. However, directly reducing the charge amount may lead to insufficient blast energy, resulting in poor ore fragmentation, which in turn negatively impacts mining and mucking efficiency. The SHAP analysis further shows that charge amount parameters (q and Q) are the primary contributing factors to PPV prediction. When q exceeds 17 kg or Q exceeds 253 kg, PPV values are significantly elevated. Therefore, controlling the charge per hole to not exceed 17 kg and the maximum explosive quantity per blast to not exceed 253 kg can help reduce the environmental impact of blast vibration while ensuring production efficiency. While the numerical thresholds of 17 kg and 253 kg are site-specific to the current geological conditions, the SHAP-based analytical framework remains transferable to other mines, although the specific values are subject to uncertainty from geological variations.
From a practical application perspective, the findings of this study can provide direct support for refined management in open-pit mines. Leveraging the accurate PPV prediction capability of the CCO–XGBoost model, mine managers can clearly understand potential vibration impacts before blasting operations and accordingly develop and implement preventative measures in advance. Furthermore, this model can offer a scientific basis for the optimal design of blasting parameters. By systematically analyzing PPV prediction results under different parameter combinations, engineering technicians can identify the optimal blasting parameters, thereby improving blasting efficiency while reducing operational costs and adverse environmental impacts.
In summary, given the dynamic nature of geological conditions in open-pit mines, where geological structures and rock properties may undergo significant changes as mining progresses, future research could further investigate the influence of dynamic geological conditions on blast vibration. Constructing models with dynamic updating capabilities would enhance their adaptability and prediction accuracy. Concurrently, by integrating the CCO–XGBoost model with real-time monitoring technology, a specialized real-time monitoring and early warning system for blast vibration in open-pit mines could be developed. This system would collect real-time blast vibration data, utilize the model for analysis and prediction, and issue timely alerts when vibration intensity exceeds safe thresholds. This would provide decision support for relevant personnel, thereby ensuring safe mine production.

6. Conclusions

This study addresses the challenges in predicting the PPV induced by blasting in an open-pit mine, including strong nonlinearity, complex influencing factors, and insufficient accuracy of traditional empirical formulas. A hybrid prediction model integrating the CCO with the XGBoost method is proposed. Systematic sensitivity analysis of the prediction process is conducted using the SHAP interpretability approach. The main conclusions are as follows.
(1)
The core contribution of this study is the development of a CCO–XGBoost hybrid framework, which demonstrates superior predictive performance. The global optimization of key XGBoost parameters by the CCO algorithm effectively enhances the model fitting accuracy and generalization capability. On the test set, the model achieves an R2 of 0.967, a VAF of 96.35, and MAE and RMSE values of 0.067 and 0.110, respectively. All evaluation metrics are significantly superior to those of the Sadovsky formula, XGBoost, PSO-XGBoost, and other commonly used machine learning models. This indicates the model possesses significant advantages in handling the nonlinear prediction of PPV.
(2)
SHAP sensitivity analysis reveals the key influencing factors of PPV and their operational mechanisms. Global analysis indicates that the distance from the blast center is the most significant negative influencing factor for PPV, contributing 43%. The charge per hole and the total charge per delay are the second and third most significant positive influencing factors, contributing 24% and 20%, respectively. Partial dependence analysis further shows that the inhibitory effect of blast center distance on PPV strengthens significantly when the distance exceeds 54 m. The positive promoting effects of charge per hole on PPV increase markedly when it exceeds 17 kg and when the total charge per delay exceeds 253 kg, providing clear threshold references for blast vibration control.
(3)
The research findings offer clear engineering guidance for blast vibration control in open-pit mines. Based on the key parameter control suggestions derived from SHAP analysis, controlling the charge per hole to 17 kg or less and the total charge per delay to 253 kg or less, while emphasizing the safety management of the blast center distance, can be directly applied to optimize blasting parameters and practice vibration prevention and control. The high accuracy and rapid prediction capability of the CCO XGBoost model can support real-time assessment of blast vibration effects at mine sites, enhancing both the safety and economic efficiency of blasting operations.
(4)
While effective, this study is limited by its single-source dataset and static modeling approach. Future work should incorporate multi-mine data and dynamic coupling effects to further enhance model robustness.

Author Contributions

Conceptualization, J.L.; methodology, C.Y.; software, C.Y.; validation, K.Z.; formal analysis, K.Z.; investigation, X.X.; data curation, C.Y. and X.X.; writing—original draft preparation, C.Y.; writing—review and editing, J.L.; visualization, C.Y.; supervision, J.L.; funding acquisition, C.Y. and J.L. All authors have read and agreed to the published version of the manuscript.

Funding

This work was supported by the Guangxi Key Research and Development Program of China (Grant No. 2024AD47009), Fundamental Research Funds for the Central Universities of Central South University (Grant No. 1053320220742).

Data Availability Statement

The data presented in this study are available on request from the corresponding author, as the mine data are subject to certain confidentiality requirements.

Conflicts of Interest

The authors declare no conflicts of interest.

References

  1. Zhou, J.; Zhang, Y.L.; Qiu, Y.G. State-of-the-art review of machine learning and optimization algorithms applications in environmental effects of blasting. Artif. Intell. Rev. 2024, 57, 5. [Google Scholar] [CrossRef]
  2. Lee, C.; Asbörnsson, G.A.; Hulthén, E.; Evertsson, M. The environmental impact of extraction: A holistic review of the quarry lifecycle. Clean. Environ. Syst. 2024, 13, 100201. [Google Scholar] [CrossRef]
  3. Li, H.B.; Lv, Y.X.; Liu, Y.Q.; Qiao, W.G.; Chen, S.H.; Zhang, Q.H.; Yan, Y.F. Optimization for the Prediction of Waveform and the Estimation of Peak Particle Velocity of Explosive Vibration. Disaster Adv. 2012, 5, 502–508. [Google Scholar]
  4. Mokfi, T.; Shahnazar, A.; Bakhshayeshi, I.; Derakhsh, A.M.; Tabrizi, O. Proposing of a new soft computing-based model to predict peak particle velocity induced by blasting. Eng. Comput. 2018, 34, 881–888. [Google Scholar] [CrossRef]
  5. Hosseini, S.A.; Tavana, A.; Abdolahi, S.M.; Darvishmaslak, S. Prediction of blast-induced ground vibrations in quarry sites: A comparison of GP, RSM and MARS. Soil Dyn. Earthq. Eng. 2019, 119, 118–129. [Google Scholar] [CrossRef]
  6. Nguyen, H.; Bui, X.N.; Bui, H.B.; Mai, N.L. A comparative study of artificial neural networks in predicting blast-induced air-blast overpressure at Deo Nai open-pit coal mine, Vietnam. Neural Comput. Appl. 2020, 32, 3939–3955. [Google Scholar] [CrossRef]
  7. Fan, H.P.; Xu, J.; Armaghani, D.J. Addressing environmental challenges in blasting: A dual-method data generation framework for peak particle velocity prediction. Appl. Soft Comput. 2026, 186, 114263. [Google Scholar] [CrossRef]
  8. Munagala, V.; Thudumu, S.; Logothetis, I.; Bhandari, S.; Vasa, R.; Mouzakis, K. A comprehensive survey on machine learning applications for drilling and blasting in surface mining. Mach. Learn. Appl. 2024, 15, 100517. [Google Scholar] [CrossRef]
  9. Alvarez-Vigil, A.E.; González-Nicieza, C.; Gayarre, F.L.; Alvarez-Fernández, M.I. Predicting blasting propagation velocity and vibration frequency using artificial neural networks. Int. J. Rock Mech. Min. Sci. 2012, 55, 108–116. [Google Scholar] [CrossRef]
  10. Bui, X.N.; Nguyen, H.; Nguyen, T.A. Artificial Neural Network Optimized by Modified Particle Swarm Optimization for Predicting Peak Particle Velocity Induced by Blasting Operations in Open Pit Mines. Inz. Miner.-J. Pol. Miner. Eng. Soc. 2021, 1, 79–90. [Google Scholar] [CrossRef]
  11. Ghasemi, E.; Ataei, M.; Hashemolhosseini, H. Development of a fuzzy model for predicting ground vibration caused by rock blasting in surface mining. J. Vib. Control 2013, 19, 755–770. [Google Scholar] [CrossRef]
  12. Huang, Y.F.; Zhou, Z.K.; Li, M.Y.; Luo, X.D. Prediction of Ground Vibration Induced by Rock Blasting Based on Optimized Support Vector Regression Models. Cmes-Comput. Model. Eng. Sci. 2024, 139, 3147–3165. [Google Scholar] [CrossRef]
  13. Yan, Y.; Guo, J.W.; Bao, S.J.; Fei, H.L. Prediction of peak particle velocity using hybrid random forest approach. Sci. Rep. 2024, 14, 30793. [Google Scholar] [CrossRef] [PubMed]
  14. Gu, Z.Y.; Xiong, X.; Yang, C.Y.; Cao, M.C.; Xu, C. Research on prediction of PPV in open pit mine used on intelligent hybrid model of extreme gradient boosting. J. Environ. Manag. 2024, 371, 123248. [Google Scholar] [CrossRef]
  15. Guo, J.; Zhang, C.; Xie, S.D.; Liu, Y. Research on the Prediction Model of Blasting Vibration Velocity in the Dahuangshan Mine. Appl. Sci. 2022, 12, 5849. [Google Scholar] [CrossRef]
  16. Sun, M.Z.; Yang, J.M.; Yang, C.Y.; Wang, W.P.; Wang, X.B.; Li, H.F. Research on prediction of PPV in open-pit mine used RUN-XGBoost model. Heliyon 2024, 10, e28246. [Google Scholar] [CrossRef] [PubMed]
  17. Zhou, J.; Qiu, Y.G.; Khandelwal, M.; Zhu, S.L.; Zhang, X.L. Developing a hybrid model of Jaya algorithm-based extreme gradient boosting machine to estimate blast-induced ground vibrations. Int. J. Rock Mech. Min. Sci. 2021, 145, 104856. [Google Scholar] [CrossRef]
  18. Qiu, Y.G.; Zhou, J.; Khandelwal, M.; Yang, H.T.; Yang, P.X.; Li, C.Q. Performance evaluation of hybrid WOA-XGBoost, GWO-XGBoost and BO-XGBoost models to predict blast-induced ground vibration. Eng. Comput. 2022, 38, 4145–4162. [Google Scholar] [CrossRef]
  19. Radisavljevic, J. Application of Artificial Neural Networks for the Prediction of the Intensity of Ground Vibration at the Veliki Krivelj Copper Mine. J. Min. Sci. 2023, 59, 211–224. [Google Scholar] [CrossRef]
  20. Sadowski, M.A. Mechanical action of blast waves on data of experimental studies. Phys. Explos. 1952, 12, 70–110. [Google Scholar]
  21. Persson, P.; Holmberg, R.; Lee, J. Rock Blasting and Explosives Engineering; CRC Press: Boca Raton, FL, USA, 1993. [Google Scholar]
  22. Atchison, T.C.; Duvall, W.I.; Pugliese, J.M. Effect of Decoupling on Explosion-Generated Strain Pulses in Rock; The United States Bureau of Mines: College Park, MD, USA, 1963. [Google Scholar]
  23. Duvall, W.I.; Petkof, B. Spherical Propagation of Explosion of Generated Strain Pulses in Rocks; RI 5483; The United States Bureau of Mines: College Park, MD, USA, 1958. [Google Scholar]
  24. Zhang, H.; Zhou, J.; Armaghani, D.J.; Tahir, M.M.; Pham, B.T.; Huynh, V.V. A Combination of Feature Selection and Random Forest Techniques to Solve a Problem Related to Blast-Induced Ground Vibration. Appl. Sci. 2020, 10, 869. [Google Scholar] [CrossRef]
  25. Nguyen, H.; Bui, X.N.; Bui, H.B.; Cuong, D.T. Developing an XGBoost model to predict blast-induced peak particle velocity in an open-pit mine: A case study. Acta Geophys. 2019, 67, 477–490. [Google Scholar] [CrossRef]
  26. Pradhan, A.M.S.; Park, H.J.; Ghimire, P.; Shrestha, S.; Lee, J.S.; Lee, J.H. Extreme gradient boosting with Shapley Additive Explanations for landslide susceptibility at slope unit and hydrological response unit scales. Geosci. Front. 2025, 16, 102081. [Google Scholar] [CrossRef]
  27. Zhou, J.; Qiu, Y.G.; Armaghani, D.J.; Zhang, W.G.; Li, C.Q.; Zhu, S.L.; Tarinejad, R. Predicting TBM penetration rate in hard rock condition: A comparative study among six XGB-based metaheuristic techniques. Geosci. Front. 2021, 12, 101091. [Google Scholar] [CrossRef]
  28. Lang, Y.F.; Gao, Y.L.; Chen, T.T.; Wang, H.M. Centered Collision Optimizer: A novel and efficient physics-based metaheuristic optimization algorithm for solving complex real-world engineering optimization problems. Comput. Methods Appl. Mech. Eng. 2026, 448, 118491. [Google Scholar] [CrossRef]
  29. Xu, C.; Zhou, K.P.; Xiong, X.; Gao, F.; Lu, Y. Prediction of mining induced subsidence by sparrow search algorithm with extreme gradient boosting and TOPSIS method. Acta Geotech. 2023, 18, 4993–5009. [Google Scholar] [CrossRef]
  30. Izzaddin, A.; Langousis, A.; Totaro, V.; Yaseen, M.; Iacobellis, V. A new diagram for performance evaluation of complex models. Stoch. Environ. Res. Risk Assess. 2024, 38, 2261–2281. [Google Scholar] [CrossRef]
  31. Van den Broeck, G.; Lykov, A.; Schleich, M.; Suciu, D. On the Tractability of SHAP Explanations. J. Artif. Intell. Res. 2022, 74, 851–886. [Google Scholar] [CrossRef]
  32. Xu, C.; Zhou, K.P.; Xiong, X.; Gao, F.; Zhou, J. Research on height prediction of water-conducting fracture zone in coal mining based on intelligent algorithm combined with extreme boosting machine. Expert Syst. Appl. 2024, 249, 123669. [Google Scholar] [CrossRef]
Figure 1. Research area ((a): Mine location; (b): large equipment at the bottom of the open pit; (c): open pit blasting).
Mathematics 14 00596 g001
Figure 2. PPV measurement and influence index.
Mathematics 14 00596 g002
Figure 3. Analysis of measured data.
Mathematics 14 00596 g003
Figure 4. Correlation matrix analysis of data set (This matrix is constructed based on the calculation of the Pearson correlation coefficient, with a value range of [−1, 1], intuitively displaying the strength of correlations between variables through a color gradient: dark red indicates a strong positive correlation, dark blue indicates a strong negative correlation, while light colors such as white and light gray represent weak correlations, with coefficients close to 0. *, **, and *** indicate differences at the levels of |p| < 0.2, 0.2 ≤ |p| < 0.3, and |*p*| > 0.3, respectively).
Mathematics 14 00596 g004
Figure 5. Centered Collision Optimizer.
Mathematics 14 00596 g005
Figure 6. Research workflow schematic.
Mathematics 14 00596 g006
Figure 7. Optimization performance of the CCO–XGBoost model under varying swarm sizes: (a) fitness convergence curve, where a lower fitness value indicates a superior parameter configuration; (be) comparative evaluation metrics obtained across varying swarm sizes, including R2, RMSE, MAE, and VAF; The units for RMSE and MAE are cm/s.
Mathematics 14 00596 g007
Figure 8. PPV prediction results of different methods ((a): CCO–XGBoost; (b): PSO–XGBboost; (c): XGBoost; (d): Sadovsky formula; (e): SVM; (f): LASSO; (g): Taylor diagram).
Mathematics 14 00596 g008
Figure 9. SHAP-based sensitivity analysis ((a): SHAP importance ranking of input features for PPV prediction, illustrating the relative contribution of each variable; (b): global SHAP value distribution, where blue dots indicate negative influence on PPV and red dots indicate positive influence; (ce): SHAP dependence plots for R, q, and Q, respectively, revealing their nonlinear relationships with PPV).
Mathematics 14 00596 g009
Table 1. Commonly Used Calculation Formulas for Blast Vibration.
Formula TypeMathematical FormDescription
Sadovsky formula [20] v = K Q 3 R α The most widely used and classic semi-empirical formula, suitable for concentrated charges or equivalent concentrated charges.
Elevation-modified Formula [21] v = K Q 3 R e α
R e = R 2 + h α
Optimized by considering the influence of different bench heights in open-pit mining.
USBM Formula [22,23] v = K R Q β Another mainstream expression of the classic prediction model; it is mathematically convertible with the Sadovsky formula.
Note: v represents the predicted peak particle vibration velocity (cm/s); Q is the charge weight per delay (kg); K is the site-specific coefficient; α and β are attenuation indices; and h is the elevation difference between the measurement point and the blast area (m).
Table 2. XGBoost calculation parameters.
ParameterDescriptionValue Range
num_treesDirectly determines the model’s learning capacity and data fitting ability. A larger value allows the model to capture more detailed data features, theoretically improving prediction accuracy. However, an excessively large value leads to a sharp increase in computational resource consumption and may even cause redundant computations.[1, 1000]
max_depthA key parameter for controlling model overfitting. A larger value results in a more complex branching structure for individual decision trees and finer fitting of training data. However, it also makes the model prone to “memorizing” noise in the data, thereby reducing its generalization capability.[1, +∞]
etaDefines the contribution weight of each decision tree in the ensemble process, i.e., the step size for iterative updates. An excessively large value accelerates model convergence but may cause it to overshoot the optimal solution, degrading prediction accuracy. Conversely, an excessively small value slows down the convergence process significantly, reduces computational efficiency, and may even trap the model in a local optimum.[0.01, 0.1]
Table 3. Optimal calculation parameters.
ParametersValue
num_trees9995
max_depth5
eta0.0956
Disclaimer/Publisher’s Note: The statements, opinions and data contained in all publications are solely those of the individual author(s) and contributor(s) and not of MDPI and/or the editor(s). MDPI and/or the editor(s) disclaim responsibility for any injury to people or property resulting from any ideas, methods, instructions or products referred to in the content.