


Abstract
Research on how corporate social responsibility (CSR) practices linked to sustainable operations (SO) affect corporate financial performance (FP) is still limited. This study presents a novel methodological proposal to measure the individual impact of such practices on the profitability of companies listed on the Mexican Stock Exchange. The method employed consists of a Random Forest (RF) model complemented by Explainable Machine Learning (XML) techniques, namely Individual Conditional Expectation (ICE), Partial Dependence Plots (PDPs) and SHapley Additive exPlanations (SHAP), to calculate the individualized marginal effect in the return on assets (RoA), return on equity (RoE) and return on investment capital (ROIC) for each company, explained by the environmental, social, and governance scores provided by Bloomberg (Bloomberg Finance, L.P., New York, NY, USA), such as the market capitalization, debt-to-equity ratio, sales growth, and years since listing. The novelty of this model lies in the application of RF and XML, which offers a comprehensive and interpretable perspective on the CSR–FP relationship and the use of lagged explanatory variables to avoid endogeneity problems, overcoming the limitations of traditional analyses. The results indicate that environmental scores exhibit the most consistent contribution to FP, whereas social and governance effects are highly metric-dependent. The SHAP analysis reveals substantial heterogeneity in the drivers of firm FP, highlighting the relevance of XML methods.
Keywords:
CSR; sustainable operations; financial performance; random forest; explainable machine learning; SHAP; Mexico MSC:
91-05; 68T01
1. Introduction
The growing focus on corporate social responsibility (CSR) and pressure from consumers, regulators, and society have made the implementation of sustainable practices and better sustainable operations (SO) a fundamental strategic imperative in the contemporary business environment. This pressure has caused CSR to evolve from a mere philanthropic exercise to a central element of corporate strategy [1]. CSR, defined as the voluntary commitment of companies to contribute to sustainable development through their interaction with stakeholders [2,3], requires tangible implementation. Consequently, the role of SO in companies is predominantly focused on the practical implementation of the ‘greening’ concept, which is integrated into the overarching CSR strategy. This entails the conversion of environmental or ecological concerns embedded within the ‘greening’ concept into tangible actions [4]. The relationship is bidirectional: CSR provides the strategy and framework, and SO provides the action and metrics. Once CSR practices are defined, implemented, and executed through SO within companies, it is necessary to evaluate the impact on financial performance (FP) to evaluate the efficacy of CSR practices.
Despite the growing emphasis on CSR and sustainability operations management, the precise impact on FP has remained a subject of interest and research in many regions and countries, and scholars continue to explore whether CSR practices enhance or detract from FP. The diversity of methodological approaches studied in the literature [5,6,7,8,9,10] reflects a growing interest in identifying the variables that define the impact of CSR on FP, determining a positive or negative relationship between the variables, the causality that exists between them, the impact it has on FP, and the magnitude with which all these variables correlate.
In Mexico, research on the subject is still scarce, with the literature review revealing that studies measure, in isolation, aspects of CSR by implementing qualitative instruments [11,12]. Some other studies use quantitative methods that measure, in a simple and direct way, the relationship between CSR and FP in those companies that have some distinctive feature or CSR certification [13,14]. Additional quantitative model studies measure the impact of CSR on stock price [15,16], and other studies estimate the correlation between CSR and competitiveness and innovation [17,18]. Most of these studies show a positive relationship between CSR and FP; however, there is still a methodological gap in understanding the relationship between the environmental, social, and governance dimensions of CSR and FP.
Addressing these gaps requires a robust methodology capable of revealing the impact of the CSR practices and SO on the profitability of Mexican companies, measured through return on assets (RoA), return on equity (RoE), and return on investment capital (ROIC). This study employs Explainable Machine Learning (XML) techniques to evaluate the individual marginal effect that the environmental, social, and governance dimensions related to CSR and financial control variables (market capitalization, debt-to-equity ratio, sales growth, and years since listing) have on RoA, RoE, and ROIC for Mexican public companies listed on the Mexican Stock Exchange. By doing so, we aim to answer the following overarching research question:
What is the individual marginal effect of the CSR practices linked to SO (Environmental, Social, and Governance) on the financial performance (RoA, RoE, and ROIC) of Mexican companies listed on the stock exchange?
The contributions of this study are as follows. First, at a methodological level, this research enriches the empirical analysis of the CSR–FP relationship by integrating Random Forest (RF) models with Explainable Machine Learning (XML) techniques in the context of Mexican publicly listed firms, a setting that remains underexplored in the literature. This methodological design allows for the identification of nonlinearities, interaction effects, and firm-level heterogeneity that are not adequately captured by traditional econometric approaches. Second, beyond methodological novelty, this study contributes to the theoretical understanding of the relationship between CSR and FP by providing evidence that the effects of CSR are neither uniform nor linear across ESG dimensions and FP metrics. From a stakeholder theory perspective, this study demonstrates that environmental practices linked to SO enhance FP by aligning stakeholder expectations with firms’ operational and FP outcomes. Third, by analyzing the impact of CSR, the study delivers practical and actionable insights for companies. The study provides a decision-oriented framework that supports the strategic alignment of CSR practices and SO with financial objectives, thereby enhancing the effectiveness of corporate strategies.
2. Literature Review
2.1. Relationship Between CSR and SO
Research on the effect of corporate social responsibility (CSR) practices linked to sustainable operations (SO) on companies’ financial performance (FP) is a topic of growing interest in academic and business literature. Recent research findings indicate that the utilization of SO principles and practices has the potential to engender sustainable competitive advantage and organizational performance. De Guimarães et al. [19] argued that CSR practices might be expected to change and become more closely aligned with the SDGs. CSR practices include all corporate sustainability initiatives related to environmental, social, and governance (ESG) issues, including SO. The environmental dimension is one of the most important as it is responsible for ensuring the best SO to mitigate environmental risk and drive sustainable growth. Businesses’ CSR strategies increasingly incorporate sustainable supplier chains, renewable energy adoption, and carbon footprint reduction [20]. Activities related to SO are closely linked with CSR practices and ultimately with the ESG activities, as was studied by [21] through a literature review followed by a meta-analysis of correlations and meta-regression, to analyze the relationship among four types of SO and sustainable environmental, social, and governance dimensions (ESG), finding that all SO practices are positively and significantly related to the environmental performance dimension, reducing some of the uncertainty, and also, at an aggregation level concluding positive relationships between eco-design (ED) and environmental performance, the green supply chain (GSC) and environmental, economic and social performance, cleaner production (CP) and environmental, economic, and social performance, and reverse logistics (RL) and the environmental, economic, and social performance [21]. Another study conducted by the same authors [21] found, through a meta-analysis, that the product process includes the four specific processes ED, GSC, CP, and RL related to SO that have a positive relationship with the ESG dimensions, identifying the occurrence of moderating factors acting on each analyzed relationship [22]. Another literature review found a consistent growth in the evaluation of GSC management practices and performance linked to the environmental dimension of ESG [4]. For a clear visualization of the relationship among the SO practices and the ESG dimensions, see Table 1.
Table 1.
Relationship between SO and ESG dimensions.
This frame of reference in the literature allows us to identify with certainty that SO is integrated into CSR practices and evaluated through ESG scores offered by different financial entities. Companies with high ESG scores show lower carbon emissions and higher climate resilience [23]. To evaluate CSR performance, it is necessary to evaluate SO efficiency and environmental, social, and governance practices, and to communicate the ESG results. These actions are an important challenge on which the organization must work as a priority to ensure that these reports contain sufficient and clear information, are presented to board members, and, most importantly, are available for related parties to consult the objectives, activities, and results obtained. The communication of CSR results is a top priority for the organization. It is essential to ensure that reports contain sufficient clear information related to CSR and specific SO. Recently, in the literature, research has found that complete and sufficient CSR sustainability reports can have a positive effect on FP in the long term [24,25].
Today, there are several agencies or companies that specialize in analyzing sustainability reports on an ongoing basis to issue a CSR/ESG rating. In Mexico and various other parts of the world, one of the ESG scores used to evaluate the performance of public companies is provided by the information and financial services provider Bloomberg, which has developed a standardized methodology as well as a total ESG score and a specific score for the evaluation of practices related to environmental, social, and governance (ESG) dimensions. Bloomberg ESG scores objectively evaluate a company’s exposure to ESG-related risks and opportunities, as well as its ability to manage them, using a rules-based approach informed by industry and country contexts. For the environmental score in particular, the main issues evaluated related to SO are environmental and supply chain management, sustainable sourcing, emission management, sustainable products, waste management, recycling, and water management (see Table 2).
Table 2.
ESG dimensions, categories, and key variables.
The rating ranges from 1 to 10, with 1 being the lowest and 10 the highest [26]. Bloomberg places particular emphasis on the transparency of sustainability reporting and on ensuring that reported practices are aligned with international standards such as the G20/OECD Corporate Governance Principles [27] and the Sustainability Accounting Standards Board’s (SASB) sector materiality frameworks [28].
While ESG scores provide a standardized and widely used proxy for CSR practices and sustainable operations (SO), their interpretation involves important conceptual limitations. ESG ratings primarily capture the extent of disclosed policies, practices, and transparency rather than the actual effectiveness or intensity of CSR implementation at the operational level. Moreover, a high ESG rating does not necessarily reflect the same type or intensity of SO across companies, as similar scores may result from different combinations of environmental, social, or governance practices. Consequently, the impact of each ESG dimension on FP may be driven by heterogeneous SO configurations and responsible practices that vary across companies and contexts. ESG scores should therefore be interpreted as imperfect but informative signals of CSR engagement.
2.2. Relationship Between FP, CSR, and SO
The relationship between FP, CSR, and SO can be theoretically grounded in stakeholder theory, which posits that firms create sustainable value by aligning managerial decisions with the interests and expectations of multiple stakeholder groups rather than focusing exclusively on shareholders. According to Freeman [2], firms should be understood as systems of relationships among stakeholders, including shareholders, employees, customers, suppliers, governments, and local communities, whose interests must be jointly managed to ensure long-term value creation. From this perspective, CSR is not an auxiliary or reputational activity but a strategic orientation that defines how firms create and distribute value among stakeholders.
Building on Freeman’s stakeholder value creation framework, the relationship between CSR practices linked to SO and FP can be explained through three interrelated mechanisms that connect the environmental, social, and governance (ESG) dimensions with specific FP metrics. First, an efficient mechanism, primarily associated with the Environmental dimension, operates through stakeholder-oriented operational practices such as energy efficiency, waste reduction, and process optimization. These practices enhance asset utilization and operational productivity, generating a direct and robust impact on FP by improving the efficiency with which physical and financial resources are employed. Second, a risk mitigation mechanism, linked mainly to the environmental and governance dimensions, reduces regulatory, operational, and reputational risks through improved compliance, transparency, and internal controls. By lowering exposure to adverse events, this mechanism exerts a stronger impact on FP. Third, a relational capital mechanism, closely related to the social and governance dimensions, emerges from sustained stakeholder engagement that strengthens trust, cooperation, and long-term relationships with employees, suppliers, customers, and investors. This mechanism primarily affects FP by enhancing investor confidence and reducing financing frictions. Taken together, these mechanisms illustrate how ESG dimensions measured through the individual ESG scores influence FP in a differentiated and metric-dependent manner, providing a theoretical explanation for the heterogeneous and non-linear CSR–FP relationships observed in previous empirical analyses.
Within an integrated CSR–SO framework, CSR practices across the environmental, social, and governance dimensions influence FP through economic mechanisms embedded in SO. Environmental and social SO, such as sustainable supply chains, renewable energy adoption, carbon footprint reduction, and workforce-related practices, enhance production efficiency, increase revenues, reduce operating costs, and support economic value growth. Governance practices related to SO, including efficient capital budgeting, disclosure transparency, and risk control, facilitate access to financing at lower interest rates, reducing interest expenses, and increasing net profits. Together, these mechanisms improve asset utilization, capital efficiency, and firm value, leading to positive effects on RoA, RoE, and ROIC.
From this theoretical perspective, FP metrics such as RoA, RoE, and ROIC capture distinct dimensions of stakeholder value creation. RoA reflects the efficiency with which stakeholder-oriented operations utilize assets, RoE captures the distribution of value to shareholders, and ROIC measures the effectiveness of capital allocation decisions shaped by governance structures.
Building on this theoretical framework, empirical research has examined how CSR-driven SO, captured through ESG scores, translates into measurable FP outcomes. With regard to FP, it was found that SO, green investments, and CSR are strategies that simultaneously improve financial and sustainable performance, strengthen corporate reputation, and reduce environmental and social risks [29]. In this regard, it was evidenced that superior ESG performance has the potential to result in favorable financial outcomes, including enhancement of the firm’s market value, and it was found that there was a clear mediating relationship between the company’s financial success and its ESG performance [30]. Other research indicates that companies with robust CSR pledges typically have better financial results, and more investors trust due to their proactive environmental policies [31].
Stakeholder theorists [32] posit that stakeholder-oriented initiatives enhance FP. However, dual responsibility theory contends that to achieve sustainable competitive advantage, firms must develop appropriate strategies that weigh stakeholder and economic responsibilities equally. This perspective is consistent with the assertion in [33] that companies should not be solely commended for enhancing their ESG/CSR performance, as ESG/CSR alone is inadequate for generating sustained financial benefits. In 1997, [34] studied the bidirectional relationship between corporate social performance (CSP) and FP, in which CSP is positively associated with past FP (ROA, ROE, ROE), supporting the slack resources theory, and CSP is positively associated with future FP, supporting the good management theory. The results showed a simultaneous relationship in which better FP may lead to improved CSP, and better CSP may lead to improved FP, ceteris paribus. Regarding the second conclusion, it shows that the positive relationship between the FP and CSP also depends on good social performance, suggesting that there is something about performing well in social arenas that may be linked to good managerial practice.
Even though most previous research tends to support a positive link between CSR and FP, this relationship is still far from clear in the literature, as the conclusions are mixed and methodologically problematic. Results could be biased by endogeneity problems, due to a lack of consistent and reliable instruments to measure SP [34], and unobserved variables, thereby complicating the measurement of the impact on FP or the correlation between the company’s CSR decisions and unobserved variables that also influence FP [35].
Conventionally, the examination of this relationship has been undertaken through the utilization of linear regression, non-linear regression, and the correlation matrix. Most studies have used the ESG rating as an independent variable and FP as a dependent variable measured through profitability indicators such as return on assets (RoA), return on equity (RoE), return per share, return on sales (RoS), return on investment capital (RoIC), risk (leverage ratio), sales, firm size, Tobin’s Q, betas (risk), and some financial ratios, such as liquidity, leverage, asset turnover, and book value per share [6,7,34,36,37,38,39].
In [40], a total of 223 studies that empirically assessed the relationship between CSR and FP were analyzed. in 193 studies, CSR was considered an independent variable and FP a dependent variable, and in 106 out of these 193 studies, there was a positive and significant relationship. In another 19 studies, CSR was considered a dependent variable. In only 11 studies, there was a positive relationship, and only 11 studies performed a bidirectional analysis between the variables, with only 6 studies showing a positive relationship. The study of [41] conducted a meta-analysis on the bidirectional relationship between CSR and FP in which they analyzed 25 meta-analyses, investigating in particular the general relationship that exists between CSR and FP, the bidirectional causality between CSR and FP, the reputation associated with CSR and its impact on FP, CSR reporting and its impact on FP, and what types of financial variables (accounting or market) affect CSR performance in greater proportion. The results obtained showed a positive average effect in the meta-analyses on the relationship between CSR performance and company FP and no indication that CSR or FP are more important from a cause–effect point of view.
The inherent complexity, non-linearity, and interactions between the multiple dimensions of CSR and financial indicators suggest that these models may not fully capture the dynamics of the relationship. In response to these limitations, recent research has begun to adopt machine learning (ML) models, Random Forest (RF) models, and Explainable Machine Learning (XML) models due to their greater flexibility in identifying complex, non-linear patterns in large datasets, thereby providing a more nuanced understanding of the impact of CSR. The use of interpretability techniques such as SHapley Additive exPlanations (SHAP) values, Individual Conditional Expectation (ICE) plots, and Partial Dependence Plots (PDPs) facilitate the decomposition and visualization of the influence of each variable on the model’s results.
In the field of research concerning XML models that evaluate the impact of SO on FP, those developed by [42] applied SHAP values to interpret ESG dispute prediction models in banks, finding that corporate governance factors contributed most of the average SHAP value in predicting disputes, followed by environmental factors and social factors. Other studies implemented ICE plots to analyze the effect of different ESG components on FP prediction, finding that 68% of companies showed a positive relationship between ESG variables and FP, while 32% exhibited more complex relationships with specific inflection points [43]. The study performed in [44], which analyzed the relationship between ESG and FP through various ML models for European public companies, concluded that environmental innovation and other governance factors were the most influential in predicting FP, with a high level of accuracy in classifying companies with high FP due to the corporate governance variables in prediction. The study of [45] predicted ESG scores using four different ML models for non-financial Taiwanese companies, comparing their performance, and found that the RF model outperformed other ML algorithms and that traditional financial variables such as return on assets (ROA) and debt ratio were key predictors in the RF model.
Despite the abovementioned theoretical arguments, empirical evidence regarding the relationship between CSR practices linked to SO and FP remains inconsistent [46]. The heterogeneous empirical findings in the CSR–FP literature can be interpreted as outcomes of differences in stakeholder priorities, operational capabilities, and performance metrics or can be attributed to methodological flaws [47] and a heavy reliance on conventional statistical methods. In response to these concerns, this study adopts a stakeholder-based analytical framework that provides a theoretical justification for the use of flexible, non-linear empirical methods capable of capturing firm-specific CSR–SO–FP dynamics. Accordingly, an RF model combined with XML techniques is employed to examine how environmental, social, and governance practices impact FP, measured through RoA, RoE, and ROIC, for Mexican public companies.
3. Materials and Methods
3.1. Data Description
This study incorporates the individual environmental, social, and governance (ESG) ratings per company published by Bloomberg (Bloomberg Finance L.P., New York, NY, USA) for the years between 2015 and 2024. A search was carried out in Bloomberg for Mexican companies listed in the capital market through the Mexican Stock Exchange (Bolsa Mexicana de Valores, S.A.B de C.V., Mexico City, Mexico) or the Institutional Stock Exchange (Bolsa Institucional de Valores, S.A. de C.V., Mexico City, Mexico) with available financial information, which identified a total of 110 companies. Once these companies were identified, the financial information and ESG ratings were consulted (see Table 3).
Table 3.
Companies included in the sample.
The utilization of individual ESG scores facilitates a systematic quantification of the degree to which CSR practices are implemented across companies, with a focus on SO. ESG indicators have been extensively adopted in academic literature as empirical proxies for CSR engagement and have proven effective in evaluating their effects on firms’ FP [34,36,37].
Consistent with previous studies, the variables used for the FP were return on assets (RoA), return on equity (RoE), and return on investment capital (ROIC) [5,6,34]. The control variables used, following previous studies, were firm size measured as market capitalization [37,40], financial leverage measured as debt-to-equity ratio [38], sales growth [4], and company age measured as the years since the company was listed in the Mexican Stock Exchange [41] (see Table 4).
Table 4.
Financial information used.
3.2. Methods
This section describes the empirical implementation of the Random Forest (RF) and Explainable Machine Learning (XML) methods used to evaluate the impact of CSR practices linked to SO on firms’ FP.
The type of research conducted in this work was quantitative. The methodology employed entailed an RF model with a group k-fold cross-validation (CV) and a complementary XML technique, such as Partial Dependence Plots (PDPs), Individual Conditional Expectation (ICE) plots, or SHapley Additive exPlanations (SHAP) values to estimate the individual marginal effect of the CSR practices (ESG scores) linked to SO on FP (see Figure 1).
Figure 1.
Model design. Source: Authors.
This methodology aims to perform a cross-sectional analysis to assess, for a given company, the individual marginal effect on the probability for each ESG dimension and control variable of obtaining a particular FP.
3.2.1. Random Forest
Separate Random Forest regression models are estimated for each FP metric, RoA, RoE, and ROIC. In all specifications, the dependent variable is measured at time t, while the environmental, social, and governance (ESG) scores and firm-level control variables (firm size (logarithm of market capitalization), financial leverage (debt-to-equity ratio), sales growth, and firm age (logarithm of years since listing)) are measured at time t − 1. This temporal structure allows the models to capture the delayed effects of CSR practices on subsequent FP performance and reduces potential simultaneity bias.
The RF algorithm is applied to the firm year-end dataset to model non-linear relationships and interaction effects among ESG scores and firm-control variables with the FP metrics that cannot be adequately captured by linear specifications. Model performance is assessed using k-fold cross-validation to ensure robust out-of-sample prediction and to mitigate overfitting given the moderate sample size.
Random Forest (RF) is a supervised ensemble learning method based on decision trees, in which a multitude of trees are built during the training process. This algorithm was initially developed by [48]. It is designed to create a predictive model of the value of a target variable by assimilating simple decision rules from the characteristics of the data set. RF models can handle complex non-linear relationships and multiple predictive variables. In this context, the interpretability of RF models has become a particularly salient issue since a comprehensive understanding of the individual contributions of each factor is imperative for effective decision-making.
Let denote a dataset with observations, where:
represents the dependent variable;
is the vector of explanatory variables.
The objective is to estimate a prediction function:
using an ensemble of decision trees.
Random Forest for Regression
An RF is an ensemble estimator based on bootstrap aggregation (bagging) that combines many regression trees to improve predictive accuracy and reduce variance. The estimator is defined as:
where:
- B is the total number of trees in the forest;
- is the prediction produced by the -th regression tree for the input vector ;
- Each tree is trained on a bootstrap sample , which is obtained by randomly sampling observations with replacement from the original dataset .
Tree Construction
At each node t of a tree:
- A random subset of predictors is selected, with cardinality .
- The split is chosen by minimizing the mean squared error (MSE):
This procedure induces decorrelation among trees, reducing the variance of the aggregated estimator.
K-Fold Cross-Validation
K-fold cross-validation (CV) is a resampling technique used to evaluate a model’s predictive performance and its ability to generalize to unseen data.
Let denote the full dataset. The dataset is divided into k mutually exclusive and exhaustive subsets (folds):
The dataset is partitioned into k = n mutually exclusive subsets:
For each fold k:
- The model is trained on ;
- Predictions are generated for all .
The CV error is obtained by aggregating prediction errors across all folds, yielding an approximately unbiased estimate of the generalization error. K-fold CV reduces the dependence of performance estimates on a single train–test split, provides a more stable and reliable assessment of model accuracy, and is particularly effective in preventing overfitting.
The RF model has gained prominence due to its high predictive accuracy and ability to handle complex interactions. Nevertheless, to enhance the interpretability of the results, it is recommended to employ complementary methods.
3.2.2. Explainable Machine Learning Methods
To improve the interpretability of the RF models, XML techniques are integrated into the empirical analysis. Partial Dependence Plots (PDPs) are used to evaluate the average marginal effect of each ESG dimension score and each firm-level control variable on FP metrics RoA, RoE, and ROIC, holding other variables constant. Individual Conditional Expectation (ICE) plots complement this analysis by illustrating heterogeneity in marginal effects across firms.
Individual Conditional Expectation (ICE)
ICE plots have emerged as a fundamental tool for understanding the individual effects of ESG variables on model predictions. ICE charts demonstrate the heterogeneity of the model’s responses to specific variable changes [49]. ICE shows how predictions change as a single feature varies, holding others fixed. Let there be a set of observations:
where:
is the subset of predictors of interest;
is the set of all other conditional variables.
The ICE plot represents the estimated functional relationship between the feature of interest and the predicted response for each observation :
the predictive model.
The primary objective of the ICE plot is to demonstrate which variables are most relevant, given the heterogeneous effect of CSR across companies. The second objective is to assess whether companies improve their FP with CSR compared to those that do not have CSR practices.
Partial Dependence Plots (PDPs)
PDPs are a model interpretation technique that visualizes the marginal effect of one variable on the predicted outcome of a machine learning model, while all other variables stay fixed. The concept was introduced by [50] in the context of gradient boosting machines to interpret complex, non-linear models.
Given a predictive model and a feature vector , where
is the subset of features of interest, and
represents all remaining features,
the partial dependence function is defined as:
That is, it expresses the expected value of the prediction when is fixed at a certain value, averaging over the marginal distribution of the other variables .
In practice, this expectation is estimated empirically as:
where are the observed values of the remaining features in the dataset.
SHapley Additive exPlanations (SHAP)
SHapley Additive exPlanations (SHAP) values are computed for each company firm-year observation to decompose predicted FP into additive contributions of ESG scores and firm-level control variables. This approach enables direct comparison of the relative importance and direction of each explanatory variable across different FP metrics.
This study considers the SHAP values proposed by [51]. The additive feature attribution methods have an explanation model that is a linear function of binary variables:
where , M is the number of simplified input features, and .
SHAP values, as derived from the principles of cooperative game theory, offer a rational and mathematically substantiated elucidation of the model’s predictions. The Shapley value fairly distributes the difference between the instance’s prediction and the dataset’s average prediction among the features. A model is used to compute this effect: , where represents the values of the input features in the set S. Since the effect of withholding a feature depends on other features in the model, the preceding differences are computed for all possible subsets . Shapley values are then computed and used as feature attributions. They are a weighted average of all possible differences:
In the context of individual prediction, the SHAP value facilitates the quantification of the degree to which CSR influences the prediction of each company to achieve high FP.
The RF and XML techniques provide a flexible and robust framework for analyzing the relationship between CSR practices and FP. These methods are well suited to capture non-linear patterns, interaction effects, and firm-level heterogeneity arising from the combined influence of CSR dimensions and firm-level structure. RF enables data-driven modeling of complex relationships, while explainability tools such as PDP, ICE, and SHAP values facilitate the interpretation of predictive outcomes in economically meaningful terms at both aggregate and firm-specific levels. As a result, this approach offers a richer and more precise understanding of how CSR practices linked to SO influence RoA, RoE, and ROIC, thereby complementing and extending insights obtained from conventional quantitative models. Overall, the combined use of RF and XML techniques provides a transparent and data-driven framework for analyzing the relationship between CSR practices linked to SO and FP, explicitly linking model specification, variable structure, and interpretation techniques to the empirical results presented in Section 4.
4. Results
4.1. Exploratory Data Analysis
This section shows the exploratory analysis of the financial information used to evaluate the individual marginal effect of the ESG scores and firm-level control variables on the probability that public companies in Mexico obtain certain FP measured through RoA, RoE, and ROIC.
The year-end financial information for the years between 2015 and 2024 was obtained from Bloomberg with the objective of making a cross-sectional analysis of the financial variables. Year-end information is most widely employed for financial analysis purposes since it provides a more comprehensive overview of the activities and results obtained by companies. The information related to the ESG scores was also obtained from Bloomberg for the same years. Data for companies that did not have individual ESG ratings were considered missing values.
To address potential endogeneity problems in the analysis of the impact of CSR practices on FP, a common, theoretically grounded approach is to use lagged explanatory variables. Introducing lagged ESG scores ensures temporal precedence in the model, thereby reducing concerns about reverse causality, whereby current FP influences the adoption of CSR practices in the present [34,36]. This strategy assumes that past CSR decisions affect current financial outcomes, but not vice versa. Furthermore, lagged variables capture the dynamic and persistent nature of CSR strategies, which typically unfold over time rather than generating immediate effects.
Therefore, the variables related to FP (RoA, RoE, and ROIC) were considered at time (t) and the information related to the CSR practices (Environmental Score, Social Score, and Governance Score) as well as the financial control variables (market capitalization, debt to equity ratio, sales growth, and company age) were lagged one year and considered at time (t − 1). As a result, a total period of nine years of information was considered from 2016 to 2024.
Once the explanatory variables were lagged, the exploratory data analysis was performed with RStudio (version 2025.09.1). The sample was a total of 110 companies for nine years (2016 to 2024). Missing data were eliminated for the financial variables and for the three individual ESG scores, resulting in a final sample of 319 company records. The results of the descriptive statistics are provided in Table 5.
Table 5.
Descriptive statistics of the ESG scores and financial information.
4.2. Random Forest Model
A Random Forest (RF) model was used to analyze the relationship between the CSR practices linked to SO and measured by the environmental, social, and governance scores and the FP outcomes RoA, RoE, and ROIC. RF is a non-parametric ensemble learning method that constructs many decision trees using a bootstrap sample of the data and aggregates their predictions, reducing variance and improving generalization performance [48].
To ensure a robust out-of-sample evaluation and mitigate overfitting, model performance is assessed using a k-fold cross-validation (CV) procedure. This method involves the random partitioning of the dataset into k equal subsets. In each iteration, k − 1 folds are used for model training, and the remaining fold is reserved for validation. This process is repeated until each fold has served once as the validation set, yielding stable and reliable estimates of predictive accuracy [52].
A selection of five-fold CV (k = 5) was made, as previous research shows that it provides comparable performance estimates to those obtained with higher values of k while substantially reducing computational requirements, particularly in ensemble-based ML models [48]. Simulation evidence shows that five-fold CV provides low variance in error estimation for medium-to-large samples, making it a popular choice in machine learning and finance research [52].
4.2.1. Model Specification
The estimation of separate Random Forest models is carried out for three measures of FP: return on assets (RoA), return on equity (RoE), and return on invested capital (ROIC). Each dependent variable is represented as a function of CSR dimensions (environmental, social, and governance), and a set of firm-level control variables (firm size (logarithm of market capitalization), financial leverage (debt-to-equity ratio), sales growth, and firm age (logarithm of years since listing). The logarithmic transformation of market capitalization and firm age has been demonstrated to reduce skewness, mitigate the influence of extreme values, and allow for a more interpretable relationship between scale-related firm characteristics and FP.
The estimated regression model is given by:
For each dependent variable
To address concerns regarding simultaneity and reverse causality, all explanatory variables are measured with a one-period lag (t − 1), while FP outcomes are measured at time t. This temporal structure ensures that the model can capture the predictive effect of prior CSR strategies and firm characteristics on subsequent financial outcomes.
Model performance is assessed with the predictions that were generated during the CV process. The metrics used to capture the model predictive accuracy are mean squared error (MSE), root mean squared error (RMSE), mean absolute error (MAE), mean absolute percentage error (MAPE), and the coefficient of determination (R2), computed as the squared correlation between observed and predicted values. The reported results reflect the relationship between lagged (t − 1) explanatory and controlling variables and the dependent variables at time t. Consequently, the estimated performance metrics should be interpreted as capturing forward-looking associations rather than contemporaneous correlations (Table 6).
Table 6.
Random Forest models for RoA, RoE, and ROIC.
The model predicting RoA demonstrates the strongest overall performance. The model demonstrates optimal performance with the lowest MSE of 18.3291 and RMSE of 4.2812, indicating minimal prediction errors. The MAE of 2.8296 suggests limited average deviation between observed and predicted values, while the MAPE of 4.6755% reflects moderate relative prediction accuracy. The R2 value of 0.3299 indicates that approximately 32.99% of the variation in RoA is explained by CSR dimensions and control variables.
The model estimated for RoE demonstrates a reduced capacity for prediction. The higher MSE of 38.6600 and RMSE of 6.2177 values indicate larger prediction errors, and the R2 suggests that only 23.87% of the variability in RoE is captured by the model.
The model for ROIC demonstrates intermediate performance. The RMSE of 5.5749 and the MAE of 3.7180 are lower than those observed for the RoE but higher than for the RoA. The MAPE of 1.0415% indicates strong relative accuracy, and the R2 value suggests that CSR dimensions and control variables explain 26.37% of the variation in ROIC.
Results suggest a moderate but statistically significant predictive capacity, with discernible variations across FP metrics. When considered as a whole, the results indicate that the RF model demonstrates greater efficacy in explaining performance metrics associated with asset utilization and capital efficiency (RoA and ROIC) in comparison to equity-based profitability (RoE). The results obtained with the R2 value are in line with previous studies, such as those obtained by [34].
4.2.2. Variable Importance Analysis
To obtain a rigorous assessment of the predictor’s relevance, this study uses three complementary measures of variable importance within the RF framework: standard RF importance, Gini-based importance, and permutation-based importance, which is computed via RMSE loss. Using these approaches together allows us to examine in detail both the structural role of predictors in tree construction and their marginal contribution to out-of-sample predictive accuracy.
The results reveal a high degree of consistency across the importance measures. The Env_Score consistently ranks as one of the most influential predictors across all three FP metrics, RoA, RoE, and ROIC. This suggests that environmental performance provides significant information for the model, contributing to both impurity reduction during tree splitting and minimizing prediction error when evaluated under permutation. Financial structure variables used as control variables, notably D_E, also exhibit high importance, particularly in the RoA and RoE models. In contrast, ln_Mk_Cap and Gov_Score are comparatively more important in the ROIC model, suggesting a closer link between market size, governance mechanisms, and capital allocation efficiency. Sales_Growth shows the lowest importance consistently across models and methods, indicating a limited marginal contribution to predictive accuracy when ESG dimensions and structural firm characteristics are included (Table 7).
Table 7.
Importance variables analysis.
The relative ordering and magnitude of variable importance differ across RoA, RoE, and ROIC. From a modelling perspective, this reflects the sensitivity of the dependent variable to different subsets of predictors for different metrics, rather than instability or inconsistency of the RF estimators. The convergence of results from structurally (Gini-based) and performance (permutation-based) oriented importance measures supports the reliability of the identified predictor rankings. This also highlights the value of combining multiple importance criteria in nonparametric ensemble models.
4.3. Explainable Machine Learning
4.3.1. Partial Dependence Plots (PDPs) and Individual Conditional Expectation (ICE)
The PDP and ICE plots for the environmental, social, and governance scores, evaluated with respect to RoA, RoE, and ROIC, were created and revealed both average trends and potential heterogeneity in the influence of CSR practices across firms and provide insight into non-linear and interaction effects. ICE plots are represented with thin gray lines and show the effect at the individual level, showing the heterogeneity of the behavior of all companies. The PDP is represented with the red bold line and shows the average effect of each independent variable. These plots describe the functional relationships learned by the Random Forest model between each predictor and the predicted FP (Figure 2).
Figure 2.
PDPs and ICE plots—Env_Score, Soc_Score, and Gov_Score variables.
The Env_Score exhibits a non-linear relationship with the predicted outcomes across all three FP measures. For low to intermediate score values, the PDPs show relatively smooth and gradual variations. In contrast, at the upper end of the Env_Score range, the PDPs show a pronounced upward shift, particularly for RoA and RoE. This behavior suggests that changes in the predicted outcomes become more significant at higher environmental score levels. The associated ICE curves show increasing dispersion at this level, suggesting that the Env_Score varies across observations.
The PDPs corresponding to the Soc_Score exhibit comparatively smoother and more gradual patterns across all FP metrics. For RoA, the average predicted outcome rises moderately at intermediate values before stabilizing. For RoE and ROIC, the PDPs remain relatively flat across most of the Soc_Score domain, indicating limited variation in predicted outcomes as the social score changes. The ICE curves reveal greater dispersion at lower Soc_Score values, particularly for RoA, before converging at higher levels.
The PDPs for the Gov_Score exhibit a non-linear structure across all three FP measures. For RoA, the average predicted outcome initially increases and then declines after reaching an intermediate Gov_Score, indicating the presence of an interior maximum. Similar but less pronounced patterns are observed for RoE and ROIC, with localized increases followed by stabilization. The ICE curves reveal significant heterogeneity around intermediate Gov_Score, with individual trajectories diverging considerably.
Comparative analysis across RoA, RoE, and ROIC indicates that the magnitude and shape of the explanatory variable’s relationship differ across FP metrics. RoA exhibits steeper average changes and greater dispersion in ICE curves, whereas ROE and ROIC display smoother average responses.
The PDPs and ICE plots for the firm-level control variables, namely ln_Mk_Cap, Sales_Growth, D_E, and ln_Years, describe the functional relationships learned by the RF model between each predictor and the RoA, RoE, and ROIC.
The PDP–ICE results for the RoA model are characterized by non-linear and heterogeneous functional relationships with firm-level control variables. The variable ln_Mk_Cap exhibits a piecewise pattern, with a positive association between low and intermediate values and a flattening effect at higher size levels, suggesting diminishing marginal variation for larger firms. Financial leverage measured by the D_E variable displays a non-monotonic structure, with distinct regimes across the distribution, indicating that the association between D_E and RoA varies depending on the capital structure level. The Sales_Growth variable shows a largely flat profile beyond low values, implying limited relevance once initial growth effects are accounted for. The ln_Years variable presents a moderate non-linear pattern, with changes in predicted RoA becoming more pronounced at higher maturity levels. The RoA model exhibits substantial heterogeneity in individual trajectories, as reflected by wide ICE dispersion, indicating that RoA profitability is sensitive to localized variations in structural firm characteristics (Figure 3).
Figure 3.
PDPs and ICE plots—RoA model.
The PDP–ICE results for the RoE model indicate comparatively smoother and more homogeneous functional relationships than those observed for RoA, while retaining non-linear features. The Ln_Mk_Cap variable shows a piecewise pattern with a positive slope at lower levels and diminishing variation at higher values. The D_E variable exhibits a mild non-monotonic structure, with limited amplitude in the average PDP but substantial dispersion in individual trajectories. The Sales_Growth variable exhibits flattening at low values, with minimal variation beyond this range. The ln_Years presents a moderate non-linear profile, with gradual changes over most of the domain and more pronounced positive variation at higher maturity levels. The RoE model is characterized by reduced ICE dispersion relative to RoA, indicating more homogeneous functional associations across firms despite persistent non-linearity (Figure 4).
Figure 4.
PDPs and ICE plots—RoE model.
The PDP–ICE results for the ROIC model indicate relatively stable non-linear functional relationships between firm-level control variables and predicted performance. The ln_Mk_Cap variable exhibits a piecewise structure, with positive pronounced variation at low values and diminishing marginal changes for larger firms, while the ln_Years variable shows a moderate non-linear profile, with more evident positive variation at higher maturity levels. The D_E variable displays a weakly non-monotonic average association with limited variation. Sales growth shows limited marginal variation beyond low values. The ROIC model is characterized by smoother average functional forms and reduced heterogeneity relative to RoA and RoE (Figure 5).
Figure 5.
PDPs and ICE plots—ROIC Model.
Across the RoA, RoE, and ROIC measures, the combined evidence from variable importance metrics and PDP–ICE analyses indicates the presence of systematic non-linear and heterogeneous functional relationships, with a gradual reduction in their magnitude when moving from RoA to RoE and ROIC. Predictors consistently identified as highly relevant, most notably Env_Score, ln_Mk_Cap, and D_E, also display the most pronounced non-linear or non-monotonic functional forms in the corresponding PDP–ICE plots, suggesting coherence between global relevance measures and local functional behavior. By contrast, Sales_Growth is characterized by persistently low importance values and nearly flat partial dependence functions, indicating limited contribution to the modeled response beyond low values of the feature domain. This pattern is stable across all three performance measures and both interpretability approaches.
4.3.2. SHAP (SHapley Additive exPlanations)
Shapley Additive Explanations (SHAP) values, as derived from the principles of cooperative game theory, offer a rational and mathematically substantiated elucidation of the model’s predictions. The SHAP values used in this study were computed to provide a local and additive decomposition of RF predictions for all firms and for each of the nine years available in the dataset. For each firm–year observation, the fitted RF models for RoA, RoE, and ROIC were evaluated using the corresponding lagged explanatory variables, ensuring temporal consistency between predictors and outcomes.
The computation was performed exhaustively for all firm–year observations, rather than for a selected subset, yielding a complete distribution of local explanations across the panel. This approach allows the analysis to capture both cross-sectional heterogeneity across firms and temporal variation across years, without imposing parametric restrictions on the functional form of the relationships.
Due to the large number of SHAP value results obtained (2233 records), descriptive statistics were used to summarize the results across firms and time. In particular, the average SHAP value () was calculated to quantify the expected magnitude of local contributions associated with each feature. Table 8 summarizes the average SHAP values for each explanatory variable across the three FP indicators. Positive values indicate an average contribution toward higher FP, whereas negative values reflect a diminishing average effect. Due to the size of the complete SHAP values results, the complete dataset is available upon request as Supplementary Materials.
Table 8.
Average SHAP values ().
The Env_Score variable consistently contributes positively to all models, with average SHAP values of 0.0159 for RoA, 0.0314 for RoE, and 0.0044 for ROIC. The effect is particularly pronounced in the RoE model. In contrast, the Soc_Score variable exhibits a weak and model-dependent effect. While it contributes negatively to RoA and RoE by −0.0066 and −0.0052, respectively, it displays a small positive contribution in the ROIC model of 0.0058. The Gov_Score variable consistently contributes negatively, with SHAP values of −0.0012 for RoA, −0.0027 for RoE, and −0.0139 for ROIC.
The firm size variable, ln_Mk_Cap, shows a positive contribution to the RoA and RoE models of 0.0148 and 0.0039, respectively, but a negative effect on the ROIC model of −0.0175. These results suggest that larger firms tend to achieve higher accounting and equity returns, while capital efficiency may decline with scale. Regarding leverage, the D/E variable displays modest positive contributions to RoA and ROIC of 0.0053 and 0.0059, respectively, but has a negative effect on RoE of −0.0023. The Sales_Growth variable contributes negatively to RoA and ROIC, by −0.0020 and −0.0005, respectively, but positively to RoE, by 0.0097. The ln_Years variable displays a beneficial and consistent impact on RoA of 0.0122 and RoE of 0.0101, while having a negative effect on ROIC of −0.0034, indicating declining marginal returns to experience in relation to invested capital productivity.
The lower panel of Table 8 presents the proportion of positive and negative SHAP values across observations. The RoA model displays a higher share of negative contributions (54.2%) relative to positive ones (45.8%), indicating greater heterogeneity in the determinants of RoA profitability. In the context of the RoE model, the positive and negative contributions are almost balanced, with proportions of 50.1% and 49.9%, respectively. This finding suggests a more symmetrical distribution of marginal effects. Conversely, the ROIC model evidences a preponderance of positive contributions amounting to 51.5%, while negative contributions amount to 48.5%, signifying that, on average, the explanatory variables contribute little more favorably to capital efficiency.
These results indicate that the environmental dimension exhibits the most consistent contribution to FP, whereas social and governance effects are highly metric-dependent. The SHAP analysis reveals substantial heterogeneity in the drivers of firm FP, highlighting the relevance of XML methods.
4.3.3. Shapley Individual Contribution Plots
In addition to calculating SHAP values, a Shapley plot was created for GFINBUR to make the results easier to understand. The analysis was conducted only for one company due to the size of the SHAP values dataset, comprising a total of 2233 records, making the graphical analysis of all the results impractical. The Shapley Individual Contribution Plot is a graphical representation of the marginal contribution of a variable, measured in terms of the SHAP value (phi ϕ), to the outcome of a classification model. Each bar in the plot represents the contribution made by that specific variable to the model’s result. Each bar represents the contribution of a given predictor to the model’s prediction relative to the baseline value, with positive values increasing the predicted outcome and negative values decreasing it (Figure 6).
Figure 6.
SHAPLEY individual contribution plot—GFINBUR.
For the RoA model, the prediction for GFINBUR is dominated by a strong positive contribution of Env_Score, which represents by far the largest Shapley value. This indicates that, for this firm, Env_Score is the primary factor driving the predicted asset-based profitability above the baseline. Gov_Score and Soc_Score also contribute positively, though with substantially smaller magnitudes, suggesting that governance and social practices reinforce the environmental effect but play a secondary role. The ln_Mk_Cap variable shows a moderate positive contribution, indicating a favorable scale effect. In contrast, ln_Years variable contributes negatively, slightly reducing the predicted RoA, while the D/E and Sales_Growth variables have marginal positive contributions.
The RoE SHAP decomposition is observed to have a similar but slightly more balanced structure. The Env_Score variable again provides the largest positive contribution, confirming its central role in explaining the predicted RoE return for GFINBUR. The Gov_Score and Soc_Score display sizable positive contributions, indicating that RoE performance for this firm is jointly supported by environmental, governance, and social dimensions. The ln_Mk_Cap and D_E variables contribute positively but with smaller magnitudes, while the ln_Years variable has a negligible effect. The Sales_Growth variable shows a noticeable positive contribution to the RoE model.
For ROIC, the SHAP values indicate a more diversified contribution structure. The Env_Score variable remains the largest positive contributor, although its magnitude is lower than in the RoA and RoE models. The Gov_Score variable provides a substantial positive contribution, highlighting the importance of governance quality for ROIC performance in GFINBUR. The Sales_Growth and the D_E variables also contribute positively and with comparable magnitudes. The ln_Mk_Cap and ln_Years variables show smaller positive contributions.
These results show that the XML model, evaluated through SHAP values, identifies differentiated trajectories of CSR practice integration. Some companies manage to transform CSR practices and SO into a financial advantage that represents a high FP; for others, this represents a structural constraint [25].
5. Conclusions and Discussion
The main objective of this study was to examine the relationship between CSR practices linked to SO measured through the environmental, social, and governance (ESG) scores and the FP of publicly listed firms in Mexico, using a non-parametric ML framework combined with XML techniques and lagged explanatory variables to avoid endogeneity problems. Consistent with stakeholder theory, the results indicate that CSR practices do not produce uniform FP effects. Instead, their impact is strongly dependent on the FP metric under consideration and firm-specific metrics, reflecting differences in stakeholder priorities, operational capabilities, and governance structures.
The theoretical, methodological, and conceptual foundations of this study enable a structured and theory-driven selection of variables. CSR engagement is operationalized through disaggregated ESG scores, allowing the empirical analysis to capture the distinct economic mechanisms associated with each dimension. FP is measured using RoA, RoE, and ROIC, which represent complementary aspects of asset efficiency, equity returns, and capital productivity, while firm-level financial control variables account for structural heterogeneity. This coherent variable design strengthens the link between the empirical results and the theoretical framework, supporting a consistent interpretation of the findings.
Environmental practices emerge as the most robust driver of FP, particularly in terms of asset utilization and capital efficiency, as they display the most consistent and robust effects on return on assets (RoA) and return on invested capital (ROIC). This suggests that environmental initiatives embedded in SO represent a key mechanism through which firms simultaneously address stakeholder expectations, improve operational efficiency, and achieve FP. Accordingly, firms are advised to prioritize environmental investments in areas where FP is more predictable and directly linked to operational performance.
Governance practices play a complementary but critical role in shaping FP related to capital allocation and risk management. The results show that governance mechanisms play a critical role in improving ROIC by reducing exposure to regulatory, operational, and reputational risks. Firms operating in highly regulated environments should therefore strengthen governance structures as part of their financial planning and investment decision processes, especially when the objective is to improve ROIC. Social practices display more heterogeneous and metric-dependent effects. While their direct contribution to RoA and ROIC is limited, social initiatives support FP indirectly by enhancing organizational stability, workforce engagement, and investor confidence. These effects are more closely reflected in equity-based FP metrics, such as return on equity (RoE).
These results show that RoA and ROIC are more closely associated with CSR practices linked to SO than RoE, suggesting that SO primarily affects operational efficiency and capital allocation rather than RoE in the short term. This finding refines prior empirical evidence by demonstrating that at least some CSR practices have a positive impact on FP. This is in line with other studies that have confirmed a positive relationship between some or all CSR practices and FP [6,32,42,53,54,55,56].
Firm-level financial control variables should be interpreted as contextual factors that shape, rather than determine, FP outcomes measured by RoA, RoE, and ROIC. Larger firm size tends to support higher RoA and RoE while reducing ROIC. Capital structure decisions exert non-linear effects that are particularly relevant for RoA and, to a lesser extent, for ROIC. Sales growth shows limited relevance for explaining variations in RoA, RoE, and ROIC once ESG practices are considered. Accordingly, managers should jointly evaluate financial variables and ESG initiatives when designing strategies aimed at improving asset efficiency, equity returns, and capital productivity.
The observed nonlinear patterns and firm-level heterogeneity can be largely attributed to differences in firms’ financial structures. The interaction between financial structure and the implementation of CSR practices linked to SO generates complex and highly diverse relationships, leading to differentiated effects on FP metrics across firms. In this context, the use of explainability techniques such as PDP, ICE, and SHAP values is particularly appropriate, as they enable a detailed examination of the specific contribution of each variable to RoA, RoE, and ROIC. This interpretability supports a more nuanced evaluation of performance and enhances the understanding of how individual CSR dimensions influence financial outcomes.
The application of XML techniques offers firms a practical decision support tool. Managers should use firm-level interpretability outputs to identify which ESG dimensions generate the highest marginal FP within their specific financial and operational context and adjust CSR strategies accordingly. More broadly, the RF–XML model illustrates the value of interpretable, data-driven analytics for corporate decision-making and suggests that environmental performance metrics may offer more reliable signals of financial resilience than aggregated ESG indicators.
Overall, the evidence presented in this study allows for clear theoretical and practical conclusions regarding the CSR–financial performance relationship. First, the consistently positive relationship between the environmental dimension and FP provides empirical support for the operational efficiency channel, whereby environmentally oriented SO improves asset utilization, reduces costs, and enhances value creation and profitability. Second, the firm-level assessment of ESG impact demonstrates that the relationship between CSR and FP is inherently firm-specific and dependent on the performance metric considered, in line with the theoretical mechanisms of efficiency, risk management, and capital allocation proposed in this study. The observed heterogeneity underscores the need to align CSR strategies with firms’ structural conditions and strategic profiles to achieve financially meaningful outcomes. Finally, the findings suggest that identifying specific financial structures in combination with distinct intensity levels of CSR dimensions enables more accurate expectations regarding FP outcomes. By linking sustainability profiles with underlying financial configurations, the study extends the theoretical framework and offers a structured basis for anticipating how CSR practices translate into differentiated financial results across firms and sectors.
These results ultimately address the research question posed for this study: What is the individual marginal effect of the CSR practices linked to SO (environmental, social, and governance) on FP (RoA, RoE, and ROIC) of Mexican companies listed on the stock exchange? The findings suggest that CSR practices can enhance FP when they are selectively prioritized, operationally embedded, and evaluated using appropriate FP metrics. Firms that adopt a targeted and data-driven approach to ESG implementation are better positioned to translate CSR initiatives linked to SO into measurable FP outcomes.
Supplementary Materials
The following supporting information can be downloaded at: https://www.mdpi.com/article/10.3390/math14030557/s1, File S1: Results. The phi value (ϕ) was calculated for all the variables to measure the variable’s contribution to the model’s prediction, where a value of ϕ > 0 increases the probability of the predicted value (high FP) of RoA, RoE, and ROIC, and a value of ϕ < 0 reduces the probability of the predicted value of RoA, RoE, and ROIC (high FP). The phi.var metric indicates the variance or dispersion of that contribution.
Author Contributions
Conceptualization, L.E.J.-C., M.V.-S. and R.R.-A.; methodology, L.E.J.-C. and R.R.-A.; software, L.E.J.-C. and R.R.-A.; validation, R.R.-A. and M.V.-S.; formal analysis, L.E.J.-C.; investigation, L.E.J.-C. and M.V.-S.; data curation, L.E.J.-C.; writing—original draft preparation, L.E.J.-C. and R.R.-A.; writing—review and editing, L.E.J.-C., M.V.-S., S.G.-Á. and R.R.-A.; visualization, L.E.J.-C., M.V.-S., R.R.-A. and S.G.-Á.; supervision, M.V.-S., R.R.-A. and S.G.-Á.; project administration, R.R.-A. All authors have read and agreed to the published version of the manuscript.
Funding
This research received no external funding.
Data Availability Statement
Restrictions apply to the availability of these data. Data were obtained from Bloomberg (2025) and are available from the authors with the permission of Bloomberg.
Conflicts of Interest
The authors declare no conflicts of interest.
Abbreviations
The following abbreviations are used in this manuscript:
| CSR | Corporate Social Responsibility |
| FP | Financial Performance |
| ESG | Environmental, Social and Governance |
| SO | Sustainable Operations |
| CG | Corporate Governance |
| ML | Machine Learning |
| XML | Explainable Machine Learning |
| ICE | Individual Conditional Expectation |
| PDP | Partial Dependence Plot |
| SHAP | SHapley Additive exPlanations |
| RoA | Return on Assets |
| RoE | Return on Equity |
| RoIC | Return on Investment Capital |
| BVPS | Book Value Per Share |
| OLM | Ordered Logit Model |
| ED | Eco-design |
| GSC | Green Supply Chain |
| CP | Cleaner Production |
| RL | Reverse Logistics |
| CSP | Corporate Social Performance |
References
- Carroll, A.B. Carroll’s Pyramid of CSR: Taking Another Look. Int. J. Corp. Soc. Responsib. 2016, 1, 3. [Google Scholar] [CrossRef] [Scilit]
- Freeman, R.E. Strategic Management: A Stakeholder Approach; Pitman Publishing: Boston, MA, USA, 1984. [Google Scholar]
- Garriga, E.; Melé, D. Corporate Social Responsibility Theories: Mapping the Territory. J. Bus. Ethics 2004, 53, 51–71. [Google Scholar] [CrossRef] [Scilit]
- Tseng, M.-L.; Islam, M.; Karia, N.; Fauzi, F.A.; Afrin, S. Literature Review on Green Supply Chain Management: Trends and Future Challenges. Resour. Conserv. Recycl. 2019, 141, 145–162. [Google Scholar] [CrossRef] [Scilit]
- Ruf, B.; Muralidhar, K.; Brown, R.M.; Janney, J.J.; Paul, K. An Empirical Investigation of the Relationship between Change in Corporate Social Performance and Financial Performance: A Stakeholder Theory Perspective. J. Bus. Ethics 2001, 32, 143–156. [Google Scholar] [CrossRef] [Scilit]
- Nollet, J.; Filis, G.; Mitrokostas, E. Corporate Social Responsibility and Financial Performance: A Non-Linear and Disaggregated Approach. Econ. Model. 2016, 52, 400–407. [Google Scholar] [CrossRef] [Scilit]
- Brammer, S.; Brooks, C.; Pavelin, S. Corporate Social Performance and Stock Returns: UK Evidence from Disaggregate Measures. Financ. Manag. 2006, 35, 97–116. [Google Scholar] [CrossRef] [Scilit]
- Escrig-Olmedo, E.; Muñoz-Torres, M.J.; Fernández-Izquierdo, M.Á.; Rivera-Lirio, J.M. Lights and Shadows on Sustainability Rating Scoring. Rev. Manag. Sci. 2014, 8, 559–574. [Google Scholar] [CrossRef] [Scilit]
- Coulmont, M.; Berthelot, S.; Gagné, V. Sustainability Performance Indicator Trends: A Canadian Industry-Based Analysis. Int. J. Corp. Soc. Responsib. 2022, 7, 2. [Google Scholar] [CrossRef] [Scilit]
- Simpson, W.G.; Kohers, T. The Link between Corporate Social and Financial Performance: Evidence from the Banking Industry. J. Bus. Ethics 2002, 35, 97–109. [Google Scholar] [CrossRef] [Scilit]
- Barroso, F. La Responsabilidad Social Empresarial. Un Estudio en 40 Empresas de la Ciudad de Mérida Yucatán. Contaduría Adm. 2008, 226, 73–91. [Google Scholar]
- Vázquez-Maguirre, M.; Benito, A.E. Impact or Outputs? Exploring Multinational’s CSR Activities in Mexico. Sustainability 2022, 14, 4140. [Google Scholar] [CrossRef] [Scilit]
- Alonso-Almeida, M.D.M.; Rodríguez García, M.D.P.; Cortez Alejandro, K.A.; Abreu Quintero, J.L. Corporate Social Responsibility and Financial Performance: An Analysis in Mexican Publicly Traded Companies. Contaduría Adm. 2012, 57, 53–77. [Google Scholar]
- Pinzón-Castro, S.Y.; Maldonado-Guzmán, G. Effects of Sustainable Culture on CSR and Financial Performance in the Manufacturing Industry. Retos 2023, 13, 191–203. [Google Scholar] [CrossRef] [Scilit]
- López-Sarabia, P. Financial Effects of Corporate Governance and Business Ethics in Mexico: The Case of Cemex and TV-Azteca. Rev. Iberoam. Estrateg. 2006, 5, 117–126. [Google Scholar]
- Durán-Vázquez, R.; Lorenzo-Valdés, A.; Moreno-Quezada, E. Innovation and CSR Impact on Financial Performance of Selected Companies in Mexico. J. Entrep. Manag. Innov. 2012, 8, 5–20. [Google Scholar] [CrossRef] [Scilit]
- Nahuat, B.; Rodríguez, M.; Gómez, M. Innovation, Corporate Social Responsibility in Large Companies. Adm. Res. 2021, 50, 1–17. [Google Scholar] [CrossRef] [Scilit]
- Alonzo-Godoy, M.C. Corporate Social Responsibility as a Determinant of Sustainable Innovation and Organizational Performance: Empirical Study through Structural Equations Controlling for Firm Size and ESR® Badge. Ph.D. Thesis, Universidad Autónoma de Guadalajara, Guadalajara, Mexico, 2023. [Google Scholar]
- De Guimarães, J.C.F.; Dorion, E.C.H.; Severo, E.A. Antecedents, Mediators, and Consequences of Sustainable Operations: A Framework for Analysis of the Manufacturing Industry. Benchmarking Int. J. 2020, 27, 2189–2212. [Google Scholar] [CrossRef] [Scilit]
- Flammer, C. Corporate Social Responsibility and Shareholder Value: The Environmental Consciousness of Investors. Acad. Manag. J. 2013, 56, 758–781. [Google Scholar] [CrossRef] [Scilit]
- D’Agostini, M.; Tondolo, V.A.G.; Camargo, M.E.; Dullius, A.I.D.S.; Tondolo, R.D.R.P.; Russo, S.L. Relationship between Sustainable Operations Practices and Performance: A Meta-Analysis. Int. J. Product. Perform. Manag. 2017, 66, 1020–1042. [Google Scholar] [CrossRef] [Scilit]
- Tondolo, V.A.G.; D’Agostini, M.; Camargo, M.E.; Tondolo, R.D.R.P.; Souza, J.D.L.; Longaray, A.A. Sustainable Operations Practices and Sustainable Performance: Relationships and Moderators. Int. J. Product. Perform. Manag. 2021, 70, 1865–1888. [Google Scholar] [CrossRef] [Scilit]
- Eccles, R.G.; Ioannou, I.; George, S. The Impact of Corporate Sustainability on Organizational Processes and Performance. Manag. Sci. 2014, 60, 2835–2857. [Google Scholar] [CrossRef] [Scilit]
- Forker, J.J. Corporate Governance and Disclosure Quality. Account. Bus. Res. 1992, 22, 111–124. [Google Scholar] [CrossRef] [Scilit]
- Al Lawati, H.; Hussainey, K.; Sagitova, R. Disclosure Quality vis-à-vis Disclosure Quantity: Does Audit Committee Matter in Omani Financial Institutions? Rev. Quant. Finance Account. 2021, 57, 557–594. [Google Scholar] [CrossRef] [Scilit]
- Bloomberg ESG Scores. Available online: https://www.bloomberg.com/ (accessed on 14 July 2025).
- OECD. G20/OECD Principles of Corporate Governance 2023; OECD Publishing: Paris, France, 2023. [Google Scholar] [CrossRef] [Scilit]
- SASB Standards. Available online: https://sasb.ifrs.org/implementation-primer/ (accessed on 14 July 2025).
- Indriastuti, M.; Chariri, A. The Role of Green Investment and Corporate Social Responsibility Investment on Sustainable Performance. Cogent Bus. Manag. 2021, 8, 1960120. [Google Scholar] [CrossRef] [Scilit]
- Zhou, G.; Liu, L.; Luo, S. Sustainable Development, ESG Performance and Company Market Value: Mediating Effect of Financial Performance. Bus. Strategy Environ. 2022, 31, 3371–3387. [Google Scholar] [CrossRef] [Scilit]
- Friede, G.; Busch, T.; Bassen, A. ESG and Financial Performance: Aggregated Evidence from More Than 2000 Empirical Studies. J. Sustain. Finance Investig. 2015, 5, 210–233. [Google Scholar] [CrossRef] [Scilit]
- Freeman, R.E.; Reed, D.L. Stockholders and Stakeholders: A New Perspective on Corporate Governance. Calif. Manag. Rev. 1983, 25, 88–106. [Google Scholar] [CrossRef] [Scilit]
- Edmans, A. The End of ESG. Financ. Manag. 2023, 52, 3–17. [Google Scholar] [CrossRef] [Scilit]
- Waddock, S.A.; Graves, S.B. The Corporate Social Performance–Financial Performance Link. Strateg. Manag. J. 1997, 18, 303–319. [Google Scholar] [CrossRef]
- Garcia-Castro, R.; Ariño, M.A.; Canela, M.A. Does social performance really lead to financial performance? Accounting for endogeneity. J. Bus. Ethics 2010, 92, 107–126. [Google Scholar] [CrossRef] [Scilit]
- Qiu, Y.; Shaukat, A.; Tharyan, R. Environmental and Social Disclosures: Link with Corporate Financial Performance. Br. Account. Rev. 2016, 48, 102–116. [Google Scholar] [CrossRef] [Scilit]
- Goel, P. Implications of Corporate Governance on Financial Performance: An Analytical Review of Governance and Social Reporting Reforms in India. Asian J. Sustain. Soc. Responsib. 2018, 3, 4. [Google Scholar] [CrossRef] [Scilit]
- Drempetic, S.; Klein, C.; Zwergel, B. The Influence of Firm Size on the ESG Score: Corporate Sustainability Ratings under Review. J. Bus. Ethics 2020, 167, 333–360. [Google Scholar] [CrossRef] [Scilit]
- Bacinello, E.; Tontini, G.; Alberton, A. Influence of Corporate Social Responsibility on Sustainable Practices of Small and Medium-Sized Enterprises: Implications on Business Performance. Corp. Soc. Responsib. Environ. Manag. 2021, 28, 776–785. [Google Scholar] [CrossRef] [Scilit]
- Martínez-Campillo, A.; Cabeza-García, L.; Marbella-Sánchez, F. Corporate Social Responsibility and Financial Performance: Evidence on the Dual Direction of Causality in the Savings Bank Sector. Cuad. Econ. Dir. Empresa 2013, 16, 54–68. [Google Scholar] [CrossRef] [Scilit]
- Busch, T.; Friede, G. The Robustness of the Corporate Social and Financial Performance Relation: A Second-Order Meta-Analysis. Corp. Soc. Responsib. Environ. Manag. 2018, 25, 583–608. [Google Scholar] [CrossRef] [Scilit]
- Thompson, R.; Martinez, A.; Johnson, K. Predicting ESG Controversies in Banks Using Machine Learning Techniques. Corp. Soc. Responsib. Environ. Manag. 2024, 31, 1245–1258. [Google Scholar]
- Zhang, H.; Liu, P.; Chen, S. ESG Ratings Explainability through Machine Learning Techniques. Ann. Oper. Res. 2023, 315, 421–448. [Google Scholar] [CrossRef] [Scilit]
- D’Amato, V.; D’Ecclesia, R.; Levantesi, S. Does Good ESG Lead to Better Financial Performances by Firms? Machine Learning and Logistic Regression Models of Public Enterprises in Europe. Sustainability 2020, 12, 5317. [Google Scholar] [CrossRef] [Scilit]
- Tsai, P.-F.; Gao, C.-H.; Yuan, S.-M. Stock selection using machine learning based on financial ratios. Mathematics 2023, 11, 4758. [Google Scholar] [CrossRef] [Scilit]
- Orlitzky, M. Institutional Logics in the Study of Organizations: The Social Construction of the Relationship between Corporate Social and Financial Performance. Bus. Ethics Q. 2011, 21, 409–444. [Google Scholar] [CrossRef] [Scilit]
- Bruna, M.G.; Đặng, R.; Ammari, A.; Houanti, L.H. The Effect of Board Gender Diversity on Corporate Social Performance: An Instrumental Variable Quantile Regression Approach. Finance Res. Lett. 2021, 40, 101734. [Google Scholar] [CrossRef] [Scilit]
- Breiman, L. Random forests. Mach. Learn. 2001, 45, 5–32. [Google Scholar] [CrossRef] [Scilit]
- Goldstein, A.; Kapelner, A.; Bleich, J.; Pitkin, E. Peeking inside the black box: Visualizing statistical learning with plots of individual conditional expectation. J. Comput. Graph. Stat. 2015, 24, 44–65. Available online: https://www.jstor.org/stable/43304932 (accessed on 7 November 2025). [CrossRef] [Scilit]
- Friedman, J.H. Greedy Function Approximation: A Gradient Boosting Machine. Ann. Statist. 2001, 29, 1189–1232. [Google Scholar] [CrossRef] [Scilit]
- Lundberg, S.M.; Lee, S.I. A Unified Approach to Interpreting Model Predictions. Adv. Neural Inf. Process. Syst. 2017, 30, 4765–4774. [Google Scholar]
- Hastie, T.; Tibshirani, R.; Friedman, J. The Elements of Statistical Learning: Data Mining, Inference, and Prediction; Springer: New York, NY, USA, 2009. [Google Scholar]
- Jimenez-Casillas, L.; Velazquez-Salazar, M.; Rodríguez-Aguilar, R. Corporate Social Responsibility and Financial Performance: Evidence from Public Companies Listed on the Mexican Stock Exchange. Scopus Conf. Proc. 2025, in press. [Google Scholar]
- D’Amato, V.; D’Ecclesia, R.; Levantesi, S. Firms’ Profitability and ESG Score: A Machine Learning Approach. Appl. Stoch. Models Bus. Ind. 2024, 40, 243–261. [Google Scholar] [CrossRef] [Scilit]
- Coelho, R.; Jayantilal, S.; Ferreira, J.J. The Impact of Social Responsibility on Corporate Financial Performance: A Systematic Literature Review. Corp. Soc. Responsib. Environ. Manag. 2023, 30, 1535–1560. [Google Scholar] [CrossRef] [Scilit]
- Velte, P.; Stawinoga, M. Do Chief Sustainability Officers and CSR Committees Influence CSR-Related Outcomes? A Structured Literature Review Based on Empirical-Quantitative Research Findings. J. Manag. Control 2020, 31, 333–377. [Google Scholar] [CrossRef] [Scilit]
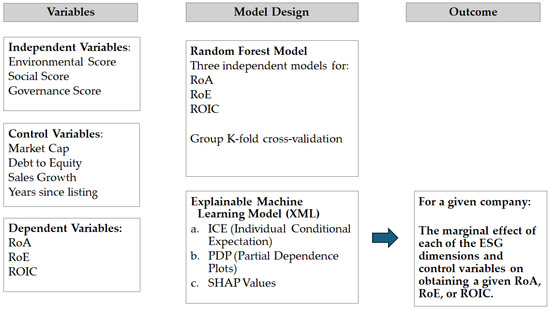
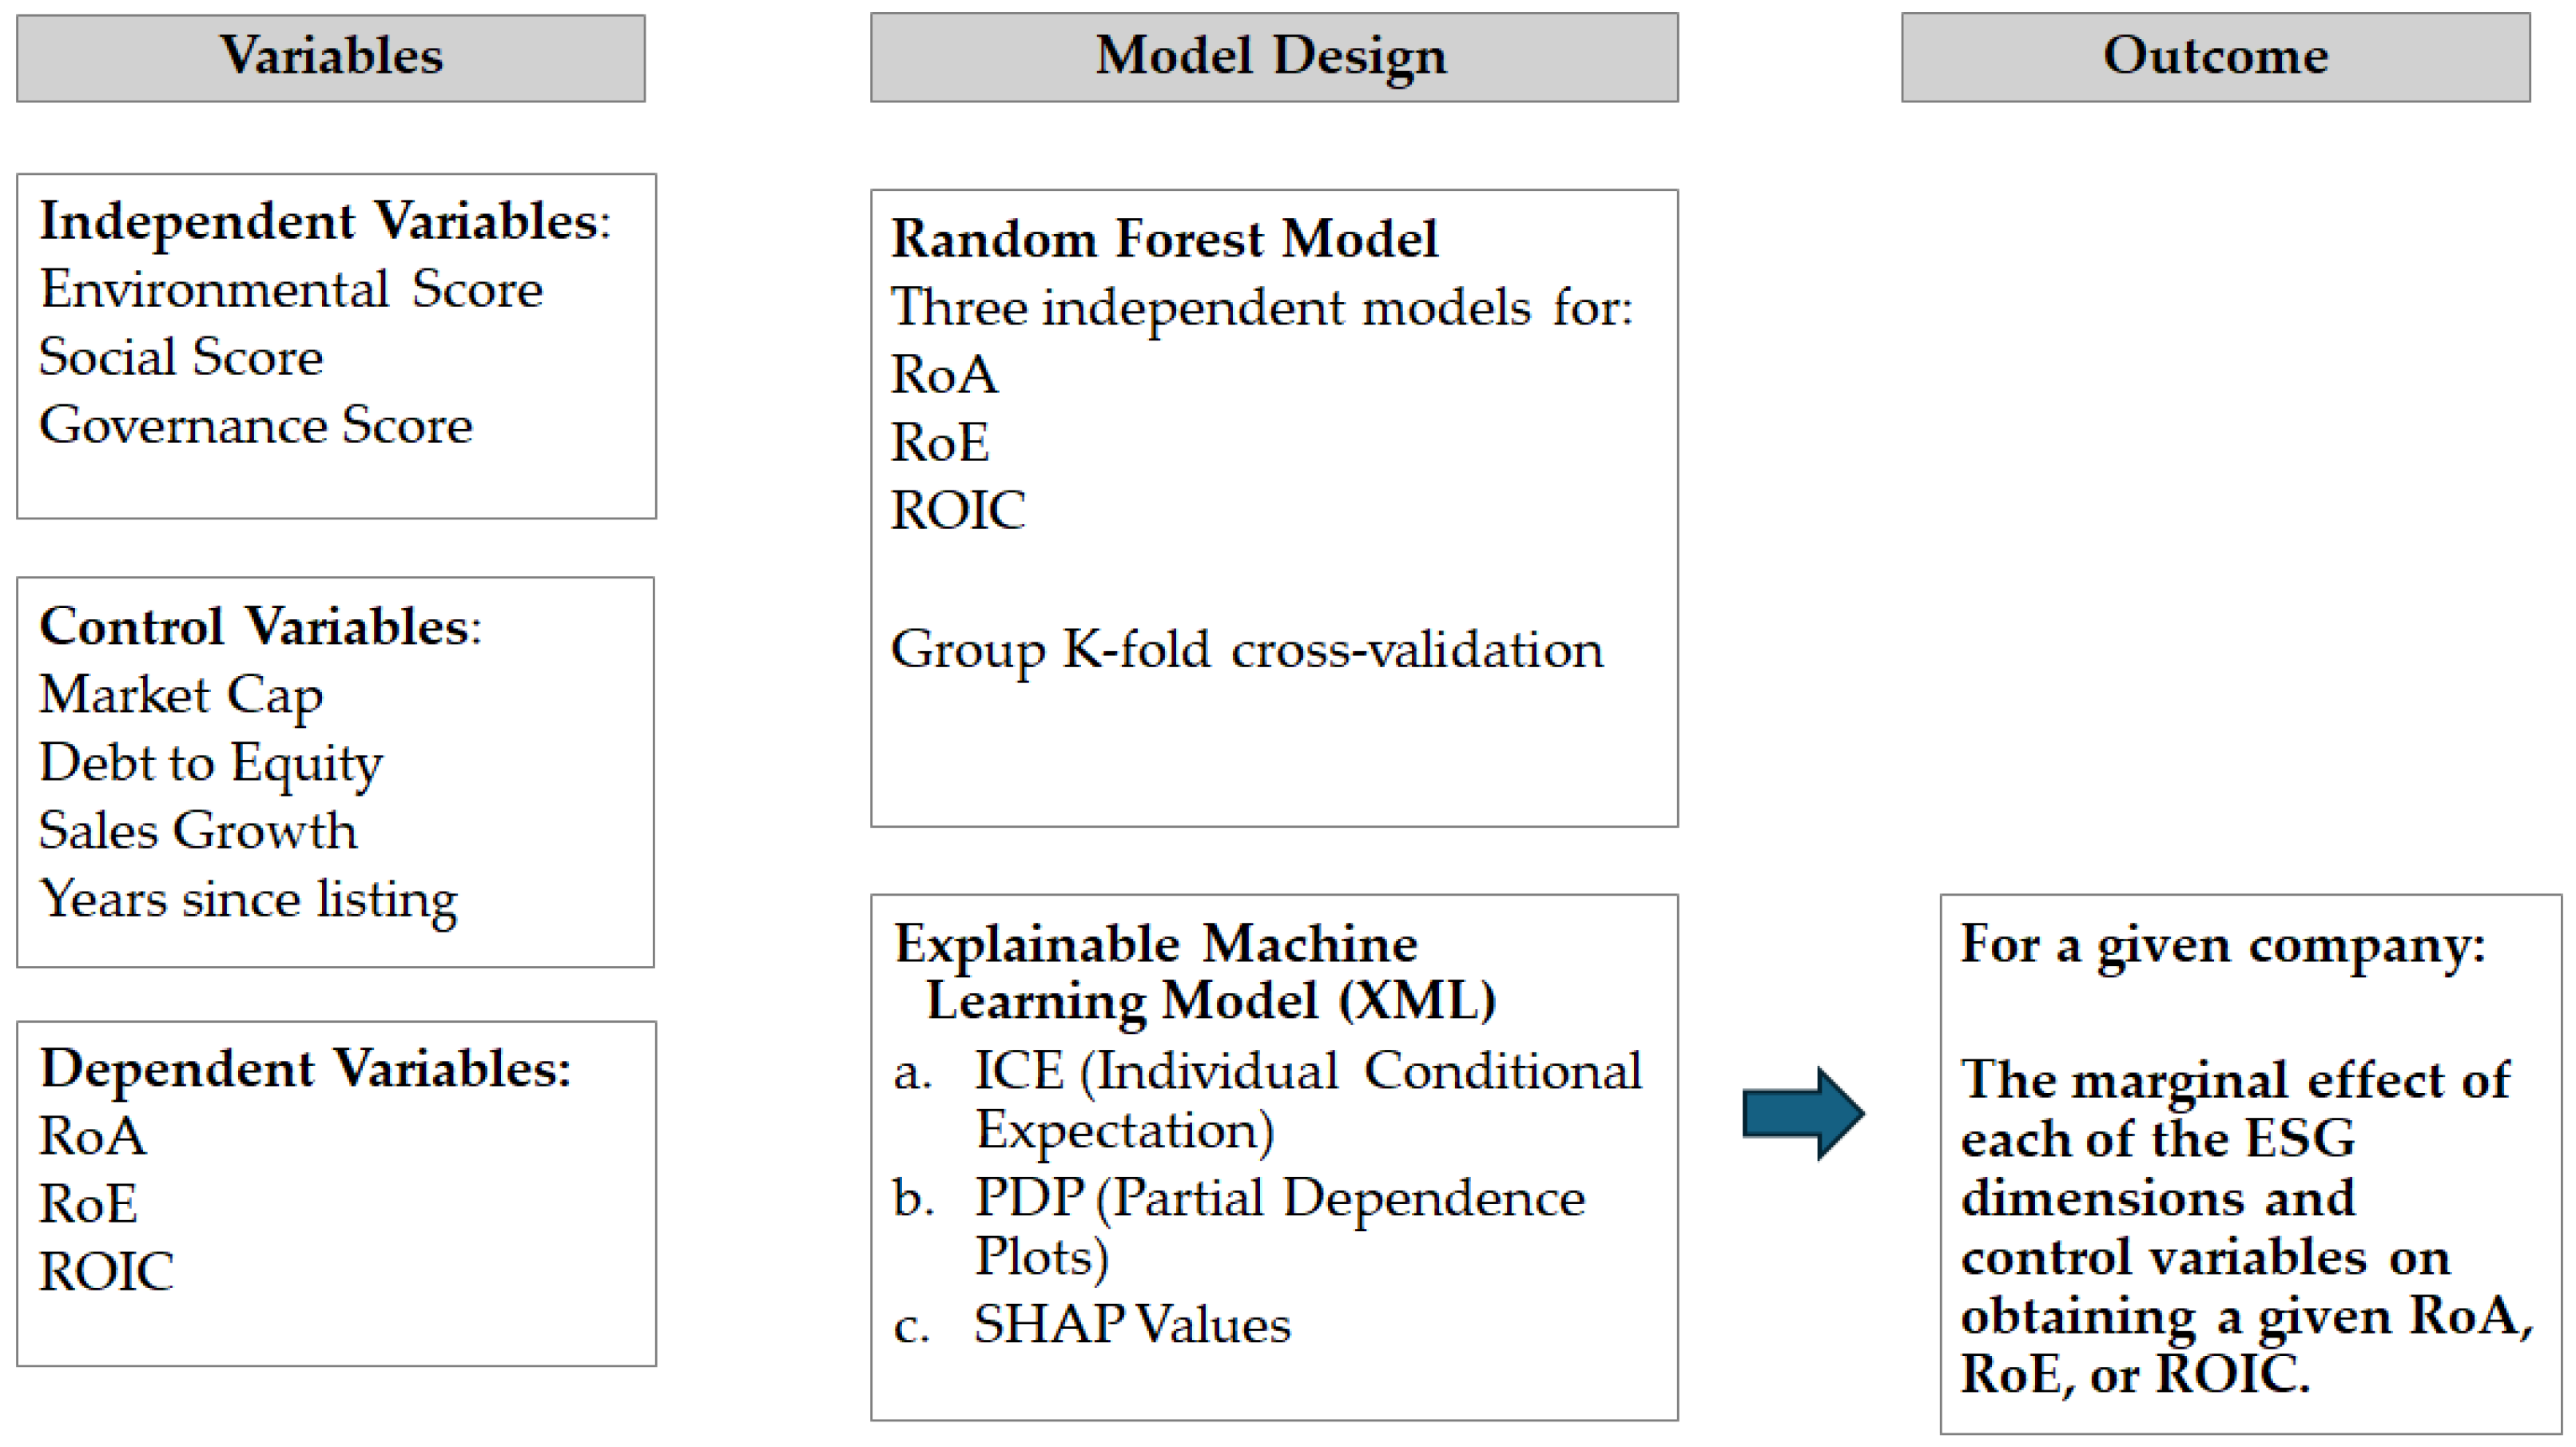
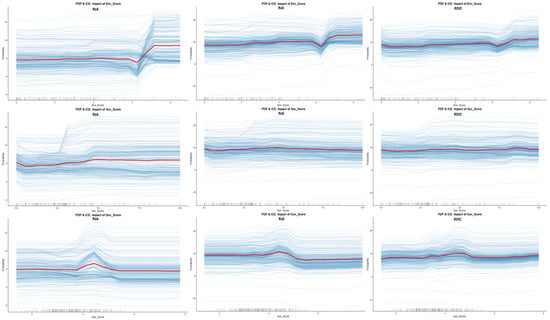
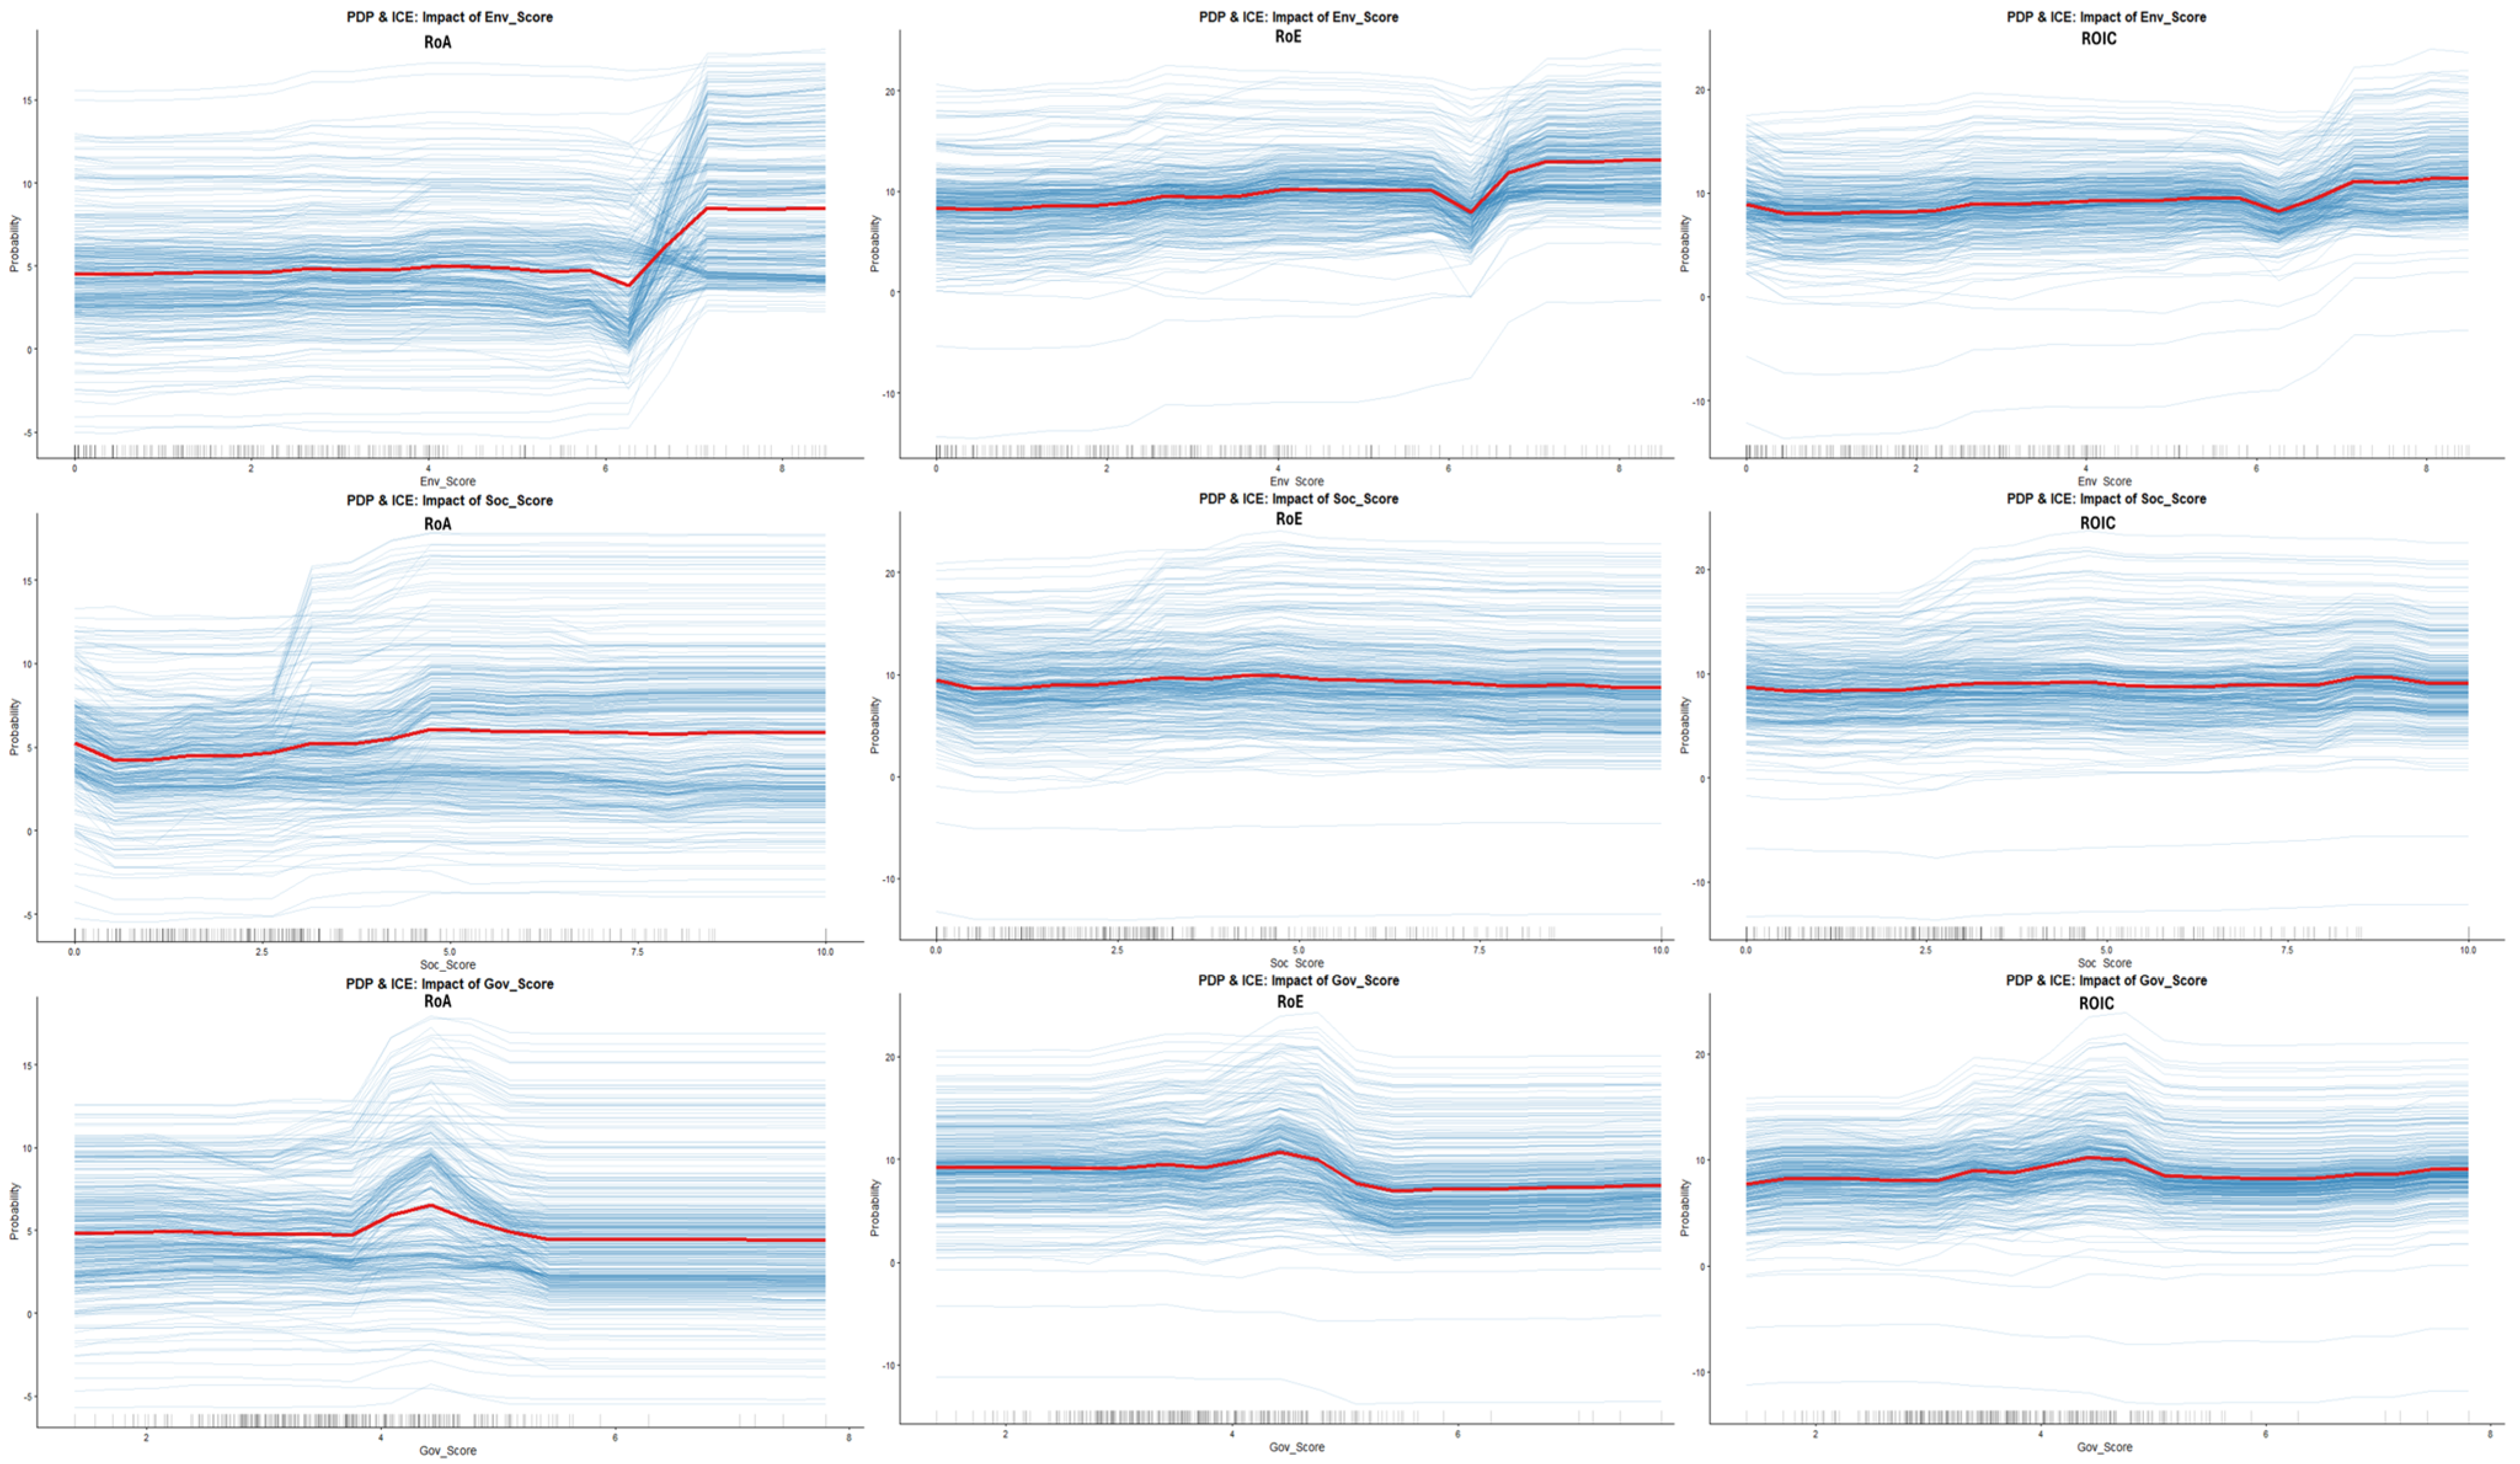
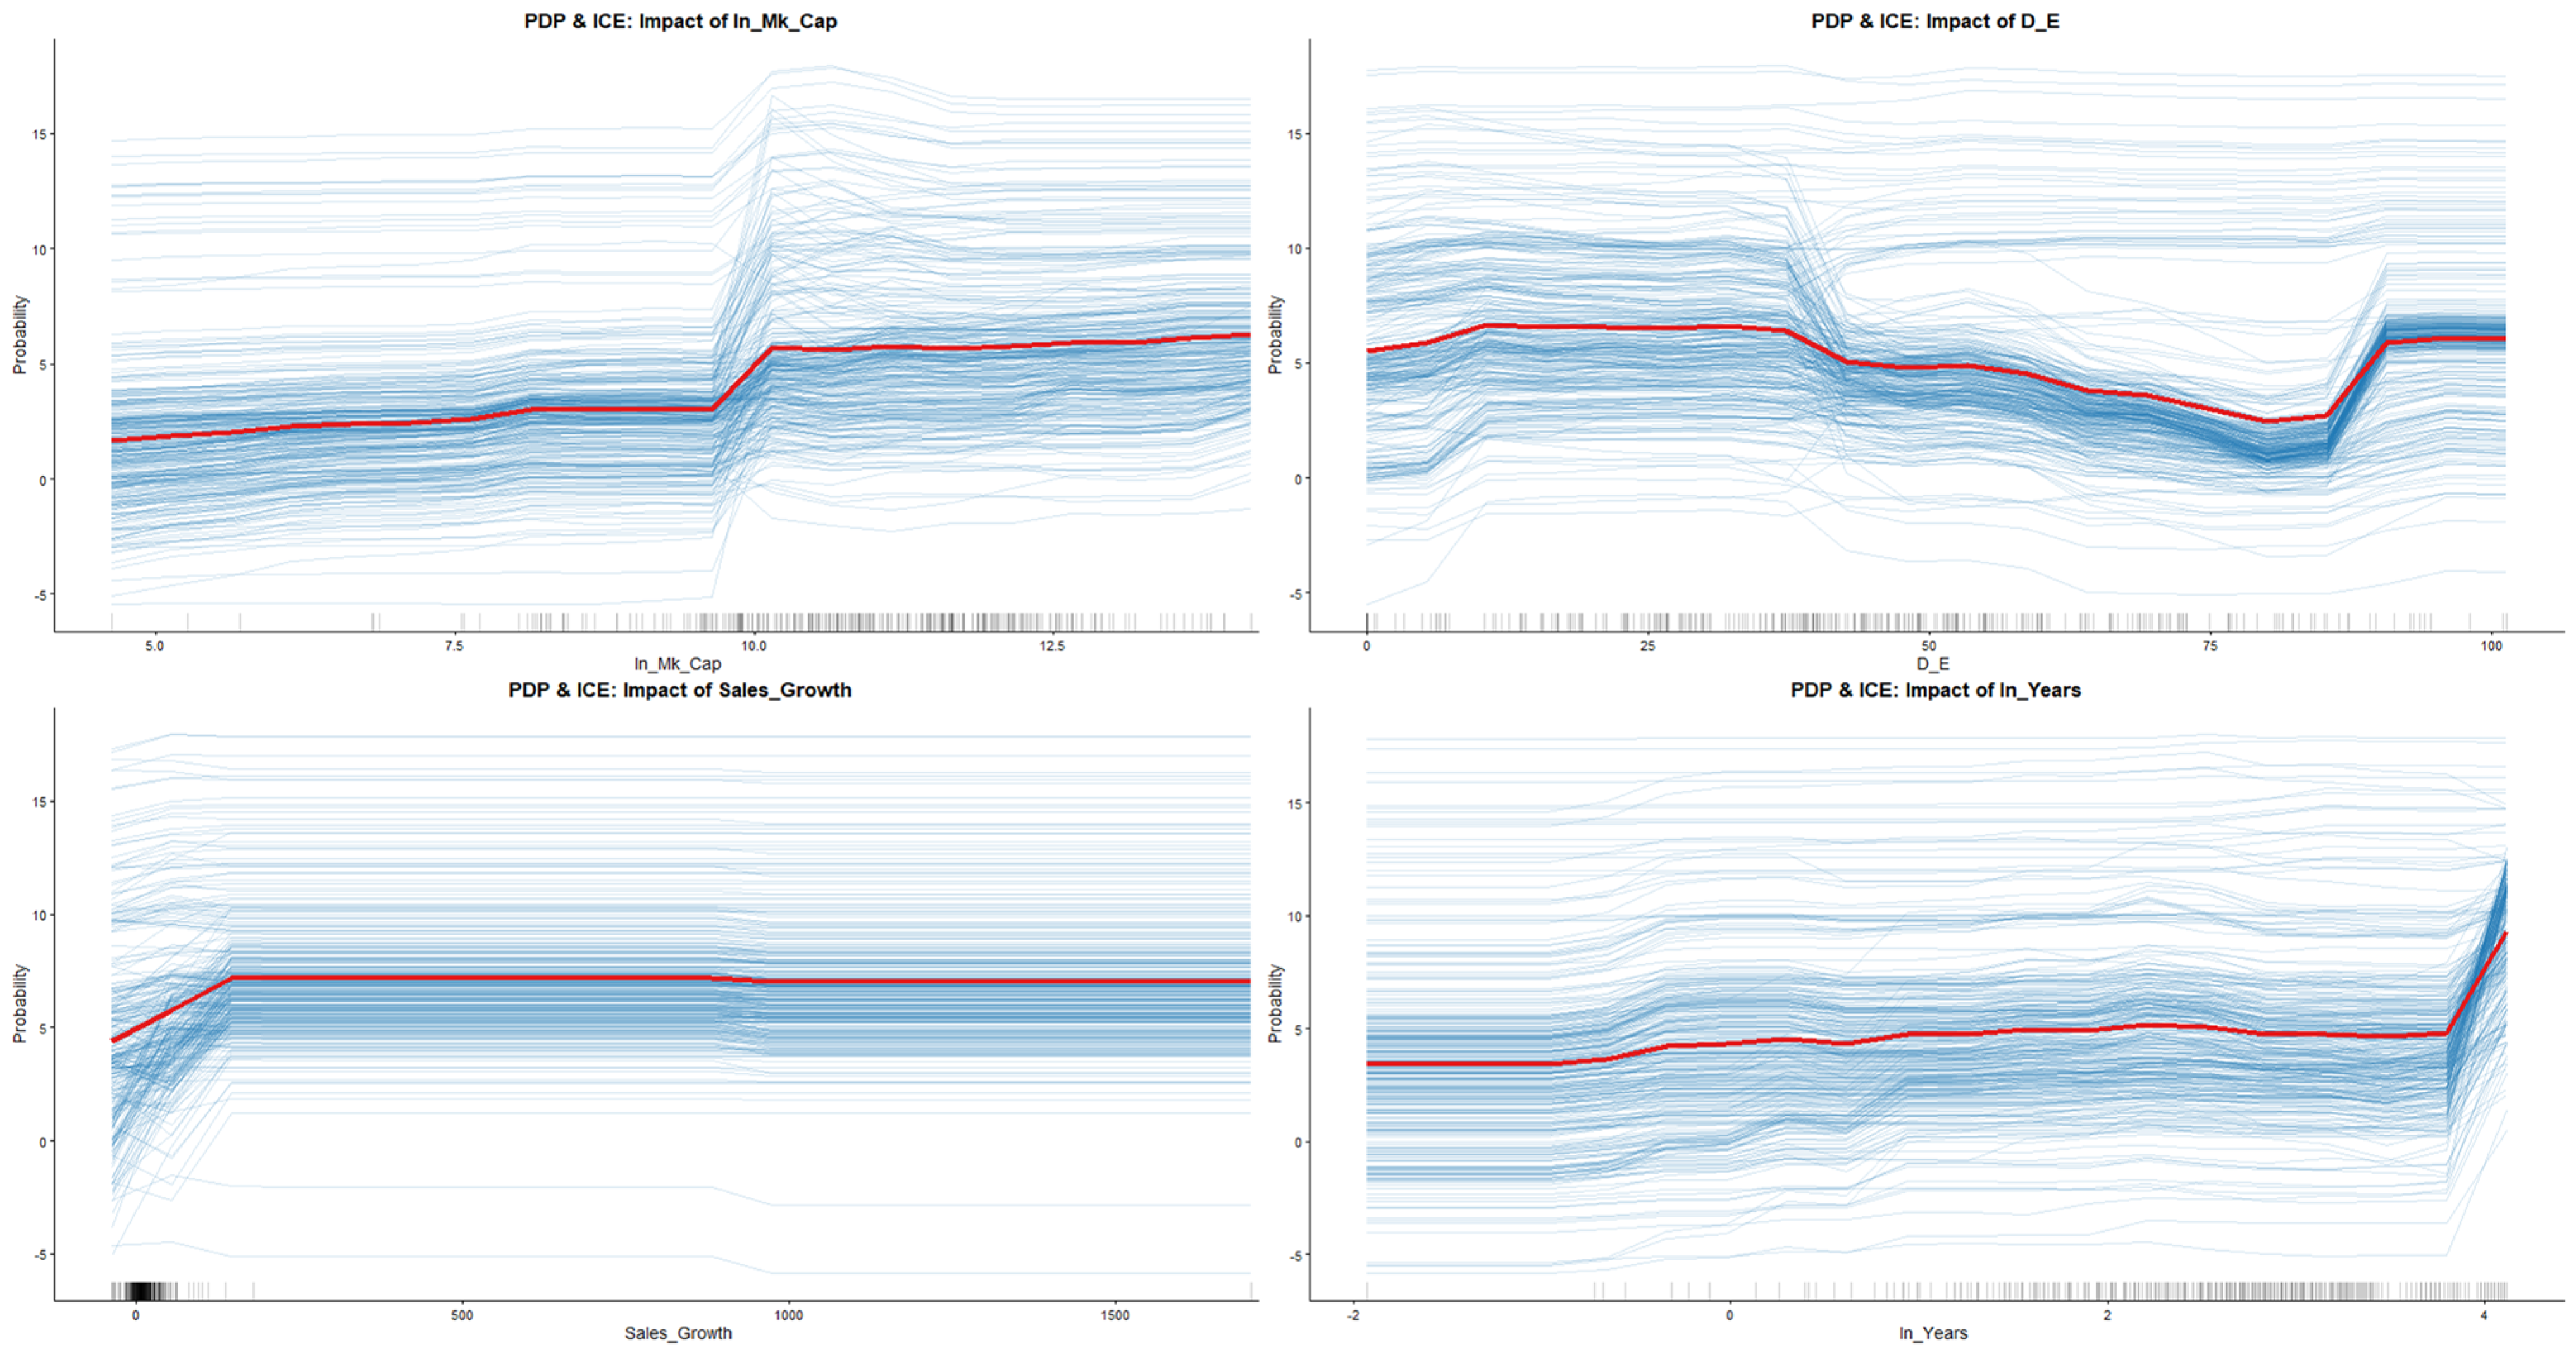
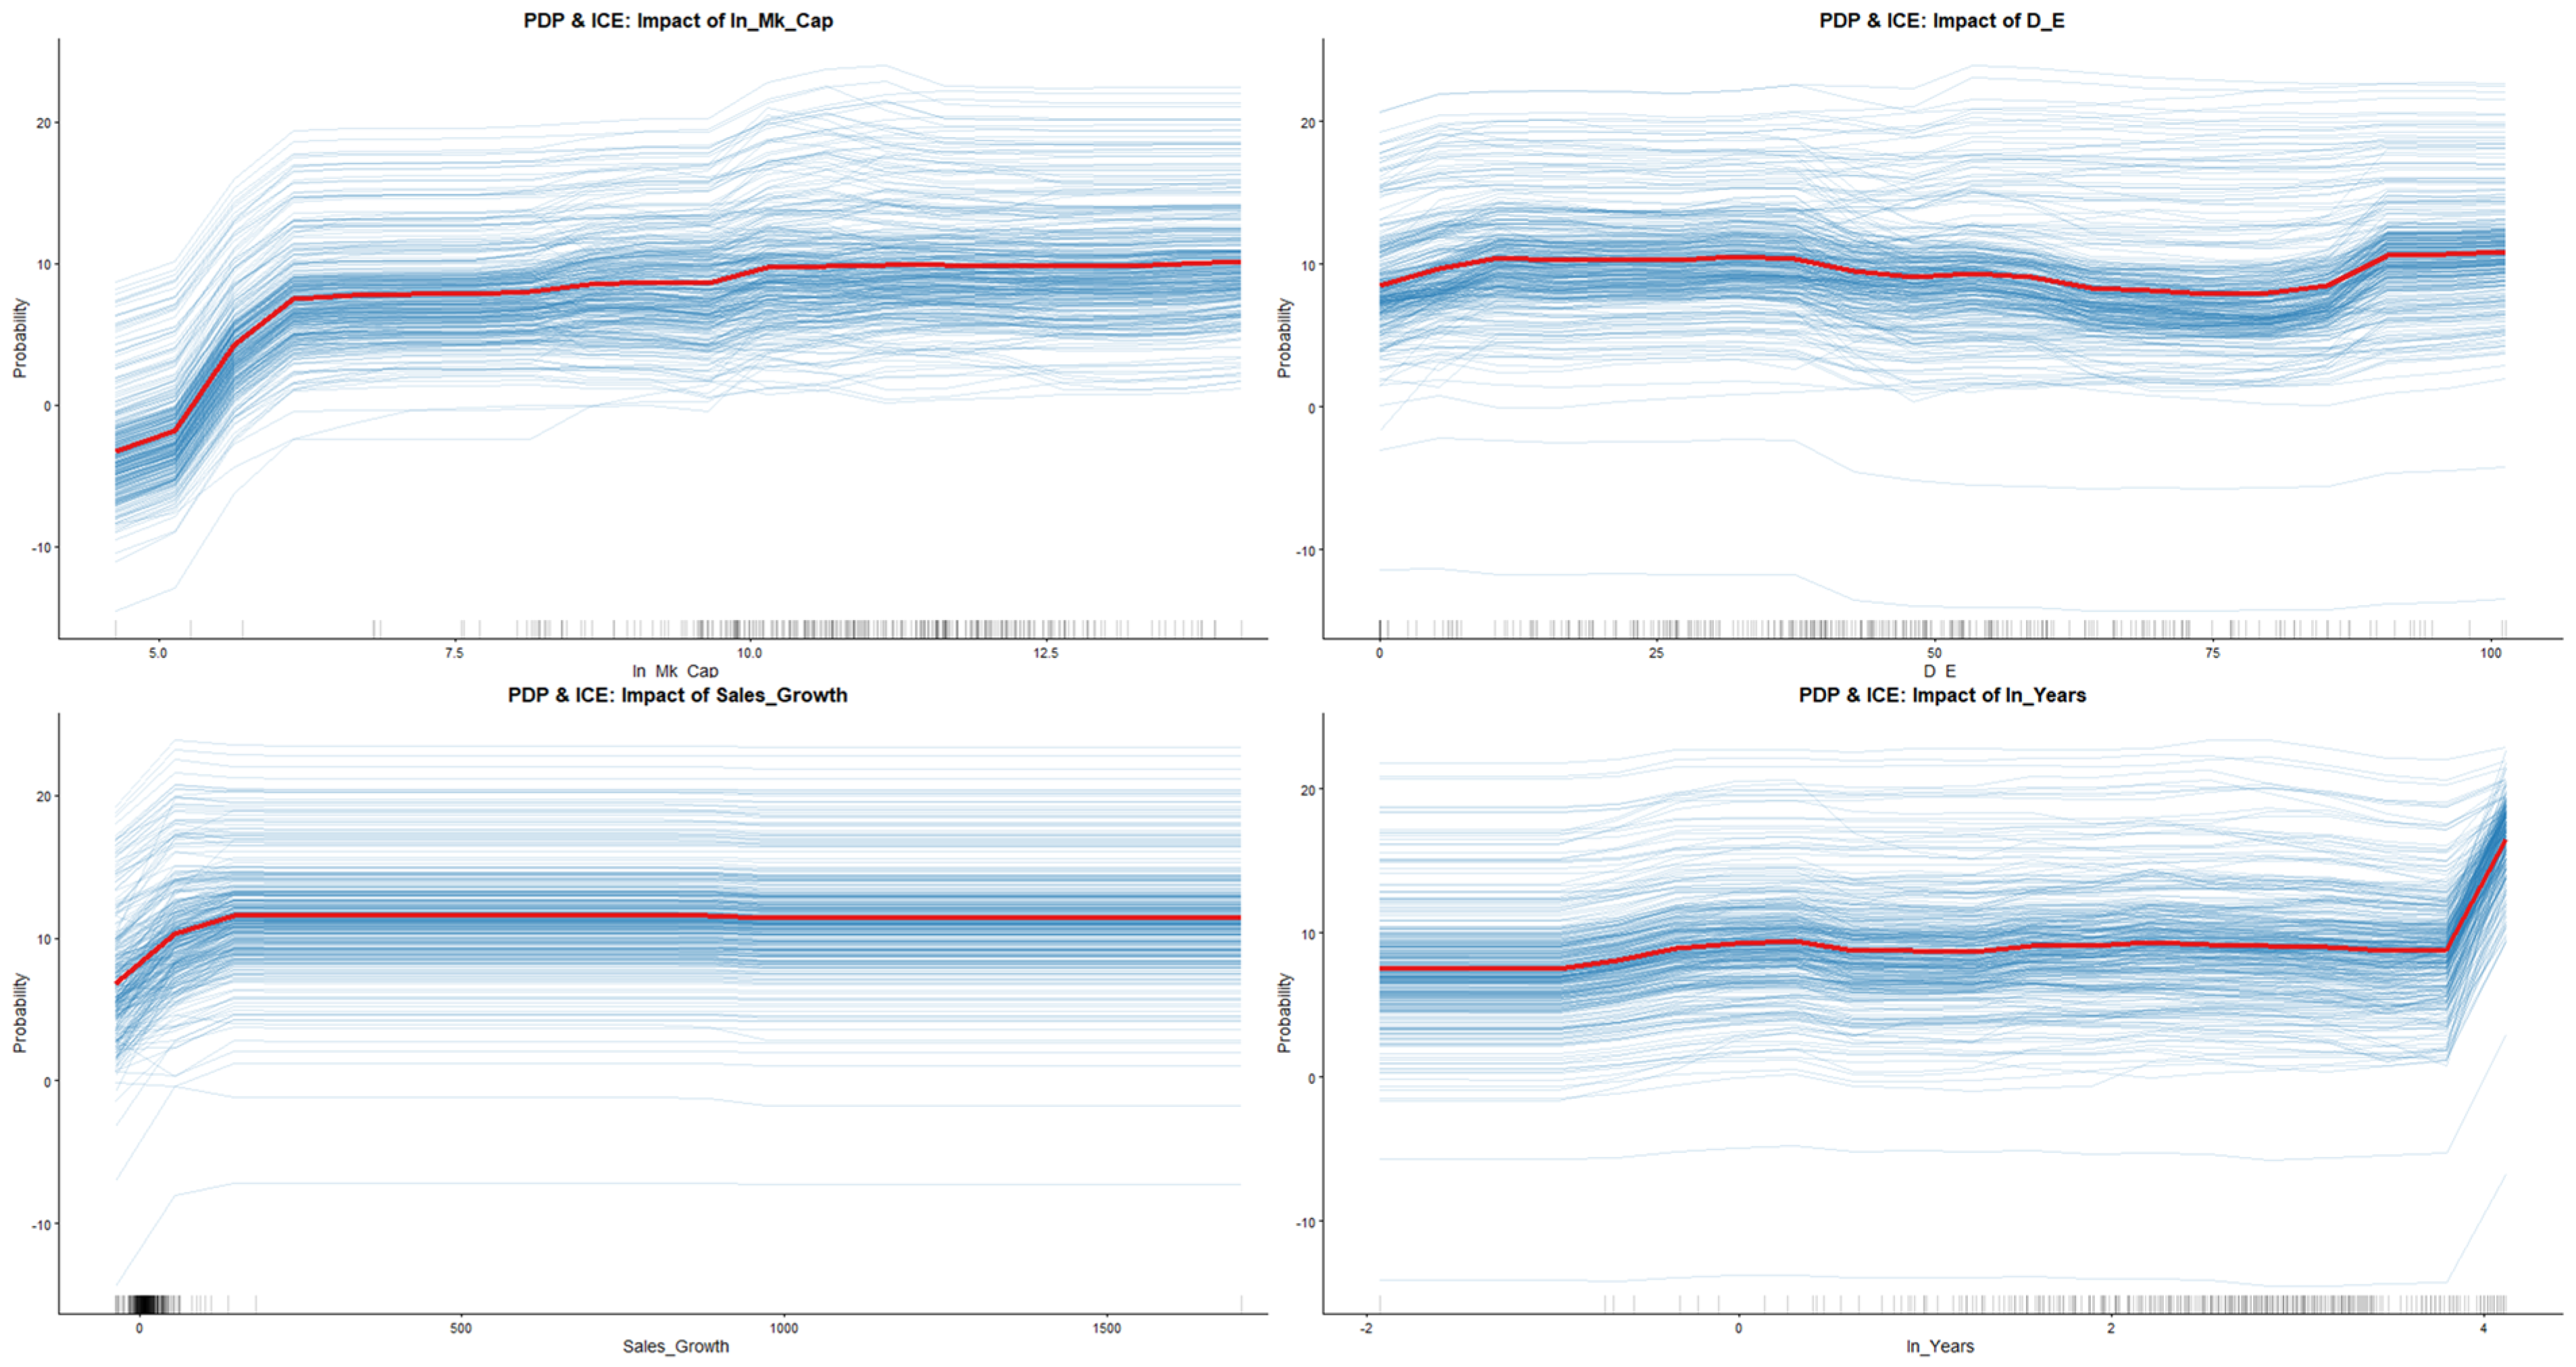
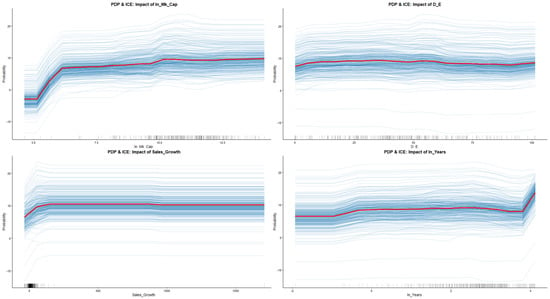
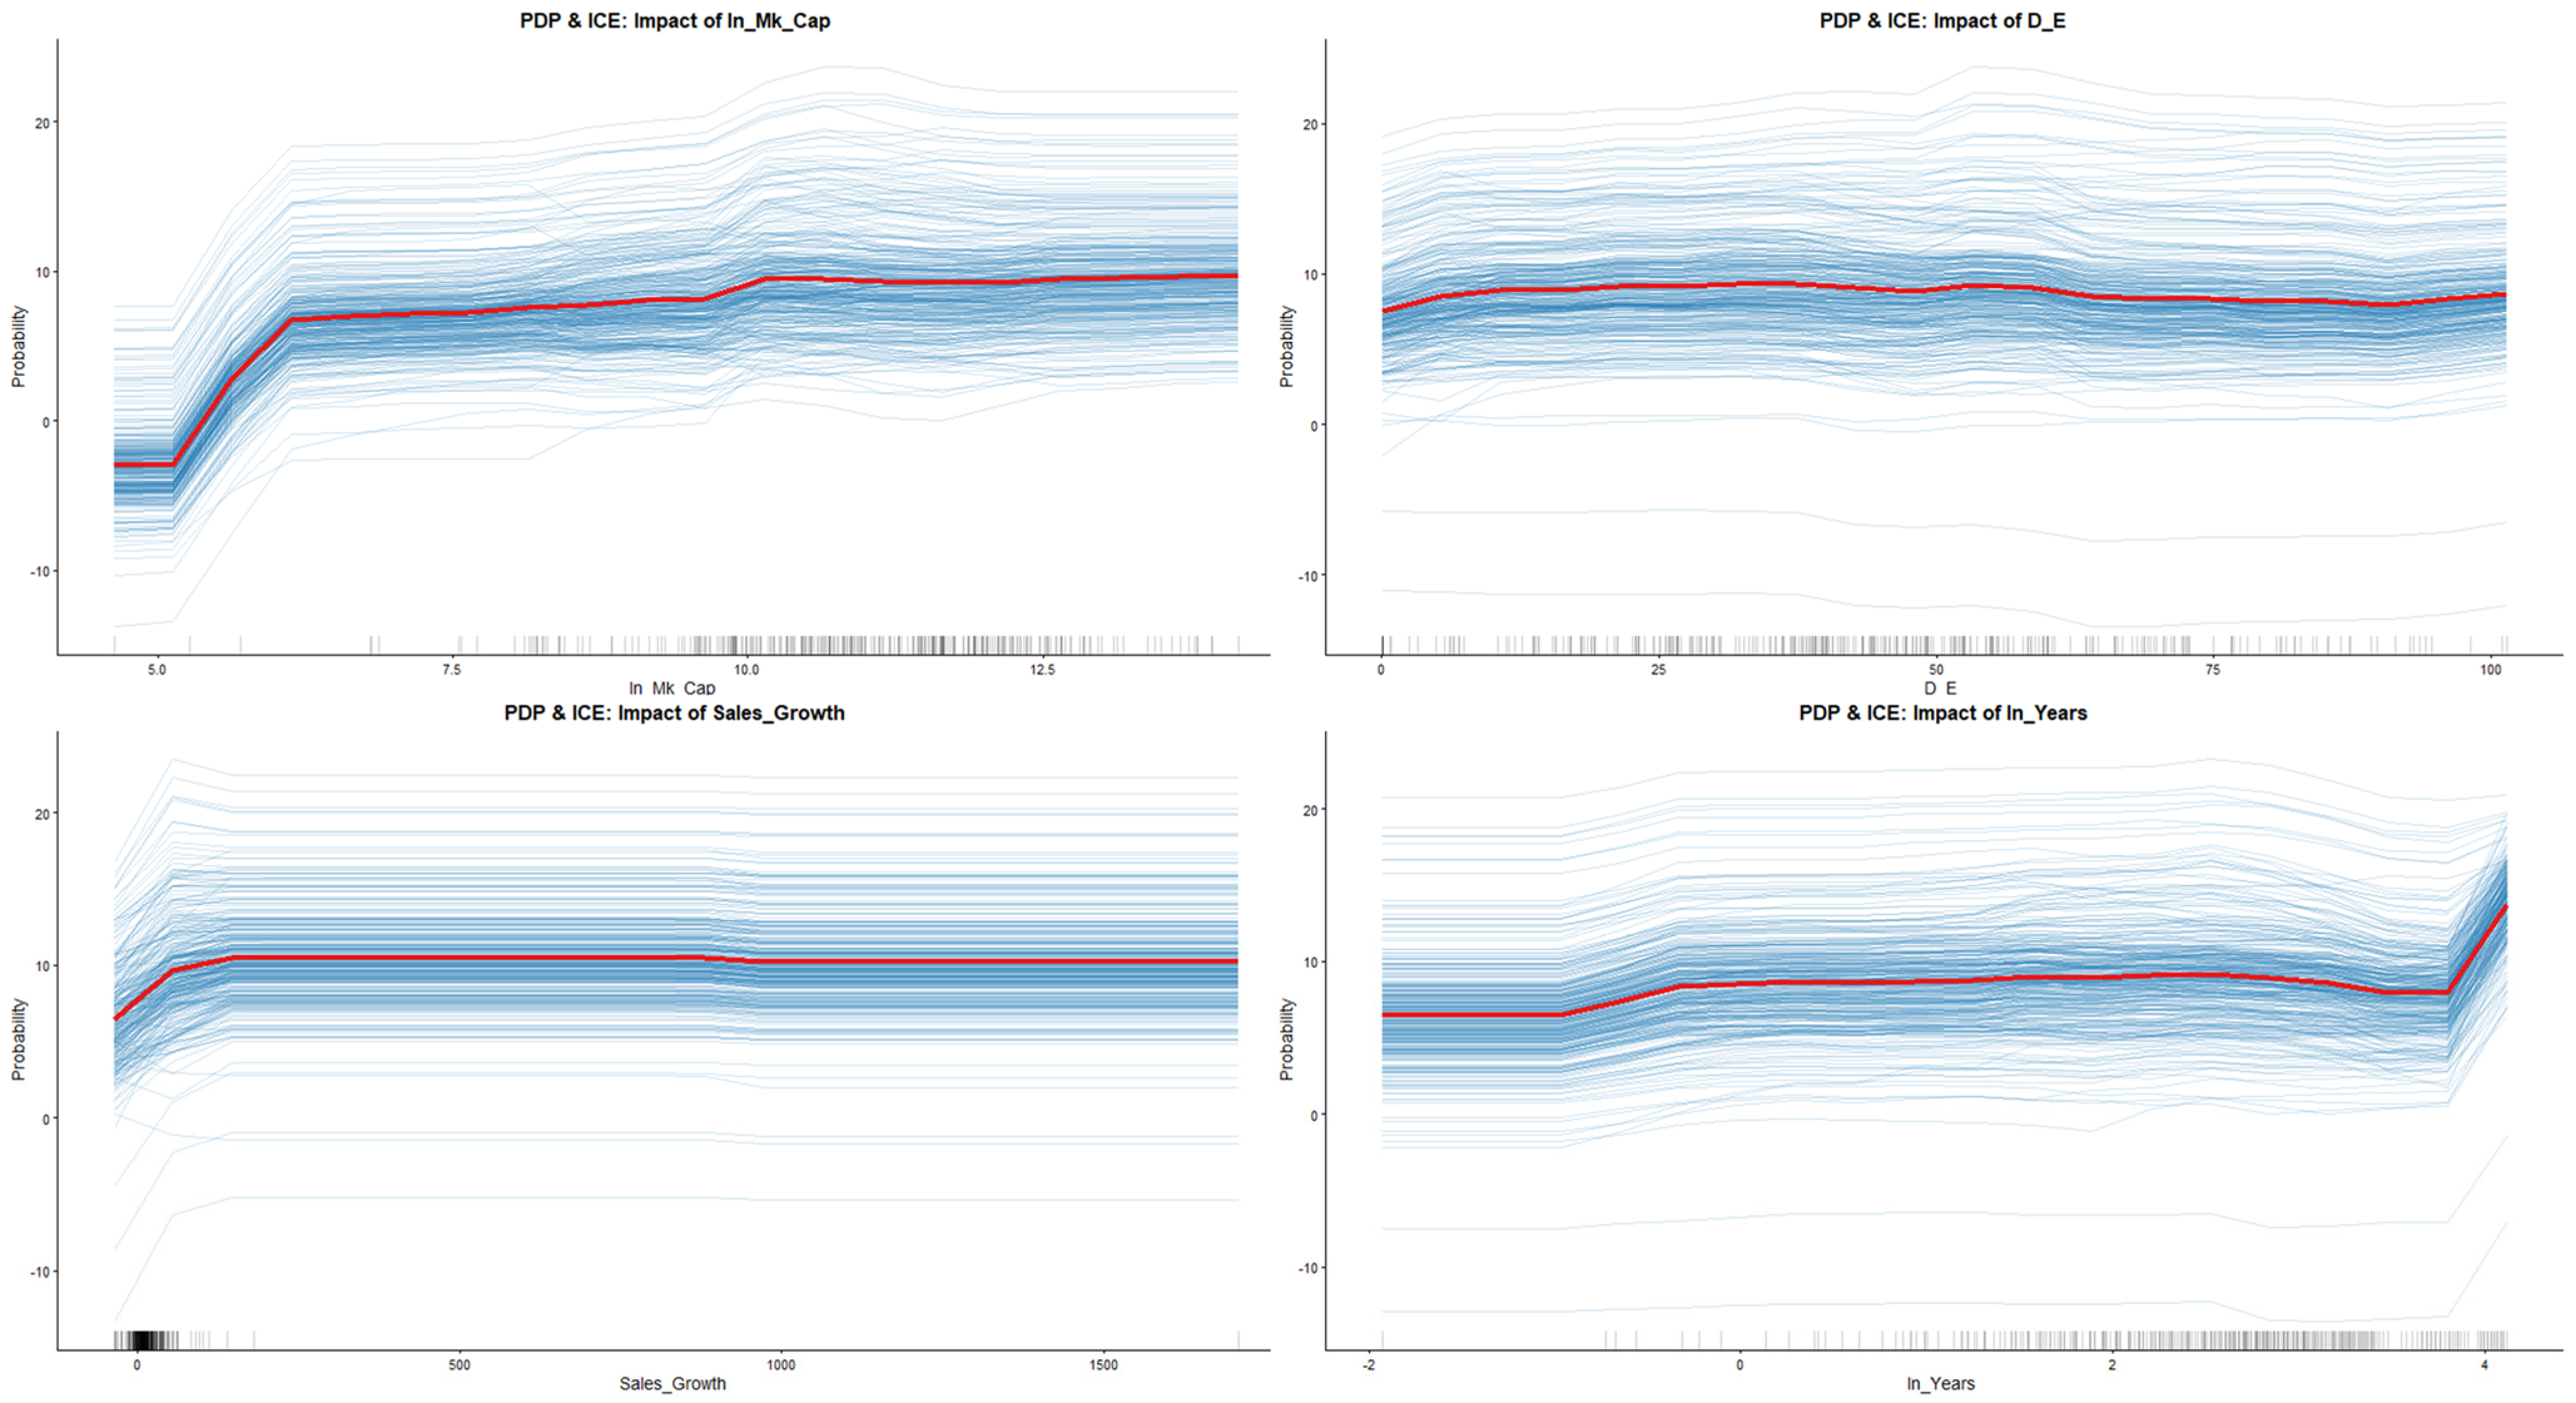
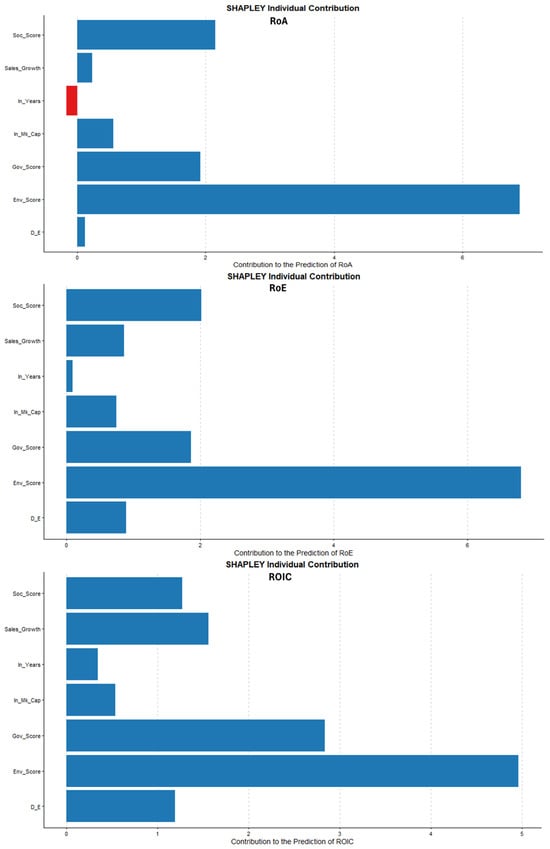
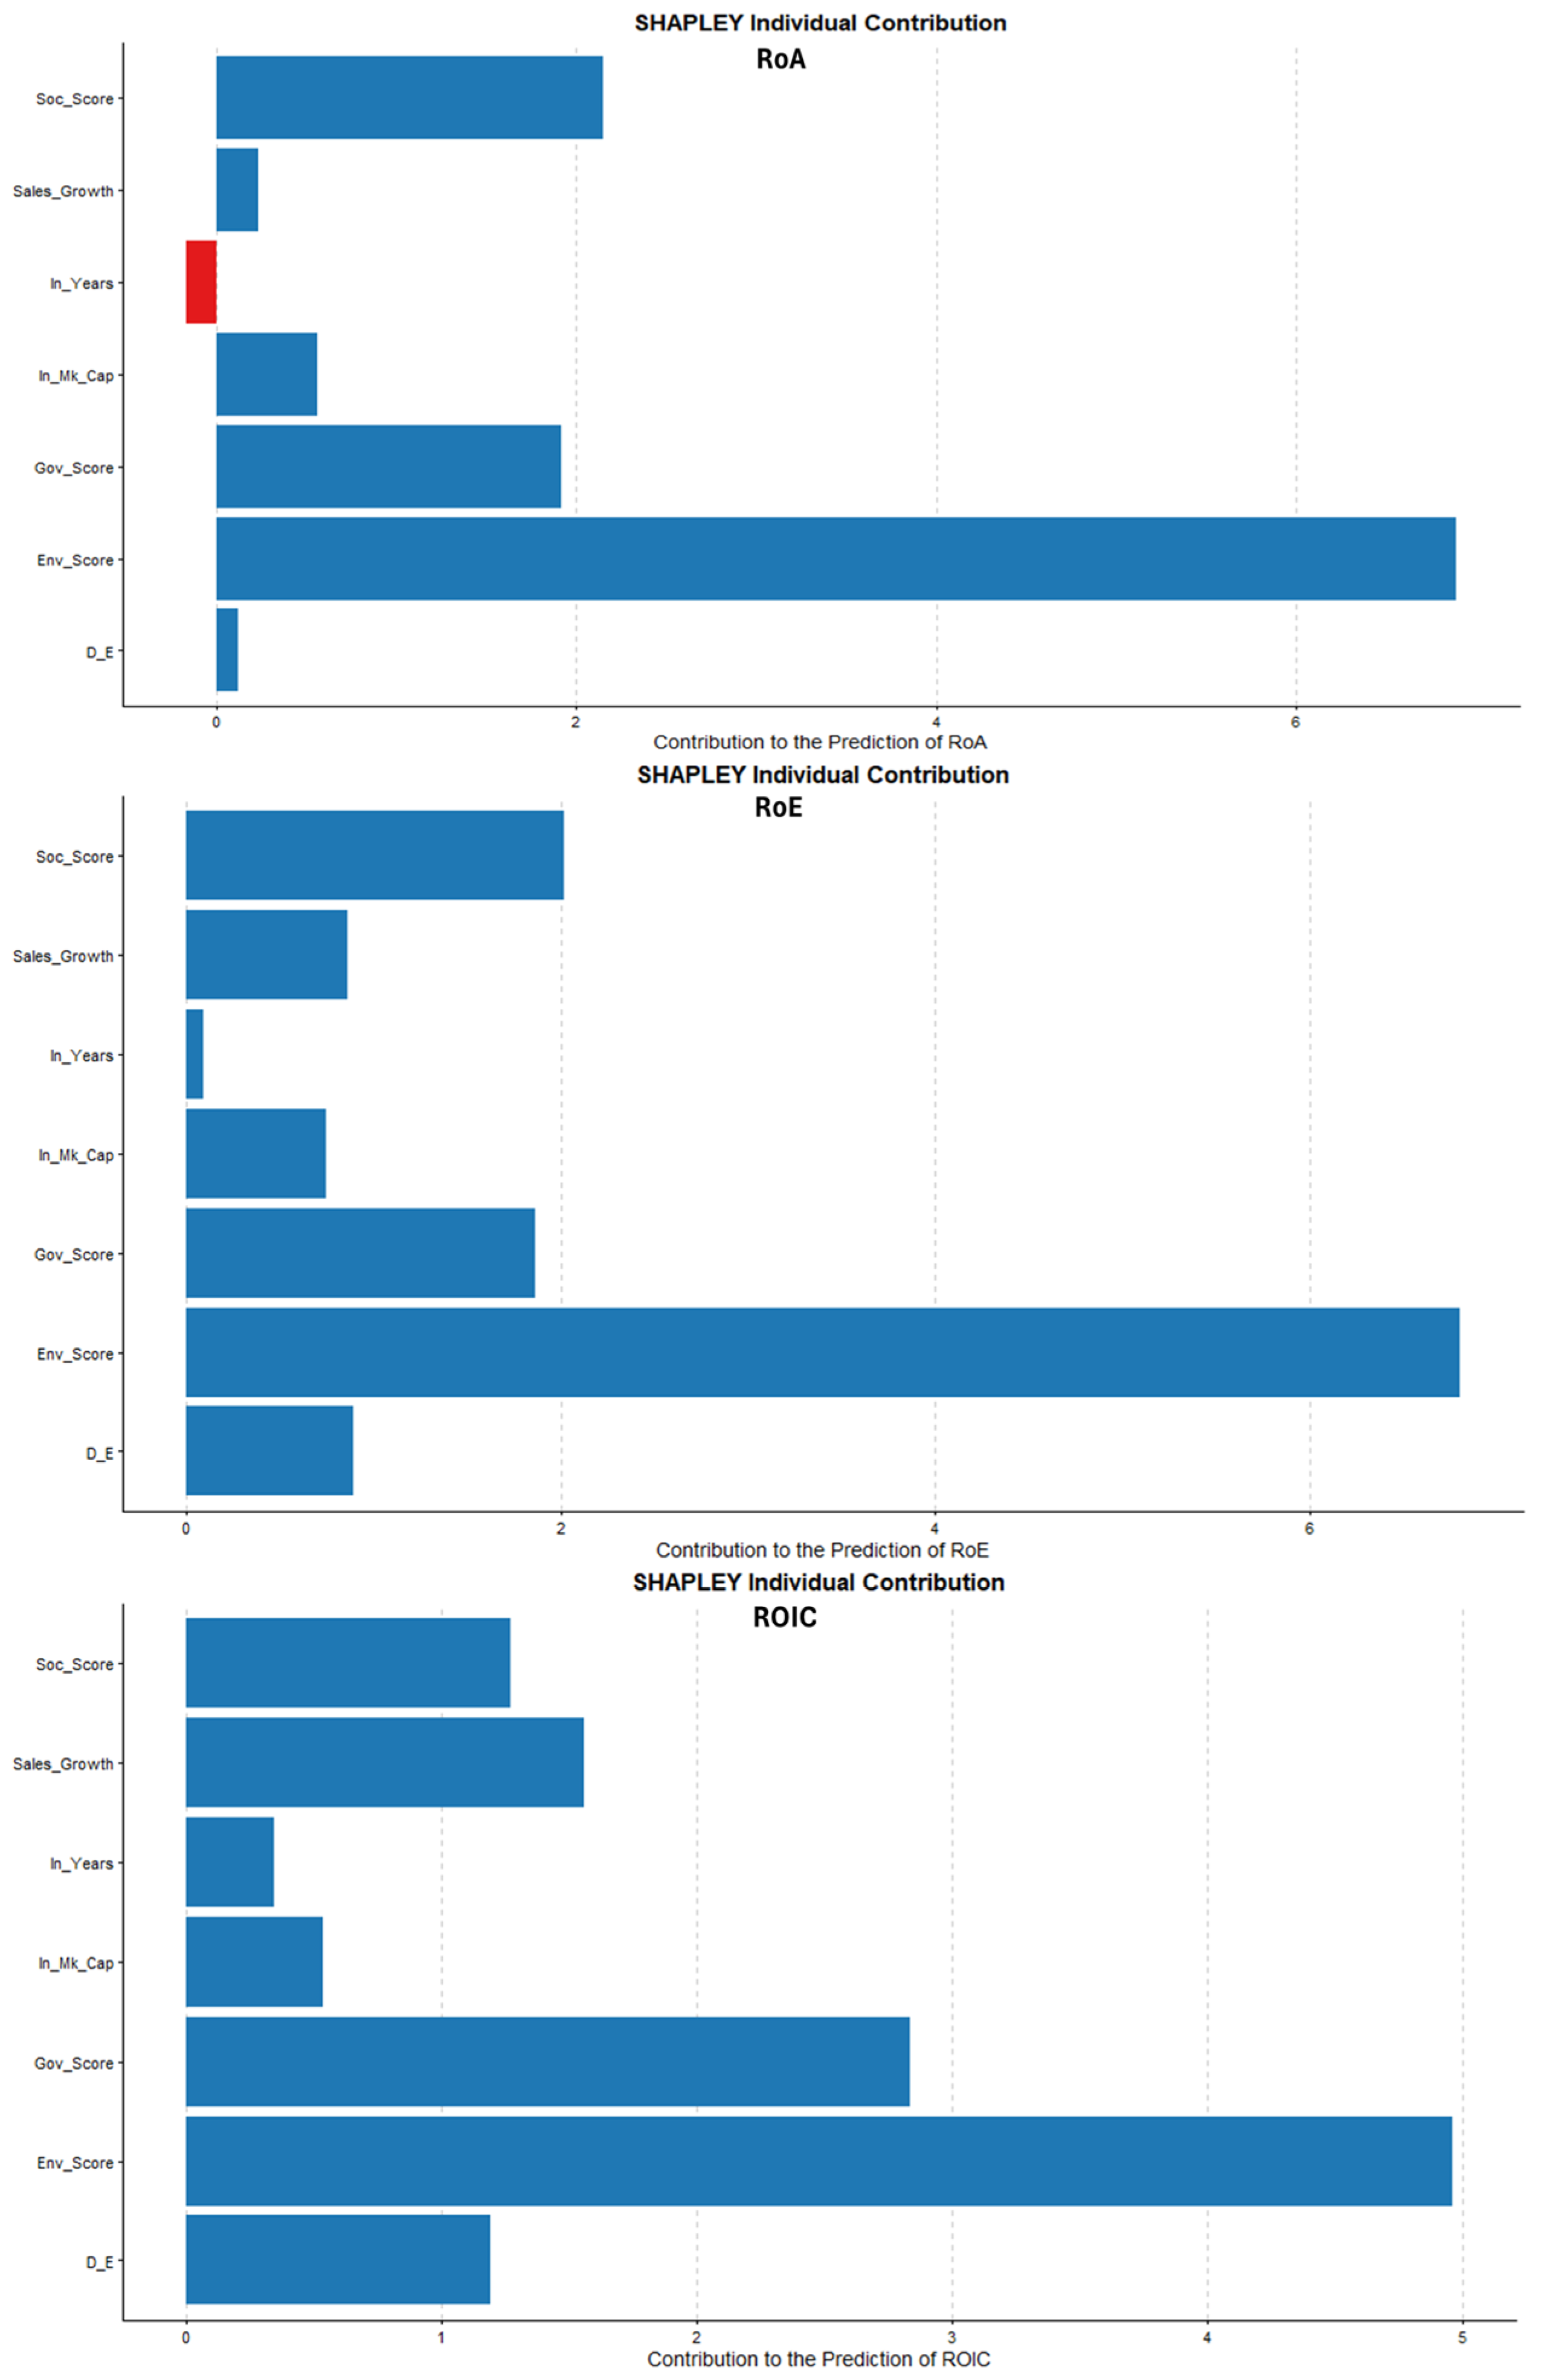

Disclaimer/Publisher’s Note: The statements, opinions and data contained in all publications are solely those of the individual author(s) and contributor(s) and not of MDPI and/or the editor(s). MDPI and/or the editor(s) disclaim responsibility for any injury to people or property resulting from any ideas, methods, instructions or products referred to in the content. |
© 2026 by the authors. Licensee MDPI, Basel, Switzerland. This article is an open access article distributed under the terms and conditions of the Creative Commons Attribution (CC BY) license.