Article

Determinants of Sustainable Investment in the Shipping Supply Chain: A Fuzzy Multi-Method Assessment Approach

1
School of Maritime Economics and Management, Dalian Maritime University, Dalian 116026, China
2
School of Public Administration, Dongbei University of Finance and Economics, Dalian 116025, China
*
Author to whom correspondence should be addressed.
Mathematics 2026, 14(10), 1678; https://doi.org/10.3390/math14101678
Submission received: 17 April 2026 / Revised: 11 May 2026 / Accepted: 12 May 2026 / Published: 14 May 2026

Abstract

Port and shipping enterprises face significant uncertainty in making effective sustainable investment decisions to meet pressing carbon reduction targets. This study addresses this challenge by developing a fuzzy multi-method framework to identify and prioritize pivotal factors that guide sustainable investments. An evolutionary game model simulates the influencing factors, while the triangular fuzzy number (TFN) and evidential reasoning (ER) algorithm assess their importance and operability. The decision-making trial and evaluation laboratory (DEMATEL) method further refines these assessments. Finally, the Bayesian probability method corrects the posteriori probability, providing a comprehensive ranking. The results reveal that low-carbon technology is the most critical driver of sustainable investment, whereas environmental factors consistently rank the lowest in importance. This methodology aids ports and shipping enterprises in making sustainable investment decisions to reduce carbon emissions.

1. Introduction

Escalating climate change and global decarbonization mandates have pushed sustainable development to the core of the modern industrial agenda [1,2]. This imperative is particularly acute for the maritime supply chain. As the backbone of global trade responsible for over 80% of international commodity movement, its environmental impact is under intense scrutiny [3]. According to data from the International Maritime Organization (IMO) in 2020, international shipping emitted 1056 million tonnes of CO2 emissions (CO2) and 1076 million tonnes of carbon dioxide equivalent (CO2e) in 2018. The share of shipping emissions in global anthropogenic emissions has increased from 2.76% in 2012 to 2.89% in 2018 [4]. IMO has set goals to curb greenhouse gas emissions from shipping, targeting net-zero emissions by 2050 and requiring at least 5% of the global fleet’s energy to be from zero or near-zero emission fuels by 2030 [5].
To foster sustainability in the maritime supply chain, governments and regulatory bodies worldwide have enacted various policies and incentives [6]. For example, the Chinese government has taken significant steps to promote green shipping, including the implementation scheme of the Domestic Emission Control Areas for Atmospheric Pollution in 2018 and the issue of the Action Plan for Green Development in the Shipbuilding Industry (2018–2022). Similarly, the EU has awarded 7.8 million euros for the development of next-generation green power systems. The Poseidon Principles, established in July 2019 by 11 shipping finance banks, prioritized environmental preservation and other factors when granting shipping loans [7]. Consequently, embracing sustainable development is no longer just an ethical imperative but a strategic necessity for shipping enterprises and their stakeholders.
As the parties primarily responsible for emissions, ports and shipping enterprises have invested in a suite of advanced technologies to reduce GHG emissions and lower the carbon intensity of international shipping [8]. Beyond technological investments, they also implement green policies [9] and optimize operational measures [10]. For example, shipping enterprises like Hapag–Lloyd reduce fuel consumption by optimizing vessel speeds and routes. Ports, meanwhile, employ a mix of policy incentives and smart operations. For example, the Port of Rotterdam offers significant fee discounts to vessels with high environmental certifications. Similarly, Busan Port leverages AI and IoT for dynamic scheduling to enhance efficiency and reduce emissions. Collaboration among supply chain members is crucial for enhancing the effectiveness of these technological and operational investments. According to Lai et al. [11], sharing forecasts can increase profits for both parties while also encouraging sustainable investment. The International Port Association (IAPH) and the IMO signed a strategic agreement on 13 October 2020, as part of the Green Voyage 2050 Project. The agreement encourages ships and port resources to collaborate to reduce GHG emissions.
As awareness of low-carbon grows, a rising number of customers are willing to pay a premium for low-carbon shipping supply chains [12]. This is evidenced by major brands like Inditex, the parent company of Zara, which has partnered with Maersk on the “ECO Delivery Ocean” project to use green fuels for all its inbound routes [13]. Furthermore, a growing number of leading international brands, such as Amazon, IKEA, and Unilever, have made individual public commitments to decarbonize their entire supply chains. The low-carbon preferences of these powerful customer groups will inevitably drive more ports and shipping enterprises to develop carbon abatement technologies.
Developing sustainable supply chains has become a key focus of research, as they involve upstream and downstream enterprises that collectively impact carbon emissions. Prior studies typically exhibit a methodological dichotomy: On one hand, game theory effectively models the dynamic strategic interactions between stakeholders in shipping supply chain but often lacks empirical grounding, relying on idealized parameters that fail to capture real-world uncertainty. On the other hand, empirical studies utilizing MCDM provide factor prioritizations but predominantly treat the decision environment as static, thereby overlooking how long-term strategy shifts between ports and shipping lines influence these determinants. Unlike previous works, our framework uses evolutionary game to derive the behavioral logic of strategic interactions in the shipping supply chain, which then serves as the theoretical anchor for a rigorous empirical evaluation. This integration allows for a systematic treatment of three inherent uncertainties: the stochasticity of strategic evolution, the fuzziness of qualitative judgments, and the complexity of causal interrelationships. Therefore, the following research questions (RQs) are formulated.
RQ1: How can the key factors influencing sustainable investment in the shipping supply chain be identified by integrating modeling and empirical evidence?
RQ2: Among these identified factors, which are the most critical in driving sustainable investment?
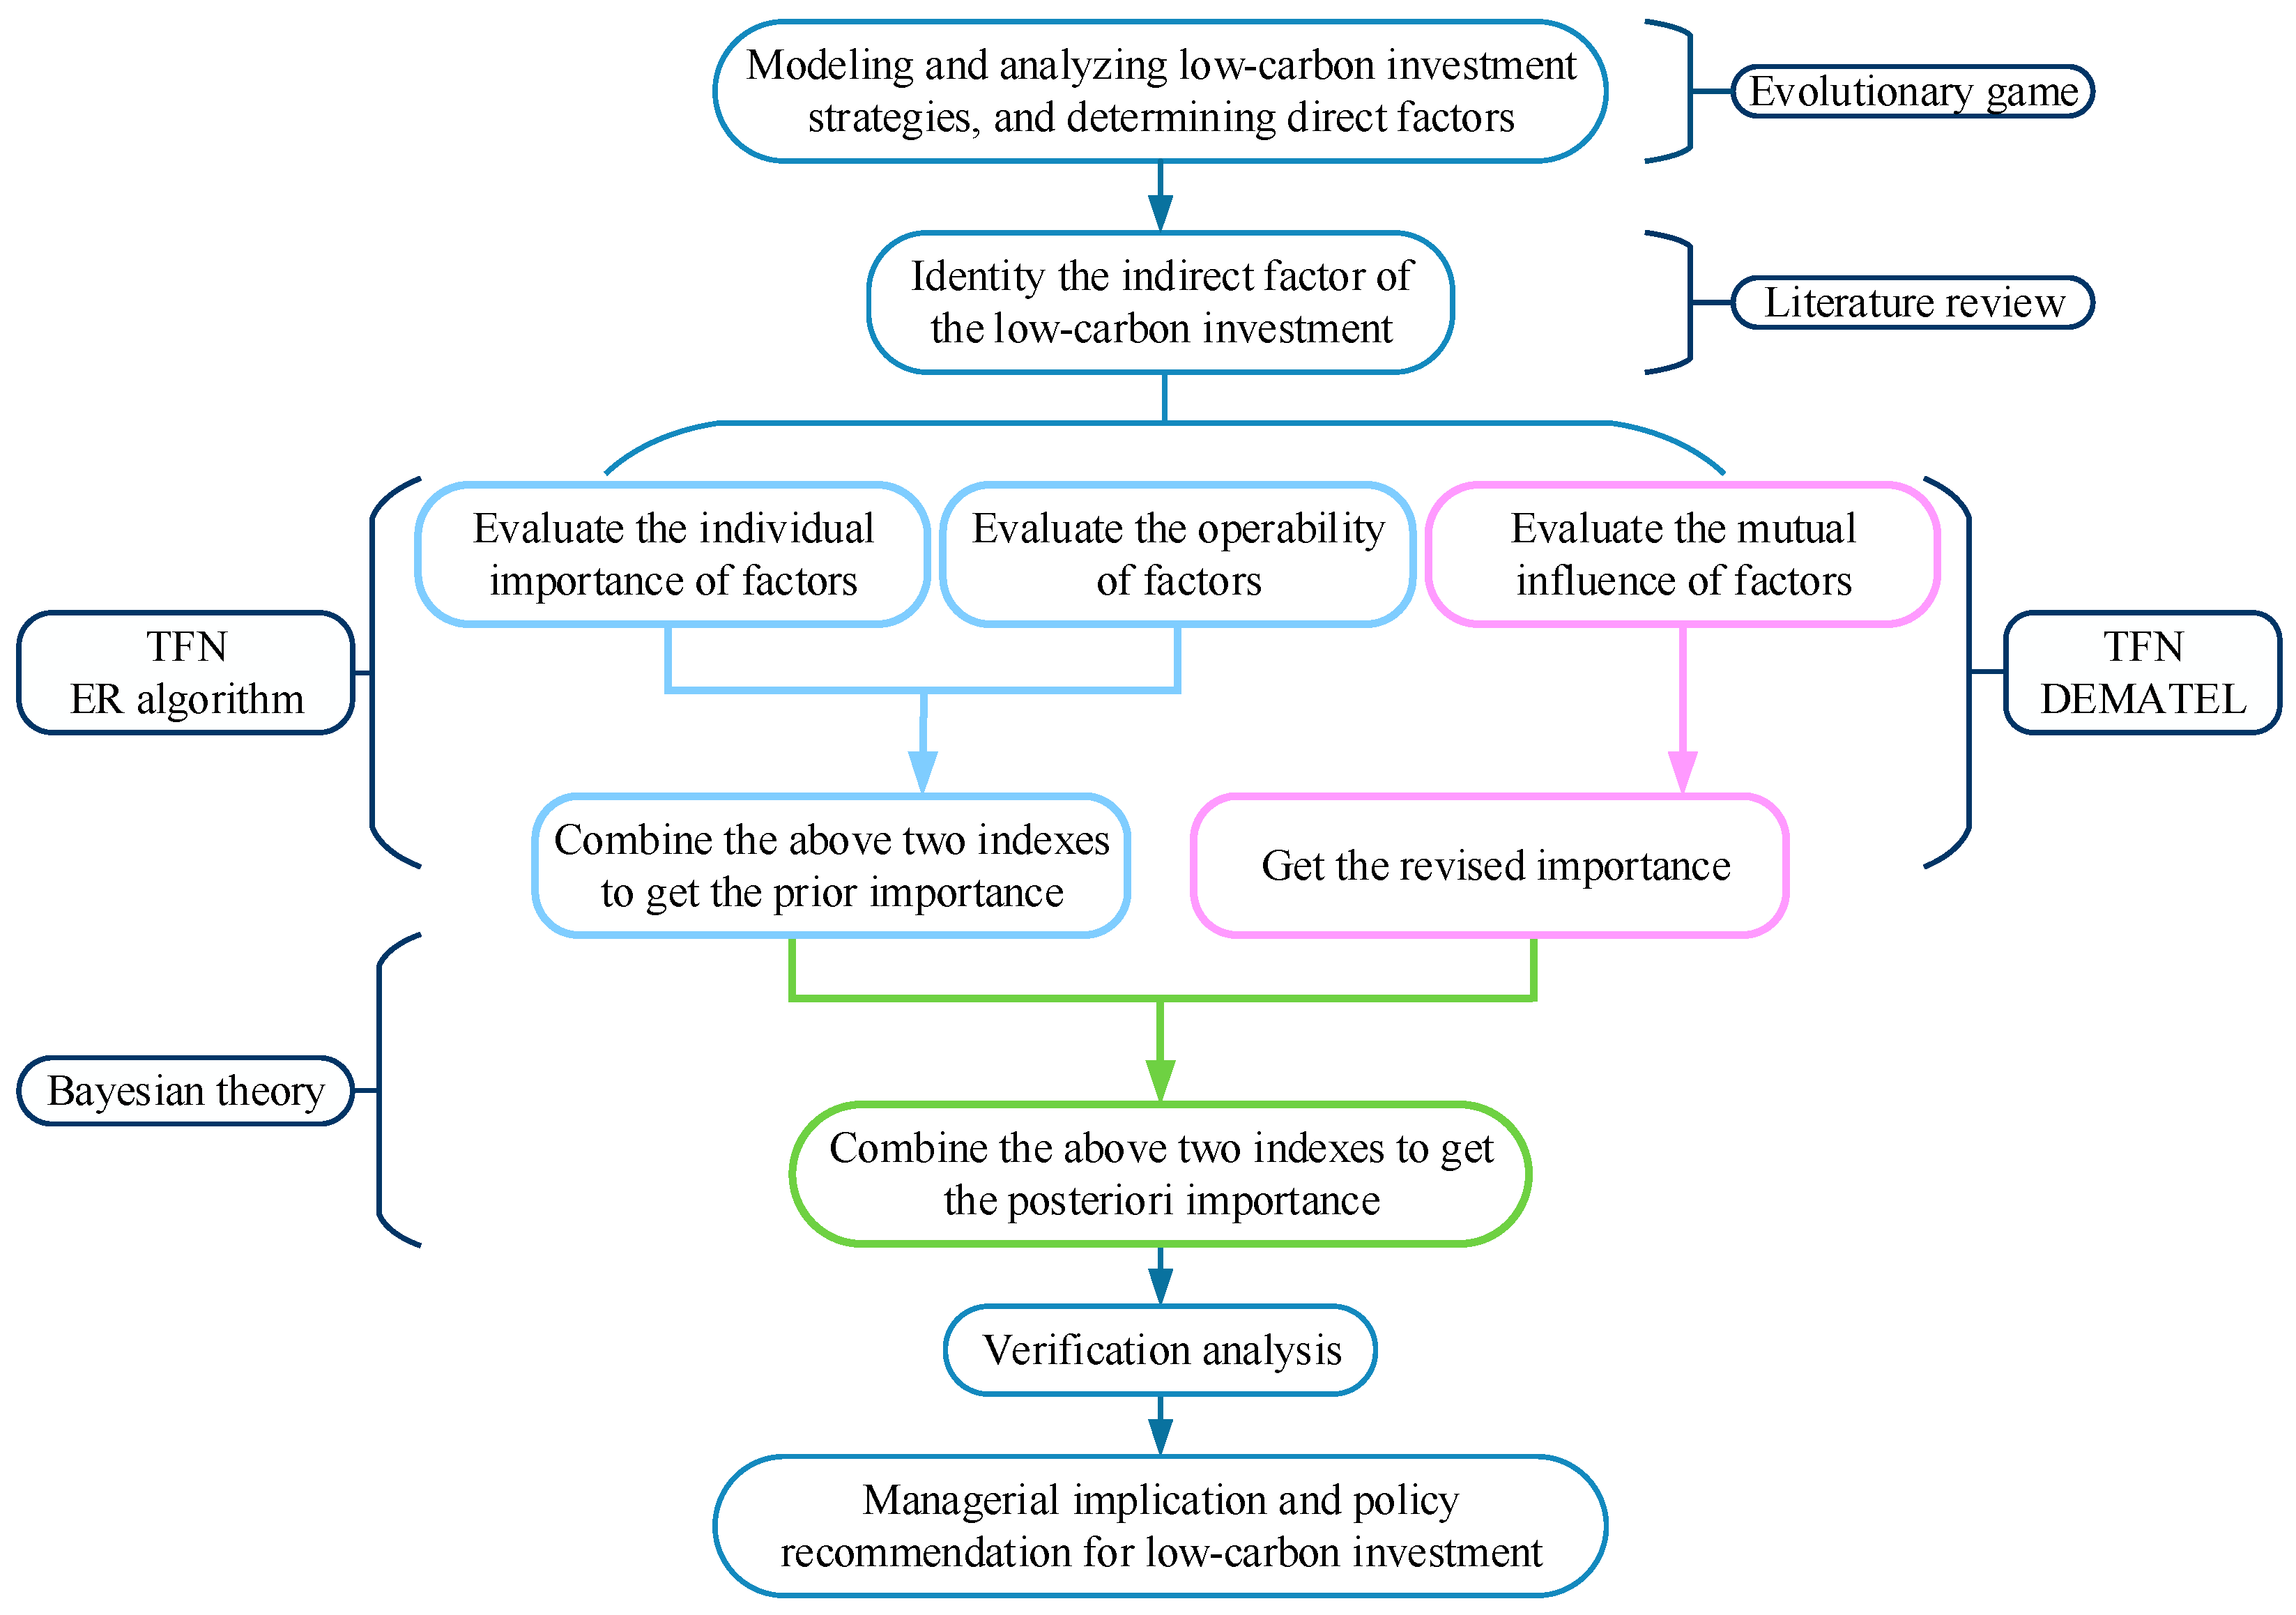
To achieve the study objectives, this paper employs a multi-stage methodology, which is illustrated by the research framework in Figure 1. First, the evolutionary game is employed to model and analyze low-carbon investment strategies, which determines five key direct factors. These factors are then decomposed into 15 specific indirect factors (C1–C15) via thorough literature reviews. To make the survey more rigorous and professional, an expert panel comprising professionals with extensive experience in port sustainability and carbon reduction was established to provide evaluations. The expert evaluations on these 15 factors are quantified using TFN, covering three aspects: individual importance, operability, and mutual influence. Specifically, the evidential reasoning algorithm is used to assess and combine the factors’ importance and operability to derive their prior importance. Concurrently, the DEMATEL method is applied to analyze the mutual influence among factors. Bayesian theory is used to integrate the prior importance (from the ER analysis) with the revised importance (from the DEMATEL analysis) to obtain the final posteriori importance. The study concludes with a verification analysis of the results and the proposal of managerial and policy recommendations.
This research framework effectively addresses the aforementioned uncertainty challenges. Specifically, this study utilizes evolutionary game as the theoretical foundation to capture the long-term dynamic strategic interactions between upstream and downstream in the shipping supply chain. Unlike traditional static models, evolutionary game allows for the identification of direct influencing factors rooted in behavioral logic, providing a basis for the subsequent analysis. To address the qualitative and ambiguous nature of these identified factors, TFN is used to scientifically quantify the fuzzy judgment intervals in experts’ minds. The evidential reasoning algorithm can aggregate these fuzzy assessment results. DEMATEL reveals the complex cause–effect interrelationships among influencing factors and accurately identifies the key factors. Bayesian theory scientifically integrates the analysis results mentioned above, yielding more comprehensive conclusions than single-dimensional analysis.
The contributions of this study are threefold: First, this study constructs a hybrid assessment framework integrating evolutionary game, TFN, ER algorithm, DEMATEL, and Bayesian theory to systematically address the multiple uncertainties in sustainable investment decisions in the shipping supply chain. Second, by combining modeling with empirical evidence, we identify both direct and indirect factors influencing investment decisions, offering a comprehensive understanding of the decision-making landscape. Third, the results reveal that low-carbon technology is the most pivotal factor for sustainable investment, whereas the importance of environmental factors consistently ranks at the bottom. This study provides a vital theoretical basis and key reference for sustainable investment decisions for members across the shipping supply chain.
Following the introduction, Section 2 presents a literature review followed by the methodology in Section 3. Section 4 outlines the key factors influencing low-carbon investments in the shipping supply chain, while Section 5 provides the empirical analysis. Section 6 offers specific management implications, and Section 7 concludes the paper.

2. Literature Review

The realistic needs for sustainable development and low-carbon investment in the shipping industry have spurred a growing body of research. The literature relevant is primarily classified into three streams: enterprise sustainable investment, sustainable development practices in the shipping industry, and factors influencing sustainable investment.

2.1. Enterprise Sustainable Investment

Many studies examine the sustainable investment of enterprises across different industries and regions, and such research has grown significantly since the adoption of the Paris Agreement. One category of the literature uses modeling approaches to investigate how enterprises formulate sustainable investment strategies under various policy and market structures. Dong et al. [14] examined the sustainability investment on sustainable product with emission regulation consideration for decentralized and centralized supply chains. Bai et al. [15] developed two optimization models for manufacturer-led decentralized systems, with and without technology investment, and showed that investments in sustainable technology can enhance both the economic and environmental performance of supply chains. The other category of the literature employs empirical methods to examine how external factors and enterprise internal characteristics influence sustainable investment. Xiong and Dai [16] employed the panel data model and found that green finance positively impacts sustainable development. Ye et al. [17] analyzed a sample of 273 Chinese pollution-intensive firms to suggest that in state-owned firms, green innovation plays a partial mediation role in the relationship between digital investment and environmental performance. Hussain and Zhou [18] investigated the impact of the National Climate Change Policy (NCCP) and sustainable investment using data from the Pakistan Stock Exchange during 2007–2018.
However, this stream of research suffers from a key methodological limitation, relying on either purely empirical econometric models or abstract game theory models. Such isolated methods often fail to concurrently capture both the strategic interactions among supply chain participants and the multidimensional factors influencing real-world decisions. To bridge this gap, our study integrates both paradigms. We first employ an evolutionary game model to identify the direct factors driving investment decisions. Subsequently, we develop an empirical framework employing the comprehensive assessment model to systematically evaluate the significance of the identified factors.

2.2. Sustainable Development Practices in the Shipping Industry

As global trade expands, the shipping industry’s growing contribution to global carbon emissions has placed it under immense pressure to decarbonize, spurring a surge in research on sustainable practices. The existing literature has predominantly focused on emission monitoring and regulation, sustainable port practices, and sustainable vessel practices.
Achieving sustainability in the shipping industry relies not only on technological advancements but also on the improvement in emission monitoring and regulation that governs them. The International Maritime Organization (IMO) established the Energy Efficiency Operational Indicator (EEOI) as a measuring tool for assessing vessel energy efficiency and CO2 emissions [19]. However, due to the difficulty and high cost of collecting and standardizing the necessary data, the Annual Efficiency Ratio (AER), a ratio of a vessel’s annual CO2 emissions to the product of its deadweight tonnage and distance traveled, is often used as a more practical proxy for evaluating emission levels per unit of transport [20]. Several studies have focused on quantifying emissions from portside activities and docking ships. For instance, Peng et al. [21] developed a simulation model to quantify the impact of mitigation strategies on carbon emissions from port operations and shipping inside container terminals, particularly in the absence of real energy consumption data. Sim [22] applied a system dynamics approach to model a container terminal’s total carbon emissions. As critical nodes in the shipping industry, ports have concentrated their sustainability efforts on providing green infrastructure and implementing incentives. Yang et al. [23] highlighted two carbon emission reduction strategies used in the shipping supply chain: shore power (SP) and low sulfur fuel (LSFO). Lam and Li [24] focused on incentives, suggesting that green port marketing can attract customers who prioritize sustainable development. For vessels, which represent the primary source of emissions in the shipping industry, sustainable practices fall into two main categories: technical and operational. Technical measures include retrofitting engines for low- or zero-carbon fuels, such as LNG and hydrogen [25], and installing energy-saving devices like air lubrication [26] and waste heat recovery systems [27]. Operational measures involve strategies such as route optimization [28], collaborative actions among shipping companies [29] and vessel speed management [30].
However, these studies typically adopt a fragmented perspective, analyzing the operability of individual sustainable development practices in isolation. Additionally, only a limited number of studies systematically investigate the influencing factors of sustainable investment in the shipping supply chain. The primary contribution of this paper lies in constructing a structured, multi-level framework. By identifying five direct factors and decomposing them into 15 indirect sub-factors, we provide a comprehensive lens to guide complex investment behaviors in the shipping industry.

2.3. Factors Influencing Sustainable Investment

The factors that influence sustainable investment decisions can be broadly classified into three main categories: policy factors, market factors, and internal firm-level factors.
In terms of policy factors, Lu et al. [31] assessed the impact of the EU ETS on sustainability investment strategies in a co-opetitive shipping market. Economic support policies have a strong and significant impact on investment decisions. Tvedt and Wergeland [32] employed real option theory to demonstrate that a policy package combining green investment subsidies with a shift from a tonnage tax to a regular profit tax regime can lower the investment thresholds for sustainable technologies in the maritime industry. Market factors encompass the business and economic environment in which enterprises operate and influence sustainable investment by shaping demand and transmitting price signals, thereby adjusting enterprises’ allocation of resources. Jia et al. [33] demonstrated that financial buyers have shown a more pronounced inclination towards investing in container eco-ships compared to operating buyers. From the firm-level perspective, Yuen et al. [34] pointed out that stakeholders’ pressure, attitude, and behavior control over shipping enterprises directly affect sustainable shipping practices and indirectly affect enterprise performance. Shang et al. [35] demonstrated that shipping alliances promote green shipping investments by constructing an economic model. Moreover, some studies have begun to develop comprehensive analytical frameworks that incorporate multiple influencing factors to evaluate the effects of policy, market, and firm-level factors on sustainable investment [36,37].
Although previous studies have identified numerous factors influencing sustainable investment and effectively assessed either the importance of factors or their causality, there is an absence of a meta-analytical framework capable of synthesizing these disparate analytical dimensions into a unified hierarchy. This paper fills this gap by developing a comprehensive assessment model that uses the ER algorithm and Bayesian theory to systematically integrate experts’ subjective judgments on factor importance with the objective structure of their mutual influences. Table 1 shows the comparison between the existing literature and the work in this paper.

3. Methodology

3.1. Evidential Reasoning Algorithm

Let E = { e 1 , e 2 , , e L } be a set of L basic criteria for evaluating a general criterion y. The relative weights of these criteria are denoted by ω i for e i , where i = 1 L ω i = 1 . H = { H 1 , H 2 , , H N } be a set of N evaluation grades. The assessment of each basic criterion e i is represented as a distribution:
S ( e i ) = { ( H n , β n , i ) , n = 1 ,   ,   N }
where β n , i is the belief degree to which e i is assessed to the grade H n . The belief degree β n , i is transformed into a basic probability mass m n , i , which represents the support from basic criterion e i for the hypothesis that the general criterion y is assessed to grade H n . This is calculated as
m n , i = ω i β n , i
The remaining probability mass m H , i denotes as follows:
m H , i = m ¯ H , i + m ˜ H , i
which is decomposed into two parts: m ¯ H , i = 1 ω i , a part due to the criterion’s weight and m ˜ H , i = ω i ( 1 n = 1 N β n , i ) , a part due to the assessment’s incompleteness.
These probability masses are then combined recursively using the ER algorithm. Let m n , I ( i ) , m ¯ H , I ( i ) , and m ˜ H , I ( i ) denote the combined probability masses after aggregating the first i criteria. The combination with the ( i )   th criterion is as follows:
m n , I ( i ) = K I ( i ) [ m n , I ( i 1 ) m n , i + m H , I ( i 1 ) m n , i + m n , I ( i 1 ) m H , i ]
m ˜ H , I ( i ) = K I ( i ) [ m ˜ H , I ( i 1 ) m ˜ H , i + m ¯ H , I ( i 1 ) m ˜ H , i + m ˜ H , I ( i 1 ) m ¯ H , i ]
m ¯ H , I ( i ) = K I ( i ) m ¯ H , I ( i 1 ) m ¯ H , i
where K I ( i ) is the normalizing factor to handle conflicts between evidence:
K I ( i ) = [ 1 t = 1 N j = 1 , j t N m t , I ( i 1 ) m j , i ] 1
This recursive process is repeated L + 1 times until all L criteria are aggregated. After the final aggregation, we obtain the total combined probability masses: m n , I ( L ) , m ¯ H , I ( L ) , m ˜ H , I ( L ) . The final combined belief degrees, β n and β H , are calculated by normalizing the results:
β n = m n , I ( L ) 1 m ¯ H , I ( L )
β H = m ˜ H , I ( L ) 1 m ¯ H , I ( L )

3.2. Bayesian Theory

Bayesian theory, proposed by British mathematician Thomas Bayes, states that when the outcome of an event is uncertain, its probability can be inferred from the probabilities of related events. It can further explain the correlation between these probabilities. Key concepts include prior probability and posteriori probability. In this paper, the Bayesian theorem is applied to adjust the prior importance and determine the final posterior importance.
(1)
Prior probability refers to the probability of each event based on historical data or subjective judgment. It can be classified into two categories: objective prior probability, derived from raw data, and subjective prior probability, based on personal experience in the absence of complete historical data.
(2)
Posterior probability refers to the probability that better reflects the actual situation after applying Bayes’ theorem and incorporating new information obtained from investigation to modify the prior probability.
(3)
Bayes’ theorem: Let the prior probability be P ( B ) . The new information obtained from the survey is P ( A | B ) . Then the posterior probability is P ( B | A ) = P ( B ) P ( A | B ) P ( A ) .
According to the Bayes’ theorem, given a prior probability P ( B ) , the posterior probability P ( B | A ) = P ( B ) P ( A | B ) P ( A ) is derived by incorporating the new information P ( A | B ) obtained from the survey.

4. Influencing Factors to the Investment of Emission Reduction Technologies

To systematically analyze the determinants influencing sustainable investment, it is essential to first understand the core strategic interactions in the shipping supply chain. In the context of emission reduction investment, the most critical interaction occurs between ports and shipping enterprises, as their investment decisions are highly interdependent and directly determine the overall emission level of the supply chain. Therefore, this section takes the green investment in a shipping supply chain as the entry point, and employs an evolutionary game model to identify the key factors that drive their strategic choices.

4.1. Evolutionary Game Strategy of Sustainable Investment

We focus our analysis on the container shipping supply chain, as its significant contribution to total global emissions makes it a critical focus for reduction research. Although container shipping enterprises account for approximately 16% of the global fleet, their CO2 emissions represent nearly 34% of the total [38], making them a critical focus for global decarbonization efforts. Given this context, we simplify the complex shipping supply chain network into a representative two-level supply chain comprising a single port and a single container shipping enterprise [11,39]. The port is obligated to meet governmental emission targets, while the shipping enterprise is subject to international scrutiny and the demands of shippers who prioritize low-carbon services.
The relevant notations involved in this paper are listed in Table 2. The pricing of freight services is jointly determined by the port and the shipping enterprise, expressed as p = w + m , where we normalize the operating cost of the port as zero [40]. Assuming that in the freight market, the owners have a preference for low-carbon services, and the market demand function is defined as Q = a β p + α θ , where a , β , α > 0 [14]. The sustainable technical level θ and the pricing of freight services p directly influence the shipper’s demand. The sustainable technical level in this study represents the efforts made by enterprises to improve the port environment during the service process. Port and shipping enterprises are independent economic entities, each responsible for determining its own sustainable technical level with the objective of maximizing profits. However, when adopting sustainable investment practices, both parties need to make additional investments.
Port and shipping enterprises are encouraged to invest in low-carbon technology to foster sustainable development and improve their sustainability level θ . Assuming that the investment cost is γ θ 2 / 2 , which shall be borne by both parties, γ > 0 denotes the sustainability investment cost coefficient. If both parties invest simultaneously, they share the investment cost, with the shipping enterprise bearing γ θ 2 ϕ / 2 , and the port bearing γ θ 2 ( 1 ϕ ) / 2 , where the sharing coefficient is ϕ ( 0 , 1 ) . The research in this thesis is mainly represented by low-carbon technology.
The government has implemented a carbon emission cap K > 0 for ports in accordance with the cap-and-trade scheme [41]. Carbon emissions are a byproduct of shipping services provided to customers. If emissions exceed the cap, the port can purchase additional quotas through the carbon trading market; otherwise, it can sell unused quotas. The trade price of carbon emission permits c t > 0 is determined by the carbon trading market [23]. The carbon emissions generated during cargo transportation can be calculated as q b θ , where q > 0 represents the initial carbon emissions per unit of cargo, and b > 0 denotes the low-carbon coefficient effect on reducing emissions. Since new technologies cannot completely eliminate carbon emissions, the sustainability level should satisfy 1 < θ < q / b .
Based on the above problem description, we assume that the shipping enterprise acts as the Stackelberg leader due to its dominant market position. First, the formation of shipping alliances enhances carriers’ bargaining power, allowing them to determine marginal profits as first movers [42]. Second, vertical integration strategies, exemplified by CMA CGM’s global terminal investments, further solidify this leverage. Consequently, shipping enterprises first determine marginal profit, while ports act as followers, setting the competitive service fee [43]. Table 3 demonstrates the profit derived from four different investment strategies. The equilibrium solution can be obtained using backward induction, as demonstrated in Appendix A.
Drawing upon behavioral economics, we assume that port and shipping enterprises can make independent investment decisions and play the game in the future to ensure continuous cooperation. Specifically, we assume that the probabilities of a port investing or not investing in sustainable technology are represented by (x) and (1 − x), respectively, while those of a shipping enterprise investing or not investing are represented by (y) and (1 − y). The payoff matrix is simplified and shown in Table 4.
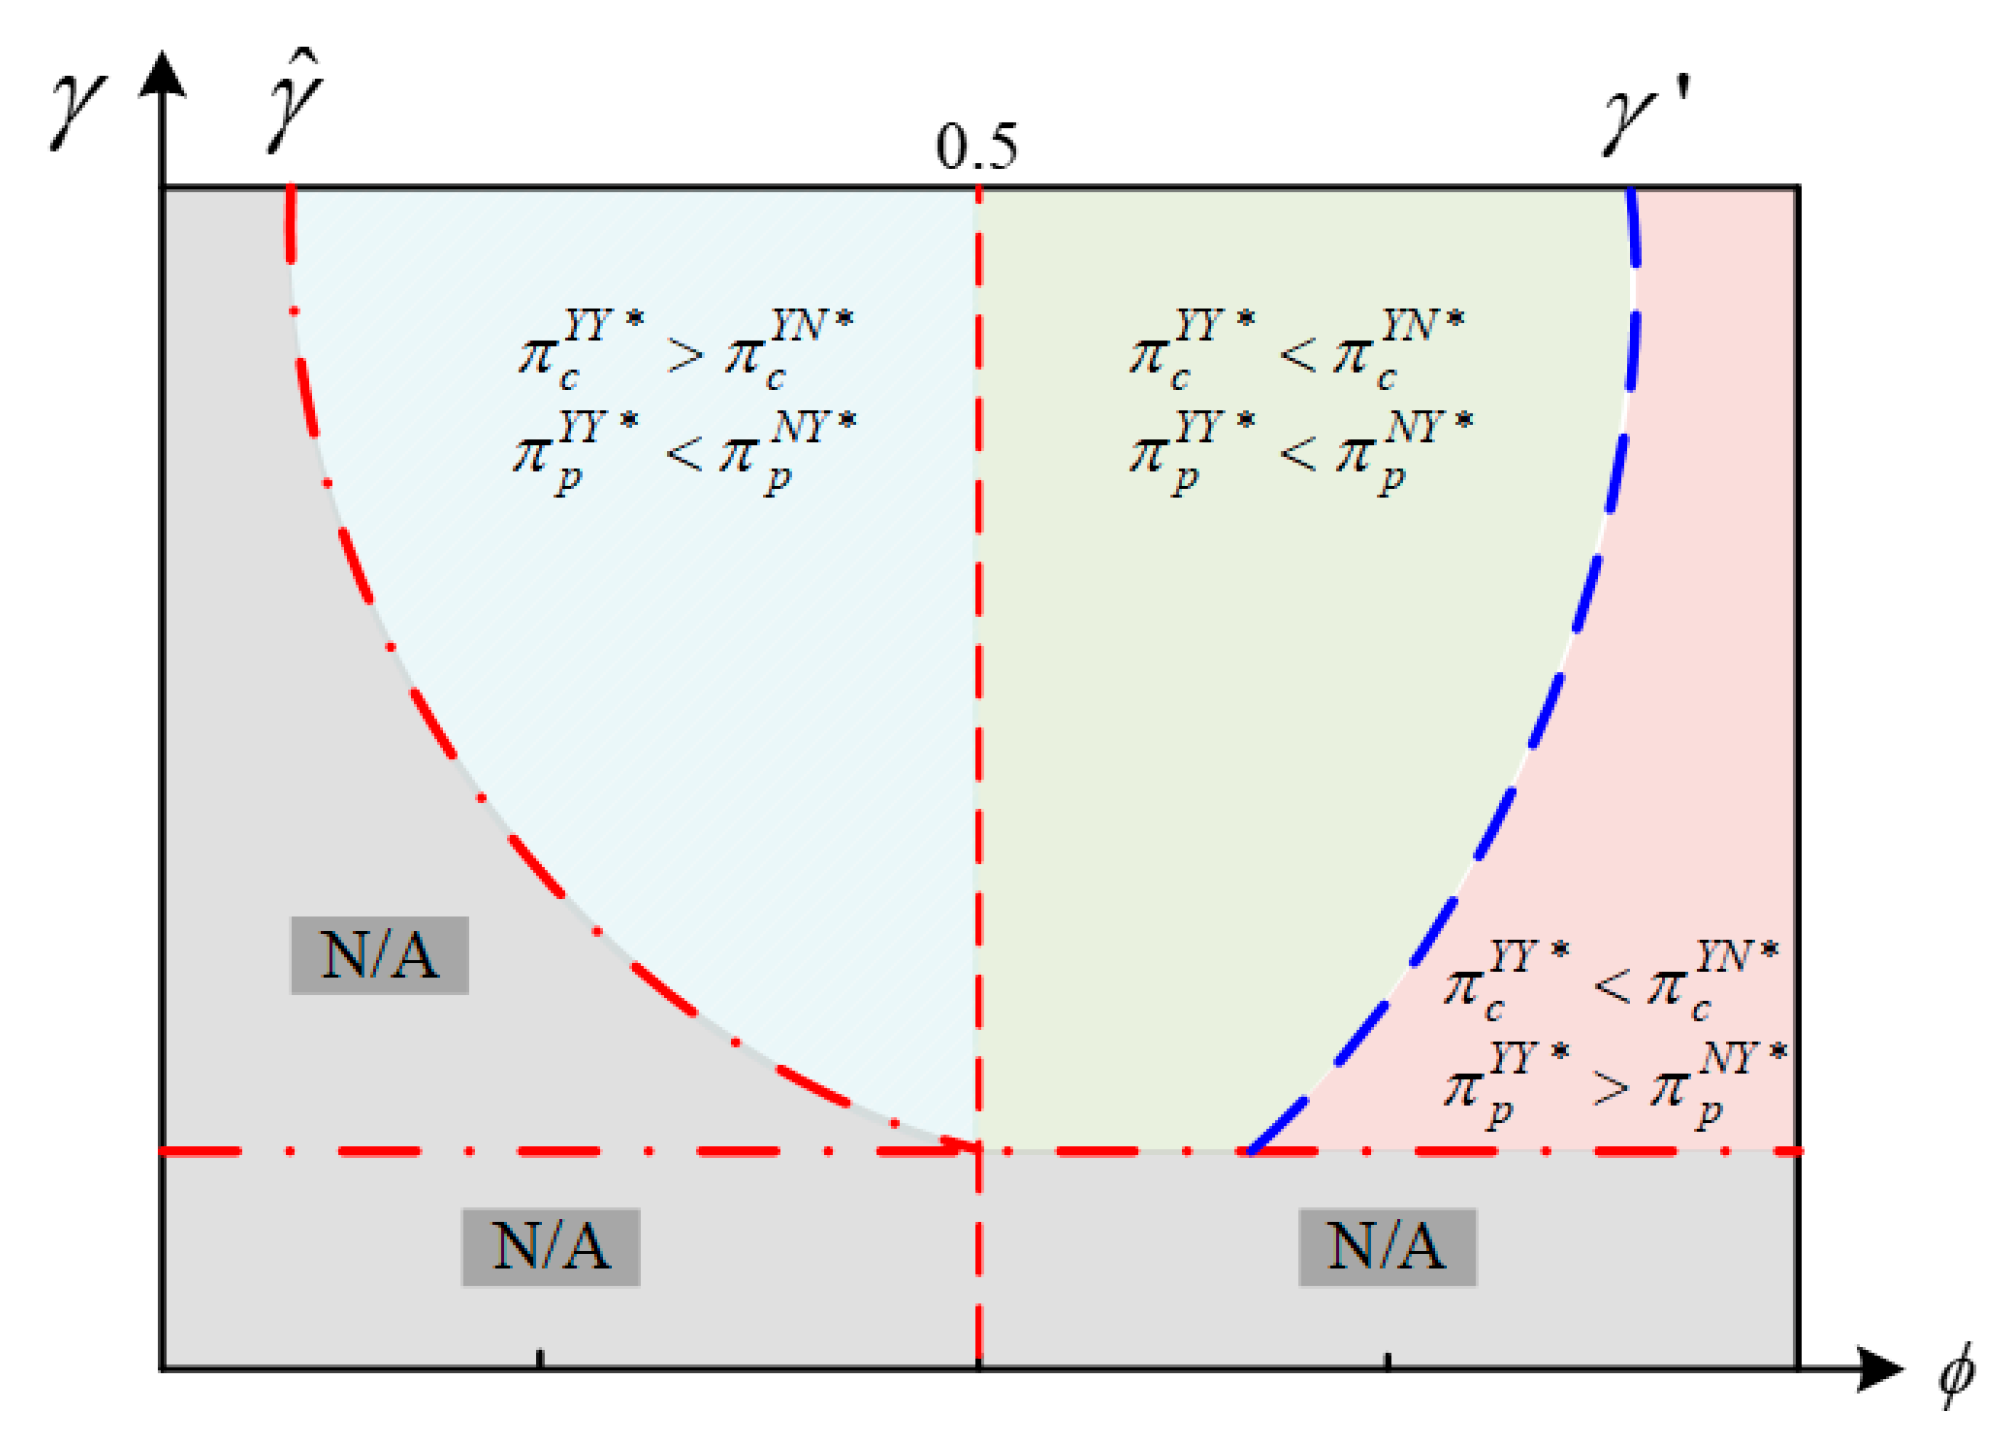
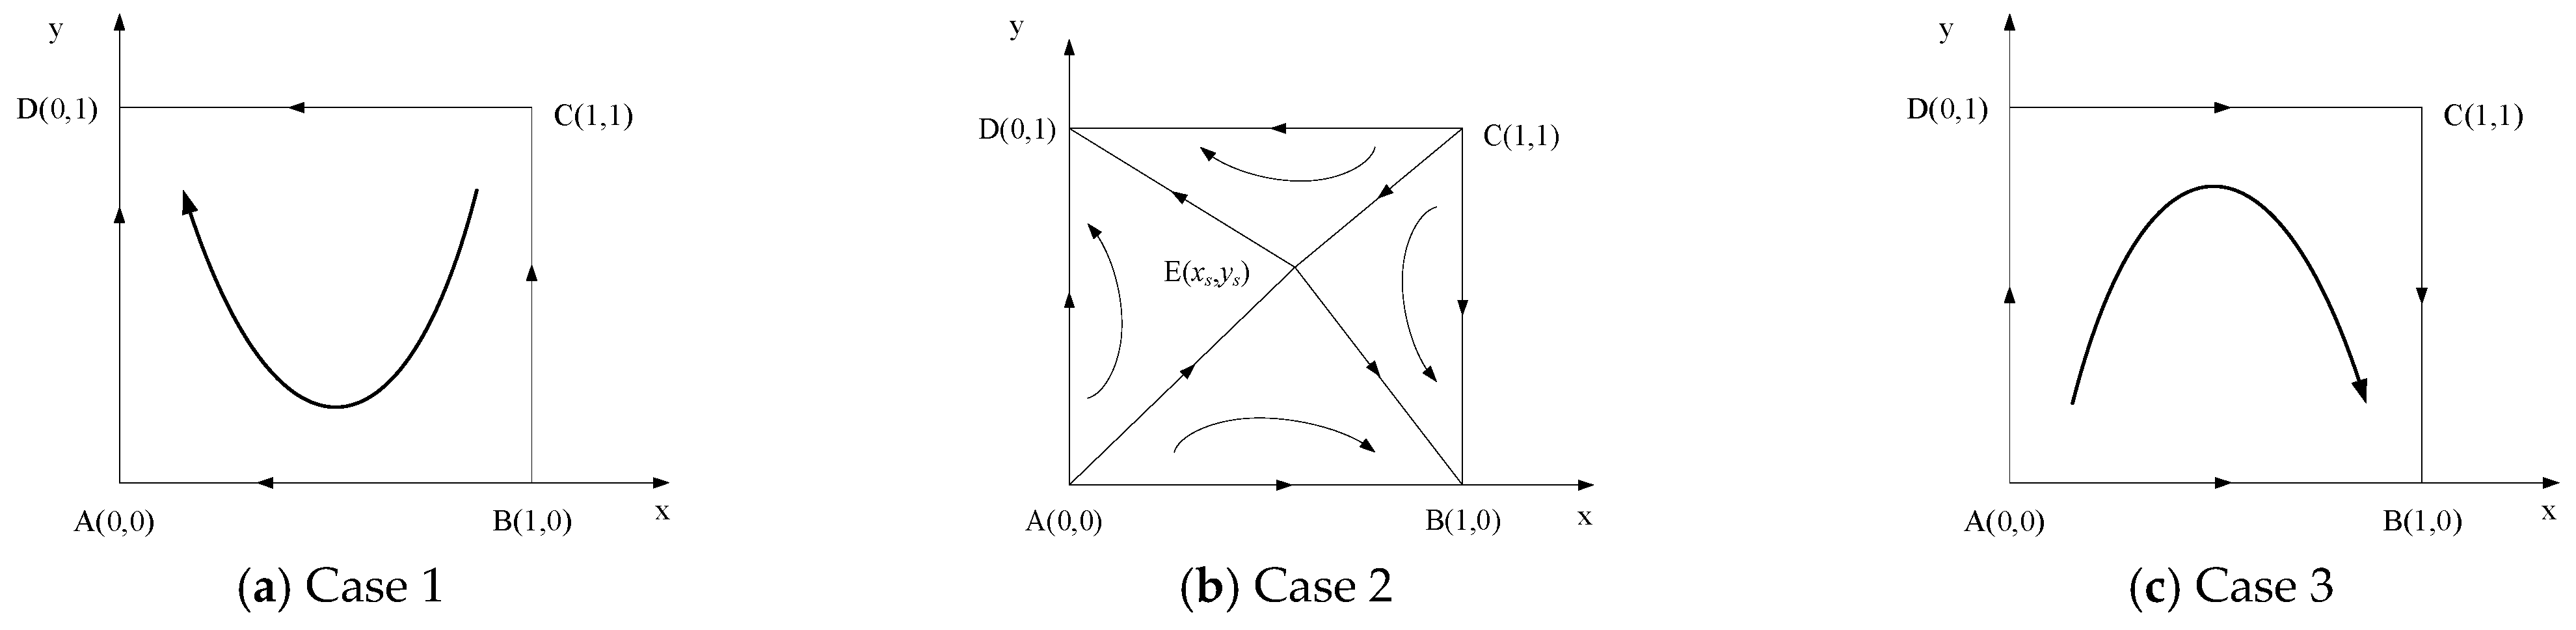
We assume γ = β α + b c β 2 3 + ϕ β 2 α + b c β 4 7 + ϕ 10 + ϕ 16 β 2 1 + ϕ . By analyzing the evolutionary game situation in Figure 2, the distribution of stable points in Table 5 can be obtained, with the corresponding evolutionary phase diagram is shown in Figure 3.
In the long-term sustainable investment of the shipping supply chain, three kinds of locally stable situations represent the stable equilibrium of the system’s evolution. Depending on the conditions, ports and shipping enterprises make different investment choices, but sustainable investment remains superior to situations where neither party invests.
In Case 1, when the joint investment share ratio is ϕ ( 0 , 1 / 2 ) , the shipping enterprise bears a small portion of the investment cost, making green investment highly attractive to it. Therefore, the optimal strategy for the shipping enterprise is to “invest”. As a rational participant, the port’s optimal strategy becomes to “not invest” when it is certain that the shipping enterprise will invest. This allows the port to save costs and benefit from the positive externality brought by the shipping enterprise’s investment. As a result, the system will stabilize at the unique equilibrium point ( 0 , 1 ) .
In Case 2, when the joint investment share ratio is in a moderate range ϕ ( 1 / 2 ,   2 / 3 ) , the evolutionarily stable strategy (ESS) becomes ( 0 , 1 ) or ( 1 , 0 ) , indicating that only one party invests. The evolutionary process and the final stable state are influenced by the saddle point ( x s , y s ) of the initial game states. As illustrated in Figure 3b, if the initial state lies in the ABCE region, the system will eventually converge at point B, indicating that only the port invests while shipping enterprise does not. In contrast, if the initial state lies within the ADCE region, the system will eventually converge at the point where the shipping enterprise invests, while the port does not. Therefore, the probability of the system’s stability strategy is determined by the size of the regions S A B C E and S A D C E , as shown in Equation (10). This suggests that precise policy interventions, such as providing temporary subsidies to one party, can guide the evolutionary path toward a more desirable ESS by altering the initial game conditions.
P ( 0 , 1 ) = S A B C E = S A B E + S B C E = 1 x s + y s 2   P ( 1 , 0 ) = S A D C E = S A D E + S D C E = 1 + x s y s 2
In Case 3, when the joint investment share ratio is ϕ ( 2 / 3 , 1 ) , in contrast to Case 1, the shipping enterprise is required to bear most of the investment cost, investment is no longer attractive to it, and its optimal strategy is to “not invest”. In this case, to meet the government’s emission reduction targets and market demand, the port is forced to invest alone, while the shipping enterprise can ride free and benefit from the green investment provided by the port. Therefore, the system ultimately stabilizes at the unique equilibrium point ( 1 , 0 ) . Next, the main factors that influence investment in port and shipping enterprise will be analyzed.

4.2. Identification of Influencing Factors

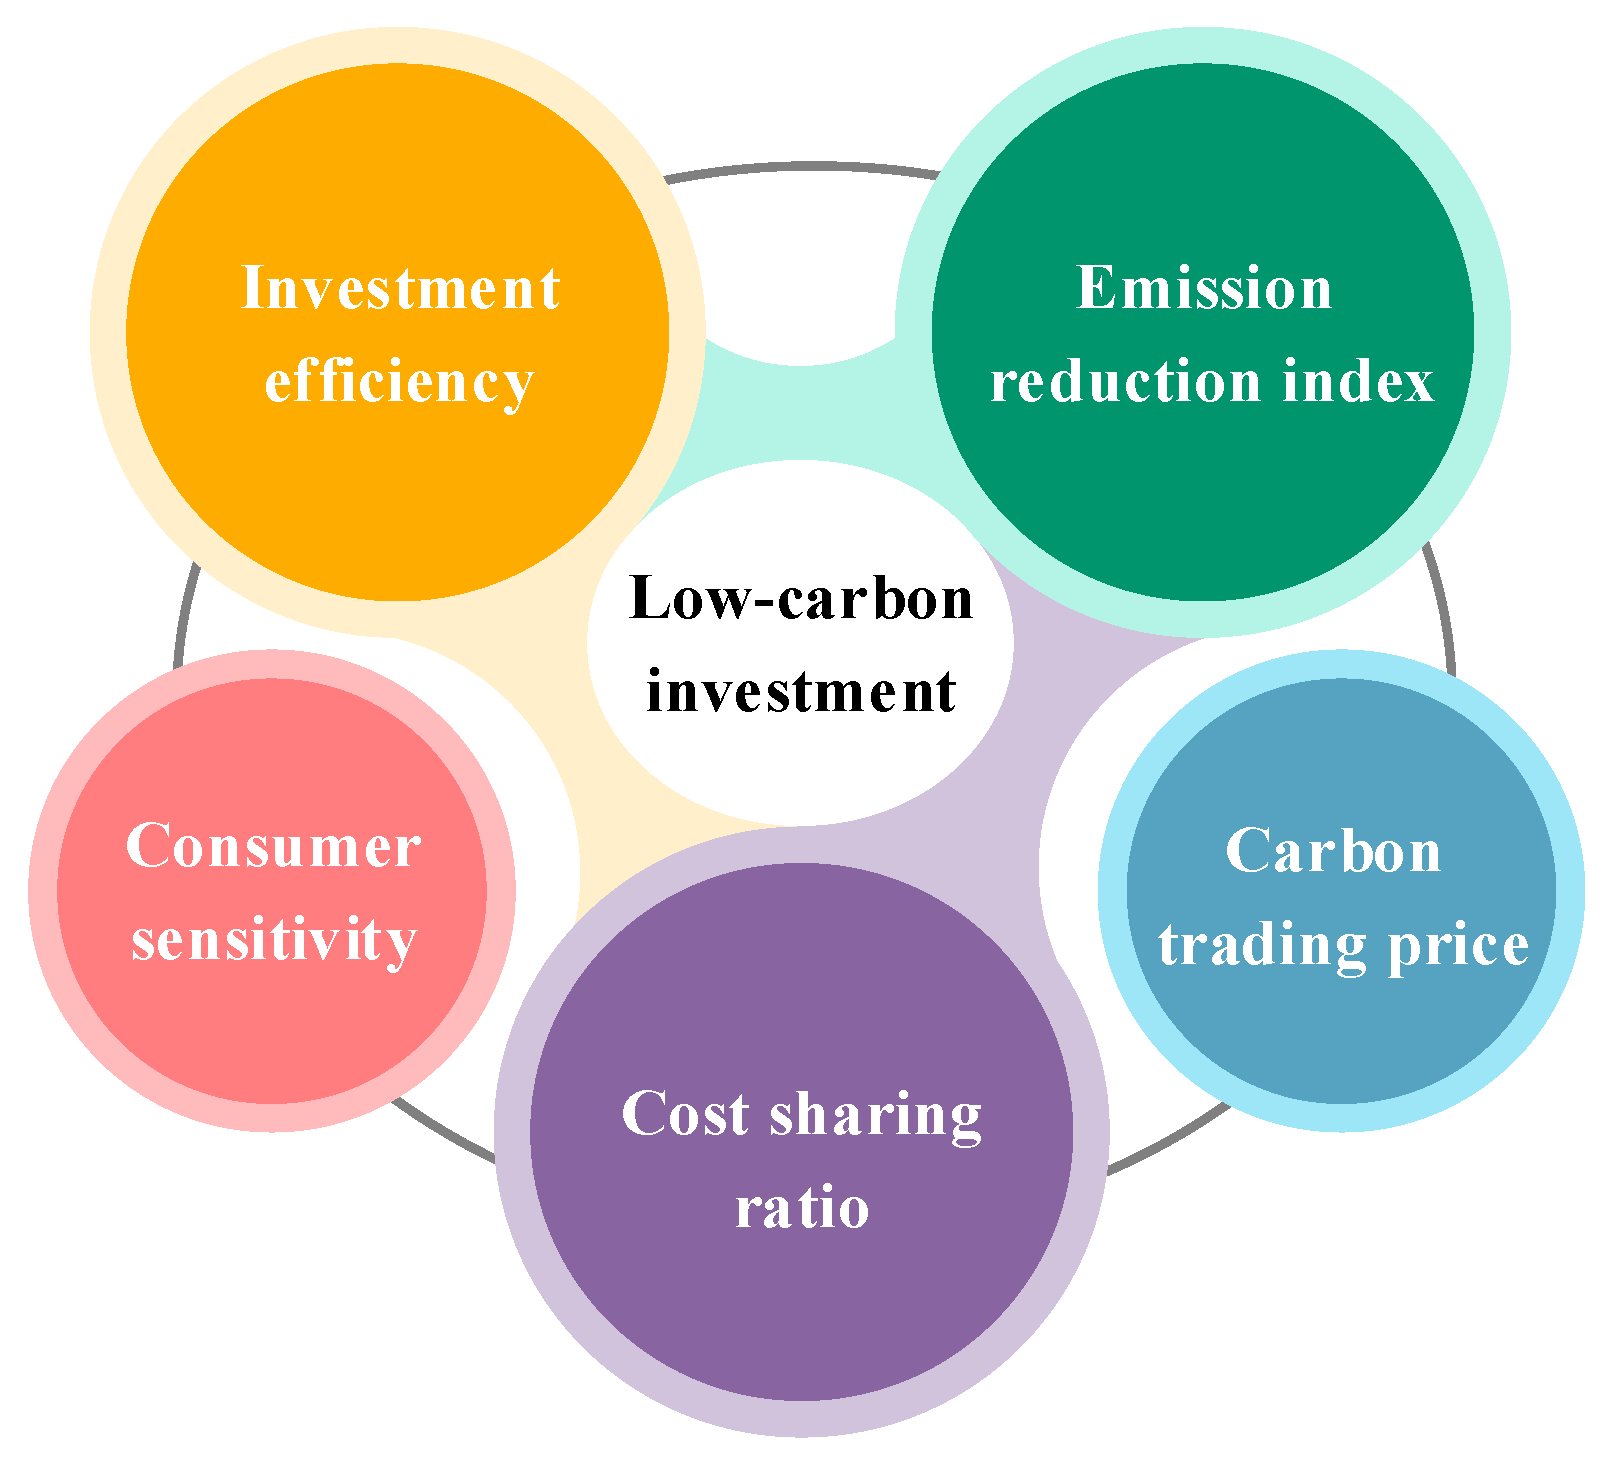
The analysis of the evolutionary game model in Section 4.1 reveals five key factors that govern the strategic investment choices: the cost-sharing ratio, investment efficiency, carbon price, consumer sensitivity, and emission reduction index. External factors include consumer sensitivity and carbon price, while internal factors comprise investment efficiency, emission reduction index, and sharing ratio (Figure 4). These are identified as the primary direct factors influencing sustainable investment behavior in the shipping supply chain. As the model simulates, these factors determine the relative influence and direction of investment decisions under varying conditions. They therefore serve as the theoretical foundation for the subsequent fuzzy multi-method analysis. This approach ensures a logical connection between the model’s theoretical insights and the empirical evaluation.
To refine the theoretical framework, five direct factors were further decomposed into 15 sub-factors according to their behavioral relevance in port-shipping low-carbon investment. The selection and structure of sub-factors were verified through expert consultation to ensure rationality and non-redundancy. In addition, real-world developments reported in industry news and official announcements were used to inform the identification of relevant sub-factors and to contextualize their practical relevance. Table 6 summarizes these sub-factors, their corresponding emission reduction strategies, and representative references, forming the analytical foundation for subsequent behavioral mechanism analysis. Furthermore, the detailed definitions of these sub-factors and their relationships with the direct factors are systematically elucidated in Appendix B.
(1)
Investment efficiency
Investment efficiency is not an internal financial objective of the shipping enterprise, but rather a comprehensive concept jointly shaped by three factors: government intervention, market perfection degree, and enterprise governance level. Regarding government intervention (C1), public policy serves as a key external variable that influences the efficiency of capital allocation. The study shows that appropriate policy incentives can channel capital toward the most efficient green projects, whereas inappropriate intervention may distort market signals and thereby reduce overall investment efficiency [44]. Regarding market perfection degree (C2), a well-functioning market mechanism ensures that capital flows at the lowest cost to areas with the highest returns. For example, a mature green financial system can provide clearer financing channels for the development of low-carbon technologies [45]. Regarding enterprise governance level (C3), a sound governance structure ensures that investment decisions can be effectively implemented. For example, establishing a dedicated sustainability committee enables the systematic planning and supervision of low-carbon investments, thereby enhancing the efficiency of capital allocation [46].
(2)
Consumer sensitivity
Consumer sensitivity primarily affects low-carbon investments through three channels: product factors provided by the shipping enterprise, marketing strategy targeting environmentally conscious consumers, and the satisfaction ultimately experienced by consumers. Product factors (C4) serve as the fundamental carrier of consumer sensitivity. Investing in green product services is a prerequisite for converting this sensitivity into commercial value. If the shipping enterprise does not invest in low-carbon services capable of delivering actual low-carbon transport, consumer sensitivity remains merely an abstract demand [48]. Marketing strategy (C5) serves as a tool to guide and enhance consumer sensitivity. An effective marketing strategy can amplify shippers’ attention to sustainability and convert latent preferences into actual purchasing behavior [49]. In the shipping context, customer satisfaction (C6) is defined as a shipper’s overall evaluation of a service based on their total purchase and consumption experience [50], which is the key component for maintaining consumer sensitivity. If the shipping enterprise fails to fulfill its commitments regarding emission reduction measures, the use of green fuels, and transparent information disclosure, customer satisfaction will be undermined, thereby reducing consumer sensitivity.
(3)
Carbon price
Carbon price fluctuations are influenced by macroeconomic environment, related energy prices, and external environmental factors. Macroeconomic environment (C7) plays a pivotal role in shaping carbon price through its impact on actual carbon emissions. When studying variables affecting carbon pricing in domestic pilot projects, researchers often consider the Shanghai and Shenzhen 300 Index (HS300) as representative macroeconomic indicators, providing a more accurate reflection of China’s economic development [51]. Related energy prices (C8) can be regarded as the opportunity cost of green transition. Fluctuations in other energy prices directly alter the economic incentives for shipping enterprises to reduce emissions, thereby causing short-term volatility in carbon price [53]. For example, higher prices of non-clean energy, such as coal, prompt enterprises to opt for cleaner alternatives, reducing greenhouse gas emissions and leading to a decline in both carbon emission demand and carbon price. Environmental factors (C9) influence carbon market policies by affecting public sentiment and regulatory pressure, which in turn indirectly transmit to carbon price. Additionally, they influence carbon price because extreme weather conditions usually cause abrupt fluctuations in fossil energy consumption, which in turn affect the demand for carbon allowances [52].
(4)
Emission reduction index
The emission reduction index, representing an enterprise’s overall emission reduction efficiency, is determined by technology, operational measures, and energy type. Technological (C10) is a core driver for enhancing emission reduction efficiency. For example, by adopting air lubrication systems and bulbous bow optimization, shipping enterprise can significantly reduce carbon emissions per unit of transport, thereby improving its overall emission reduction performance [15]. Operational measures (C11) achieve efficient energy utilization by optimizing voyage planning [55], speed management [56], and loading efficiency [54]. The choice of energy type (C12) is a fundamental factor determining carbon intensity. Transitioning from conventional heavy fuel oil to LNG, methanol, or ammonia can substantially enhance emission reduction efficiency [56].
(5)
Cost share ratio
The cost share ratio is primarily determined by three factors: each party’s resources, corporate scale, and investment inclination. With regard to resource (C13), capital and technological resources determine a shipping enterprise’s capacity to bear investment risks, thereby directly influencing the upper limit of its acceptable cost share ratio in negotiations [59]. Corporate scale (C14) is a key factor influencing the cost share ratio. Large enterprises possess advantages such as superior human resources, R&D investment, and an efficient management system, all of which facilitate carbon abatement. However, they are also subject to more internal and external supervision, which encourages them to prioritize sustainable development [60]. Therefore, in cooperative negotiations, larger enterprises typically have both the capacity and a greater willingness to bear a higher proportion of the investment cost. Investment inclination (C15) determines the willingness of each party to contribute [61]. When a shipping enterprise regards low-carbon investment as a strategic priority, it places greater value on long-term intangible benefits. This strong investment inclination leads to greater sincerity in negotiations, making it willing to bear a larger share of costs to facilitate cooperation.


5. Empirical Analysis

5.1. Data and Expert Selection

To ensure the reliability and objectivity of the expert evaluation, a panel of professionals with extensive experience in the field of port sustainability and carbon reduction was invited to participate in the assessment. The selection process followed three main criteria: (1) at least five years of relevant professional experience; (2) academic or practical background in maritime management, port operations, or environmental policy; and (3) availability and willingness to provide independent judgments. Earlier studies indicate that a panel of four to six experts is sufficient for MCDM-based evaluations [62,63]. As all five experts had comparable backgrounds and experience, differential weighting was not applied [63]. Table 7 presents the detailed background information of the participating experts.
Additionally, to complement the expert-based evaluation and to enhance the robustness of the subsequent simulation, real-world carbon price data were incorporated into the analysis. The data were obtained from four pilot carbon trading platforms in China: Beijing (https://www.bjets.com.cn), Shanghai (https://www.cneeex.com), Guangdong (https://cnemission.com/), and Tianjin (https://www.chinatcx.com.cn). The dataset covers the period from 2013 to 2022 and includes the daily average trading prices of carbon allowances. Since the simulation focuses on the price fluctuation range, no additional preprocessing was required. Instead, the data were used directly to compute the corresponding price intervals, ensuring consistency across regions and years. These data provide an empirical foundation for calibrating the simulation parameters and validating the model outcomes.

5.2. Evaluation Framework

This section presents the practical analysis. A comprehensive fuzzy assessment model will be employed to evaluate the importance, operability and interrelationships of these factors identified in the preceding chapter. Initially, the importance and operability of various factors are evaluated to determine the prior probabilities using the D-S theory. Specifically, importance denotes the strategic impact of a sub-factor on the overall sustainable investment decision-making process, reflecting its strategic value. Conversely, operability characterizes the practical feasibility and the ease with which ports and shipping enterprises can implement or influence a given factor, representing its practical implementability. Next, the DEMATEL method is applied to identify the relationships and influences among factors, forming the posterior probability. Finally, the revised posterior probability is derived by combining the prior probability with the posterior probability. This approach addresses the subjectivity of individual probabilities and provides a more comprehensive assessment than previous studies. The resulting ranking reflects combined effects of factor importance, operability, and interrelationships, providing comprehensive insights for investment decision-making.
In order to address the complexity of evaluating decisions with multiple influencing factors and experts’ subjective or imprecise judgments, a five-level linguistic variable is employed [64]. This variable, as depicted in Table 8, aids in addressing the subjectivity and uncertainty inherent in expert evaluations.

5.3. Evaluation of Importance and Operability

Fuzzy set theory (FST) is an effective methodology for addressing uncertainty in human judgment within the context of multi-criteria decision-making (MCDM) [65]. To evaluate importance and operability, we adopted the TFN as the evaluation language and engaged the participation of five experts. The initial evaluation results were then converted to TFN using the definitions specified in Table 9.
Based on the initial evaluation results, the ER algorithm has shown that importance and operability are intertwined, resulting in the determination of prior probability.
(1)
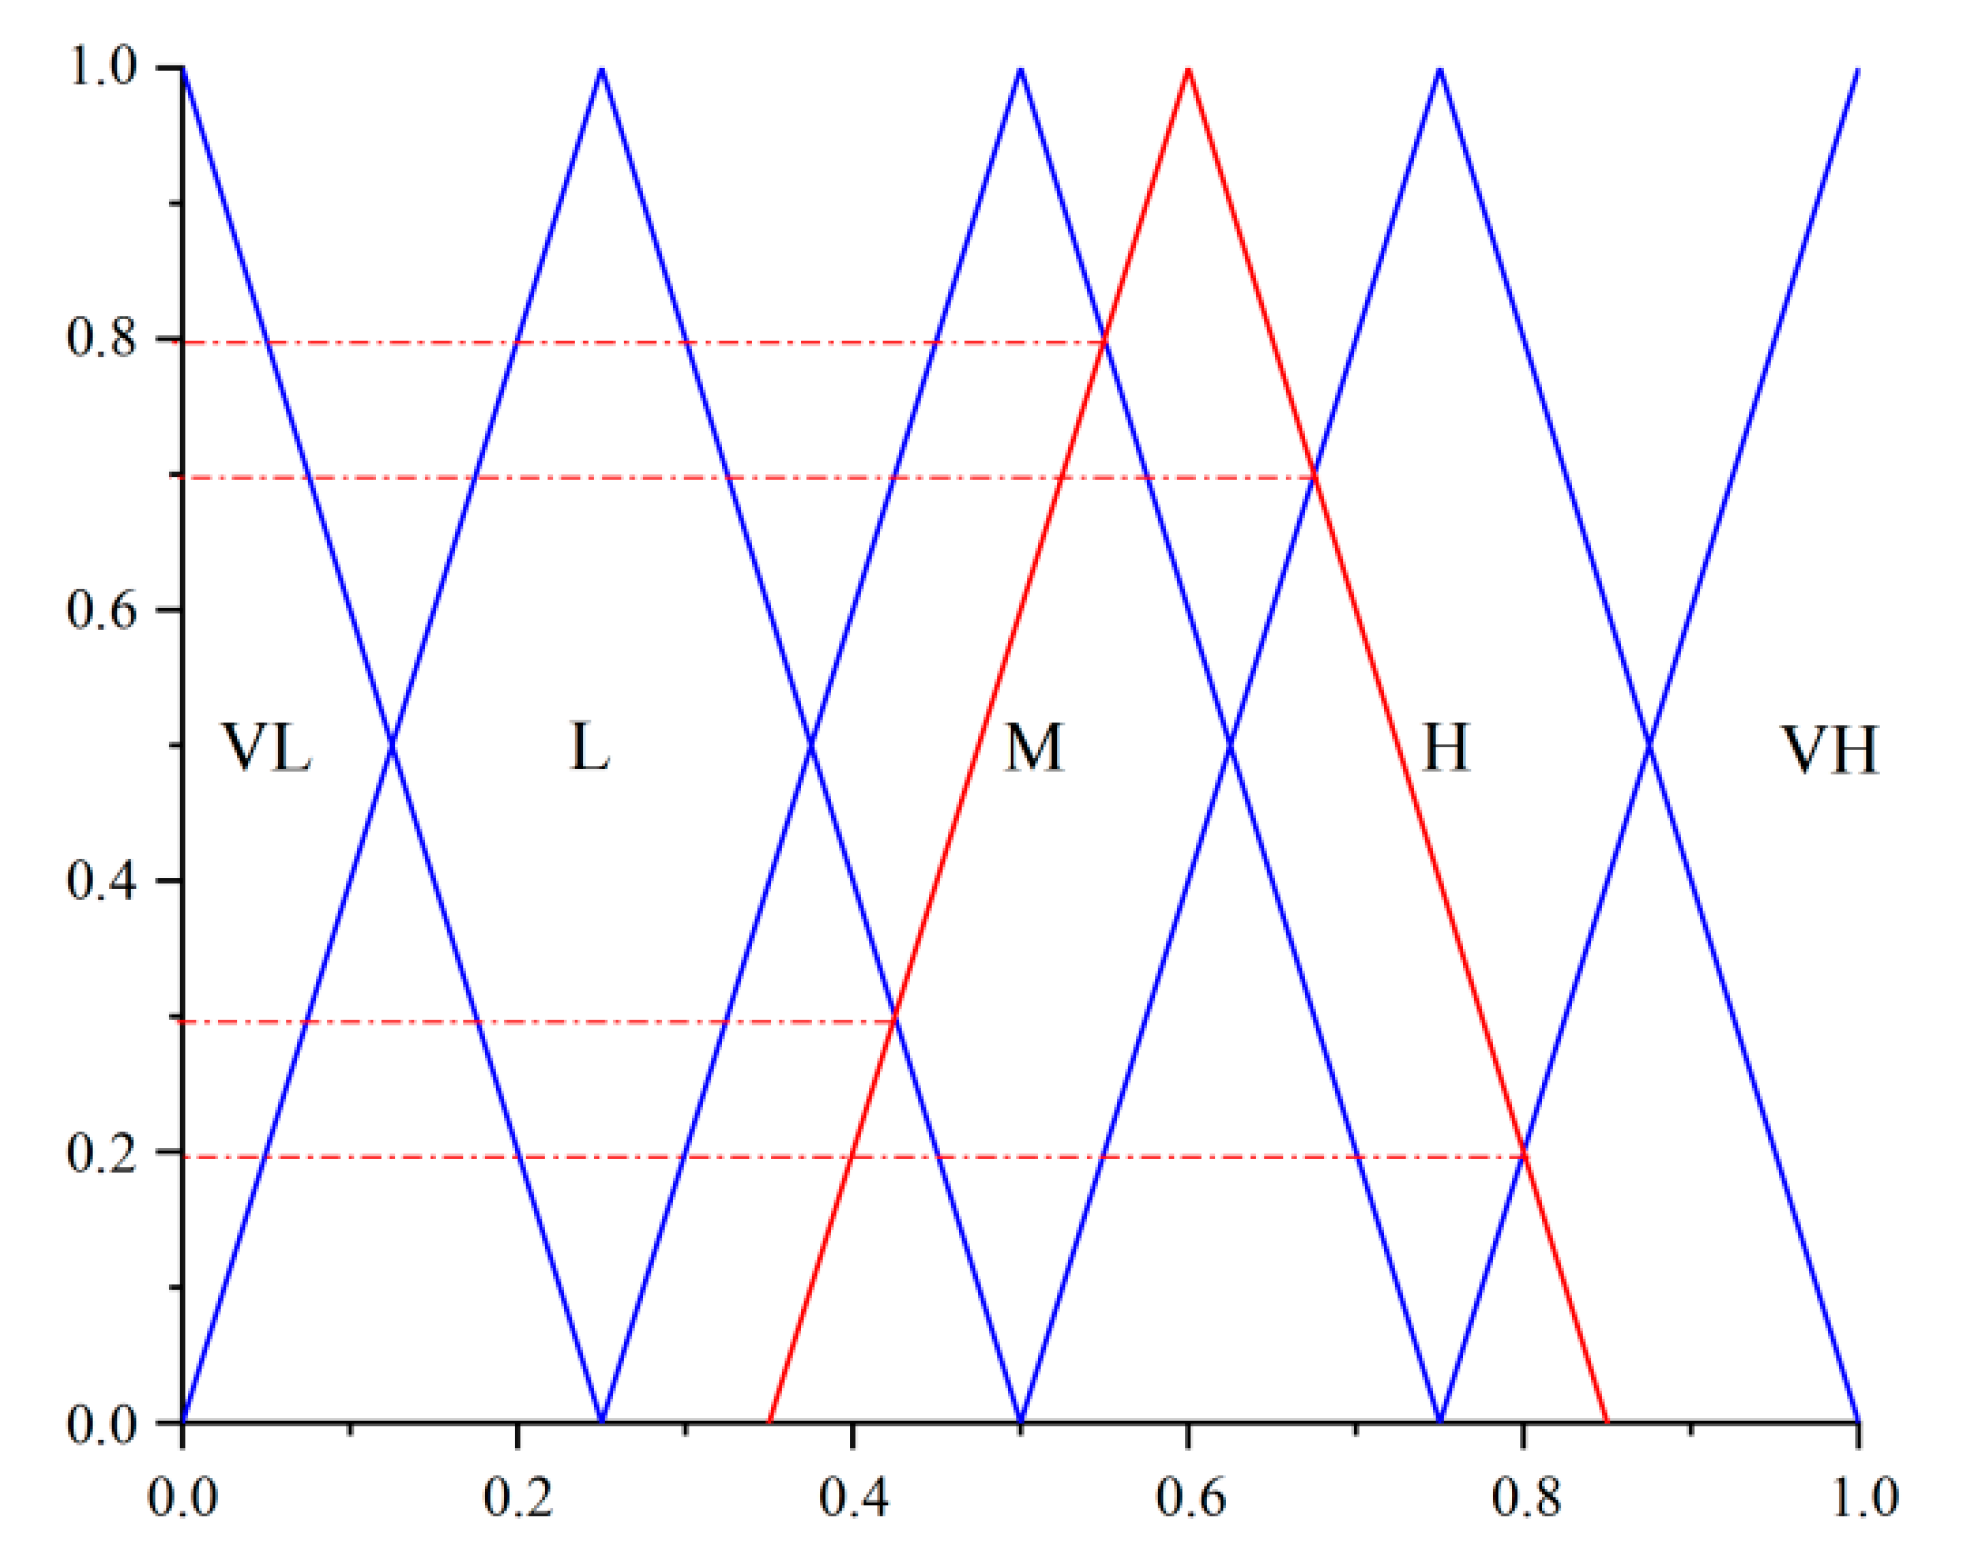
The TFN is transformed into a confidence structure by mapping it onto a uniform distribution of five confidence levels (VL, L, M, H, and VH) [66]. The intersection of the red triangle with the four evaluation grade triangles (L, M, H, and VH) in Figure 5 determines the confidence level of the TFN according to an intersection rule. The confidence is normalized to obtain the final confidence level.
(2)
The ER algorithm, which originated in the 1990s to handle MCDM in uncertain circumstances, combines all normalized confidence levels to obtain a unified confidence level. Drawing on decision theory and evidence theory, the algorithm is particularly effective in dealing with incomplete uncertainty evaluations, making it suitable for combining two types of uncertainties and obtaining their comprehensive prior importance.
The confidence levels are converted into an expected utility value, referred to as the priori importance (PI), which is displayed in the last column of Table 10 (specific calculation process provided in Appendix C).

5.4. Evaluation of Influence Relationship Among Factors

We choose five other experts to evaluate the relationship R i = D i C i among factors, using the TFN in Table 9 as the evaluation language to obtain Table 11.
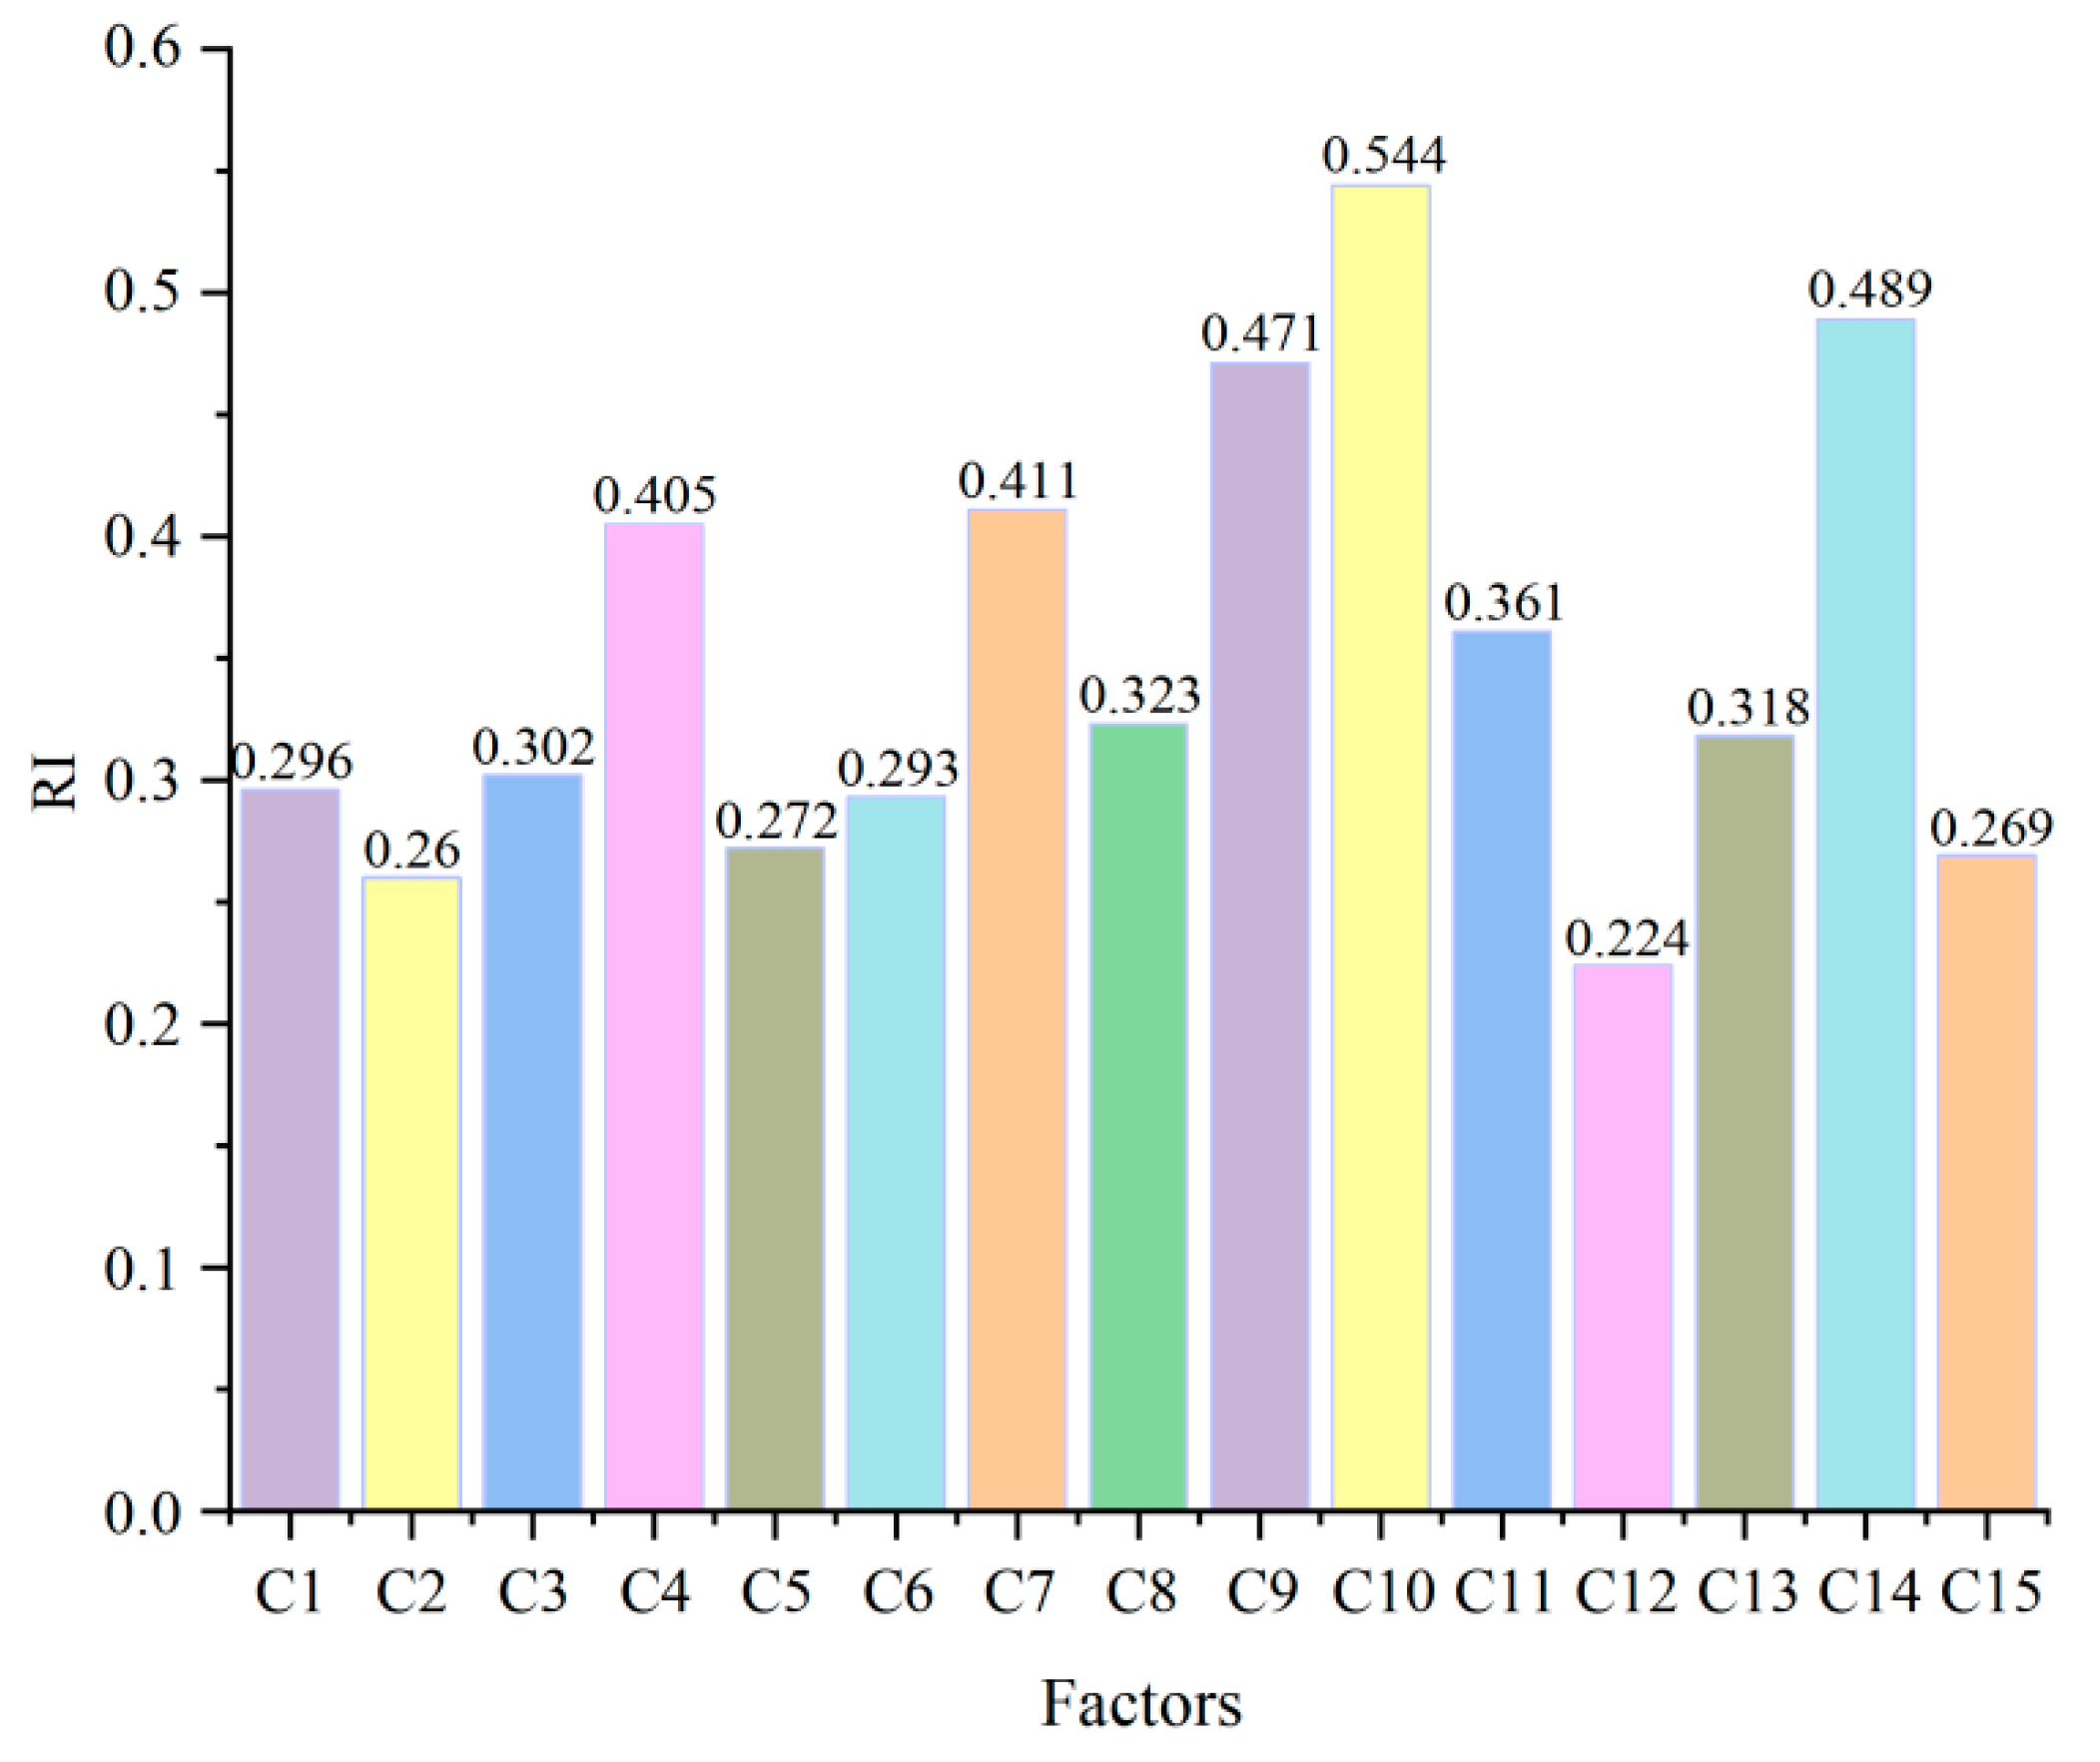
Therefore, the centrality after de-fuzzification was obtained as the revised importance (RI) by using Equation (11), shown in Figure 6.
R I = a L + 2 a M + a U 4
First, the centrality analysis reveals that low-carbon technology (C10), corporate scale (C14), and environmental factors (C9) exhibit the highest centrality, indicating their strong interconnectedness with other factors in sustainable investment decisions within the shipping supply chain, and highlighting them as primary focal points for shipping enterprises and ports. In addition, the causality analysis divides the 15 factors into a “causal group” ( R > 0 ) and an “effect group” ( R < 0 ). Before classification, we applied Equation (11) to de-fuzzify each factor’s fuzzy causality (R) to obtain a clear numerical value. The results show that factors such as government intervention (C1), resources (C13), and the macroeconomic environment (C7) are fundamental drivers that influence the entire system. The effect group mainly includes low-carbon technology (C10), product factors (C4), and investment inclination (C15). These factors are more easily influenced by others, representing relatively passive and surface-level outcomes in decision-making.
Combining centrality and causality analyses provides a profound managerial insight: although low-carbon technology (C10) holds the highest centrality, it is classified within the effect group, indicating that its advancement is influenced by other causal factors. Consequently, direct investment in technology alone may not constitute the most effective approach to enhancing sustainability in the shipping supply chain. Rather, focusing on fundamental drivers, such as policy guidance and sufficient resource support, can more effectively foster the development of low-carbon technology and optimize the overall impact of sustainable investment decisions.

5.5. Evaluation of Comprehensive Importance

Bayesian theory is commonly utilized to evaluate the likelihood of a risk occurring. When the sample data is insufficient, Bayesian theory can reasonably quantify the risk probability and enhance the reliability of probability estimation [67]. Therefore, Bayesian theory embodies the concept that new information can adjust the original probability to form a new probability. We have employed the probability correction method of Bayesian theory to derive the revised comprehensive importance, referred to as posteriori importance (PTI), using Equation (12).
P t = P a ( ω i ) P b ( ω i ) P a ( ω i ) P b ( ω i ) + P a ( ω i ¯ ) P b ( ω i ¯ )
By taking the comprehensive utility value obtained through D-S coupling of experts in Group A as the prior importance P a ( ω i ) , and the relationship between factors obtained by experts in Group B using the DEMATEL theory as the revised importance P b ( ω i ) , we can comprehensively evaluate the importance of investment influencing factors.
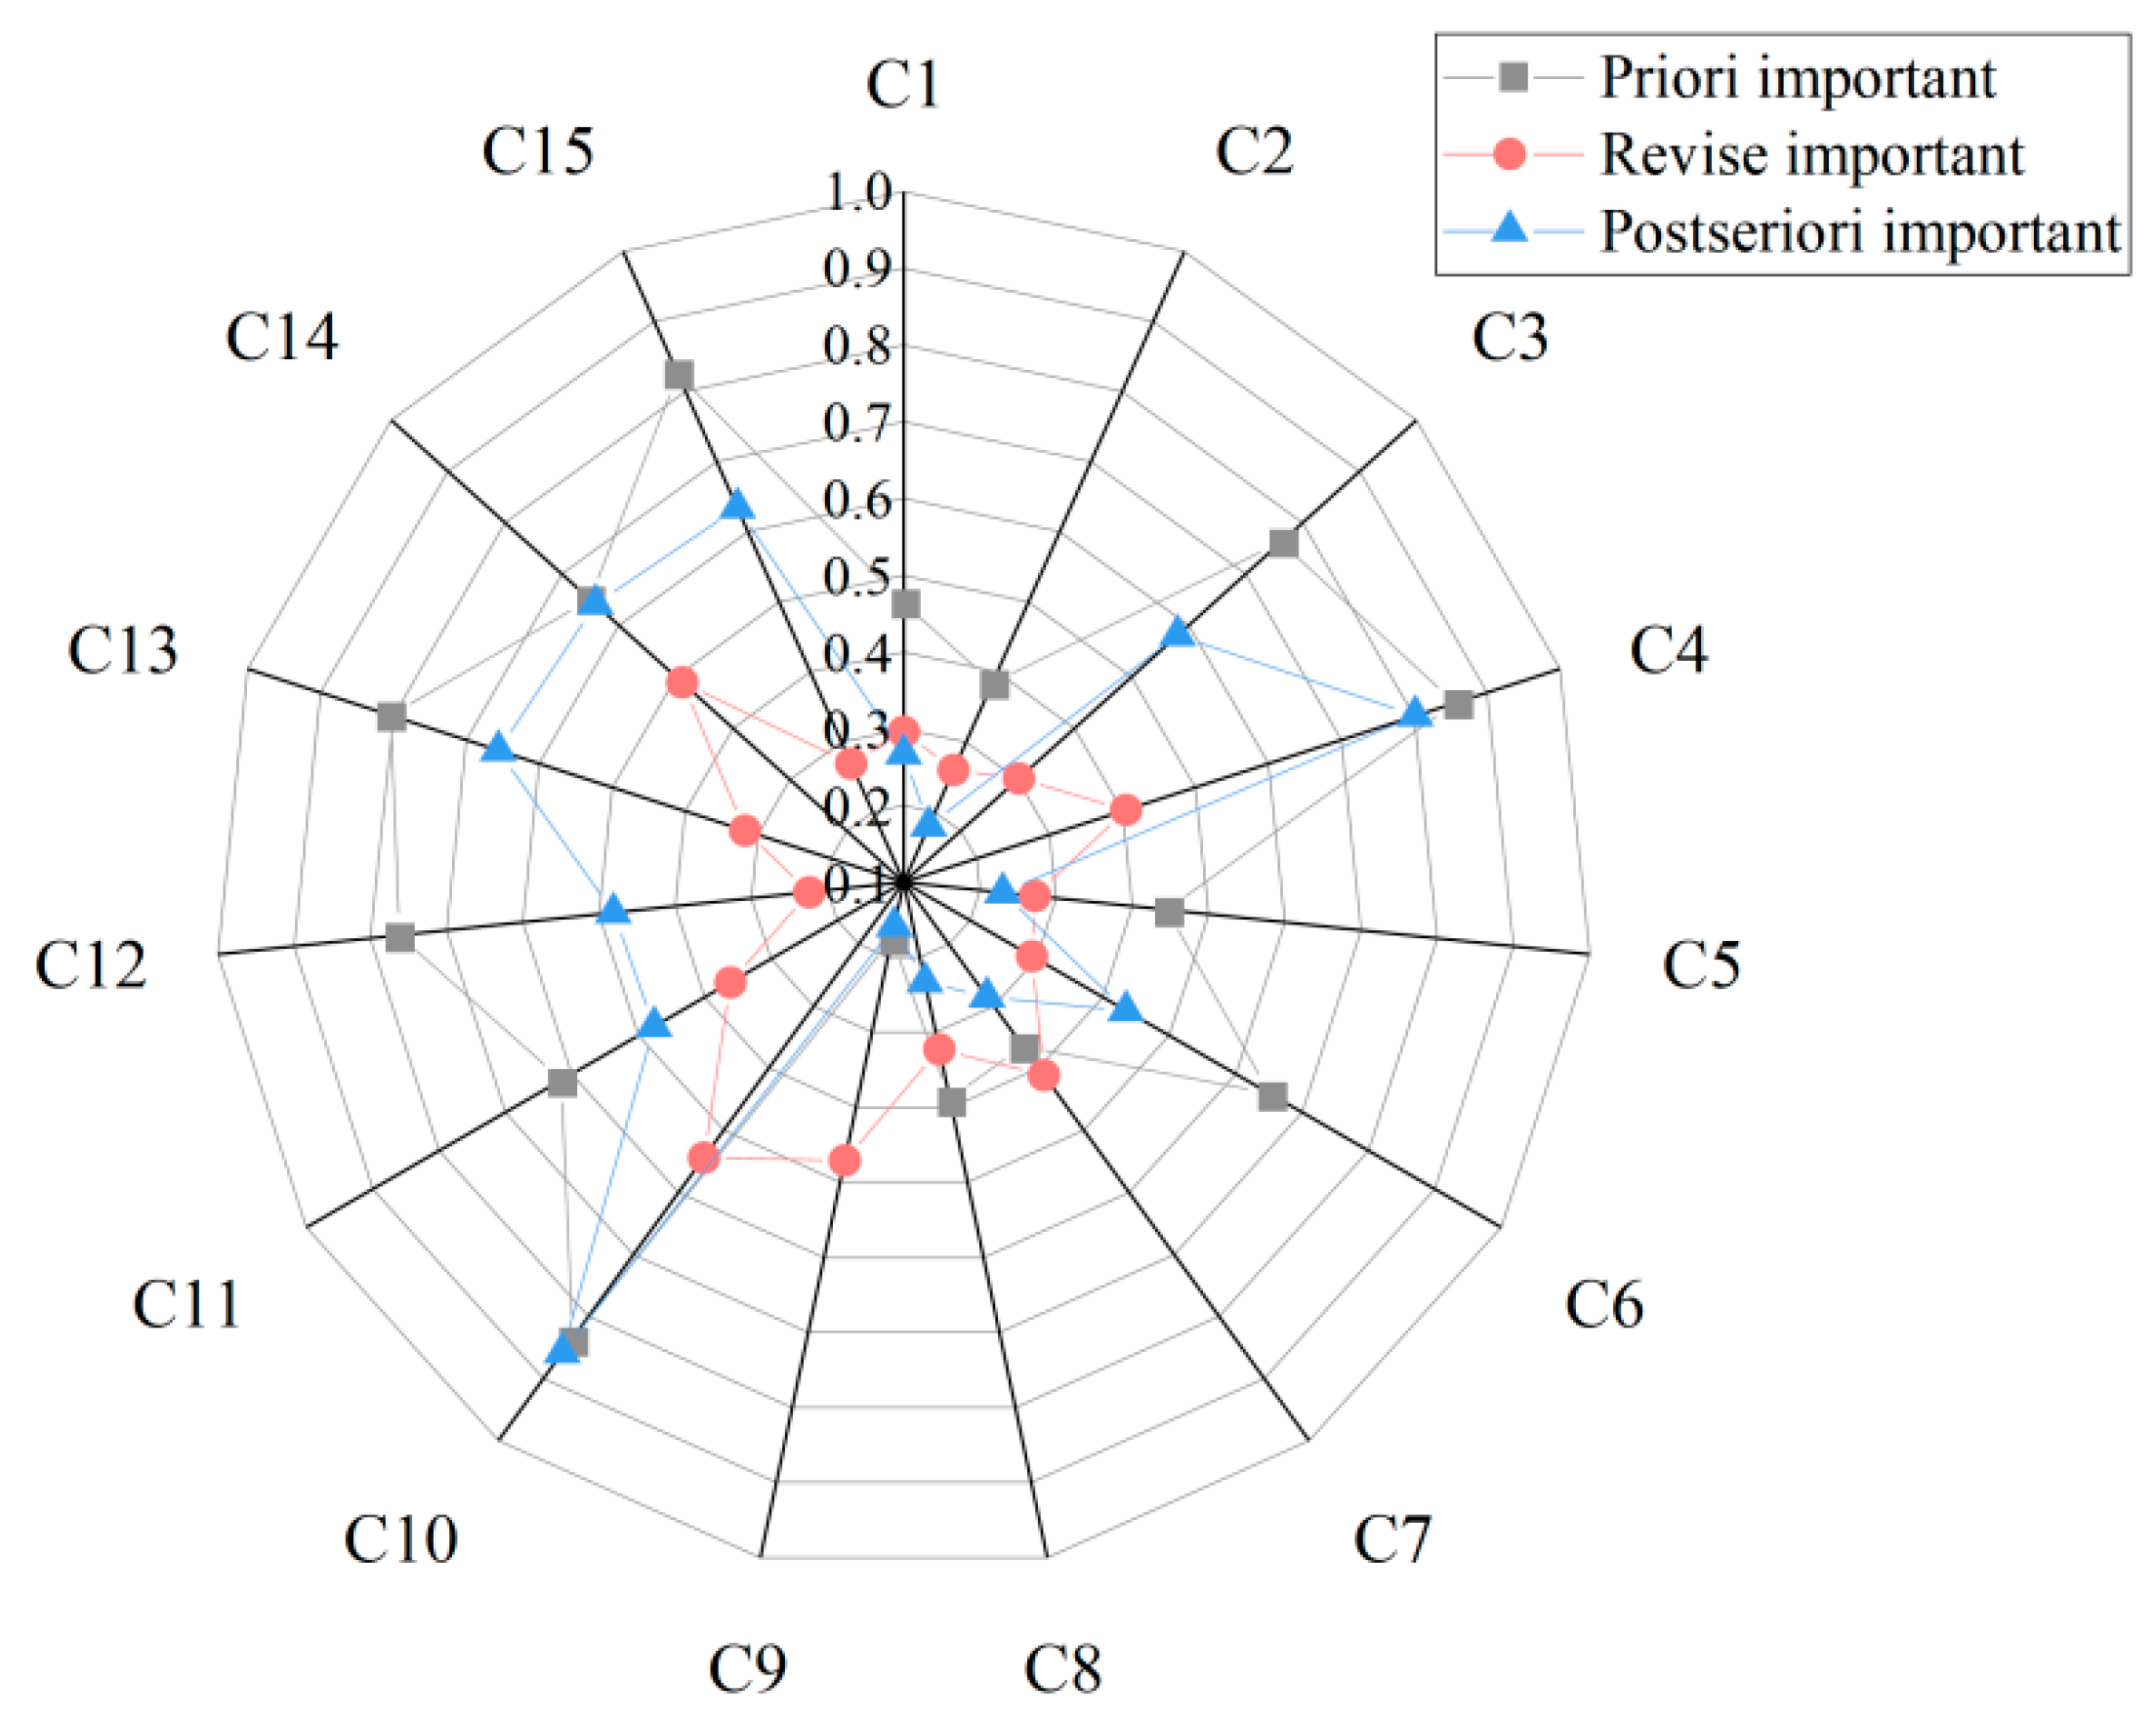
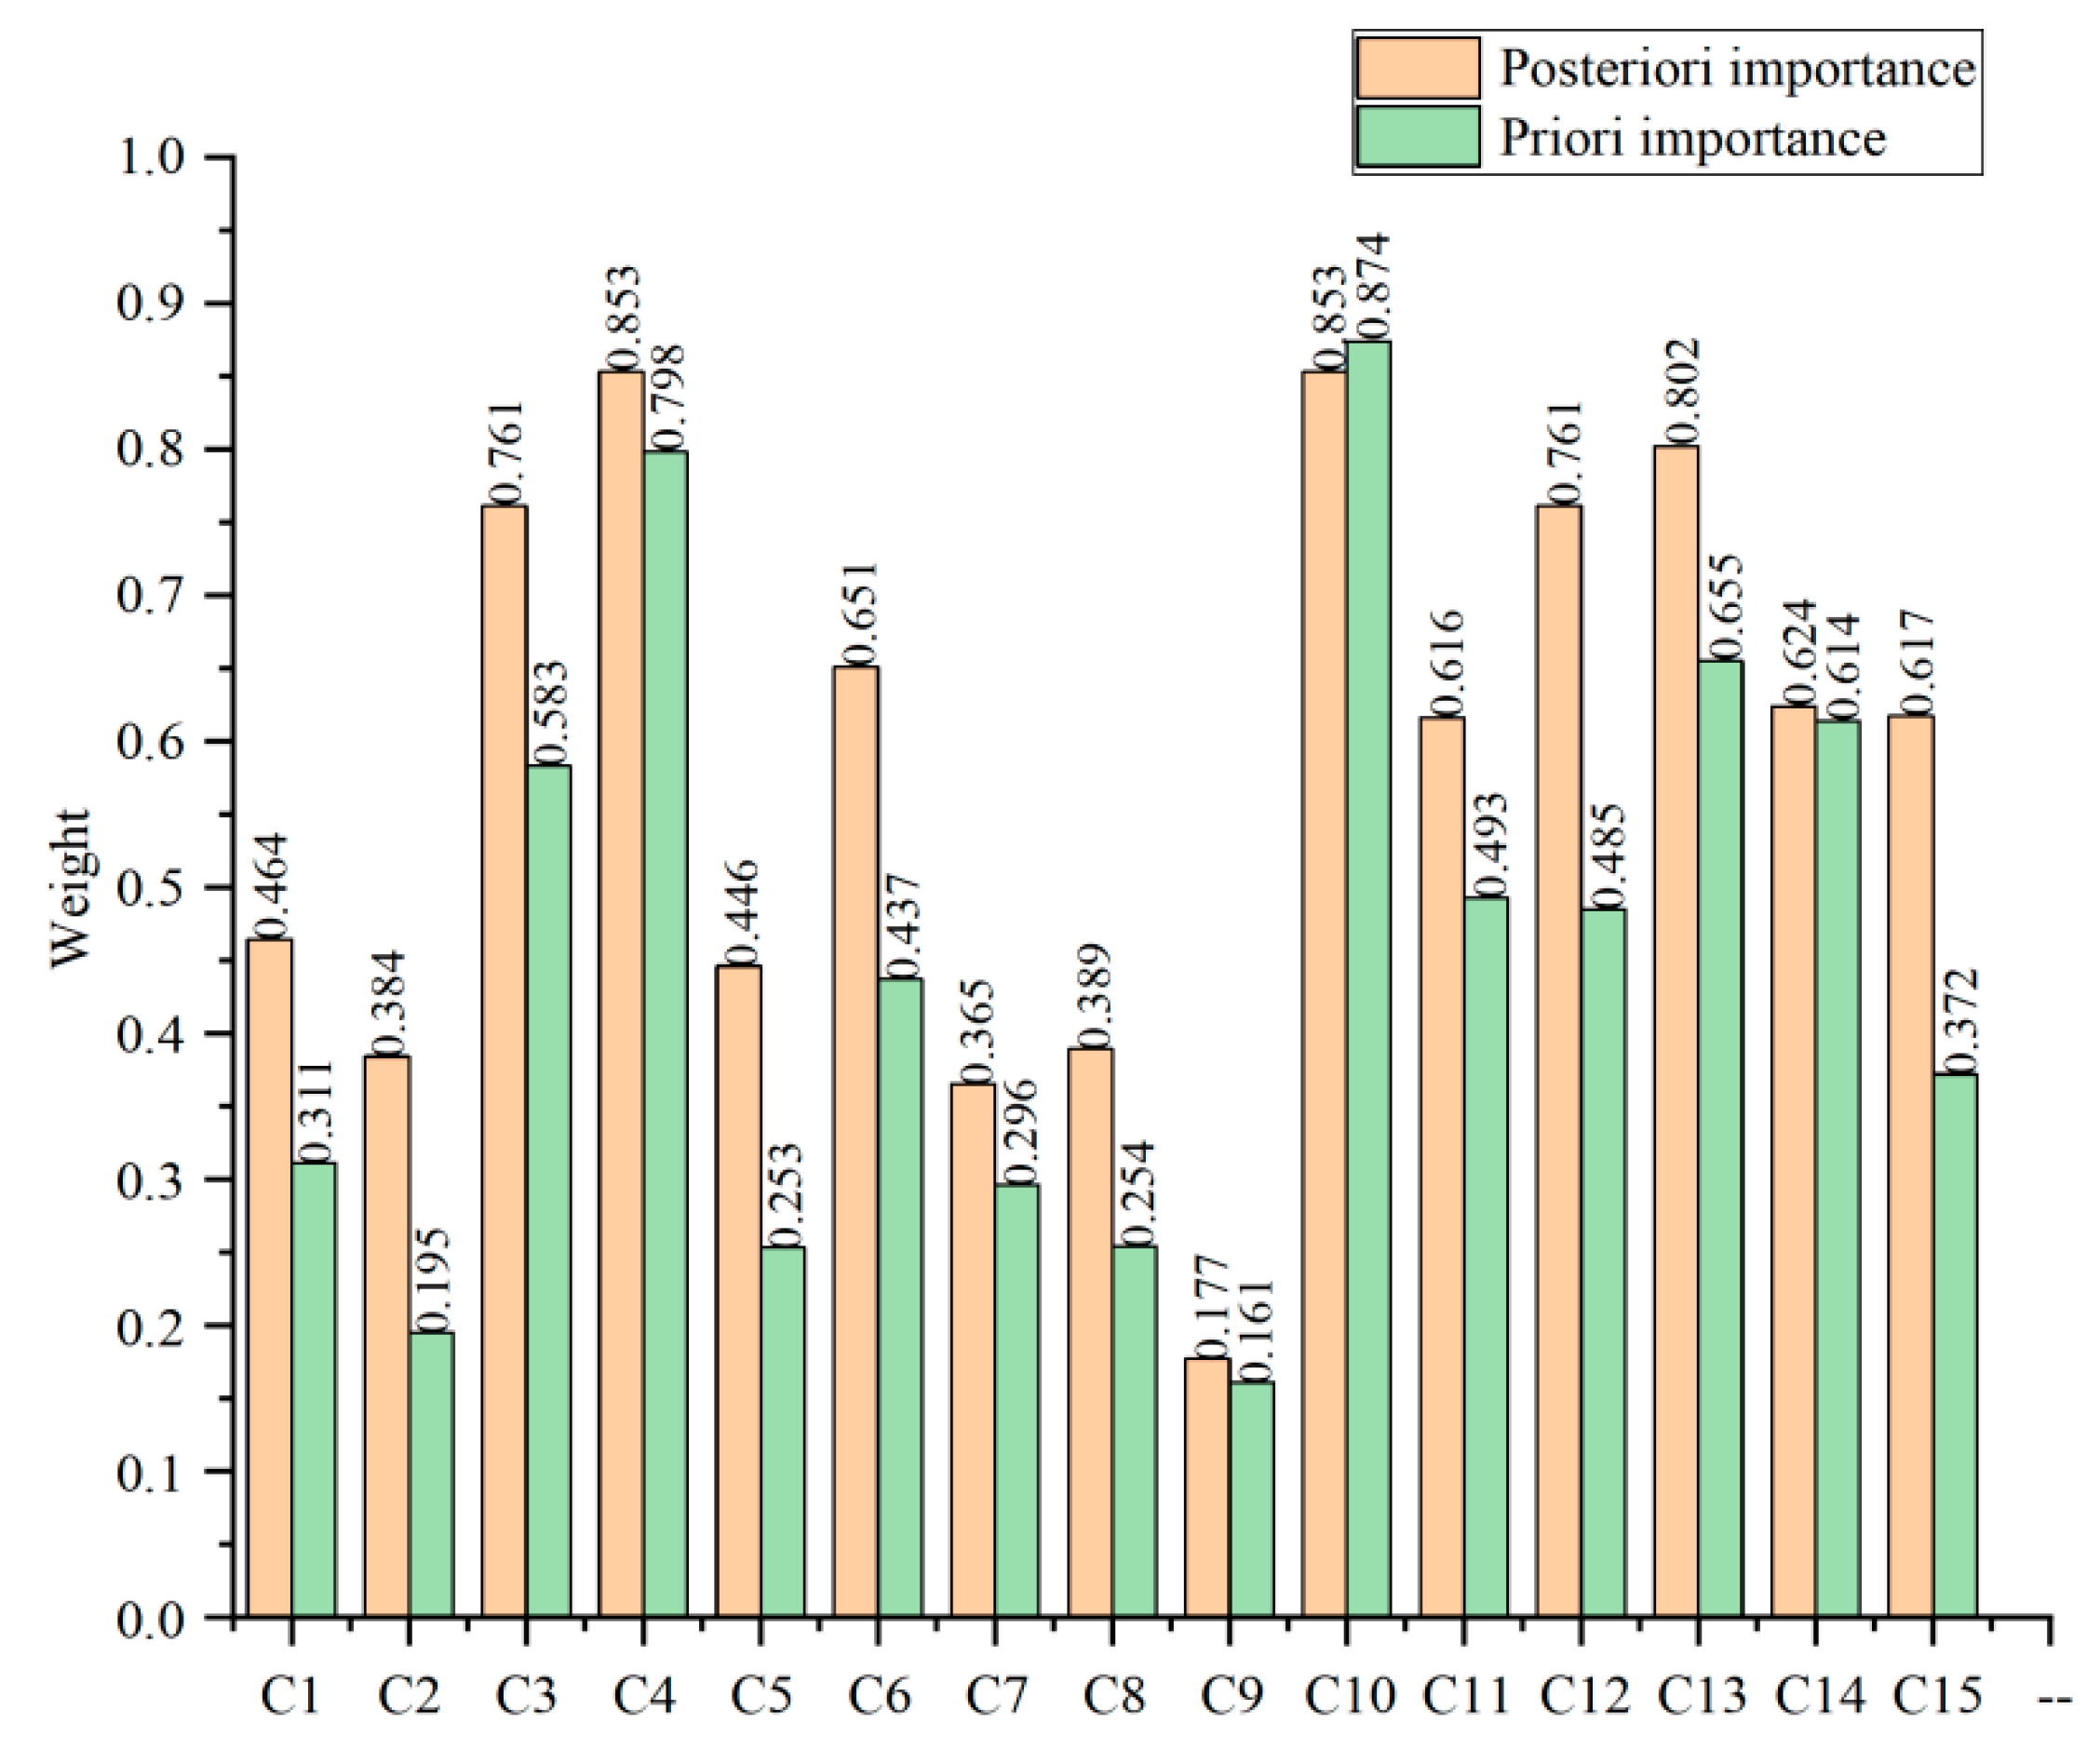
As shown in Figure 7, the pivotal role of low-carbon technology (C10) is underscored by its consistent top ranking in both PI and PTI. Uniquely among all factors, its importance score increases from PI to PTI, reflecting its systemic influence and interconnections with other factors. This finding, demonstrating technology’s dual role as both intrinsically important and a powerful systemic driver, aligns with Wang et al. [68], who highlight technological innovation as the ultimate pathway for the maritime industry to achieve net-zero emissions. Similarly, Chua et al. [69] identify the technology acceptance as a core input factor with a central role in Sustainable Shipping Management. Industry evidence further confirms this conclusion. Clarksons research reports that, in 2024, around 50% of newbuilding orders by gross tonnage incorporated alternative-fuel capability. This structural shift in shipbuilding investment patterns reflects the systemic influence of technological progress, confirming that low-carbon technology acts as the central enabler of maritime decarbonization [70]. Therefore, enterprises should prioritize low-carbon technologies in investment decisions.
While Chițimiea et al. [71] suggest that green investments are invariably combined with climate change mitigation or adaptation, our findings present a more nuanced perspective. Environmental factors (C9) occupy the bottom position among all drivers in our rankings. The primary reason for this is that these factors are beyond the control of businesses, making it a challenge for them to accurately predict or intervene in their effects. Consequently, the influence of environmental factors on both the PI and PTI is relatively limited. While enterprises acknowledge the importance of environmental factors, the practical implementation of incorporating them into investment decisions remains a complex task. Overcoming operational barriers and finding viable solutions to integrate environmental factors effectively will be crucial in promoting sustainable investment practices and achieving a more sustainable future.

5.6. Verification Analysis

This section conducts a comprehensive verification analysis to ensure the robustness, consistency, and empirical validity of the proposed framework. The verification is structured into three parts: (1) sensitivity analysis, which tests the stability of sub-factor prioritization under parameter variations; (2) simulation analysis, which examines the robustness and rationality of the comprehensive influence degrees of the five direct factors; and (3) regression analysis, which provides empirical evidence to verify the critical factors that influence the price of carbon trading.

5.6.1. Sensitivity Analysis

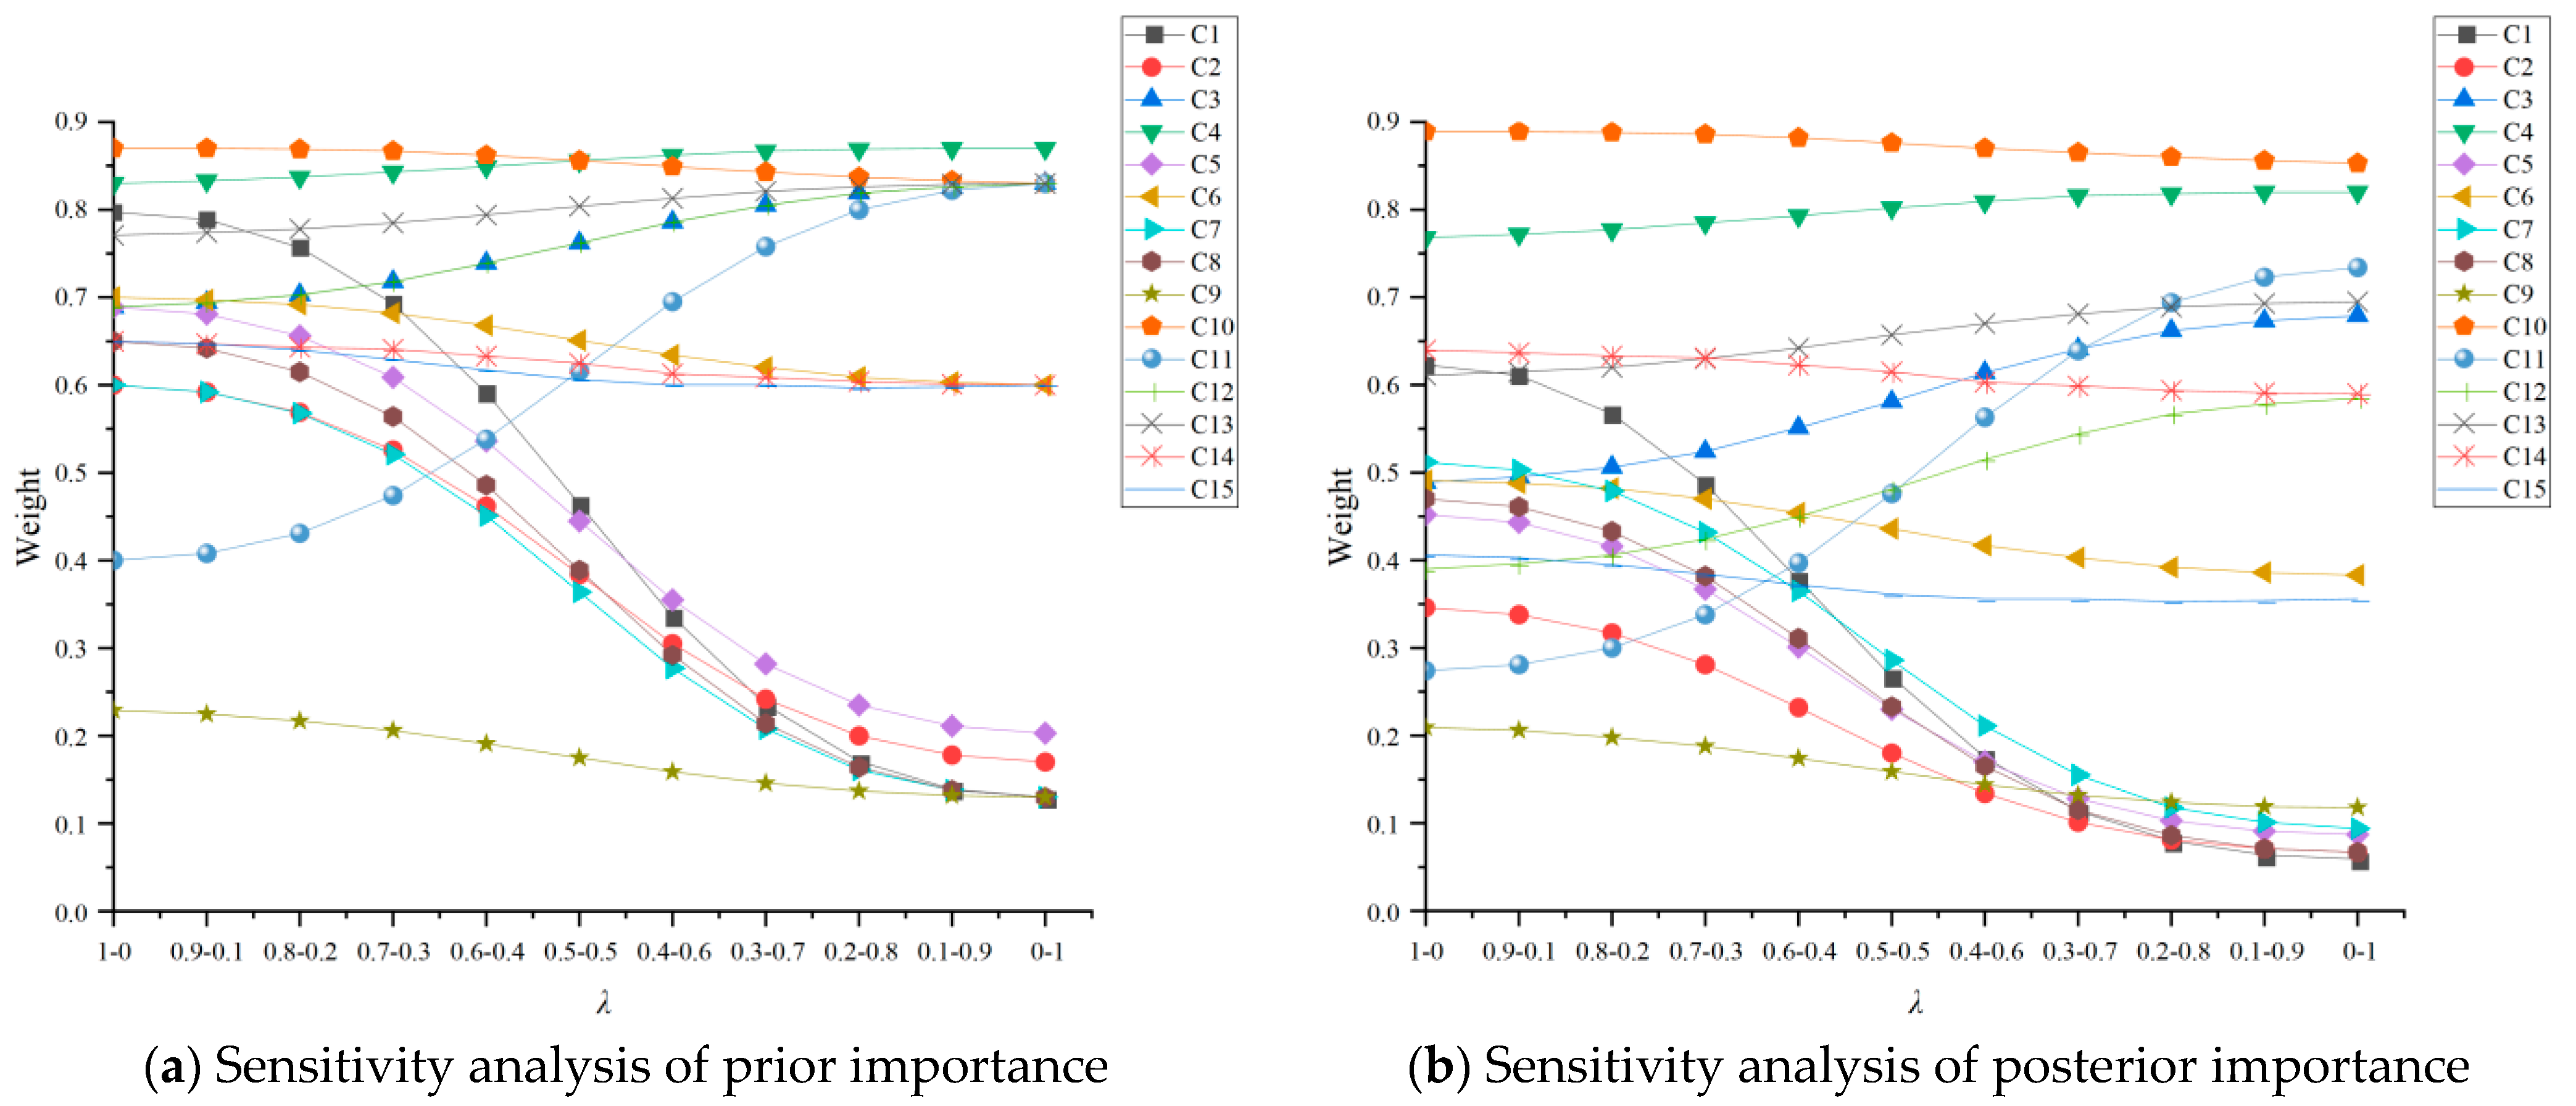
In the initial findings, we assigned a value of λ = 0.5 to represent the weight of operability in the PI. The different selection of λ can influence the relative importance of various factors. To ensure the reliability of our comprehensive approach, we conducted a sensitivity analysis. This analysis allowed us to modify the input data by adjusting the model parameters or the degree of confidence in the given linguistic terms [64]. We performed the sensitivity analysis by incrementally changing the operability weight in the PI by 0.1. The results of the sensitivity analysis for the PI and PTI are presented in Figure 8a and Figure 8b, respectively. The results demonstrate that the majority of indicators maintain the same rankings in terms of importance. For instance, C7 and C10 consistently hold the top two positions in terms of prior importance, with slight changes resulting from the increase in operability, while C9 consistently ranks last. In PTI, C10 consistently occupies the first position, while C9 is generally at a disadvantage. The sensitivity analysis reveals that low-carbon technology plays the most crucial role in the investment decision-making process for enterprises. Shipping companies and ports will carefully select the most suitable low-carbon technology to effectively reduce emissions.
Figure 8 demonstrates that there is an upward trend in the prior and posterior importance of C3, C4, C11, C12, and C13 with an increase in λ . Conversely, other factors show a declining trend due to their low operability. This pattern emerges because these four factors are closely linked to the enterprise, reflecting both its present condition and its adaptability to change. Consequently, when making decisions about investing in low-carbon solutions, enterprises should take into account their own actions and behaviors.
Upon analyzing the average values presented in Figure 9, a clear trend emerges, indicating that C10 is the factor most profoundly influenced by changes in operability weight, while C9 is the least affected. The higher sensitivity of C10 suggests that it is a critical factor for enterprises to consider when making investment decisions related to low-carbon solutions. Its significance implies that selecting the right low-carbon technology can have a substantial impact on reducing emissions and achieving sustainability goals. Conversely, the relatively lower sensitivity of C9 implies that it may have less influence on the overall decision-making process. Nevertheless, considering its contribution to the comprehensive evaluation remains essential. This finding is consistent with the initial results and further confirms the reliability of our methodology. Notably, there are a few variations in the rankings, such as the interchange of positions between C11 and C12, as well as between C1 and C7. However, these changes do not alter the overall hierarchy of importance among the factors. This consistency in the overall ranking demonstrates the robustness of our model.

5.6.2. Simulation Analysis

To examine the robustness and rationality of the comprehensive influence degrees of the five direct factors summarized in Table 12, a simulation analysis based on the evolutionary game framework is conducted. This simulation captures the behavioral interactions between ports and shipping enterprises under varying low-carbon policy and market conditions. The key parameters are determined using a combination of the literature benchmarks, expert judgments, and empirical calibration, ensuring both theoretical soundness and practical relevance.
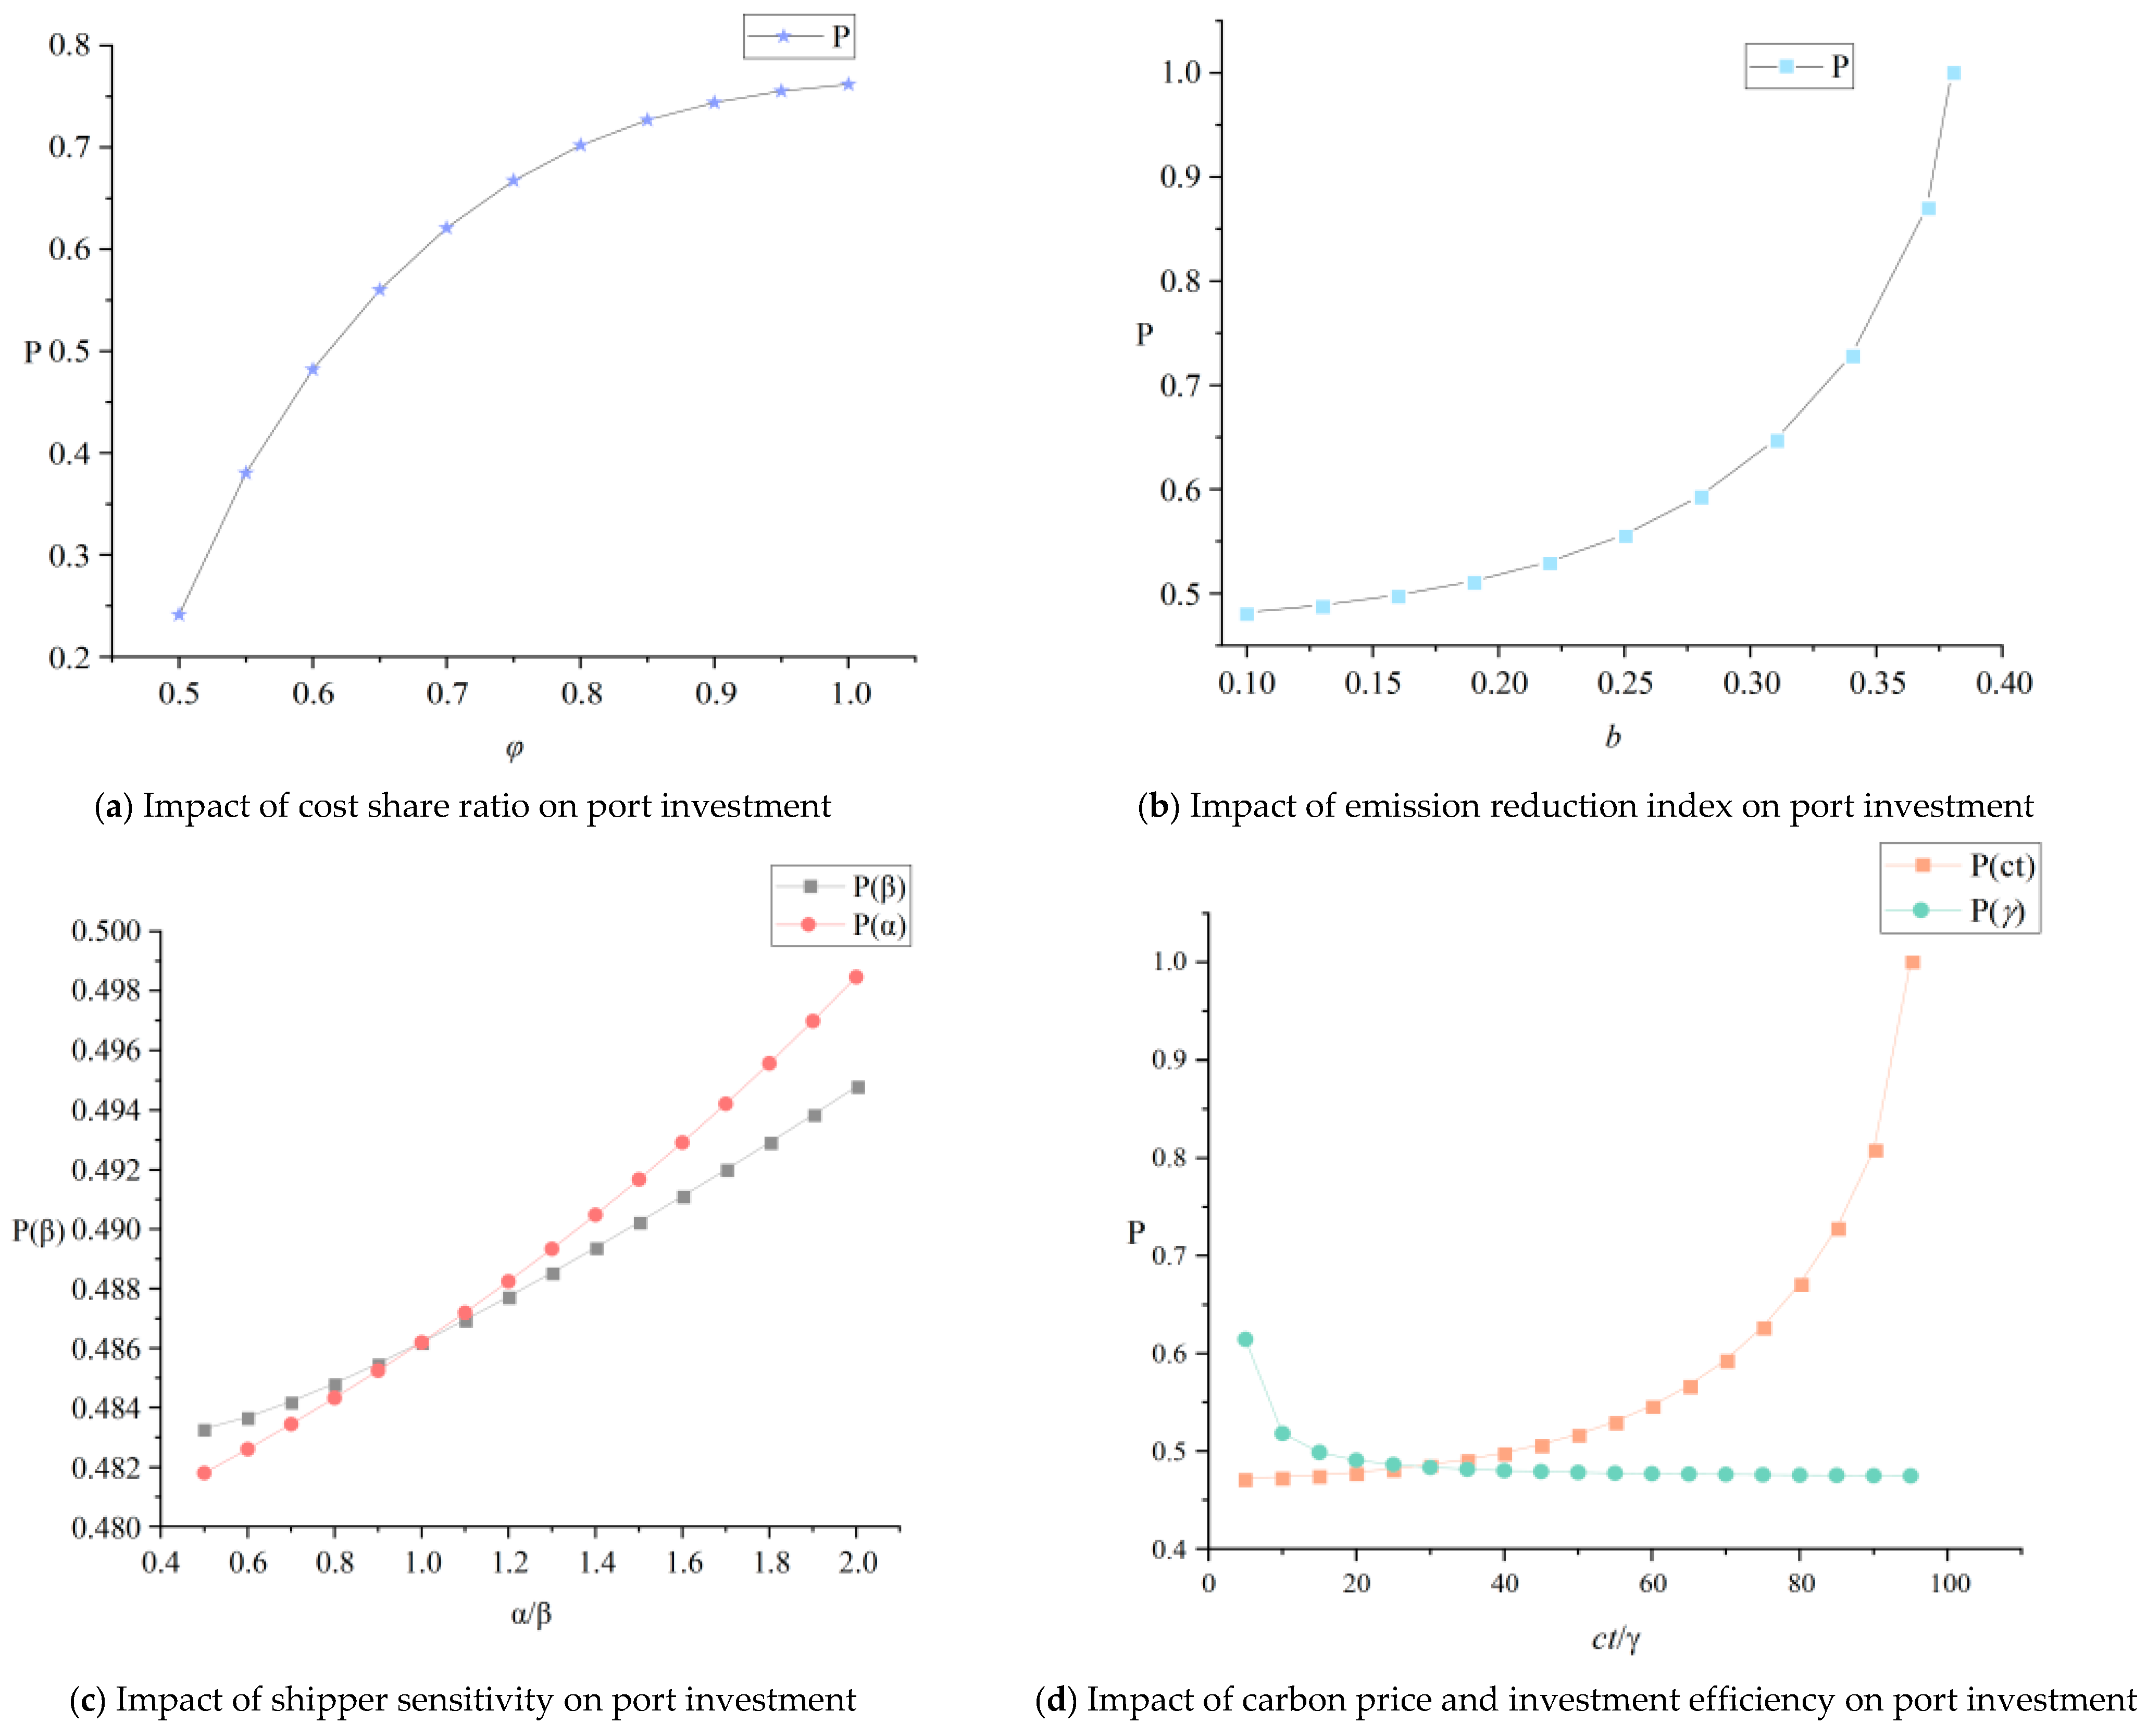
The simulation simultaneously serves as a parameter sensitivity analysis, testing the stability of behavioral outcomes across realistic policy ranges. Each parameter is systematically adjusted within its empirical range, and the corresponding changes in investment probabilities were recorded to assess behavioral stability. The normalized sensitivity in Table 12 is calculated from the average elasticity of investment probability with respect to parameter changes. The high consistency observed across most factors confirms the reliability of the results. Both approaches identify the emission reduction index and cost share ratio as the most influential determinants, while consumer sensitivity and carbon price show weaker effects. Detailed sensitivity trends are shown in Figure 10.
Specifically, the cost-sharing ratio is set within [0, 1]. A reasonable range of [0.5, 1] is adopted for graphical presentation, since when the ratio falls below 0.5, the port’s investment probability remains below 0.3, indicating limited responsiveness. Within this effective range, the port’s willingness to invest increases steadily, whereas that of the shipping enterprise declines. This opposing behavioral response highlights that the cost-sharing ratio affects the two actors differently, and the overall impact on the shipping supply chain is a combined outcome of these contrasting tendencies. When the ratio is high, the low-carbon effect of port investment tends to dominate, suggesting that an enterprise’s participation in investment is closely tied to its cost burden. This substantial influence explains why the cost-sharing ratio ranks as the most important determinant in Table 12.
In Figure 10b, the emission reduction index is normalized within [0, 1] to represent behavioral probabilities [41]. The simulation shows that the probability of port investment increases steadily as the emission reduction index rises. Even minor improvements in emission reduction performance can shift the port’s behavior from potential to certain investment, confirming the high sensitivity of investment decisions to emission reduction efforts. Investment probability reaches saturation when the index exceeds about 0.4, indicating that the effective variation lies mainly in the lower range.
Figure 10c explores shippers’ sustainability preference and price sensitivity, both varying within [0, 2] to capture a realistic behavioral spectrum, where zero denotes insensitivity and two denotes strong responsiveness, capturing a realistic behavioral spectrum [31]. The results show only marginal variation in investment probability as either coefficient varies across [0, 2], indicating limited influence of demand-side preferences on low-carbon investment under the modeled assumptions.
Figure 10d illustrates the influence of investment efficiency and carbon pricing on the probability of port investment. The results show that the carbon price exerts little influence on enterprise investment decisions across most of this range, as real market prices have typically remained below 80 CNY and stabilized around 50 CNY since 2021. Only when prices exceed enterprise affordability do investment probabilities change significantly. By contrast, higher investment costs γ decrease the likelihood of port companies investing; even at a cost level of 100, the investment probability stays around 0.5. These findings indicate that while both parameters affect investment behavior, their overall impact is weaker compared with other determinants.

5.6.3. Regression Analysis

Only the carbon price has a set of data accessible among the numerous components considered in this research. To obtain carbon trading price, we utilized data from carbon trading pilots. In order to identify the influencing factors, we conducted an analysis of the prices of crude oil, thermal coal, natural gas, air quality, the Shanghai and Shenzhen 300 Index, and the Shanghai Stock Exchange Industrial Index. The results of the regression analysis are presented in Table 13, which allow us to identify the critical factors that influence the price of carbon trading.
The results of the regression analysis confirm the ranking of influential factors, with energy price, macroeconomic environment, and environmental factors being identified as the most significant. This outcome aligns with the findings from the sensitivity analysis, further strengthening the credibility of the ranking presented in this study. It highlights the importance of considering energy price dynamics, macroeconomic conditions, and environmental considerations when formulating investment strategies and policies. These findings contribute to a comprehensive understanding of the key determinants that drive investment decisions in the relevant sectors and support decision-makers in making informed choices to promote sustainable and financially viable investments. Based on these empirical findings, the following chapter will discuss the managerial implications and propose specific policy implications.

6. Management Implications

Building on the empirical analysis and comprehensive assessment of the factors influencing sustainable investment discussed in the previous sections, this section translates the research findings into actionable management implications. To provide a clear roadmap for mitigating investment uncertainty and accelerating the maritime industry’s green transition, these implications are structured from the dual perspectives of policymakers and shipping enterprises.

6.1. For Policymakers

Given that low-carbon technology is identified as the paramount driver of sustainable investment, policymakers should transition from generic environmental mandates toward a precise incentive regulation. It is imperative for the government to prioritize a technology-oriented fiscal support system, providing targeted R&D subsidies and tax exemptions specifically for high-barrier maritime innovations, such as ammonia/hydrogen propulsion systems and onboard carbon capture technologies, to mitigate initial capital risks for private investors. To alleviate the high cost pressures of new technology adoption, authorities should spearhead the establishment of “Green Shipping Corridors”, where vessels equipped with low-carbon technologies receive preferential berthing rights and port fee rebates. Furthermore, addressing the currently limited impact of carbon pricing on investment decisions, regulators should establish a maritime decarbonization fund to recirculate carbon market revenues back into corporate green retrofitting projects, thereby strengthening the synergistic link between market mechanisms and investment strategies.

6.2. For Shipping Enterprises

Shipping enterprises should leverage their corporate scale and governance capabilities to transform environmental constraints into competitive advantages. Leading enterprises must act as chain leaders by adopting a phased fleet greening strategy, prioritizing the integration of energy-saving technologies such as air lubrication or rotor sails, and utilizing their collective bargaining power to reduce the procurement costs of green fuels, thereby setting industry benchmarks. Considering that consumer sensitivity is a pivotal direct factor influencing investment, enterprises should implement carbon footprint tracking systems based on blockchain to provide B2B clients with verifiable green certificates, effectively converting public low-carbon awareness into premium revenue and brand loyalty. Furthermore, shipping enterprises should incorporate carbon performance clauses into their supplier procurement criteria. By offering technical support or preferential payment terms to upstream and downstream partners who adopt low-carbon measures, they can foster a symbiotic momentum for green transformation across the entire supply chain, ensuring long-term operational resilience under increasingly stringent international emission regulations.

7. Conclusions

This paper develops a novel multi-method framework to identify and prioritize the key factors influencing sustainable investment in the shipping supply chain. By combining the influencing factors, we propose several measures and suggestions that can serve as a reference for enterprises and policymakers when making investment decisions. The framework offers strategic guidance for low-carbon investment in port and shipping enterprises. The main contributions and novel findings of this study are highlighted as follows:
(1)
This study adopts a research paradigm that integrates modeling analysis with empirical evaluation. We begin by employing an evolutionary game model to identify the direct factors influencing sustainable investment decisions in the shipping supply chain. Subsequently, we apply a comprehensive assessment framework that systematically combines expert judgment with the objective interrelationships among factors, thereby enabling a deeper and more rigorous assessment and prioritization of these factors. The results demonstrate that the central role of the technological factor is amplified not only by its intrinsic importance and operability but also by its strong influence on other factors.
(2)
This study identifies and ranks 15 sub-factors in the comprehensive assessment model, revealing two key findings: low-carbon technology is the most critical driver of sustainable investment, whereas environmental factors consistently rank the lowest in importance. This is because, although environmental issues provide an underlying impetus for action, managers tend to prioritize factors that are characterized by a high degree of managerial controllability and predictability.
(3)
The results show that internal factors of enterprises, such as enterprise governance level, resource, and corporate scale, significantly impact investment decisions. Although sustainable investment is also influenced by external factors such as government incentives and macroeconomic environment, the core impetus lies in the enterprise’s internal capacity building and managerial innovation.
This paper possesses several limitations. Firstly, the research relies on the subjective judgments of a limited number of experts. To address this concern in future studies, we recommend expanding stakeholder participation and incorporating a wider range of objective data. Secondly, the exploration of influencing factors conducted in this study may not be comprehensive enough. To enhance our comprehension of these factors in subsequent research, it is crucial to integrate insights from diverse real-world scenarios and the emerging literature. Thirdly, the current findings may overlook regional variations in regulations and policies, which could lead to differences in the priority ranking of influencing factors. Future research could leverage big data analytics and large-sample quantitative approaches to mitigate subjective bias and systematically capture the heterogeneity of sustainable investment drivers across diverse regional contexts, thereby identifying how key factors vary under different geographical and regulatory environments.

Author Contributions

Conceptualization, S.X. and Y.K.; methodology, S.X. and X.G.; validation, X.G.; formal analysis, S.X., J.W. and Y.K.; investigation, J.W.; data curation, X.G. and Y.K.; writing—original draft preparation, S.X. and Y.K.; writing—review and editing, J.W. and X.G.; supervision, X.G.; funding acquisition, X.G., J.W. and Y.K. All authors have read and agreed to the published version of the manuscript.

Funding

This research was funded by the National Natural Science Foundation of China (grant number 72402022) and the Natural Science Foundation of Liaoning (grant number 2025-BS-0206).

Data Availability Statement

The data that support the findings of this study are available from the corresponding author upon reasonable request.

Acknowledgments

The authors sincerely thank the editor and the anonymous reviewers for their constructive and important comments on the paper.

Conflicts of Interest

The authors have no competing interests to declare that are relevant to the content of this article.

Appendix A

The profit and pricing sequence in four different investment strategies are as follows.
Strategy NN (no investment, no investment). Ports and shipping enterprises choose not to invest. Meantime, the profit function of shipping enterprises is π c N N = m Q , and port is π p N N = w Q ( q Q K ) c t , of which the sustainable level is zero. The sequence of events is as follows: the shipping enterprises first determine the marginal profit m , and the port determines the service fee w according to m .
Strategy YN (investment, no investment). The investment cost is to be paid by port. The profit function of the shipping enterprise and port are π c Y N = m Q and π p Y N = w Q ( ( q b θ ) Q K ) c t γ θ 2 / 2 , respectively. The sequence of events is as follows: the shipping enterprise first determines the marginal profit m , and the port determines the service fee w and the sustainable investment level θ according to it.
Strategy NY (no investment, investment). Investment cost is paid by shipping enterprises, when the profit function of shipping enterprises and port are π c N Y = m Q γ θ 2 / 2 and π p N Y = w Q ( ( q b θ ) Q K ) c t , respectively. The sequence of events is as follows: the shipping enterprise first determines the marginal profit m and sustainable investment level θ , and the port determines the service fee w according to m .
Strategy YY (investment, investment). The cost of sustainable investment is shared by port and shipping enterprises; the shipping enterprise bears γ θ 2 ϕ / 2 and the port bears γ θ 2 ( 1 ϕ ) / 2 . The profit function of shipping enterprises and port are π c Y Y = m Q γ θ 2 ϕ / 2 and π p Y Y = w Q ( ( q b θ ) Q K ) c t γ θ 2 ( 1 ϕ ) / 2 , respectively. The sequence of events is as follows: the shipping enterprise first determines the marginal profit m and sustainable investment level θ , and the port determines the service fee w according to m .
According to the above four strategies, the equilibrium solution can be obtained by the inverse method, as shown in Table A1. To make all equilibrium solutions positive and ensure the existence of optimal solutions (Hessian matrix is negative definite matrix), we can obtain γ > γ ^ = M a x { c t ( α + b c t β ) ( a b + q α ) ( a + 3 c t q β ) ϕ , ( α b c t β ) 2 2 β + 2 b c t α , c t ( α + b c t β ) ( a b + 2 q α + b c t q β ) a + 3 c t q β , ( α + b c t β ) 2 4 β ϕ } and a > c t q β .
Table A1. Equilibrium solutions under four strategies.
NNYNNYYY
w a + 3 c t q β 4 β ( γ ( a + 3 c t q β ) c t α + b c t β ( a b + 2 α q + b c t q β ) ) / ( 2 ( 2 γ β ( α + b c t β ) 2 ) ) ( a γ c t ( α + b c t β ) ( a b + q α ) ) / ( 4 γ β ( α + b c t β ) 2 ) ( γ ( a + 3 c t q β ) ϕ c t ( a b + q α ) ( α + b c t β ) ) / ( 4 γ β ϕ ( α + b c t β ) 2 )
m a c t q β 2 β a c t q β 2 β 2 γ ( a c t q β ) 4 γ β ( α + b c t β ) 2 2 γ ( a c t q β ) ϕ 4 γ β ϕ ( α + b c t β ) 2
Q a c t q β 4 γ β ( a c t q β ) 2 ( 2 γ β ( α + b c t β ) 2 ) γ β ( a c t q β ) 4 γ β ( α + b c t β ) 2 γ β ( a c t q β ) ϕ 4 γ β ϕ ( α + b c t β ) 2
θ - ( α + b c t β ) ( a c t q β ) 2 ( 2 γ β ( α + b c t β ) 2 ) ( α + b c t β ) ( a c t q β ) 4 γ β ( α + b c t β ) 2 ( α + b c t β ) ( a c t q β ) 4 γ β ϕ ( α + b c t β ) 2
π p * ( a c t q β ) 2 + 16 K β c t 16 β γ ( a c t q β ) 2 + 8 K c t ( 2 γ β ( α + b c t β ) 2 ) / 8 ( 2 γ β ( α + b c t β ) 2 ) γ 2 β ( a c t q β ) 2 + K c t ( 4 γ β ( α + b c t β ) 2 ) 2 / ( 4 γ β ( α + b c t β ) 2 ) 2 γ ( a c t q β ) 2 ( ( α + b c t β ) 2 ( ϕ 1 ) + 2 γ β ϕ 2 ) + 2 K c t ( ( α + b c t β ) 2 4 γ β ϕ ) 2 / ( 2 ( ( α + b c t β ) 2 4 γ β ϕ ) 2 )
π c * ( a c t q β ) 2 8 β γ ( a c t q β ) 2 4 ( 2 γ β ( α + b c t β ) 2 ) γ ( a c t q β ) 2 2 ( 4 γ β ( α + b c t β ) 2 ) γ ( a c t q β ) 2 ϕ 2 ( 4 γ β ϕ ( α + b c t β ) 2 )

Appendix B

For the port, the fitness function under “Investment” strategy is
f p Y = y π p Y Y * + ( 1 y ) π p Y N *
The fitness under “No investment” strategy is
f p N = y π p N Y * + ( 1 y ) π p N N *
The average fitness function is
f p = x f p Y + ( 1 x ) f p N
For the shipping enterprise, the fitness function under “Investment” strategy is
f c Y = x π c Y Y * + ( 1 x ) π c N Y *
The fitness under “No investment” strategy is
f c N = y π c Y N * + ( 1 y ) π c N N *
The average fitness function is
f c = x f c Y + ( 1 x ) f c N
Therefore, the repeated dynamic differential equations of ports and shipping enterprises are
f ( x ) = d x d t = x ( 1 x ) [ y ( π p Y Y * π p N Y * ) + ( 1 y ) ( π p Y N * π p N N * ) ]
f ( y ) = d y d t = y ( 1 y ) [ x ( π c Y Y * π c Y N * ) + ( 1 x ) ( π c N Y * π c N N * ) ]
Let d x d t = 0 and d y d t = 0 , we can obtain the Evolutionary equilibrium point ( 0 , 0 ) , ( 1 , 0 ) , ( 0 , 1 ) , ( 1 , 1 ) and x s , y s , where x s = π c N N * π c N Y * π c Y Y * π c N Y * π c Y N * + π c N N * and y s = π p N N * π p Y N * π p Y Y * π p N Y * π p Y N * + π p N N * .
The Jacobian matrix j of the above differential equation is
J = ( 1 2 x ) [ y ( π p Y Y * π p N Y * ) + ( 1 y ) ( π p Y N * π p N N * ) x ( 1 x ) [ π p Y Y * π p N Y * π p Y N * + π p N N * ] y ( 1 y ) [ π c Y Y * π c Y N * π c N Y * + π c N N * ] ( 1 2 y ) [ x ( π c Y Y * π c Y N * ) + ( 1 x ) ( π c N Y * π c N N * ) ]
Then, the local stable point is determined by analyzing the determinant and the sign of trace on the five equilibrium points as follows.
det J = j 11 j 12 j 21 j 22 = j 11 j 22 j 12 j 21 > 0 t r J = j 11 + j 22 < 0
When a point satisfies the condition (26), it is a local stable point (ESS).

Appendix C

Table A2. Definitions of sub-factors and their relationships with direct factors.
Sub-FactorsSub-FactorsDefinitionRelationship
Investment efficiencyGovernment intervention (C1)The extent of government involvement through subsidies, tax incentives, or green credit support for sustainable investments.It directly enhances the return on investment (ROI) by mitigating externality costs and providing financial support.
Market perfection degree (C2)The level of transparency, liquidity, and the soundness of legal frameworks within the green shipping market.A well-functioning market mechanism reduces transaction costs and information asymmetry, thereby optimizing investment efficiency.
Enterprise governance level (C3)The effectiveness of internal institutional systems regarding environmental decision-making, risk management, and resource allocation.High-quality governance ensures the scientificity of sustainable investment decisions and determines internal resource conversion efficiency.
Consumer sensitivityProduct factors (C4)The low-carbon attributes of shipping services and their performance in terms of service quality and punctuality.The green premium of service products serves as the fundamental basis for consumer sensitivity toward price and environmental attributes.
Marketing strategy (C5)The methods and intensity used by shipping enterprises to promote the advantages of low-carbon logistics and enhance their green brand image.Proactive marketing amplifies consumer preference for green services by shaping and guiding their environmental perceptions.
Customer Satisfaction (C6)The evaluation and loyalty of shippers toward existing green shipping services.High satisfaction translates into brand stickiness, strengthening consumer sensitivity toward green premiums.
Carbon priceMacroeconomic environment (C7)The macroscopical environment, including global and regional economic growth rates and trade activity levels.Economic fluctuations influence the supply and demand of carbon emission allowances by altering shipping demand, thus determining carbon price.
Related energy prices (C8)The market prices of traditional and alternative fuels, such as Very Low Sulfur Fuel Oil (VLSFO) and Liquefied Natural Gas (LNG).Energy prices are highly correlated with carbon emission costs, serving as external variables that regulate carbon trading prices.
Environmental factors (C9)The stringency of emission regulations and the orientation of climate policies from IMO and various national governments.Environmental policy enforcement defines emission caps, directly determining carbon trading prices.
Emission reduction indexTechnology (C10)The performance of maritime decarbonization technologies (e.g., scrubbers, high-efficiency engines, and carbon capture).The advancement of technology directly dictates the upper limit of CO2 emission reduction achievable per unit of investment.
Operational measures (C11)Management-based emission reduction methods such as vessel speed optimization, route planning, and fleet upscaling.Operational optimization contributes directly to the emission reduction index by improving energy efficiency without hardware modifications.
Energy types (C12)The types of fuels utilized by vessels, such as methanol, hydrogen, or ammonia.The transition of the energy structure is the most critical determinant of the emission reduction index, defining the depth of decarbonization.
Cost share ratioResource (C13)The transition of the energy structure is the most critical determinant of the emission reduction index, defining the depth of decarbonization.Resource endowment determines the negotiating leverage of a shipping enterprise to bear initial investment costs in cooperative agreements.
Corporate scale (C14)Indicators of an enterprise’s size, such as total assets, fleet capacity, or port throughput.Economies of scale allow larger shipping enterprises to absorb high costs more effectively, thereby altering the cost-sharing proportions.
Investment inclination (C15)The degree of strategic importance an enterprise places on long-term sustainability and its willingness to assume risks.A strong investment inclination drives enterprises to proactively bear a higher proportion of costs.

Appendix D

This appendix provides a generalized calculation procedure for any given influence factor C i ( i { 1 ,   ,   15 } ), covering the entire process from the collection of expert linguistic evaluations to the determination of final utility values.
After collecting evaluations from experts e { 1 ,   ,   5 } regarding the importance and operability of each factor, the linguistic ratings (VL, L, M, H, VH) are mapped to standard TFN ( a , b , c ) as defined in Figure 5. For a specific factor C i , the integrated TFN is synthesized by calculating the arithmetic mean of the TFNs provided by all experts:
T F N ( C i ) = ( 1 5 e = 1 5 a e , 1 5 e = 1 5 b e , 1 5 e = 1 5 c e )
The integrated TFN of C i is mapped onto the membership functions of the five standard evaluation grades using the intersection rule. First, the initial belief degree d n is determined by calculating the intersection between the factor’s TFN and the triangular functions of each evaluation grade. Then, a normalization process is applied to obtain the normalized belief structures for the two evidence sources. As an example, we calculate the confidence transformation using TFN (C2), which is shown in Table A3.
Table A3. A sample calculation for TFN (C2) into normalized belief degree.
Importance of Market Perfection Degree (0.35, 0.60, 0.85)
GradeVLLMHVH
Belief Degree00.30.80.70.2
Normalized Belief Degree00.150.40.350.1
The importance and operability are expressed as e 1 and e 2 as the two evidences of ER, respectively. The belief degree of importance is S ( e 1 C i ) = { ( H n , β n , 1 C i ) } ,   n = 1 ,   ,   5 . The belief degree of operability is S ( e 2 C i ) = { ( H n , β n , 2 C i ) } ,   n = 1 ,   ,   5 , where β n , k C i = d n , k C i / n = 1 5 d n , k C i . For example, the importance of C2 is TFN (0.35, 0.6, 0.85), and operability is TFN (0, 0.1, 0.35). Transforming them into the degree of beliefs are S ( e 1 C 2 ) = { ( V L , 0 ) ( L , 0.15 ) , ( M , 0.4 ) , ( H , 0.35 ) , ( V H , 0.1 ) } and S ( e 2 C 2 ) = { ( V L , 0.442 ) ( L , 0.434 ) , ( M , 0.124 ) , ( H , 0 ) , ( V H , 0 ) } , respectively. Assuming the relative weights for importance and operability are λ 1 = λ 2 = 0.5 . The basic probability assignment (BPA) for importance or operability is represented a vector of six values:
m 1 C i = { m 1 , 1 C i ,   m 2 , 1 C i ,   m 3 , 1 C i , m 4 , 1 C i , m 5 , 1 C i ,   m H , 1 C i }
m 2 C i = { m 1 , 2 C i ,   m 2 , 2 C i ,   m 3 , 2 C i , m 4 , 2 C i , m 5 , 2 C i ,   m H , 2 C i }
where m n , k C i = λ k β n , k C i , and m H , k C i = m ¯ H , k C i + m ˜ H , k C i = ( 1 λ k ) + λ k ( 1 n = 1 5 β n , k C i ) . The first five values correspond to the probability masses assigned to each of the five specific evaluation grades. The final values are the remaining probability mass, which represents the belief that is unassigned to any specific grade due to uncertainty. A normalization factor K C i is introduced to handle the conflicts between the two sources of evidence for C i .
K C i = [ 1 t = 1 5 j = 1 , j t 5 m t , 1 C i m j , 2 C i ] 1
where t and j represent the indices of the evaluation grades H 1 to H 2 . Accordingly, the combined BPAs are calculated by integrating the specific grade mass and the remaining mass:
m n , I ( 2 ) C i = K C i [ m n , 1 C i m n , 2 C i + m H , 1 C i m n , 2 C i + m n , 1 C i m H , 2 C i ]
m ˜ H , I ( 2 ) C i = K C i [ m ˜ H , 1 C i m ˜ H , 2 C i + m ¯ H , 1 C i m ˜ H , 2 C i + m ˜ H , 1 C i m ¯ H , 2 C i ]
m ¯ H , I ( 2 ) C i = K C i ( m ¯ H , 1 C i m ¯ H , 2 C i )
By eliminating the remaining unassigned probability mass, the final normalized belief degree β n C i for factor C i at each evaluation grade is determined:
β n C i = m n , I ( 2 ) C i 1 m ¯ H , I ( 2 ) C i
Finally, the prioritized importance score for C i is computed using a linear utility function.
u ( C i ) n = 1 5 β n C i u ( H n )
where u ( H n ) = n 1 N 1 , n = 1 , 2 , , N .

References

  1. Li, J.S.; Zhou, H.W.; Meng, J.; Yang, Q.; Chen, B.; Zhang, Y.Y. Carbon emissions and their drivers for a typical urban economy from multiple perspectives: A case analysis for Beijing city. Appl. Energy 2018, 226, 1076–1086. [Google Scholar] [CrossRef]
  2. Liu, Q.; Shen, B.; Dong, C.; Yang, D. Who should lead the decarbonization transition? Leadership and shared responsibility in decarbonization supply chains. Int. J. Prod. Econ. 2026, 292, 109911. [Google Scholar] [CrossRef]
  3. Wang, J.; Zhang, B.; Zhu, Q.; Liu, J. Emission surcharge in the European Union Emissions Trading System: A competitive analysis for shipping companies. Transp. Res. Part E Logist. Transp. Rev. 2025, 202, 104338. [Google Scholar] [CrossRef]
  4. International Maritime Organization (IMO). Fourth IMO Greenhouse Gas Study 2020. Available online: https://www.imo.org/en/OurWork/Environment/Pages/Fourth-IMO-Greenhouse-Gas-Study-2020.aspx (accessed on 2 November 2025).
  5. Tadros, M.; Ventura, M.; Soares, C.G. Review of current regulations, available technologies, and future trends in the green shipping industry. Ocean Eng. 2023, 280, 114670. [Google Scholar] [CrossRef]
  6. Tian, X.; Shangguan, Y.; Pang, K.W.; Guo, Y.; Lyu, M.; Wang, S.; Huang, G.Q. Carbon emission allocation policy making in liner shipping: A novel approach toward equitable and efficient maritime sustainability. Ocean. Coast. Manag. 2024, 256, 107270. [Google Scholar] [CrossRef]
  7. Poseidon Principles. Available online: https://www.poseidonprinciples.org/ (accessed on 3 November 2025).
  8. Jafarian, A.; Neghabadi, P.D.; Asgari, N.; Farahani, R.Z. A sustainable maritime supply chain framework: An overview for academics and practitioners. Transp. Res. Part A Policy Pract. 2026, 205, 104863. [Google Scholar] [CrossRef]
  9. Molavi, A.; Lim, G.J.; Shi, J. Stimulating sustainable energy at maritime ports by hybrid economic incentives: A bilevel optimization approach. Appl. Energy 2020, 272, 115188. [Google Scholar] [CrossRef]
  10. Elsisi, M.; Amer, M.; Su, C.L.; Aljohani, T.; Ali, M.N.; Sharawy, M. A comprehensive review of machine learning and Internet of Things integrations for emission monitoring and resilient sustainable energy management of ships in port areas. Renew. Sustain. Energy Rev. 2025, 218, 115843. [Google Scholar] [CrossRef]
  11. Lai, X.; Tao, Y.; Wang, F.; Zou, Z. Sustainability investment in maritime supply chain with risk behavior and information sharing. Int. J. Prod. Econ. 2019, 218, 16–29. [Google Scholar] [CrossRef]
  12. Han, X.; Liu, X. A competitive supply chain model considering consumer green preference under demand uncertainty. Oper. Res. 2025, 25, 57. [Google Scholar] [CrossRef]
  13. Maersk. Inditex Partners with Maersk to Reduce Its Maritime Transport Emissions. Available online: https://www.maersk.com/news/articles/2023/10/16/inditex-partners-with-maersk-to-reduce-its-maritime-transport-emissions (accessed on 3 November 2025).
  14. Dong, C.; Shen, B.; Chow, P.S.; Yang, L.; Ng, C.T. Sustainability investment under cap-and-trade regulation. Ann. Oper. Res. 2016, 240, 509–531. [Google Scholar] [CrossRef]
  15. Bai, Q.; Xu, J.; Chauhan, S.S. Effects of sustainability investment and risk aversion on a two-stage supply chain coordination under a carbon tax policy. Comput. Ind. Eng. 2020, 142, 106324. [Google Scholar] [CrossRef]
  16. Xiong, Y.; Dai, L. Does green finance investment impact on sustainable development: Role of technological innovation and renewable energy. Renew. Energy 2023, 214, 342–349. [Google Scholar] [CrossRef]
  17. Ye, F.; Ouyang, Y.; Li, Y. Digital investment and environmental performance: The mediating roles of production efficiency and green innovation. Int. J. Prod. Econ. 2023, 259, 108822. [Google Scholar] [CrossRef]
  18. Hussain, F.; Zhou, Z. National climate change policy, environmental regulation, and media attention: Implications for sustainable investment. J. Clean. Prod. 2025, 521, 146235. [Google Scholar] [CrossRef]
  19. Prill, K.; Behrendt, C.; Szczepanek, M.; Michalska-Pożoga, I. A new method of determining energy efficiency operational indicator for specialized ships. Energies 2020, 13, 1082. [Google Scholar] [CrossRef]
  20. Lu, P.H.; Theocharis, D. The influence of energy efficiency and carbon indicators on ship prices: Early evidence from the tanker and bulk carrier sectors. Marit. Econ. Logist. 2025, 27, 549–566. [Google Scholar] [CrossRef]
  21. Peng, Y.; Li, X.; Wang, W.; Liu, K.; Li, C. A simulation-based research on carbon emission mitigation strategies for green container terminals. Ocean. Eng. 2018, 163, 288–298. [Google Scholar]
  22. Sim, J. A carbon emission evaluation model for a container terminal. J. Clean. Prod. 2018, 186, 526–533. [Google Scholar] [CrossRef]
  23. Yang, L.; Cai, Y.; Wei, Y.; Huang, S. Choice of technology for emission control in port areas: A supply chain perspective. J. Clean. Prod. 2019, 240, 118105. [Google Scholar] [CrossRef]
  24. Lam, J.S.L.; Li, K.X. Green port marketing for sustainable growth and development. Transp. Policy 2019, 84, 73–81. [Google Scholar] [CrossRef]
  25. Ventayol, A.A.; Lam, J.S.L.; Bai, X.; Chen, Z.S. Comparative life cycle assessment of hydrogen internal combustion engine and fuel cells in shipping. Int. J. Hydrogen Energy 2025, 109, 774–788. [Google Scholar] [CrossRef]
  26. Kim, D.; Rhee, S.H. Data-driven framework with theoretical modelling to evaluate fuel savings through air lubrication system. Ocean. Eng. 2025, 316, 119920. [Google Scholar] [CrossRef]
  27. Barone, G.; Buonomano, A.; Forzano, C.; Palombo, A.; Vicidomini, M. Sustainable energy design of cruise ships through dynamic simulations: Multi-objective optimization for waste heat recovery. Energy Convers. Manag. 2020, 221, 113166. [Google Scholar] [CrossRef]
  28. Zhao, Y.; Fan, Y.; Zhou, J.; Kuang, H. Bi-objective optimization of vessel speed and route for sustainable coastal shipping under the regulations of emission control areas. Sustainability 2019, 11, 6281. [Google Scholar] [CrossRef]
  29. Wang, H.; Dong, J.; Niu, B.; Xu, X. Could shipment consolidation jointly improve the economic and environmental sustainability of a maritime service supply chain? Int. J. Logist. Res. Appl. 2025, 28, 279–324. [Google Scholar] [CrossRef]
  30. Wang, H.; Hou, Y.; Xiong, Y. Research on multi-interval coupling optimization of vessel speed for energy efficiency. Ocean Eng. 2022, 257, 111559. [Google Scholar] [CrossRef]
  31. Lu, B.; Fan, L.; Wang, J.J.; Li, Y. Does the EU ETS promote shipping decarbonization? Green investment and sustainability strategies of shipping alliances. Transp. Res. Part A Policy Pract. 2025, 199, 104569. [Google Scholar] [CrossRef]
  32. Tvedt, J.; Wergeland, T. Tax regimes, investment subsidies and the green transformation of the maritime industry. Transp. Res. Part D Transp. Environ. 2023, 119, 103741. [Google Scholar] [CrossRef]
  33. Jia, H.; Jiang, L.; Azevedo, P. Green premium and the role of financial investors in sustainable investment in container shipping. Transp. Res. Part E Logist. Transp. Rev. 2024, 189, 103658. [Google Scholar] [CrossRef]
  34. Yuen, K.F.; Wang, X.; Wong, Y.D.; Zhou, Q. Antecedents and outcomes of sustainable shipping practices: The integration of stakeholder and behavioural theories. Transp. Res. Part E Logist. Transp. Rev. 2017, 108, 18–35. [Google Scholar] [CrossRef]
  35. Shang, T.; Wu, H.; Wang, K.; Yang, D.; Jiang, C.; Yang, H. Would the shipping alliance promote or discourage green shipping investment? Transp. Res. Part D Transp. Environ. 2024, 128, 104102. [Google Scholar] [CrossRef]
  36. Longarela-Ares, Á.; Calvo-Silvosa, A.; Pérez-López, J.B. Investment preference for either technical or operational energy efficiency measures to achieve sustainable maritime shipping. Environ. Dev. Sustain. 2024, 26, 30723–30747. [Google Scholar] [CrossRef]
  37. Garg, C.P.; Kashav, V.; Lam, J.S.L. Evaluation of value creating factors in green shipping corridors. Transp. Res. Part D Transp. Environ. 2025, 145, 104790. [Google Scholar] [CrossRef]
  38. Drewry. First EU ETS Shipping Payment Due 30 Sept. Available online: https://www.drewry.co.uk/maritime-research-opinion-browser/maritime-research-opinions/first-eu-ets-shipping-payment-due-30-sept (accessed on 3 November 2025).
  39. Liu, J.; Wang, J. Carrier alliance incentive analysis and coordination in a maritime transport chain based on service competition. Transp. Res. Part E Logist. Transp. Rev. 2019, 128, 333–355. [Google Scholar] [CrossRef]
  40. Wu, X.; Wang, K.; Fu, X.; Jiang, C.; Zheng, S. How would co-opetition with dry ports affect seaports’ adaptation to disasters? Transp. Res. Part D Transp. Environ. 2024, 130, 104194. [Google Scholar] [CrossRef]
  41. Xu, J.; Chen, Y.; Bai, Q. A two-echelon sustainable supply chain coordination under cap-and-trade regulation. J. Clean. Prod. 2016, 135, 42–56. [Google Scholar] [CrossRef]
  42. Wang, T.; Wu, Z.; Cheng, P.; Wang, Y. The effect of carbon quota allocation methods on maritime supply chain emission reduction. Transp. Policy 2024, 157, 155–166. [Google Scholar] [CrossRef]
  43. Metzger, D.; Schinas, O. Fuzzy real options and shared savings: Investment appraisal for green shipping technologies. Transp. Res. Part D Transp. Environ. 2019, 77, 1–10. [Google Scholar] [CrossRef]
  44. Liang, J.; Dou, Y.; Song, Y. A Tripartite Evolutionary Game Study on the Carbon Emission Reduction of Shipping Enterprises Considering Government and Shipper Behavior. Sustainability 2025, 17, 3895. [Google Scholar] [CrossRef]
  45. Hrovatin, N.; Dolšak, N.; Zorić, J. Factors impacting investments in energy efficiency and clean technologies: Empirical evidence from Slovenian manufacturing firms. J. Clean. Prod. 2016, 127, 475–486. [Google Scholar] [CrossRef]
  46. Al-Shaer, H.; Zaman, M. Credibility of sustainability reports: The contribution of audit committees. Bus. Strategy Environ. 2018, 27, 973–986. [Google Scholar] [CrossRef]
  47. Yun, W.; Hanson, N. Weathering consumer pricing sensitivity: The importance of customer contact and personalized services in the financial services industry. J. Retail. Consum. Serv. 2020, 55, 102085. [Google Scholar] [CrossRef]
  48. Yang, L.; Liao, F.; He, Y. Towards Decarbonization: Sustainable Incentives in a Price-Competitive Maritime Supply Chain with Environmentally-Conscious Shippers. Sustainability 2025, 17, 2030. [Google Scholar] [CrossRef]
  49. Zheng, W.; Li, B.; Song, D. The optimal green strategies for competitive ocean carriers under potential regulation. Eur. J. Oper. Res. 2022, 303, 840–856. [Google Scholar] [CrossRef]
  50. Yuen, K.F.; Thai, V.V.; Wong, Y.D. An investigation of shippers’ satisfaction and behaviour towards corporate social responsibility in maritime transport. Transp. Res. Part A Policy Pract. 2018, 116, 275–289. [Google Scholar] [CrossRef]
  51. Zhou, K.; Li, Y. Influencing factors and fluctuation characteristics of China’s carbon emission trading price. Phys. A Stat. Mech. Its Appl. 2019, 524, 459–474. [Google Scholar] [CrossRef]
  52. Zhu, B.; Ye, S.; Han, D.; Wang, P.; He, K.; Wei, Y.M.; Xie, R. A multiscale analysis for carbon price drivers. Energy Econ. 2019, 78, 202–216. [Google Scholar] [CrossRef]
  53. Batten, J.A.; Maddox, G.E.; Young, M.R. Does weather, or energy prices, affect carbon prices? Energy Econ. 2021, 96, 105016. [Google Scholar] [CrossRef]
  54. Niu, Y.; Yu, F.; Yao, H.; Yang, Y. Multi-equipment coordinated scheduling strategy of U-shaped automated container terminal considering energy consumption. Comput. Ind. Eng. 2022, 174, 108804. [Google Scholar] [CrossRef]
  55. Poulsen, R.T.; Viktorelius, M.; Varvne, H.; Rasmussen, H.B.; Von Knorring, H. Energy efficiency in ship operations-exploring voyage decisions and decision-makers. Transp. Res. Part D Transp. Environ. 2022, 102, 103120. [Google Scholar] [CrossRef]
  56. Kondratenko, A.A.; Zhang, M.; Tavakoli, S.; Altarriba, E.; Hirdaris, S. Existing technologies and scientific advancements to decarbonize shipping by retrofitting. Renew. Sustain. Energy Rev. 2025, 212, 115430. [Google Scholar] [CrossRef]
  57. Bouman, E.A.; Lindstad, E.; Rialland, A.I.; Strømman, A.H. State-of-the-art technologies, measures, and potential for reducing GHG emissions from shipping—A review. Transp. Res. Part D Transp. Environ. 2017, 52, 408–421. [Google Scholar] [CrossRef]
  58. Wang, Z.; He, S.; Zhang, B.; Wang, B. Optimizing cooperative carbon emission reduction among enterprises with non-equivalent relationships subject to carbon taxation. J. Clean. Prod. 2018, 172, 552–565. [Google Scholar] [CrossRef]
  59. Jin, J.; Meng, L.; Wang, X.; He, J. Carbon emission reduction strategy in shipping industry: A joint mechanism. Adv. Eng. Inform. 2024, 62, 102728. [Google Scholar] [CrossRef]
  60. Aflaki, S.; Kleindorfer, P.R.; deMiera Polvorinos, V.S. Finding and implementing energy efficiency projects in industrial facilities. Prod. Oper. Manag. 2013, 22, 503–517. [Google Scholar] [CrossRef]
  61. Zhou, Z.; Nie, L.; Ji, H.; Zeng, H.; Chen, X. Does a firm’s low-carbon awareness promote low-carbon behaviors? Empirical evidence from China. J. Clean. Prod. 2020, 244, 118903. [Google Scholar] [CrossRef]
  62. Koley, S.; Barua, M.K.; Bisi, A. Inhibitors in ridesharing firms from developing Nations: A novel Integrated MCDM–Text Mining approach using Large-Scale data. Transp. Res. Part E Logist. Transp. Rev. 2025, 193, 103832. [Google Scholar] [CrossRef]
  63. Liu, J.; Gu, B.; Chen, J. Enablers for maritime supply chain resilience during pandemic: An integrated MCDM approach. Transp. Res. Part A Policy Pract. 2023, 175, 103777. [Google Scholar] [CrossRef]
  64. Wan, C.; Yan, X.; Zhang, D.; Yang, Z. A novel policy making aid model for the development of LNG fuelled ships. Transp. Res. Part A Policy Pract. 2019, 119, 29–44. [Google Scholar] [CrossRef]
  65. Chen, S.M. Aggregating fuzzy opinions in the group decision-making environment. Cybern. Syst. 1998, 29, 363–376. [Google Scholar] [CrossRef]
  66. Lyu, H.M.; Sun, W.J.; Shen, S.L.; Zhou, A.N. Risk assessment using a new consulting process in fuzzy AHP. J. Constr. Eng. Manag. 2020, 146, 04019112. [Google Scholar] [CrossRef]
  67. Trimmer, P.C.; Houston, A.I.; Marshall, J.A.; Mendl, M.T.; Paul, E.S.; McNamara, J.M. Decision-making under uncertainty: Biases and Bayesians. Anim. Cogn. 2011, 14, 465–476. [Google Scholar] [CrossRef] [PubMed]
  68. Wang, T.; Cheng, P.; Zhen, L. Green development of the maritime industry: Overview, perspectives, and future research opportunities. Transp. Res. Part E Logist. Transp. Rev. 2023, 179, 103322. [Google Scholar] [CrossRef]
  69. Chua, J.Y.; Wang, X.; Yuen, K.F. Sustainable shipping management: Definitions, critical success factors, drivers and performance. Transp. Policy 2023, 141, 72–82. [Google Scholar] [CrossRef]
  70. Clarkson, P.L.C. 2024 Annual Report. 2024. Available online: https://www.clarksons.com/media/iabfo121/clarkson_plc_annual_report_2024.pdf?utm_source=chatgpt.com (accessed on 3 November 2025).
  71. Chițimiea, A.; Minciu, M.; Manta, A.M.; Ciocoiu, C.N.; Veith, C. The drivers of green investment: A bibliometric and systematic review. Sustainability 2021, 13, 3507. [Google Scholar] [CrossRef]
Figure 1. Research framework of influencing factors of low-carbon investment.
Mathematics 14 01678 g001
Figure 2. Evolution game situation of sustainable investment.
Mathematics 14 01678 g002
Figure 3. Dynamic evolution diagram of sustainable investment in shipping supply chain.
Mathematics 14 01678 g003
Figure 4. Decision-making environment of sustainable investment.
Mathematics 14 01678 g004
Figure 5. TFN transformation into belief degree (C2).
Mathematics 14 01678 g005
Figure 6. RI of the of influencing factors of low-carbon investment.
Mathematics 14 01678 g006
Figure 7. Distribution diagram of influencing factors.
Mathematics 14 01678 g007
Figure 8. Sensitivity analysis of factors.
Mathematics 14 01678 g008
Figure 9. Average importance of influencing factors.
Mathematics 14 01678 g009
Figure 10. Impact of various factors on low-carbon investment probability.
Mathematics 14 01678 g010
Table 1. Comparisons among our paper and other major studies.
LiteratureInvestment EfficiencyConsumer SensitivityCarbon Trading PriceEmission Reduction IndexCost Share RatioModeling StudiesEmpirical Studies
[14]×
[18]××××
[29]××
[32]××
[33]××××
[34]×××
[35]×
[36]×××
[37]×××
Our Paper
Table 2. Notations.
Table 2. Notations.
NotationDescription
wPort service fee, assuming that the marginal cost of the service is zero (CNY/TEU)
mUnit marginal profit (CNY/TEU)
QThe actual market demand (TEU)
aThe potential market demand (TEU)
β Shipper sensitivity to price
α Shipper sensitivity to sustainable development
θ Sustainable technical level
γ Investment cost coefficient
ϕ Share ratio of shipping enterprise
KCarbon emission cap (tonCO2e)
ctTrade price of carbon emission permits (CNY/tonCO2e)
qInitial carbon emissions per unit of cargo (tonCO2e/TEU)
bLow-carbon coefficient effect on reducing emission
π p The profits of port (CNY)
π c The profits of shipping enterprise (CNY)
Table 3. The profit in four different investment strategies.
Shipping Enterprise\PortInvestmentNo Investment
Investment π c Y Y = m Q γ θ 2 ϕ / 2
π p Y Y = w Q ( ( q b θ ) Q K ) c t γ θ 2 ( 1 ϕ ) / 2
π c N Y = m Q γ θ 2 / 2
π p N Y = w Q ( ( q b θ ) Q K ) c t
No investment π c Y N = m Q
π p Y N = w Q ( ( q b θ ) Q K ) c t γ θ 2 / 2
π c N N = m Q
π p N N = w Q ( q Q K ) c t
Table 4. Sustainable investment income matrix of shipping supply chain.
Shipping Enterprise/Port Investment   ( x ) No   Investment   ( 1 x )
Investment ( y ) π c Y Y * , π p Y Y * π c N Y * , π p N Y *
No investment ( 1 y ) π c Y N * , π p Y N * π c N N * , π p N N *
Table 5. EE stability analysis.
Case 1Case 2Case 3
EEdetJtrJLocal StabilitydetJtrJLocal StabilitydetJtrJLocal Stability
( 0 , 0 ) ++Unsteady++Unsteady++Unsteady
( 1 , 0 ) Unsteady+ESS+ESS
( 0 , 1 ) +-ESS+ESSUnsteady
( 1 , 1 ) Unsteady++Unsteady Unsteady
x s , y s -0Saddle point+0Saddle point0Saddle point
Table 6. Strategic direction and measures affecting low-carbon investment.
Direct FactorsSub-FactorsReferences
Investment efficiencyGovernment intervention (C1)[44]
Market perfection degree (C2)[45]
Enterprise governance level (C3)[46]
Consumer sensitivityProduct factors (C4)[47,48]
Marketing strategy (C5)[47,49]
Customer Satisfaction (C6)[47,50]
Carbon priceMacroeconomic environment (C7)[51,52]
Related energy prices (C8)[51,53]
Environmental factors (C9)[52,53]
Emission reduction indexTechnology (C10)[15]
Operational measures (C11)[54,55,56]
Energy types (C12)[56,57]
Cost share ratioResource (C13)[58,59]
Corporate scale (C14)[35,60]
Investment inclination (C15)[33,61]
Table 7. Affiliations and qualifications of the experts.
No.AffiliationTypeEducationEmployment (Years)
A1Dalian Maritime UniversalityScholarPhD20
2University of SouthamptonScholarPhD17
3China COSCO Shipping GroupPractitionerMaster15
4Shanghai International Port GroupPractitionerMaster10
5Liaoning Maritime Bureau of the People’s Republic of ChinaDirectorMaster11
B1Dalian Maritime UniversalityScholarPhD10
2China COSCO Shipping GroupPractitionerMaster10
3Liaoning Port GroupPractitionerMaster10
4Shanghai university ScholarPhD20
5Liaoning Maritime Bureau of the People’s Republic of ChinaDirectorMaster8
Table 8. Conversion of linguistic variables to TFN.
Linguistic Terms of RelationLinguistic Terms of ImportanceTriangular Fuzzy Numbers
No influence (No)Lowest (VL)(0, 0, 0.25)
Very low influence (VL)Low (L)(0, 0.25, 0.5)
Low influence (L)Medium (M)(0.25, 0.5, 0.75)
High influence (H)High (H)(0.5, 0.75, 1)
Very high influence (VH)Highest (VH)(0.75, 1, 1)
Table 9. Conversion of linguistic variables to TFN.
FactorsImportanceOperability
1234512345
C1HVHHHVHVLVLVLLVL
C2MHMMHVLLLVLVL
C3HHMVHMHVHVHHVH
C4VHVHHVHHVHHVHVHVH
C5MHMVHHLLVLVLL
C6HHMHHMMHMH
C7HMMMHVLVLVLVLL
C8MHHHMVLLVLVLVL
C9VLLLLLVLVLLVLVL
C10VHVHVHHVHVHHVHVHH
C11MMMLLVHVHVHHH
C12HMVHMHVHHHVHVH
C13HVHHHHHVHVHVHH
C14MMHHHHMMMH
C15HVHHHHVHVHVHVHH
Table 10. Priori importance of all influence factors.
GradeVLLMHVHUtility
C10.2700.1950.1250.2310.1800.464
C20.2090.3070.2710.1660.0470.384
C30.0000.0220.2050.4740.2990.762
C40.0000.0000.0820.4110.5070.856
C50.1740.2600.2600.2230.0830.445
C60.0000.0900.3560.4150.1390.651
C70.2610.2880.2360.1680.0480.364
C80.2640.2570.2120.1940.0730.389
C90.4250.4510.1250.0000.0000.175
C100.0000.0000.0820.4110.5070.856
C110.0470.1660.2710.3070.2090.616
C120.0000.0220.2050.4740.2990.762
C130.0000.0000.1550.4760.3690.804
C140.0000.1150.3850.3850.1150.625
C150.0000.0000.1250.4500.4250.825
Table 11. Modified probability obtained by DEMATEL.
FactorsDCMR
C1(0.102, 0.155, 0.237)(0.080, 0.118, 0.219)(0.183, 0.272, 0.456)(0.022, 0.037, 0.018)
C2(0.067, 0.114, 0.192)(0.084, 0.132, 0.208)(0.151, 0.246, 0.399)(−0.018, −0.018, −0.016)
C3(0.092, 0.142, 0.228)(0.089, 0.141, 0.232)(0.181, 0.283, 0.460)(0.003, 0.001, −0.003)
C4(0.107, 0.164, 0.253)(0.168, 0.227, 0.307)(0.275, 0.391, 0.561)(−0.060, −0.063, −0.054)
C5(0.094, 0.135, 0.193)(0.087, 0.127, 0.189)(0.181, 0.262, 0.382)(0.007, 0.008, 0.003)
C6(0.094, 0.135, 0.196)(0.102, 0.146, 0.216)(0.196, 0.281, 0.412)(−0.007, −0.011, −0.020)
C7(0.144, 0.203, 0.308)(0.128, 0.189, 0.282)(0.272, 0.391, 0.591)(0.016, 0.014, 0.026)
C8(0.141, 0.163, 0.201)(0.130, 0.155, 0.183)(0.272, 0.318, 0.385)(0.011, 0.008, 0.018)
C9(0.162, 0.215, 0.311)(0.178, 0.237, 0.330)(0.340, 0.452, 0.642)(−0.015, −0.022, −0.019)
C10(0.194, 0.251, 0.327)(0.230, 0.284, 0.354)(0.424, 0.535, 0.681)(−0.035, −0.033, −0.027)
C11(0.117, 0.179, 0.274)(0.106, 0.167, 0.257)(0.222, 0.346, 0.531)(0.011, 0.012, 0.017)
C12(0.088, 0.119, 0.159)(0.070, 0.100, 0.141)(0.158, 0.219, 0.300)(0.018, 0.019, 0.018)
C13(0.101, 0.157, 0.254)(0.090, 0.143, 0.227)(0.191, 0.299, 0.481)(0.011, 0.014, 0.027)
C14(0.213, 0.265, 0.332)(0.156, 0.123, 0.300)(0.369, 0.478, 0.633)(0.056, 0.052, 0.032)
C15(0.072, 0.118, 0.192)(0.091, 0.137, 0.212)(0.163, 0.254, 0.404)(−0.019, −0.019, −0.020)
Table 12. Consistency between expert evaluation and sensitivity analysis.
Core FactorExpert ImportanceNormalized SensitivityConsistency
Cost share ratio ( ϕ )0.6341.294High
Emission reduction index (b)0.6170.731High
Consumer sensitivity ( α , β )0.4960.028, 0.020Moderate
Investment efficiency ( 1 / γ )0.3630.159High
Carbon price (ct)0.2370.509Moderate
Table 13. Regression analysis of carbon price.
Influence FactorsWeight
Macroeconomic environment (C7)0.31
Related energy prices (C8)0.41
Environmental factors (weather/air quality) (C9)0.28
Disclaimer/Publisher’s Note: The statements, opinions and data contained in all publications are solely those of the individual author(s) and contributor(s) and not of MDPI and/or the editor(s). MDPI and/or the editor(s) disclaim responsibility for any injury to people or property resulting from any ideas, methods, instructions or products referred to in the content.