1. Introduction
Full factorial designs are characterized by a high number of runs, which means more expensive experiments; as an alternative, there are fractional factorial designs. These designs enable the investigation of the effects of many factors using fewer runs. When many factors are involved, researchers usually opt for experimenting with resolution IV fractions, which permit the estimation of main effects (
MEs) but have the disadvantage that two-factor interactions (
2FIs) are confounded by each other. Since the success of an experiment depends on the inclusion of important factors, being able to examine as many factors as possible without requiring additional runs is quite useful [
1,
2].
The use of fractional factorial designs often leads to confounding, which means that some effects cannot be estimated independently. Additionally, in this, some MEs or interactions may be confounded by each other, making it difficult to determine which factors are responsible for the observed changes in the response.
In resolution III designs,
MEs are confounded with
2FIs, complicating interpretation and modeling [
3,
4]. To address this, a foldover fraction replicating the original experiment with reversed factor levels can disentangle these confounded effects. This method enhances design resolution by combining the original and folded designs, thereby clarifying ambiguities. For resolution IV designs, Lawson (2014) remarks that simply mirroring the design fails to resolve confounded interactions; instead, strategically reversing one or two factor’s signs in a foldover fraction breaks these aliases [
3]. Montgomery (2012) mentions that foldover creates two experimental blocks, with effect signs
confounded across blocks, identifiable via generator adjustments [
2].
Practical implementation of foldover techniques varies by design; for instance [
5,
6,
7], reversing one factor’s column in
or
designs suffices to separate its interactions, whereas
may require multiple reversals. The foldover techniques offer a robust pathway to deconfound effects, with strategic factor reversals optimizing both the resolution and precision. Even though for [
8], there are available foldover plans for different resolution IV designs, there are no specific patterns to construct foldovers for designs with 17 factors or greater.
This paper proposes increasing the tables of recommended foldovers for designs of
proposed in [
8,
9] for a set of resolution IV fractions with 17 to 21 factors. These designs have been named as the optimal foldover plans and maximize the decoupling of
2FIs interactions; in addition, they require the minimum number of columns to be inverted.
The methodology applied is based in computational programming and an exhaustive search. All possible foldover plans were investigated and evaluated; foldover plans were obtained for the following fractions: , , .
In the following section, we present a literature review, highlighting concepts such as augmentation by foldover, foldover methods, and confounding in
and
designs.
Section 3 presents the methodology,
Section 4 presents the results,
Section 5 presents a practical application,
Section 6 introduces the discussion, and finally,
Section 7 presents the conclusions.
2. Related Literature
2.1. Augmenting by Foldover
When using fractional factorial designs, loss of information is unavoidable, creating confusion. The resolution of an experimental design relates to the ability to separate individual effects in the analysis. A higher resolution (IV or V) indicates that you can distinguish the
MEs more easily and with greater confidence. In a resolution III fractional factorial design, the
MEs are confounded with some
2FIs; if more than one effect appears to be significant after the analysis of data from a resolution III design, it is not clear whether all effects are due to
MEs or whether some could be related to
2FIs [
3]. One way to break the confounding between
MEs and
2FIs is to run an additional set of experiments that is the same as the first, except that some (or all) column factors are reversed [
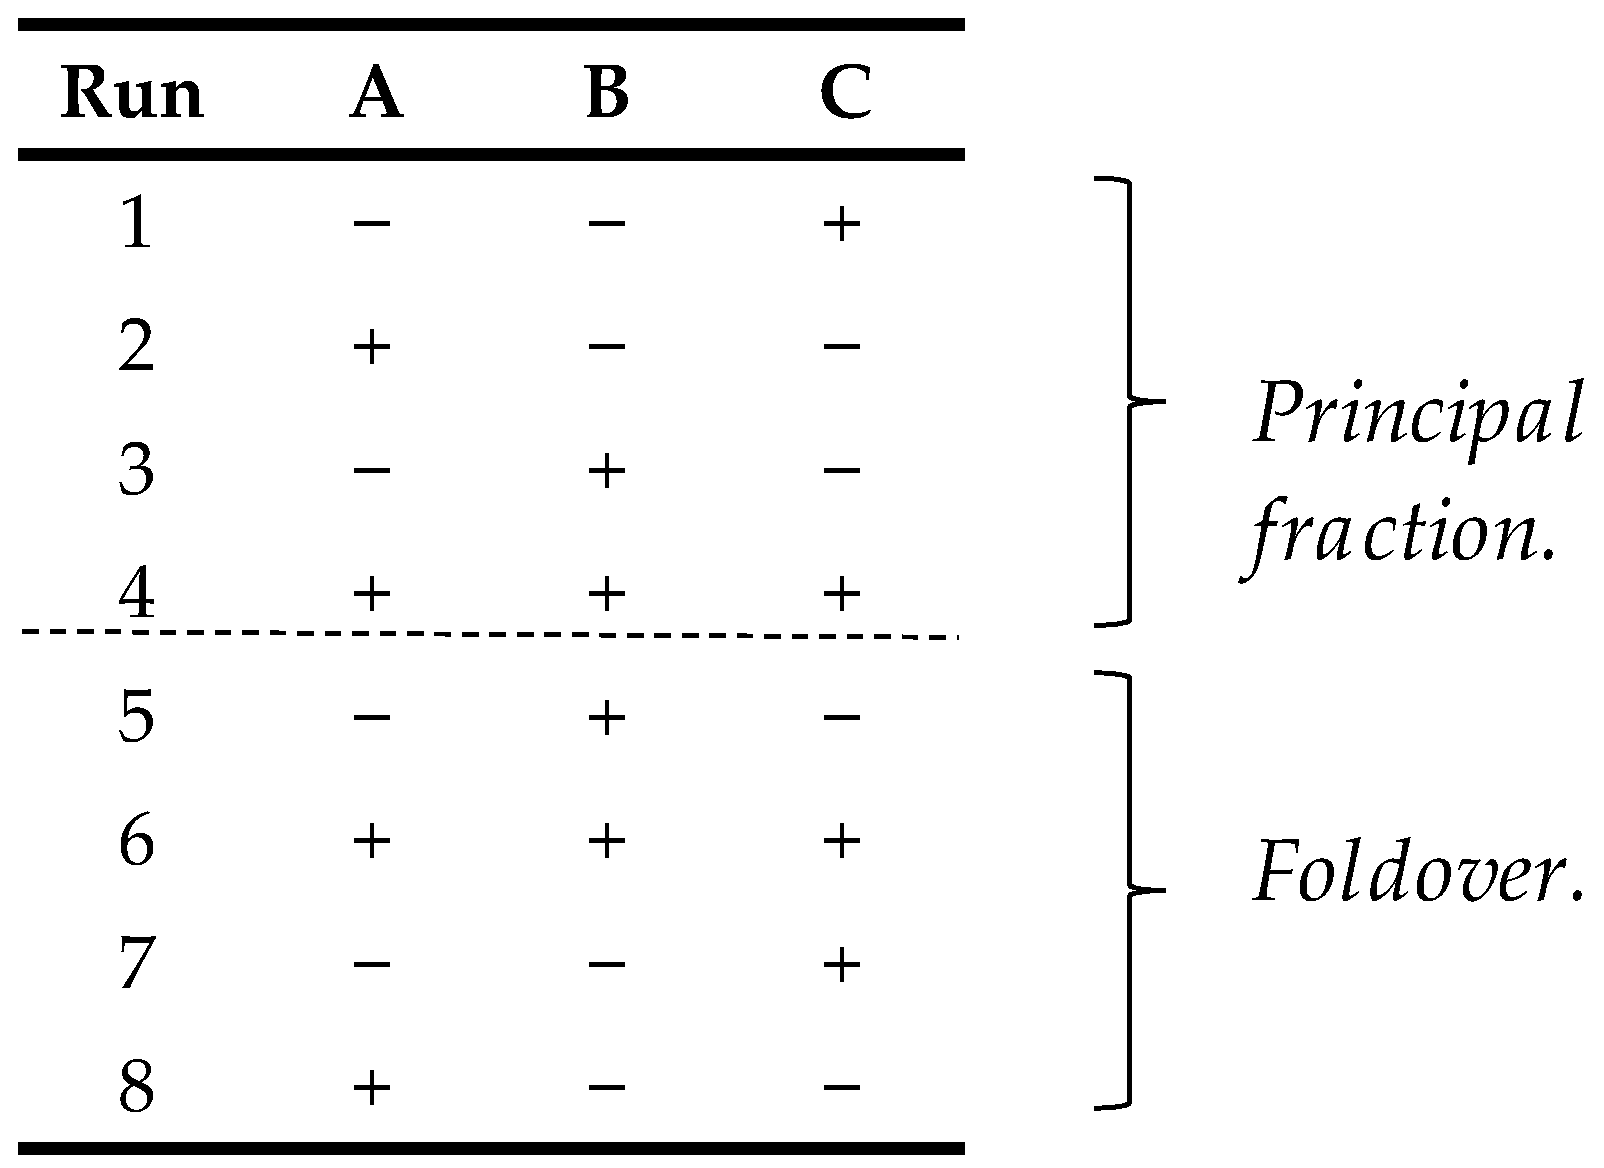
4]. This is called an augmented design, shown in
Figure 1 for a
design.
Since a foldover design requires twice as many runs as the initial design, a semifoldover may be a more cost-effective follow-up procedure; we use the term “semifolding” to describe using half of a foldover design. Mee and Peralta (2000) address the possibilities for following a two-level fractional factorial with another fractional factorial half the size of the original experiment; in many situations, a smaller follow-up experiment will suffice [
10].
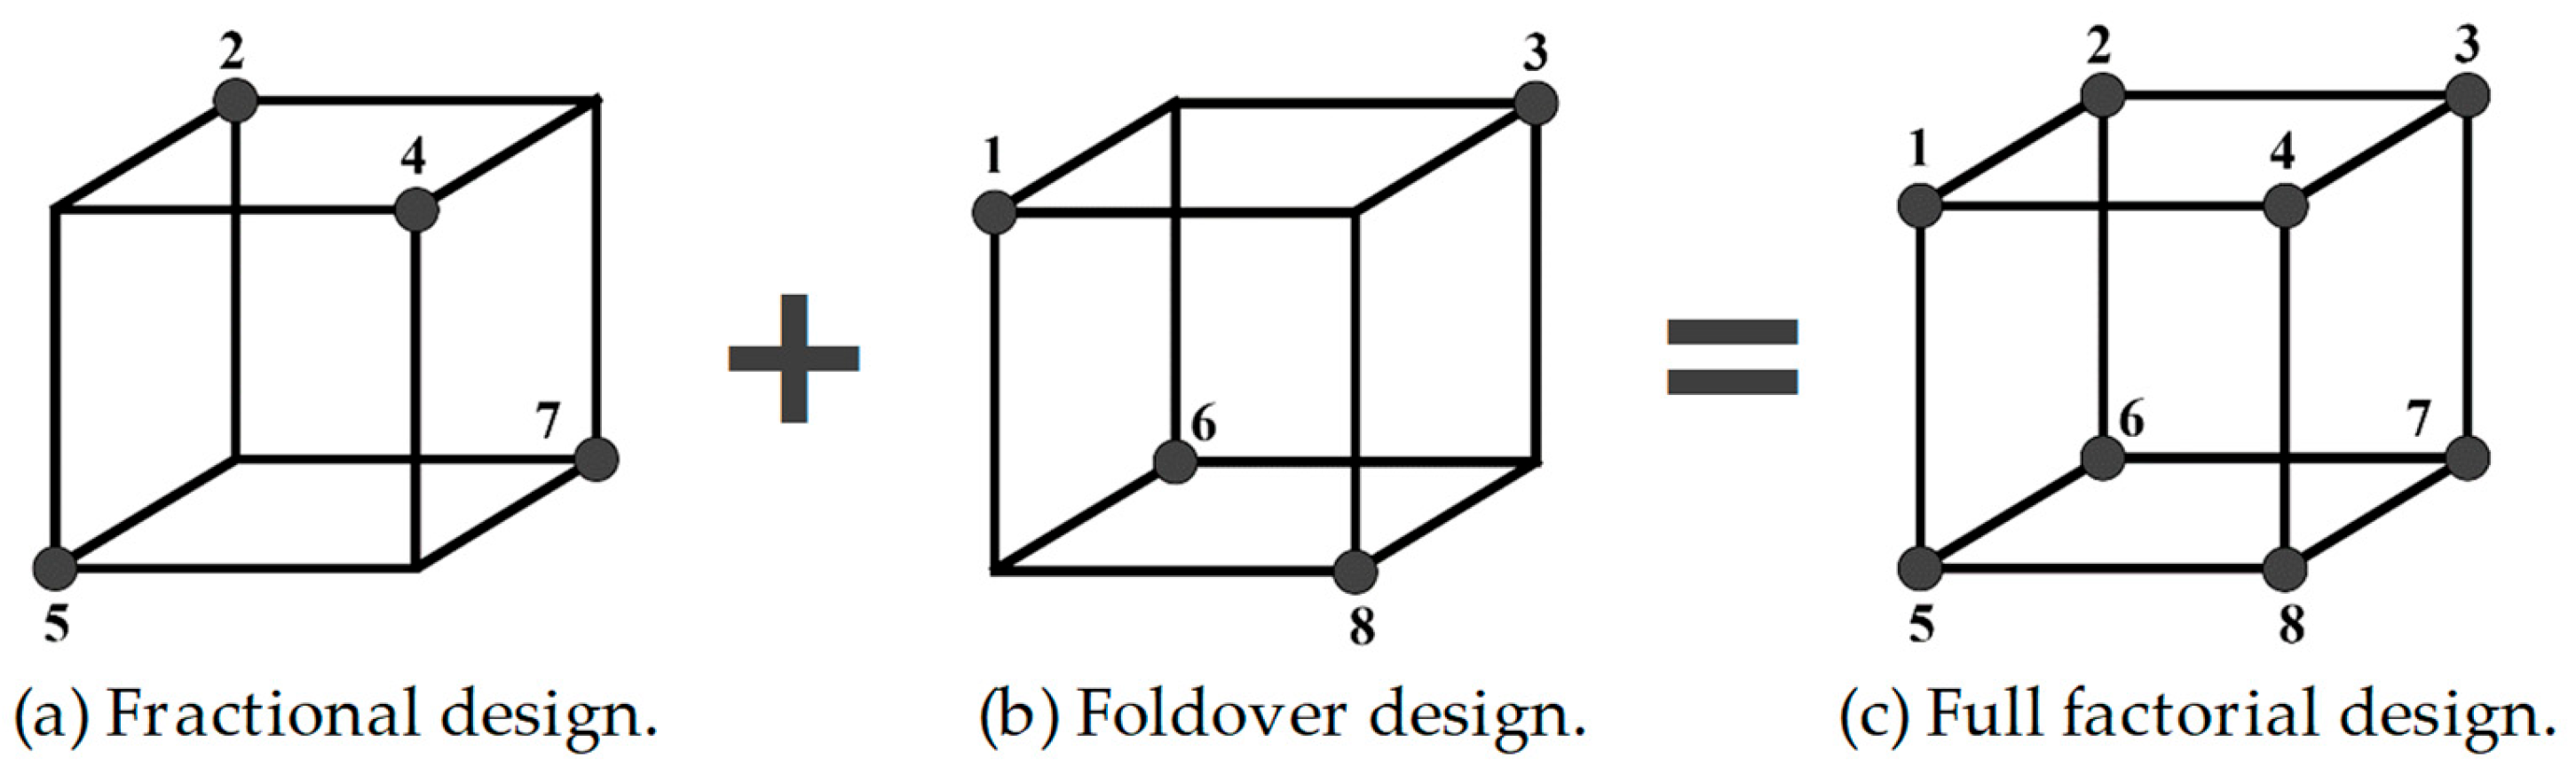
To foldover a design means to add a new fraction identical to the original fraction, except that the signs for some (resolution IV) or all (resolution III) factors are reversed. The new fraction is called a foldover design. As we can see in
Figure 2, combining a foldover design with the original fraction converts an odd-resolution design
r into an
resolution design.
For any even resolution IV design, there are at most (
) degrees of freedom for
2FIs [
11]. Augmenting a resolution IV design with a foldover in which all columns are reversed will not help to break strings of confounded
2FIs. However, reversing only one or two columns can help to separate
2FIs from each other [
3].
For the and the resolution IV designs, every possible foldover fraction is obtained by reversing the signs of a single MEs column. For the and any design where , some foldover fractions are obtained only by reversing the signs of two or more columns. If the signs of the column for a single factor are reversed, all 2FIs involving that factor are separated from their confounded 2FIs strings.
In resolution IV designs with many sets of confounded
2FIs of size 4 or more, a larger number of length-4 words eliminated by foldovers is obtained by reversing column signs for more than one factor [
5,
6,
7].
Once the foldover fraction is determined, a judiciously chosen subset of
runs will suffice. All
runs of the foldover fraction should be performed only if the standard errors after the initial
experiment were deemed unsatisfactorily large [
12].
For uniform designs, if one semifolds by subsetting on an
MEs, the semifold fraction permits the estimation of as many
2FIs as could be estimated if the entire foldover were to be run. The gain in completing the entire foldover rather than the semifold is in the added precision. After foldover, the standard errors are
, while after a semifold, the standard errors for
2FIs can be as large as
[
1,
5,
13]. When only a few effects are found to be significant after an analysis of data from a resolution IV design, a foldover plan is needed that can separate the significant
MEs from
2FIs [
9].
2.2. Foldover Methods
Research was conducted on foldover methods for two-level designs, and the identified papers are presented in chronological order.
In 2002, Li and Mee focused on optimizing better foldover methods to enhance the utility of resolution III fractional factorial designs
; their work provides a cost-effective design augmentation in resolution III experiments by focusing on fractional foldovers, and experimenters can achieve significant alias resolution with minimal additional runs [
14].
In 2003, Li and Lin obtained optimal foldover plans for 16 and 32 runs and tabulated the results for practical use [
6]. They showed that any foldover plan of a
fractional factorial design is equivalent to a core foldover plan consisting only of
out of
factors. Furthermore, they proved that there are exactly
foldover plans that are equivalent to any core foldover plan of a
design and demonstrated how these foldover plans can be constructed. They proposed a new class of designs called combined-optimal designs, consisting of the initial design and its optimal foldover, and demonstrated that these designs have the minimum aberration among all
designs. Li et al. showed the optimal foldover plans for two-level non-regular orthogonal designs. They provided plans for reversing the signs of all factors, and these plans are optimal for all orthogonal designs of 12 and 20 runs [
15]. Fang et al. presented a theoretical justification for optimal foldover plans, based on the criterion of uniformity, considering two-level fractional factorial designs [
16].
In 2005, Miller and Sitter showed the advantages of using non-orthogonal resolution IV designs for running small screening experiments when the primary goal is the identification of important
MEs with a secondary goal of entertaining a small number of potentially important second-order interactions [
17]. They evaluated the structure and performance of designs obtained by folding over small, efficient, non-orthogonal resolution III designs and comparing them with more commonly used orthogonal resolution III designs of comparable size, such as fractional factorials and Plackett–Burman designs [
17].
In 2007, F. Li and Jacroux, proposed the use of the foldover technique as applied to blocked regular fractional factorial designs [
18]. Two criteria were suggested, a minimum aberration criterion and a maximal rank-minimum aberration criterion, as applied to combined designs, which can be obtained by using different foldovers of the initial design. Using these criteria and search methods, optimal foldover plans were obtained for several blocked fractional factorial plans [
18].
During 2008, Mee and Xiao proposed systematic methods to optimize foldovers and semifolding for an improved estimation of effects [
5]. They emphasized the importance of adding a follow-up fraction to resolve aliasing in resolution IV designs. They extended this by identifying optimal foldover plans that minimize the aberration criterion, ensuring minimal confounding of lower-order effects, focused on resolution IV designs [
5]. Both McLeod and Brewster considered the construction of optimal foldover plans for split-plot designs and pointed out that the criterion of least aberration has been used for foldovers of
fractional factorial designs [
19].
In 2009, Guo et al. developed a mechanism to foldover designs involving factors with different numbers of levels, say mixed-level designs [
20]. Through an exhaustive search, they identified the optimal foldover plans. The criterion used was the general balance metric, which can reveal the aberration properties of the combined designs (original design plus foldover) [
20].
Weng et al. (2021) [
21] introduced a machine learning-driven approach to optimize foldover techniques in experimental design. The methodology bridges statistical design principles with optimization algorithms, enhancing the selection of foldover fractions to resolve aliasing, improve orthogonality, and reduce experimental costs.
Additionally, some articles were also found that approach foldover techniques for designs with three or more levels. In 2008, Ai et al. published “optimal foldover plans for regular s-level factorial design” [
22]. In 2016, Galindo et al. applied a methodology and developed an algorithm to construct efficient foldover plans for resolution IV fractional factorial designs for experiments involving 11–16 factors [
8]. This technique minimizes the
MEs that are confounded with
2FIs, a key requirement for screening experiments in high-dimensional settings. They provided a list of recommended foldover plans with the minimum aberration criteria for large resolution IV designs. The traditional foldover designs were built by reversing the signs of selected columns in an initial design to resolve ambiguities in effect estimation, particularly for confounded interactions [
8].
In 2008, Ai et al. [
22] published “optimal foldover plans for regular s-level factorial design”, a general structure of the breakdown of the foldover plan. The results published were applied to fractional factorial designs of the general regular
s level, where
s is any major level; the relationships between an initial design and its combined designs were explored. This was achieved with and without the blocking factor. The paper shows the foldover plans found for three-level designs with 27 runs [
22]. In 2016, Li and Lin proposed a new methodology by allowing the permutation of columns in foldover. Focused on resolution IV designs, they showed that almost all designs are better than existing results with respect to the minimum aberration criterion [
23]. They augmented a design by a foldover with column permutations, resulting in a nonregular combined design. All proposed designs have a solution for which no
2FI is fully confounded with any other
2FIs [
23]. In 2021, Ou and Li introduced an innovative approach to construct and optimize foldover plans for three-level fractional factorial designs [
24]. This method allows for a broader exploration of the foldover space by permuting the levels of individual factors, by redefining foldover strategies through level permutations and rigorous discrepancy analysis, offering a robust framework for optimizing three-level designs. Their results are particularly valuable for researchers requiring high-resolution fractional factorial experiments in situations of resource scarcity [
24].
In 2011, Ríos et al. aimed for a sequential experimentation approach capable of overcoming the drawbacks of the general methods while maintaining some of their benefits [
25]. They developed an algorithm for sequential augmentation of fractional factorial designs of resolution III [
25]. In 2018, Ríos et al. applied the R3 algorithm as an augmentation tool for Taguchi experiments, concluding that Taguchi designs augmented with the R3 algorithm are capable of estimating control x control interactions, possess similar values for performance indicators when compared with other techniques, and in most cases, require fewer runs [
26]. Ríos et al.’s (2021) research proposes a sequential experimentation method to separate
2FIs from blocks and assign contributing percentages to each blocked noise factor [
27]. The method is evaluated and compared to foldover, semifold, and
-optimal augmentation [
27].
2.3. Confounding in and Designs
Montgomery et al. (2010) mention that confusion is a design technique by which a complete factorial experiment is distributed in blocks, where the size of the block is less than the number of combinations of the treatments of a replicate [
28]. This technique makes information about certain effects of treatments, usually higher-order interactions, indistinguishable from blocks or confused with blocks. Even though the designs are incomplete block designs, since each block does not contain all the treatments or combinations of treatments, the special structure of the
factorial system allows for a simplified method of analysis [
28]. In Montgomery’s (2012) study, the construction and analysis of the
factorial design in
incomplete blocks is considered, where
. Therefore, these designs can be run in two blocks
, in four blocks
, in eight blocks
, and so on [
2].
In general, Lawson (2014) mentions that a completed foldover experiment will always form two blocks with effects whose signs are positive in one block and negative in the other, confounded with blocks [
3]. These effects can always be determined from the generators, whose signs have been switched to form the foldover [
2]. Ríos et al. (2021) designed a method to separate interaction effects from block effects, which arise when researchers partition experiments into homogeneous groups (blocks) to control for noising variables, and they propose a sequential methodology to resolve confounding between these effects, enhancing the interpretability without requiring large initial designs [
27]. This method offers a strategy to separate interaction effects from block effects [
28].
2.4. Correlation Matrix
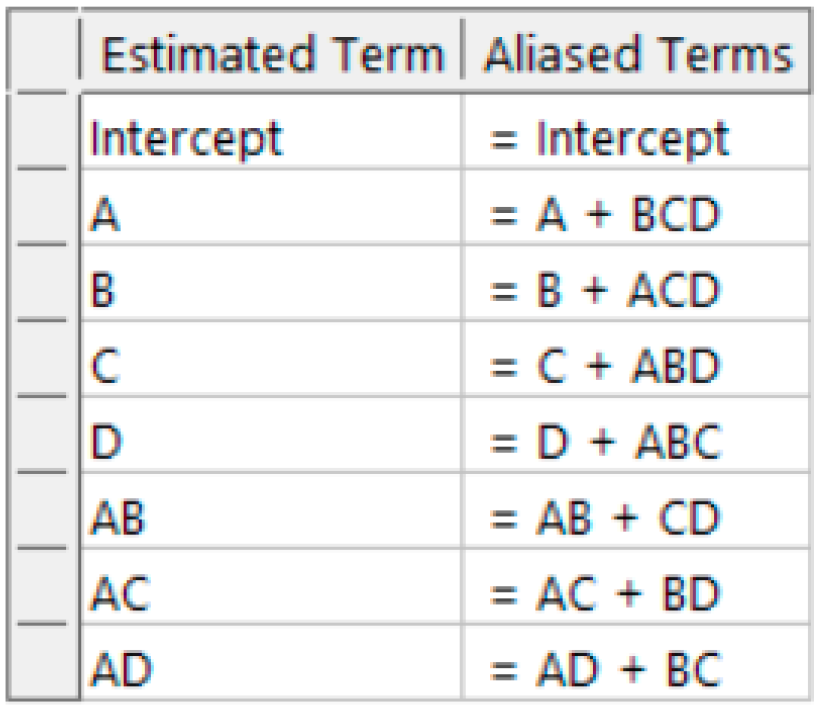
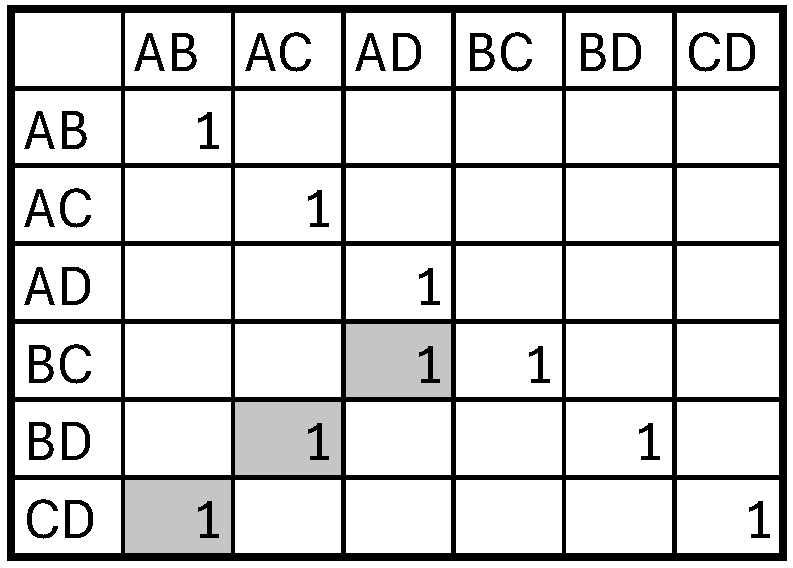
The concept of a correlation matrix is introduced in this investigation. A correlation is a tool that describes the existing correlations in an experimental design. Consider, for example,
; the alias structure for this design is shown in
Figure 3 and the corresponding correlation matrix in
Figure 4. Note that 1 indicates a correlation and 0 indicates orthogonality. Therefore, there are three existing correlations in this design.
3. Methodology
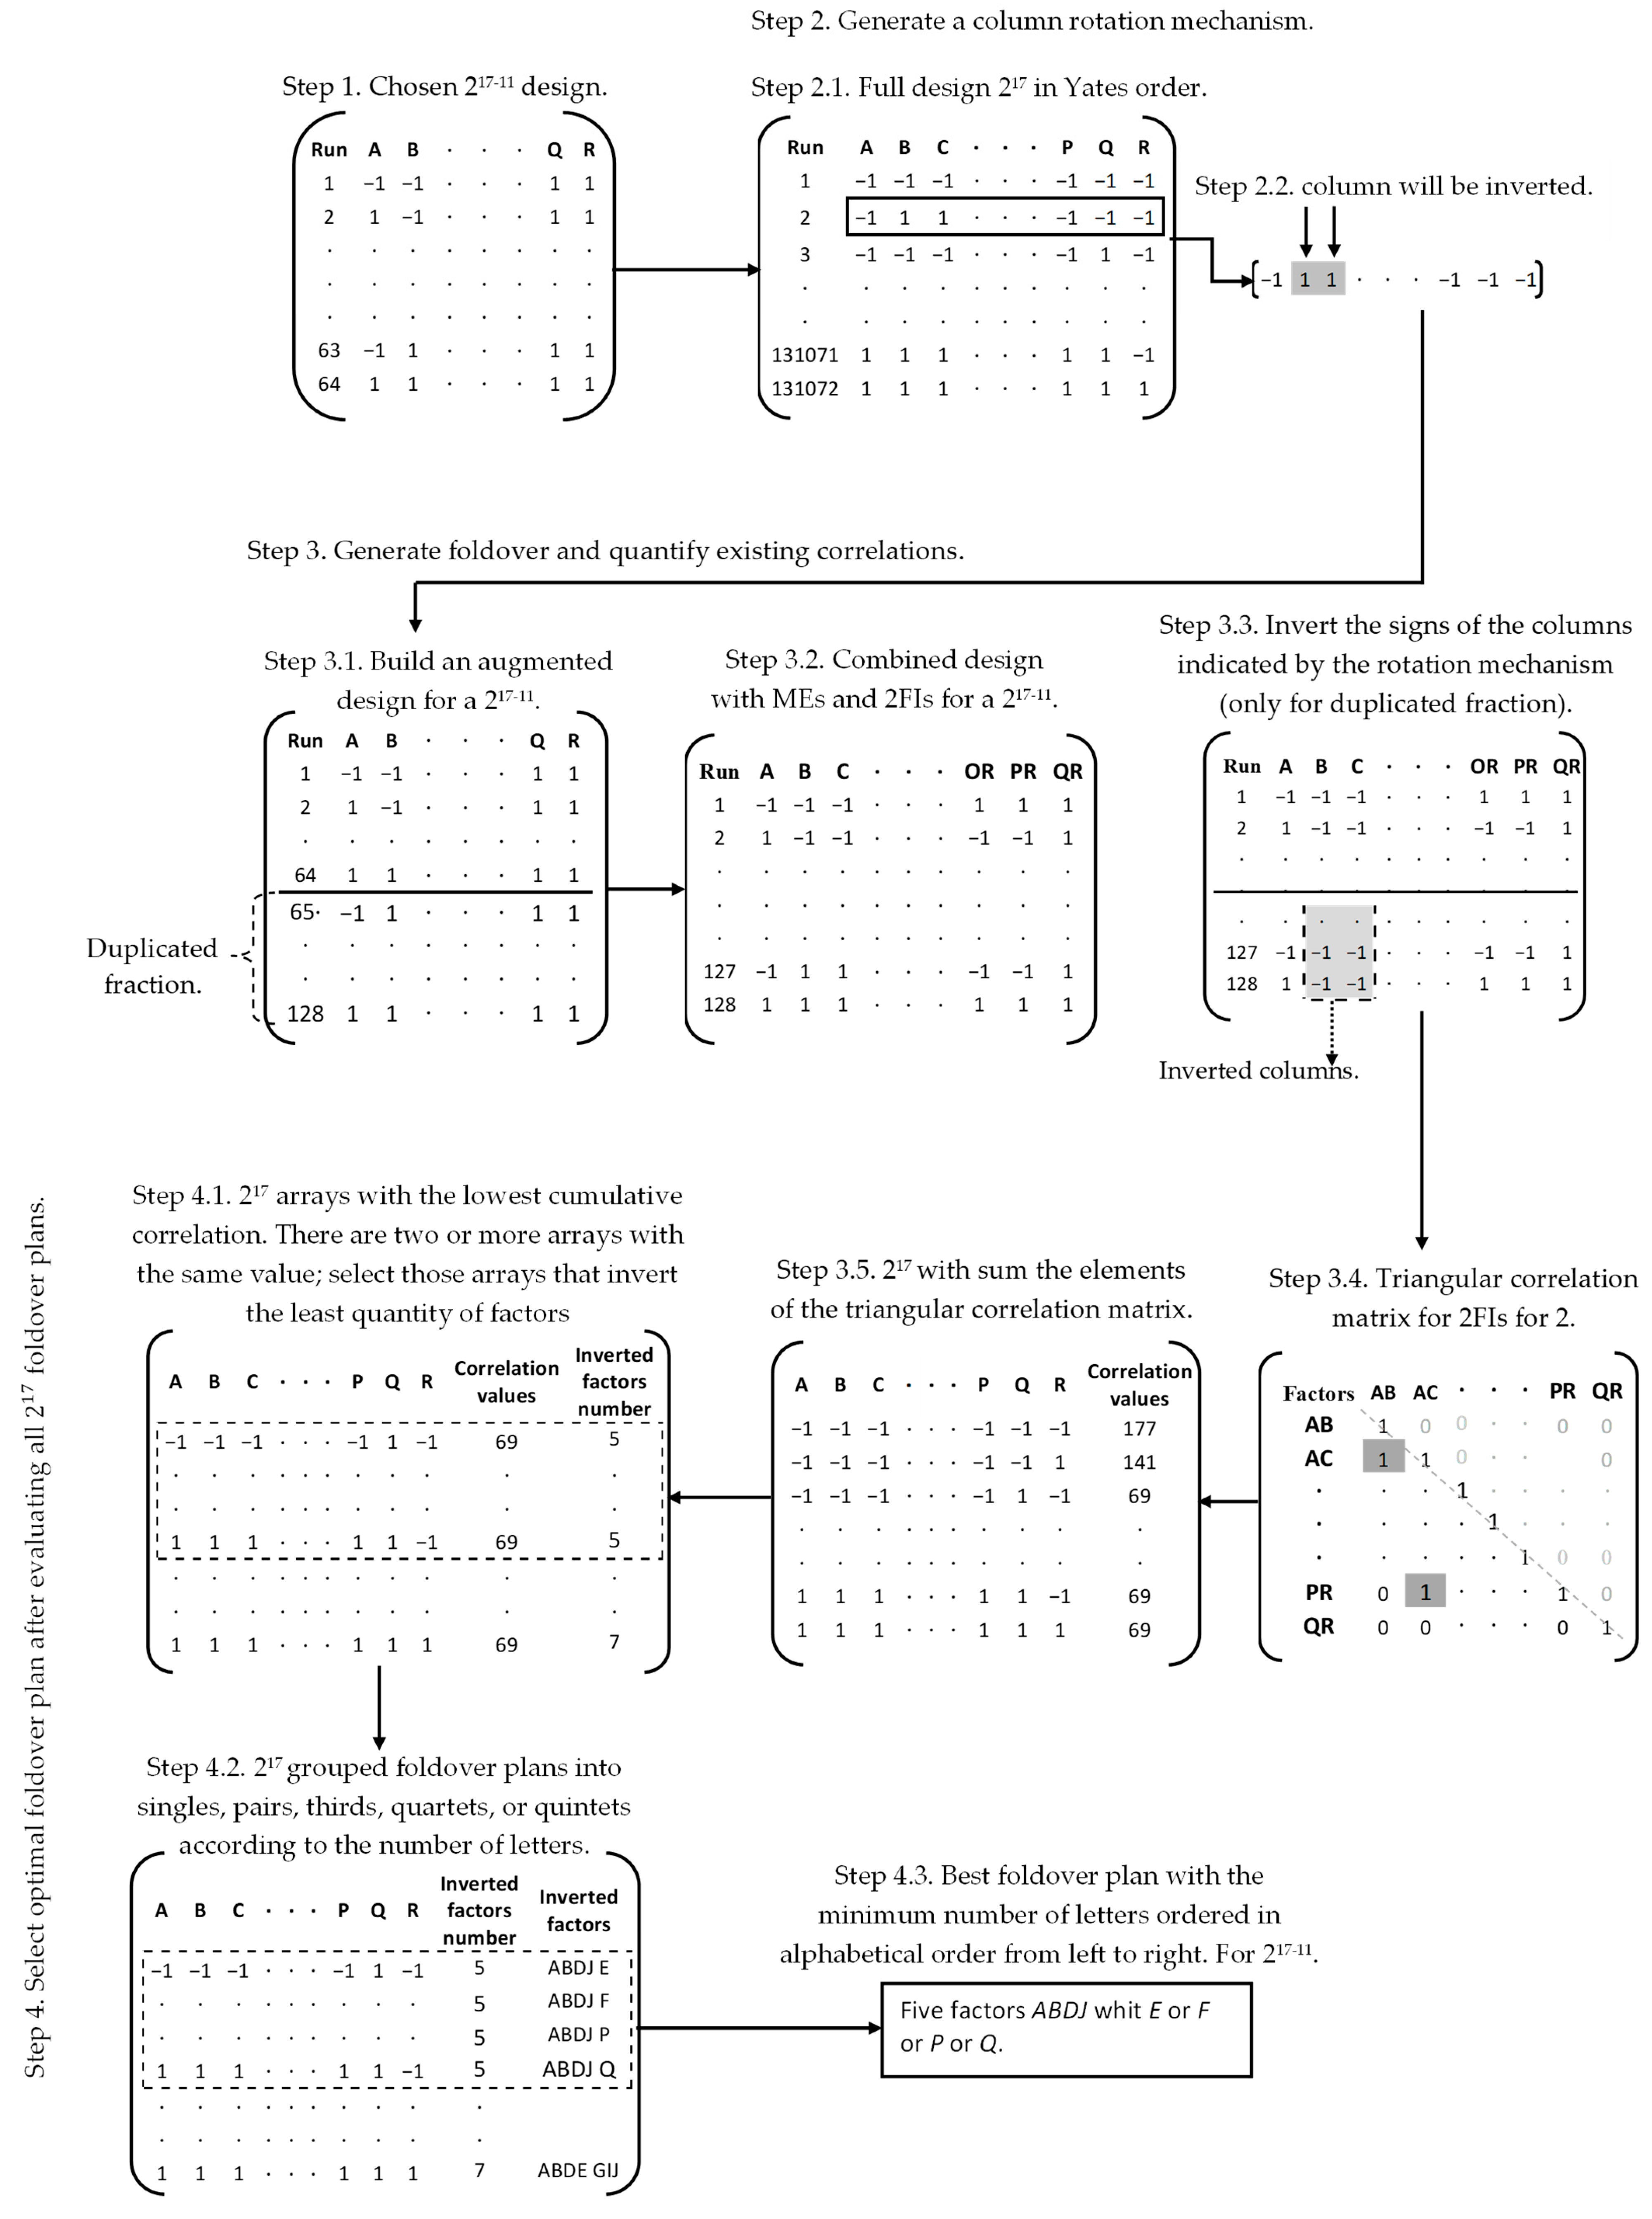
The methodology used in this research consists of 4 steps, described in the following.
Step 1. Choose with 17 to 21 factors.
Step 2. Generate a column rotation mechanism.
2.1. Generate a full matrix design in Yates order using configuration (−1, 1).
2.2. Extract one row at a time from the full matrix design to specify the columns to be inverted (1 means the column will be inverted, 0 means column will not be inverted). Note that this step ensures that all possible foldover plans are computed and evaluated in such a way that the optimal plan is guaranteed to be found.
Step 3. Generate foldover and quantify existing correlations.
3.1. Build an augmented design, with a doubled fraction to the initial fraction .
3.2. Create a combined design that includes MEs and 2FIs.
3.3. Invert the signs of the columns indicated by the rotation mechanism for this array (only for duplicate fraction).
3.4. Compute a triangulated correlation matrix. The correlation matrix is calculated only for the 2FIs columns.
3.5 Sum the elements of the triangular correlation matrix (correlation values) and reserve this value according to the row value of the rotation mechanism.
Step 4. Select optimal foldover plan after evaluating all foldover plans.
4.1 Select those arrays with the lowest correlation values. In case there are two or more arrays with the same value, select those arrays that invert the least quantity of factors.
4.2 Group foldover plans into singles, pairs, thirds, quartets, or quintets according to the number of letters.
4.3 Choose the plan with the minimum number of letters ordered in alphabetical order from left to right.
The lowest cumulative correlation was the primordial criterion for optimality; it ensures that the optimal foldover plan can decouple the highest number of 2FIs. But given that many foldover plans proved to be optimal, two additional criteria were added, the minimum factor inversion and the alphabetical order. These two criteria have no statistical meaning; they were just used to narrow down the set of possible candidates.
This method was scripted in MATLAB
® v.2021b [
29], and this can be found in the
Supplementary Material.
Figure 5 shows an exhaustive search methodology for
step by step. A standard laptop computer was used to perform simulations; the characteristics of the equipment are the following: i7 Intel processor, 36 GB RAM, Nvidia 4070 graphics card. The longest simulation took 2 h to accomplish.
For example, consider the design; it is known that there are 131,072 different plans, and to characterize them, they were ordered by the correlation value from lowest to highest. Only the plans that have the lowest number of correlations were selected; for this example, there are 1280 plans with the lowest correlation value. Once filtered, they were ordered according to the number of factors they require to invert, and only those that required the least number of factors were selected. For this example, there are only 5 foldover plans that could be optimal, BCQ, DFN, JKP, EGL and HMO, but BCQ is considered optimal since it is the one that is first in alphabetical order.
4. Results
The foldover plans were classified into three categories: best (set of plans with the lowest correlation value), bad (all those plans that have a high correlation value), and worst (those plans that could not decouple any
2FIs). This distribution for
to
designs is shown in
Table 1, where the best foldover plans constitute <1% of the total. In contrast, most of the foldover plans evaluated present a high correlation, so that if an experimenter were to choose a plan randomly, they would have a low chance of obtaining an optimal design. Thus, it is advisable to use the plans proposed in this paper.
Note that variance and confidence information may not be very meaningful because each design produces a unique result. For example, the design has 131,072 possible foldover plans; from these, 0.98% were the best, 48.63% were bad, and 50.20% were the worst.
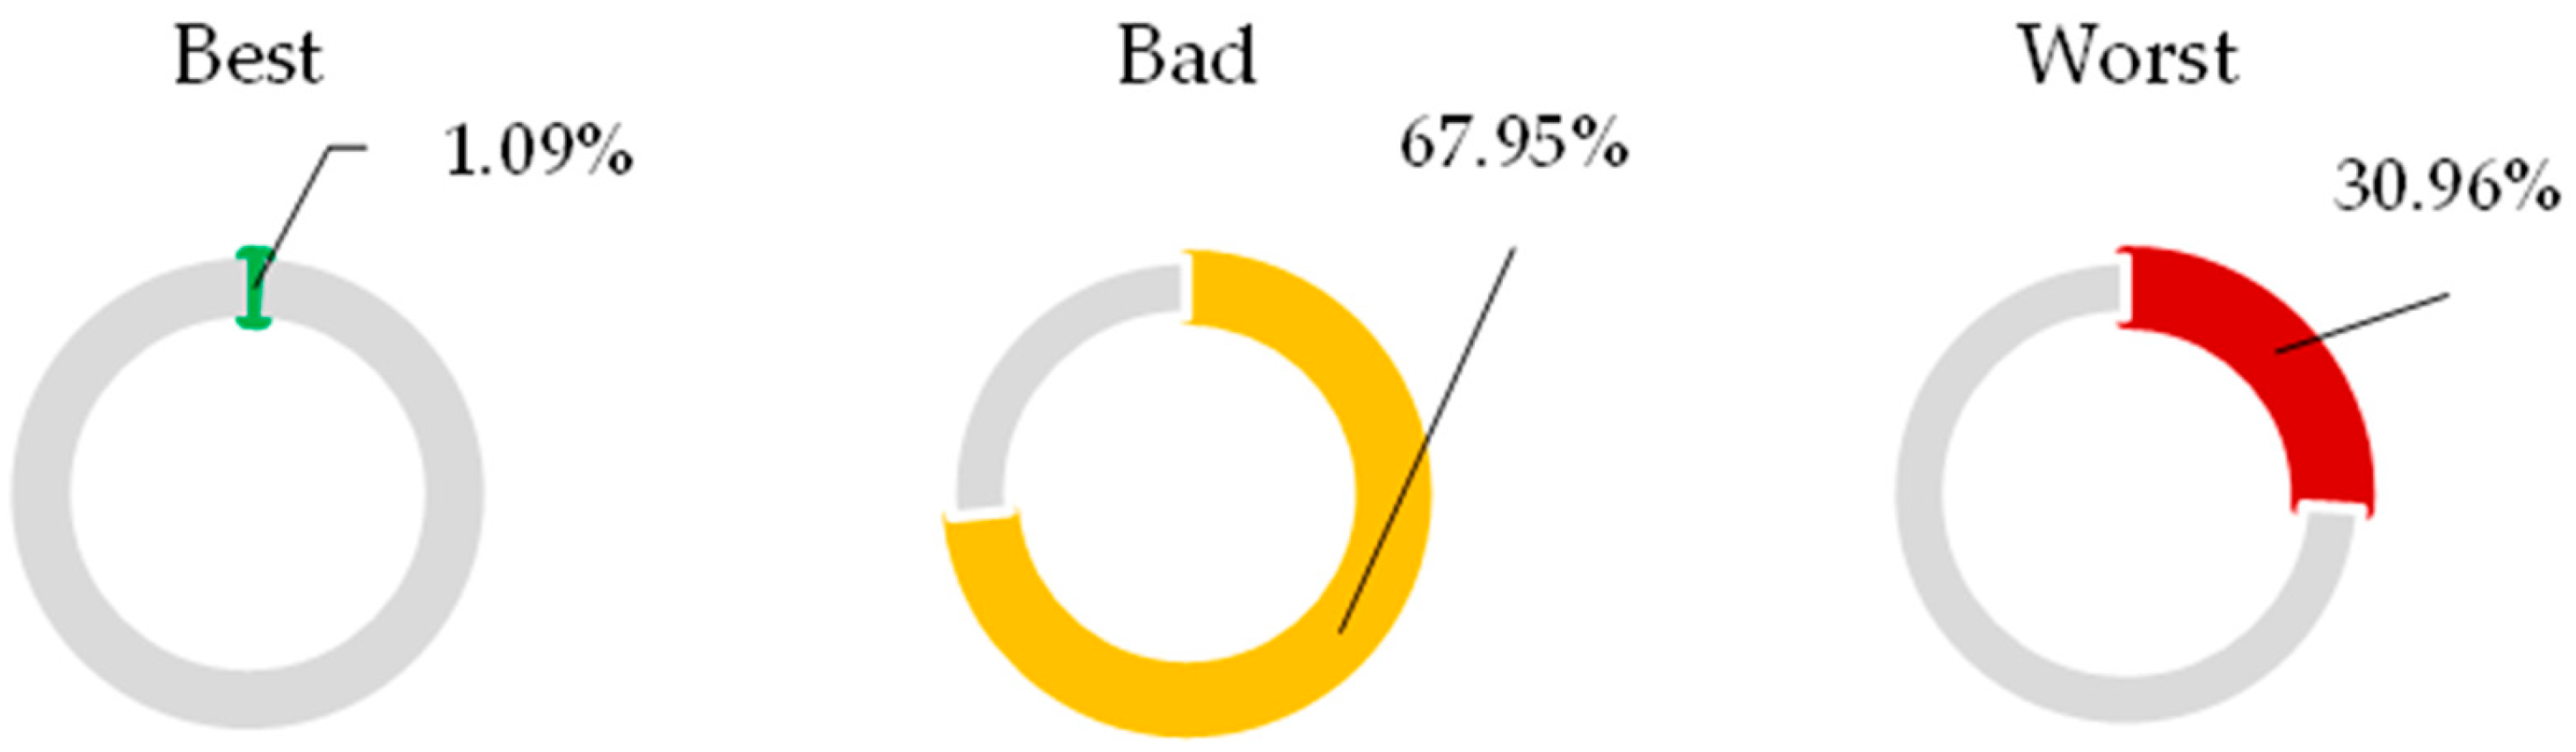
Figure 6 shows a graph of the ranking of foldover plans, allowing us to see that 1.09% of the plans have a low correlation, while 67.95% have a high correlation and 30.96% (the worst plans) did not decouple any
2FIs.
Table 2 shows a total set of foldovers presented by Montgomery et al. (1996) and Galindo et al. in 2016 from
to
[
8,
9], now extended to
.
The foldovers plans presented here are optimal in the sense that no other plan can decouple more 2FIs; how robust these plans are in the presence of different noise levels or poor-quality data is an issue that can be studied in future research. Currently, commercial software does not provide recommended foldovers for resolution IV designs, but we believe that providing this information would help experimenters since they would not have to search for these plans in scientific articles, which is easy to do but depends on the software companies
5. Practical Application
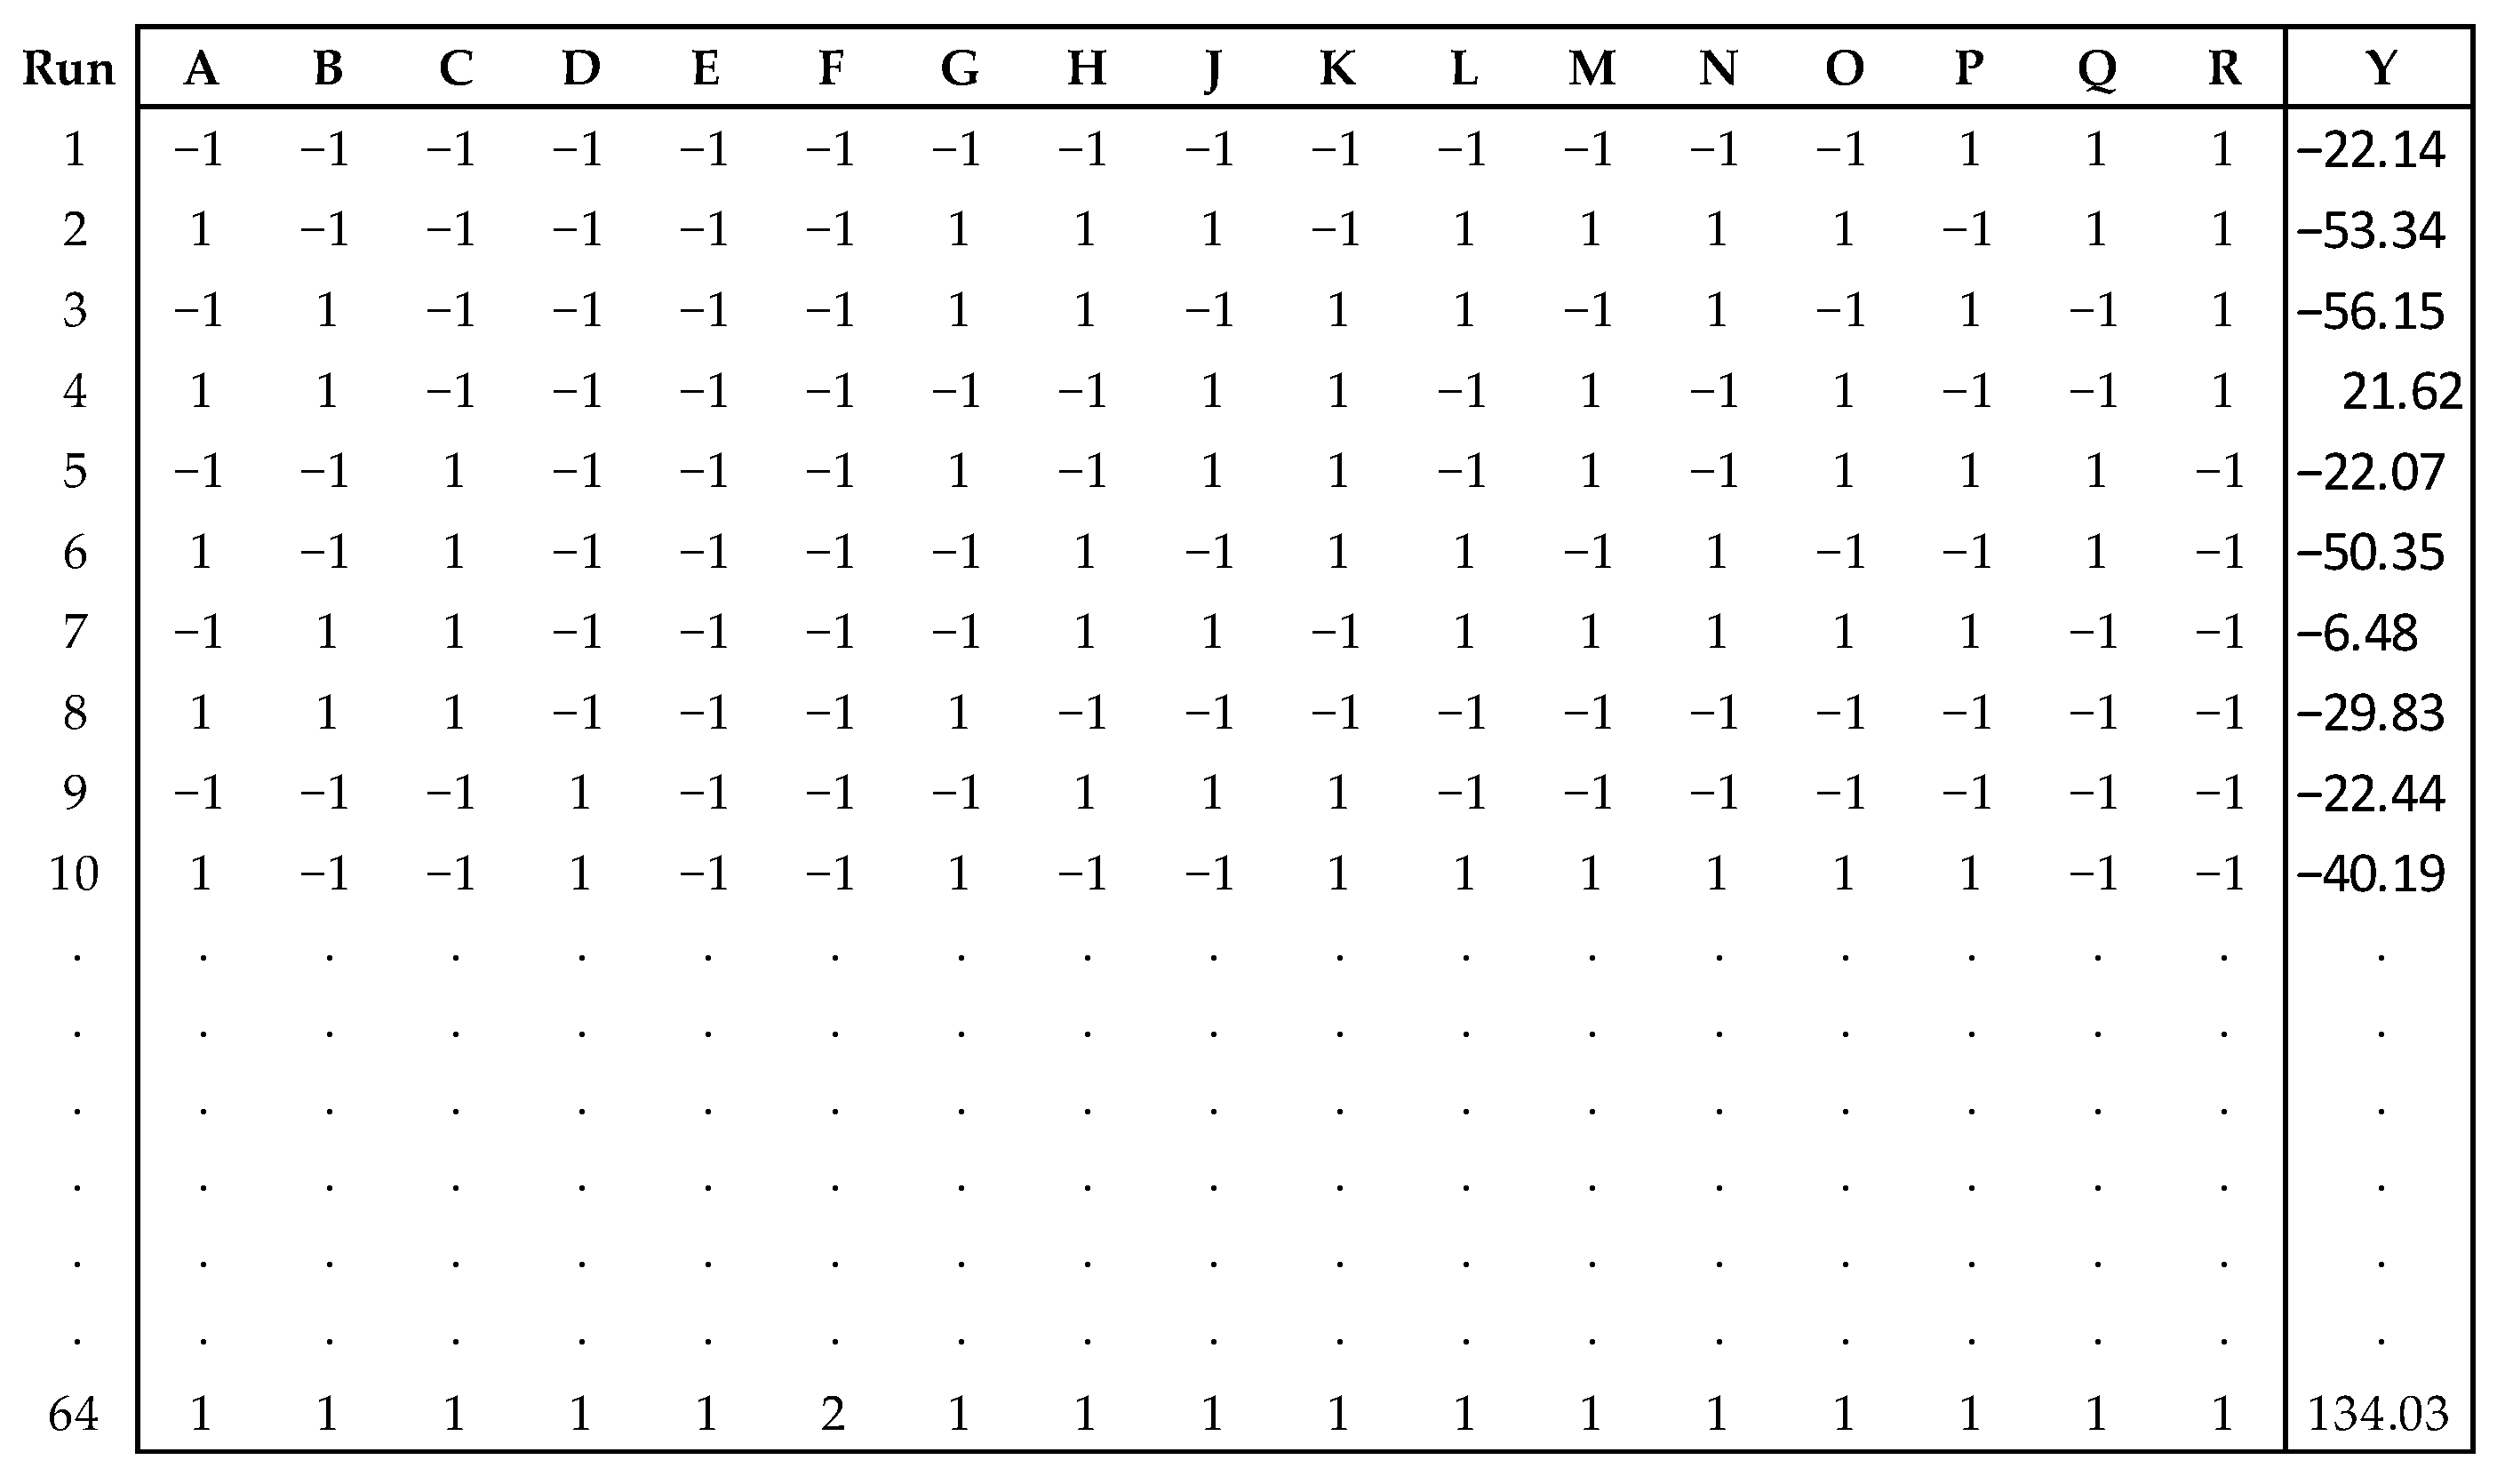
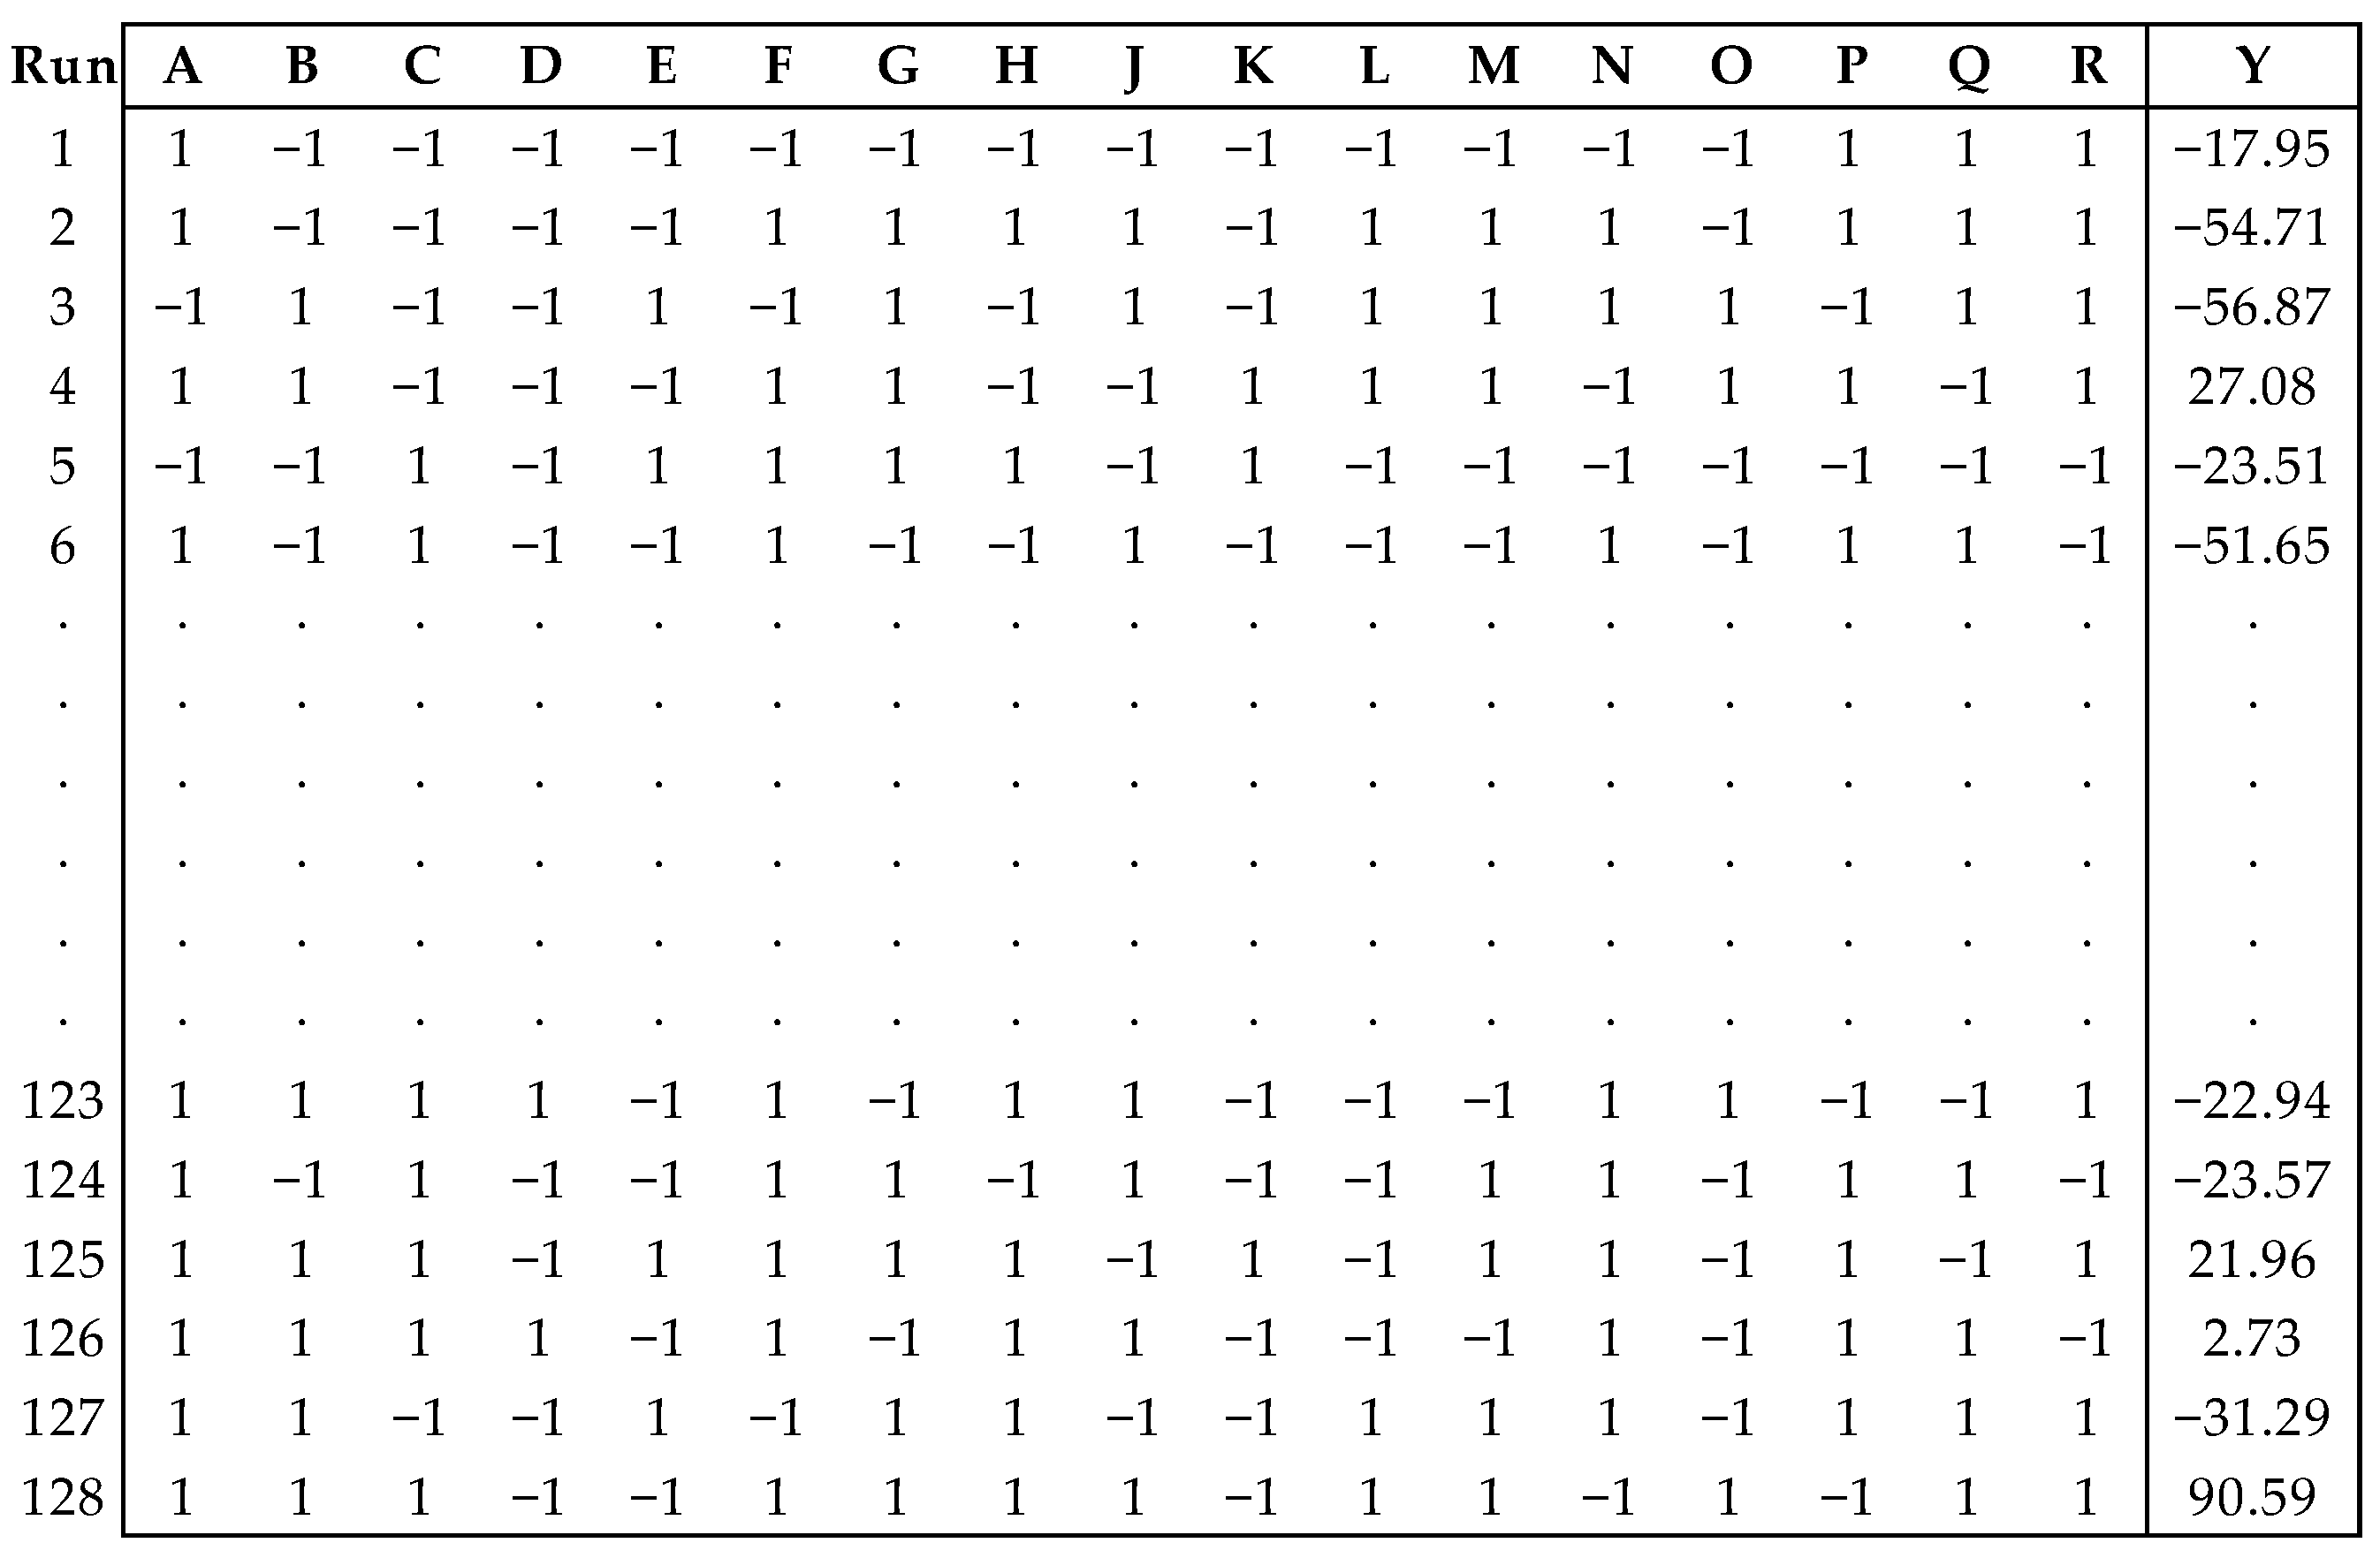
An experimenter is interested in studying the effect of 17 factors on a response variable; to reduce the cost of the experiment, they decide to run a fraction consisting of 64 runs. This experiment uses simulated data, with the flowing true model: Y = 100 + 9A + 10B + 12D + 11E + 14F + 9H + 12J + 13AB + 10AF + 14BJ + 9DE + 11FH + NORM (0,3).
Note that the regression coefficients are at least three times the error variance, which indicates a low noise level. The simulated data is shown in
Figure 7.
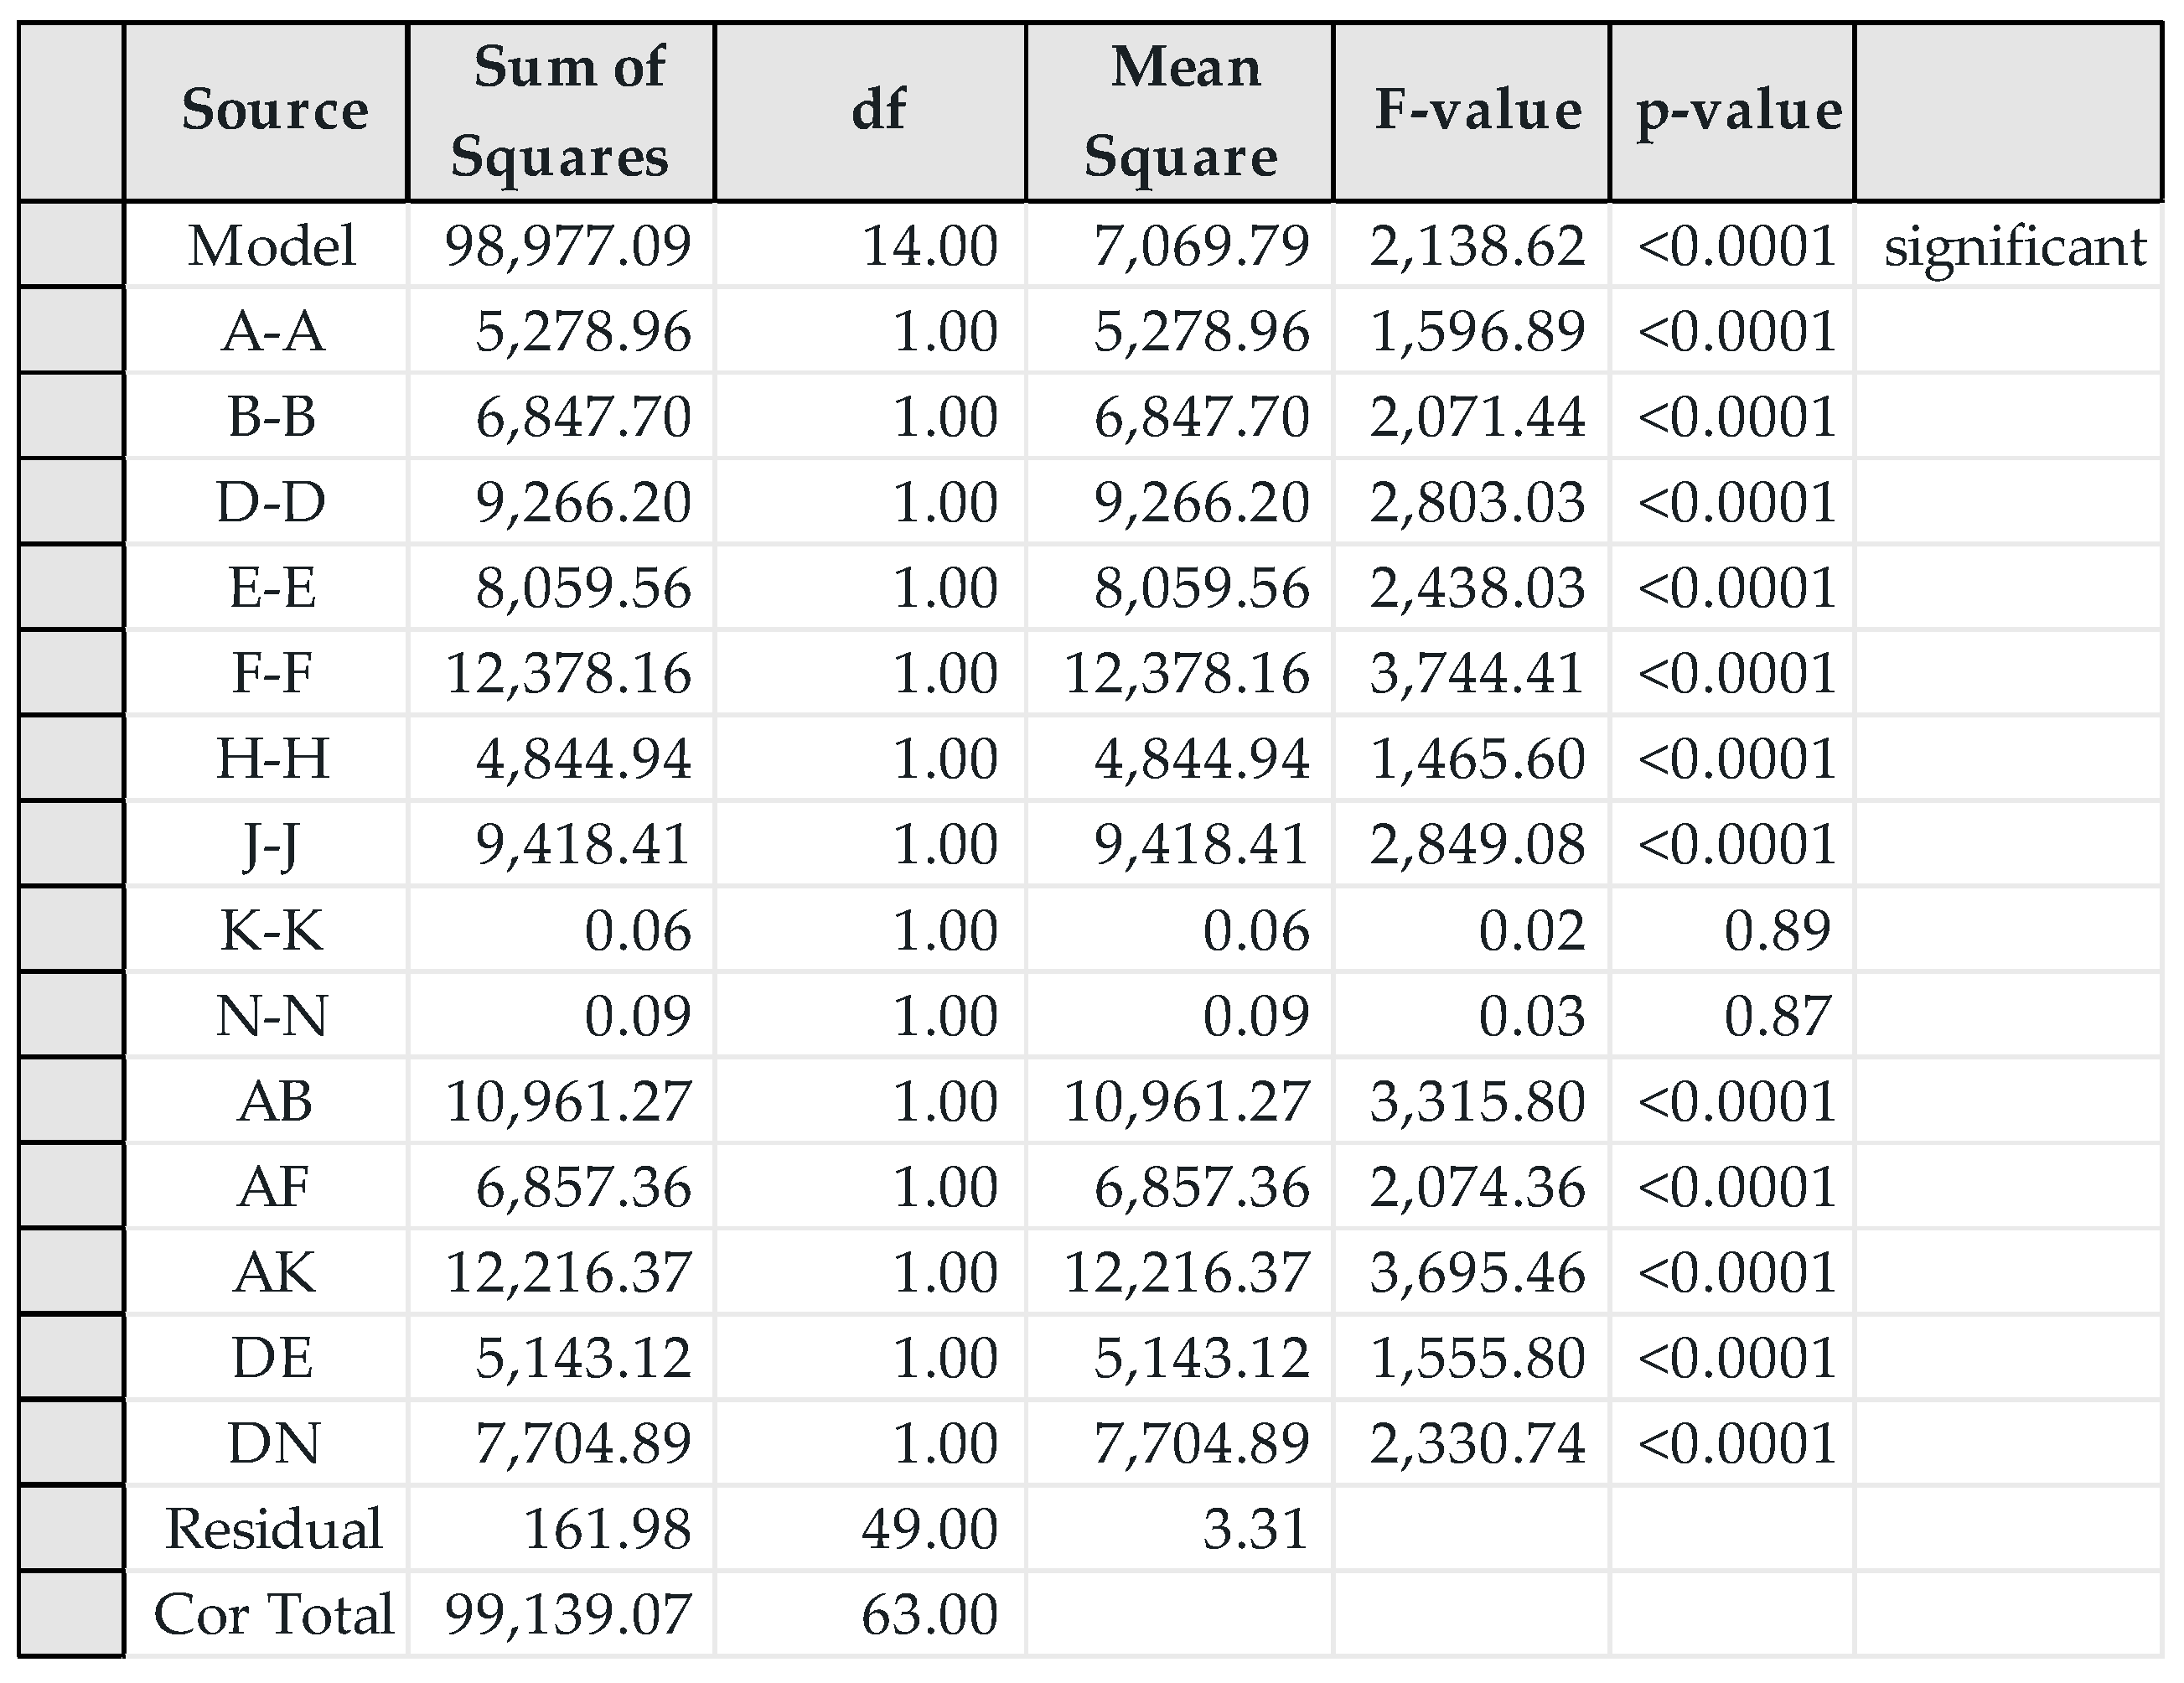
The model obtained is shown in
Figure 8; this is a hierarchical model obtained in Design Expert. Note that although the model is close to the true model, several interactions and main effects are incorrect.
The experimenters know that this is a highly fractionated design in which many
2FIs are confounded by each other, and for that reason, they decide to run a foldover using the recommendations provided in
Table 1. For the
fraction, the foldover plan is
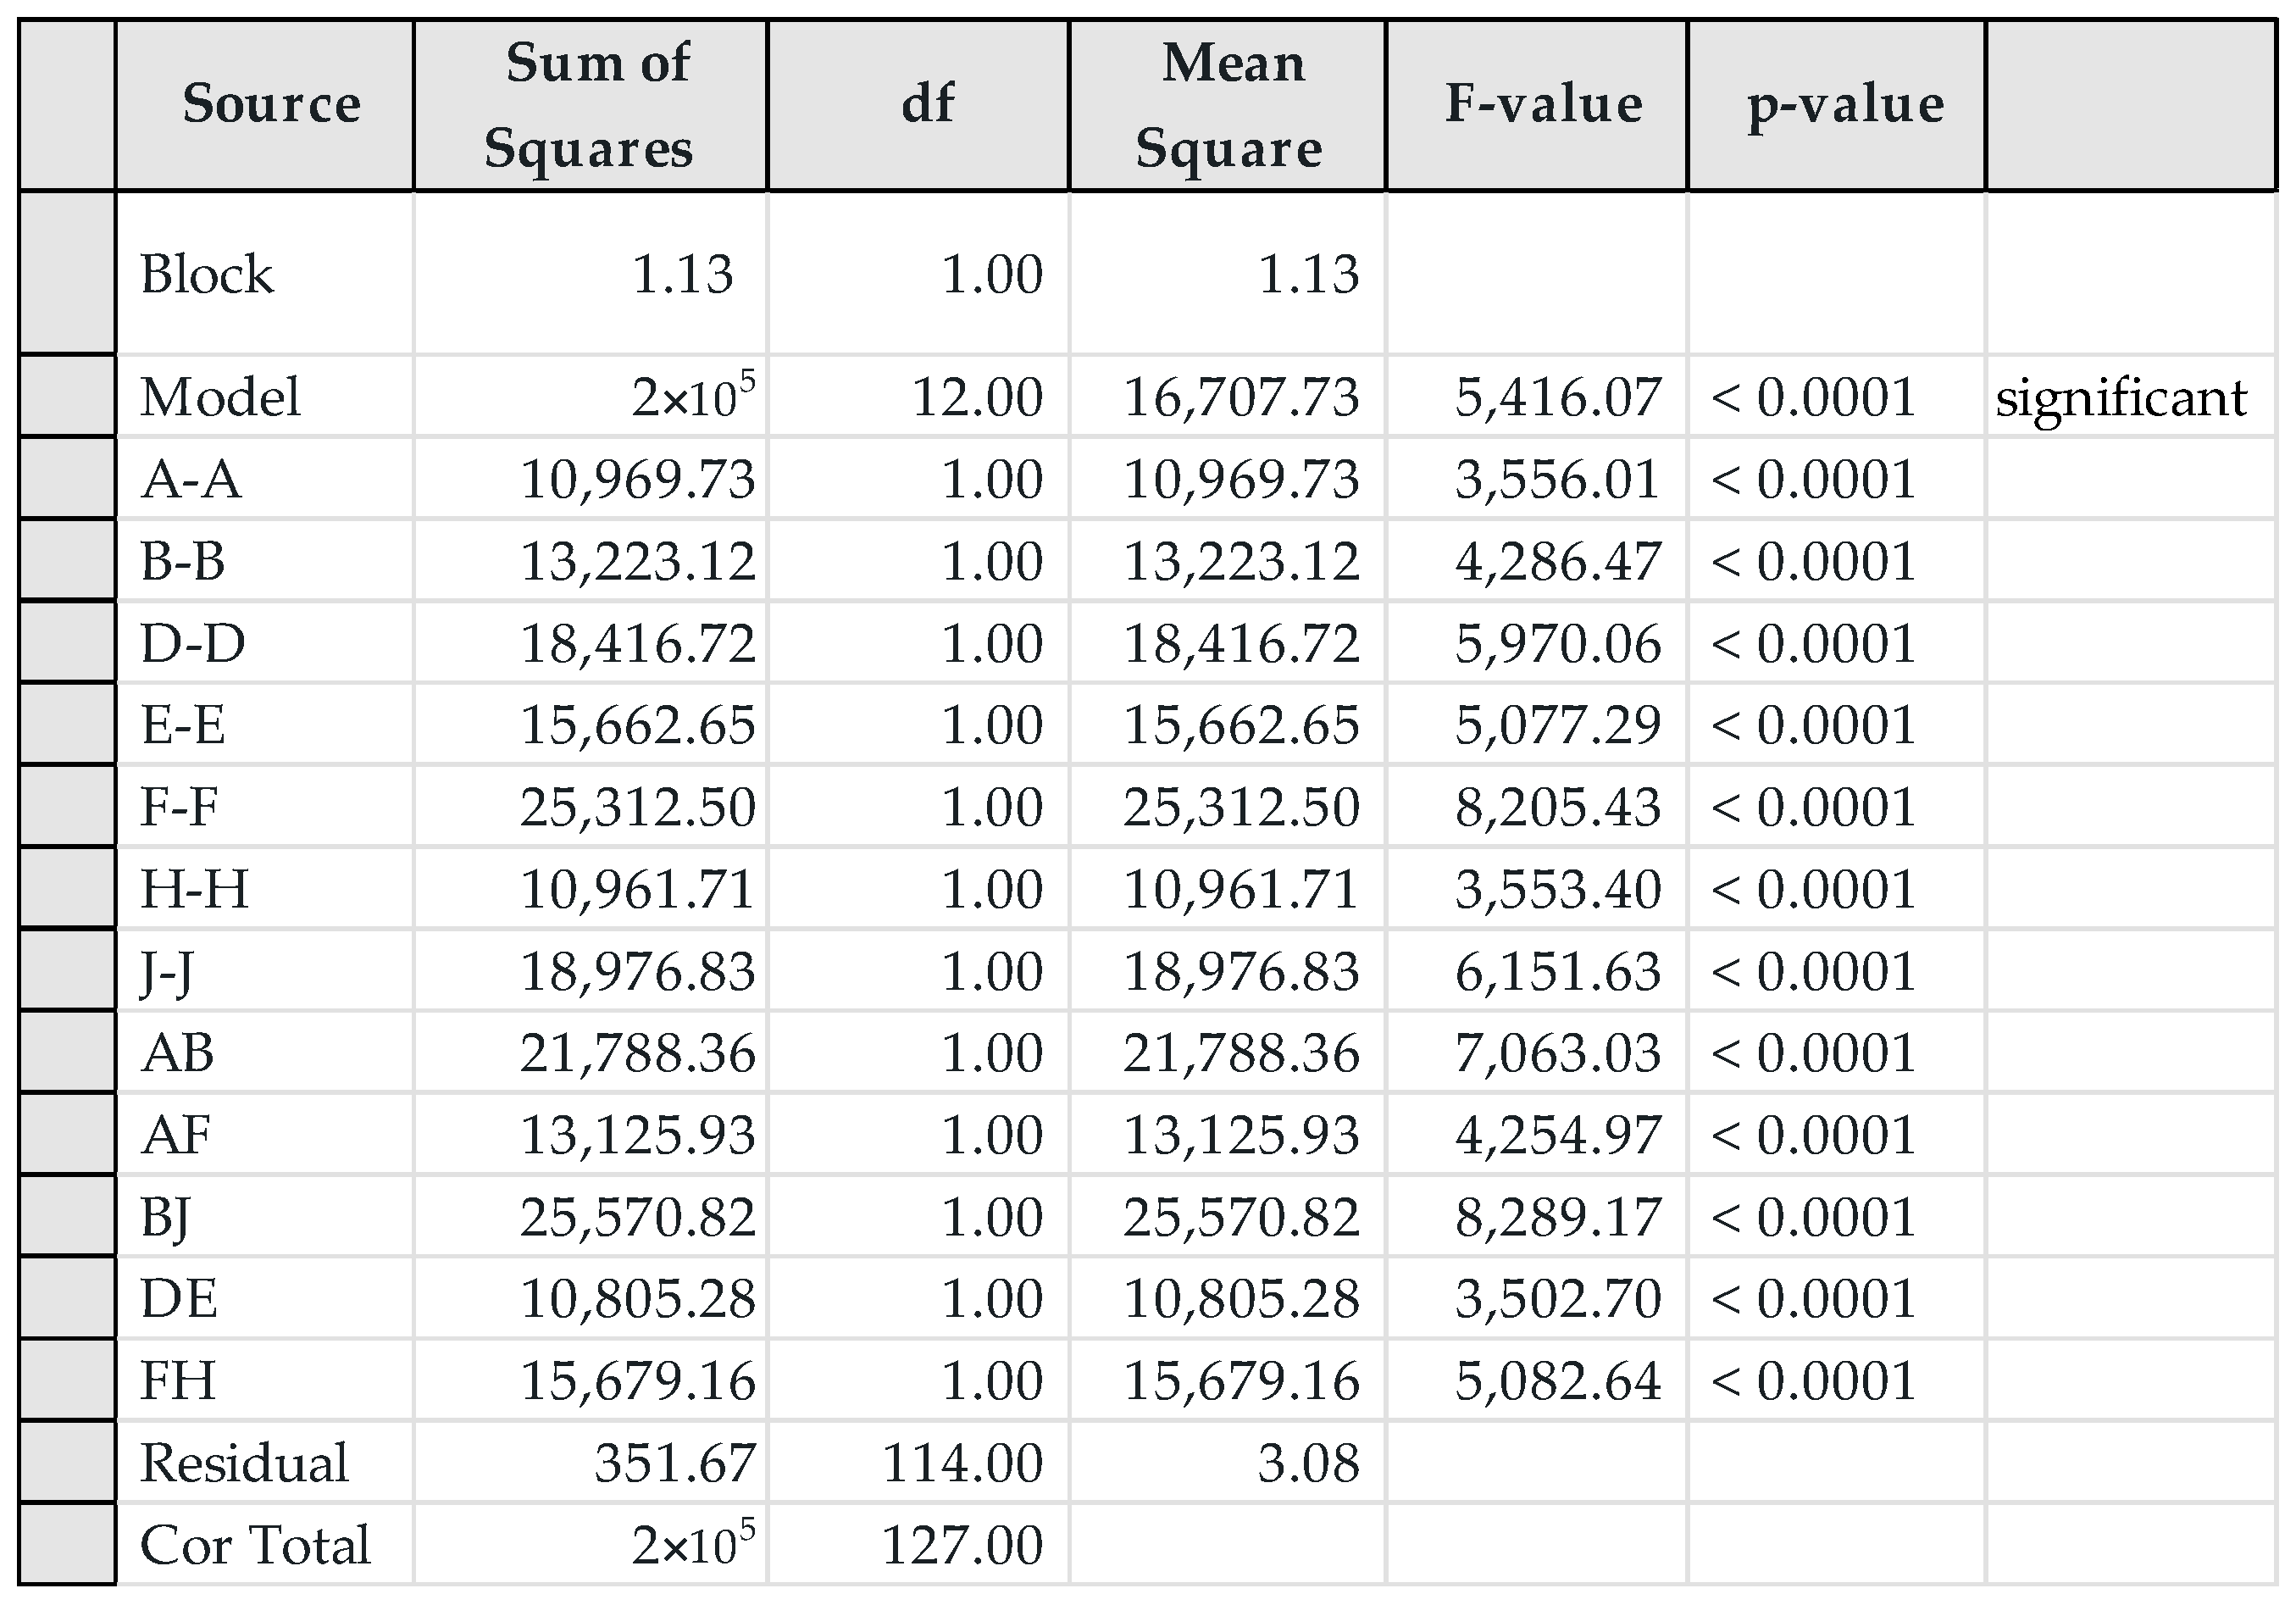
ABDJE; the augmented design is shown in
Figure 9.
The model obtained is shown in
Figure 10; note that after the foldover is performed, all significant terms are correctly identified.
6. Discussions
This research provides optimal foldover plans for fractional factorial designs with 17 to 21 factors, which can be applied in high-dimensional environments common in modern applications such as semiconductor fabrication or computational biology. In future research, we propose to extend the list of optimal foldover plans to designs above 21 factors, as well as the addition and comparison of other techniques such as -optimality, semifolding, machine learning techniques, and adaptive design. This methodology can also be adapted to multilevel designs, addressing designs with three-level factors and multilevel factors, which are common in industrial experimentation but require tailored foldover strategies.
Regarding D-optimality, this is an augmentation technique that is available in many commercial software; previous research has shown that D-optimality tends to require fewer additional runs, and it works well when only a few terms are correlated. In cases in which many 2FIs are significant, foldover is a better option because it maintains a balance and orthogonality and can decouple many 2FIs. In addition, foldover provides more degrees of freedom for error and provides better estimates of the regression coefficients. A quantitative analysis comparing both methods could be addressed in future research.
The objective of this research was to obtain optimal foldover plans for resolution IV designs with 17 to 21 factors. A comparison with other techniques such as D-optimal augmentations or adaptive design was not the objective of this research; future research can address such comparisons in terms of comparing the balance, orthogonality, and number of runs required by each method, as well as the accuracy of each method, to find the true model. Validation with real data is also considered for future research.
For the study of foldovers larger than 21 factors, it is recommended to replace an exhaustive search with metaheuristics or heuristics methods to efficiently handle larger designs. Machine learning models will also be used to predict optimal folding configurations based on design properties. The use of these techniques could improve computational efficiency because the exhaustive search can be replaced by a more efficient algorithm.
Other areas of interest where this research can be extended include sequential experimentation, biotechnology, sustainable manufacturing, and AI/ML hyperparameter tuning. Future work should prioritize balancing rigor with efficiency, ensuring that the pursuit of optimality does not come at the cost of practicality, especially in resource-constrained settings. As experiments grow in complexity, the ability to strategically use the foldover technique will remain critical to unlocking actionable insights from limited data.
This methodology could be considered for non-regular designs, adapting the column rotation mechanism to irregular designs (e.g., Plackett–Burman), which are common in screening experiments but lack a defined methodology for applying a foldover technique.
7. Conclusions
This paper presents a set of optimal foldovers for resolution IV designs with 17 to 21 factors. These optimal foldovers minimize the correlation that exists between
2FIs. The plans proposed extends the table from Montgomery et al. (1996) [
9] and Galindo et al. (2016) [
8].
The methodology used in this research provides a practical framework for the identification of optimal folding schemes in high-dimensional resolution IV fractional factorial designs. This offers clear guidelines for experimenters to implement foldovers, improving the resolution and precision by minimizing aliasing in resolution IV designs. By systematically reducing confounding, this research enhances the reliability of fractional factorial experiments in data-scarce scenarios, and the presented foldover plans serve as a practical toolkit for experimenters working with high-factor designs, ensuring that resource constraints do not compromise the quality of design.
The study discusses a critical challenge in experimental design: reducing aliasing effects while maintaining practical feasibility. The exhaustive search approach, combined with clear selection criteria (lower correlation, minimal factor inversion, and left-to-right prioritization), provides a replicable strategy for experimenters working with complex designs. However, the rarity of the best foldover schemes (often <1% of the total candidates) emphasizes the combinatorial complexity of these problems and highlights the need for improved methodologies in large-scale experimentation.
This paper opens the door to future research on larger designs, mixed-level designs, and -optimal designs, among others, to which the proposed method can be applied to obtain optimal foldover plans.




 ,
,