Article

How Does Government Innovation Regulation Inhibit Corporate “Greenwashing”?—Based on a Tripartite Evolutionary Game Perspective

1
School of Finance & Economics, Jiangsu University, Zhenjiang 212013, China
2
School of Business Administration, Shanghai Lixin University of Accounting and Finance, Shanghai 201620, China
3
School of Accounting, Shanghai Lixin University of Accounting and Finance, Shanghai 201620, China
*
Author to whom correspondence should be addressed.
Mathematics 2025, 13(22), 3658; https://doi.org/10.3390/math13223658
Submission received: 26 October 2025 / Revised: 10 November 2025 / Accepted: 12 November 2025 / Published: 14 November 2025
(This article belongs to the Special Issue Dynamic Analysis and Decision-Making in Complex Networks)

Abstract

A strategic fulcrum for leading high-quality economic development and shaping the nation’s future. Core competitiveness lies in how governments can effectively stimulate consumer demand for green consumption and motivate enterprises to pursue green technology innovation through the development of precise and efficient innovative regulation models. In this paper, a tripartite evolutionary game model is constructed based on evolutionary game theory, encompassing the government, enterprises, and consumers. We analyze the strategic interactions and evolutionary path among these three entities under conditions of bounded rationality and information asymmetry. The research reveals the following: (1) the government can effectively guide enterprises towards genuine green innovation through enhanced rewards for substantive innovation and increased penalties for strategic innovation; (2) consumer purchasing decisions are significantly shaped by economic benefits, perceived social value, and government subsidies, with their market choices forming a critical external supervisory force; and (3) government regulatory strategies are dynamically adjusted in response to market integrity levels and social welfare, with a tendency to implement innovative regulation when “greenwashing” risk is elevated. In conclusion, simulation analysis is conducted using MATLAB 2018a, and governance recommendations are offered based on three dimensions: precise government regulation, enhanced corporate responsibility, and enhanced consumer capabilities. These recommendations offer both a theoretical basis and a practical path for establishing an integrated green innovation governance system based on incentive constraint empowerment.

1. Introduction

Driven by the escalating global climate crisis, the explosive growth of cutting-edge technologies, and various countries’ strong policy promotion, green innovation products are gradually evolving into a profound transformation that includes the entire industrial chain and aims to reconstruct the future economic and social landscape. As enterprises, consumers, and governments are the three primary drivers of the green innovation market, their strategic interactions and behavioral choices have a direct impact on whether the market can evolve toward a “true green” form and reach the ultimate goal of sustainability. In September 2025, the outdoor sports brand ARC’TERYX held a “mountain blasting” fireworks show in the Himalayas, raising questions about the brand’s “respect for nature” philosophy. Through a strategic green innovation endeavor, ARC’TERYX expected to gain consumer emotional recognition and brand premium at a lower cost but instead triggered strong consumer surveillance and a crisis of trust, which in turn forced government departments to examine and strengthen their innovative regulation role.
As the main body of green transformation, enterprises’ innovative behaviors are not only related to environmental benefits but also determine the potential of high-quality economic development [1,2]. On the one hand, society needs enterprises to solve environmental problems through substantive green innovation; on the other hand, high R&D costs, uncertain market returns, and intense short-term competitive pressure may give rise to strategic behaviors, i.e., creating an environmentally friendly image through behaviors such as “greenwashing”. As the source of market demand for green needs and the natural surveillants of corporate behavior, consumers’ purchasing preferences can theoretically directly guide corporate R&D direction [3]. However, compared with similar traditional products, mature green products face a premium problem. This cycle of “the more substantive green innovation products are invented—the higher the product’s sales price—the fewer the consumers” is common. Between corporate green technology innovation and consumer choice, a self-reinforcing “Möbius ring” dilemma is presented: weak green market signals mean that companies tend to strategic innovation, causing “greenwashing” incidents to occur and consumer trust to collapse, further weakening market signals. As the rule-maker and market regulator, the government bears the significant responsibility of guiding innovation direction through policy instruments, preventing “greenwashing” risk, and maintaining market integrity [4,5,6]. Constrained by regulatory resources, the government finds it difficult to accurately identify and evaluate the innovative behaviors of all enterprises. Facing increasingly concealed corporate “strategic innovation” tactics, traditional conventional regulatory measures find it difficult to keep up, and there is an urgent need to evolve towards a more precise and efficient innovative regulation model. Therefore, systematically analyzing the strategic interactions among the government, enterprises, and consumers in the tripartite game is of urgent practical significance for optimizing the allocation of government regulatory resources, effectively curbing corporate “greenwashing” impulses, and reshaping consumer trust in green products.
The marginal contributions of this paper are mainly reflected in the following three aspects: first, it constructs a game model based on the simultaneous existence of enterprises, consumers, and government departments, which more comprehensively depicts the complex interactive relationships of core stakeholders in the green innovation market, and provides a more systematic theoretical lens for understanding the generation and governance mechanisms of the market’s “greenwashing” phenomenon. Second, it explicitly distinguishes between “substantive green innovation” and “strategic green innovation” in corporate green innovation behavior, and accurately quantifies the differences between the two in terms of costs, benefits, and regulatory risks faced. This distinction shifts the research focus from general “green innovation” to the analysis of innovation “quality” and “motivation,” deepens the understanding of the roots of corporate opportunistic behavior, and makes the discussion of regulatory countermeasures more targeted. Finally, through systematic stability analysis and numerical simulation, it dynamically reveals the evolutionary path and effects of the government’s “innovative regulation” and “conventional regulation” models under different parameter conditions. The study not only verifies the effectiveness of traditional policy tools such as reward and punishment mechanisms, but also emphasizes the importance of improving regulatory accuracy, optimizing resource allocation, and utilizing market signals (consumer choice), providing a concrete and actionable theoretical basis and practical path for the government to design an innovative regulatory toolbox that is both incentive-compatible and cost-effective.
The remainder of this study is organized as follows: Section 2 introduces the research methods and model. The results are provided in Section 3. Section 4 presents a discussion. Section 5 summarizes the conclusions.

2. Literature Review

2.1. Greenwashing: Conceptualization and Motivations

Corporate greenwashing has evolved from a specific marketing issue into a systemic threat to environmental governance. The term greenwashing was coined in 1986 by environmental activist Jay Westerveld, which was formally defined in the Oxford English Dictionary (2012) as “the dissemination of false information to create a public image of environmental responsibility”. Recent conceptual definitions have gone beyond mere advertising deception to encompass strategic innovation tactics where enterprises invest in symbolic rather than substantive environmental actions. This distinction is crucial: traditional greenwashing involves overt misinformation, while strategic green innovation represents a more covert form where companies allocate resources to create the appearance of environmental compliance without changing core production processes. Motivation-related literature indicates that strategic green innovation implies lower costs and higher profit margins; therefore, the pursuit of economic benefits becomes its most direct motivation [7]. When enterprises face environmental pressure [8], green demand [9], policy incentives [10], and other factors, it can induce enterprises to produce “greenwashing” products. Currently, most game-theoretic studies on corporate green technology innovation focus on the technological factors of green technology innovation and the stability of the strategic choices of each player. Scholars focus on banks, enterprises, and investors to assess the spillover effect and the market competitiveness level of green credit policies on green technology innovation, and construct a tripartite game involving the government, enterprises, and green innovation service platforms, considering two typical factors: technological greenness and technological innovation [11,12,13]. Participants in the market are often conditioned by bounded rationality, exhibiting cognitive biases and having limited information processing capabilities. Evolutionary game theory relaxes the rationality assumption of participants, requiring only that they possess a certain learning ability and can continuously learn and adjust strategies in repeated games [14,15]. By constructing replicator dynamic equations, the evolutionary game model can well depict the evolution process of the game. As participants dynamically adjust their strategies, the game will converge towards an evolutionarily stable strategy [16,17].

2.2. Government Regulation and Market Governance

The role of governments in curbing “greenwashing” remains a subject of debate in both theoretical discourse and practical implementation. Market failure theory posits that information asymmetry between firms and consumers necessitates regulatory intervention [18], yet empirical evidence indicates that conventional command-and-control approaches exhibit diminishing returns. Markham et al. [19] argue that existing regulations have failed to prevent greenwashing, as static penalty structures cannot adapt to increasingly sophisticated corporate deception strategies. Baum [20] points out the same thing regarding corporate environmental communication tactics. Recent scholars advocate for dynamic, innovation-oriented regulation that evolves in tandem with market behaviors [21]. Sun et al. [22] have attested that penalty mechanisms can effectively deter “greenwashing” behaviors only when the penalty magnitude exceeds the net gains from deception, while tax subsidies are often insufficient for heterogeneous firms—particularly inferior enterprises with limited absorptive capacities. This finding highlights a critical gap: most regulatory models assume homogeneous corporate responses, neglecting how resource endowments and market positions moderate policy effectiveness.

2.3. Consumer Agency and Information Asymmetry

Consumers act as both market drivers and de facto regulators through their purchasing decisions and social surveillance [23]. However, bounded rationality and information processing constraints severely limit their ability to distinguish genuine green products from false ones [24]. This asymmetry creates a “lemons market”, where greenwashing can crowd out substantive green innovation. Perceived social value and environmental awareness can mitigate this effect: when consumers derive non-monetary benefits from authentic green consumption, their willingness to pay increases, thereby strengthening market incentives for genuine innovation [25]. Government subsidies amplify this effect by reducing price premiums and signaling quality; however, improperly designed subsidies may inadvertently reward environmental opportunism and exacerbate moral hazard [10]. Third-party certification mechanisms are regarded as crucial institutional arrangements to mitigate information asymmetry, reducing consumers’ information search costs through independent verification and signal transmission. However, their effectiveness depends on the credibility of the certification bodies and the soundness of surveillance mechanisms. Emerging digital technologies, particularly blockchain and the Internet of Things, are reshaping how consumers access information by providing tamper-proof product traceability data, offering the technical feasibility to address information asymmetry in green product markets [26]. Additionally, the improvement in consumers’ environmental literacy not only enhances their ability to discern but also amplifies supervisory effects through social network mechanisms, creating social disciplinary pressure against greenwashing practices. To a certain extent, this collective intelligence mechanism compensates for the limitations of formal regulation [27].

2.4. Applications of Evolutionary Game Theory

Evolutionary game theory provides a robust framework for analyzing strategic interactions under bounded rationality, where agents learn and adapt through repeated gameplay rather than optimizing with perfect information [28]. Fan et al. [29] modeled pollution control as an evolutionary process in which penalty mechanisms drive corporate compliance, Ren et al. [30] analyzed greenwashing prevention in public–private partnerships, and Dong et al. [31] examined the impact of dynamic government regulation on manufacturing firms’ “greenwashing” behaviors. However, these studies are primarily characterized by binary (government–enterprise) or homogeneous enterprise assumptions, neglecting the tripartite interactions and heterogeneous capabilities present in real-world green innovation ecosystems. Cheng et al. [32] highlight that integrating deep reinforcement learning with evolutionary game theory enables the capture of adaptive strategy optimization. Nevertheless, these methodologies remain largely theoretical in nature and lack empirical calibration.
Table A1 provides a detailed comparative summary of the selected literature. Each study is evaluated across standardized criteria to ensure consistent assessment.

3. Construction of a Three-Party Evolutionary Game Model

3.1. Problem Description

Despite the presence of climate change skeptics, consumers, especially younger demographics, are increasingly favoring green and sustainable products. However, a challenge arises: green products are becoming more difficult to identify. Are enterprises engaging in “greenwashing” by making inconsistent claims and actions? According to the “2023 China Patent Survey Report” released by the National Intellectual Property Administration, the industrialization rate of valid invention patents in China was only 39.6% in 2023. A significant number of patents and inventions are not practically applied, becoming mere displays on “shelves,” and cases of “pseudo-innovation” penalties are emerging endlessly. Globally, the attitude towards green products is gradually shifting from preferential encouragement to mandatory requirements, and the rules against “greenwashing” are becoming stricter, with the cost of greenwashing shifting from moral condemnation to legal regulation. How can we combat greenwashing without pushing enterprises into green silence?
Enterprises, as the entities that transform green innovation technologies from laboratory concepts into marketable products and services, are both the core executors of innovation and the risk bearers in the supply–demand dynamic. On one hand, they expect clear and consistent policy signals from government departments, along with the construction of fair and effective incentive and constraint mechanisms [33]. This would help them mitigate the risks associated with exploring cutting-edge technologies and achieve genuinely effective substantive green innovation. On the other hand, enterprises also hope that consumers will embrace new green technologies, products, and services with an open mind, rationally evaluate green offerings, and be willing to pay a premium, thus providing valuable opportunities for market iteration [34]. Therefore, this paper mainly discusses the choice between substantive green innovation and strategic green innovation behavior of enterprises under green innovation strategy.
Consumers are the drivers of market demand, supervisors of corporate behavior, and influencers of government policy. Their preferences directly shape corporate R&D and investment, providing market returns for green innovation. On one hand, consumers can monitor corporate green innovation through social media and advocacy groups, seeking transparent information and genuine commitment to environmental responsibility from companies, and desiring affordable, high-quality, and eco-friendly products. On the other hand, their environmental concerns provide a solid foundation of public support for government regulatory policies. They expect the government to foster a market environment characterized by transparent regulation, effective incentives, and comprehensive infrastructure, thereby ensuring a sustainable lifestyle. Therefore, this paper discusses the willingness of consumers to purchase green products. The strategy of whether to buy the green product belongs to the mixed strategy, which means that the agent participating in the game will randomly choose one of the strategies with a certain probability.
The government acts as the rule-maker, defining the boundaries and direction of behavior through laws, regulations, policies, and standards. It also incentivizes market innovation, stimulating the enthusiasm of both enterprises and consumers through economic measures. On the one hand, the government encourages enterprises to move beyond mere compliance and strategic innovation to engage in substantive green innovation, investing resources in green technology fields prioritized for national development. It also expects them to disclose accurate environmental information, facilitating timely adjustments to government policies and fostering globally leading green technologies and industries. On the other hand, the government hopes that consumers will rationally trust and support domestic green innovation, actively respond to and cooperate with government environmental policies, and ultimately achieve the coordinated development of environmental, economic, and social benefits. Therefore, this article divides government regulatory measures into two scenarios: innovative regulation and conventional regulation, and compares the different effects of these two mechanisms in preventing enterprises from adopting greenwashing strategies and encouraging consumers to make green purchases.
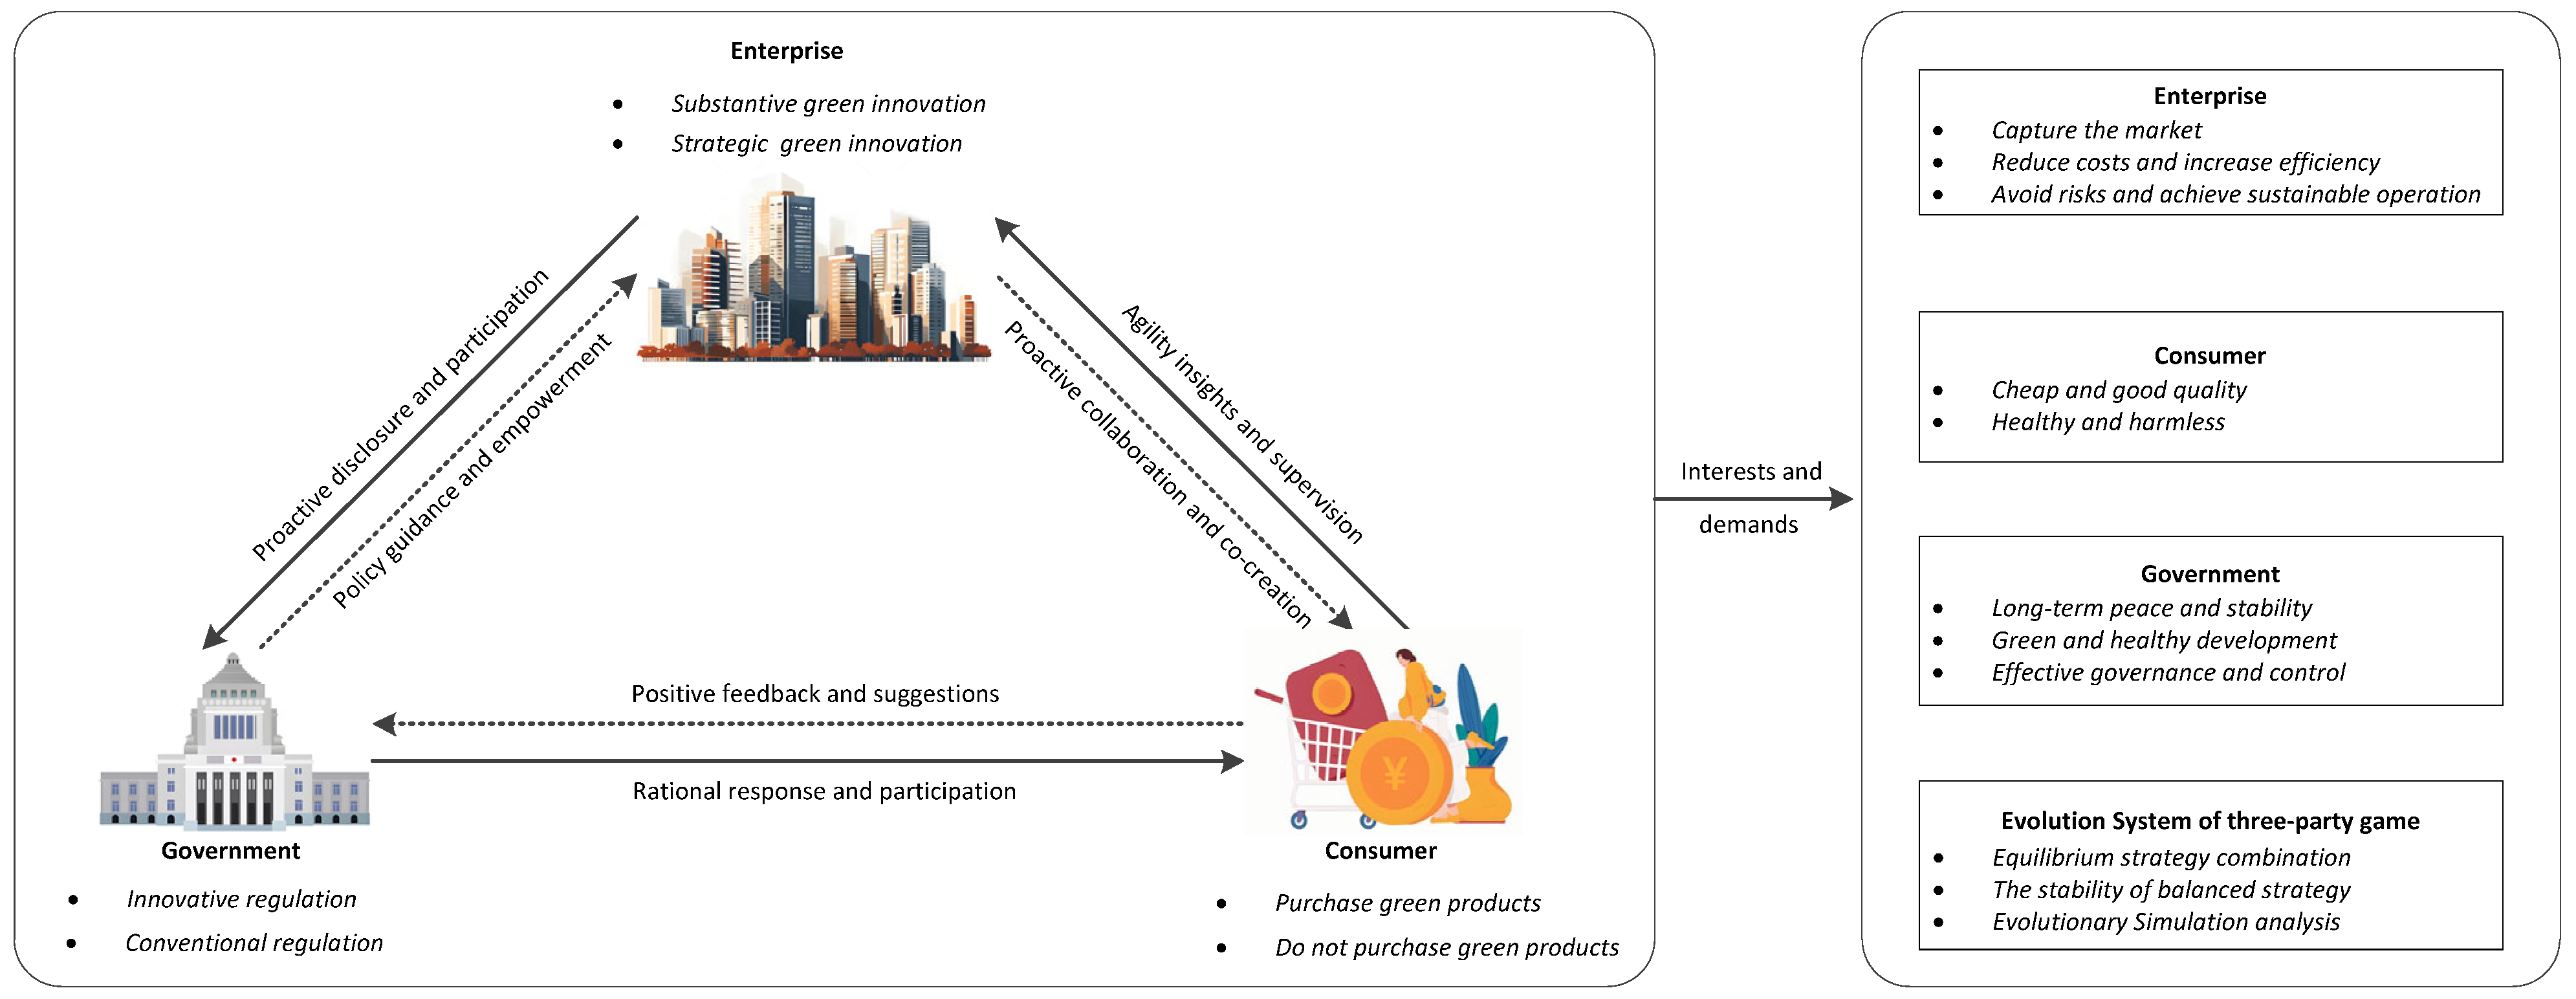
In conclusion, this paper develops a dynamic evolutionary game model involving three key players: the government, enterprises, and consumers, as illustrated in Figure 1.

3.2. Tripartite Evolutionary Game Model Assumptions

Assumption 1.
Consider the enterprise side (denoted as A ), consumer side (denoted as B ), and government supervision and guidance side (denoted as C ) as a complete green innovation system. Each subject in the system possesses the characteristics of bounded rationality and exhibits the phenomenon of information asymmetry. Each evolutionary subject has its own behavioral strategy choices, resulting in corresponding returns, to maximize its own interests as the basis for strategy selection. A  engages in green innovation technology research and development, and sells green products through the market.  B  purchases green products in the market, obtaining economic and health and safety benefits.  C conducts regulation of the green product market, prevents potential “greenwashing” risks, and maintains healthy market development.
Assumption 2.
The enterprise, consumer and government sectors make independent decisions based on their own interests. Enterprises can categorize their strategies into substantive green innovation and strategic green innovation based on the substantial contribution and true motivation of its environmental performance, with corresponding selection probabilities of  x  and  1 x , respectively. Consumers can categorize their strategies into purchasing green products and not purchasing green products based on their cognitive involvement, with corresponding selection probabilities of  y  and  1 y , respectively. The government regulation department categorizes innovation activities into innovation regulation strategy and conventional regulation strategy based on the incentive and penalty intensity and the methods of policy guidance, with the selection probabilities of  z  and  1 z , respectively, where  x , y , z 0 , 1 , all of which are functions of Time  t .
Assumption 3.
When making innovation decisions, the enterprise mainly focuses on product input and expected returns. When the enterprise conducts green product R&D, the substantive green innovation R&D costs and the rent-seeking costs of strategic green innovation are C 1  and  C 2 , respectively ( C 1 > C 2 ). Substantive green innovation requires the payment of genuine R&D investment, third-party testing, and green certification costs, while strategic innovation only needs to bear the expenses for packaging and “greenwashing” promotion. Therefore, C 1 > C 2  conforms to the reality of the cost structure. Rent-seeking costs mainly include operating and management expenses, such as falsifying environmental assessment reports and concealing environmental risks. After listing, the expected sales revenue of “true green” and “greenwashed” products are  R 1  and  R 2 , respectively ( R 1 > R 2 ).
Assumption 4.
Given the prevalent information asymmetry and consumers’ bounded rationality in the market, consumers find it difficult to accurately distinguish between genuine and fake green products. The costs consumers pay for purchasing “true green“ products and “greenwashed” products are C 3  and  C 4 , respectively ( C 3 > C 4 ). After obtaining the products, the expected return consumers receive are R 3  and  R 4 , respectively. The expected net benefit for consumers who do not purchase green products and choose conventional products is Δ R . The government provides consumers with a basic green purchase subsidy amount of  S  (reward coefficient  δ  ,  δ > 1 ).
Assumption 5.
The local government undertakes important public management responsibilities in socioeconomic development, with the primary goal of preventing “Greenwashing” risks while also considering the social benefits generated by green innovation and encouraging green consumption. The government sector’s basic cost of supervision is C 5 , the social welfare brought about by choosing innovative regulation is  W 1 , the reward amount is  I  (Reward Coefficient  α ,  0 < α < 1 ) for the enterprise’s substantive green innovation behavior, the penalty  F  (Penalty Coefficient  β ,  0 < β < 1 ) is for enterprises engaging in strategic green innovation behavior, the green purchase subsidies  S  is given to consumers, and the environmental tax  E  is levied. The government sector’s social welfare from choosing conventional regulation is  W 2 , the reward amount is  I α  for the enterprise’s substantive green innovation behavior, and the penalty  F ( 1 + β )  is for enterprises engaging in strategic green innovation behavior. The boundary between  α  and  β  is between 0 and 1, ensuring that the amount of government rewards and punishments does not exceed the enterprise’s sales revenue to prevent the enterprise from exiting the market due to financial infeasibility or excessive punishment.
Table 1 shows the main parameters of the model and their meanings. All parameter values are non-negative.
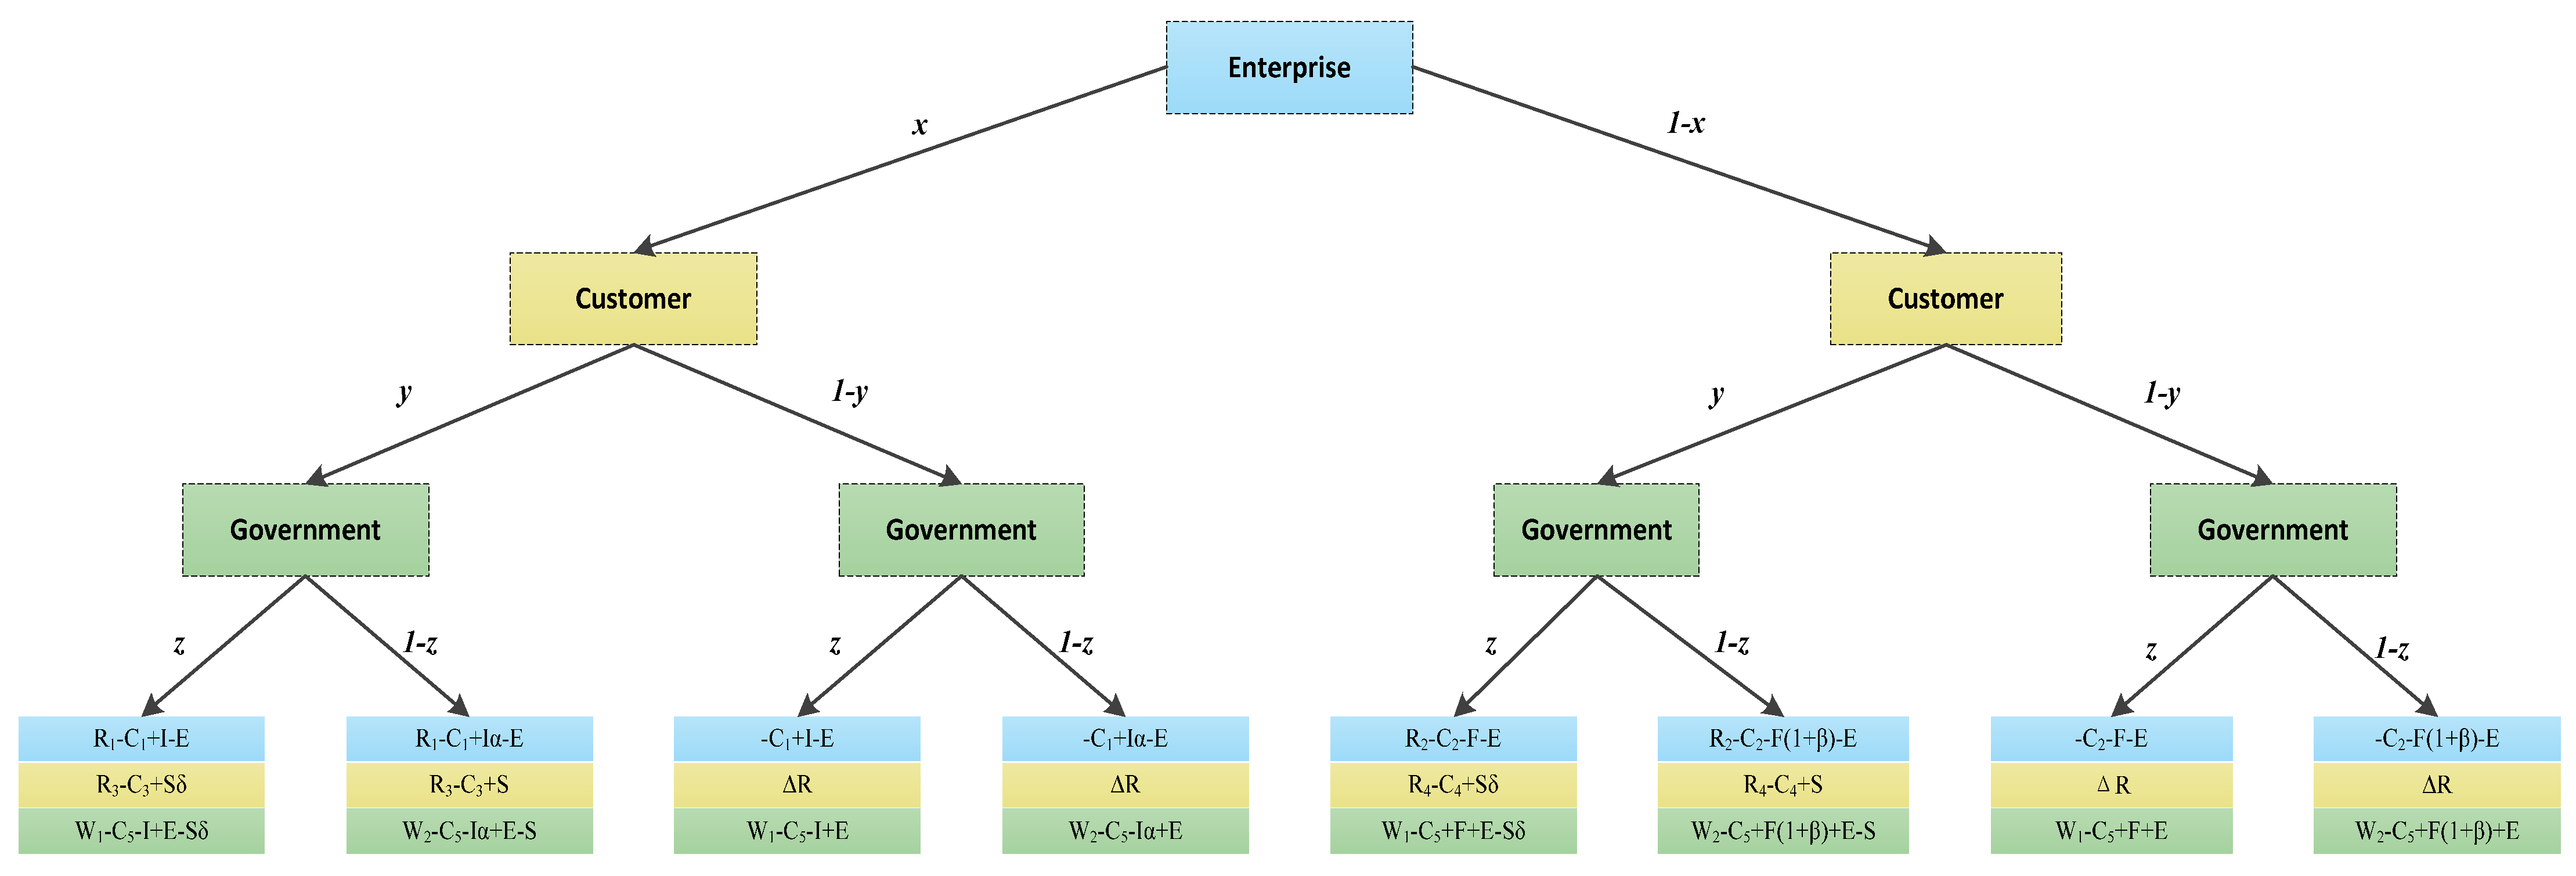
Based on the above assumptions, enterprises, consumers, and the government make decisions independently, and the strategic behaviors of the three parties interact in the market, jointly determining the outcome of the game. The payoff matrix of the game is shown in Table 2, and the payoff tree of the evolutionary game is shown in Figure 2.

4. Evolutionary Stable Strategy Analysis

4.1. Firm Replication Dynamic Equation and Behavioral Strategy Analysis

For enterprises, the expected return from choosing substantive green innovation is E X 1 , the expected return from choosing strategic green innovation is E X 2 , and the average expected return is E X ¯ , respectively, in Equations (1)–(3).
E X 1 = y z ( R 1 C 1 + I E ) + y ( 1 z ) ( R 1 C 1 + I α E ) + ( 1 y ) z ( C 1 + I E )     + ( 1 y ) ( 1 z ) ( C 1 + I α E )
E X 2 = y z ( R 2 C 2 F E ) + y ( 1 z ) R 2 C 2 F ( 1 + β ) E     + ( 1 y ) z ( C 2 F E ) + ( 1 y ) ( 1 z ) C 2 F ( 1 + β ) E
E X ¯ = x E X 1 + ( 1 x ) E X 2    = ( x 1 ) C 2 + E + F ( 1 + β ) R 2 y F β z x C 1 + E I α R 1 y I ( 1 α ) z
According to evolutionary game theory, the replication dynamic equation for the probability of enterprises selecting substantive green innovation x can be expressed as Equation (4):
F ( x ) = d x d t = x ( E X 1 E X ¯ ) = x ( 1 x ) ( E X 1 E X 2 )    = x ( 1 x ) C 2 C 1 + F ( 1 + β ) + I α + ( R 1 R 2 ) y + ( I I α F β ) z
According to the stability theorem of differential equations, for the probability of enterprises choosing substantive green innovation to be in a stable state, the following must be satisfied: F ( x ) = 0   and   F ( x ) < 0 , take the first-order partial derivative of F ( x ) to be Equation (5):
F ( x ) = ( 1 2 x ) C 2 C 1 + F ( 1 + β ) + I α + ( R 1 R 2 ) y + ( I I α F β ) z
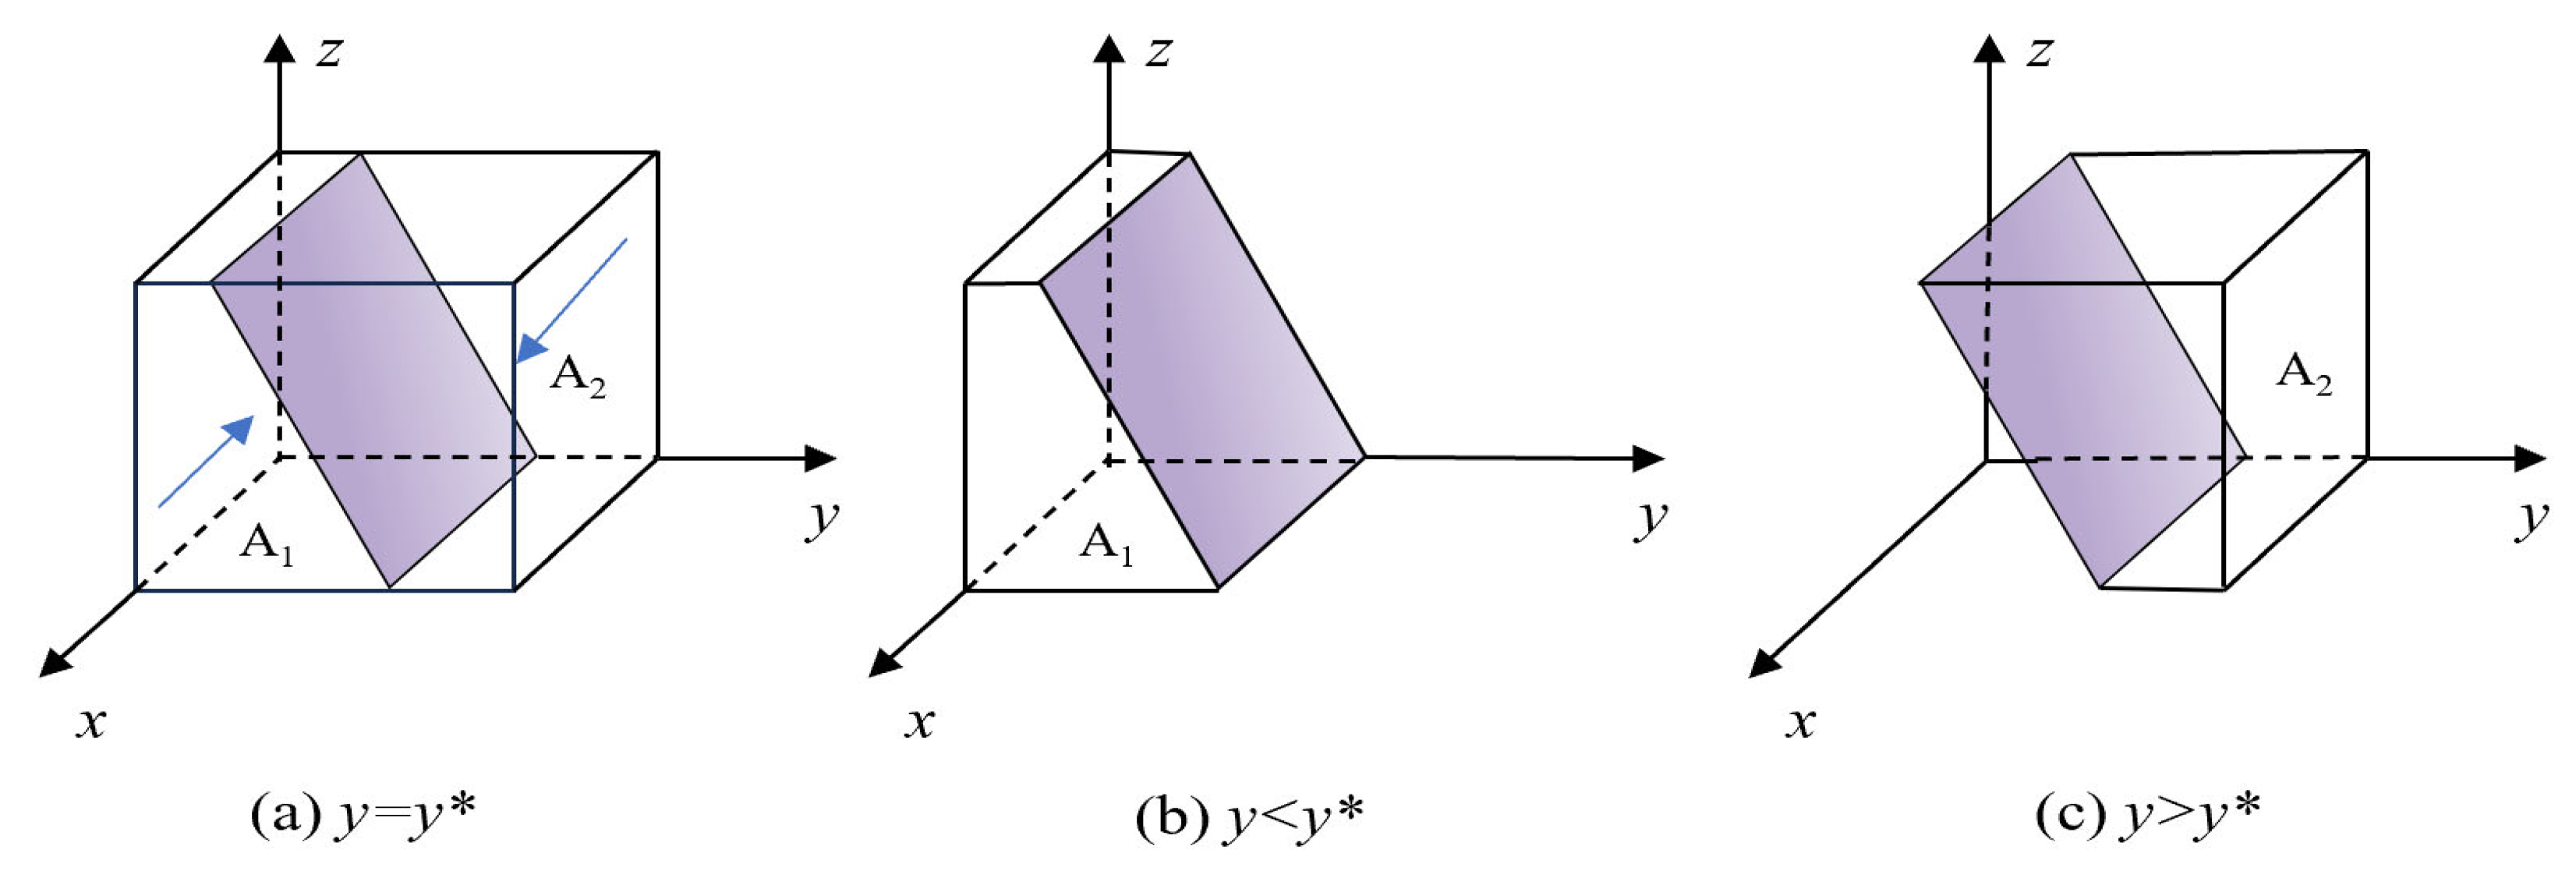
  • When y = y = C 2 C 1 + F ( 1 + β ) + I α + ( I I α F β ) z R 2 R 1 , whatever x 0 , 1 , F ( x ) 0 , enterprises cannot determine a stable policy.
  • When 0 < y < y , x = 0 is an evolutionarily stable strategy; when y < y < 1 , x = 1 is an evolutionarily stable strategy. Representing the above conclusions in a three-dimensional coordinate system, we can obtain the dynamic evolutionary trend of enterprises’ green innovation behavior, as shown in Figure 3.
Figure 3 shows that the probability of enterprises implementing strategic green innovation is the volume V A 1 of A 1 , and the probability of implementing substantive green innovation is the volume V A 2 of A 2 , calculated as Equations (6) and (7):
V A 1 = 0 1 0 1 C 2 C 1 + F ( 1 + β ) + I α + ( I I α F β ) z R 2 R 1 d z d x      = 2 ( C 2 C 1 + F ) ( I + I α + F β ) 2 ( R 1 R 2 )
V A 2 = 1 V A 1 = 2 ( C 2 C 1 + F ) + ( I + I α + F β ) 2 ( R 1 R 2 ) + 1
Inference 1.
By taking the first-order partial derivative of each element involved in the  V A 2  equation, we can obtain V A 2 R 1 > 0 ,  V A 2 R 2 < 0 ,  V A 2 C 1 < 0 ,  V A 2 C 2 > 0 ,  V A 2 F > 0 ,  V A 2 I > 0 ; see Appendix A for detailed derivations. From this, it can be deduced that the probability of an enterprise choosing substantive green innovation is positively correlated with the benefits of substantive green innovation, the strategic green innovation’s costs, the government’s rewards for substantive green innovation, and the penalties for strategic innovation, and negatively correlated with the benefits of strategic green innovation and the costs of substantive green innovation. This means that the government can guide enterprises to shift from strategic green innovation to substantive green innovation by adjusting the reward and penalty mechanisms promptly.

4.2. Consumers’ Replicator Dynamic Equation and Behavioral Strategy Analysis

For consumers, the expected payoffs for choosing to purchase green products, choosing not to purchase green products, and the average expected payoff are E Y 1 , E Y 2 , and E Y ¯ , respectively, Equations (8)–(10):
E Y 1 = x z ( R 3 C 3 + S δ ) + x ( 1 z ) ( R 3 C 3 + S )     + ( 1 x ) z ( R 4 C 4 + S δ ) + ( 1 x ) ( 1 z ) ( R 4 C 4 + S )
E Y 2 = Δ R
E Y ¯ = y E Y 1 + ( 1 y ) E Y 2    = Δ R ( 1 y ) + y ( R 4 C 4 + S ) ( R 4 C 4 R 3 + C 3 ) x ( S S δ ) z
Similarly, the replicator dynamics equation for the probability of consumers purchasing green products can be expressed as Equation (11):
F ( y ) = d y d t = y ( E Y 1 E Y ¯ ) = y ( 1 y ) ( E Y 1 E Y 2 )    = y ( y 1 ) C 4 + Δ R R 4 S + ( R 4 C 4 R 3 + C 3 ) x ( S δ S ) z
According to the differential equation stability theorem, for the probability of consumers choosing to purchase green products to be stable, it must satisfy its first-order partial derivative with respect to F ( y ) and the following condition must be met: F ( y ) = 0   a n d   F ( y ) < 0 . Take the first-order partial derivative of F ( y ) as Equation (12):
F ( y ) = ( 2 y 1 ) C 4 + Δ R R 4 S + ( C 3 C 4 R 3 + R 4 ) x ( S δ S ) z
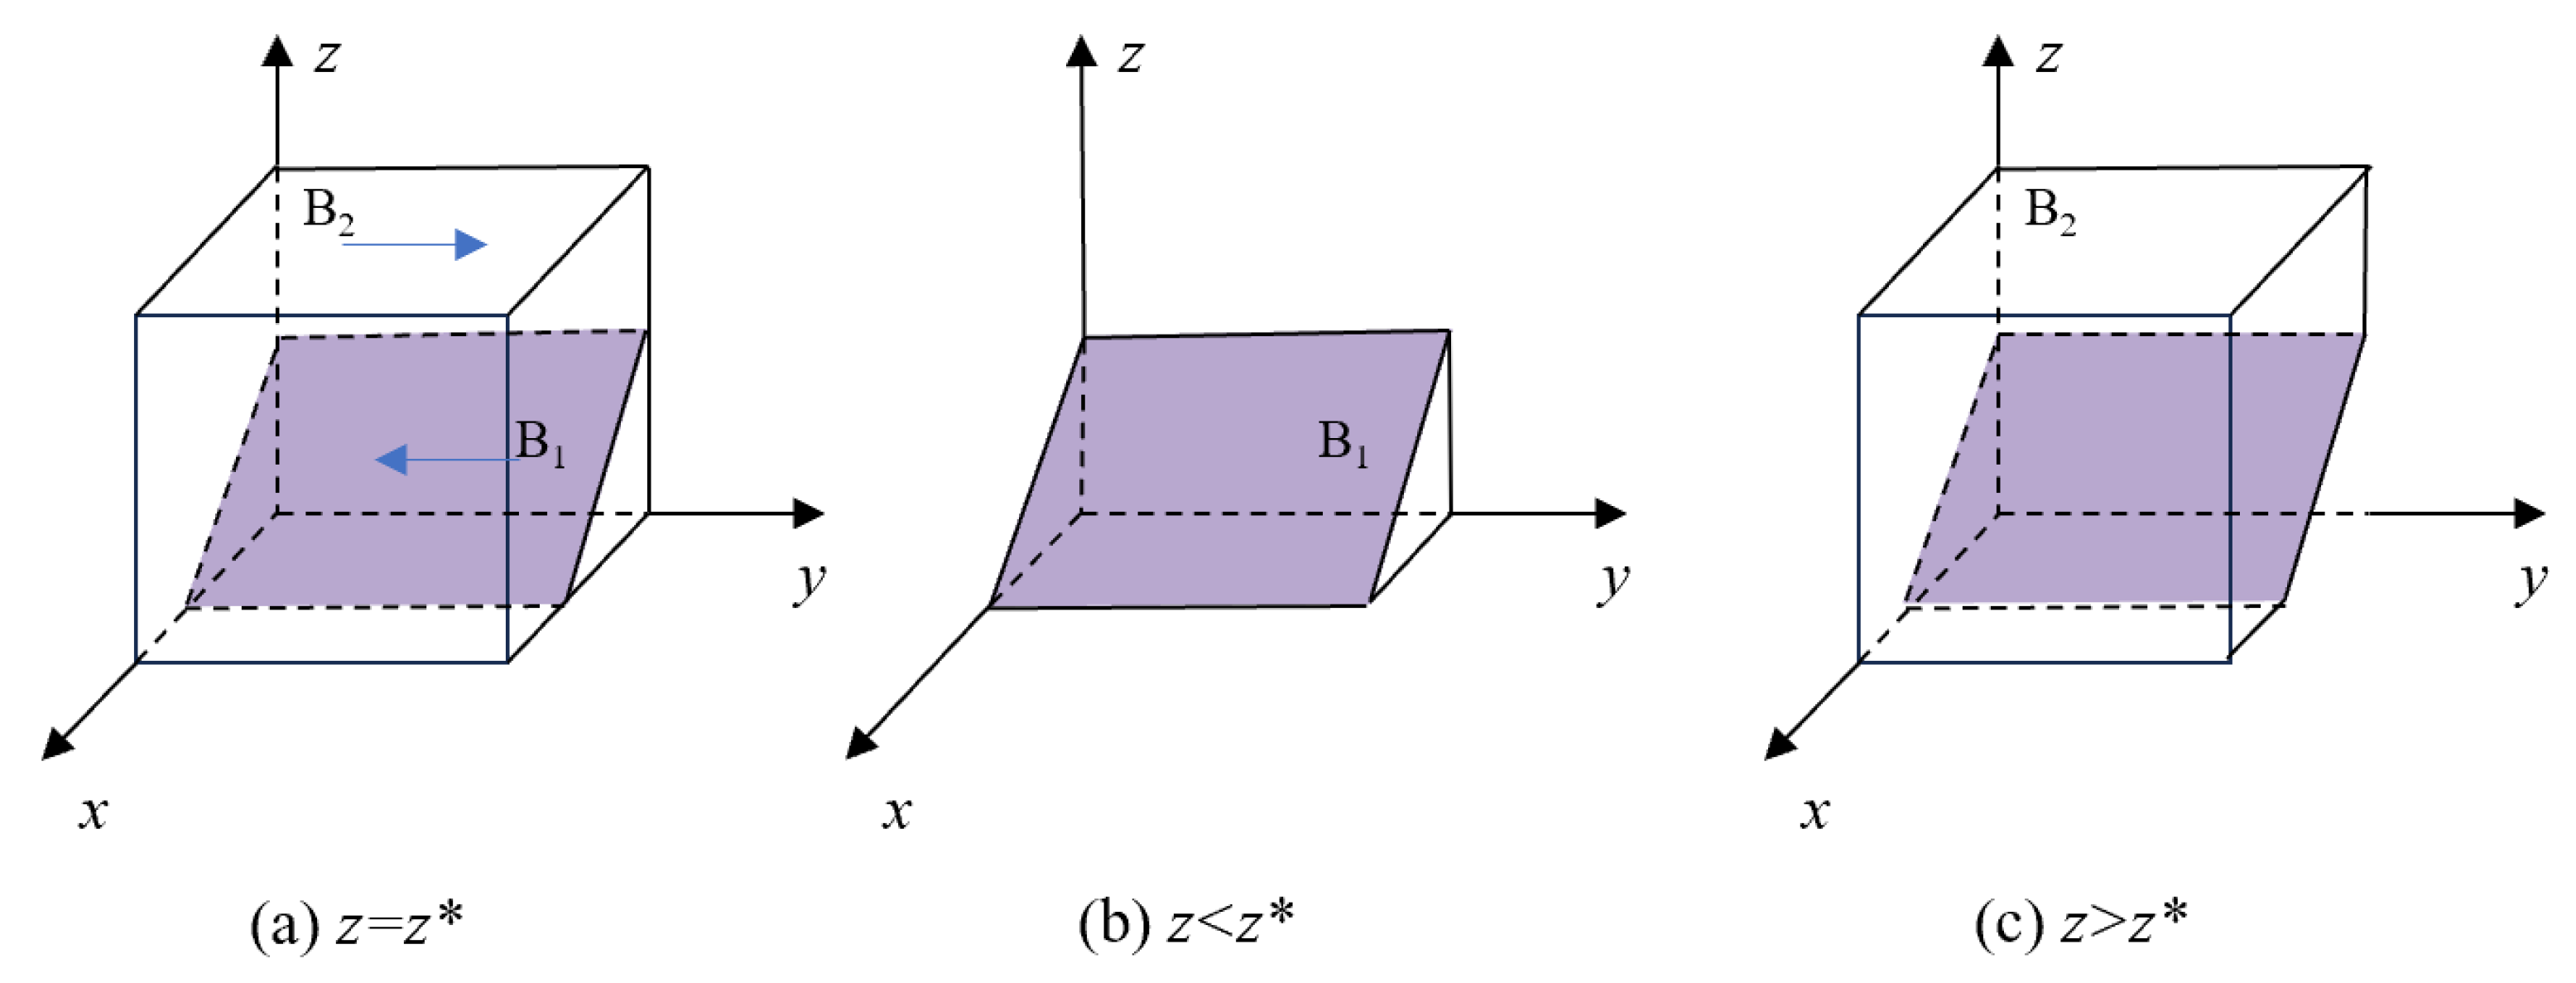
  • When z = z = C 4 + Δ R R 4 S + ( C 3 C 4 R 3 + R 4 ) x S δ S , whatever y 0 , 1 , F ( y ) 0 , and the consumer cannot settle on a stable strategy;
  • When 0 < z < z , y = 0 is an evolutionarily stable strategy; when z < z < 1 , y = 1 is an evolutionarily stable strategy.
Plotting the above conclusions in a three-dimensional coordinate system reveals the dynamic evolution trend of consumer behavior with regards to the purchase of green behavior, as depicted in Figure 4.
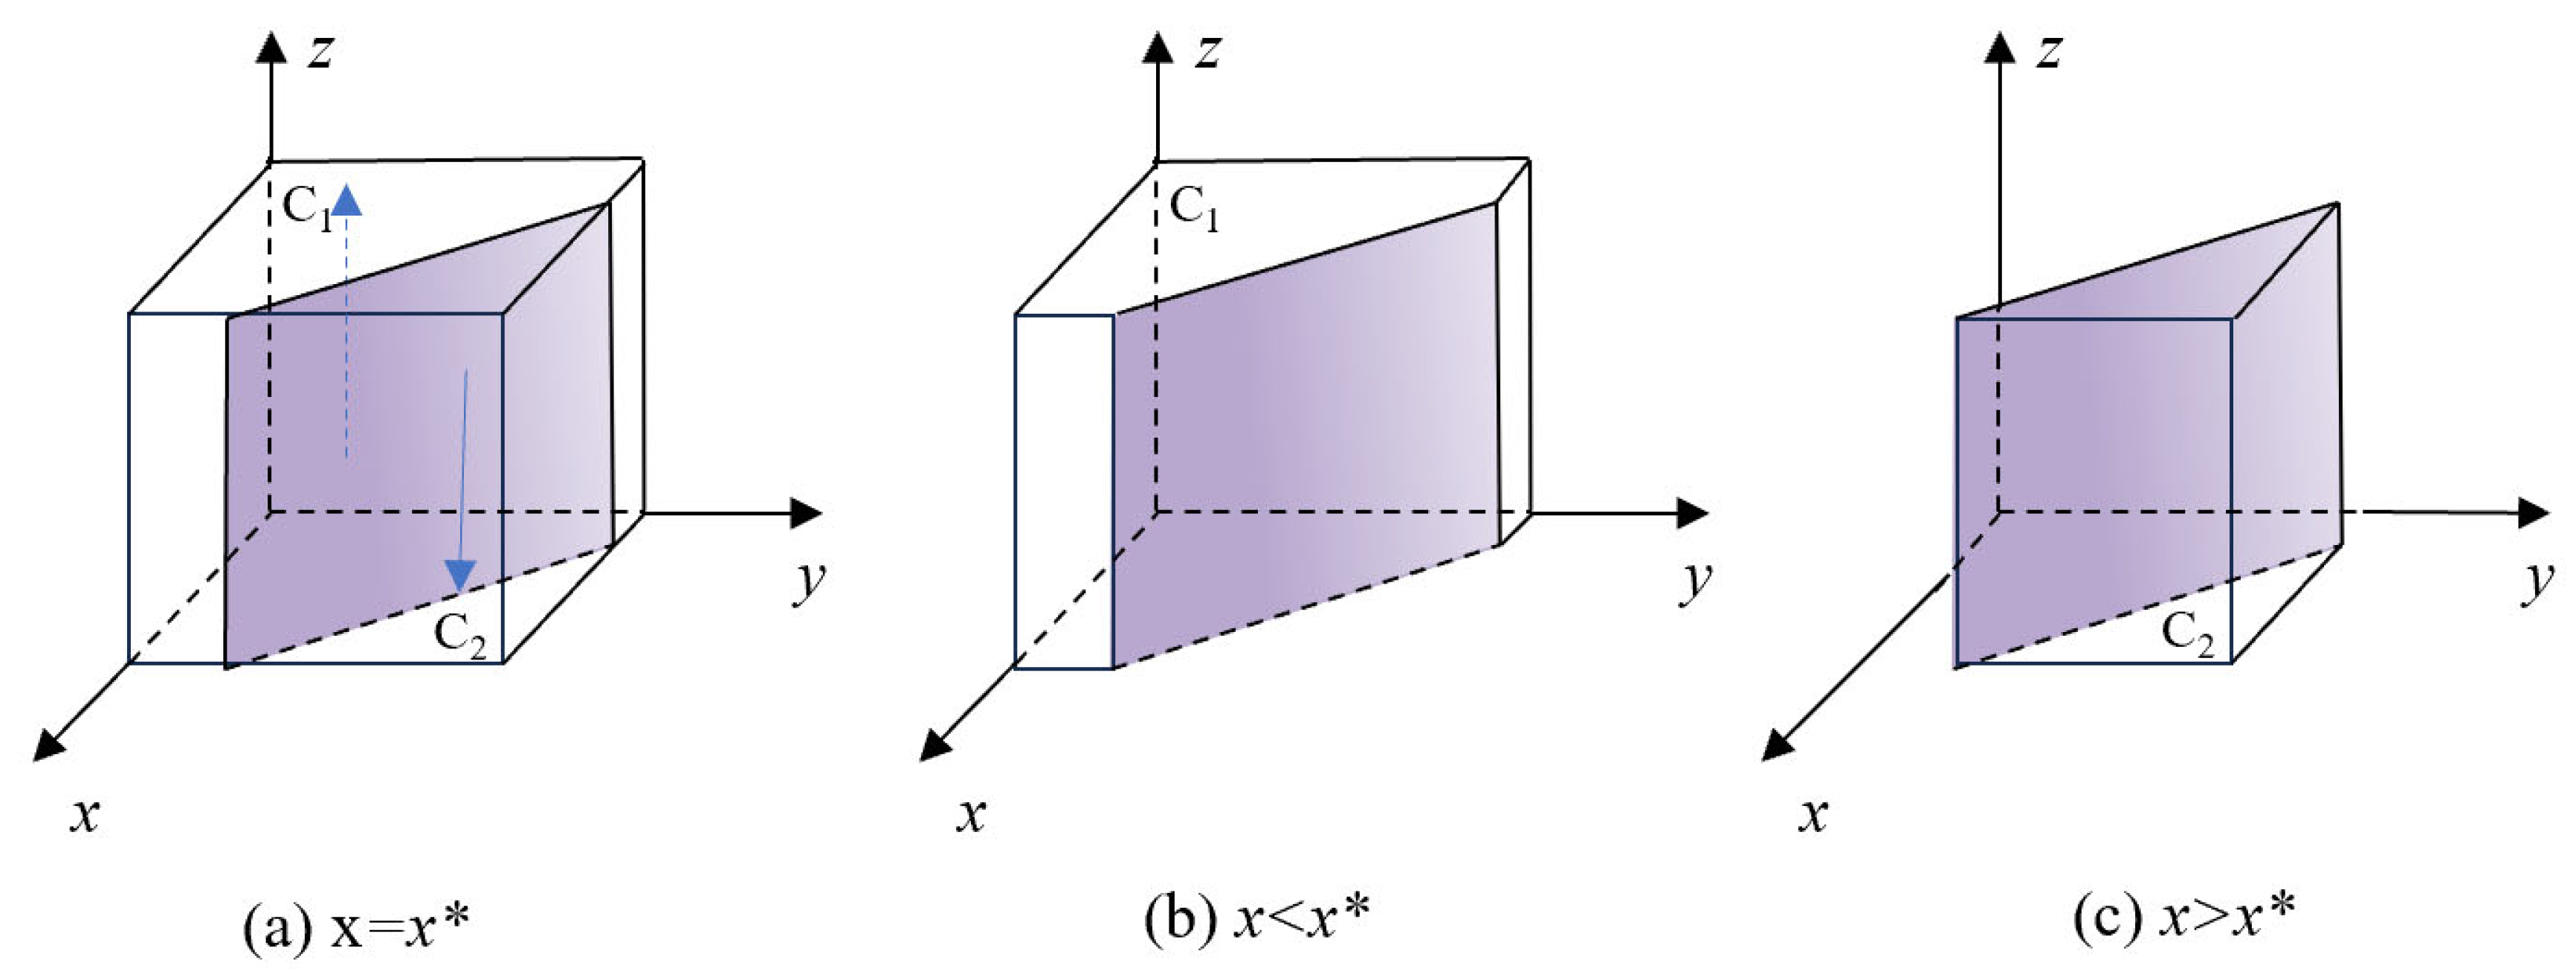
Figure 4 shows that the cross-section passes through a point ( C 4 + Δ R R 4 S R 3 C 3 R 4 + C 4 , 0 , 0 ) , where the volume V B 1 , corresponding to the probability B 1 that the consumer chooses not to purchase green products, and the volume V B 2 , corresponding to the probability B 2 that the consumer chooses to purchase green products, are calculated as Equations (13) and (14):
V B 1 = 0 1 0 C 4 + Δ R R 4 S R 3 C 3 R 4 + C 4 C 4 + Δ R R 4 S + ( C 3 C 4 R 3 + R 4 ) x S δ S d x d y     = C 4 + Δ R R 4 S 2 2 ( S S δ ) ( C 3 C 4 R 3 + R 4 )
V B 2 = 1 V B 1    = 1 - C 4 + Δ R R 4 S 2 2 ( S S δ ) ( C 3 C 4 R 3 + R 4 )
Inference 2.
By taking the first-order partial derivative of each element involved in the equation, we obtain  V B 2 S > 0 ,  V B 2 R 3 < 0 ,  V B 2 C 4 < 0 ,  V B 2 Δ R < 0 ; see Appendix A for detailed derivations. From this, it can be deduced that the probability of consumers choosing to purchase green products is positively correlated with the green consumption subsidies provided by the government and the social benefits of purchasing “Truly green” products, and negatively correlated with the net income of purchasing ordinary products and the cost of purchasing “greenwashing” products. This means that consumers’ green purchasing decisions are jointly driven by economic benefits, social value, and risk perception, and the green consumption subsidies provided by the government can directly promote consumer purchasing.

4.3. Government Replicator Dynamic Equation and Behavioral Strategy Analysis

For the government, its expected payoff from choosing innovative regulation is E Z 1 , its expected payoff from choosing conventional regulation is E Z 2 , and its average expected payoff is E Z ¯ , respectively, Equations (15)–(17):
E Z 1 = x y ( W 1 C 5 I + E S δ ) + x ( 1 y ) ( W 1 C 5 I + E ) + ( 1 x ) y ( W 1 C 5     + F + E S δ ) + ( 1 x ) ( 1 y ) ( W 1 C 5 + F + E )
E Z 2 = x y ( W 2 C 5 I α + E S ) + x ( 1 y ) ( W 2 C 5 I α + E ) + ( 1 x ) y     W 2 C 5 + F ( 1 + β ) + E S + ( 1 x ) ( 1 y ) W 2 C 5 + F ( 1 + β ) + E
E Z ¯ = z E Z 1 + ( 1 z ) E Z 2     = ( z 1 ) C 5 E W 2 F F β + ( F + F β + I α ) x + S y     z C 5 E F W 1 + ( F + I ) x + S δ y
Similarly, the replicator dynamic equation for the probability z of the government choosing innovative regulation can be expressed as Equation (18):
F ( z ) = d z d t = z ( E Z 1 E Z ¯ ) = z ( 1 z ) ( E Z 1 E Z 2 )    = z ( 1 z ) W 1 W 2 F β ( I I α F β ) x ( S δ S ) y
According to the stability theorem of differential equations, for the probability of the government choosing innovative regulation to be stable, the following conditions must be met: F ( z ) = 0   and   F ( z ) < 0 . These differential equations operationalize the core tenet of evolutionary game theory—strategy adoption rates increase when expected payoffs exceed the population average—thereby relaxing the assumption of perfect rationality and grounding the model in empirically observed bounded rationality. Take the first-order partial derivative of F ( z ) as Equation (19):
F ( z ) = ( 1 2 z ) W 1 W 2 F β ( I I α F β ) x ( S δ S ) y
  • When x = x = W 1 W 2 F β ( S δ S ) y I I α F β , whatever z 0 , 1 , F ( z ) 0 , and government regulation cannot determine a stable strategy.
  • When 0 < x < x , z = 1 is an evolutionarily stable strategy; when x < x < 1 , z = 0 is an evolutionarily stable strategy.
Plotting the above conclusions in a three-dimensional coordinate system reveals the dynamic evolution trend of the government sector’s innovative regulation behavior, as shown in Figure 5.
Figure 5 indicates that the volume V C 1 , for which the probability of the government choosing innovative regulation is C 1 , and the volume V C 2 , for which the probability of the government choosing conventional regulation is C 2 , are calculated as Equations (20) and (21):
V C 1 = 0 1 0 1 W 1 W 2 F β ( S δ S ) y I I α F β d y d z     = 2 W 1 2 W 2 2 F β + S S δ 2 ( I I α F β )
V C 2 = 1 V C 1    = 2 W 2 2 W 1 + 2 F β + S δ S 2 ( I I α F β ) + 1
Inference 3.
By taking the first-order partial derivative of each element involved in the  V C 1  equation, we obtain  V C 1 W 1 > 0 ,  V C 1 W 2 < 0 ,  V C 1 F > 0 ,  V C 1 S < 0 ,  V C 1 I < 0 ; see Appendix A for detailed derivations. It can be deduced that the probability of the government choosing innovative regulation is positively correlated with the social welfare it generates and the penalties given to strategic green innovation, and negatively correlated with the social welfare of conventional regulation and the consumption subsidies given to consumers purchasing green products. This means that when there is excessive enterprise “greenwashing” behavior leading to the failure of consumer subsidy policies, the government will optimize the allocation of resources and increase the intensity of innovative regulation.

4.4. Stability Analysis of Equilibrium Points in a Three-Party Evolutionary Game System

Based on the above analysis, the three-dimensional dynamic system for the evolutionary game is given by Equation (22):
F ( x ) = x ( 1 x ) C 2 C 1 + F β + I α + ( R 1 R 2 ) y + ( F + I F β I α ) z F ( y ) = y ( 1 y ) C 4 + D 4 + Δ R R 4 S + ( C 3 C 4 + D 2 D 4 R 3 + R 4 + S S δ ) x + ( D 3 D 4 ) z + ( D 1 D 2 D 3 + D 4 ) x z F ( z ) = z ( 1 z ) F + W 1 W 2 F β + ( F β F + I α I ) x
When F ( x ) = 0 , F ( y ) = 0 , F ( z ) = 0 , the local stable equilibrium points are, respectively, E 1 ( 0 , 0 , 0 ) , E 2 ( 0 , 0 , 1 ) , E 3 ( 0 , 1 , 0 ) , E 4 ( 0 , 1 , 1 ) , E 5 ( 1 , 0 , 0 ) , E 6 ( 1 , 0 , 1 ) , E 7 ( 1 , 1 , 0 ) , and E 8 ( 1 , 1 , 1 ) . The Jacobian matrix of the three-party evolutionary game system is Equation (23):
J = J 1 J 2 J 3 J 4 J 5 J 6 J 7 J 8 J 9 = F ( x ) x F ( x ) y F ( x ) z F ( y ) x F ( y ) y F ( y ) z F ( z ) x F ( z ) y F ( z ) z = ( 1 2 x ) C 2 C 1 + F ( 1 + β ) + I α + ( R 1 R 2 ) y + ( I I α F β ) z x ( 1 x ) ( R 1 R 2 ) x ( x 1 ) ( F β I + I α ) y ( y 1 ) ( C 3 C 4 R 3 + R 4 ) ( 2 y 1 ) C 4 + Δ R R 4 S + ( R 4 C 4 R 3 + C 3 ) x ( S δ S ) z y ( 1 y ) ( S δ S ) z ( z 1 ) ( I I α F β ) z ( z 1 ) ( S δ S ) ( 1 2 z ) W 1 W 2 F β ( I I α F β ) x ( S δ S ) y
According to the Lyapunov stability theorem, for any pure policy equilibrium point, when all eigenvalues of the Jacobian matrix are less than 0, the equilibrium point is asymptotically stable; when all eigenvalues are greater than 0, the equilibrium point is unstable; and when the eigenvalues are positive and negative, the equilibrium point is a saddle point. According to the replication dynamic equation, the eigenvalues of the Jacobian matrix are shown in Table 3.

5. Simulation Analysis

Based on actual conditions and initial parameter constraints, and incorporating the simulation parameter setting methods from the relevant literature on enterprise green innovation behavior analysis, consumer purchase behavior analysis, and government regulation behavior analysis, the following numerical assumptions are made for the relevant parameters. Array 1: R 1 = 160 , R 2 = 120 , C 1 = 80 , C 2 = 50 , R 3 = 100 , R 4 = 50 , C 3 = 50 , C 4 = 40 , Δ R = 30 , C 5 = 20 , W 1 = 100 , W 2 = 75 , I = 15 , F = 10 , S = 15 , E = 3 , α = 0.4 , β = 0.7 , and δ = 2 . The probability of selecting any strategy in the initial state is x = 0.5 , z = 0.5 . The details of the MATLAB software simulation are comprehensively documented in the Supplementary Materials.
In order to balance the external validity and mechanism observability, parameter assignment follows a dual procedure of “literature calibration–scenario demonstration”. Firstly, based on the green invention patent licensing and filing data of the National Intellectual Property Administration from 2018 to 2022 and the environmental information disclosure data of A-share listed companies in Shanghai and Shenzhen, the expected market return of substantive green innovation is set at CNY 1.6 million, representing the sum of the average patent licensing fee and product premium of leading green technologies. The strategic innovation benefit is based on the empirical results of Li et al. [35] on 176 new energy enterprises. Taking their short-term profits as approximately 75% of R 1 , it is assumed that R 2 is CNY 1.2 million. Secondly, in terms of the cost parameters, substantive innovation needs to bear the costs of real research and development, the purchase of testing equipment, and third-party certification. The estimated comprehensive cost is CNY 800,000. Strategic innovation only incurs expenditures for packaging, promotion, and document embellishments, with a cost of approximately CNY 0.3 million. The C 1 / C 2 ratio is approximately 2.7, which is consistent with the 2–3 times range provided in the OECD’s (2021) “green R&D cost variance” report and meets the model’s structural constraint of C 1 > C 2 . Finally, the government policy coefficients are set based on the upper limit of the fine of “three times the illegal gains” stipulated in the “regulations on environmental administrative penalties” and the green consumption subsidy standards of Shanghai, with a reward coefficient of α = 0.4 , a penalty coefficient of β = 0.7 , and an environmental tax rate of δ = 2 to depict the policy scenario of “high penalty and medium compensation”. The above values are intended to reveal the evolution mechanism rather than precisely predict market equilibrium. The robustness test section has conducted a ±20% sensitivity analysis on key parameters, and the qualitative conclusion of the system evolution path remains unchanged.
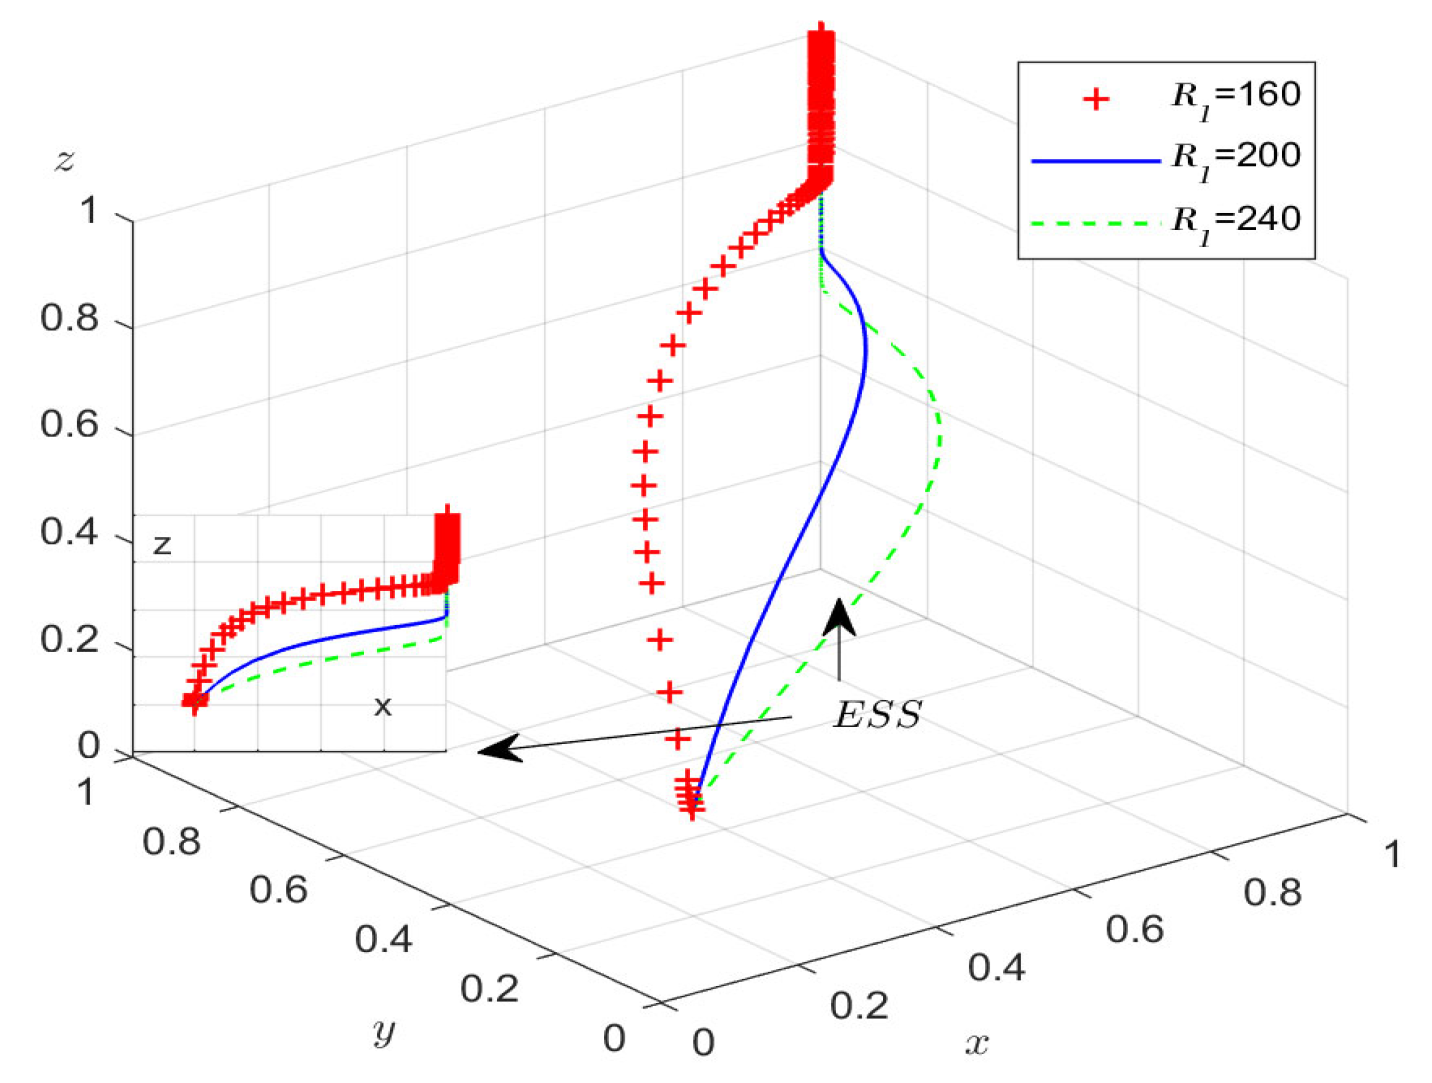
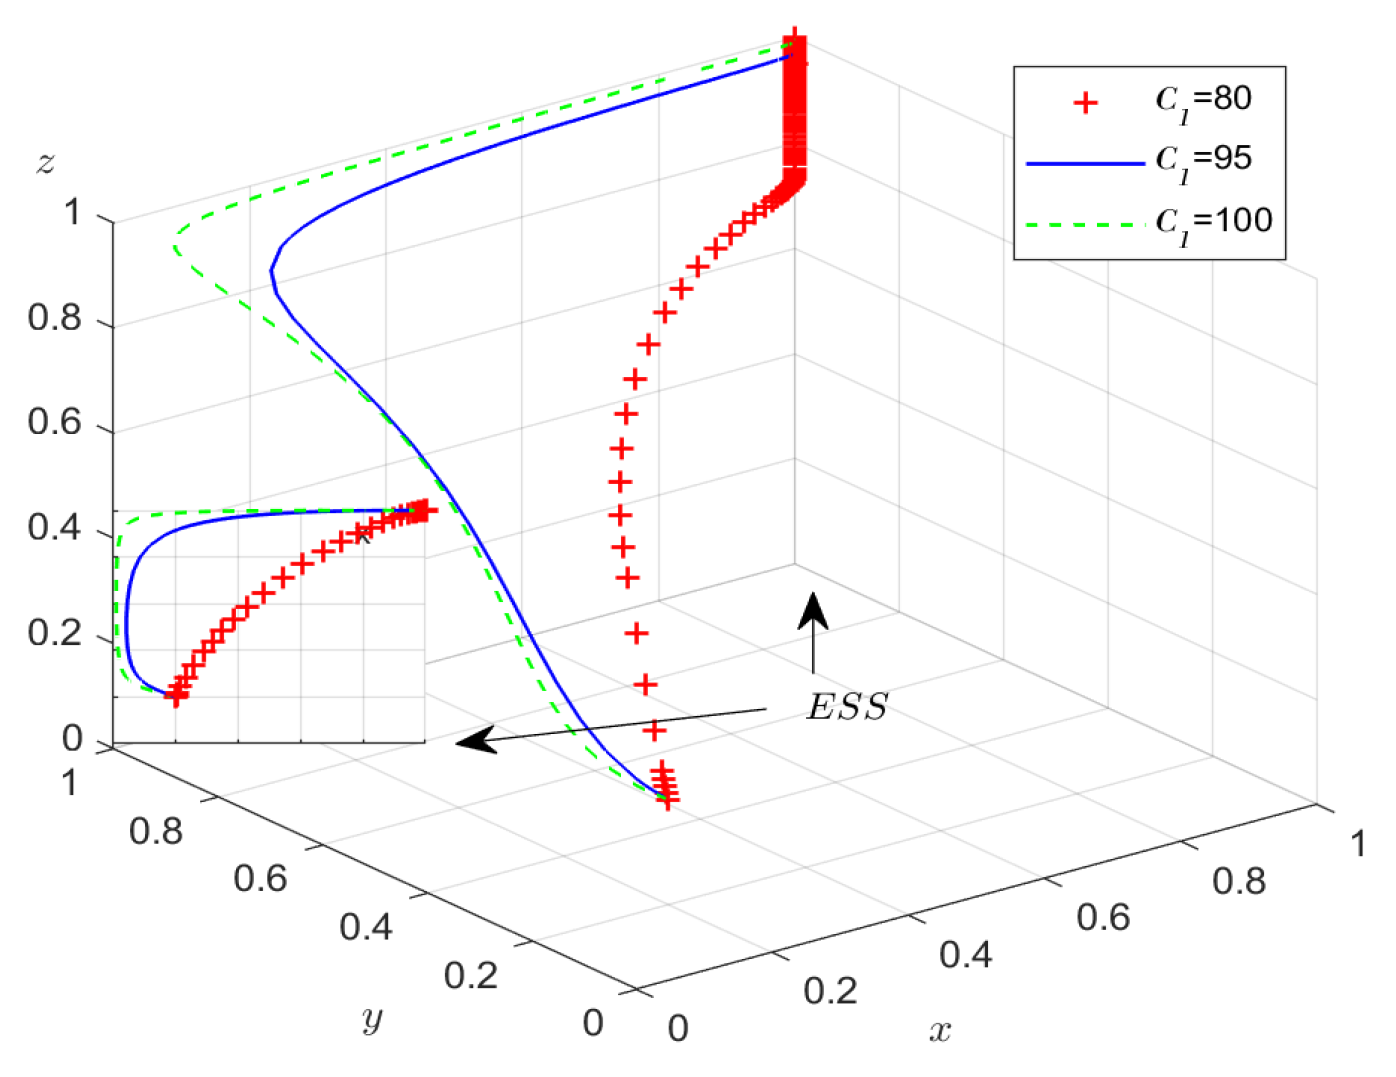
Firstly, to analyze the impact of the revenue R 1 of enterprises’ substantive green innovation on the evolutionary game process and result, R 1 is set to R 1 = 160 , 200 , 240 and the simulation results of the replication dynamic equations evolving 50 times over time are shown in Figure 6. For the costs C 1 of enterprises’ substantive green innovation, C 1 is set to C 1 = 80 , 95 , 100 , and the simulation results are shown in Figure 7.
As shown in Figure 6, during the system’s evolution to a stable point, as R 1 increases, the probability of enterprises choosing substantive green innovation rises, and the probability of the government regulation department choosing innovative regulation also increases. Therefore, the government no longer applies a “one-size-fits-all” approach to all enterprises, but instead invests more resources in enterprises with development potential or those with “Greenwashing” risks, giving more trust to truly innovative enterprises, and shifting the regulatory focus from “whether they are compliant” to “whether the innovation process is genuine and whether environmental performance is improving.” Figure 7 shows that, during the evolutionary process, as C 1 increases, the probability of consumers choosing to purchase green products rises, and the probability of the government regulation department choosing innovative regulation also increases. Therefore, consumers and regulatory authorities have formed a virtuous collaborative governance relationship, and the overall efficiency and integrity of the green products market have been significantly improved, forming an effective positive feedback reinforcement mechanism between market signals and government regulation.
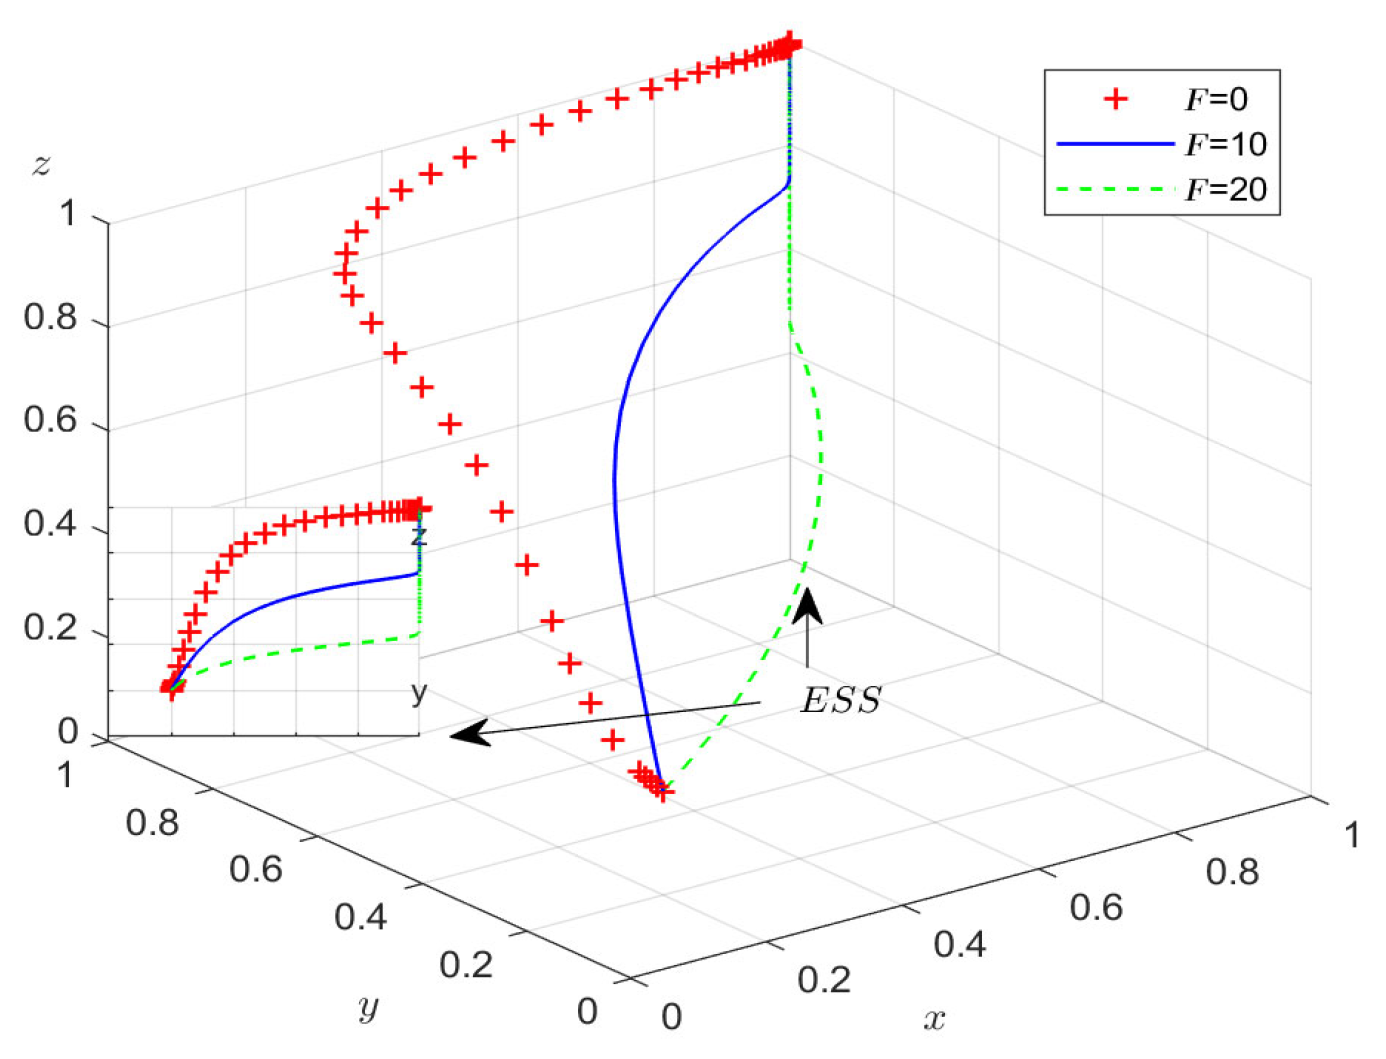
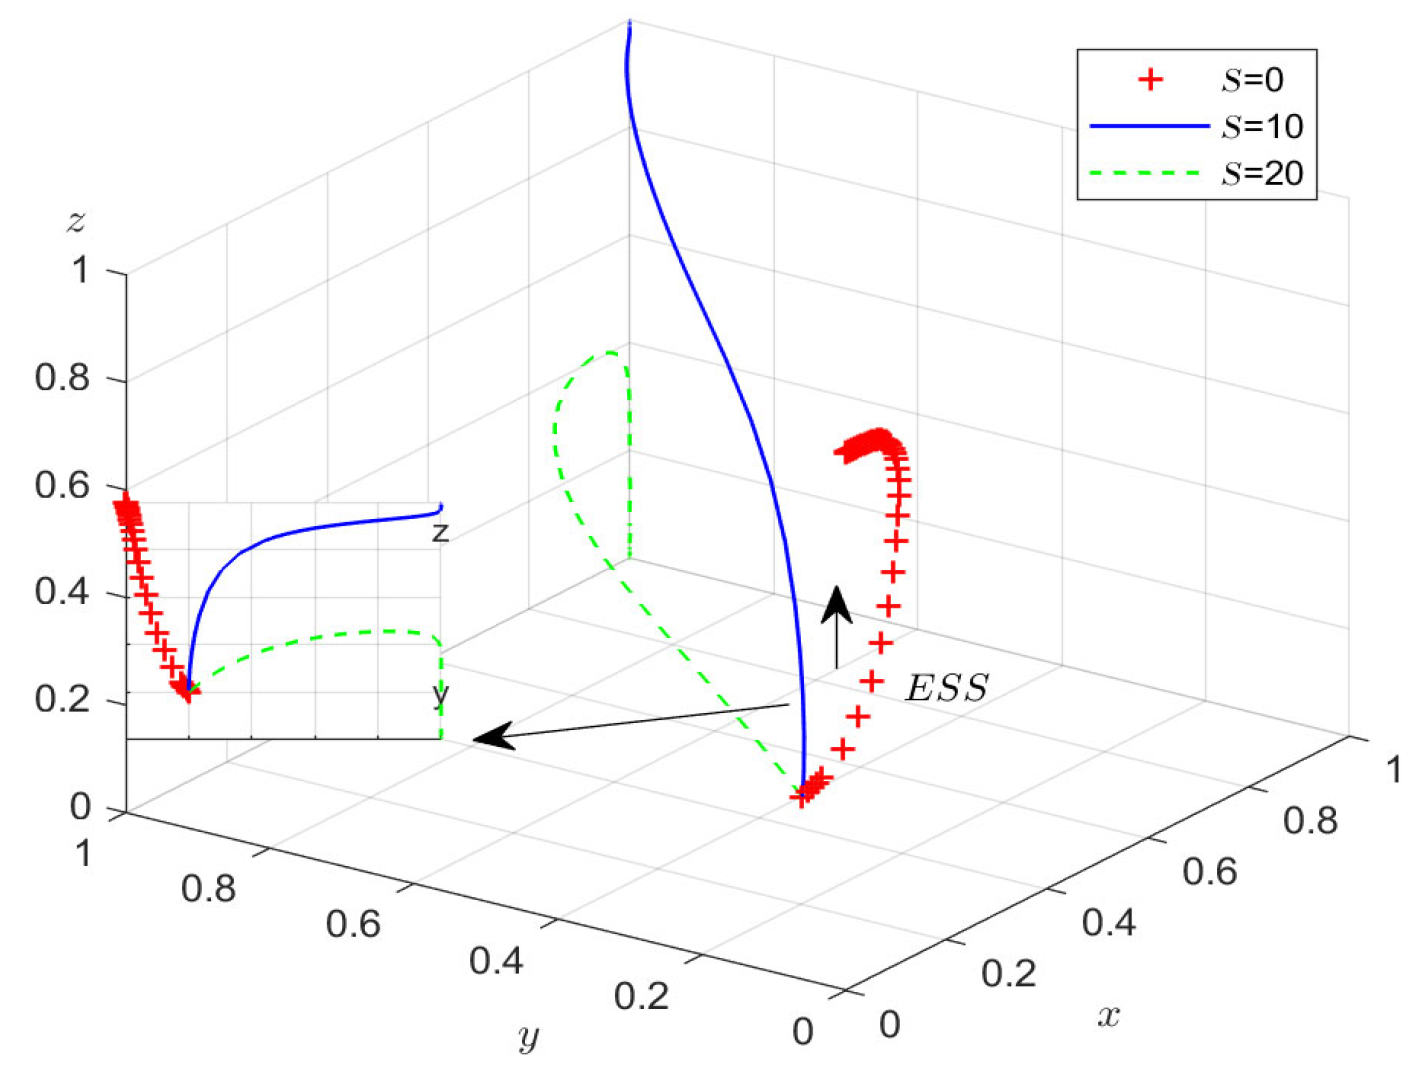
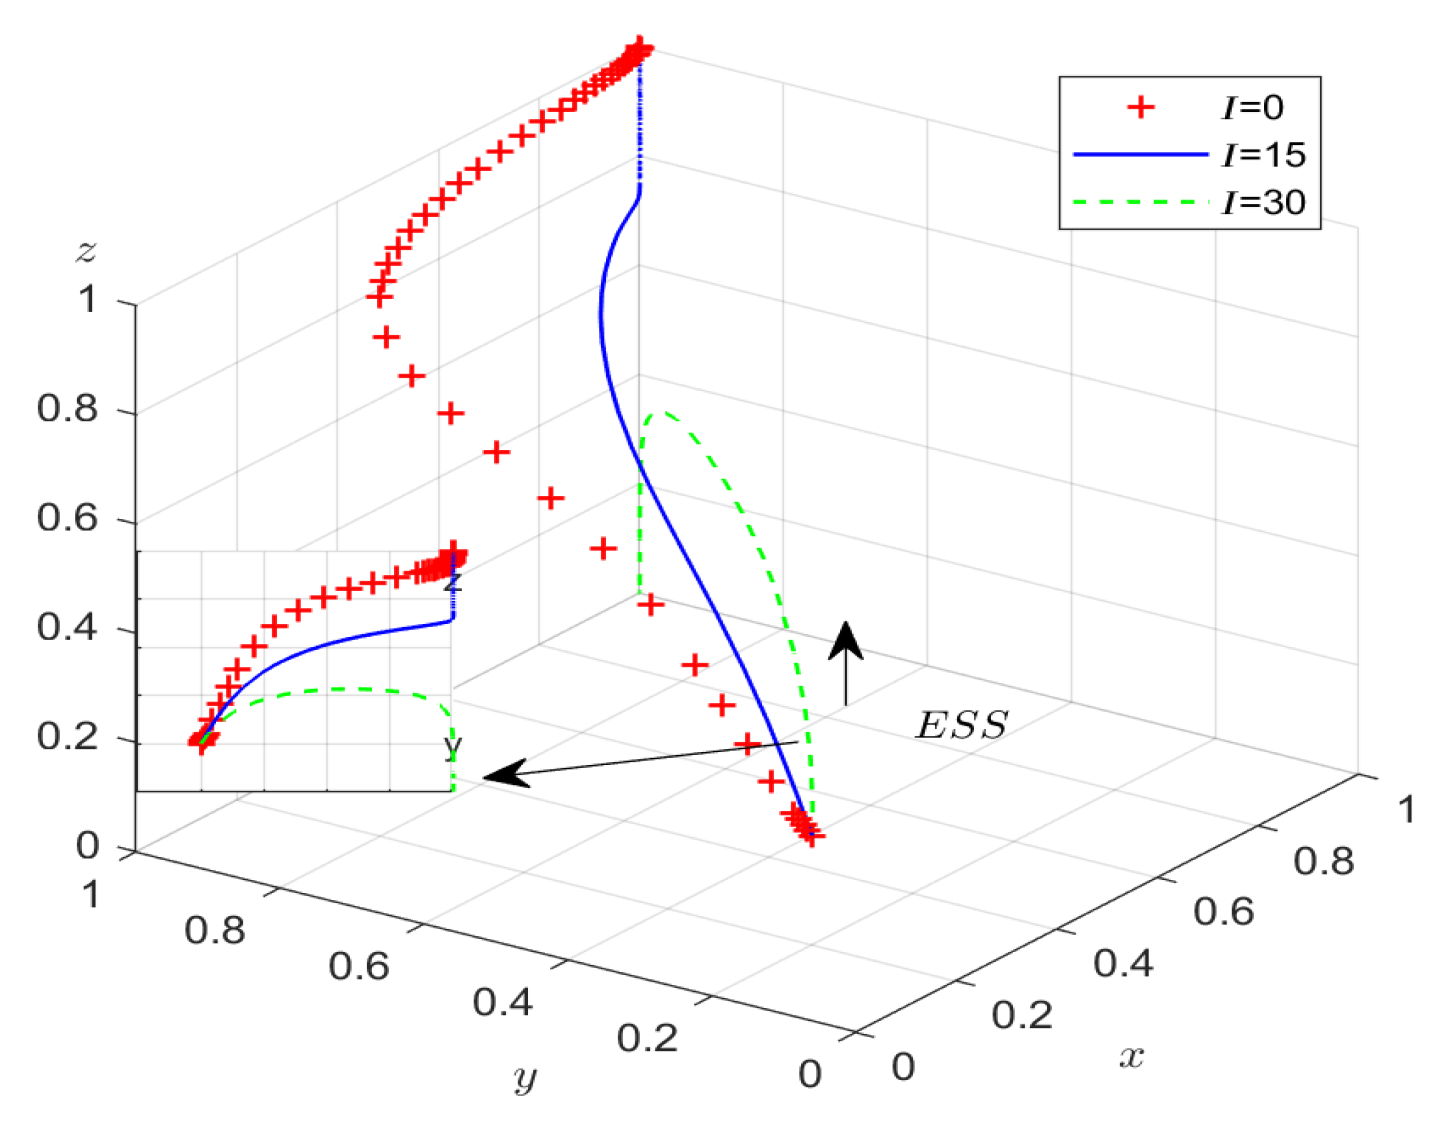
Next, assigning I = 0 , 15 , 30 , respectively, the simulation results are shown in Figure 8; assigning F = 0 , 10 , 20 , respectively, the simulation results are shown in Figure 9; and assigning S = 0 , 10 , 20 , respectively, the simulation results are shown in Figure 10. Figure 8 shows that, during the evolution process, an increase in I leads to a decrease in the probability of government innovation regulation. Figure 9 shows that, after the probability of substantive green innovation by enterprises stabilizes at 1, an increase in F leads to an increase in the probability of government innovation regulation. Figure 10 shows that, after the probability of substantive green innovation by enterprises stabilizes at 1, an increase leads to a decrease in the probability of government innovation regulation. Therefore, the government should reasonably formulate the incentive and punishment mechanism so that enterprises and the government jointly assume the responsibility of protecting the legitimate rights and interests of consumers.
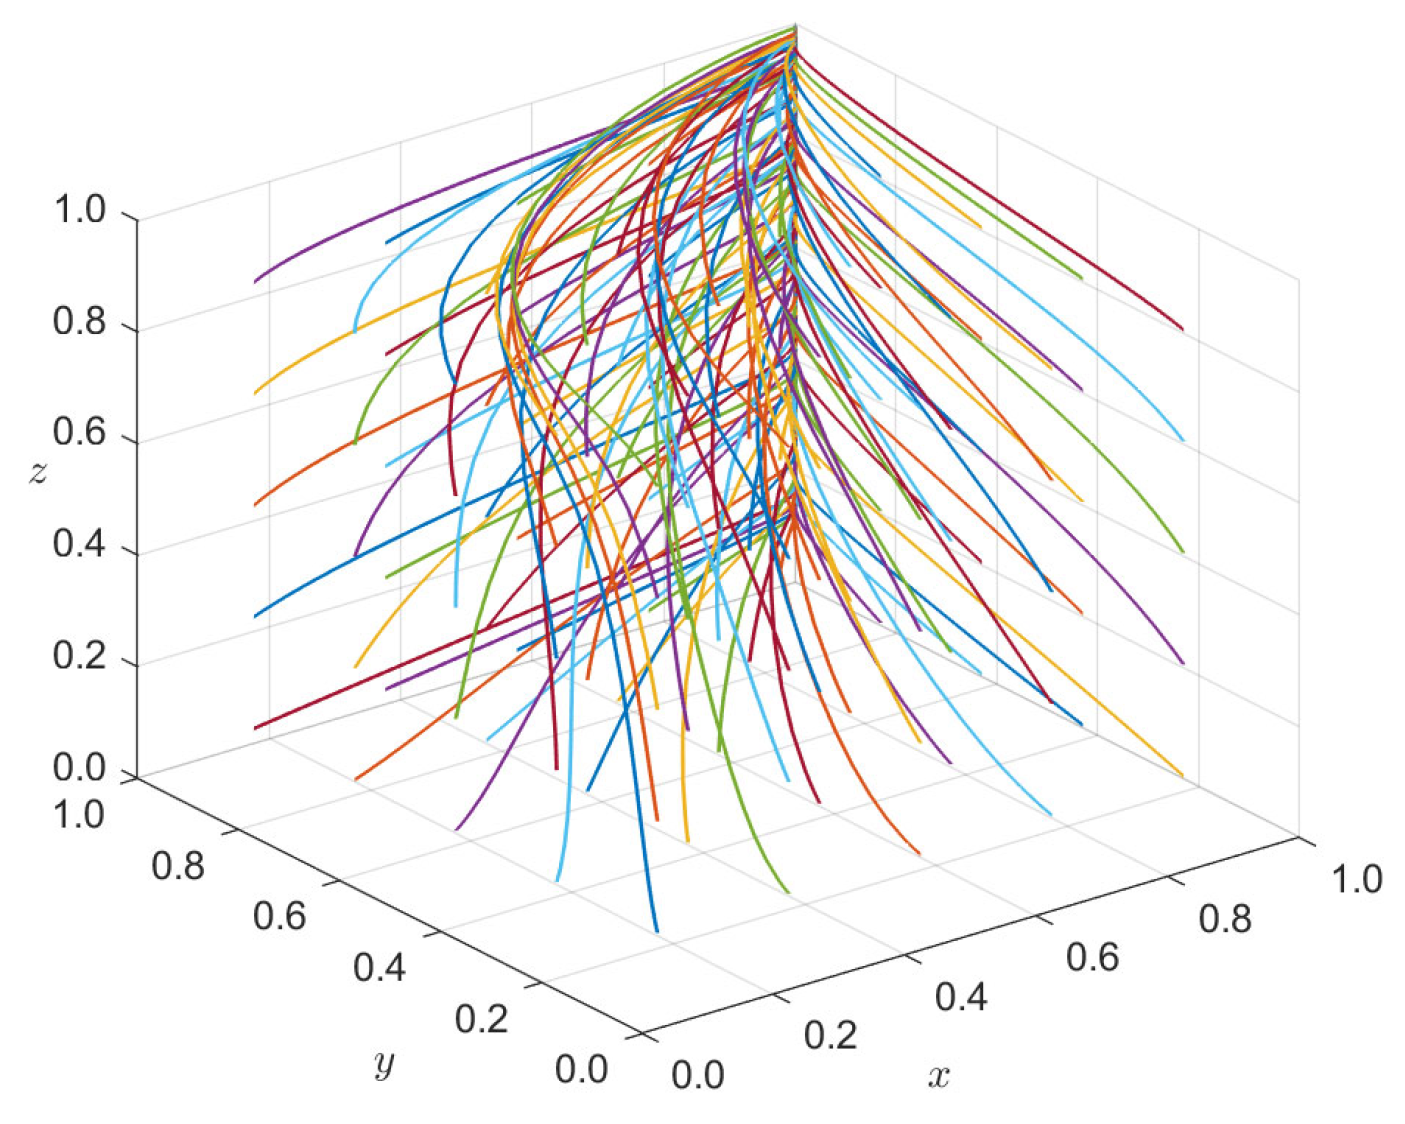
Figure 11 shows the result after 50 evolutions with W 1 = 100 . At this point, the system has only one evolutionarily stable strategy of {substantive green innovation, purchasing green products, innovative regulation}. The probability x of substantive green innovation by enterprises has risen from 0.3 to 1.0, the probability y of consumers purchasing green products has increased from 0.4 to 1.0, and the probability z of government innovation regulation has also risen from 0.2 to 1.0. The system has aggregated into an evolutionarily stable strategy. At this time, the sum of the government’s rewards for enterprises’ substantive green innovation and green subsidies for consumers under the innovative regulation policy should be higher than the sum of the rewards for enterprises’ substantive green innovation and green subsidies for consumers under the conventional regulation policy. With the support of the innovative regulation policy, the government can ensure the orderly development of enterprises’ green technology innovation by setting up a reasonable incentive and punishment mechanism.
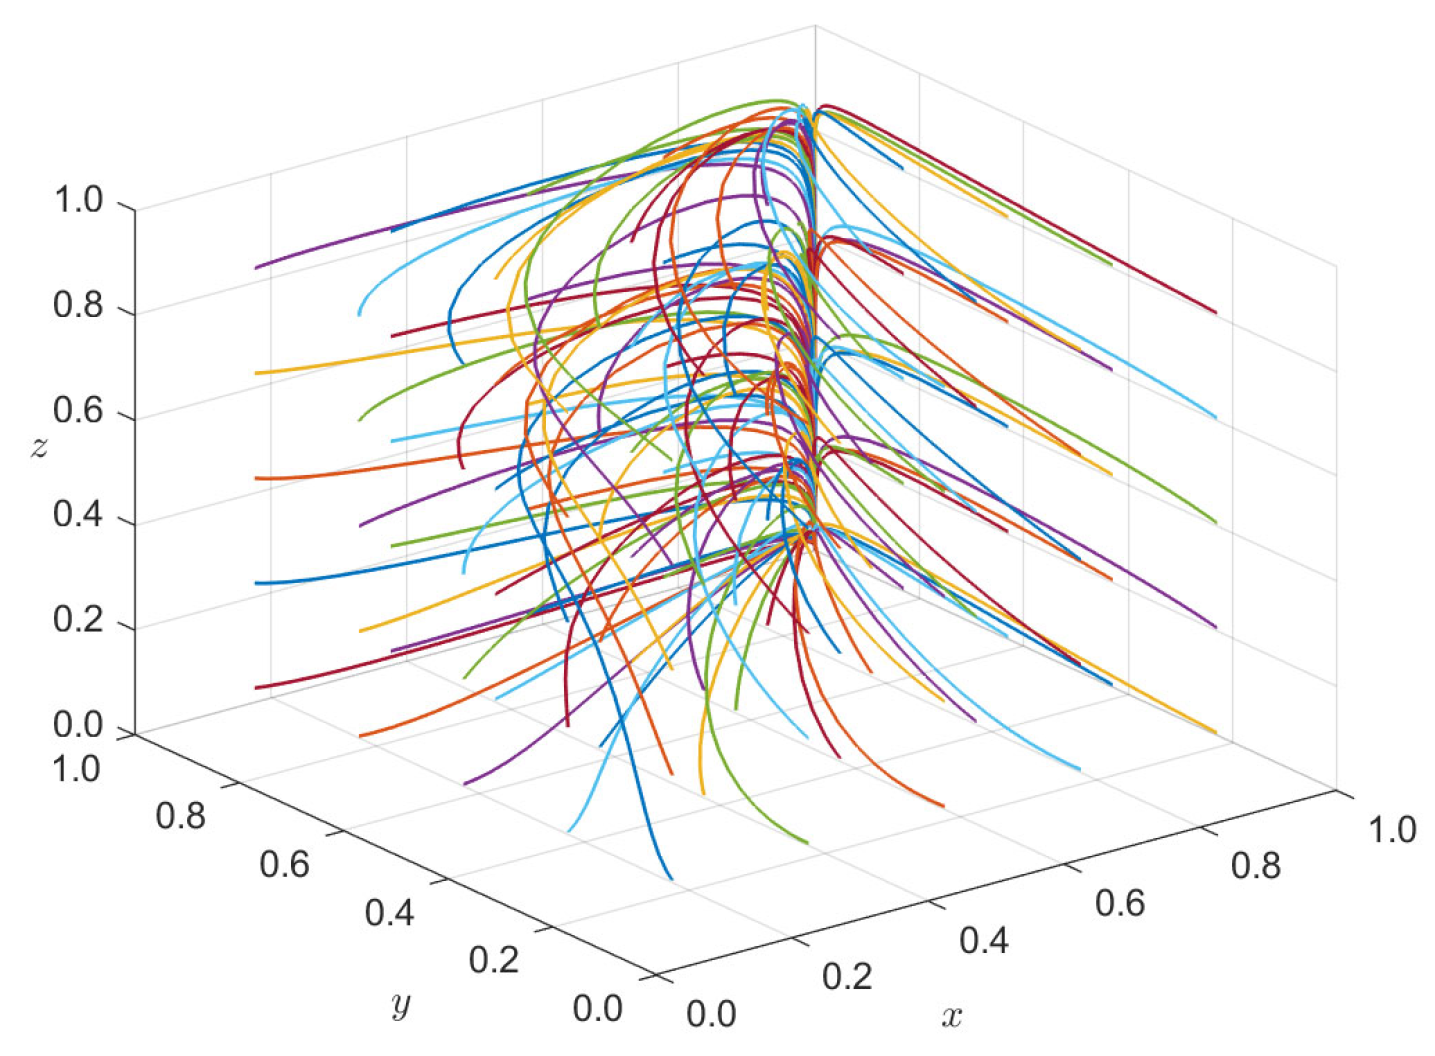
Figure 12 shows the outcome after 50 evolutions of W 1 = 90 . At this point, the system only has one evolutionarily stable strategy of {substantive green innovation, purchase green products, conventional regulation}. The probability x of substantive innovation by enterprises decreased from 1 to 0.2, the probability y of consumer purchase rose from 0.4 to 1.0, while the probability z of government innovation regulation slowly decreased from 0.8 to 0.6. The system converges with the evolutionary stability strategy, indicating that under the condition of high innovation returns, even if the government reduces the intensity of intervention, the market can still maintain a green transformation, though weakened regulatory efforts may increase the risk of a strategic resurgence in the future. At this time, the government regulation division should strengthen information construction and examine the interests of the enterprise and consumer in many aspects.
Figure 13 shows the outcome after 50 evolutions of W 2 = 50 . At this point, the system only has one evolutionarily stable strategy of {substantive green innovation, purchase green products, innovative regulation}. The greater the excess social welfare obtained by the government through innovative regulation, the easier it is to form a positive feedback mechanism, that is, the more effective the regulation is, the more enterprises choose substantial green innovation, the higher the consumer trust is, and then the regulatory efficiency of the government is further amplified, forming a self-reinforcing stable cycle.
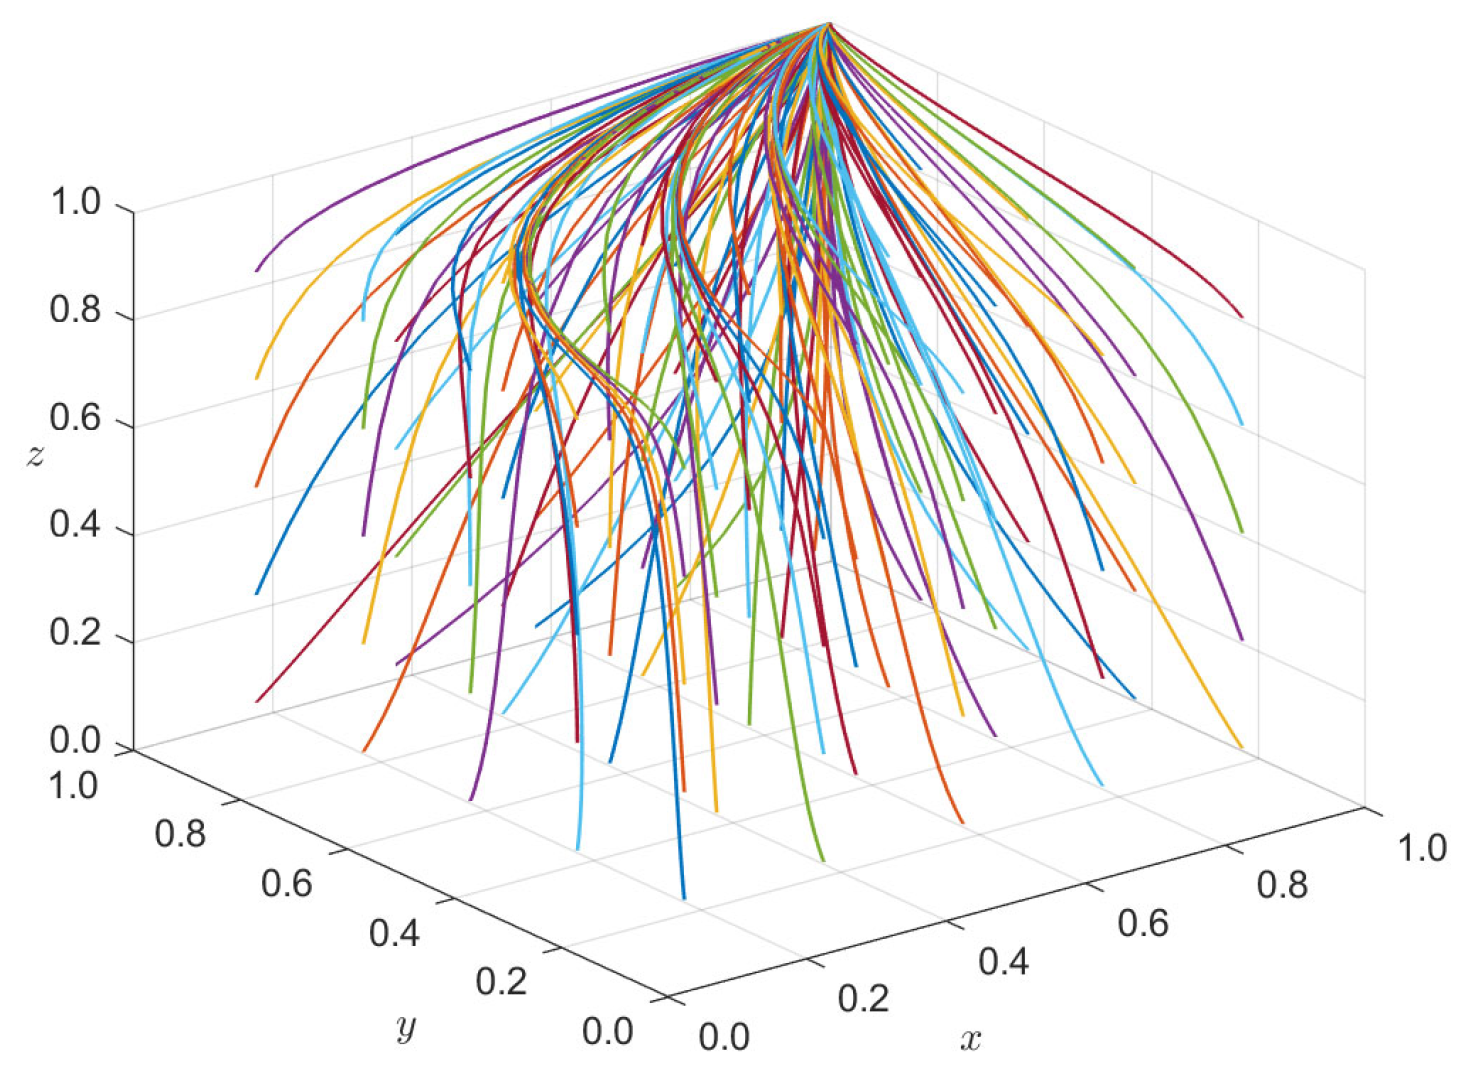
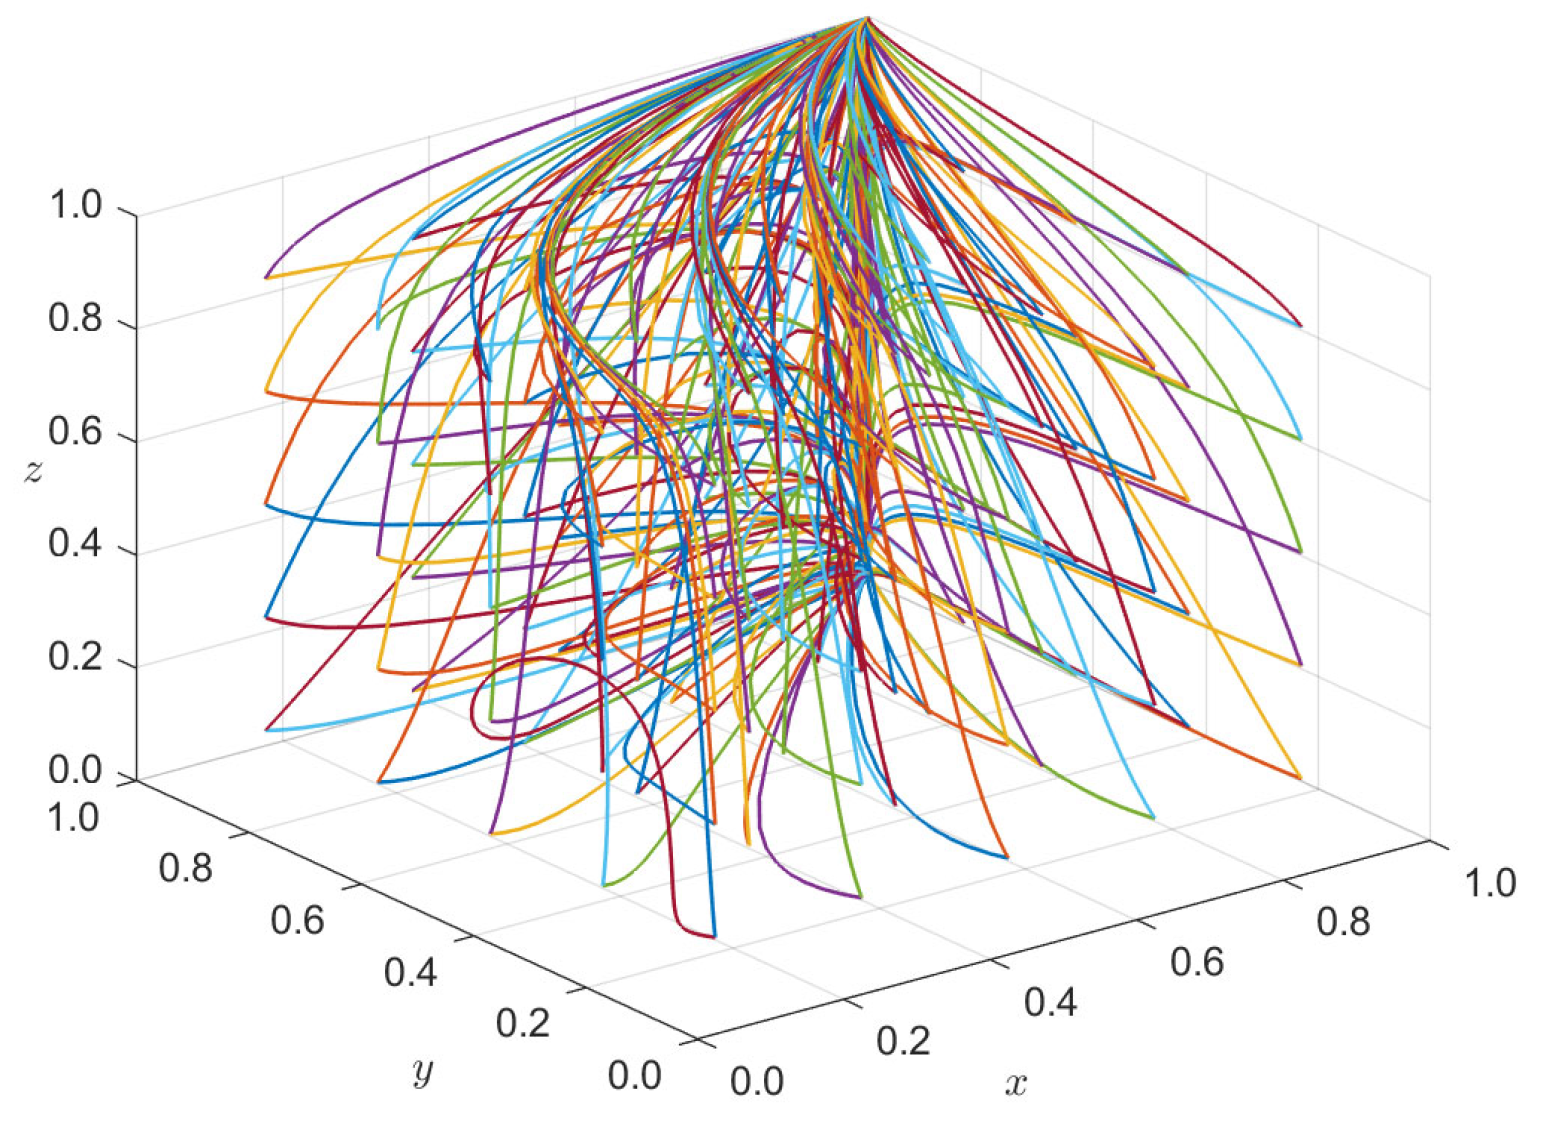
Figure 14 shows the outcome after 50 evolutions of W 2 = 90 . At this point, the system only has one evolutionarily stable strategy of {substantive green innovation, purchase green products, conventional regulation}. Conventional regulation has evolved into a “comfort zone,” while transitioning to innovative regulatory approaches entails bearing higher switching costs and risks of uncertainty. As a result, the system becomes trapped in path dependence, leaving governments with insufficient motivation to break the status quo even when “greenwashing” issues persist in the market. Consequently, policy design must ensure that W 1 W 2 exceeds a critical threshold to foster a spontaneous order of green governance; otherwise, the system risks falling into a low-level equilibrium trap. In summary, the simulation analysis is consistent with the stability analysis conclusion of all parties’ strategies and is effective, which has practical guidance significance for supervision.

6. Research Conclusions and Policy Recommendations

6.1. Research Conclusions

This paper explores the dynamic game process among enterprises, consumers, and government regulatory departments by constructing a tripartite game model, grasping the conflicts of interest and the bases for decision-making among relevant entities. The main findings are as follows:
Firstly, increasing the government’s reward for substantive green innovation and the punishment for strategic innovation can effectively guide enterprises to shift from “greenwashed” to “true green” initiatives. When R 1 C 1 + I > R 2 C 2 F , the system tends to converge on a substantive green innovation strategy. By adjusting rewards I and penalties F , the government can significantly alter the evolutionary path of the enterprise strategy space, guiding it to evolve towards the ideal equilibrium point. Secondly, consumers’ choices are not only influenced by product prices, but are also significantly driven by their perceived social benefits and government subsidies. When customers can accurately identify and purchase “true green” items and S and R 3 are sufficiently large, the system tends towards a consumer green purchasing strategy. It will create a robust market signal, offering positive incentives for companies to engage in meaningful innovation. Conversely, customer skepticism and “voting with their feet” will intensify the occurrence of “bad money driving out good money” in the market. Furthermore, the choice of government regulatory strategies is a dynamic process, and its evolutionary stable condition is W 1 + W 2 + S δ S + I I α < 0 , which tends to adopt the innovative regulation mode when the “greenwashing” risk is high and the social welfare loss is significant, and revert to the lower-cost conventional regulation mode when the market is operating well. Finally, the stability analysis of the system’s equilibrium point reveals that the system has an asymptotically stable point at E 8 ( 1 , 1 , 1 ) . The ideal stable state of the system is {substantive green innovation of enterprises, consumers purchase green products, government implement innovative regulation}. The absence or failure of any party will lead the system into a “Möbius ring”-like trust and market dilemma. Therefore, it is imperative to construct a new governance landscape where corporate self-discipline, market selection, and government regulation mutually reinforce and synergistically co-govern.

6.2. Policy Recommendations

Firstly, government regulations should continuously improve the environmental protection-related legal system construction. It should also widely apply technologies such as big data, the Internet of Things, and blockchain to establish a green product lifecycle traceability and carbon footprint monitoring platform. Furthermore, the government should continue to implement and optimize the green consumption subsidy policy for consumers while enhancing their identification ability and environmental awareness through official green label certification, public awareness campaigns, and other initiatives, thereby expanding the market demand for substantive green products.
Second, businesses must firmly embrace the green development concept and strengthen their green responsibility awareness, focusing on enhancing substantive green innovation returns. They should be willing to make long-term, sustained investments in substantive green technology, committing to reducing the environmental impact across the entire lifecycle through genuine technological breakthroughs, thereby gaining a sustainable competitive advantage. Furthermore, it is crucial to strengthen the oversight of how companies utilize their green fund investment, strictly preventing them from intentionally defrauding government subsidies, avoiding strategic penalties and consumer trust collapse triggered by “greenwashing” behavior and ensuring that subsidy policy tools are used effectively.
Third, consumers should actively improve their green literacy and enhance their identification ability. They should pay attention to authoritative green product certification labels, learn to recognize companies’ “greenwashing” rhetorics, and avoid being misled by deceptive environmental protection propaganda.
Concurrently, consumers should fully leverage channels such as social media and consumer rights protection organizations to monitor companies’ environmental protection commitments and actual practices. They should actively expose “greenwashing” behavior to create significant social pressure, thereby compelling companies to standardize their conduct.
This study has certain limitations. This model assumes that consumers cannot immediately identify greenwashing (high information asymmetry). When information disclosure is extremely thorough and consumers can identify genuine and fake green products at zero cost, the benefits of strategic innovation will approach zero, and the model will degenerate into a homogeneous game between two strategies. At this point, the government can achieve {substantive green innovation, purchasing green products, innovative regulation} without incurring high fines. Future research should conduct systematic sensitivity analyses across diverse industry contexts using Monte Carlo methods, and the learning speed of consumers or the accuracy of third-party certification can be introduced to further relax the assumption of incomplete information.

6.3. Future Research Directions

To further extend the analytical boundaries of this study, the following research avenues merit exploration:
Introducing consumer learning mechanisms: future models may incorporate dynamic consumer learning processes to reflect how green product recognition ability improves over time, thereby reducing information asymmetry and its impact on greenwashing incentives.
Incorporating heterogeneous firm types and sector-specific regulation: relaxing the assumption of homogeneous firms by integrating variations in firm size, ownership structure, or sectoral attributes could enhance the model’s realism and policy relevance, particularly for sector-targeted regulatory design.
Empirical validation using real-world greenwashing cases: while this study adopts a simulation-based approach, future research could test the model’s predictive power using empirical datasets, such as disclosed instances of corporate greenwashing or regulatory enforcement records across regions or industries.
Exploring multi-regional or multi-period regulatory dynamics: extending the model to a spatial or temporal dimension may reveal how regulatory strategies evolve under differing regional governance capacities or across policy cycles, offering insights into the long-term effectiveness of innovation regulation.


Supplementary Materials

The following supporting information can be downloaded at: https://www.mdpi.com/article/10.3390/math13223658/s1, File S1.

Author Contributions

Y.Z.: Writing—original draft, methodology, and formal analysis. M.W.: Supervision, investigation, and funding acquisition. J.L.: Software, resources, and project administration. Q.J.: Writing—review and editing and conceptualization. All authors have read and agreed to the published version of the manuscript.

Funding

This research was funded by the National Natural Science Foundation of China, grant numbers 72372106 and 72072076, and the Postgraduate Research & Practice Innovation Program of Jiangsu Province, grant number KYCX24_3906.

Data Availability Statement

The original contributions presented in this study are included in the Supplementary Materials. Further inquiries can be directed to the corresponding author.

Conflicts of Interest

The authors do not have permission to share data.

Appendix A

Appendix A.1

Table A1. Comparative analysis of this study and the related literature.
StudyAgentsRegulation TypeContribution
This studyGovernment, enterprises, consumersInnovation regulationReveals dynamic co-evolution mechanism; distinguishes innovation quality; calibrated to Chinese policy context
Sun & Zhang (2019) [22]Government, heterogeneous enterprisesStatic supervisionShows how firm heterogeneity affects regulation effectiveness; focuses on inspection probability
Li et al. (2023) [35]Government, enterprises, green innovation platformsIncentive-based regulationAnalyzes a platform’s intermediary role; focuses on the service ecosystem
Nguyen et al. (2019) [23]Enterprises, consumersMarket self-regulationIdentifies information asymmetry as a root cause; consumer awareness-focused
Safarzyńska e al. (2012) [34]Government, enterprisesPolicy stringency dynamicsOptimal policy paths over continuous time; ignores consumer role
Our contribution uniquely combines (1) dynamic innovation regulation that co-evolves with market behavior, (2) empirically calibrated parameters from Chinese green patent and penalty data, and (3) mechanism design insights for incentive–constraint–empowerment governance.

Appendix A.2

The result deduction of the partial derivative for the first-order partial derivatives of x , y , and z .
V A 1 > 0 , V A 2 > 0 2 ( C 2 C 1 + F ) ( I + I α + F β ) > 0 V A 2 R 1 = 2 ( C 2 C 1 + F ) + ( I + I α + F β ) 2 ( R 1 R 2 ) 2 > 0 V A 2 R 2 = 2 ( C 2 C 1 + F ) + ( I + I α + F β ) 2 ( R 1 R 2 ) 2 < 0 V A 2 C 1 = 2 2 ( R 1 R 2 ) < 0 V A 2 C 2 = 2 2 ( R 1 R 2 ) > 0 V A 2 F = 2 + β 2 ( R 1 R 2 ) > 0 V A 2 I = 1 + α 2 ( R 1 R 2 ) > 0 V B 1 > 0 , V B 2 > 0 , 1 δ < 0 , C 3 C 4 R 3 + R 4 < 0 V B 2 S = ( C 4 + Δ R R 4 ) 2 2 ( 1 δ ) ( C 3 C 4 R 3 + R 4 ) S 2 + 1 2 ( 1 δ ) ( C 3 C 4 R 3 + R 4 ) > 0 V B 2 R 3 = ( C 4 + Δ R R 4 ) 2 2 ( 1 δ ) S ( C 3 C 4 R 3 + R 4 ) 2 < 0 V B 2 C 4 = ( C 3 C 4 R 3 + R 4 ) + 2 ( Δ R S + C 3 R 3 ) ( Δ R S + C 3 R 3 ) 2 C 3 C 4 R 3 + R 4 2 ( 1 δ ) S < 0 V B 2 Δ R = 2 C 4 + Δ R R 4 S 2 ( S S δ ) ( C 3 C 4 R 3 + R 4 ) < 0 V C 1 > 0 , V C 2 > 0 , I I α F β > 0 V C 1 W 1 = 1 I I α F β > 0 V C 1 W 2 = 1 I I α F β < 0 V C 1 F = 2 W 2 2 W 1 + S δ S 2 ( I I α F β ) 2 + I I α ( I I α F β ) 2 > 0 V C 1 S = S ( 1 δ ) 2 ( I I α F β ) < 0 V C 1 I = 2 W 1 2 W 2 2 F β + S S δ 4 ( I I α F β ) 2 < 0

References

  1. Liang, P.; Sun, X.; Qi, L. Does artificial intelligence technology enhance green transformation of enterprises: Based on green innovation perspective. Environ. Dev. Sustain. 2024, 26, 21651–21687. [Google Scholar] [CrossRef]
  2. Guo, Y.; Zhang, F. Accelerated depreciation of fixed assets and green transformation of enterprises. Pac. Basin Financ. J. 2024, 86, 102428. [Google Scholar] [CrossRef]
  3. Chatterji, A.K.; Fabrizio, K.R. Using users: When does external knowledge enhance corporate product innovation? Strateg. Manag. J. 2014, 35, 1427–1445. [Google Scholar] [CrossRef]
  4. Du, X. How the market values greenwashing? Evidence from China. J. Bus. Ethics 2015, 128, 547–574. [Google Scholar] [CrossRef]
  5. Xu, M.; Tse, Y.K.; Geng, R. Greenwashing and market value of firms: An empirical study. Int. J. Prod. Econ. 2025, 284, 109606. [Google Scholar] [CrossRef]
  6. Teichmann, F.M.J.; Wittmann, C.; Sergi, B.S.S. What are the consequences of corporate greenwashing? A look into the consequences of greenwashing in consumer and financial markets. J. Inf. Commun. Ethics Soc. 2023, 21, 290–301. [Google Scholar] [CrossRef]
  7. Béatrice, P.; Florence, B.M.; Fabrice, L. How Sustainability Ratings Might Deter “Greenwashing”: A Closer Look at Ethical Corporate Communication. J. Bus. Ethics 2011, 102, 15–28. [Google Scholar] [CrossRef]
  8. Eun-Hee, K.; Lyon, T.P. Strategic environmental disclosure: Evidence from the DOE’s voluntary greenhouse gas registry. J. Environ. Econ. Manag. 2011, 61, 311–326. [Google Scholar] [CrossRef]
  9. Delmas, M.A.; Burbano, V.C. The drivers of greenwashing. Calif. Manag. Rev. 2011, 54, 64–87. [Google Scholar] [CrossRef]
  10. Irfan, M.; Razzaq, A.; Sharif, A. Influence mechanism between green finance and green innovation: Exploring regional policy intervention effects in China. Technol. Forecast. Soc. Change 2022, 182, 121882. [Google Scholar] [CrossRef]
  11. Simula, H.; Lehtimäki, T.; Salo, J. Managing greenness in technology marketing. J. Syst. Inf. Technol. 2009, 11, 331–346. [Google Scholar] [CrossRef]
  12. Xu, J.; Duan, Y. Pricing and greenness investment for green products with government subsidies: When to apply blockchain technology? Electron. Commer. Res. Appl. 2022, 51, 101108. [Google Scholar] [CrossRef]
  13. Palmié, M.; Wincent, J.; Parida, V. The evolution of the financial technology ecosystem: An introduction and agenda for future research on disruptive innovations in ecosystems. Technol. Forecast. Soc. Change 2020, 151, 119779. [Google Scholar] [CrossRef]
  14. Zhang, P.; Zhou, E.; Lei, Y. Technological innovation and value creation of enterprise innovation ecosystem based on system dynamics modeling. Math. Probl. Eng. 2021, 1, 5510346. [Google Scholar] [CrossRef]
  15. Antoci, A.; Borghesi, S.; Galeotti, M. Environmental options and technological innovation: An evolutionary game model. J. Evol. Econ. 2013, 23, 247–269. [Google Scholar] [CrossRef]
  16. Zeng, J.; Huang, T.; Wu, X. Authentic or spurious: An evolutionary game analysis of manufacturing enterprises’ greenwashing behavior under dynamic government regulation. Humanit. Soc. Sci. Commun. 2025, 12, 1–23. [Google Scholar] [CrossRef]
  17. Ozkan, C.E.; Beraha, A.; Bas, A. Application of evolutionary game theory to strategic innovation. Procedia Soc. Behav. Sci. 2016, 235, 685–693. [Google Scholar] [CrossRef]
  18. Woller, G. From market failure to marketing failure: Market orientation as the key to deep outreach in microfinance. J. Int. Dev. 2002, 14, 305. [Google Scholar] [CrossRef]
  19. Markham, D.; Khare, A.; Beckman, T. Greenwashing: A proposal to restrict its spread. J. Environ. Assess. Policy Manag. 2014, 16, 1450030. [Google Scholar] [CrossRef]
  20. Baum, I. Innovative regulation through competition: A response to rapidly evolving markets. Israel Law Rev. 2016, 49, 197–236. [Google Scholar] [CrossRef]
  21. Larson, L.R.; Stedman, R.C.; Cooper, C.B. Understanding the multi-dimensional structure of pro-environmental behavior. J. Environ. Psychol. 2015, 43, 112–124. [Google Scholar] [CrossRef]
  22. Sun, Z.; Zhang, W. Do government regulations prevent greenwashing? An evolutionary game analysis of heterogeneous enterprises. J. Clean. Prod. 2019, 231, 1489–1502. [Google Scholar] [CrossRef]
  23. Nguyen, T.T.H.; Yang, Z.; Nguyen, N. Greenwash and green purchase intention: The mediating role of green skepticism. Sustainability 2019, 11, 2653. [Google Scholar] [CrossRef]
  24. Reynolds, T.; Kolodinsky, J.; Murray, B. Consumer preferences and willingness to pay for compact fluorescent lighting: Policy implications for energy efficiency promotion in Saint Lucia. Energy Policy 2012, 41, 712–722. [Google Scholar] [CrossRef]
  25. Henard, D.H.; Dacin, P.A. Reputation for product innovation: Its impact on consumers. J. Prod. Innov. Manag. 2010, 27, 321–335. [Google Scholar] [CrossRef]
  26. Cruz, C.J.; Ramo, G.C.; Giménez, B.M. A review of consumer-to-consumer digital information and knowledge sharing. Manag. Decis. 2025, 63, 96–122. [Google Scholar] [CrossRef]
  27. Lyon, T.P.; Montgomery, A.W. Tweetjacked: The impact of Social Media on Corporate Greenwash. J. Bus. Ethics 2013, 118, 747–757. [Google Scholar] [CrossRef]
  28. Traulsen, A.; Glynatsi, N.E. The future of theoretical evolutionary game theory. Philos. Trans. R. Soc. B 2023, 378, 20210508. [Google Scholar] [CrossRef]
  29. Fan, W.; Wang, S.; Gu, X. Evolutionary game analysis on industrial pollution control of local government in China. J. Environ. Manag. 2021, 298, 113499. [Google Scholar] [CrossRef]
  30. Ren, Y.; Yuan, P.; Dong, X. How to prevent “greenwash” in green retrofit process under PPP model: An evolutionary game theory-based analysis. Appl. Econ. 2025, 57, 1888–1908. [Google Scholar] [CrossRef]
  31. Dong, Z.; Wang, S.; Zhang, W. The dynamic effect of environmental regulation on firms’ energy consumption behavior-Evidence from China’s industrial firms. Renew. Sustain. Energy Rev. 2022, 156, 111966. [Google Scholar] [CrossRef]
  32. Cheng, L.; Wei, X.; Li, M. Integrating Evolutionary Game-Theoretical Methods and Deep Reinforcement Learning for Adaptive Strategy Optimization in User-Side Electricity Markets: A Comprehensive Review. Mathematics 2024, 12, 3241. [Google Scholar] [CrossRef]
  33. Li, M.-M.; Cao, G.K.; Li, H.B.; Hao, Z.-X.; Zhang, L. How government subsidies affect technology innovation in the context of Industry 4.0: Evidence from Chinese new-energy enterprises. Kybernetes 2024, 53, 4149–4171. [Google Scholar] [CrossRef]
  34. Safarzyńska, K.; Frenken, K.; Van Den Bergh, J.C.J.M. Evolutionary theorizing and modeling of sustainability transitions. Res. Policy 2012, 41, 1011–1024. [Google Scholar] [CrossRef]
  35. Li, C.; Li, H.; Tao, C. Evolutionary game of platform enterprises, government and consumers in the context of digital economy. J. Bus. Res. 2023, 167, 113858. [Google Scholar] [CrossRef]
Figure 1. Game players’ strategies and mechanisms of action.
Mathematics 13 03658 g001
Figure 2. Evolutionary game payoff tree.
Mathematics 13 03658 g002
Figure 3. Corporate strategy evolution phase diagram.
Mathematics 13 03658 g003
Figure 4. Consumer strategy evolution phase diagram.
Mathematics 13 03658 g004
Figure 5. Phase diagram of government regulatory strategy evolution.
Mathematics 13 03658 g005
Figure 6. Impact of the enterprise’s substantive green innovation returns R 1 .
Mathematics 13 03658 g006
Figure 7. Impact of enterprise’s substantive green innovation cost C 1 .
Mathematics 13 03658 g007
Figure 8. Government’s impact on substantive green innovation rewards I .
Mathematics 13 03658 g008
Figure 9. Government’s impact on strategic green innovation and penalties F .
Mathematics 13 03658 g009
Figure 10. Government’s impact on consumer green subsidies S .
Mathematics 13 03658 g010
Figure 11. W 1 = 100 evolutionarily stable strategy.
Mathematics 13 03658 g011
Figure 12. W 1 = 90 evolutionarily stable strategy.
Mathematics 13 03658 g012
Figure 13. W 2 = 50 evolutionarily stable strategy.
Mathematics 13 03658 g013
Figure 14. W 2 = 90 evolutionarily stable strategy.
Mathematics 13 03658 g014
Table 1. Main model parameters and their meanings.
SymbolMeaning
R 1   R 2 Enterprise revenue from selling “true green” and “greenwashed” products
C 1   C 2 Enterprise costs of substantive green innovation and strategic green innovation
R 3   R 4 Consumer social benefits from purchasing “true green” and “greenwashed” products
C 3   C 4 Consumer costs of purchasing “true green” and “greenwashed” products
Δ R Consumer net benefit from purchasing conventional products
C 5 Government basic cost of supervision
W 1   W 2 Government social welfare from innovative regulation and conventional regulation
I Government reward for substantive green innovation
F Government penalty for strategic green innovation
S Government consumption subsidy for consumers’ purchase of green products
E Government environmental tax levied on enterprise production
δ   α   β Reward coefficient and punishment coefficient under government regulation
Table 2. Payment matrix for the government, enterprise, and consumer.
Strategy SelectionConsumerGovernment Sector
Innovative Regulation zConventional Regulation 1-z
EnterpriseSubstantive green innovation xPurchase green products y R 1 C 1 + I - E R 1 C 1 + I α E
R 3 C 3 + S δ R 3 C 3 + S
W 1 C 5 I + E S δ W 2 C 5 I α + E S
Not purchase green products 1-y C 1 + I E C 1 + I α E
Δ R Δ R
W 1 C 5 I + E W 2 C 5 I α + E
Strategic green innovation 1-xPurchase green products y R 2 C 2 F E R 2 C 2 F ( 1 + β ) E
R 4 C 4 + S δ R 4 C 4 + S
W 1 C 5 + F + E S δ W 2 C 5 + F ( 1 + β ) + E S
Not purchase green products 1-y C 2 F E C 2 F ( 1 + β ) E
Δ R Δ R
W 1 C 5 + F + E W 2 C 5 + F ( 1 + β ) + E
Table 3. Eigenvalues of the Jacobian matrix.
Equilibrium Point λ 1 λ 2 λ 3 Symbol
E 1 ( 0 , 0 , 0 ) W 1 W 2 F β R 4 C 4 Δ R + S C 1 + C 2 + F + F β + I α + , - , U
E 2 ( 0 , 0 , 1 ) W 1 + W 2 + F β R 4 C 4 Δ R + S δ C 1 + C 2 + F + I - , + , U
E 3 ( 0 , 1 , 0 ) R 4 + C 4 + Δ R S W 1 W 2 F β S δ + S R 1 C 1 R 2 + C 2 + F + F β + I α + , U , +
E 4 ( 0 , 1 , 1 ) R 4 + C 4 + Δ R S δ W 1 + W 2 + F β + S δ S R 1 C 1 R 2 + C 2 + F + I - , U , +
E 5 ( 1 , 0 , 0 ) W 1 W 2 + I α I R 3 C 3 Δ R + S C 1 C 2 F F β I α + , + , U
E 6 ( 1 , 0 , 1 ) R 3 C 3 Δ R + S δ C 1 C 2 F I W 1 + W 2 + I I α + , U , -
E 7 ( 1 , 1 , 0 ) R 3 + C 3 + Δ R S W 1 W 2 S δ + S I + I α R 1 + C 1 + R 2 C 2 F F β I α - , U , -
E 8 ( 1 , 1 , 1 ) R 3 + C 3 + Δ R S δ W 1 + W 2 + S δ S + I I α R 1 + C 1 + R 2 C 2 F I - , U , -
U means that the sign of eigenvalue is uncertain and the stability of equilibrium point cannot be determined.
Disclaimer/Publisher’s Note: The statements, opinions and data contained in all publications are solely those of the individual author(s) and contributor(s) and not of MDPI and/or the editor(s). MDPI and/or the editor(s) disclaim responsibility for any injury to people or property resulting from any ideas, methods, instructions or products referred to in the content.