Article

Evaluating the Effectiveness of Standardized Sales Incentive Contracts Under Agent Heterogeneity

1
School of Business, Macau University of Science and Technology, Macau SAR, China
2
School of Management, Guangzhou University, Guangzhou 510006, China
3
School of Business, Sun Yat-sen University, Guangzhou 510275, China
*
Author to whom correspondence should be addressed.
Mathematics 2025, 13(18), 2968; https://doi.org/10.3390/math13182968
Submission received: 5 August 2025 / Revised: 10 September 2025 / Accepted: 10 September 2025 / Published: 13 September 2025
(This article belongs to the Special Issue Advances in Mathematical Optimization in Operational Research)

Abstract

Salespeople, as the core executors of product distribution, form a classical principal–agent relationship with the firm. A substantial body of academic research has focused on how firms can develop optimal sales incentive contracts in various scenarios to achieve precise and effective motivation of their salespeople. However, in sales management practice, firms face a tradeoff between management precision and control costs. Therefore, instead of tailoring contracts for each individual, they tend to adopt standardized incentive contracts for the broader range of salespeople. This practice has called the effectiveness of standardized incentive schemes into question. These questions have received limited attention in prior research, yet they hold significant theoretical and practical relevance for optimizing sales incentive mechanisms and improving managerial effectiveness. This study underscores the critical role of salesperson heterogeneity in shaping the effectiveness of standardized incentive contracts. By constructing game-theoretical models of standardized sales incentive contracts in two scenarios and analyzing how heterogeneous salespeople respond to these contracts, the study finds that heterogeneity weakens the incentive effectiveness of standardized contracts. To address this challenge, we propose two practical evaluation methods to help firms assess and adjust both the degree of salesperson heterogeneity and the actual effectiveness of standardized incentive contracts.

1. Introduction

Sales and salesperson management is a complex activity that largely determines corporate commercial success [1]. Salespeople, as the core executors of product distribution, form a classical principal–agent relationship with the firm [2,3]. Within this framework, the firm’s primary objective is to design effective incentive mechanisms that fully motivate the enthusiasm and creativity of the salespeople, thereby maximizing corporate profits. Consequently, a substantial body of academic research has focused on how firms can develop optimal sales incentive contracts in various scenarios to achieve the precise and effective motivation of their salespeople [4].
However, in practice, firms often face a range of operational constraints in sales management. Influenced by factors such as managerial efficiency, administrative costs, and organizational fairness, it is typically infeasible for firms to engage in deep, individualized contracting with each salesperson or to obtain complete and accurate information about their characteristics. As a result, rather than tailoring contracts for each individual, firms tend to adopt standardized incentive contracts for the broader range of salespeople [5,6]. These standardized contracts help to streamline management processes, reduce administrative costs, and promote a sense of fairness within the organization.
However, in the practical application of standardized sales incentive contracts, a series of issues has gradually emerged. Empirical evidence indicates that standardized incentives fail to motivate all salespeople equally [6]. As Bommaraju and Hohenberg [7] mentioned in their study, the sales director of an international energy supplier summarized the challenges related to standardized incentive schemes: “Our sales force encompasses various types of salespeople, each of whom naturally requires a different set of steering mechanisms. However, we cannot provide different incentives for every individual, as this would be extremely costly and overly complex”. At the end of each evaluation period, when firms calculate bonuses based on these contracts, the effectiveness of standardized incentive schemes is increasingly called into question. For example, we interviewed a large equipment-manufacturing company in China. This company had implemented a unified, standardized sales incentive contract. The contract applied to all the equipment salespeople within the same region and at the same hierarchical level. Yet during the year-end bonus settlement, the human resource department discovered that some bonus amounts were extraordinarily high, often reaching millions of yuan. This triggered serious concerns within the HR department. They questioned whether such substantial bonuses were truly justified and if the standardized incentive contract was genuinely effective. Specifically, they wondered if the high payouts were a reward for exceptional sales effort or if they stemmed from the firm’s insufficient understanding of critical factors. These factors could include regional sales potential and the actual capabilities of salespeople at that level. If so, this lack of understanding could lead to serious design flaws in the incentive contract and, consequently, unreasonable bonus allocations.
This case highlights a widespread and pressing challenge in sales management: Does heterogeneity among the salespeople undermine the effectiveness of standardized incentive contracts? When such heterogeneity is private information held by salespeople, how can firms effectively detect its existence, accurately measure its degree, and evaluate the performance of standardized incentive schemes? Previous literature on the design of sales incentive contracts has primarily focused on the formulation of precise, tailored contracts through one-to-one game-theoretical interactions between firms and salespeople across diverse sales contexts [4]. However, these studies have largely neglected to examine the incentive effectiveness of standardized contracts when applied to heterogeneous salespeople. Moreover, a concrete quantitative framework for assessing the practical incentive performance of such standardized contracts remains notably absent. Consequently, these questions have received limited attention in prior research, yet they hold significant theoretical and practical relevance for optimizing sales incentive mechanisms and improving managerial effectiveness. A deeper investigation into these issues not only enriches the application of the principal–agent theory in the context of sales management but also provides valuable insights for firms seeking to design more scientific and equitable sales incentive policies. As Ahearne and Ahearne [8] noted in their study of sales incentive management, “Companies invest millions in plan design, administration, and payouts, yet very few can definitively assess whether these expenditures generate proportional value. This presents a significant opportunity for academic contribution”. Therefore, research on the measurement and evaluation of the effectiveness of sales incentive contracts remains an important and underexplored area that warrants further investigation.
To address the aforementioned research gap, this study focuses on the following three key research questions:
(1)
Does heterogeneity among the salespeople lead to a loss in incentive effectiveness under standardized incentive contracts?
(2)
How can firms identify and quantify the presence and degree of such heterogeneity as well as evaluate the effectiveness of standardized incentive schemes?
(3)
Do different types of salesperson heterogeneity, such as heterogeneity in capability versus heterogeneity in risk attitude, differ in their impact on contract effectiveness and in the methods required for their evaluation?
To address the above research questions, this study proceeds in two main steps. First, we develop a sales incentive contract design model based on a one-to-one game between the firm and a salesperson, solving for the optimal contract in various scenarios to derive the “standardized incentive contract”. Second, we examine three types of salesperson heterogeneity, differences in capability, effort cost, and risk attitude, and analyze how heterogeneous salespeople respond to the standardized contract as well as how such heterogeneity affects both salespeople and firm payoffs (i.e., contract effectiveness). According to this analysis, we propose two evaluation methods for identifying the heterogeneity of the salespeople and assessing the effectiveness of standardized incentive contracts.
This study finds that heterogeneity among the salespeople leads to a loss in the incentive effectiveness of standardized contracts. In the long run, when such heterogeneity exists, lower-competency salespeople are naturally screened out, while higher-performing individuals tend to remain and earn excess returns. This self-selection dynamic undermines the overall effectiveness of standardized sales incentive contracts. In addition, when the market’s potential sales volume is common knowledge, firms can compare the actual income distribution of salespeople under the standardized contract with the expected distribution to identify the presence and degree of heterogeneity and to assess the contract’s effectiveness, providing a form of ex post (midterm) control. When the market’s potential sales volume is private information held by the salespeople, firms can use salespeople’s feedback on perceived market potential as a signal to evaluate heterogeneity and incentive effectiveness in advance, providing a form of ex ante (preemptive) control. The ex post control method remains a useful supplementary tool in this setting. Furthermore, heterogeneity in capability, effort cost, and risk attitude all negatively affect the effectiveness of standardized incentive contracts. The ex ante evaluation method is valid across all three types of heterogeneity. However, the ex post method is effective only in cases of capability and effort cost heterogeneities and fails in the case of heterogeneity in risk attitudes.
This study makes several key contributions to the literature on sales incentive design. Theoretically, it addresses a critical gap by focusing on the effectiveness evaluation of standardized sales incentive contracts, thereby extending the scope of incentive contract management. Methodologically, it introduces two novel approaches for assessing contract effectiveness, establishing a robust foundation for future studies. From a managerial perspective, the proposed evaluation methods offer strong operational feasibility and actionable insights, enabling firms to systematically optimize incentive structures and enhance salesperson management.
The remainder of this paper is organized as follows. Section 2 reviews the relevant literature. Section 3 develops the benchmark model of a standardized sales incentive contract. Section 4 proposes two methods for evaluating the effectiveness of sales incentive contracts. Section 5 employs Monte Carlo simulation to examine a numerical example, demonstrating the impacts of salesperson heterogeneity on the effectiveness of standardized contracts and in validating the proposed evaluation methods. Finally, Section 6 concludes the study, discusses its limitations, and outlines directions for future research.

2. Literature Review

Our research focuses on evaluating the effectiveness of standardized sales incentive contracts. The related literature can be broadly categorized into two main areas: (1) research on the design of sales incentive contracts and (2) research on the evaluation of sales incentive contracts’ effectiveness.

2.1. Research on the Design of Sales Incentive Contracts

The foundational model for salesperson compensation plan design in agency theory was introduced by Farley [9]. Subsequent studies have applied agency theory to explore optimal sales compensation plans across various scenarios.
Basu et al. [10] established a principal–agent model for optimal compensation contract design under the assumptions of homogeneous salesperson capability and sales territories, along with unobservable sales effort levels. Holmstrom and Milgrom [11] further incorporated exponential utility functions to investigate optimal compensation mechanisms in dynamic relationships. Their analysis demonstrated that linear contracts constitute the optimal form and precisely determined the contract parameters. Retaining these assumptions, Lal and Staelin [12] examined compensation mechanisms under conditions of heterogeneous salesperson capability and asymmetric information. Mantrala et al. [13] addressed a critical gap in the salesperson management literature. Their study examined the design of equitable and effective quota–bonus plans. This examination focused on contexts where salespeople demonstrate heterogeneous capabilities, including skill variations across different territories and the selling of multiple products with divergent profit margins and demand characteristics. Bhardwaj [14], Joseph [15], and Mishra and Prasad [16] further examined delegated pricing within the principal–agent framework of firm–salesperson relationships. Bhardwaj [14] found that in a duopoly market, a firm’s decision to delegate pricing authority to its salespeople depends on the relative intensity of price competition versus sales effort competition. Joseph [15] challenged the conventional view that “full delegation of pricing is invariably optimal”, arguing that the substitutability between pricing authority and sales effort constitutes a key constraint, and proposed a scheme of limited delegation. Mishra and Prasad [16] further incorporated information asymmetry, revealing that under symmetric information conditions, centralized and delegated pricing contracts are mathematically equivalent in achieving the upper bound of the firm’s profit, allowing managers to focus on designing optimal incentive schemes. Under asymmetric information conditions, however, centralized pricing equilibrium is generally prevalent in the market, and constraints on contract form or observability can affect these conclusions.
Jain [17] and Jerath and Long [18] explored multi-period sales incentive problems. Jain [17] demonstrated that firms can mitigate employee self-control issues through deferred compensation, and multi-period quota plans, despite potentially encouraging procrastination, may still constitute the optimal choice. Jerath and Long [18] showed that within the context of multi-period sales incentive contracts, seemingly suboptimal salesperson effort patterns, such as the “hockey stick”, “giving up”, and “resting-on-laurels” phenomena, can be optimal for the firm under specific conditions.
Several studies incorporate inventory decisions into the analysis of sales incentive contract design. Dai and Jerath [19] investigated scenarios where firms design compensation contracts for salespeople while simultaneously determining inventory levels. It was found that incorporating inventory considerations leads firms to choose contracts with higher-powered incentives, and inventory management interacts with compensation design, influencing the firm’s decisions. They also specifically studied the impact of limited inventory on optimal salesperson compensation contracts [20] and focused on sales contracts under demand and supply uncertainties, exploring the dual moral hazard problem and establishing the optimality of smooth contracts in this context [21].
Recent studies on sales incentive contract design have increasingly incorporated emerging sales modalities and novel managerial contexts. For instance, Bhargava and Rubel [22] addressed compensation design for salespeople on two-sided platforms, employing a principal–agent model to investigate how direct and indirect network effects influence compensation plan design. Dai et al. [23] conducted a seminal investigation into the optimal incentive design for retail store managers operating under dual-task conditions involving both operational and marketing responsibilities. Zhang et al. [24] examined incentive contract design within live streaming sales channels. Gao [25] conducted a rigorous examination of how salespeople’s learning capabilities influence long-term compensation design. Zhang et al. [26] conducted a comparative analysis of the incentive effects between individual commission systems and team/store-wide incentive mechanisms within the context of brand-managed retail outlets.
It is evident that although the literature on sales incentive contract design has flourished over the past few decades, discussions remain predominantly focused on the design of precisely tailored incentive contracts through one-to-one game-theoretical interactions between firms and salespeople. Major research innovations have primarily involved expansion into diverse business models and sales contexts [22,23,24,25,26]. Despite the widespread adoption of standardized incentive contracts in practice, existing studies have not adequately explored the influences of salesperson heterogeneity on the effectiveness of such contracts, nor have they proposed a concrete quantitative methodology for evaluating the actual incentive effectiveness of standardized sales incentive contracts.

2.2. Research on the Evaluation of Sales Incentive Contract Effectiveness

Certain studies have sought to empirically examine the impacts of multiple factors on incentive contract effectiveness. These factors operate at both individual and organizational levels. At the individual level, factors include motivational and reward orientations [7], predispositions [27], self-monitoring and psychological capital [28], and emotional regulation [29]. At the contextual level, factors include sale-control systems [30], cultural influences [31], and sales unit structures [32].
Some recent research has focused on incentive contract design and effectiveness enhancement for online labor platforms, with certain studies employing machine-learning approaches for precise parameter estimation and personalized treatment assignment. For instance, Kaynar and Siddiq [33] addressed the effectiveness of actual sales contracts in online labor markets where salespeople’s true characteristic parameters are unknown, proposing an optimal sales contract estimation method to enhance real-world contract effectiveness. Through two large-scale experiments involving approximately 12,000 Amazon Mechanical Turk workers, Opitz et al. [34] examined the performance effects of machine-learning-based personalized incentive scheme allocation.
Although these studies address issues of sales incentive contract effectiveness, they have limitations. Research in the first category cannot quantitatively evaluate the effectiveness of specific incentive contracts, and the primary research innovation lies in novel findings from psychology and organizational behavior [28,29,32]. Meanwhile, studies in the second category focus on incentive contract design for online labor platforms, and the primary research innovation is reflected in breakthroughs in estimating salesperson characteristic parameters by leveraging large-scale data from online platforms [33,34], lacking applicability to traditional enterprise sales management models. Consequently, neither stream of research addresses the question posed by Ahearne and Ahearne [8].
The literature comparison is provided in Table 1.

2.3. Contributions

In summary, this study makes three primary contributions to the literature, and these contributions bridge theoretical rigor with practical applicability, advancing both academic discourse and managerial decision making in sales incentive design.
(1)
Theoretical Advancement: By focusing on the effectiveness evaluation of standardized sales incentive contracts, this research addresses a critical gap in the sales compensation literature. It extends the scope of incentive contract management and responds to Ahearne and Ahearne’s [8] call for further investigation into the effectiveness of sales incentive allocations;
(2)
Modeling and Methodology: Leveraging a principal–agent game-theoretical framework, we examine heterogeneous salespeople’s responses to standardized incentive contracts. Our analysis yields two novel methodologies for assessing contract effectiveness, thereby establishing a robust theoretical foundation for future research in this domain;
(3)
Managerial Implications: The proposed evaluation frameworks demonstrate strong operational feasibility, offering actionable insights for salesperson management. These tools enable firms to systematically optimize incentive structures, enhancing both efficiency and effectiveness in salesperson management.

3. Model

In this section, we construct a standardized incentive contract, focusing on the design of a sales incentive scheme in a setting where the firm interacts with a single representative salesperson. We define this as the benchmark of our study. Next, we introduce the model framework from the perspectives of the firm and the salesperson.

3.1. Firm

Following Basu et al. [10], Holmstrom and Milgrom [11], and Lal and Srinivasan [35], we assume that the firm is risk neutral and seeks to maximize its expected profit, defined as sales revenue minus the salesperson’s compensation. Let the market’s potential sales volume be denoted by x. Regarding sales incentive contracts (salesperson’s compensation), Holmstrom and Milgrom [11] proposed a general framework for linear incentive contracts. They demonstrated that a linear incentive contract is optimal within a principal–agent relationship. This type of contract typically consists of a fixed salary plus a commission rate. Yu and Kong [36] further showed that under parameter uncertainty conditions, linear contracts remain the most robust. According to these findings, we assume that the firm establishes a sales incentive contract as a linear function as follows:
W ^ = α + r ( x ) ,
where α is a fixed salary component that is independent of sales performance, and r ( x ) is a variable component defined as follows:
r ( x ) = β · Q ( x ) ,
where β denotes the commission rate, and Q ( x ) represents the sales volume. For simplicity, we assume the unit price of the product is 1, as this does not affect our analytical results. In addition, following Basu et al. [10] and Lal and Srinivasan [35], the sales volume ( Q ( x ) ) is modeled as follows:
Q ( x ) = x + d ε + θ ,
where d ( d > 0 ) is the sales capability coefficient (which varies across salespeople), ε denotes the sales effort exerted by the salesperson, and θ ( θ N ( 0 , δ 2 ) ) captures the market sales uncertainty.
Therefore, the firm’s expected revenue is defined as follows:
Π ( α , β ) = E x + d ε + θ α β ( x + d ε + θ ) .
And the design of the firm’s sales incentive contract is equivalent to determining the optimal commission parameters ( α and β ) .

3.2. Salesperson

Following Basu et al. [10], Holmstrom and Milgrom [11], and Lal and Srinivasan [35], we assume that the salesperson is risk averse. Since the salesperson is directly engaged with the market, the salesperson has accurate knowledge of x. The salesperson aims to maximize individual utility by selecting the optimal effort level ( ε ) that aligns with personal interests under the firm’s incentive contracts. The the effort cost for the salesperson is c ( ε ) = k 2 ε 2 , where k ( k > 0 ) is the coefficient for the effort cost.
Following Holmstrom and Milgrom [11], the salesperson’s utility function takes a negative exponential form. The salesperson’s expected wage (w) and utility ( U ( ε ) ) are given by
w = E ( α + β ( x + d ε + θ ) ) ,
U ( ε ) = e γ α + β ( x + d ε + θ ) k 2 ε 2 ,
where γ ( γ > 0 ) is the coefficient of the risk aversion for the salesperson. Due to the identical monotonicity of the functions, using the Pratt [37] certainty-equivalent (CE) formulation, the utility of the salesperson, U ( ε ) , can be equivalently expressed as follows:
U ( ε ) = α + β ( x + d ε ) k 2 ε 2 γ 2 δ 2 β 2 ,
where the first term denotes fixed income, the second term signifies variable income, the third term accounts for effort cost, and the fourth term represents a risk premium.
Since the salesperson is directly engaged with the market, the salesperson has accurate knowledge of x. For the firm, however, we consider two scenarios: The firm knows the exact value of x (denoted as scenario CK, Common Knowledge), and the firm only knows the probability distribution of x (denoted as scenario PK, Private Knowledge).
Scenario CK. When a firm’s sales regions are relatively concentrated and its sales management structure is flat, the firm can more easily obtain information about the potential sales volume in a specific market. Therefore, in the game between the firm and the salesperson over the design of the sales incentive contract, the market’s potential sales volume information (x) is common knowledge to both parties.
In this scenario, the decision sequence is that the firm first determines the optimal commission structure ( ( α , β ) ), after which the salesperson chooses the effort level ( ε ).
Scenario PK. When a firm’s sales regions are dispersed (e.g., in the case of a globally operating company) and its sales management structure is multilayered (e.g., with a headquarter-regional-city hierarchy), it becomes more difficult for the firm to accurately assess the potential sales volume in specific markets. The firm only estimates a probability distribution function of f ( x ) and a cumulative distribution function of F ( x ) , where x [ x ̲ , x ¯ ] . The potential sales volume distribution has the increasing failure rate(IFR) property, with a failure rate of h ( x ) = f ( x ) 1 F ( x ) . As a result, the firm relies on the salesperson to report the market’s potential sales volume, denoted as y. The firm then uses this reported information (y) as a reference when setting the incentive contract parameters ( ( α ( y ) and β ( y ) ) ). This means that the salesperson may report a value (y), even though the true potential sales volume is x.
The utility of salesperson, U ( ε , y ) , can be equivalently expressed as follows:
U ( ε , y ) = α ( y ) + β ( y ) ( x + d ε ) k 2 ε 2 γ 2 δ 2 β 2 ( y ) .
In this scenario, the decision sequence is that the salesperson first feeds back information on the market’s sales potential (y), then the firm determines the optimal commission structure ( ( α ( y ) , β ( y ) ) ), after which the salesperson chooses the effort level ( ε ).

3.3. Decision Equilibrium

3.3.1. Scenario CK

In scenario CK, when the game between the firm and the salesperson reaches equilibrium, the following constraints must be satisfied:
  • Incentive Compatibility Constraint (IC):
    ε = arg max U ( ε ) , x [ x ̲ , x ¯ ] ,
    which ensures that the contract encourages the salesperson to exert the optimal effort level that maximizes their utility, eliminating moral hazard;
  • Rational Constraint (IR):
    U ( ε ) μ 0 , x [ x ̲ , x ¯ ] ,
    which guarantees that the utility of the salesperson exceeds a minimum threshold of μ 0 , representing their opportunity cost, where μ 0 is high enough so that α in the optimal contract is positive.
The principal–agent model is summarized as follows:
max Π ( α , β ) = E x + d ε + θ α β ( x + d ε + θ ) , s . t . ε = arg max U ( ε ) , x [ x ̲ , x ¯ ] , U ( ε ) μ 0 , x [ x ̲ , x ¯ ] .
From the incentive compatibility (IC) constraint, we obtain ε = β d k . From the individual rationality (IR) constraint, we find that U ( ε ) = μ 0 serves as a binding constraint; otherwise, the firm could lower the compensation paid to the salesperson to increase its profit.
Thus, the model can be transformed as follows:
max Π ( α , β ) = ( x + β d 2 k ) α β ( x + β d 2 k ) , s . t . U ( ε ) = μ 0 , x [ x ̲ , x ¯ ] .
Theorem 1. 
In scenario CK, the equilibrium decisions are as follows:
β = d 2 d 2 + k γ δ 2 , α = μ 0 d 2 x d 2 + k γ δ 2 d 4 ( d 2 k γ δ 2 ) 2 k ( d 2 + k γ δ 2 ) 2 , ε = d 3 k ( d 2 + k γ δ 2 ) .
Then, we can obtain that the expected wages received by the salesperson are w = μ 0 + d 4 2 k ( d 2 + k γ δ 2 ) , the utility of the salesperson is U ( ε ) = μ 0 , and the expected revenue of the firm is Π ( α , β ) = x μ 0 + d 4 2 k ( d 2 + k γ δ 2 ) .
As indicated by Theorem 1, in scenario CK, where information is symmetric between the firm and the salesperson, the salesperson obtains only the minimum utility level determined by the opportunity cost and is unable to attain any excess utility. The salesperson’s expected income exceeds this baseline utility because it incorporates compensation for effort cost as well as a risk premium arising from market uncertainty.

3.3.2. Scenario PK

In scenario PK, when the game between the firm and the salesperson reaches equilibrium, the following constraints must be satisfied:
  • Incentive Compatibility Constraint (IC1):
    U ( ε , y ) U ( ε , x ) , x , y [ x ̲ , x ¯ ] ,
    which ensures that the sales incentive contract motivates the salesperson to truthfully disclose the market’s potential sales volume;
  • Incentive Compatibility Constraint (IC2):
    ε = arg max U ( ε , x ) , x [ x ̲ , x ¯ ] ,
    which ensures that the contract encourages the salesperson to exert the optimal effort level that maximizes their utility, eliminating moral hazard;
  • Rational Constraint (IR):
    U ( ε , x ) μ 0 , x [ x ̲ , x ¯ ] ,
    which guarantees that the utility of the salesperson exceeds a minimum threshold of μ 0 , representing their opportunity cost.
The principal–agent model is summarized as follows:
max Π ( α ( x ) , β ( x ) ) = E x + d ε + θ α ( x ) β ( x ) ( x + d ε + θ ) , s . t . U ( ε , y ) U ( ε , x ) , x , y [ x ̲ , x ¯ ] , ε = arg max U ( ε , x ) , x [ x ̲ , x ¯ ] , U ( ε , x ) μ 0 , x [ x ̲ , x ¯ ] .
Theorem 2. 
In scenario PK, the equilibrium decisions are as follows:
β ( x ) = d 2 h ( x ) k ( d 2 + k γ δ 2 ) h ( x ) , ε ( x ) = β ( x ) d k ,
α ( x ) = μ 0 β ( x ) d ε ( x ) + k 2 ε 2 ( x ) + γ 2 δ 2 β 2 ( x ) x β ( x ) + x ̲ x β ( z ) d z .
The complete derivation of the model is provided in Appendix A.1. Then, we can obtain that the expected wage received by the salesperson is w = μ 0 + k 2 ε 2 ( x ) + γ 2 δ 2 β 2 ( x ) + x ̲ x β ( z ) d z , and the utility for the salesperson is U ( ε , x ) = μ 0 + x ̲ x β ( z ) d z , which is higher than that in scenario 3.3.1 when x is common knowledge. The expected revenue of the firm is Π ( α ( x ) , β ( x ) ) = x μ 0 + d 4 2 k ( d 2 + k γ δ 2 ) k 2 ( d 2 + k γ δ 2 ) h ( x ) 2 x ̲ x β ( z ) d z , which is lower than that in scenario 3.3.1 when x is common knowledge. Moreover, x ̲ x β ( z ) d z can be interpreted as the information rent paid by the firm to the salesperson, while k 2 ( d 2 + k γ δ 2 ) h ( x ) 2 represents the systematic distortion loss caused by the salesperson’s reporting of the potential sales volume.
A comparison between Theorem 2 and Theorem 1 reveals that in scenario PK, where information asymmetry exists between the firm and the salesperson, the latter obtains excess utility due to private knowledge regarding the potential market demand. Consequently, the firm’s profit is lower relative to that in scenario CK. This reduction stems partly from the subsidy granted to the salesperson to incentivize truth-telling and partly from the distortion loss imposed on the entire system due to information asymmetry.
Ideally, a sales incentive contract motivates the salesperson to exert the optimal level of effort, aligning with the principal’s objectives. In such cases, the firm can achieve the maximum revenue. However, as discussed in Section 1, practical limitations, such as the tradeoff between managerial precision and cost, often prevent firms from designing personalized, optimal contracts for each individual salesperson. Instead, firms commonly adopt a standardized incentive contract across the salespeople. This uniform approach may diverge from the optimal arrangement and reduce effectiveness, particularly due to heterogeneity among salespeople.
However, even in the presence of salesperson heterogeneity, when firms adopt standardized incentive contracts, the original contractual mechanism fails to account for or reveal such heterogeneity. It is precisely this “non-revelation characteristic” that may undermine the effectiveness of sales incentive contracts. Therefore, in studying how salesperson heterogeneity affects the effectiveness of standardized incentive contracts and how to quantitatively evaluate such effectiveness loss, the model specifications in scenarios CK and PK remain valid. What requires further investigation is how heterogeneous salespeople respond differentially to the aforementioned standardized contracts, how these responses influence contractual performance, and how such heterogeneity and its effects can be made explicit.

4. The Incentive Contract Effectiveness Evaluation with Salesperson Heterogeneity

In this section, we examine how salesperson heterogeneity, specifically in terms of capabilities, effort costs, and risk attitudes, affects the payoffs of both parties and the effectiveness of the standardized incentive contract proposed in Section 3. At the same time, we also aim to identify a practically feasible approach that enables firms to “observe” the existence and severity of such heterogeneity among salespeople.

4.1. Salesperson Heterogeneity in Scenario CK

4.1.1. The Incentive Contract Effectiveness Evaluation with Heterogeneity in Salespeople’s Capabilities

When salespeople’s capabilities are heterogeneous, the effort exerted by individuals varies under a standardized incentive contract.
For salespeople with weaker capabilities, the optimal effort level is lower:
ε i = β d i k < β d k .
And their expected income and utility are lower than anticipated:
w i = α + β ( x + d i ε i ) < w ,
U ( ε i ) = α + β x + ( β d i ) 2 2 k γ 2 δ 2 β 2 < U ( ε ) .
Conversely, for salespeople with stronger capabilities, the optimal effort level is higher than ε , and their expected income and utility exceed expectations.
In summary, for salespeople with d i > d , U ( ε i ) > U ( ε ) , while for those with d i < d , U ( ε i ) < U ( ε ) . Given U ( ε ) = μ 0 , it follows that U ( ε i ) > μ 0 for salespeople with d i > d , and U ( ε i ) < μ 0 for those with d i < d . Consequently, in the long term, salespeople with d i < d will opt out, whereas those with d i > d will remain and gain premium utility. Then, we can derive Proposition 1.
Proposition 1. 
Under a standardized incentive contract, when salespeople exhibit heterogeneous capabilities, those whose capabilities fall below the threshold are naturally eliminated, while those with above-standard capabilities choose to remain and earn excess returns.
In this case, the effectiveness of the sales incentive contract is undermined. While the firm may reduce the fixed salary component and increase the commission rate to boost profits, “overqualified” salespeople leverage the capability-level information they acquire to achieve excess utility. As a result, the actual effectiveness of the incentive contract falls short of its intended design.
Proposition 2. 
Under a standardized incentive contract, the presence of heterogeneous sales capabilities reduces the contract’s effectiveness relative to its intended design.
Interestingly, when managers monitor the work status of salespeople, these salespeople exert effort beyond anticipated levels, yet the effectiveness of the sales incentive contract is diminished.
If we introduce additional ranks for salespeople and formulate differentiated incentive contracts tailored to each rank, allowing salespeople with higher capabilities to ascend to higher ranks, then under the optimal incentive contract, those in the higher ranks will receive a greater total income compared those of to their counterparts in lower ranks. However, their utility will remain equivalent to that of the lower-ranked salespeople, while the effectiveness of the company’s sales incentive contracts is enhanced.
Next, we discuss the distribution of the actual income among salespeople in this scenario and examine the feasibility of using graphical representations based on this income distribution to identify heterogeneity among the salespeople and evaluate the effectiveness of the standardized incentive contract.
Considering that in practice, the only observable variables for the firm are the actual sales volume and the corresponding actual income of the salespeople, we propose using the deviation between the actual income distribution of the salespeople and the expected distribution to assess the heterogeneity among salespeople and the corresponding effectiveness deviation of sales incentive contracts.
Assume M salespeople use the same sales incentive contract and their incomes are represented by the variable W, with a probability density function of g. Let the income of any salesperson be W ^ i , with a probability density function ϕ i . According to the model’s solution in Section 3, W ^ i is identically normally distributed as follows:
W ^ i N α + β ( x + d i ε i ) , β 2 δ 2 .
Using the actual income of M salespeople as a sample, an empirical income distribution kernel density curve can be constructed. If all M salespeople are homogeneous and the sample size is sufficiently large, the kernel density curve asymptotically approaches the probability density function as follows:
g ( ϖ ) = 1 M i = 1 M ϕ i ( ϖ ) = ϕ i ( ϖ ) .
Therefore, W is normally distributed, i.e., W N α + β ( x + d ε ) , β 2 δ 2 .
Under heterogeneous sales capability conditions, the probability density functions of income for different salespeople ( ϕ i ) vary. The overall probability density function ( g ( ϖ ) ) is expressed as follows:
g ( ϖ ) = 1 M i = 1 M ϕ i ( ϖ ) .
The statistical characteristics of the variable W are derived as follows:
E ( W ) = i = 1 M ϕ i ( ϖ ) M ϖ d ϖ = 1 M i = 1 M ϕ i ( ϖ ) ϖ d ϖ = i = 1 M E ( W ^ i ) M .
The expected value of W represents the mean of the expected incomes of M salespeople. If most salespeople have lower capabilities, the expected value of W shifts leftward. Conversely, if most have higher capabilities, the expected value shifts rightward.
Figure 1 provides a possible schematic illustration of g ( ϖ ) . The probability density function of g ( ϖ ) shifts leftward compared to that in the homogeneous case if most salespeople have lower capabilities and rightward if most have higher capabilities.
The variance of W is given by
D ( W ) = ( ϖ E ( W ) ) 2 i = 1 M ϕ i ( ϖ ) M d ϖ = i = 1 M D ( W ^ i ) M + i = 1 M ( E ( W ) E ( W ^ i ) ) 2 M .
The first term in equation (21) represents the mean of D ( W ^ i ) . Since heterogeneity in sales capability does not affect D ( W ^ i ) , this term remains β 2 δ 2 . The second term is always positive, unless all M salespeople share the same d i , indicating that D ( W ) exceeds the variance expected under homogeneity.
As Figure 1 illustrates, compared to the expected normal distribution, the resulting distribution is more dispersed, with a larger variance.
Proposition 3. 
Under standardized sales incentive contracts, the presence of capability heterogeneity in salespeople leads to a shift in the mean value of salespeople’s actual income and an increase in the variance of actual income distribution.
Furthermore, the probability density function ( g ( ϖ ) = 1 M i = 1 M ϕ i ( ϖ ) ) deviates from a normal distribution. The direction and degree of heterogeneity in capability may vary among salespeople, leading to differing changes in expected income. Consequently, the probability density curve of g ( ϖ ) may lose symmetry around its mean value and exhibit an irregular shape. Figure 1 provides a possible schematic illustration.
Using the actual income of M salespeople as a sample, an empirical income distribution kernel density curve can be constructed. We can find that under a standardized incentive contract, when salespeople exhibit heterogeneous capabilities, comparing the actual income distribution of all the salespeople with the expected normal distribution provides a basis for observing and assessing the degree of heterogeneity among the salespeople as well as the deviation in the effectiveness of the standardized contract. If actual capabilities are heterogeneous, the actual income distribution will exhibit greater variance and be more dispersed than the expected distribution. Moreover, if the majority of the salespeople possess capabilities above the standard level, the income distribution will be right skewed; conversely, if most fall below the standard, the distribution will be left skewed.

4.1.2. The Incentive Contract Effectiveness Evaluation with Heterogeneity in Salespeople’s Effort Costs

When the effort costs for salespeople are heterogeneous, similar to those in Section 4.1.1, the effort exerted by individuals varies. For salespeople with higher effort costs, the optimal effort level is lower, and their expected income, as well as their utility, is also lower than anticipated, i.e, ε i = β ( x ) d k i < β ( x ) d k , w i = α + β ( x + d ε i ) < w , and U ( ε i ) = α + β x + ( β d ) 2 2 k i γ 2 δ 2 β 2 < U ( ε ) . Conversely, for salespeople with a lower effort cost, the optimal effort level and expected income and utility are higher.
Proposition 4. 
Under a standardized incentive contract, (1) when salespeople differ in their effort costs, those with costs above the standard level are naturally screened out, while those with lower effort costs choose to stay and earn excess returns; (2) the presence of heterogeneous effort costs among salespeople leads to an actual effectiveness that falls short of the contract’s intended design.
In this scenario, the impact of heterogeneous effort costs on W mirrors that in Section 4.1.1. Using the actual income of M salespeople as a sample, an empirical income distribution kernel density curve can be constructed, similar to that in Section 4.1.1; in addition, the comparison between the actual income distribution of all the salespeople and the expected normal distribution yields results similar to those discussed in Section 4.1.1.
Proposition 5. 
Under standardized sales incentive contracts, the presence of effort cost heterogeneity among salespeople leads to a shift in the mean value of the salespeople’s actual income and an increase in the variance of the actual income distribution.
It is worth noting that we can introduce additional ranks for salespeople and formulate differentiated incentive contracts tailored to each rank, allowing salespeople with lower effort costs to ascend to higher ranks to enhance the effectiveness of sales incentive contracts.

4.1.3. The Incentive Contract Effectiveness Evaluation with Heterogeneity in Salespeople’s Risk Attitudes

When salespeople exhibit heterogeneous risk attitudes, the model solution in Section 3 shows that for salespeople with γ i > γ , we have U ( ε i ) < U ( ε ) , whereas for those with γ i < γ , it holds that U ( ε i ) > U ( ε ) . Given U ( ε ) = μ 0 , and it follows that U ( ε i ) < μ 0 for salespeople with γ i > γ and U ( ε i ) > μ 0 for those with γ i < γ . Consequently, in the long term, salespeople with γ i > γ will opt out, whereas those with γ i < γ will remain and gain premium utility.
In this scenario, the effectiveness of the sales incentive contract is compromised because the firm could have reduced the fixed part of wages and increased the commission coefficient to achieve greater profits.
Proposition 6. 
Under a standardized incentive contract, (1) when salespeople exhibit heterogeneous risk attitudes, those with overly conservative risk attitudes are naturally screened out, while those with more aggressive risk attitudes choose to remain and earn excess returns; (2) heterogeneity in salespeople’s actual risk attitudes leads to a reduction in the contract’s effectiveness compared to its designed performance.
However, in this scenario, there is no deviation between the actual income distribution and the expected distribution. Under the same sales incentive strategy ( ( α , β ) ), the effort exerted by the individual salesperson remains unchanged ( ε = β d k ), as well as the expected income. Therefore, W ^ i remains identically normally distributed, i.e., W ^ i N α + β ( x + d ( ε ) , β 2 δ 2 . The overall probability density function of W is g ( ϖ ) = 1 M i = 1 M ϕ i ( ϖ ) = ϕ i ( ϖ ) , which remains normally distributed and consistent with expectations. Therefore, in this scenario, employing the actual income distribution of salespeople as a tool to determine sales heterogeneity, and evaluating the effectiveness of the sales incentive contract fails to yield valid results.
Proposition 7. 
Under standardized sales incentive contracts, heterogeneity in salespeople’s risk attitudes does not affect their actual income distribution.
Unlike heterogeneity in capabilities or effort costs, differences in risk attitudes among salespeople affect only their utilities without influencing effort levels or sales performance under standardized incentive contracts. Since the compensation function does not include a risk premium, the unobservable nature of risk attitude heterogeneity in income thus renders this evaluation method ineffective for salespeople with diverse risk attitudes.

4.2. Salesperson Heterogeneity in Scenario PK

4.2.1. The Incentive Contract Effectiveness Evaluation with Heterogeneity in Salespeople’s Capabilities

In this case, the original expression of U ( ε , y ) can be transformed as follows:
U ( y ) = α ( y ) + β ( y ) x + β 2 ( y ) d 2 2 k γ 2 δ 2 β 2 ( y ) + β 2 ( y ) ( Δ d 2 + 2 d Δ d ) 2 k ,
where the first part is consistent with the original function, and Δ d represents the difference between the actual capability of a salesperson and the parameter in the original model. A positive Δ d value indicates higher capability, while a negative Δ d value indicates lower capability.
Proposition 8. 
When salespeople’s capabilities are heterogeneous, with the same market potential sales volume (x), salespeople’s feedback on x varies conditionally based on their private information ( d i ).
Therefore, the heterogeneity of salespeople’s capabilities can be further assessed by exposing salespeople to additional information.
As demonstrated by the numerical experiments in Section 5, salespeople with lower capability tend to underreport x, while those with higher capability tend to overreport x.
Therefore, under a standardized incentive contract, when salespeople have heterogeneous capabilities, the sales manager can ask them to report the market’s potential sales volumes. According to these reports, the manager can observe and infer the degree of heterogeneity among the salespeople as well as the extent to which the effectiveness of the standardized incentive contract deviates.

4.2.2. The Incentive Contract Effectiveness Evaluation with Heterogeneity in Salespeople’s Effort Costs

In this case, the original expression of U ( ε , y ) can be transformed as follows:
U ( y ) = α ( y ) + β ( y ) x + β 2 ( y ) d 2 2 k γ 2 δ 2 β 2 ( y ) Δ k β 2 ( y ) d 2 2 k ( k + Δ k ) ,
where the first part is consistent with the original function, and Δ k represents the difference between the actual effort cost of a salesperson and the parameter in the original model. A positive Δ k value indicates higher effort cost, while a negative Δ k value indicates lower effort cost.
Proposition 9. 
When salespeople’s effort costs are heterogeneous, with the same market potential sales volume (x), salespeople’s feedback on x varies conditionally based on their private information ( k i ).
Therefore, the heterogeneous effort costs of salespeople can be further assessed by exposing salespeople to additional information.
As demonstrated by the numerical experiments in Section 5, salespeople with higher effort costs tend to underreport x, while those with lower effort costs tend to overreport x.
Therefore, under a standardized incentive contract, when salespeople have heterogeneous effort costs, the sales manager can ask them to report the market’s potential sales volumes. According to these reports, the manager can observe and infer the degree of heterogeneity among the salespeople as well as the extent to which the effectiveness of the standardized incentive contract deviates.

4.2.3. The Incentive Contract Effectiveness Evaluation with Heterogeneity in Salespeople’s Risk Attitudes

In this case, the original expression of U ( ε , y ) can be transformed as follows:
U ( y ) = α ( y ) + β ( y ) ( x + d ε ) k 2 ε 2 γ 2 δ 2 β 2 ( y ) Δ γ 2 δ 2 β 2 ( y ) ,
where the first part is consistent with the original function, and Δ γ represents the difference between the actual risk attitude of a salesperson and the parameter in the original model. A positive Δ γ value indicates higher risk aversion, while a negative Δ γ value indicates lower risk aversion.
Proposition 10. 
When salespeople’s risk attitudes are heterogeneous, with the same market potential sales volume (x), salespeople’s feedback on x varies conditionally based on their private information ( γ i ).
Therefore, the heterogeneous risk attitudes of salespeople can be further assessed by exposing salespeople to additional information.
As demonstrated by the numerical experiments in Section 5, salespeople with higher risk aversion tend to underreport x, while those with lower risk aversion tend to overreport x.
Therefore, under a standardized incentive contract, when salespeople have heterogeneous risk attitudes, the sales manager can request them to report the market’s potential sales volumes. According to these reports, the manager can observe and infer the degree of heterogeneity among the salespeople as well as the extent to which the effectiveness of the standardized incentive contract deviates.

4.3. Summary of Evaluation Methods

According to the analyses in Section 4.1 and Section 4.2, we derive the following three findings regarding the evaluation methods:
(1)
Evaluation based on actual income distribution relies on interim performance outcomes as evaluation signals, serving as a form of ex post (real-time) control. In contrast, evaluation based on salespeople’s reported market potential sales volumes uses their information transmission as signals and functions as a form of ex ante (preemptive) control;
(2)
In the game between the firm and salespeople over the sales incentive contract, when the market potential is private information held by the salespeople, the ex ante control method is effective under all three types of heterogeneity: capability, effort cost, and risk attitude. When the market potential is common knowledge, the ex post control method is effective under capability heterogeneity and effort cost heterogeneity but ineffective under risk attitude heterogeneity;
(3)
Even when the market potential is private information, the ex post control method remains effective under capability and effort cost heterogeneities and can serve as a complementary approach to ex ante control in practical implementation.

4.4. Further Discussion on Dynamics and Selection

The model and evaluation framework proposed in this study constitute a static analysis. However, as Propositions 2, 4 and 6 demonstrate, standardized contracts induce a selection effect (i.e., the exit of low-competency types), which leads to an improvement in the posterior-type distribution over time. This dynamic implication underscores the necessity of incorporating the principal–agent interplay under standardized incentives into a multi-period framework.
In such a multi-period setting, if salespeople are myopic and optimize only their short-term gains, while the firm updates its beliefs regarding salesperson heterogeneity and the effectiveness of the standardized contract based on prior-period observations and accordingly adjusts the contract parameters, then through iterative contract updates and ongoing selection, the firm’s belief updating and the effectiveness of the incentive mechanism will progressively become more accurate. Furthermore, aligned with practical sales management, the firm should undertake organizational adjustments (e.g., sales team structural changes) at the end of each cycle based on diagnostic outcomes. Such interventions would accelerate the convergence toward the optimal contract performance. This process precisely underscores the practical significance of the evaluation methods proposed in this study.
If salespeople are far-sighted and base their decisions on both current payoffs and anticipated future firm actions, their short-term responses become strategically distorted to maximize multi-period utility. This behavior creates an incentive to conceal their true heterogeneity, a phenomenon akin to the “ratchet effect” extensively documented in the sales management literature. Consequently, such strategic concealment compromises the validity of the proposed evaluation methods. To break this equilibrium and prompt earlier truth-telling, firms should consider implementing countermeasures against the ratchet effect, such as high-powered bonus contests or the strategic leverage of career concerns.

5. Monte Carlo Numerical Simulation Experiments

In this section, we employ Monte Carlo simulations to illustrate the impact of the salesperson heterogeneity on the effectiveness of a standardized incentive contract as well as to validate the effectiveness of the two evaluation methods proposed in this study. We assume a sales force consisting of 200 salespeople. The parameters used to design the standardized sales incentive contract are as follows: x = 1 , μ 0 = 1 , γ = 1 , k = 1 , d = 1 , and θ N ( 0 , 1 ) .

5.1. Salesperson Heterogeneity in Scenario CK

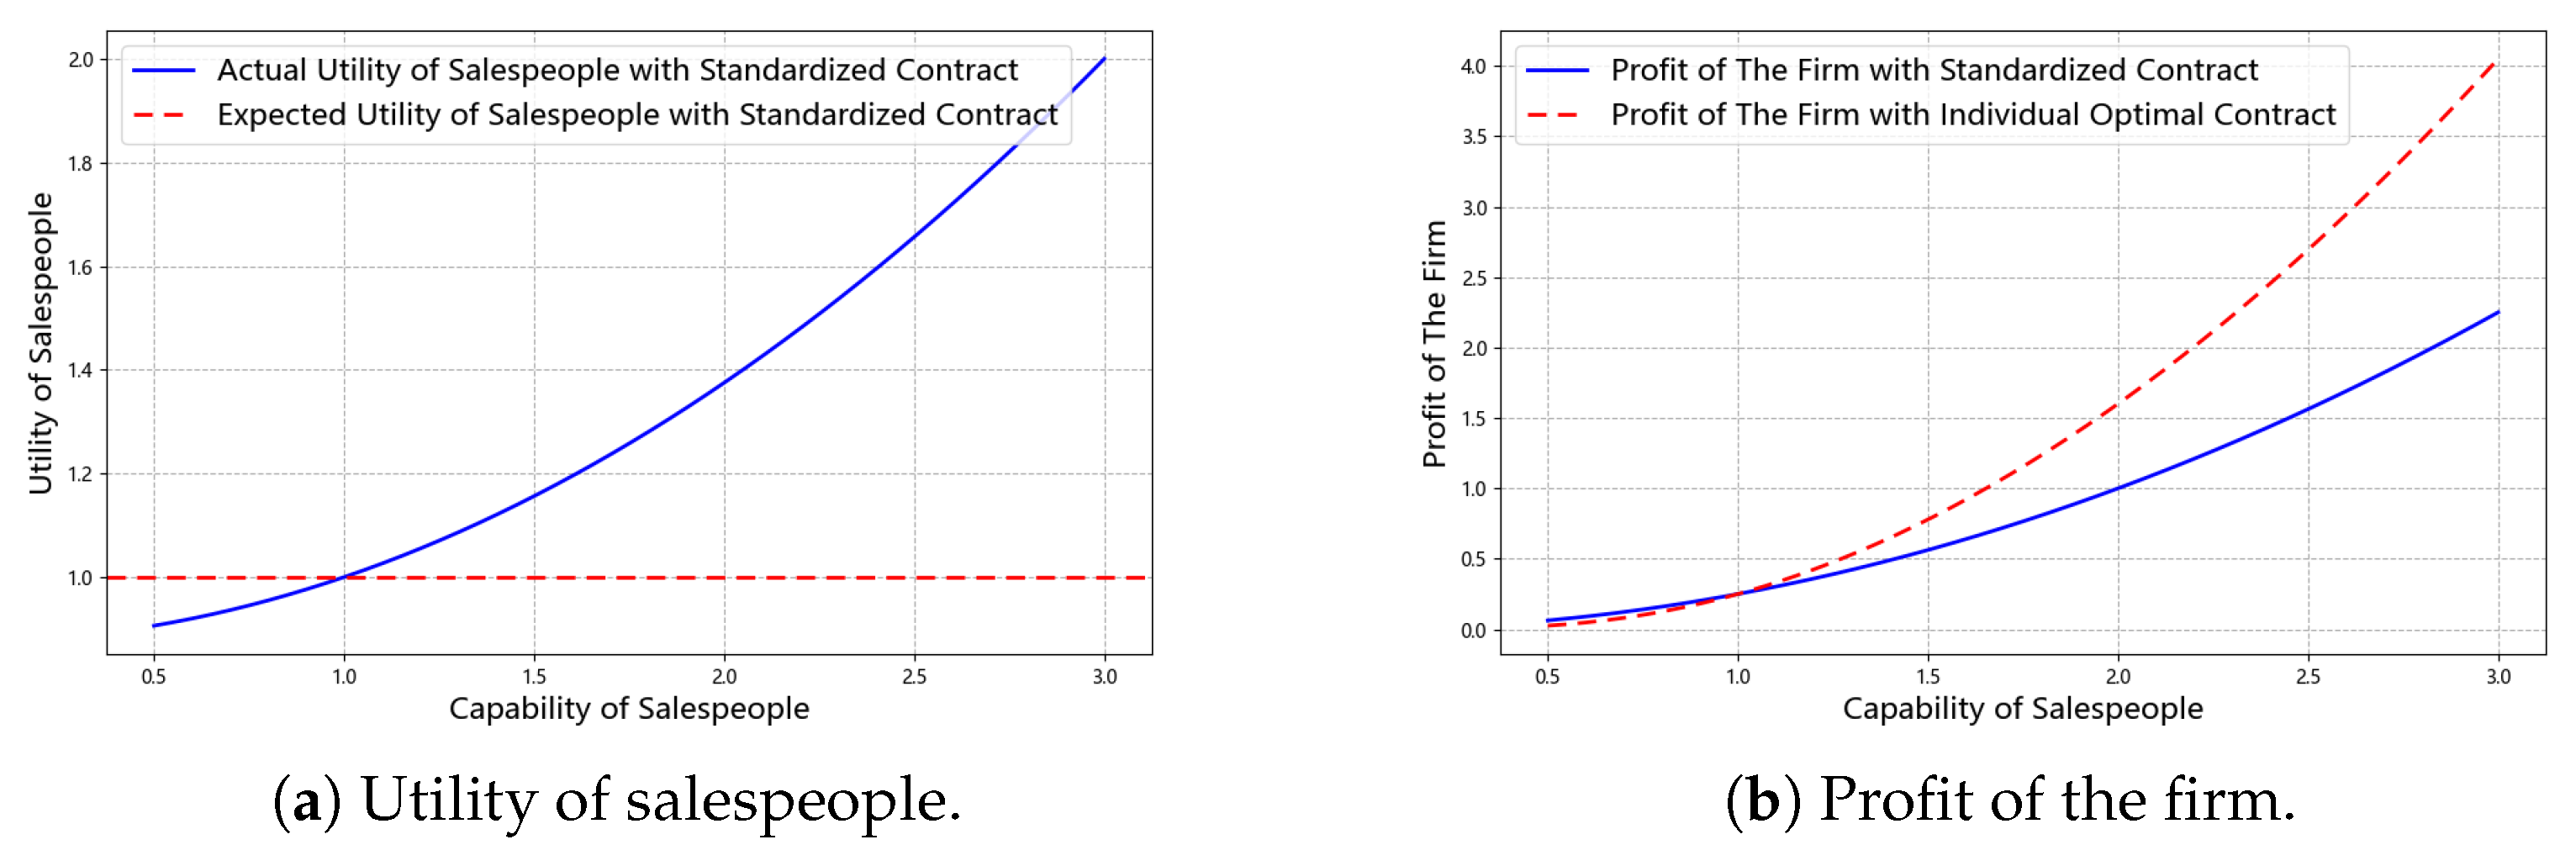
Heterogeneity in Salespeople’s Capabilities. When the actual capability coefficients of the salespeople are uniformly distributed over the interval [ 0.5 , 3 ] while the reference value used to design the standardized incentive contract is set at 1, Figure 2 shows the benefits for both parties. Figure 2a depicts the gap between the opportunity utility and actual utility for salespeople with varying capability levels. It shows that salespeople with capability levels below the reference value of 1 experience insufficient utility and will exit the game, while those with capability levels above 1 enjoy excess utility. Moreover, this excess utility increases with increasing deviation of the capability from the reference value. Therefore, the results support Proposition 1. Figure 2b shows the difference in the firm’s net profit under the standardized contract versus the optimal contract across different capability levels. It can be observed that salespeople with capabilities higher than the reference value of 1 lead to a loss in the effectiveness of the standardized incentive contract, and this loss increases as the gap between the actual capability level and the reference value widens. Therefore, the results support Proposition 2.
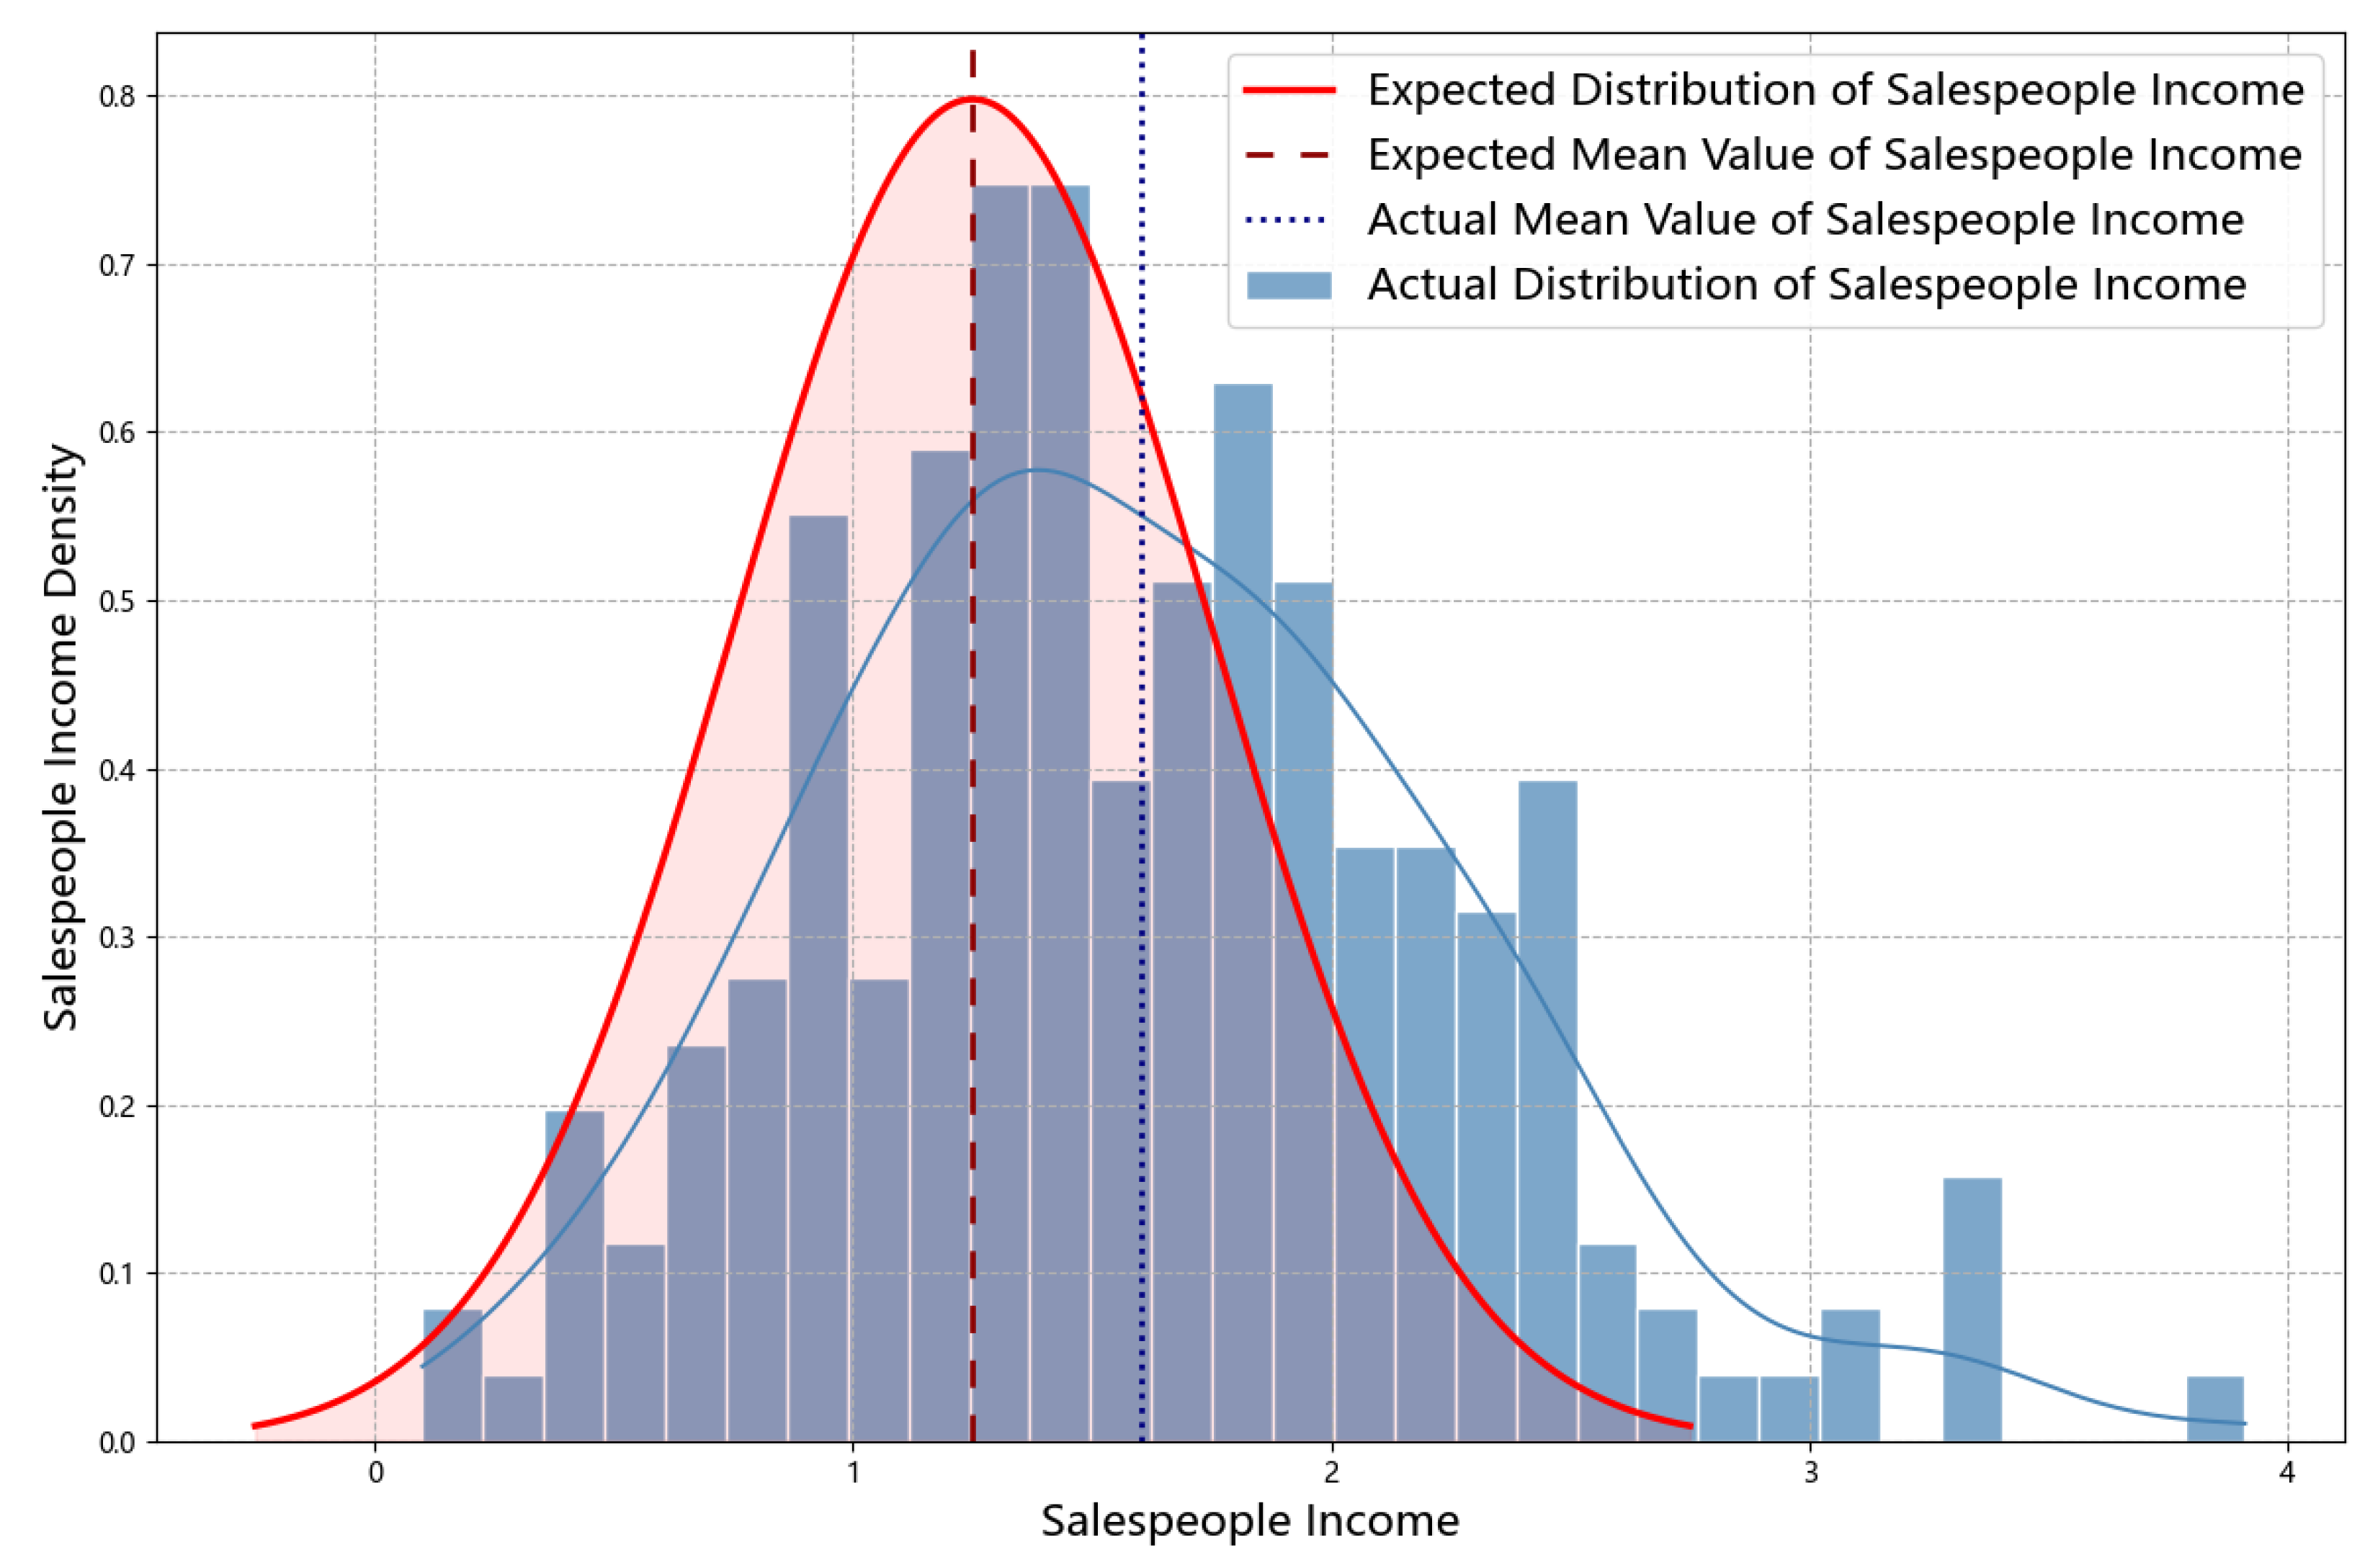
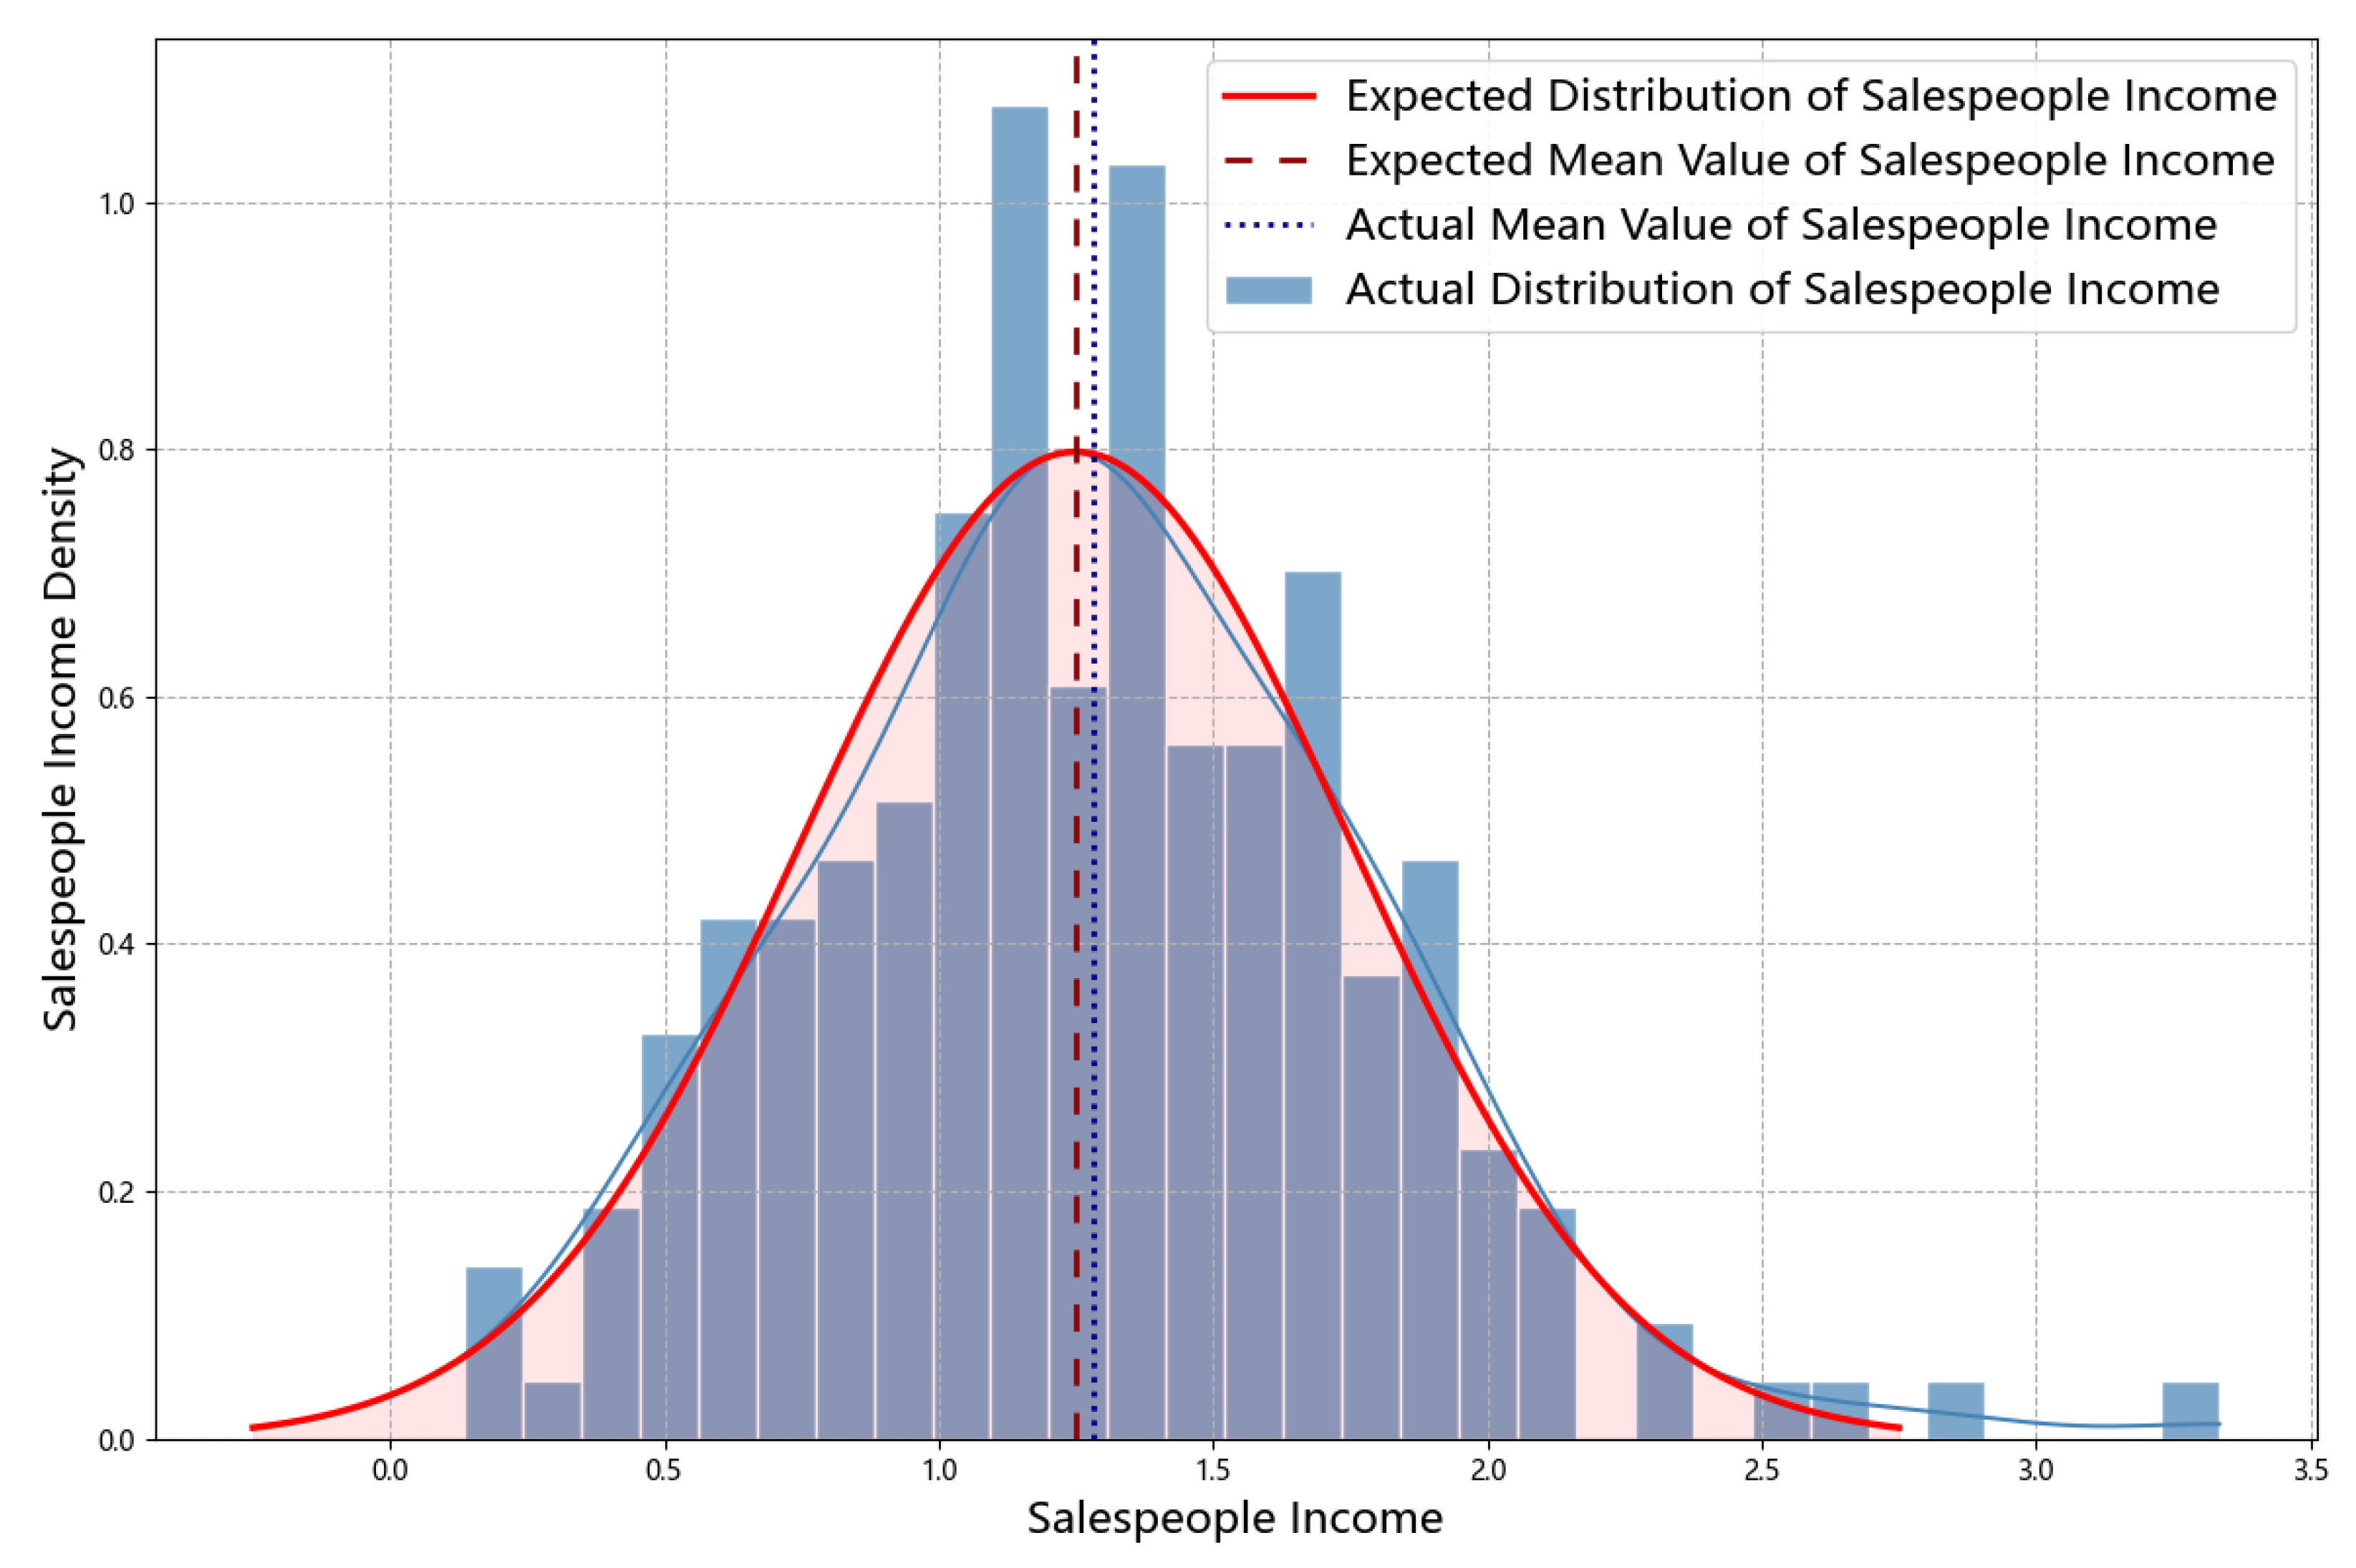
Figure 3 presents a possible comparison between the firm’s expected income distribution for the 200 salespeople and their actual income distribution (the latter curve is subject to randomness due to market uncertainty ( θ ), and the figure illustrates one possible realization). In this scenario, the actual income distribution shifts to the right and becomes more dispersed compared to the expected curve. Therefore, the results support Proposition 3.
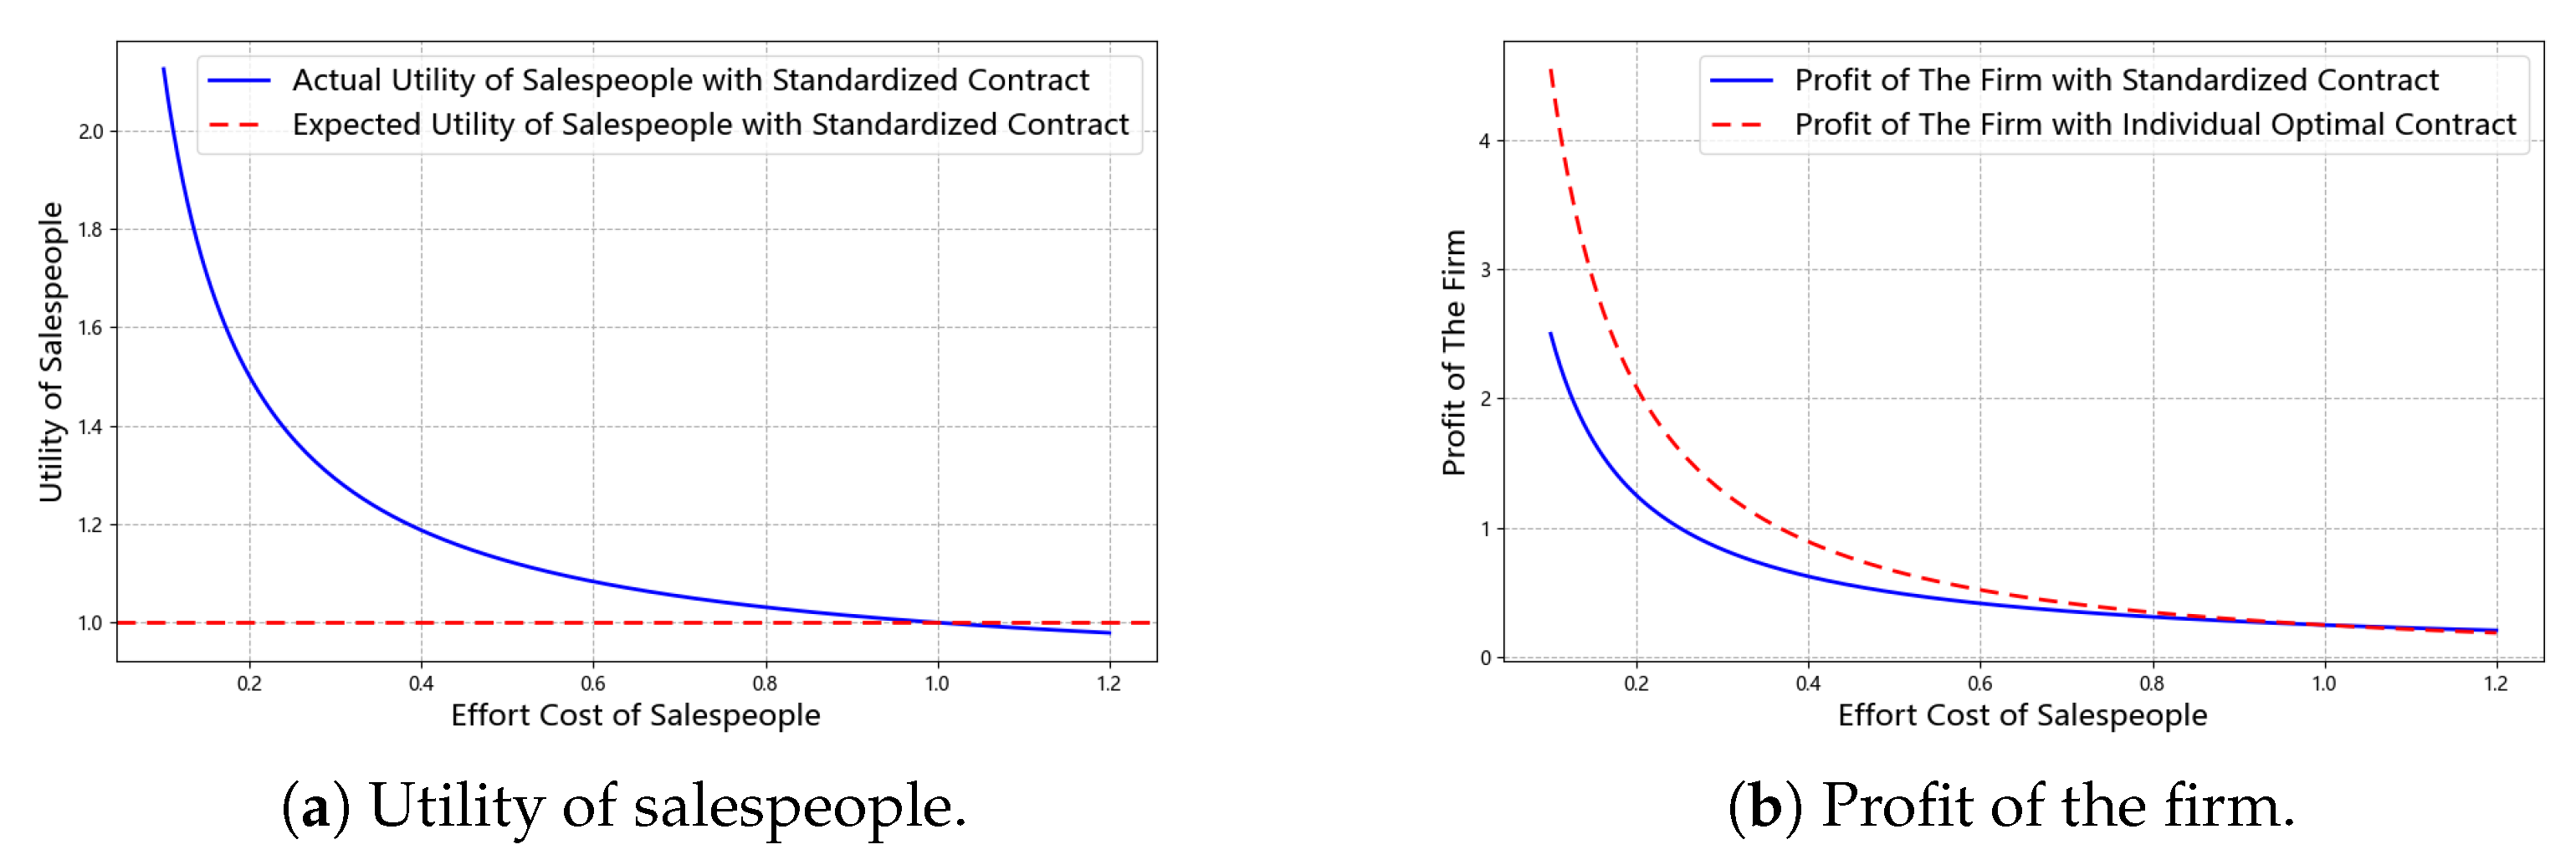
Heterogeneity in Salespeople’s Effort Costs. When the actual effort cost coefficients of the salespeople are uniformly distributed over the interval [ 0.1 , 1.2 ] while the reference value used to design the standardized incentive contract is set at 1, Figure 4 shows the benefits for both parties. Figure 4a depicts the gap between the opportunity utility and actual utility for salespeople with varying effort cost levels. It shows that salespeople with effort costs above the reference value of 1 experience insufficient utility and will exit the game, while those with effort costs below 1 enjoy excess utility. Moreover, this excess utility increases with increasing deviation of the effort cost from the reference value. Figure 4b shows the difference in the firm’s net profit under the standardized contract versus the optimal contract across different effort costs. It can be observed that salespeople with effort costs lower than the reference value of 1 lead to a loss in the effectiveness of the standardized incentive contract, and this loss increases as the gap between the actual effort cost level and the reference value widens. Therefore, the results support Proposition 4.
Figure 5 presents a possible comparison between the firm’s expected income distribution for the 200 salespeople and their actual income distribution (the latter curve is subject to randomness due to market uncertainty ( θ ), and the figure illustrates one possible realization). In this scenario, the actual income distribution shifts to the right and becomes more dispersed compared to the expected curve. Therefore, the results support Proposition 5.
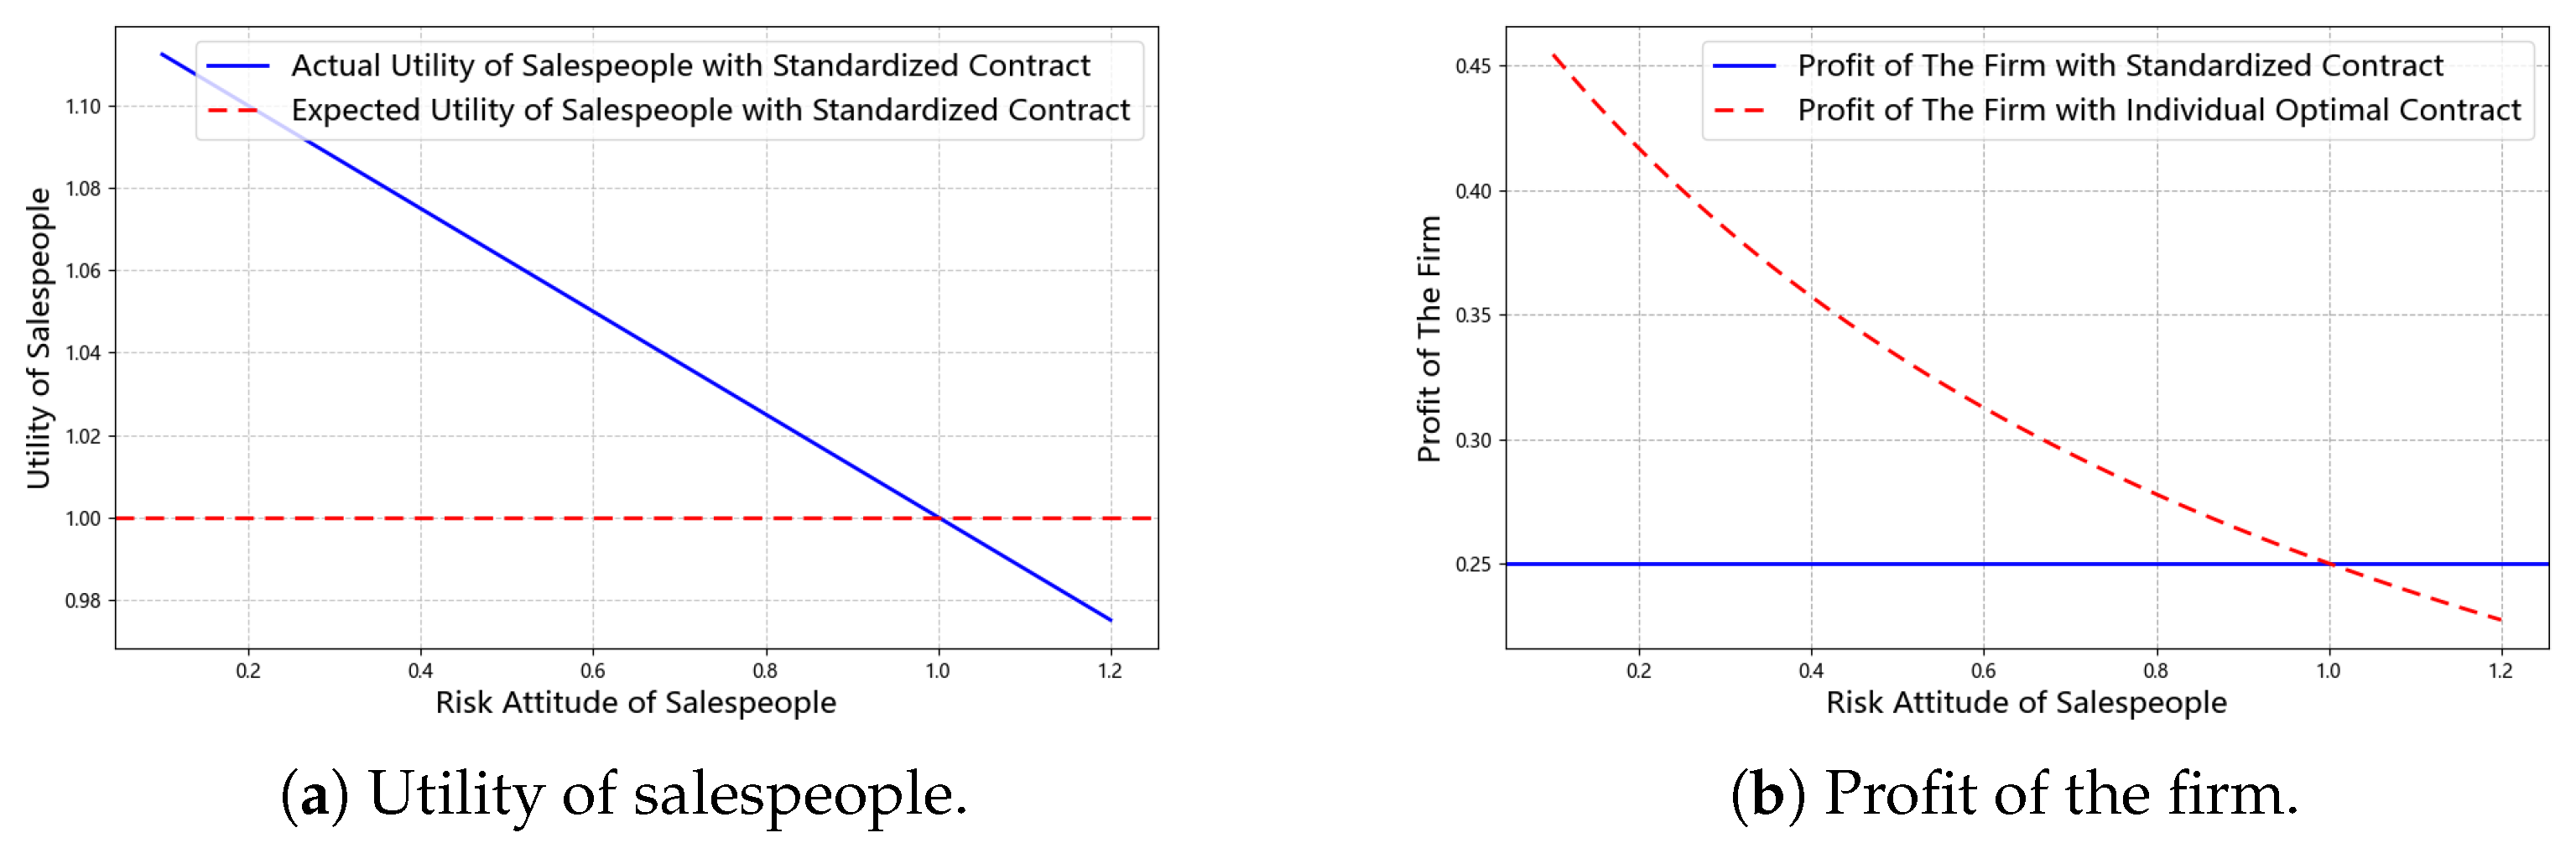
Heterogeneity in Salespeople’s Risk Attitudes. When the actual risk aversion coefficients of the salespeople are uniformly distributed over the interval [ 0.1 , 1.2 ] while the reference value used to design the standardized incentive contract is set at 1, Figure 6 shows the benefits for both parties. Figure 6a depicts the gap between the opportunity utility and actual utility for salespeople with varying risk attitudes. It shows that salespeople with risk attitudes above the reference value of 1 experience insufficient utility and will exit the game, while those with risk attitudes below 1 enjoy excess utility. Moreover, this excess utility increases with increasing deviation of the risk attitude from the reference value. Figure 6b shows the difference in the firm’s net profit under the standardized contract versus the optimal contract across different risk attitudes. It can be observed that lower risk aversion levels compared to the reference value of 1 lead to a loss in the effectiveness of the standardized incentive contract, and this loss increases as the gap between actual risk aversion and the reference value widens. Therefore, the results support Proposition 6.
However, as Figure 7 shows, the actual income distribution closely matches the expected distribution, indicating that this evaluation method fails to capture heterogeneity in risk attitudes. Therefore, the results support Proposition 7.
In corporate practice, firms establish an expected target compensation for each level of salespeople, reflecting expected income under standardized incentive contracts based on market conditions and the profile of the salespeople at each tier. Internally, this value is embedded in the human resource department’s compensation structure as target pay figures, which are typically confidential. Externally, salespeople and candidates may infer aspects of this expectation through job advertisements and compensation communications. Variance in expected compensation originates primarily from market uncertainty, a parameter that firms can estimate with reasonable accuracy using historical sales management data. Therefore, within traditional sales management contexts, firms possess a robust empirical foundation to apply the ex post evaluation method proposed in this study.

5.2. Salesperson Heterogeneity in Scenario PK

Assume that salespeople possess accurate information about the market’s potential sales volume ( x = 1 ), while the firm does not have access to this information and only knows that x follows a uniform distribution over the interval [ 0.5 , 1.5 ] . Then, the failure rate function is given by h ( x ) = 1 1.5 x .
Under the optimal standardized contract design discussed in Section 3.2, according to the salespeople’s reported information (y) about the market potential (x), the firm accordingly sets the following incentive contract parameters:
β ( y ) = 2 y 1 4 , α ( y ) = 1 + β 2 ( y ) y β ( y ) + 0.5 y β ( z ) d z = 17 16 y 2 4 .
Heterogeneity in Salespeople’s Capabilities. When the actual capability coefficients of the salespeople are uniformly distributed over the interval [ 0.5 , 3 ] while the reference value used to design the standardized incentive contract is set at 1, the individual utility function of a salesperson under the above incentive contract parameters is given by
U i ( y ) = α ( y ) + β ( y ) x + β 2 ( y ) d 2 2 k γ 2 δ 2 β 2 ( y ) + β 2 ( y ) ( Δ d i 2 + 2 d Δ d i ) 2 k ,
which can be simplified to
U i ( y ) = 13 16 y 2 4 + y 2 + ( 2 y 1 4 ) 2 ( Δ d i 2 + 2 Δ d i 2 ) .
Let y = arg max U i ( y ) denote the optimal response of salespeople with heterogeneous capabilities to the true market potential. The response function of salespeople within the intervals Δ d i [ 0.5 , 2 ] and y [ 0.5 , 1.5 ] is illustrated in Figure 8a. It can be observed that salespeople with heterogeneous capabilities respond inconsistently to the same true market potential. Specifically, when salespeople’s capability level is exactly at the reference value of 1, which corresponds to the point on the curve where the horizontal coordinate is zero, they report a true market potential value of 1, those with capability levels above the reference value tend to overreport the market potential, while those with capability levels below the reference value tend to underreport it. Therefore, the Monte Carlo simulation results support Proposition 8.
Heterogeneity in Salespeople’s Effort Costs. When the actual effort cost coefficients of the salespeople are uniformly distributed over the interval [ 0.1 , 1.2 ] while the reference value used to design the standardized incentive contract is set at 1, the individual utility function of a salesperson under the above incentive contract parameters is given by
U i ( y ) = α ( y ) + β ( y ) x + β 2 ( y ) d 2 2 k γ 2 δ 2 β 2 ( y ) Δ k i β 2 ( y ) d 2 2 k ( k + Δ k i ) ,
which can be simplified to
U i ( y ) = 13 16 y 2 4 + y 2 ( 2 y 1 4 ) 2 ( Δ k i 2 ( 1 + Δ k i ) ) .
Let y = arg max U i ( y ) denote the optimal response of salespeople with heterogeneous effort costs to the true market potential. The response function of salespeople within the intervals Δ k i [ 0.9 , 0.2 ] and y [ 0.5 , 1.5 ] is illustrated in Figure 8b. It can be observed that salespeople with heterogeneous effort costs respond inconsistently to the same true market potential. Specifically, when salespeople’s effort cost is exactly at the reference value of 1, which corresponds to the point on the curve where the horizontal coordinate is zero, they report a true market potential value of 1, those with effort costs above the reference value tend to underreport the market potential, while those with effort costs below the reference value tend to overreport it. Therefore, the Monte Carlo simulation results support Proposition 9.
Heterogeneity in Salespeople’s Risk Attitudes. When the actual risk aversion coefficients of the salespeople are uniformly distributed over the interval [ 0.1 , 1.2 ] while the reference value used to design the standardized incentive contract is set at 1, the individual utility function of a salesperson under the above incentive contract parameters is given by
U i ( y ) = α ( y ) + β ( y ) ( x + d ε ) k 2 ε 2 γ 2 δ 2 β 2 ( y ) Δ γ i 2 δ 2 β 2 ( y ) ,
which can be simplified to
U i ( y ) = 13 16 y 2 4 + y 2 ( 2 y 1 4 ) 2 ( Δ γ i 2 ) .
Let y = arg max U i ( y ) denote the optimal response of salespeople with heterogeneous risk attitudes to the true market potential. The response function of salespeople within the intervals Δ γ i [ 0.9 , 0.2 ] and y [ 0.5 , 1.5 ] is illustrated in Figure 8c. It can be observed that salespeople with heterogeneous risk attitudes respond inconsistently to the same true market potential. Specifically, when salespeople’s risk attitude is exactly at the reference value of 1, which corresponds to the point on the curve where the horizontal coordinate is zero, they report a true market potential value of 1, and those who are more risk averse than the reference level tend to underreport the market potential, while those who are less risk averse tend to overreport it. Therefore, the Monte Carlo simulation results support Proposition 10.
In practical firm settings, particularly under conditions of extensive market coverage and multi-layered sales management structures, information regarding potential sales volumes across various markets is of paramount importance for designing sales incentive policies. Such information serves as a critical element in negotiations between the firm and the salespeople concerning incentive schemes. Consequently, soliciting feedback from salespeople on potential market demand constitutes a conventional practice in sales management. As a result, firms possess a well-established managerial foundation for implementing the ex ante evaluation approach proposed in this study.

5.3. Robustness Check

In the simulation experiments presented in this section, the parameters ( x , μ 0 , γ , k , d , and δ ) were assigned a uniform value of 1 for clarity of exposition and illustrative purposes, and the heterogeneity of ( γ , k , d ) was initially assumed to follow a uniform distribution. To verify the robustness of the findings under various parameter configurations and heterogeneity assumptions, we systematically varied the key parameters across different combinations (e.g., (10, 8, 2, 1, 2, 1) and (10, 8, 1, 2, 2, 1)) and further examined cases where the heterogeneity of parameters γ , k , and d follows other distributions, such as a normal distribution. The simulation results confirm that although specific numerical outcomes vary, the core findings and main conclusions of this study remain consistent across all the tested parameter sets and heterogeneity distribution assumptions. These robustness checks collectively attest to the reliability and generalizability of our conclusions.

6. Conclusions

This study underscores the critical role of salesperson heterogeneity in shaping the effectiveness of standardized incentive contracts. By constructing game-theoretical models of standardized sales incentive contracts in two scenarios and analyzing how heterogeneous salespeople respond to these contracts, the study finds that heterogeneity weakens the incentive effectiveness of standardized contracts. To address this challenge, it proposes two practical evaluation methods to help firms assess and adjust both the degree of salesperson heterogeneity and the actual effectiveness of standardized incentive contracts.

6.1. Key Findings

The main findings are as follows: (1) Heterogeneity among the salespeople leads to a loss in the incentive effectiveness of standardized contracts. In the long run, when salespeople under a standardized incentive contract exhibit heterogeneity in individual capabilities, effort costs, or risk attitudes, lower-competency salespeople are naturally screened out, while higher-performing individuals tend to remain and earn excess returns. This self-selection dynamic undermines the overall effectiveness of standardized sales incentive contracts. (2) When the market’s potential sales volume is common knowledge, firms can compare the actual income distribution of salespeople with the expected distribution to evaluate the presence and degree of heterogeneity, serving as an ex post (midterm) control method. When the potential sales volume is the salespeople’s private information, firms can use salespeople’s feedback on perceived market potential as an ex ante (preemptive) control signal to assess heterogeneity. The ex post method remains applicable in this scenario as a supplementary tool. (3) All three types of heterogeneity (capability, effort cost, and risk attitude) negatively affect the contract effectiveness. While the ex ante method applies to all three types, the ex post method is only effective for capability and effort cost heterogeneities, not for risk attitude heterogeneity.

6.2. Managerial Implications

Based on the above findings, this study provides several targeted managerial insights for salesperson management. These recommendations are organized into two primary dimensions: ongoing operational management and holistic system optimization.
Regarding ongoing operational management, firms can utilize the two proposed evaluation methods (ex ante and ex post) to assess and mitigate salesperson heterogeneity and to enhance the effectiveness of standardized incentive contracts. For organizations with relatively flat structures and transparent market demand information, ex post evaluation can be conducted mid-cycle. According to the assessment results, sales teams can be reorganized and incentive contracts adjusted to improve capability alignment within a given hierarchy and the effectiveness of standardized contracts, followed by continuous iterative refinement. For enterprises with more complex organizational structures and opaque market potential information, ex ante evaluation should be employed prior to the sales period. Adjustments to the team structure and incentive contracts can then be made based on feedback from salespeople, thereby improving salesperson alignment in the given hierarchy and contract effectiveness under standardized schemes. A supplementary ex post evaluation may also be conducted mid-cycle for further validation and refinement. Through this cycle of persistent assessment and adjustment, firms can achieve continuous improvement in contract performance and increasingly refined sales management practices.
For holistic system optimization, firms should improve role-competency alignment in areas such as sales position management, recruitment and selection, and career development, including the following specific measures: (1) To improve the homogeneity of salespeople within the same rank, it is necessary to establish more hierarchical levels and set clearer qualification standards for each level. This ensures that individuals within the same tier share similar capabilities, thereby aligning more closely with the expectations of the incentive system. (2) By implementing tailored sales incentive contracts for different hierarchical levels, organizations can better balance the tradeoff between management precision and administrative costs. This approach allows for more targeted incentives, which reflect the specific responsibilities and performance metrics of each tier. (3) While aligning qualifications with role requirements is important, overmatching, selecting candidates whose capabilities far exceed the demands of their positions, can lead to unintended consequences. Overqualified personnel may become complacent, reducing the effectiveness of sales incentive contracts and the overall organizational performance. (4) As salespeople develop and improve their capabilities, timely recognition and promotion are crucial to sustain the effectiveness of incentive contracts. This approach does not necessarily increase costs but ensures that incentive structures remain aligned with the evolving capabilities of the salespeople, maintaining their motivational impact.

6.3. Limitations and Future Research

This study also has some limitations.
First, this study is fundamentally based on a static framework. As demonstrated by Propositions 2, 4 and 6, standardized contracts induce a selection effect (i.e., the exit of low-competency types), leading to a gradual improvement in the posterior-type distribution over the long run. This dynamic, in turn, influences the optimal coefficient settings in the standardized incentive contract. Furthermore, when salespeople are forward looking, their short-term responses may become strategically distorted to maximize multi-period utility, creating an incentive to conceal their true heterogeneity. Such strategic behavior compromises the validity of the proposed evaluation methods. A promising direction for future research would be to develop a multi-period extension model, investigating how to interpret effectiveness diagnostics of standardized incentive contracts under the influence of both selection effects and such intertemporal strategic behaviors, which would offer significant theoretical and practical value.
Second, the current analysis focuses on the evaluation of incentive effectiveness in a single-product, individual-based sales model. Future research could extend this work to more complex sales management settings, such as multi-product sales or team-based incentive structures. Such extensions will necessitate adaptive adjustments to the incentive contract structures within new sales management contexts, as well as corresponding modifications to the methodologies for evaluating incentive effectiveness. These issues warrant further investigation.
In addition, the two evaluation methods proposed in this study are designed for traditional enterprise sales management practices, typically involving relatively stable sales teams, defined evaluation cycles, market sales fluctuations, and historical data on salespeople’s characteristics. These methods may not be applicable to emerging sales models, such as live-streaming sales. Future research could explore how to evaluate incentive effectiveness under such new and rapidly evolving sales formats.

Author Contributions

Conceptualization, N.W. and H.D.; Methodology, N.W., H.D. and L.N.; Software, N.W., H.D. and L.N.; Validation, N.W., H.D. and L.N.; Formal analysis, N.W., H.D. and L.N.; Investigation, N.W., H.D. and L.N.; Resources, N.W.; Data curation, N.W., H.D. and L.N.; Writing—original draft preparation, N.W., H.D. and L.N.; Writing—review and editing, N.W., H.D. and L.N.; Visualization, N.W., H.D. and L.N.; Supervision, H.D. All authors have read and agreed to the published version of the manuscript.

Funding

This research received no external funding.

Data Availability Statement

The original contributions presented in this study are included in the article. Further inquiries can be directed to the corresponding author.

Conflicts of Interest

The authors declare that they have no known competing interests that could appear to have influenced the work reported in this paper.

Appendix A

Appendix A.1. Proof of Theorem 1

The principal–agent model is summarized as follows:
max Π ( α , β ) = ( x + β d 2 k ) α β ( x + β d 2 k ) ,
s . t . U ( ε ) = μ 0 , x [ x ̲ , x ¯ ] .
Applying the specified constraint yields Equation (A3).
α = μ 0 β x β 2 d 2 2 k + γ 2 δ 2 β 2 .
Substituting Equation (A3) into the objective function yields a univariate quadratic concave function in β . Setting its first derivative to zero yields β = d 2 d 2 + k γ δ 2 , and by utilizing Equation (A3), we obtain α = μ 0 d 2 x d 2 + k γ δ 2 d 4 ( d 2 k γ δ 2 ) 2 k ( d 2 + k γ δ 2 ) 2 and ε = d 3 k ( d 2 + k γ δ 2 ) .

Appendix A.2. Proof of Theorem 2

The principal–agent model is summarized as follows:
max Π = E x + d ε + θ α ( x ) β ( x ) ( x + d ε + θ ) ,
subject to
U ( ε , y ) U ( ε , x ) , x , y [ x ̲ , x ¯ ] ,
ε = arg max U ( ε , x ) , x [ x ̲ , x ¯ ] ,
U ( ε , x ) μ 0 , x [ x ̲ , x ¯ ] ,
where
U ( ε , y ) = α ( y ) + β ( y ) ( x + d ε ) k 2 ε 2 γ 2 δ 2 β 2 ( y ) .
Since U ( ε , y ) U ( ε , x ) for all x , y [ x ̲ , x ¯ ] , we derive the first-order and second-order conditions as follows:
U ( ε , y ) y y = x = 0 and 2 U ( ε , y ) 2 y 0 .
Integrating the first-order conditions of Equation (A9) from y to x, we obtain
α ( x ) α ( y ) + β ( x ) d ε ( x ) β ( y ) d ε ( y ) k 2 ε 2 ( x ) + k 2 ε 2 ( y ) γ 2 δ 2 β 2 ( x ) β 2 ( y ) = y x z β ( z ) d z .
For all x , y [ x ̲ , x ¯ ] , since U ( ε , y ) U ( ε , x ) , we have
α ( x ) α ( y ) + β ( x ) d ε ( x ) β ( y ) d ε ( y ) k 2 ε 2 ( x ) + k 2 ε 2 ( y ) γ 2 δ 2 β 2 ( x ) β 2 ( y ) + x β ( x ) β ( y ) 0 .
Thus, we deduce
y x z β ( z ) d z x y x β ( z ) d z = x β ( x ) β ( y ) .
From proof by contradiction, we conclude that β ( x ) 0 .
Conversely, if β ( x ) 0 , integrating the first-order conditions of Equation (A9) from y to x yields
α ( x ) α ( y ) + β ( x ) d ε ( x ) β ( y ) d ε ( y ) k 2 ε 2 ( x ) + k 2 ε 2 ( y ) γ 2 δ 2 β 2 ( x ) β 2 ( y ) = y x z β ( z ) d z x y x β ( z ) d z = x β ( x ) β ( y ) ,
which implies U ( ε , y ) U ( ε , x ) for all x , y [ x ̲ , x ¯ ] .
Therefore, the incentive compatibility constraint (IC1) can be transformed to
U ( ε , y ) y y = x = 0 and β ( x ) 0 .
Furthermore, since
U ( ε , x ) x = U ( ε , y ) y y = x + β ( x ) 0 ,
U ( ε , x ) is monotonically increasing with respect to x. For the Rational Constraint (IR) to hold universally, it is necessary and sufficient that it holds at its minimum value, and (IR) must be binding at its minimum value. Thus, we have
U ( ε , x ̲ ) = μ 0 .
Integrating the first-order condition in Equation(A9) from x ̲ to x, we obtain
α ( x ) = μ 0 β ( x ) d ε ( x ) + k 2 ε 2 ( x ) + γ 2 δ 2 β 2 ( x ) x β ( x ) + x ̲ x β ( z ) d z .
Additionally, from the incentive compatibility constraint (IC2), we derive
U ( ε , x ) ε = β ( x ) d k ε = 0 and 2 U ( ε , x ) 2 ε = k < 0 .
Thus, we have
ε ( x ) = β ( x ) d k .
In summary, the original model can be transformed to
max x ̲ x ¯ x + β ( x ) d 2 k x ̲ x β ( z ) d z β 2 ( x ) 2 d 2 k + γ δ 2 μ 0 f ( x ) d x ,
subject to β ( x ) 0 .
Using the identity
x ̲ x ¯ x ̲ x β ( z ) d z f ( x ) d x = x ̲ x ¯ β ( x ) h ( x ) f ( x ) d x ,
the model further simplifies to
max x ̲ x ¯ x + d 2 k 1 h ( x ) β ( x ) β 2 ( x ) 2 d 2 k + γ δ 2 μ 0 f ( x ) d x ,
subject to β ( x ) 0 .
This model involves the independent function β ( x ) . We can solve the model and obtain
β ( x ) = d 2 h ( x ) k ( d 2 + k γ δ 2 ) h ( x ) .
Correspondingly, we derive α ( x ) and ε ( x ) , yielding the solution to the model.

Appendix A.3. Proof of Proposition 3

The expectation E ( W ) is expressed as follows:
E ( W ) = i = 1 M ϕ i ( ϖ ) M ϖ d ϖ = 1 M i = 1 M ϕ i ( ϖ ) ϖ d ϖ = i = 1 M E ( W ^ i ) M .
The variance D ( W ) is expressed as follows:
D ( W ) = ( ϖ E ( W ) ) 2 i = 1 M ϕ i ( ϖ ) M d ϖ = i = 1 M 1 M ( ϖ E ( W ) ) 2 ϕ i ( ϖ ) d ϖ ,
= i = 1 M 1 M ( ϖ E ( W ^ i ) ) + ( E ( W ^ i ) E ( W ) ) 2 ϕ i ( ϖ ) d ϖ ,
= i = 1 M 1 M ( ϖ E ( W ^ i ) ) 2 ϕ i ( ϖ ) d ϖ + 1 M ( E ( W ^ i ) E ( W ) ) 2 + 2 ( ϖ E ( W ^ i ) ) ( E ( W ^ i ) E ( W ) ) ϕ i ( ϖ ) d ϖ ,
= i = 1 M D ( W ^ i ) M + i = 1 M ( E ( W ) E ( W ^ i ) ) 2 M .

Appendix A.4. Proof of Proposition 8

The expression for U ( y ) is
U ( y ) = α ( y ) + β ( y ) x + β 2 ( y ) d 2 2 k γ 2 δ 2 β 2 ( y ) + β 2 ( y ) ( Δ d 2 + 2 d Δ d ) 2 k ,
where we define
ν ( y ) = α ( y ) + β ( y ) x + β 2 ( y ) d 2 2 k γ 2 δ 2 β 2 ( y ) ,
and
ψ ( y ) = β 2 ( y ) ( Δ d 2 + 2 d Δ d ) 2 k .
Under the incentive compatibility constraint (IC2), we have
d ν ( y ) d y y = x = 0 and d 2 ν ( y ) d 2 y 0 .
Given d + Δ d > 0 , it can be concluded that ν ( y ) is concave. ψ ( y ) is convex when Δ d > 0 and concave when Δ d < 0 . There must exist a positive value (p) such that U ( y ) is concave when Δ d 2 + 2 d Δ d < p , linear when Δ d 2 + 2 d Δ d = p , and convex when Δ d 2 + 2 d Δ d > p .
Let y = arg max U ( y ) , where y stands for salespeople’s feedback on the market’s potential sales volume.
When Δ d 2 + 2 d Δ d < p , given β ( y ) 0 within [ x ̲ , x ¯ ] and β ( y ) 0 , we know
y [ x ̲ , x ¯ ] :
d ψ ( y ) d y 0 , if Δ d > 0 , d ψ ( y ) d y 0 , if Δ d < 0 .
With the first-order condition d U ( y ) d y = 0 , we have
d ν ( y ) d y y = y ^ = d ψ ( y ) d y y = y ^ .
When y ^ [ x ̲ , x ¯ ] , y = y ^ , and we can conclude that
y < x if Δ d < 0 , and y > x if Δ d > 0 .
Otherwise, if y ^ < x ̲ , y = x ̲ , or if y ^ > x ¯ , y = x ¯ .
When Δ d 2 + 2 d Δ d = p , U ( y ) is linear. At this point, y may take either x ̲ or x ¯ .
When Δ d 2 + 2 d Δ d > p , U ( y ) is convex. At this point, y may take either x ̲ or x ¯ .
Taken together, salespeople’s feedback on the market’s potential sales volume (x) varies conditionally based on their private information ( d i ).

Appendix A.5. Proof of Proposition 9

The expression for U ( y ) is
U ( y ) = α ( y ) + β ( y ) x + β 2 ( y ) d 2 2 k γ 2 δ 2 β 2 ( y ) Δ k β 2 ( y ) d 2 2 k ( k + Δ k ) ,
where we define
ν ( y ) = α ( y ) + β ( y ) x + β 2 ( y ) d 2 2 k γ 2 δ 2 β 2 ( y ) ,
and
ψ ( y ) = Δ k β 2 ( y ) d 2 2 k ( k + Δ k ) .
Under the incentive compatibility constraint (IC2), we have
d ν ( y ) d y y = x = 0 and d 2 ν ( y ) d 2 y 0 .
Given k + Δ k > 0 , it can be concluded that ν ( y ) is concave. ψ ( y ) is convex when Δ k > 0 and concave when Δ k < 0 . There must exist a negative value (p) such that U ( y ) is convex when Δ k < p , linear when Δ k = p , and concave when Δ k > p .
Let y = arg max U ( y ) , where y stands for salespeople’s feedback on the market’s potential sales volume.
When Δ k > p , given β ( y ) 0 within [ x ̲ , x ¯ ] and β ( y ) 0 , we know
y [ x ̲ , x ¯ ] :
d ψ ( y ) d y 0 , if Δ k > 0 , d ψ ( y ) d y 0 , if Δ k < 0 .
With the first-order condition ( d U ( y ) d y = 0 ), we have
d ν ( y ) d y y = y ^ = d ψ ( y ) d y y = y ^ .
When y ^ [ x ̲ , x ¯ ] , y = y ^ , and we can conclude that
y < x if Δ k > 0 , and y > x if Δ k < 0 .
Otherwise, if y ^ < x ̲ , y = x ̲ , or if y ^ > x ¯ , y = x ¯ .
When Δ k = p , U ( y ) is linear. At this point, y may take either x ̲ or x ¯ .
When Δ k < p , U ( y ) is convex. At this point, y may take either x ̲ or x ¯ .
Taken together, salespeople’s feedback on the market’s potential sales volume (x) varies conditionally based on their private information ( k i ).

Appendix A.6. Proof of Proposition 10

The expression for U ( y ) is
U ( y ) = α ( y ) + β ( y ) ( x + d ε ) k 2 ε 2 γ 2 δ 2 β 2 ( y ) Δ γ 2 δ 2 β 2 ( y ) ,
where we define
ν ( y ) = α ( y ) + β ( y ) ( x + d ε ) k 2 ε 2 γ 2 δ 2 β 2 ( y ) ,
and
ψ ( y ) = Δ γ 2 δ 2 β 2 ( y ) .
Under the incentive compatibility constraint (IC2), we have
d ν ( y ) d y y = x = 0 and d 2 ν ( y ) d 2 y 0 .
It can be found that ν ( y ) is concave. ψ ( y ) is convex when Δ γ > 0 and concave when Δ γ < 0 . There must exist a negative value (p) such that U ( y ) is concave when Δ γ > p , linear when Δ γ = p , and convex when Δ γ < p .
Let y = arg max U ( y ) , where y stands for salespeople’s feedback on the market’s potential sales volume.
When Δ γ > p , given β ( y ) 0 within [ x ̲ , x ¯ ] and β ( y ) 0 , we know
y [ x ̲ , x ¯ ] :
d ψ ( y ) d y 0 , if Δ γ > 0 , d ψ ( y ) d y 0 , if Δ γ < 0 .
With the first-order condition ( d U ( y ) d y = 0 ), we have
d ν ( y ) d y y = y ^ = d ψ ( y ) d y y = y ^ .
When y ^ [ x ̲ , x ¯ ] , y = y ^ , and we can conclude that
y < x if Δ γ > 0 , and y > x if Δ γ < 0 .
Otherwise, if y ^ < x ̲ , y = x ̲ , or if y ^ > x ¯ , y = x ¯ .
When Δ γ = p , U ( y ) is linear. At this point, y may take either x ̲ or x ¯ .
When Δ γ < p , U ( y ) is convex. At this point, y may take either x ̲ or x ¯ .
Taken together, salespeople’s feedback on the market’s potential sales volume (x) varies conditionally based on their private information ( γ i ).

References

  1. Arditto, L.; Cambra-Fierro, J.J.; Fuentes-Blasco, M.; Olavarria Jaraba, A.; Vazquez-Carrasco, R. How Does Customer Perception of Salespeople Influence the Relationship? A Study in an Emerging Economy. J. Retail. Consum. Serv. 2020, 54, 101952. [Google Scholar] [CrossRef]
  2. Bergen, M.; Dutta, S.; Walker, O.C. Agency Relationships in Marketing: A Review of the Implications and Applications of Agency and Related Theories. J. Mark. 1992, 56, 1–24. [Google Scholar] [CrossRef]
  3. Chohan, R. Agency Theory in Marketing: 27 Years On. J. Strateg. Mark. 2023, 31, 767–793. [Google Scholar] [CrossRef]
  4. Bowen, M.; Haas, A.; Hofmann, I. Sales Force Financial Compensation—A Review and Synthesis of the Literature. J. Pers. Sell. Sales Manag. 2023, 44, 374–397. [Google Scholar] [CrossRef]
  5. Steenburgh, T.; Ahearne, M. Motivating Salespeople: What Really Works. Harv. Bus. Rev. 2012, 90, 70–75. [Google Scholar]
  6. Chung, D.J. How to Really Motiv. Salespeople. Harv. Bus. Rev. 2015, 93, 54–61. [Google Scholar]
  7. Bommaraju, R.; Hohenberg, S. Self-Selected Sales Incentives: Evidence of Their Effectiveness, Persistence, Durability, and Underlying Mechanisms. J. Mark. 2018, 82, 106–124. [Google Scholar] [CrossRef]
  8. Ahearne, M.; Ahearne, M. Designing Sales Incentives: Opportunities for Research with Impact. AMS Rev. 2025, 15, 307–312. [Google Scholar] [CrossRef]
  9. Farley, J.U. An Optimal Plan for Salesmen’s Compensation. J. Mark. Res. 1964, 1, 39–43. [Google Scholar] [CrossRef]
  10. Basu, A.K.; Lal, R.; Srinivasan, V.; Staelin, R. Salesforce Compensation Plans: An Agency Theoretic Perspective. Mark. Sci. 1985, 4, 267–291. [Google Scholar] [CrossRef]
  11. Holmstrom, B.; Milgrom, P. Aggregation and Linearity in the Provision of Intertemporal Incentives. Econometrica 1987, 55, 303–328. [Google Scholar] [CrossRef]
  12. Lal, R.; Staelin, R. Salesforce Compensation Plans in Environments with Asymmetric Information. Mark. Sci. 1986, 5, 179–198. [Google Scholar] [CrossRef]
  13. Mantrala, M.K.; Sinha, P.; Zoltners, A.A. Structuring a Multiproduct Sales Quota-Bonus Plan for a Heterogeneous Sales Force: A Practical Model-Based Approach. Mark. Sci. 1994, 13, 121–144. [Google Scholar] [CrossRef]
  14. Bhardwaj, P. Delegating Pricing Decisions. Mark. Sci. 2001, 20, 143–169. [Google Scholar] [CrossRef]
  15. Joseph, K. On the Optimality of Delegating Pricing Authority to the Sales Force. J. Mark. 2001, 65, 62–70. [Google Scholar] [CrossRef]
  16. Mishra, B.K.; Prasad, A. Delegating Pricing Decisions in Competitive Markets with Symmetric and Asymmetric Information. Mark. Sci. 2005, 24, 490–497. [Google Scholar] [CrossRef]
  17. Jain, S. Self-Control and Incentives: An Analysis of Multiperiod Quota Plans. Mark. Sci. 2012, 31, 855–869. [Google Scholar] [CrossRef]
  18. Jerath, K.; Long, F. Multiperiod Contracting and Salesperson Effort Profiles: The Optimality of “Hockey Stick,” “Giving up,” and “Resting on Laurels”. J. Mark. Res. 2020, 57, 211–235. [Google Scholar] [CrossRef]
  19. Dai, T.; Jerath, K. Salesforce Compensation with Inventory Considerations. Manag. Sci. 2013, 59, 2490–2501. [Google Scholar] [CrossRef]
  20. Dai, T.; Jerath, K. Technical Note—Impact of Inventory on Quota-Bonus Contracts with Rent Sharing. Oper. Res. 2016, 64, 94–98. [Google Scholar] [CrossRef]
  21. Dai, T.; Jerath, K. Salesforce Contracting under Uncertain Demand and Supply: Double Moral Hazard and Optimality of Smooth Contracts. Mark. Sci. 2019, 38, 852–870. [Google Scholar] [CrossRef]
  22. Bhargava, H.K.; Rubel, O. Sales Force Compensation Design for Two-Sided Market Platforms. J. Mark. Res. 2019, 56, 666–678. [Google Scholar] [CrossRef]
  23. Dai, T.; Ke, R.; Ryan, C.T. Incentive Design for Operations-Marketing Multitasking. Manag. Sci. 2021, 67, 2211–2230. [Google Scholar] [CrossRef]
  24. Zhang, Y.; Xu, Q.; Zhang, G. Optimal Contracts with Moral Hazard and Adverse Selection in a Live Streaming Commerce Market. J. Retail. Consum. Serv. 2023, 74, 103419. [Google Scholar] [CrossRef]
  25. Gao, L. Optimal Incentives for Salespeople with Learning Potential. Manag. Sci. 2023, 69, 3285–3296. [Google Scholar] [CrossRef]
  26. Zhang, W.; Li, J.; Balachander, S. Group or Individual Sales Incentives? What Is Best for Brand-Managed Retail Sales Operations? J. Mark. 2024, 88, 103–120. [Google Scholar] [CrossRef]
  27. Homburg, C.; Hohenberg, S.; Hahn, A. Steering the Sales Force for New Product Selling: Why Is It Differ. How Can Firms Motiv. Differ. Sales Reps? J. Prod. Innov. Manag. 2019, 36, 282–304. [Google Scholar] [CrossRef]
  28. Wang, X.; Li, P.; Zheng, Y.; Jiang, L.A.; Yang, Z. Salespersons’ Self-Monitoring, Psychological Capital and Sales Performance. Asia Pac. J. Mark. Logist. 2021, 33, 1918–1933. [Google Scholar] [CrossRef]
  29. Kuo, S.Y.; Kao, Y.L.; Tang, J.W.; Tsai, P.H. Impacts of Emotional Regulation, Adaptive Selling and Customer-Oriented Behavior on Sales Performance: The Moderating Role of Job Resourcefulness. Asia Pac. J. Mark. Logist. 2023, 35, 1075–1092. [Google Scholar] [CrossRef]
  30. Mallin, M.L.; Pullins, E.B. The Moderating Effect of Control Systems on the Relationship between Commission and Salesperson Intrinsic Motivation in a Customer Oriented Environment. Ind. Mark. Manag. 2009, 38, 769–777. [Google Scholar] [CrossRef]
  31. Hohenberg, S.; Homburg, C. Motivating Sales Reps for Innovation Selling in Different Cultures. J. Mark. 2016, 80, 101–120. [Google Scholar] [CrossRef]
  32. Homburg, C.; Morguet, T.R.; Hohenberg, S. Incentivizing of inside Sales Units—The Interplay of Incentive Types and Unit Structures. J. Pers. Sell. Sales Manag. 2021, 41, 181–199. [Google Scholar] [CrossRef]
  33. Kaynar, N.; Siddiq, A. Estimating Effects of Incentive Contracts in Online Labor Platforms. Manag. Sci. 2023, 69, 2106–2126. [Google Scholar] [CrossRef]
  34. Opitz, S.; Sliwka, D.; Vogelsang, T.; Zimmermann, T. The Algorithmic Assignment of Incentive Schemes. Manag. Sci. 2025, 71, 1546–1563. [Google Scholar] [CrossRef]
  35. Lal, R.; Srinivasan, V. Compensation Plans for Single- and Multi-Product Salesforces: An Application of the Holmstrom-Milgrom Model. Manag. Sci. 1993, 39, 777–793. [Google Scholar] [CrossRef]
  36. Yu, Y.; Kong, X. Robust Contract Designs: Linear Contracts and Moral Hazard. Oper. Res. 2020, 68, 1457–1473. [Google Scholar] [CrossRef]
  37. Pratt, J.W. Risk Aversion in the Small and in the Large. Econometrica 1964, 32, 122–136. [Google Scholar] [CrossRef]
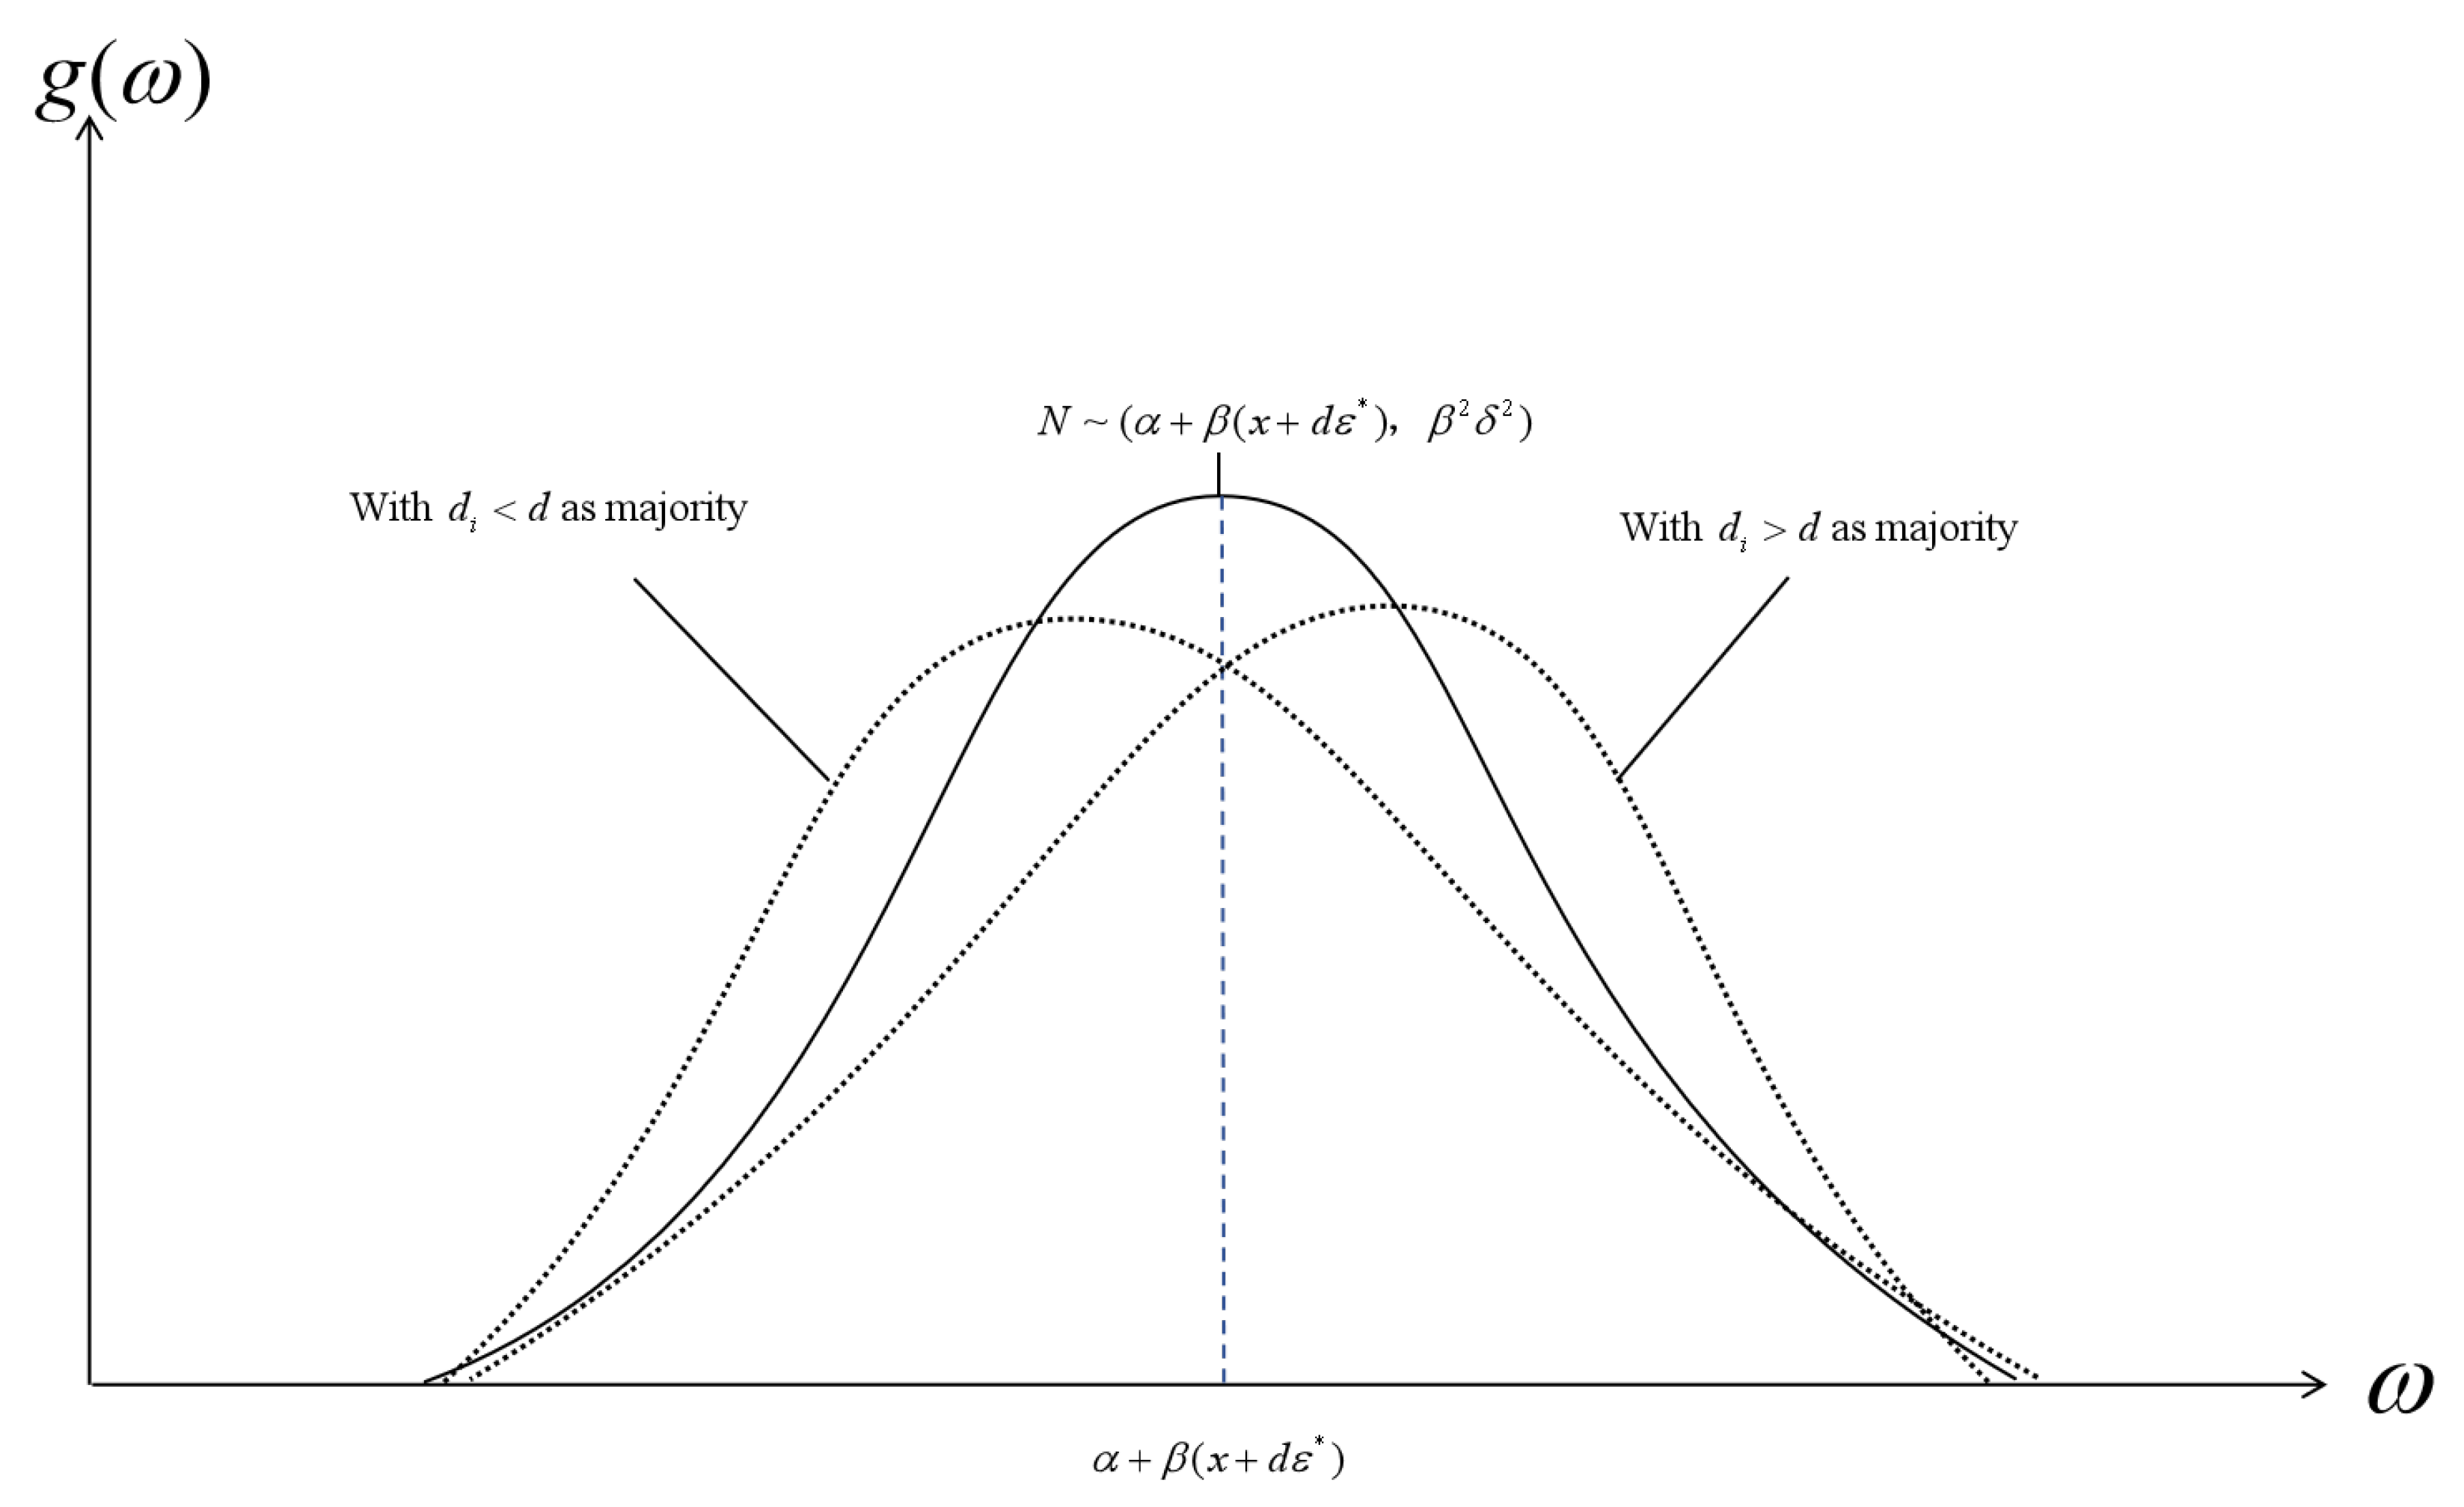
Figure 1. An illustration comparing salespeople’s income distributions with heterogeneous capabilities.
Mathematics 13 02968 g001
Figure 2. Benefits of both parties with heterogeneous salesperson capabilities.
Mathematics 13 02968 g002
Figure 3. Comparison of salespeople’s actual versus expected income distributions with heterogeneous capabilities under a standardized contract.
Mathematics 13 02968 g003
Figure 4. Benefits of both parties with heterogeneous salesperson effort costs.
Mathematics 13 02968 g004
Figure 5. Comparison of salespeople’s actual versus expected income distributions with heterogeneous effort costs under a standardized contract.
Mathematics 13 02968 g005
Figure 6. Benefits of both parties with heterogeneous salesperson risk attitudes.
Mathematics 13 02968 g006
Figure 7. Comparison of salespeople’s actual versus expected income distributions with heterogeneous risk attitudes under a standardized contract.
Mathematics 13 02968 g007
Figure 8. Salespeople’s feedback ( y ) on the market’s potential sales volume (x) varies conditionally based on their private information about the individual capability ( Δ d i ), effort cost ( Δ k i ), and risk attitude ( Δ γ i ).
Mathematics 13 02968 g008
Table 1. Literature comparison.
LiteratureResearch MethodResearch ContextsFocus on Practical Effectiveness
Game-Theoretical Models Empirical Econometric Approaches Platform-Based Heterogeneity Estimation
Basu et al. [10] Basic Enterprise Sales
Lal and Staelin [12] Basic Enterprise Sales
Mishra and Prasad [16] Basic Enterprise Sales with Pricing Delegation
Dai and Jerath [20] Basic Enterprise Sales with Inventory
Bhargava and Rubel [22] Two-sided Market Sales
Dai et al. [23] Multitasking Sales
Homburg et al. [32] Effects of Unit StructuresPartially
Zhang et al. [26] Brand-Managed Retail Sales
Opitz et al. [34] Online Labor PlatformsPartially
This paper Basic Enterprise Sales
Disclaimer/Publisher’s Note: The statements, opinions and data contained in all publications are solely those of the individual author(s) and contributor(s) and not of MDPI and/or the editor(s). MDPI and/or the editor(s) disclaim responsibility for any injury to people or property resulting from any ideas, methods, instructions or products referred to in the content.