
Crisis Response Modes in Collaborative Business Ecosystems: A Mathematical Framework from Plasticity to Antifragility


Abstract
1. Introduction
- We introduce a hierarchical structure for selecting and organizing capability indicators linked to the four systemic response modes, offering a quantitative extension to earlier qualitative taxonomies.
- We apply an AHP-based weighting system to incorporate expert judgment into a unified framework tailored for crisis response. This adds methodological rigor and addresses the challenge of prioritizing diverse organizational capabilities within the context of CBE resilience and antifragility.
- We develop a nonlinear performance scoring model that maps capability levels to dynamic recovery trajectories, thereby capturing the temporal dimension of adaptations—something lacking in static metrics used in prior works.
- We offer a unified mathematical formulation that integrates internal organizational capabilities with external strategic responses.
- We extend Taleb’s fragility–resilience–antifragility typology into a more comprehensive framework and embed it within a practical evaluation tool.
- Finally, we validate the framework using multiple approaches—including consistency checks, sensitivity analyses, and scenario-based simulations—to demonstrate its robustness and applicability.
- Collectively, these contributions bridge the gap between theoretical typologies of crisis response and measurable, comparative evaluation tools suitable for complex, networked environments.
2. Materials and Methods
2.1. Systemic Response Modes in Collaborative Business Ecosystems
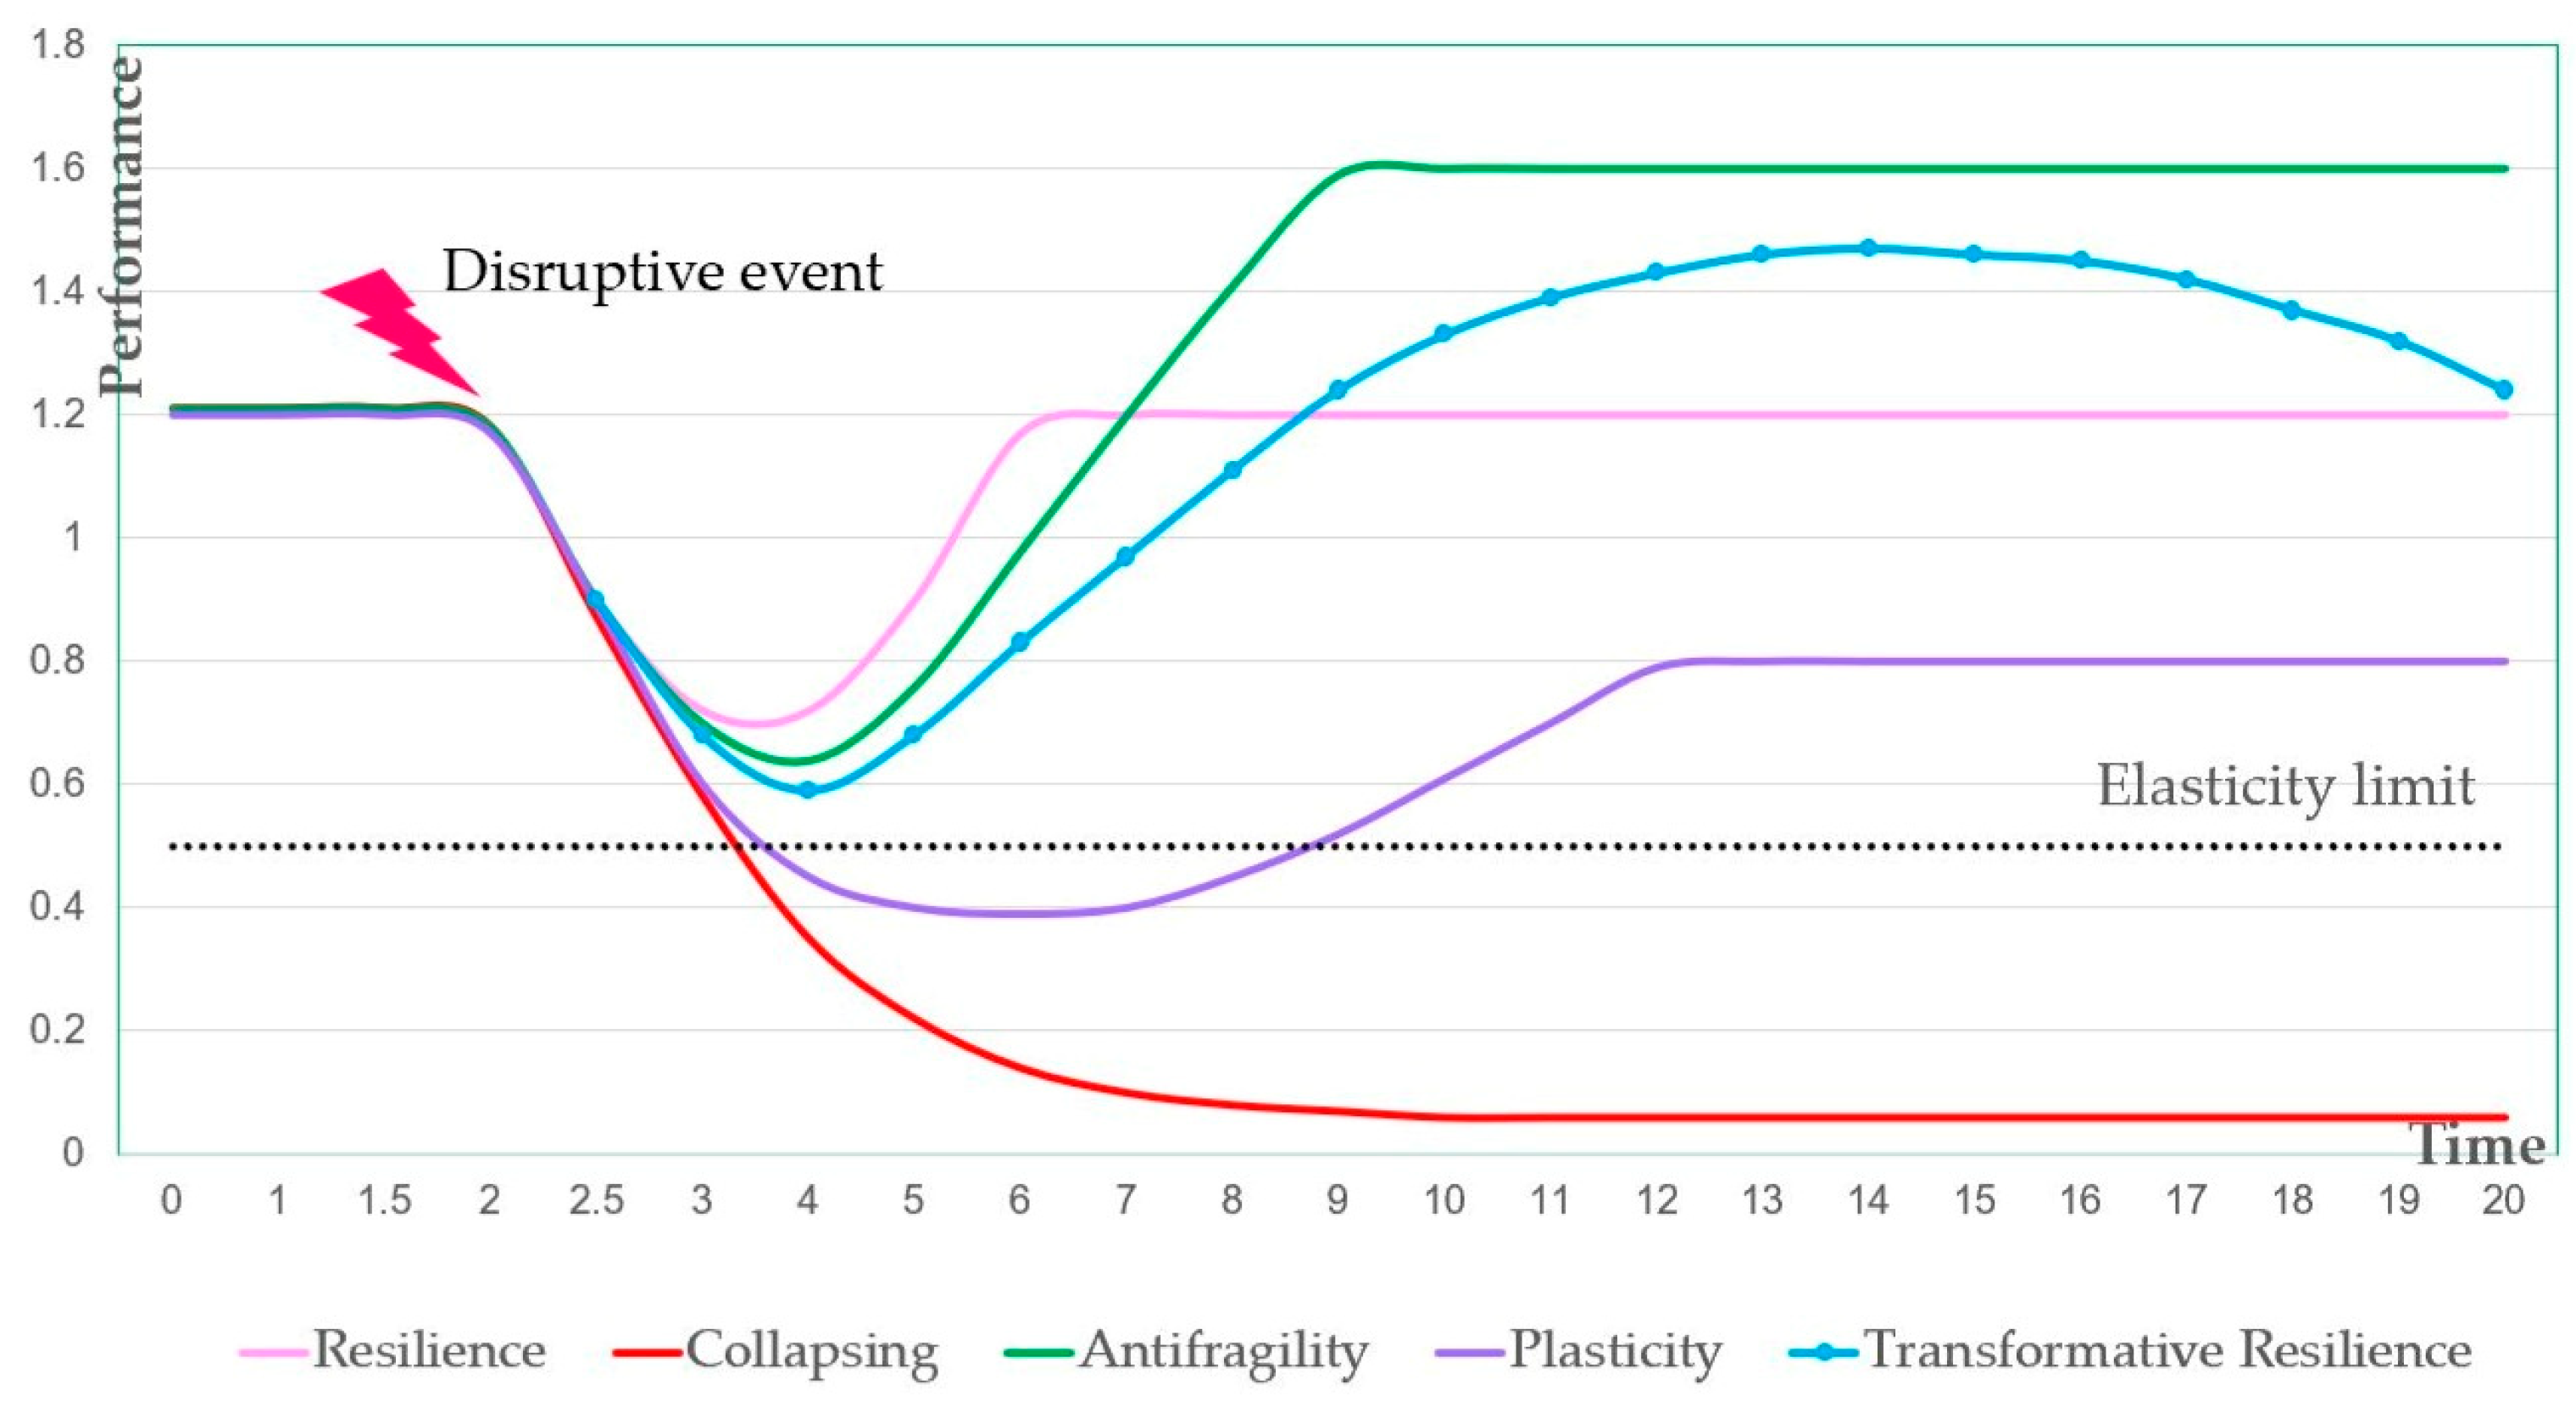
- Collapse: The organization fails to recover and experiences a long-term or irreversible breakdown of structure and function. This outcome reflects extreme fragility, where the system lacks a sufficient robustness or adaptive capacity to survive a disruptive event.
- Plasticity: The organization stabilizes at a lower, yet sustainable, performance level after a disruption. This represents a partial recovery without a return to the original baseline, often because of (1) a structural rigidity that prevents full reconfiguration, (2) resource constraints that limit the recovery capacity, and (3) hysteresis effects in which past disruptions create lasting organizational memories that hamper future responses. Plasticity therefore differs from resilience (full recovery), adaptive decline (gradual, continuous loss without stabilization), and collapse (catastrophic failure). Example: A factory that, after a major fire or flood, resumes operations at half of its former output, remaining viable but never regaining its previous capacity.
- Resilience: The organization restores its pre-crisis performance while preserving its core functions and structure. This outcome reflects effective internal capabilities and coordinated coping strategies. During the COVID-19 pandemic, Unilever rapidly reconfigured production lines—for example, converting deodorant facilities to hand sanitizer production facilities—maintained service, and regained its market position through agile adaptation [15].
- Transformative Resilience: The organization recovers or improves its performance while simultaneously undergoing positive structural change, enabling long-term adaptability to dynamic environments. Many educational systems leveraged the COVID-19 crisis to accelerate digital transformation, adopting blended and hybrid learning models that permanently altered instructional methods and increased flexibility and resilience.
- Antifragility: The organization benefits from disorder and emerges stronger than before, ultimately exceeding its prior performance. This mode relies on mechanisms such as optionality and the ability to exploit volatility through convex strategies. Example: During the COVID-19 pandemic, Amazon experienced explosive growth—expanding logistics, investing in new technologies, and increasing profits by nearly 200 percent—thus emerging even stronger from the crisis.
2.2. Indicator Selection Methodology
- -
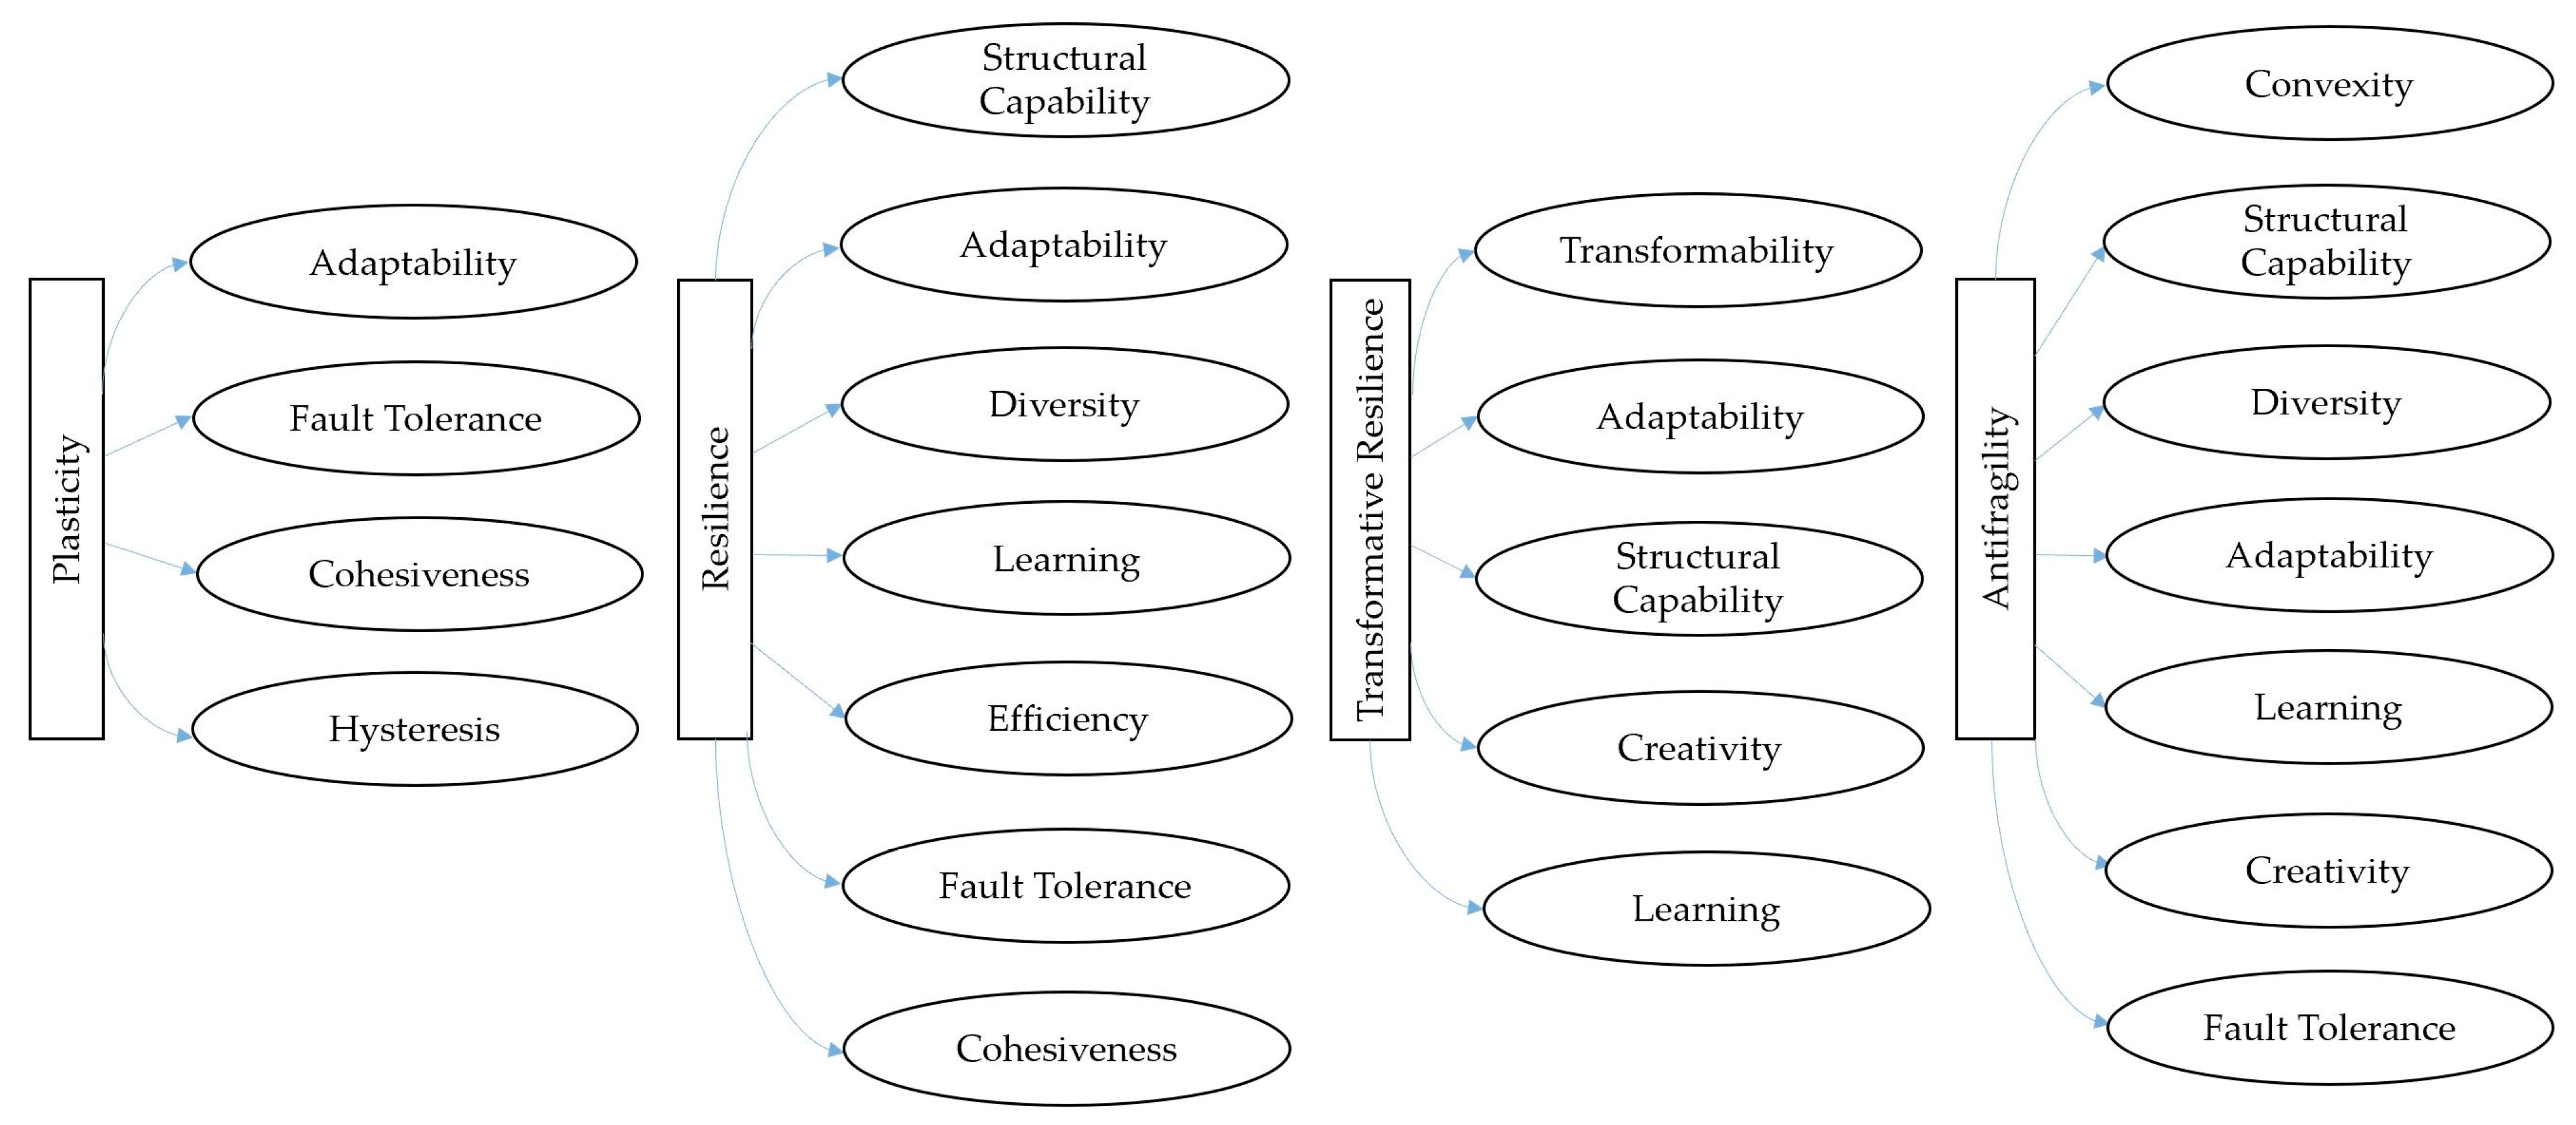
- Resilience: Diversity, adaptability, efficiency, cohesiveness, structural capability, fault tolerance, and learning.
- -
- Antifragility: Diversity, adaptability, structural capability, fault tolerance, learning, convexity, and creativity.
- -
- Transformative Resilience: Adaptability, structural capability, transformability, creativity, and learning.
- -
- Plasticity: Adaptability, cohesiveness, fault tolerance, and hysteresis.
2.3. AHP Structuring and Weighting
3. Results and Discussions
3.1. AHP-Derived Weights for Capability Indicators
3.1.1. Performance Indicators
3.1.2. Plasticity Capability Indicators
- -
- Adaptability: The capacity to reconfigure processes and structures in response to disruptions.
- -
- Fault Tolerance: The ability to absorb failures without a cascading collapse, through built-in redundancies and safeguards.
- -
- Cohesiveness: The degree of internal alignment and coordination among subunits.
- -
- Hysteresis: The system’s inertia or tendency to resist abrupt change and preserve its prior operational state.
3.1.3. Resilience Capability Indicators
3.1.4. Transformative Resilience Capability Indicators
3.1.5. Antifragility Capability Indicators
3.2. Calculation of Performance Score
3.3. Mathematical Formulation of Response Scores
- Step 1: Baseline Performance Recovery (ΔP)
- -
- Pbase, is the pre-crisis performance level.
- -
- Pdisruption, is the performance immediately after the disruption.
- -
- Precovery, is the performance after a recovery period.
- Step 2: Capability-Adjusted Performance (ΔP′)
- -
- α is the baseline elasticity (the recovery capacity achievable without any adaptive capability);
- -
- β controls the sensitivity of the recovery to the capability score.
- Step 3: Response Mode Score
- Ad1ᵢ—Structural Flexibility: Quantifies the organization’s network reachability under disruption, accounting for both direct connections and weighted two-hop (indirect) links. This metric is grounded in social network analysis (SNA) concepts of closeness centrality and reachability, where indirect paths (with reduced weights) contribute to overall resilience [25,26].
- Ad2ᵢ—Technology Adoption and Integration: Assesses the organization’s uptake of new technologies relative to the ecosystem average. It is calculated as a normalized ratio of the firm’s technology adoption level (scaled for deployment or scalability) to the network-wide mean. This relative metric aligns with innovation capability measures in the literature that use normalized performance ratios for cross-firm comparisons [27].
- Ad3ᵢ—Successful Market Entry and Competition: Reflects the ability to adapt the strategy by entering new markets. It is given by the success rate of market entry attempts (successful entries divided by total attempts), following the approach of gradual internationalization metrics in strategic management [28].
- Coh1ᵢ—Reciprocity of Collaboration Opportunities: Measures the proportion of mutual (bidirectional) collaboration ties that the organization maintains, normalized by the total number of potential partners (N–1). This captures network reciprocity, as used in SNA to gauge bilateral engagement in collaborative structures [29,30].
- Coh2ᵢ—Density of Direct Inter-Organizational Ties: Captures the density of the organization’s direct connections by taking the fraction of actual ties to all possible ties. This serves as a proxy for structural cohesion—a higher network density enables quicker communication, coordinated action, and collective resilience. The metric draws on graph theoretic concepts linking a high density to robust coordination and stability in networks [25,26].
- Cnv1ᵢ—Relative Performance Improvement: The normalized increase in the performance after a crisis relative to the pre-crisis level (e.g., post-crisis productivity gain). This metric captures a “convex” response, where the exposure to stress yields net positive performance improvements beyond a simple recovery [31].
- Cnv2ᵢ—Impact of Strategies on Antifragile Gains: Calculates the average benefit obtained from specific stress-responsive strategies deployed during or after the crisis. It reflects the contribution of strategic initiatives (such as hedging or flexible investments) to upside outcomes, drawing on real options theory and the strategic flexibility literature emphasizing gains under uncertainty [32].
- Cnv3ᵢ—Opportunity Capitalization Rate: Measures the organization’s effectiveness in capitalizing on new opportunities arising from the disruption. Formally, it is the average contribution of crisis time strategic actions to post-crisis performance gains, capturing the upside potential of optionality. This metric is inspired by the real options theory’s asymmetric payoff (convex return) concept and aligns with strategic management studies on seizing opportunities under volatility [33].
- Crt1ᵢ—R&D Intensity: Defined as the ratio of the R&D expenditure to operating expenses, indicating the level of investment in innovation relative to operations. This normalized input–effort ratio is a standard metric in innovation and resilience studies, reflecting the firm’s exploratory orientation and self-adaptive capacity under stress [34].
- Crt2ᵢ—Network-Based Innovation Potential (Betweenness Centrality): Uses the betweenness centrality to gauge the organization’s structural position in the knowledge-sharing network. A higher betweenness value indicates that the organization serves as a key broker or bridge connecting otherwise disconnected partners, which enhances access to diverse knowledge and cross-domain innovation. This metric is grounded in the network theory of brokerage and information diffusion, where central brokers are associated with a greater creative performance and idea recombination [30,35].
- Di1ᵢ—Product/Service Portfolio Diversity: The number of distinct products or services the organization offers, normalized by the ecosystem average. This indicates the firm’s ability to pivot across offerings and spread risk. The metric applies a normalized product count ratio grounded in the portfolio diversification theory, wherein a broader portfolio (relative to peers) reduces the concentration risk [36].
- Di2ᵢ—Competency Diversity: The share of distinct internal competencies (skills, capabilities, resources) that the organization possesses relative to the total variety of competencies present in the ecosystem. This is essentially a specialization versus diversification measure of the firm’s knowledge and resource base. It mirrors metrics in the resource-based view of the firm, which is used to gauge internal adaptability through a balanced competency profile [34].
- Di3ᵢ—Market Entropy (Diversification Index): The evenness of the organization’s activity distribution across different markets, quantified using the Shannon entropy formula. A higher entropy value means the firm’s operations are more evenly spread across markets or segments, indicating a well-diversified market portfolio that minimizes vulnerability to any single market disruption. Entropy-based diversification measures are well-established in economics, ecology, and information theory for evaluating robustness through balance [37].
- Ef1ᵢ—Revenue Proportion from New Products/Services: The proportion of total revenue derived from recently launched products or services. This revenue share metric is widely used to assess how efficiently a firm’s innovation activities translate into market output and profits. A higher value signifies the effective commercialization of innovation, which is consistent with frameworks for innovation performance (e.g., innovation success rates) [38].
- Ef2ᵢ—Collaboration Success Rate: The fraction of the organization’s initiated collaborations that result in successful outcomes (e.g., completed projects or implemented solutions). This is a standard success rate indicator used in studies of strategic alliances and R&D partnerships to reflect execution effectiveness. A higher success rate denotes a strong capability in managing inter-organizational projects and realizing collaborative value [39].
- Ef3ᵢ—Network Utilization Efficiency: The ratio of actively utilized network ties (ongoing collaborative relationships) to the total number of available ties. This utilization metric distinguishes mere connectivity from productive collaboration, highlighting that it is the activation of connections—not just their existence—that generates value. The concept is rooted in social capital and structural embeddedness theory, emphasizing the efficient use of one’s network for tangible outcomes [40].
- FT1ᵢ—Productivity Loss During Disruption: The proportional drop in productivity during a crisis, relative to the normal (pre-disruption) level. It is expressed as a normalized loss ratio, where a smaller value indicates a higher tolerance to shocks. This metric captures the system’s absorptive capacity and corresponds to loss-of-function measures used in resilience engineering and critical infrastructure protection [41].
- FT2ᵢ—Employee Retention Rate During Disruption: The ratio of employees retained throughout the disruption period to the total workforce. This indicates workforce continuity and the stability of human capital under stress. It draws on organizational studies showing that retaining talent during crises is linked to adaptive capacity and resilience (e.g., leadership and memory sustaining the organization) [42].
- FT3ᵢ—Partial Recovery Time: The time required for the organization to stabilize operations after a disruption, even if full the pre-crisis performance is not yet restored. It is measured as a normalized recovery time to enable comparisons across organizations of different sizes. Shorter partial recovery times signify a faster rebound to a stable state, paralleling the time-to-recovery metrics used in resilience assessment frameworks (with a focus here on regaining a functional baseline rather than complete recovery) [43].
- Hys1ᵢ—Immediate Performance Drop: The immediate loss in performance caused by a disruption, quantified as the normalized difference between the pre-crisis performance and the post-shock level. This indicates the severity of the initial impact and the organization’s short-term vulnerability. It parallels shock impact measures in resilience engineering and disaster economics that assess abrupt performance degradation [44].
- Hys2ᵢ—Time to Full Recovery: The duration required for the organization to fully return to its pre-disruption performance level. This metric reflects the delay in recovery and is especially pertinent in scenarios where hysteresis leads to prolonged stagnation. It builds on infrastructure and supply chain resilience models in which the time to recovery is a core indicator of system resilience [45,46].
- Hys3ᵢ—Residual Effects of Past Disruptions: The persistent impact of historical disruptions on the current performance, calculated as the average influence of past shock events on present recovery outcomes. This metric embodies the idea of path dependence and cumulative effects: past crises leave lasting “scars” on organizational structures or behaviors. The approach is supported by studies of organizational memory and legacy effects that impede a full recovery over the long term [46,47].
- Lrn1ᵢ—Performance Improvement Post-Disruption: The relative increase in performance observed after a disruption compared to the pre-crisis baseline, expressed as a normalized gain. A positive value indicates that the organization not only recovered but improved due to learning from the event. This metric aligns with learning curve models and observations of post-crisis performance enhancement in resilience research [47,48].
- Lrn2ᵢ—Frequency of Knowledge-Sharing Events: The frequency with which the organization engages in knowledge-sharing activities (both formal and informal) in a given time frame, normalized to a standard period. This metric reflects a culture of continuous learning and collaboration; it is supported by knowledge management and social learning theories, wherein regular information exchange and joint problem-solving strengthen resilience [49,50].
- Lrn3ᵢ—Investment in Crisis-Relevant Training: The percentage of total revenue invested in training programs focused on crisis management and recovery skills. This budget allocation ratio serves as a proxy for the organization’s commitment to learning and preparedness. Using financial investment in training as an indicator is common in the resilience literature to gauge proactive capacity-building efforts [51].
- Stc1ᵢ—Degree Centrality: The organization’s normalized degree centrality in the ecosystem’s network, a standard SNA measure of how well-connected a node is. Higher degree centrality implies greater embeddedness and visibility in the network, leading to faster information diffusion and better access to collaborative resources. This metric is widely used in modeling networked systems’ resilience, as highly connected nodes can more readily mobilize support or alternate pathways during disruptions [52,53].
- Stc2ᵢ—Flow Asymmetry: The degree of imbalance between incoming and outgoing connections, computed as the normalized absolute difference between the in-degree and out-degree (or weighted link flows). This metric, derived from a directed network analysis, identifies structural imbalances—an extreme asymmetry suggests an over-reliance on either incoming or outgoing flows (e.g., dependence on a single source or bottlenecked outflow), whereas a balanced flow structure supports more resilient, reciprocal interactions. The concept is rooted in network stability and information flow optimization studies, where symmetry in exchange is linked to robustness [54,55].
- Stc3ᵢ—Redundancy and Backup System Preparedness: The proportion of the organization’s critical systems or nodes (e.g., key suppliers, IT infrastructure, logistics channels) that have backup or failover alternatives. It is calculated as a redundancy ratio (number of systems with backups divided by total critical systems). This metric is common in reliability engineering, supply chain design, and business continuity planning; a higher value indicates greater structural robustness and an ability to maintain operations by switching to backups if primary systems fail [56].
- Tr1ᵢ—Structural Flexibility via Edge Modifications: The extent of the network reconfiguration post-disruption, measured as the ratio of modified connections (edges added or removed in the organizational network) to the total pre-disruption connections. This network reconfiguration ratio indicates the responsiveness to shock: a higher value means the organization substantially restructured its partnerships or linkages in reaction to the crisis. The metric is conceptually rooted in dynamic network adaptation models, where the timely reorganization of ties is a sign of resilience and flexibility [57,58].
- Tr2ᵢ—Redundancy via Backup Nodes: The availability of alternative nodes to replace or supplement critical partners/nodes during disruptions. It is quantified as the ratio of backup or secondary nodes (e.g., substitute suppliers, backup facilities) to all primary critical nodes. This redundancy coverage metric is widely used in supply chain and IT resilience planning to evaluate preparedness for rapid substitution; a higher ratio indicates that the organization can quickly reroute or maintain functions under stress [45,59].
- Tr3ᵢ—Decentralization of Decision-Making: The degree to which the decision-making power is distributed across the network, proxied by the normalized dispersion (variance or entropy) of node degrees in the collaboration network. A more uniform degree distribution (high entropy across nodes’ connectivity) suggests that the control and influence are not concentrated in a few nodes but are rather spread out. This indicates a decentralized structure, which reduces the vulnerability to any single point of failure in a crisis. The metric is inspired by entropy-like measures of heterogeneity and formal decentralization indices in organizational network design [60,61].
4. Model Validation and Sensitivity Analysis
4.1. AHP Consistency Ratio
- -
- n is the number of indicators in the matrix;
- -
- RI is the Random Index, derived from Saaty’s scale (e.g., RI = 0.90 for n = 4, 1.12 for n = 5, 1.32 for n = 7).
- -
- A CR below 0.10 indicates an acceptable consistency. A value closer to zero reflects a greater coherence in expert judgments.
- Plasticity: For n = 4 (4 indicators) RI is 0.90. We obtained λmax = 4.031, so and (1.15%).
- Resilience: For n = 7 (7 indicators) RI is 1.32. λmax = 7.0700, giving and (0.88%).
- Transformative resilience: For n = 5 (5 indicators) RI is 1.12. λmax = 5.0183, so and (~0.41%).
- Antifragility: For n = 7 (7 indicators) RI is 1.32. λmax = 7.2148, yielding and (~2.71%).
4.2. Sensitivity Analysis
- Plasticity: The top indicator is adaptability (WAd = 0.4658). We decreased it by 10% (to 0.4192) and increased it by 10% (to 0.5124), adjusting the other three plasticity weights so the total = 1. The plasticity score of the test profile changed by less than 0.1% (it remained essentially 1.000 in our normalized scenario). Such a negligible change indicates that the plasticity score is not overly sensitive to a small error in the adaptability weight.
- Resilience: The top indicator is the structural capability (WStC = 0.2828). We varied this to 0.2545 and 0.3111 (±10%) and recomputed the resilience score. The result changed by less than 0.01% (from 1.0001 to 1.0001 in normalized terms effectively no change).
- Transformative Resilience: The highest weight indicator is transformability (WTr = 0.4028). Adjusting it by ±10% (to 0.3625 and 0.4431) led to a <0.01% change in the transformative resilience score (approximately 0.9999 in both cases, essentially unchanged).
- Antifragility: The highest indicator is convexity (WCnv = 0.3464). We varied this to 0.3118 and 0.3810 (±10%) and observed the effect on the antifragility score. This had a slightly larger impact than the other modes: the antifragility score changed from a baseline of about 0.78 to 0.73 (when the convexity weight was −10%) or 0.82 (+10%). This is roughly a 5% change in the score for a 10% change in the weight (small, but noticeable compared to the virtually zero change in other modes).
4.3. Correlation Analysis: Capabilities vs. Performance Outcomes
- Adaptability: r ≈ 0.72. This was the highest correlation, indicating organizations scoring high in adaptability tended to recover a much larger fraction of the lost performance (often even exceeding the baseline, i.e., ΔP′ > 1 in some cases). This aligns with a vast resilience literature that positions adaptability as crucial for effective responses.
- Diversity: r ≈ 0.58. This is a moderate positive correlation, suggesting that having a diverse set of resources or options contributes to a better recovery, though not as strongly as adaptability. Diversity provides alternative pathways when primary ones fail, hence aiding recovery.
- Fault Tolerance: r ≈ 0.45. This is a weaker positive correlation. Organizations with a high fault tolerance did tend to recover more, but the relationship was less pronounced. Fault tolerance helps prevent catastrophic drops, but by itself it does not guarantee a full rebound, hence a modest correlation.
- Cohesiveness: r ≈ 0.39. This was the weakest correlation among the tested capabilities. While more cohesive organizations recovered slightly better on average, the effect was relatively small. This makes sense: cohesiveness (strong internal coordination) is beneficial, but if an organization lacks adaptability or resources, being cohesive alone will not regenerate performance quickly.
4.4. Scenario-Based Simulation and Calibration
- Organization A: With a low capability across the board (e.g., Ad = 0.2, FT = 0.3, Di = 0.1, StC = 0.3 on a 0–1 scale), this profile showed minimal recovery (ΔP ≈ 0.05), which was further dampened after the adjustment (ΔP′ ≈ 0.042). Its low plasticity (0.18) and resilience (0.22) scores reflect a fragile profile with poor adaptability and a limited structural capacity.
- Organization B: With a moderate capability (Ad = 0.5, FT = 0.6, Di = 0.4, StC = 0.5) and a mid-level profile, this profile demonstrated partial recovery (~10%), with moderate capability scores yielding ΔP′ ≈ 0.095. The resulting mode scores (Ψ = 0.33, R = 0.39) align with expectations for a mid-level, moderately prepared organization. This is typical of resilient but non-transformative organizations, able to bounce back with some delay or loss but not to innovate or benefit from the disruption.
- Organization C: With a high capability (Ad = 0.8, FT = 0.7, Di = 0.6, StC = 0.7), this profile exhibited the strongest response: ΔP′ ≈ 0.165 indicates not only 15% of its performance recovered but slightly exceeded the baseline. The resilience score (0.61) was notably higher than the plasticity score (0.48), suggesting a proactive rebound rather than simple adaptation, a hallmark of antifragile behavior.
- The weighting structure is internally consistent and credible (Section 4.1);
- Small changes in weights do not upset the model (Section 4.2);
- The capability indicators relate to performance as expected (Section 4.3);
- The integrated model produces logical outcomes for different scenarios (Section 4.4).
- Re-tuning weight coefficients based on industry-specific data;
- Introducing new indicators (e.g., digital resilience, supply chain agility);
- Validating the generalizability of the score behavior across disruption types.
5. Conclusions
- Distinct Capability Configurations: Each response mode is characterized by a specific profile of capabilities. For example, plasticity relies on the adaptability and fault tolerance to stabilize the performance at a lower but sustainable level, resilience depends on robustness to recover to the baseline, transformative resilience involves structural reconfiguration, and antifragility leverages optionality and convex mechanisms to gain from stress. This taxonomy extends Taleb’s fragility–resilience typology into a structured, operational model for decision support and comparative analysis.
- Mathematical Rigor: We derived all indicator weights using the AHP and constructed a multi-level scoring model that links micro-level data (such as product portfolios or network centralities) to macro-level performance outcomes. Consistency checks and sensitivity analyses confirmed the model’s numerical soundness and robustness.
- Predictive Insights: Simulation tests showed that capabilities like adaptability and diversity strongly predict recovery and performance gains, aligning with the model’s theoretical assumptions. The framework thus distinguishes mere recovery from constrained adaptation, strategic reinvention, or performance improvements under disruption.
- Integration of Response Modes: Unlike existing resilience models that focus on static properties or basic recovery, our framework uniquely integrates four differentiated crisis response modes with nonlinear, time-dependent scoring. To our knowledge, this is the first unified, indicator-driven mathematical model that captures plasticity and antifragility (alongside resilience modes) in networked organizations.
- Managerial Implications: The framework offers actionable guidance for practitioners. Managers can use it to diagnose capability gaps, compare investment strategies (e.g., buffering versus learning), and simulate the effects of decisions (e.g., network restructuring) under crisis scenarios. For example, leaders may prioritize investing in learning and flexibility to foster antifragility or in structural safeguards to enhance resilience. In sum, the model provides a transparent bridge between theory and practice, supporting evidence-based resilience planning, system reconfiguration, and opportunistic adaptation in business ecosystems.
Author Contributions
Funding
Data Availability Statement
Conflicts of Interest
References
- Minciu, M.; Berar, F.A.; Dima, C. The Opportunities and Threats in the Context of the V.U.C.A World. Proc. Int. Manag. Conf. 2019, 13, 1142–1150. [Google Scholar]
- Ramezani, J.; Camarinha-Matos, L.M. Approaches for resilience and antifragility in collaborative business ecosystems. Technol. Forecast. Soc. Change 2020, 151, 119846. [Google Scholar] [CrossRef]
- Ramezani, J.; Camarinha-Matos, L.M. Novel Approaches to Handle Disruptions in Business Ecosystems; Springer: Berlin/Heidelberg, Germany, 2019. [Google Scholar] [CrossRef]
- Schweitzer, F.; Casiraghi, G.; Tomasello, M.V.; Garcia, D. Fragile, Yet Resilient: Adaptive Decline in a Collaboration Network of Firms. Front. Appl. Math. Stat. 2021, 7, 6. [Google Scholar] [CrossRef]
- Chen, R.; Xie, Y.; Liu, Y. Defining, conceptualizing, and measuring organizational resilience: A multiple case study. Sustainability 2021, 13, 2517. [Google Scholar] [CrossRef]
- Taleb, N.N. Antifragile: Things That Gain from Disorder; Allen Lane: London, UK, 2012. [Google Scholar]
- Ramezani, J.; Camarinha-Matos, L.M. A collaborative approach to resilient and antifragile business ecosystems. Procedia Comput. Sci. 2019, 162, 604–613. [Google Scholar] [CrossRef]
- Yan, F.; Song, X. A Review of Research on Supply Chain Resilience Evaluation Indicator System and Evaluation Methods. Ind. Sci. Eng. 2024, 1, 22–30. [Google Scholar] [CrossRef]
- Hosseini, S.; Ivanov, D.; Dolgui, A. Review of quantitative methods for supply chain resilience analysis. Transp. Res. E Logist. Transp. Rev. 2019, 125, 285–307. [Google Scholar] [CrossRef]
- Axenie, C. Antifragility as a Complex System’s Response to Perturbations, Volatility, and Time. arXiv 2023, arXiv:10.48550/arXiv.2312.13991. [Google Scholar]
- Graça, P.; Camarinha-Matos, L.M. Influencing collaboration in sustainable business ecosystems. In Collaborative Networks in Digitalization and Society 5.0; Camarinha-Matos, L.M., Boucher, X., Ortiz, A., Eds.; Springer Nature: Cham, Switzerland, 2023; pp. 3–20. [Google Scholar] [CrossRef]
- Fan, R.; Yao, Q.; Chen, R.; Qian, R. Agent-based simulation model of panic buying behavior in urban public crisis events: A social network perspective. Sustain. Cities Soc. 2024, 100, 105002. [Google Scholar] [CrossRef]
- Lu, Y.; Liu, T.; Wang, T. Dynamic analysis of emergency inter-organizational communication network under public health emergency: A case study of COVID-19 in Hubei Province of China. Nat. Hazards 2021, 109, 2003–2026. [Google Scholar] [CrossRef]
- Bravo-Laguna, C. Crisis management from a relational perspective: An analysis of interorganizational transboundary crisis networks. J. Public Policy 2024, 44, 720–746. [Google Scholar] [CrossRef]
- van Hoek, R. Responding to COVID-19 Supply Chain Risks—Insights from Supply Chain Change Management, Total Cost of Ownership and Supplier Segmentation Theory. Logistics 2020, 4, 23. [Google Scholar] [CrossRef]
- Tripsas, M.; Gavetti, G. Capabilities, Cognition, and Inertia: Evidence from Digital Imaging. Strateg. Manag. J. 2000, 21, 1147–1161. [Google Scholar] [CrossRef]
- Behzadi, G.; O’Sullivan, M.J.; Olsen, T.L. On metrics for supply chain resilience. Eur. J. Oper. Res. 2020, 287, 145–158. [Google Scholar] [CrossRef]
- Bruckler, M.; Wietschel, L.; Messmann, L.; Thorenz, A.; Tuma, A. Review of metrics to assess resilience capacities and actions for supply chain resilience. Comput. Ind. Eng. 2024, 192, 110176. [Google Scholar] [CrossRef]
- Saaty, T.L. Relative Measurement and Its Generalization in Decision Making Why Pairwise Comparisons are Central in Mathematics for the Measurement of Intangible Factors the Analytic Hierarchy/Network Process (To the Memory of my Beloved Friend Professor Sixto Rios Garcia). Rev. de la Real Acad. de Cienc. Exactas Fis. y Naturales. Ser. A. Mat. 2008, 102, 251–318. [Google Scholar] [CrossRef]
- Canco, I.; Kruja, D.; Iancu, T. Ahp, a reliable method for quality decision making: A case study in business. Sustainability 2021, 13, 3932. [Google Scholar] [CrossRef]
- Vinogradova-Zinkevič, I.; Podvezko, V.; Zavadskas, E.K. Comparative assessment of the stability of AHP and FAHP methods. Symmetry 2021, 13, 479. [Google Scholar] [CrossRef]
- Graça, P.; Camarinha-Matos, L.M. A proposal of performance indicators for collaborative business ecosystems. In Collaboration in a Hyperconnected World; PRO-VE, 2016, Afsarmanesh, H., Camarinha-Matos, L., Soares, A.L., Eds.; Springer: Berlin/Heidelberg, Germany, 2016; Volume 480, pp. 253–264. [Google Scholar] [CrossRef]
- Graça, P.; Camarinha-Matos, L.M. A Human-AI Centric Performance Evaluation System for Collaborative Business Ecosystems. In Camarinha-Matos, L.M., Ferrada, F. (eds) Technological Innovation for Human-Centric Systems. DoCEIS 2024. In IFIP Advances in Information and Communication Technology; Springer: Cham, Switzerland, 2024; Volume 716, pp. 3–27. [Google Scholar] [CrossRef]
- Yikilmaz, I. A Dynamic Capability to Determine Business Performance in the Post-COVID-19 Era. In Change Management During Unprecedented Times; IGI Global Scientific Publishing: New York, NY, USA, 2023; p. 22. [Google Scholar] [CrossRef]
- Newman, M. Networks: An Introduction, 1st ed.; Oxford University Press: Oxford, UK, 2010. [Google Scholar]
- Jackson, M.O. Social and Economic Networks, illustrated ed.; Princeton University Press: Princeton, NJ, USA, 2008. [Google Scholar]
- Guan, J.; Ma, N. Innovative capability and export performance of Chinese firms. Technovation 2003, 23, 737–747. [Google Scholar] [CrossRef]
- Emeterio, M.C.S.; Fernández-Ortiz, R.; Arteaga-Ortiz, J.; Dorta-González, P. Measuring the gradualist approach to internationalization: Empirical evidence from the wine sector. PLoS ONE 2018, 13, e0196804. [Google Scholar] [CrossRef]
- Robert; Hanneman, A.; Riddle, M. Concepts and Measures for Basic Network Analysis. In The SAGE Handbook of Social Network Analysis; SAGE Publications Ltd.: Thousand Oaks, CA, USA, 2014. [Google Scholar] [CrossRef]
- Borgatti, S.P.; Everett, M.G.; Johnson, J.C.; Agneessens, F. Analyzing Social Networks, 3rd ed.; SAGE Publications Ltd.: Thousand Oaks, CA, USA, 2024. [Google Scholar]
- Taleb, N.N. Mathematical Definition, Mapping, and Detection of (Anti)Fragility. Quant. Finance 2012, 13. [Google Scholar] [CrossRef]
- Taleb, N.N.; West, J. Working with Convex Responses: Antifragility from Finance to Oncology. Entropy 2023, 25, 343. [Google Scholar] [CrossRef]
- Axenie, C.; López-Corona, O.; Makridis, M.A.; Akbarzadeh, M.; Saveriano, M.; Stancu, A.; West, J. Antifragility in complex dynamical systems. NPJ Complex. 2024, 1, 12. [Google Scholar] [CrossRef]
- Prenzel, L.; Steinhorst, S. Towards Resilience by Self-Adaptation of Industrial Control Systems. In Proceedings of the 27th IEEE International Conference on Emerging Technologies and Factory Automation (ETFA), Stuttgart, Germany, 6–9 September 2022; pp. 1–8. [Google Scholar]
- Lutter, M.; Weidner, L. Newcomers, betweenness centrality, and creative success: A study of teams in the board game industry from 1951 to 2017. Poetics 2021, 87, 101535. [Google Scholar] [CrossRef]
- Carmichael, B.; Koumou, G.B.; Moran, K. Unifying Portfolio Diversification Measures Using Rao’s Quadratic Entropy. J. Quant. Econ. 2023, 21, 769–802. [Google Scholar] [CrossRef]
- Olbryś, J.; Ostrowski, K. An entropy-based approach to measurement of stock market depth. Entropy 2021, 23, 568. [Google Scholar] [CrossRef]
- OECD, Eurostat. Oslo Manual. The Measurement of Scientific, Technological and Innovation Activities; OECD Publishing: Paris, France, 2018. [Google Scholar] [CrossRef]
- Kale, P.; Singh, H. Managing Strategic Alliances: What Do We Know Now, and Where Do We Go from Here? Academy of Management Perspectives. 2009. Available online: https://www.jstor.org/stable/27747525 (accessed on 21 December 2023).
- Abreu, A.; Camarinha-Matos, L.M. IFIP AICT 362—An Approach to Measure Social Capital in Collaborative Networks In 12th Working Conference on Virtual Enterprises; Springer: Berlin/Heidelberg, Germany, 2011; pp. 29–40. [Google Scholar] [CrossRef]
- Hosseini, S.; Barker, K.; Ramirez-Marquez, J.E. A review of definitions and measures of system resilience. Reliab. Eng. Syst. Saf. 2016, 145, 47–61. [Google Scholar] [CrossRef]
- Somers, S. Measuring resilience potential: An adaptive strategy for organizational crisis planning. J. Contingencies Crisis Manag. 2009, 17, 12–23. [Google Scholar] [CrossRef]
- Valiyev, I. Strategic Management in the Anti-Crisis Regulation of the Organization’s Activities. Anc. Land 2024, 6, 137–140. [Google Scholar] [CrossRef]
- Panteli, M.; Mancarella, P. Modeling and evaluating the resilience of critical electrical power infrastructure to extreme weather events. IEEE Syst. J. 2017, 11, 1733–1742. [Google Scholar] [CrossRef]
- Ivanov, D.; Dolgui, A. A digital supply chain twin for managing the disruption risks and resilience in the era of Industry 4.0. Prod. Plan. Control 2021, 32, 775–788. [Google Scholar] [CrossRef]
- Chen, Q.; Sun, T.; Wang, T. Network centrality, support organizations, exploratory innovation: Empirical analysis of China’s integrated circuit industry. Heliyon 2023, 9, e17709. [Google Scholar] [CrossRef]
- Duchek, S. Organizational resilience: A capability-based conceptualization. Bus. Res. 2020, 13, 215–246. [Google Scholar] [CrossRef]
- Williams, T.A.; Gruber, D.A.; Sutcliffe, K.M.; Shepherd, D.A.; Zhao, E.Y. Organizational response to adversity: Fusing crisis management and resilience research streams. Acad. Manag. Ann. 2017, 11, 733–769. [Google Scholar] [CrossRef]
- Argote, L. Organizational learning research: Past, present and future. Manag. Learn. 2011, 42, 439–446. [Google Scholar] [CrossRef]
- Zhang, Y.; Shao, C.; He, S.; Gao, J. Resilience centrality in complex networks. Physical Review E 2020, 101, 022304. [Google Scholar] [CrossRef]
- Oh, I.S.; Han, J.H. Will investments in human resources during the COVID-19 pandemic crisis pay off after the crisis? SSRN Electron. J. 2021, 14, 98–100. [Google Scholar] [CrossRef]
- Borgatti, S.P.; Everett, M.G. A Graph-theoretic perspective on centrality. Soc. Netw. 2006, 28, 466–484. [Google Scholar] [CrossRef]
- Li, L.; Wang, J.; Yuan, J.; Gu, T.; Ling, S.; Zhan, H. Unlocking Physical Resilience Capacities of Building Systems: An Enhanced Network Analysis Approach. Buildings 2025, 15, 641. [Google Scholar] [CrossRef]
- Opsahl, T.; Agneessens, F.; Skvoretz, J. Node centrality in weighted networks: Generalizing degree and shortest paths. Soc. Netw. 2010, 32, 245–251. [Google Scholar] [CrossRef]
- Centola, D. The spread of behavior in an online social network experiment. Science 2010, 329, 1194–1197. [Google Scholar] [CrossRef]
- Ivanov, D.; Sokolov, B. Adaptive Supply Chain Management; Springer: London, UK, 2010. [Google Scholar] [CrossRef]
- Panzarasa, P.; Opsahl, T.; Carley, K.M. Patterns and dynamics of users’ behavior and interaction: Network analysis of an online community. J. Am. Soc. Inf. Sci. Technol. 2009, 60, 911–932. [Google Scholar] [CrossRef]
- Guimerà, R.; Danon, L.; Díaz-Guilera, A.; Giralt, F.; Arenas, A. Self-similar community structure in a network of human interactions. Phys. Rev. E 2003, 68, 065103. [Google Scholar] [CrossRef]
- Yang, Z.; Wu, M.; Sun, J.; Zhang, Y. Aligning redundancy and flexibility for supply chain resilience: A literature synthesis. J. Risk Res. 2024, 27, 313–335. [Google Scholar] [CrossRef]
- Gochhayat, S.P.; Shetty, S.; Mukkamala, R.; Foytik, P.; Kamhoua, G.A.; Njilla, L. Measuring decentrality in blockchain based systems. IEEE Access 2020, 8, 178372–178390. [Google Scholar] [CrossRef]
- Erdmenger, J.; Grosvenor, K.T.; Jefferson, R. Towards quantifying information flows: Relative entropy in deep neural networks and the renormalization group. SciPost Phys. 2022, 12. [Google Scholar] [CrossRef]
- Erkut, E.; Tarimcilar, M. On sensitivity analysis in the analytic hierarchy process. IMA J. Manag. Math. 1991, 3, 61–83. [Google Scholar] [CrossRef]
- Hu, C.; Yun, K.H.; Su, Z.; Xi, C. Effective Crisis Management during Adversity: Organizing Resilience Capabilities of Firms and Sustainable Performance during COVID-19. Sustainability 2022, 14, 3664. [Google Scholar] [CrossRef]

| Plasticity | Resilience | Transformative Resilience | Antifragility | |
|---|---|---|---|---|
| Performance level after shock | Stabilizes at a lower, yet sustainable, performance level (e.g., 60–85% of baseline) | Returns to pre-shock performance (95–100% of baseline) | Recovers or exceeds baseline performance with positive structural change | Surpasses pre-shock performance (greater than 100% of baseline) |
| Nature of change | Permanent structural or functional adaptation; constrained flexibility | Temporary or reversible adjustments; core structure preserved | Positive, evolutionary transformation; fundamental reconfiguration | Innovative, opportunistic transformation; benefits directly from stress |
| Recovery capability | Full recovery is not possible; only partial, stable adaptation | Full recovery of function and structure | Recovery with systemic improvement and enhanced adaptability | Increased capability and performance as a result of the shock |
| Long-term outcome | New, lower equilibrium; reduced growth potential | Restoration of normalcy and stability | Enhanced resilience and adaptability for future challenges | Enhanced growth trajectory and ability to exploit volatility |
| Learning and growth | Limited learning; focus on survival and coping | Learning aimed at restoring previous state | Deep learning, innovation, and positive transformation | Proactive learning; accelerated innovation and growth |
| Response to future challenges | Increased vulnerability; reduced adaptive capacity | Maintained or improved capacity to respond | Greater flexibility and preparedness for future disruptions | Improved ability to thrive and capitalize on future shocks |
| Example | Kodak: After failing to adapt to digital photography, Kodak filed for bankruptcy in 2012 but re-emerged as a smaller, restructured company focused on commercial printing and imaging, stabilizing at a much lower scale than its historical dominance [16]. | Walt Disney: After facing severe financial distress and near-bankruptcy in the early 2000s, Disney restructured, refocused on core brands, invested in new attractions, and rebounded to become one of the world’s most valuable media companies. | IBM: In response to industry disruption and declining hardware sales, IBM shifted its business model to focus on cloud computing and hybrid cloud services, transforming its core operations and regaining industry leadership. | Netflix: Netflix, through its “Simian Army” chaos engineering tools, continuously tests and strengthens its systems by intentionally introducing failures, enabling it to evolve and thrive amid ongoing technological challenges [2]. |
| Innovation | Contribution | Prestige | RBO | |
|---|---|---|---|---|
| Innovation | 1 | 2 | 3 | 2 |
| Contribution | 1 | 2 | 1 | |
| Prestige | 1 | |||
| RBO | 1 | 2 | 1 |
| Indicator | Weight |
|---|---|
| Innovation | 0.424 |
| Contribution | 0.227 |
| RBO | 0.227 |
| Prestige | 0.122 |
| Adaptability | Cohesiveness | Fault Tolerance | Hysteresis | |
|---|---|---|---|---|
| Adaptability | 1 | 3 | 2 | 4 |
| Cohesiveness | 1 | 2 | ||
| Fault Tolerance | 2 | 1 | 3 | |
| Hysteresis | 1 |
| Indicator | Weight |
|---|---|
| Adaptability | 0.4660 |
| Fault Tolerance | 0.2771 |
| Cohesiveness | 0.1611 |
| Hysteresis | 0.0960 |
| Diversity | Adaptability | Efficiency | Cohesiveness | Structural Capability | Fault Tolerance | Learning | |
|---|---|---|---|---|---|---|---|
| Diversity | 1 | 1 | 2 | 3 | 2 | 1 | |
| Adaptability | 1 | 1 | 2 | 3 | 2 | 1 | |
| Efficiency | 1 | 2 | 1 | ||||
| Cohesiveness | 1 | ||||||
| Structural Capability | 2 | 2 | 3 | 4 | 1 | 3 | 2 |
| Fault Tolerance | 1 | 2 | 1 | ||||
| Learning | 1 | 1 | 2 | 3 | 2 | 1 |
| Indicator | Weight |
|---|---|
| Adaptability | 0.1619 |
| Diversity | 0.1619 |
| Efficiency | 0.0884 |
| Cohesiveness | 0.0548 |
| Structural Capability | 0.2828 |
| Fault Tolerance | 0.0884 |
| Learning | 0.1619 |
| Adaptability | Structural Capability | Transformability | Creativity | Learning | |
|---|---|---|---|---|---|
| Adaptability | 1 | 1 | 2 | 3 | |
| Structural Capability | 1 | 1 | 2 | 3 | |
| Transformability | 2 | 2 | 1 | 4 | 5 |
| Creativity | 1 | 2 | |||
| Learning | 1 |
| Indicator | Weight |
|---|---|
| Adaptability | 0.2085 |
| Structural Capability | 0.2085 |
| Transformability | 0.4028 |
| Creativity | 0.1114 |
| Learning | 0.0687 |
| Diversity | Adaptability | Structural Capability | Fault Tolerance | Learning | Convexity | Creativity | |
|---|---|---|---|---|---|---|---|
| Diversity | 1 | 1 | 2 | 1 | 2 | ||
| Adaptability | 1 | 1 | 2 | 1 | 2 | ||
| Structural Capability | 2 | 2 | 1 | 3 | 2 | 3 | |
| Fault Tolerance | 1 | 1 | |||||
| Learning | 1 | 1 | 2 | 1 | 2 | ||
| Convexity | 3 | 3 | 4 | 4 | 3 | 1 | 4 |
| Creativity | 1 | 1 |
| Indicator | Weight |
|---|---|
| Diversity | 0.1116 |
| Adaptability | 0.1116 |
| Structural Capability | 0.1961 |
| Fault Tolerance | 0.0614 |
| Learning | 0.1116 |
| Convexity | 0.3464 |
| Creativity | 0.0614 |
| Calculation Formulas | Description | |
|---|---|---|
| Innovation Indicator | Organization Level: ϵ (a small constant, e.g., 1) prevents division by zero and avoids extreme values when the portfolio size is small. CBE Level: | Innovation (Inv) measures the innovation potential of the organization/CBE. Inv is measured as a weighted combination of three factors: 1. The ratio of new products or services to the existing portfolio at the organizational and CBE levels. 2. Patent application ratio to R&D Projects. 3. Proportion of utilized opportunities that were innovation-driven (Inv3i, Inv3CBE). Variable definitions: #NewPdi: Number of new products or services generated by organization i. #PortPdi: Total portfolio of products or services of organization i. #OppInnoi: Number of opportunities utilized with innovative solutions by organization i. #OppUtili: Number of opportunities utilized. #PtnAppi: Number of patent applications submitted by organization i. #TechDisci: Number of technological discoveries (software, prototypes, trade secrets) by organization i. #RnDPrji: Total number of R&D projects conducted by organization i. |
| Contribution Indicator | Organization Level: CBE Level: | Contribution (Cnt) is measured as a weighted combination of three key factors: 1. The proportion of collaborative projects to total projects at the organizational (Cnt1) and CBE (Cnt1CBE) levels. 2. The degree of incoming and outgoing collaborative activities (Cnt2, Cnt2CBE). 3. The level of shared resources relative to total resources (Cnt3, Cnt3CBE). Variable definitions: #CoPrji: Number of collaborative projects involving organization i. #TotPrji: Total projects involving organization i. #Actin, i: Incoming collaborative activities for organization i. #Act out, i: Outgoing collaborative activities from organization i. #ShResi: Resources shared by organization i. #TotResi: Total resources owned by organization i. |
| Prestige Indicator | Organization Level: CBE Level: | Prestige (Prs) is measured as a weighted combination of three key factors: 1. Network influence through eigenvector centrality at the organizational (Prs1) and CBE (Prs1CBE) levels. 2. Commitment to Opportunities: Organizations that commit to opportunities over time build stronger reputations (Prs2, Prs2CBE). 3. Recognized Achievements: A higher proportion of recognized accomplishments increases Prestige. Variable definitions: EigCnt (Oi): Eigenvector centrality for organization i, measuring how well it is connected to other influential organizations. #OppComti: Number of committed opportunities. #OppUtili: Number of opportunities utilized. #Recogi: Number of recognized achievements (including publications, awards, and certifications). #Achvi: Total number of achievements claimed by organization I (publications + awards + certifications). |
| Opportunity Responsiveness (RBO) Indicator | Organization Level: where d (Oi, Oj) is the shortest path distance between organization Oi and Oj. (A higher closeness centrality indicates better accessibility to opportunities.) CBE Level: | Responsiveness to Business Opportunities (RBO) is measured as a weighted combination of three key factors: 1. Overall business opportunity utilization rate at the organizational (RBO 1i) and CBE (RBO 1CBE) levels. 2. Timeliness in completing business opportunities (RBO 2i, RBO 2CBE). 3. Average closeness centrality, reflecting accessibility to opportunities (RBO 3i, RBO 3CBE). Variable Definitions: #OppUtili: Number of opportunities utilized by organization i. #TotOppi: Total number of opportunities identified by organization i. #OppOnTimei: Number of utilized business opportunities that were completed within the required deadline for organization i. CloseCnt (Oi): Closeness centrality for organization i. A higher value indicates better accessibility to opportunities. W1, W2, W3: Weights assigned to metrics, allowing adjustment of their relative importance. |
| Response Mode | Performance Modifier Formula | WC | WS | WP | Description |
|---|---|---|---|---|---|
| Plasticity Ψ | 0.4 | 0.4 | 0.2 | Emphasizes internal adaptability and strategic buffering, with partial recovery. CPl = f(Ad,FT,Coh,Hys). SPl: Scenario value (e.g., buffering, redundancy). | |
| Resilience R | R = | 0.4 | 0.2 | 0.4 | Emphasizes full recovery driven by structural and adaptive capabilities. CRe: f(Stc,Ad,Di,Lrn,Ef,FT,Coh). SRe: Scenario value (e.g., info/risk sharing). |
| Transformative Resilience T | 0.4 | 0.1 | 0.5 | Includes structural transformation multiplier. CTr: f(Tr,Ad,Stc,Crt,Lrn). STr: Scenario value (e.g., innovation, network reconfiguration). α = 1.2 if structural change occurred, otherwise 1. | |
| Antifragility A | A = | 0.4 | 0.1 | 0.5 | Emphasizes performance gain from stress, with ε ≈ 10−6 to avoid division by zero. CAn: f(Cnv,Stc,Di,Ad,Lrn,Crt,FT). SAn: Scenario value (e.g., optionality, fault injection). |
| Calculation Formulas | Description | |
|---|---|---|
| Adaptability Indicator | Organization Level: CBE Level: | Adaptability (Ad) is measured as a weighted combination of three key factors: 1. Structural adaptability through indirect linkages at the organizational (Ad1i) and CBE (Ad1CBE) levels. 2. Technology adoption and integration (Ad2i, Ad2CBE). 3. Successful market entry and competition (Ad3i, Ad3CBE). Variable Definitions: pij: Probability of direct interaction between organizations i and j.: Probability of indirect interaction between i and j via an intermediary k. W: Weight factor for indirect interactions (0 < W < 1). #NewTechi: Number of new technologies adopted by organization i. ScfRate: Success rate of new technology implementation for organization i. #ScfMktEntriesi: Number of successful market entries by organization i. #TotMktEntriesi: Total number of market entry attempts by organization i. W1, W2, W3: Weights assigned to each adaptability metric. |
| Cohesiveness Indicator | Organization Level: CBE Level: | Cohesiveness (Coh) is measured as a weighted combination of two key factors: 1. Reciprocity of collaboration opportunities at the organizational (Coh1i) and CBE (Coh1CBE) levels. 2. Density of direct connections (Coh2i, Coh2CBE). Variable Definitions: #ColOpin,i in: Number of collaboration opportunities received by organization i. #ColOpout,i out: Number of collaboration opportunities initiated by organization i. N: Total number of organizations in CBE. #Relationsi: Total number of direct connections of organization i. W1, W2: Weights assigned to metrics, allowing for adjustment of their relative importance. |
| Convexity Indicator | Organization Level: CBE Level: | Convexity (Cnv) measures how much an organization’s performance exceeds pre-disruption levels after recovery. It incorporates three components: 1. The relative performance improvement at the organizational (Cnv1i) and CBE (Cnv1CBE) levels. 2. The impact of strategies (Cnv2i, Cnv2CBE). 3. The ability to capitalize on new business opportunities (Cnv3i, Cnv3CBE). Variable Definitions: Ppre,i: Pre-disruption performance of organization i. Ppost,i: Post-disruption performance of organization i. Prodnormal,i: Normal productivity of organization i. Es: The impact of strategy s taken by the organization. S: The set of all strategies implemented by the organization. #NewBopost,i: Number of new business opportunities gained by organization i after disruption. Tpost-recovery: The time period after recovery in which new opportunities are measured. N: Total number of organizations in the ecosystem. W1, W2, W3: Weights assigned to each convexity metric, adjusted for their importance at both levels. |
| Creativity Indicator | Organization Level: CBE Level: | Creativity (Crt) is measured as a weighted combination of three factors: 1. R&D investment ratio to operating costs at the organizational (Crt1i) and CBE (Crt1CBE) levels. 2. The collaborative potential of an organization based on its network centrality (Crt2i, Crt2CBE). Variable definitions: RnDExpi: Total research and development expenditure for organization i. #OpExpi: Total operating expenses for organization i. BetCnti: Betweenness centrality of organization i in the ecosystem network. N: Total number of organizations in the CBE. W1, W2, W3: Weights assigned to each creativity metric based on its importance. |
| Diversity Indicator | Organization Level: CBE Level: | Diversity (Di) is measured as a weighted combination of three factors: 1. Measures the product/service diversity of an organization, normalized by the highest product count in the ecosystem at the organizational (Di1i) and CBE (Di1CBE) levels. 2. Measures the competency diversity of an organization relative to the entire ecosystem’s total competencies (Di2i, Di2CBE). 3. Captures market diversification using Shannon entropy to quantify how evenly an organization’s connections are spread across different markets. Variable Definitions: #PortPdi: Portfolio of products or services of organization i. #PortCmti: Portfolio of competencies (skills/expertise) of organization i. Pij: Proportion of organization i’s connections linked to organization j. N: Total number of organizations in the ecosystem. W1, W2, W3: Weights assigned to each diversity metric, adjusted for their importance at both levels. |
| Efficiency Indicator | Organization Level: CBE Level: | Efficiency (Ef) measures how well an organization or ecosystem 1. Develops revenue in proportion to new products/services at the organizational (Ef1i) and CBE (Ef1CBE) levels. 2. Converts collaboration opportunities into successful outcomes (Ef2i, Ef2CBE). 3. Effectively utilizes its network connections for collaboration (Ef3i, Ef3CBE). Variable Definitions: Revnew,i: Revenue from newly introduced products/services for organization i. Revtotal,i: Total revenue for organization i. #ScColi: Number of successful collaborations in organization i. #TotColi: Total number of collaboration attempts in organization i. #EdgColi: Number of network edges actively used in collaborations by organization i. #TotEdgi: Total number of potential edges in the organization’s collaboration network. |
| Fault Tolerance Indicator | Organization Level: CBE Level: | Fault Tolerance (FT) is measured as a weighted combination of three key factors: 1. The percentage loss in productivity under stress at the organizational (FT1i) and CBE (FT1CBE) levels. 2. The proportion of employees retained during stress. 3. The time taken to recover from disruption. Variable Definitions: Prodnormal,i: Productivity of organization I under normal conditions. Prodstress, i: Productivity of organization i during or after stress/disruption. Empretained, i: Number of employees retained during disruption in organization i. Emptotal, i: Total number of employees in organizations. Trecovery, i: Time taken for organization i to recover performance post-disruption. Ttotal, i: Total reference time period for performance assessment. N: Total number of organizations in the ecosystem. W: Weights representing the importance of each fault tolerance metric. |
| Hysteresis Indicator | Organization Level: CBE Level: | Hysteresis (Hys) measures how past disruptions affect the speed and trajectory of recovery. It accounts for the following: 1. Immediate performance drops after disruption at the organizational (Hys1i) and CBE (Hys1CBE) levels. 2. Time required to recover performance to pre-disruption level (Hys2i, Hys2CBE). 3. Impact of past disruptions on current recovery speed (Hys3i, Hys3CBE). Variable Definitions: Ppre,i: Pre-disruption performance of organization i. Pdrop,i: Minimum performance level reached after disruption for organization i. Trecovery, i: Time required for organization iii to recover to pre-disruption performance. Dimpact: The impact of each past disruption on the organization’s ability to recover. #PastEvents: The total number of past disruptions that affected the organization. N: Total number of organizations in the ecosystem. W1, W2, W3: Weights for adjusting the relative importance of each hysteresis metric. |
| Learning Capability Indicator | Organization Level: CBE Level: | Learning Capability (Lrn) is measured as a weighted combination of three factors: 1. Relative performance improvement after disruption at the organizational (Lrn1i) and CBE (Lrn1CBE) levels. 2. Knowledge-sharing events conducted over time (Lrn2i, Lrn2CBE). 3. Percentage of total revenue invested in training (self-reported) (Lrn3i, Lrn3CBE). Variable definitions: : Pre-disruption performance of organization. : Post-disruption performance of organization i. : Number of knowledge-sharing events conducted by organization i. T: Time period (e.g., months, years). : Self-reported percentage of total revenue invested in training N: Total number of organizations in the CBE. W1, W2, W3: Weights assigned to each learning metric based on strategic priorities. |
| Structural Capability Indicator | Organization Level: CBE Level: | Structural Capability (Stc) is measured as a weighted combination of three key factors: 1. Direct connectivity (degree centrality) at the organizational (Stc1i) and CBE (Stc1CBE) levels. 2. Flow asymmetry (Stc2i, Stc2CBE). 3. Redundancy and backup system preparedness (Stc3i, Stc3CBE). Variable Definitions: Degi: Degree of organization i (number of direct connections in the network). : Average degree of all organizations in the ecosystem. InDegj: Number of incoming connections to organization i. OutDegi: Number of outgoing connections from organization i. #BcSysi: Number of backup systems in organization i. #TotSysi: Total number of systems in organization i. N: Total number of organizations in the ecosystem. W1, W2, W3: Weights assigned to each structural capability metric. |
| Transformability Indicator | Organization Level: CBE Level: | Transformability (Tr) is measured as a weighted combination of four key factors: 1. Structural flexibility through edge modifications at the organizational (Tr1i) and CBE (Tr1CBE) levels. 2. Redundancy via backup nodes (Tr2i, Tr2CBE). 3. Decentralization of decision-making (Tr3i, Tr3CBE). Variable Definitions: #ChEdgi: Number of changed edges in organization i #TotEdgi: Total number of edges in organization i. #BcNodi: Number of backup nodes in organization i. #TotNodi: Total number of nodes in organization i. degj: Degree of node j in the network. : Average degree of all nodes in the ecosystem. N: Total number of organizations in the ecosystem. W1, W2, W3: Weights for adjusting the relative importance of each metric. |
| Organization | Ad | FT | Di | Stc | ΔP | ΔP′ | Ψ (Plasticity) | R (Resilience) |
|---|---|---|---|---|---|---|---|---|
| A | 0.2 | 0.3 | 0.1 | 0.3 | 0.05 | 0.042 | 0.18 | 0.22 |
| B | 0.5 | 0.6 | 0.4 | 0.5 | 0.10 | 0.095 | 0.33 | 0.39 |
| C | 0.8 | 0.7 | 0.6 | 0.7 | 0.15 | 0.165 | 0.48 | 0.61 |
Disclaimer/Publisher’s Note: The statements, opinions and data contained in all publications are solely those of the individual author(s) and contributor(s) and not of MDPI and/or the editor(s). MDPI and/or the editor(s) disclaim responsibility for any injury to people or property resulting from any ideas, methods, instructions or products referred to in the content. |
© 2025 by the authors. Licensee MDPI, Basel, Switzerland. This article is an open access article distributed under the terms and conditions of the Creative Commons Attribution (CC BY) license (https://creativecommons.org/licenses/by/4.0/).
Share and Cite
Ramezani, J.; Gomes, L.; Graça, P. Crisis Response Modes in Collaborative Business Ecosystems: A Mathematical Framework from Plasticity to Antifragility. Mathematics 2025, 13, 2421. https://doi.org/10.3390/math13152421
Ramezani J, Gomes L, Graça P. Crisis Response Modes in Collaborative Business Ecosystems: A Mathematical Framework from Plasticity to Antifragility. Mathematics. 2025; 13(15):2421. https://doi.org/10.3390/math13152421
Chicago/Turabian StyleRamezani, Javaneh, Luis Gomes, and Paula Graça. 2025. "Crisis Response Modes in Collaborative Business Ecosystems: A Mathematical Framework from Plasticity to Antifragility" Mathematics 13, no. 15: 2421. https://doi.org/10.3390/math13152421
APA StyleRamezani, J., Gomes, L., & Graça, P. (2025). Crisis Response Modes in Collaborative Business Ecosystems: A Mathematical Framework from Plasticity to Antifragility. Mathematics, 13(15), 2421. https://doi.org/10.3390/math13152421