Abstract
The Hidden Markov Model (HMM) is a crucial probabilistic modeling technique for sequence data processing and statistical learning that has been extensively utilized in various engineering applications. Traditionally, the EM algorithm is employed to fit HMMs, but currently, academics and professionals exhibit augmenting enthusiasm in Bayesian inference. In the Bayesian context, Markov Chain Monte Carlo (MCMC) methods are commonly used for inferring HMMs, but they can be computationally demanding for high-dimensional covariate data. As a rapid substitute, variational approximation has become a noteworthy and effective approximate inference approach, particularly in recent years, for representation learning in deep generative models. However, there has been limited exploration of variational inference for HMMs with high-dimensional covariates. In this article, we develop a mean-field Variational Bayesian method with the double-exponential shrinkage prior to fit high-dimensional HMMs whose hidden states are of discrete types. The proposed method offers the advantage of fitting the model and investigating specific factors that impact the response variable changes simultaneously. In addition, since the proposed method is based on the Variational Bayesian framework, the proposed method can avoid huge memory and intensive computational cost typical of traditional Bayesian methods. In the simulation studies, we demonstrate that the proposed method can quickly and accurately estimate the posterior distributions of the parameters with good performance. We analyzed the Beijing Multi-Site Air-Quality data and predicted the PM2.5 values via the fitted HMMs.
MSC:
62F15; 65K10; 62M05
1. Introduction
Hidden Markov Models (HMMs) are a statistical model used to describe the evolution of observable events that depend on internal factors or states, which are not directly observable and called hidden states. Each hidden state can transition to another hidden state, including itself, with a certain probability, while we cannot observe them directly, we infer their presence and transitions between them based on observable outputs. HMMs have been widely used in various applications, including speech recognition, bioinformatics, natural language processing, and financial markets. In practice, HMMs often face high-dimensional issues, that is, a large number of covariates (or high-dimensional covariates) and multiple states result in high-dimensional parameters existing in the HMMs. The high-dimensional issue may result in the overfitting for the HMMs. The challenge then becomes identifying important variables or parameters in different hidden states. Thus, efficient parameter estimation and hidden Markov chain recovering are significant for the high-dimensional HMMs.
Currently, there have been many methods for estimating parameter estimation and recovering hidden Markov chains, including recursive algorithms [1,2,3,4] and traditional Bayesian methods [5,6]. Bayesian inference [7,8] is a versatile framework that utilizes sophisticated hierarchical data models for learning and consistently quantifies uncertainty in unknown parameters through the posterior distribution [9]. However, computing the posterior is demanding even for moderately intricate models and frequently necessitates approximation. Moreover, traditional Bayesian methods (e.g., Markov chain Monte Carlo (MCMC)) for the HMMs is often considered a black-box method by many statisticians due to its reliance on simulations to produce computable results, which is generally inefficient and unnecessary. Traditional Markov Chain Monte Carlo (MCMC) methods may also exhibit slow convergence and extended running times, as documented in prior studies [10,11,12].
The Variational Bayesian approach is an alternative to traditional MCMC algorithm in high-dimensional issue. Variational inference (VI) based on Bayesian method [13,14,15,16] can approximate posterior distributions quickly [17], since VI uses the Kullback–Leibler (KL) divergence to measure the difference between the variational posterior and the true posterior, and transforms the statistical inference problem into a mathematical optimization problem by minimizing the KL divergence. Therefore, the variational approach is as close as possible to the true posterior distribution according to the KL divergence. Wang and Blei [17] have proved that the variational posterior is consistent to the true posterior distribution. Moreover, there have been many efficient optimization algorithms to approximate complex probability densities such as coordinate-ascent (CAVI) [18] and gradient-based methods [15,19]. Currently, there exist many VI research studies for the HMMs [20,21,22,23,24]. For example, MacKay [20] was the pioneering proponent of the application of variational methods to HMMs, with a focus only on cases with discrete observations. Despite the limited comprehension of the state-removal phenomenon, which is that removing certain states from an HMM for simplifying the HMM while preserving its essential statistical properties does not significantly affect the the ability of the HMM to represent the underly stochastic process, variational methods are gaining popularity for HMMs within the machine learning community. C. A. McGrory [21] extended the deviance information criterion for Bayesian model selection within the Hidden Markov Model framework, utilizing a variational approximation. Nicholas J. Foti [22] devised an SVI algorithm to learn HMM parameters in settings of time-dependent data. Since VI can be seen as a special instance of the EM algorithm [23], Gruhl [23] integrates both approaches and uses the multivariate Gaussian output distribution of VI to train the HMM. Ding [24] employed variational inference techniques to investigate nonparametric Bayesian Hidden Markov Models built on Dirichlet processes. These processes enable an unbounded number of hidden states and adopt an infinite number of Gaussian components to handle continuous observations. However, variational inference has not been fully explored in HMMs, especially in HMMs with a high-dimensional covariate. It is important to note that research frequently entails using high-dimensional covariate datasets in real-world applications. When high-dimensional HMMs contain a large number of parameters, there is a possibility of overfitting the given data set. The challenge then becomes identifying which covariates have a substantial impact on the interpretation of observations and state shifts in each hidden state of the model, and which covariates have a negligible effect. This process is important for improving the predictive accuracy of the model, reducing the risk of overfitting, and improving the interpretability of the model.
In this article, we develop a Variational Bayesian method for variable selection. We utilize the double-exponential shrinkage prior [25,26,27,28] as the prior of coefficients in each hidden state models, to screen vital variables that affect each hidden state and obtain hidden Markov regression models. We use mean-field variational inference to identify variational densities for approximating complex posterior densities, via minimizing the difference between the approximate probability density and the actual posterior probability density. Moreover, we adopt the Monte Carlo Co-ordinate Ascent VI (MC-CAVI) [29] algorithm to compute the necessary expectations within the CAVI. Since the variational inference is a fast alternative to the MCMC method and can avoid large memory and intensive computational cost compared to traditional Bayesian methods, the proposed approach inherits the good properties of variational inference, and can quickly and accurately estimate the posterior distributions and the unknown parameters. In the simulation studies and real data analysis, the proposed method outperforms the common methods in term of variable selection and prediction.
The main contributions of this article are as follows: First, the proposed method can perform variable selection for high-dimensional HMMs, and offer the advantage of fitting the model and investigating specific factors that impact the response variable changes simultaneously. Since the proposed method uses double-exponential shrinkage prior, which has the feature of being able to select important variables, the proposed method can simultaneously select important variables to the response variable and estimate the corresponding parameters. Second, since the proposed method is based on the Variational Bayesian framework, the proposed method can avoid huge memory and intensive computational cost of the traditional Bayesian methods, especially for the high-dimensional issue. Finally, we demonstrate that the proposed method can quickly and accurately estimate the posterior distributions of the parameters with good performance in the simulation studies. Moreover, we analyze Beijing Multi-Site Air-Quality data and predict the PM2.5 values well via the fitted HMMs.
The rest of the article is organized as follows: Section 2 introduce the Hidden Markov Model with high-dimensional covariate and shrinkage priors in the Bayesian inference. In Section 3, we propose an efficient Variational Bayesian estimation method with the double-exponential shrinkage prior for variable selection of the high-dimensional HMMs (HDVBHMM). In Section 4, we conduct simulation studies to investigate the finite sample performances of the proposed method. In Section 5, Beijing Multi-Site Air-Quality data are analyzed and the efficiency of the proposed method is verified. Section 6 concludes our work. Technical details are presented in the Appendix A.
2. Model and Notation
2.1. Hidden Markov Model
In this section, we first introduce Hidden Markov Models (HMMs). The HMMs are a type of doubly stochastic process that occurs over discrete time intervals and includes observations and latent states . In a traditional Hidden Markov Model without covariates, the observation depends only on the current potential state . The conditional distribution of the observation when given the potential state can be expressed as:
where denotes a certain family of distributions, such as the normal distribution . Extended HMM models can include covariates . That is, the set of observations is and . Specifically, for , and , the model expression is as follows:
where the symbol N represents the normal distribution, denotes the variance of , and is the coefficient of the covariate at all hidden states. In the article, we consider the high-dimensional issue of the covariate. We denote the dummy variable corresponding to as the , where and other elements being zero if . Thus,
In hidden Markov chains, each hidden state is independent from and conditionally on . Therefore, we can assume that the probability distribution of is given by , where and . The conditional probability of given is assumed as:
where A is the transition matrix with elements for , and , and represents the probability of transitioning from state i to state j. Thus, the joint distribution is as follows:
2.2. Prior Selection in the HMMs
To make Variational Bayesian inference, we require specifying the prior of the parameters , A, and . Based on the characteristics of , and , Dirichlet distribution is applied to the prior distribution of as follows:
where , , and . In the model, A denotes the transition matrix of the hidden state and can be expressed as follows:
Like Nicholas [22], we specify the prior of the jth row of the transition matrix A as:
where , , and . Since is variance of the y, we specify the prior of the as
In a high-dimensional and sparse issue, we consider the double-exponential shrinkage prior [25,27] as the prior of , defined as follows:
where represents gamma distribution and represents the exponential distribution. The above prior can select important variables of the HMMs in each hidden state. Bayesian approaches can be used to solve the parameter estimation question with the above prior information. However, in high-dimensional data, the traditional Bayesian methods (e.g., MCMC) require huge memory and intensive computational cost. The Variational Bayesian approach is an alternative to the traditional MCMC algorithm in high-dimensional issue. Next, we introduce the proposed Variational Bayesian inference for high-dimensional HMMs.
3. Variational Bayesian Inference for the HMMS
3.1. Mean Field Variational
Mean-field Variational Bayesian inference is a prevalent approach in variational inference, and aims to identify an approximate density by minimizing the difference between the approximate probability density and the actual posterior probability density, while being bounded by the Kullback–Leibler divergence. In this subsection, we proposed the mean-field variational inference for HMMS with the high-dimensional covariates.
Let be an observed data set, with response set and covariate set , and . The and include all parameters in the HMMs. We focus on the posterior distribution of parameters and the hidden state . Assume that there is an approximate density family containing possible densities over the parameters . Minimizing the Kullback–Leibler (KL) divergence between the member of the family and the true posterior is to obtain the optimal density approximation of the true posterior, with variational inference prioritizing optimization rather than sampling. That is,
where the KL-divergence is:
The KL-divergence can be further written as:
where is a constant, denotes the expected value of and z drawn from the distribution q. Thus, minimizing the KL divergence is equivalent to maximizing the following evidence lower bound (ELBO):
From another perspective, the ELBO comprises the negative KL divergence and .
According to the mean-field variational framework [30,31], the parameters are assumed to be posterior independent of each other and to be controlled by a separate factor in the variational density. In the HMMs, is decomposed as:
Each parameter and latent state is governed by its own variational factor. The forms of and are unknown, but the form of the hypothesized factorization is determined. In the optimization process, the optimal solutions of these variational factors and are obtained by maximizing the ELBO of Equation (6) by the coordinate ascent method. Based on the consistency of the Variational Bayesian [17], the variational densities over the mean-field family are still consistent to the posterior densities, even though the mean field approximating family can be a brutal approximation. More generally, one can consider structured variational distributions involving partial factorizations that correspond to tractable substructures of parameters [32]. In this article, we only consider the mean field framework. To express the variational posterior formula concisely, we define and rewrite as .
3.2. The Coordinate Ascent Algorithm for Optimizing the ELBO
Based on the variational density decomposition, we can obtain each factor of the variational density via maximizing the ELBO. Let for be the ith factor of the variational density in (7). The common approaches to maximize the ELBO mainly include a Coordinate Ascent Variational Inference (CAVI) and a gradient-based approach [33]. The CAVI approach sequentially optimizes each factor of the variational density of the mean field to obtain a local maximizer for the ELBO, while keeping the others fixed. Based on the CAVI approach, we can obtain the optimal variational density as follows:
where (or ) refers to the ordered indexes that are less than (or greater than) i. Let . The vector represents the vector with the ith component removed. The denotes the expectation with respect to .
Based on the joint distribution (1), the priors (2)–(5) and Formula (8), we can derive all variational posteriors (see Appendix A for details). The variational posterior of the is:
where . The variational posterior of the is:
where . The variational posterior of the is:
where
The variational posterior of the is:
where and The variational posterior of the is:
where , , and . The variational posterior of the is:
where and
Based on the dependencies of hidden states, we divide the posterior of z into three parts. The variational posterior of the is:
where the Mult represents multinomial distribution, and
The variational posterior of the for is:
where and
The variational posterior of the is:
where and
Note that the expectation part of some parameter posterior formulas is difficult to derive analytically. One feasible method is to use Monte Carlo (MC) sampling to approximate the expectation part that cannot be derived analytically, that is, the Monte Carlo Coordinate Ascent VI (MC-CAVI) [29] algorithm. The MC-CAVI recursion approaches have been proved to be convergent to the maximizer of the ELBO with arbitrarily high probability under regularity conditions. In the article, we also use MC-CAVI to obtain the intractable expectations.
3.3. Implementation
Assume that the expectations for within an index set I can be analytically obtained across all updates of the variational density , and cannot be analytically obtained for . For the MC-CAVI method, intractable integrals can be approximated using the MC methods if . Specifically, for , the samples with the sample size are drawn from the current to obtain the expectation estimations as follows:
The Algorithm 1 summarizes the implementation of MC-CAVI, where the denotes the density of the ith density factor after it has undergone the kth updates, and refers to the density of all density factors except the ith factors after the kth updates to the factors preceding the ith factor and the updates to the blocks following it.
| Algorithm 1 Main iteration steps of MC-CAVI |
| Necessary: Number of iteration cycles T. |
| Necessary: Quantity of Monte Carlo samples denoted as N. |
| Necessary: in closed form for . |
| 1. Initialize . |
| 2. for : |
| 3. for : |
| 4. If : |
| 5. Set ; |
| 6. If : |
| 7. Obtain N samples from for ; |
| 8. Set ; |
| 9. end |
| 10. end. |
Combining with the MC-CAVI algorithm, we can summarize the implementation algorithm for variational posteriors for all parameters as follows in Algorithm 2. Based on the Algorithm 2, we can adopt the variational posterior means of the parameters as the estimators.
| Algorithm 2 Variational Bayesian Algorithm for the high-dimensional HMMs |
| Data Input: ; |
| Hyperparameter Input: , , , and for ; |
| Initialize: , , , , , and for , |
| and for , iteration-index , a sufficiently small |
| and a maximum iteration times ; |
| While the absolute change of the iterated ELBO and do: |
| Update and according to Equation (9); |
| Estimate by the MC method; |
| for : |
| Update and according to Equation (10); |
| Estimate by the MC method; |
| end |
| for : |
| Update , and according to Equation (11); |
| end |
| Update , and according to Equation (12); |
| Estimate by the MC method; |
| for : |
| Update , and according to Equation (13); |
| end |
| Update and according to Equation (14); |
| Update and according to Equation (15); |
| Update and according to Equation (16); |
| Update and according to Equation (17); |
| Compute the ELBO using the Formula (6), denoted as , |
| and the absolute change of the iterated ELBO ; |
| ; |
| Output: the variational densities , for , for , |
| , , for , and for ; |
| and the posterior modes of parameters for . |
4. Simulation Studies
In this section, we carry out simulation studies to investigate the finite sample performances of the proposed method, denoted as HDVBHMM. To evaluate the prediction performance, we compare the proposed method with some commonly used and popular methods, including Back Propagation Neural Network (BP), Long Short-Term Memory (LSTM), and Random Forest. The experimental code can be found via the github link (https://github.com/LiuWei-hub/VBHDHMM, accessed on 23 March 2024).
We consider the dataset , where T is the number of the discrete time intervals, the covariate is generated from the Gaussian distribution , and , in which the random error , and is hidden state. Here, the initial hidden state is generated from , where . For , the hidden state is generated from , where and . We set the number of hidden states , , and .
To assess the predictive performance, we use the samples in the last m time intervals as the testing set and the samples in the first time intervals as the training set. In addition, we use four criteria: (1) the mean absolute percentage error , where is the true value and represents the predicted value; (2) the root mean square error ; (3) the mean absolute error ; and (4) , where represents the sample mean, is the error caused by the prediction, and is the error caused by the mean. The smaller the MAPE, RMSE and MAE values are, the better the performance of the method is. The larger the is, the better the performance of the method is. To evaluate the performance of the parameter estimation, we use two criteria: (1) the root mean square error loss , where n is the number of repeated experiments, is the estimated value of the parameter obtained in the ith experiment, and is the true parameter value; and (2) . The RMSE and Bias values closer to zero imply better performance for the method. We repeat 10 simulation examples and calculate the average values of the above metrics for each method.
4.1. Experiment 1
In experiment 1, we consider different dimensions p = 20, 30 and 40. In addition, the state transition matrix A is set as follows:
Due to , we have three regression coefficients , , . We set the coefficient as follows:
where the first four rows are nonzero and other elements are zero. We set the number of the discrete time intervals and the sample size in the testing set . In addition, the hyperparameters r, in the HDVBHMM method are set to 1. The results are shown in Table 1 and Table 2.

Table 1.
Average values of four metrics of all approaches with standard deviation in each parenthesis based on 10 simulations under .

Table 2.
Average values of the RMSE and Bias of A and based on 10 replications in Experiment 1.
In Table 1, the smaller MAPE, RMSE, and MAE index values, the better the algorithm performance. The larger the index, the better the algorithm performance. Bold indicates the optimal result in each scenario. It is clear that our method is optimal in all cases (bold), especially for , , and . In the small sample case, the prediction performance of the LSTM method decreases significantly as the dimensionality of the covariates increases. The prediction performance of the Random Forest and BP methods is not stable with increasing covariate dimensions. Although the performance of our method decreases as the covariate dimension increases, it is still significantly better than the other methods. Table 2 shows the RMSE and Bias of the estimated values of and A. From Table 2, we can see that the proposed method performs well. Two metrics are small when the covariate dimension is 20 and 30. When the dimension is increased to 40, the value of the RMSE index increases, but it is still within the acceptable range.
To better illustrate the performance of parameter estimation, Figure 1 shows box plots of the estimator values of A, , , under , where the horizontal coordinate is the index of the variables and the vertical coordinate is the values of estimators. The corresponding figures on and are shown in Appendix A.2. For the estimators , and , we can see the first four elements are estimated close to the true value, and the remaining values are estimated clear to zero; This implies that the proposed method can achieve good variable selection performance. In addition, all elements of the state increment matrix A are estimated close to the true values, which also confirms the good performance of our method.
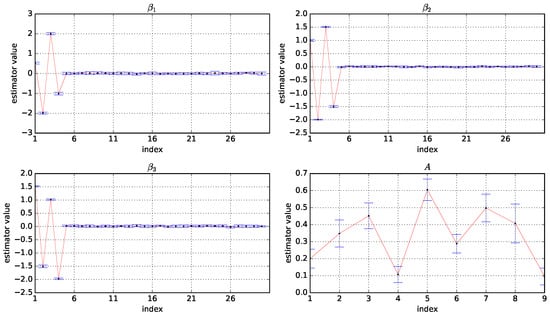
Figure 1.
Box plots of the estimator values of A, , , based on 10 experiments under and . The horizontal coordinate is the index of the variables and the vertical coordinate is the value of the estimators.
In addition, to further verify that the algorithm is sensitive to the choice of hyperparameters , we conduct experiments on data with a covariate dimension of 30. Consider the following three experiments, the first with ; the second with ; and the third with . The experimental results show that the estimation results are not sensitive to the choice of the two hyperparameters r and . The images of the Gamma distributions for the three different hyperparameter settings are very similar in shape. This similarity may contribute to the reason why, for a certain range of variations in r and values, the model’s performance may not show sensitivity to these hyperparameters. We show the results in Appendix A.4.
4.2. Experiment 2
In experiment 2, we consider the higher dimension cases: p = 60, 90, 120. We set the same A as experiment 1 and the coefficient as follows:
where the first four rows are nonzero and other elements are zero. We set the number of discrete time intervals and the sample size in the testing set . In addition, the hyperparameters r and in the HDVBHMM method are set to 1. The results are shown in Table 3 and Table 4.

Table 3.
Average values of four metrics of all approaches with standard deviation in each parenthesis based on 10 simulations under .

Table 4.
Average values of the RMSE and Bias of A and based on 10 replications in Experiment 2.
As can be seen in Table 4, when the covariate dimensions are increased and the sample size reaches 600, our method still performs well among the four methods. It should be noted that when the covariate dimension is 90 and 120, the MAPE metric of the random forest method is slightly smaller than our method. In addition, as the covariate dimension increases from p = 60 to P = 120, the performance of the LSTM method decreases significantly, which is the worst performance among the four methods. This shows that LSTM does not perform well on such small-sample high-dimensional datasets. As the dimensionality of the covariates increases, although the BP and Random Forest methods show better prediction performance than the LSTM method, they are also poorer than the prediction performance of the HDVBHMM method. Overall, our method outperforms the other three methods in terms of prediction performance as the dimensionality increases, suggesting that our method performs better on small-sample high-dimensional datasets.
Figure 2 shows box plots of the estimator values of A, , , under . The corresponding figures on and are shown in Appendix A.3. From Figure 2, we can see that the regression coefficients , , and are accurately estimated. the first four elements are estimated close to the true value, and the remaining values are estimated clear to zero. It implies that the proposed method can successfully achieve variable screening even as the covariate dimension increases. In addition, all elements of the state increment matrix A are estimated close to the true values, which also confirms the good performance of the proposed method.
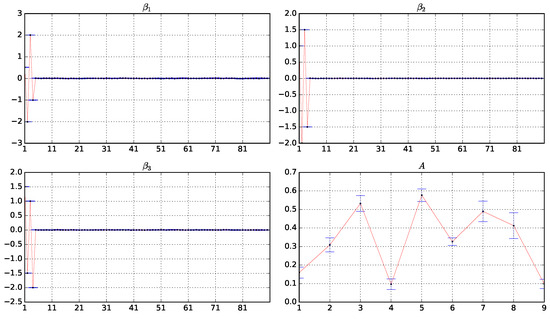
Figure 2.
Box plots of the estimator values of A, , , based on 10 experiments under and . The horizontal coordinate is the index of the variables and the vertical coordinate is the value of the estimators.
5. Application to Real Datasets
In this section, we focus on Beijing Multi-Site Air-Quality data, which include 6 major air pollutants and 6 related meteorological variables at multiple locations in Beijing. These air-quality measurements are created by the Beijing Municipal Environmental Monitoring Center. In addition, meteorological data at each air quality location are paired with the nearest weather station provided by the China Meteorological Administration. The data span from 1 March 2013 to 28 February 2017. In our study, we consider PM2.5 concentration as response variable, and PM10 concentration, SO2 concentration, NO2 concentration, CO concentration, O3 concentration, Temperature (TEMP), Pressure (PRES), Dew point temperature (DEWP), Precipitation (RAIN), and Wind speed (WSPM) as covariates; that is, . In order to study the performance on small sample datasets, we delete the missing values in the data and select the data samples in the first 200 time intervals from the Shunyi observation point in Beijing in 2017 for analysis. To assess the predictive performance, we use the first 140 samples as the training set, and the remaining 60 samples as the testing set. We compare the proposed method with the BP neural network, LSTM and Random Forest method similar to Section 4.
One of the main challenges in implementing the HMM is to determine the optimal number of hidden states. The Akaike Information Criterion (AIC) and the Bayesian Information Criterion (BIC) are two common model selection techniques, which select the best model by balancing the fitting accuracy and complexity of the model. In selecting the number of hidden states for a Hidden Markov Model, both AIC and BIC evaluate multiple models containing different numbers of states and select an optimal model that balances fitting accuracy and complexity. Multiple HMMs are trained separately using different numbers of hidden states, then the AIC or BIC values are calculated for each model, and finally the model with the smallest AIC or BIC value is selected [34]. Similar to the work of Dofadar et al. [34], we use AIC and BIC to select the number of the hidden states. The AIC equation used in this study is given by , where k is the number of free parameters in the model and L is the log probability value. The formula for k used in this research is , where n is the current value of the hidden state. The BIC equation used in this study is expressed as , where T is the total number of observations. To find the best number of hidden states, we calculate AIC and BIC values based on the different numbers of hidden states: 2, 3, 4, and 5. The results are shown in Figure 3. Figure 3 shows that when the number of hidden states is 3, the AIC and BIC values are the smallest, indicating that choosing the number of hidden states as 3 is the closest to the real model. Therefore, we set the the number of hidden states .
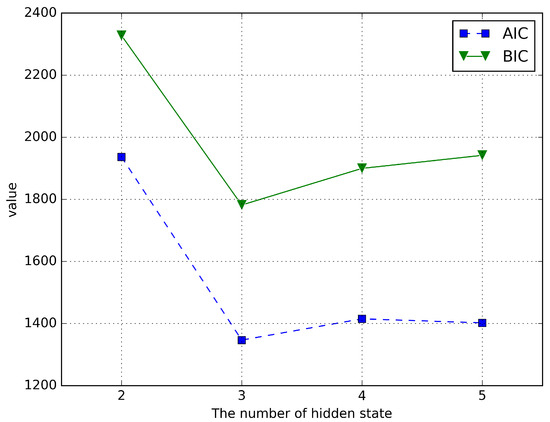
Figure 3.
AIC and BIC values when the number of hidden states is 2, 3, 4, and 5 on the real dataset.
Similar to Section 4, we calculate MAPE, RMSE, MAE and to evaluate the predictive performance. Since the time series data are positively skewed, MAE and MASE are the best evaluation metrics for evaluating the model performance [35]. The results are shown in Table 5. From Table 5, we can see that the MAPE and MAE of the proposed HDVBHMM method are smaller than ones of other methods, and the value of the proposed method is larger than one of other methods, indicating that the performance of the HDVBHMM method is better than other methods. Among the other three competing methods, the MAPE and MAE values of the Random Forest method are lowest among those of the three competing methods, but its MAPE and MAE are still much larger than ones of the proposed method. The BP method is the worst performing among four methods with MAE = 27.570 and MAPE = 1.025.

Table 5.
Prediction Performance of Four Methods on the testing data.
To better illustrate the predictive performance, Figure 4 shows the true data and predicted values via four methods on the testing set. From Figure 4, we can see that in the first 30 time points, the proposed method fits the true values very well. In the second set of 30 time points, as the prediction time period increases, the predicted values exhibit a slight error, but they are still better than those of other methods. Overall, the prediction accuracy of the proposed method is much better than ones of other methods in term of both short and long time periods.
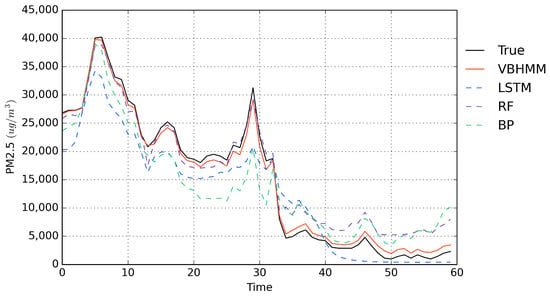
Figure 4.
Comparison of observed hourly PM2.5 emissions (test set) with PM2.5 emissions predicted by four methods.
The estimated values of corresponding to the three states are shown in Table 6. From Table 6, we can see that PM10, SO2, TEMP (temperature), DEWP (dew point temperature), RAIN (precipitation), and WSPM (wind speed) have the greatest influence on PM2.5 emissions in state 1. PM10, SO2, TEMP, and DEWP are the four factors that have a negative effect on the presence of PM2.5 emissions in the area, and as these four factors increase, PM2.5 emissions will decrease; meanwhile RAIN and WSPM have a positive effect on the presence of PM2.5 in the area. Rainfall and high wind speed may have increased PM2.5 concentrations through physical effects (such as windblown dust). The prediction formula of the PM2.5 in State 1 is as follows:

Table 6.
Estimates of the regression coefficients for each hidden state.
In addition, PM10, Sulfur Dioxide, Nitrogen Dioxide, TEMP (temperature), DEWP (dew point temperature), RAIN (precipitation), and WSPM (wind speed) have the largest effect on PM2.5 in State 2. The results showed that in state 2, some chemical reactions led to the depletion of gases such as SO2 and NO2, which reduced the production of PM2.5, and rainfall also reduced the production of PM2.5. The high wind speed led to an increase in PM2.5 concentration, probably because the wind speed increased the diffusion and transport of particulate matter. The prediction formula of the PM2.5 in this State is as follows:
PM10, SO2, NO2, O3, TEMP (temperature), PRES (pressure), DEWP (dew point temperature), RAIN (precipitation), and WSPM (wind speed) have the greatest impact on PM2.5 in state 3. It is worth noting that the increase in variables such as SO2 and NO2 leads to an increase in PM2.5 concentration. In addition, the significant positive coefficients for temperature indicate that higher temperatures promote the formation of PM2.5, which may be related to the acceleration of certain chemical reactions by high temperatures. The increase in SO2 and NO2 may promote the formation of secondary particulate matter, which in turn increases the PM2.5 concentration. Wind speed increases particulate dispersion, and rainfall may also promote the formation of secondary particulate matter from some soluble substances. The prediction formula of the PM2.5 in this State is as follows:
In summary, the regression coefficients for the three states reflect the effects of different environmental factors on PM2.5 concentrations. The positive and negative signs and magnitudes of these coefficients can provide scenarios on how to manage and predict PM2.5 concentrations by controlling these environmental factors under different environmental conditions. In particular, the fact that temperature, rainfall and wind speed have different effects on PM2.5 concentrations in different states suggests that PM2.5 management needs to take into account complex meteorological conditions and interactions between air pollutants.
6. Conclusions
In this paper, the variable selection for high-dimensional HMMs is studied based on the variational inference. We develop a Variational Bayesian method with the double-exponential shrinkage prior for variable selection. The proposed method can quickly and accurately estimate the posterior distributions and the unknown parameters. In the simulation studies and real data analysis, the proposed method outperforms the common methods in term of variable selection and prediction. In the Beijing Multi-Site Air-Quality analysis, we select the optimal number of the hidden stats based on the AIC and BIC methods, and fit the HMMs of the response variable PM2.5. In the current research work, we investigate variational inference for linear HMMs with high dimensional covariates; that is, the mean of the response variable is linear with respect to the high dimensional covariates. Many of the relationships between variables in practical applications may be not linear, so variational inference for nonlinear HMMs is worth studying. In addition, it is assumed that the variances in observations are the same in different hidden states in this study, but in practical applications, heteroskedasticity may be more in line with real-world data characteristics. For that reason, the heteroskedasticity issue for HMMs is also worth exploring deeply. Moreover, Ivan Gorynin’s work [36] verifies that the Pairwise Markov Model (PMM) outperforms the traditional HMM in terms of accuracy when the observed variable y is highly autocorrelated or when the hidden chain is not Markovian. Unlike the HMM, which assumes that the hidden chain z is Markovian, the PMM assumes that () is Markovian. Since hidden chains are not necessarily Markovian in the PMM, it is more general than the HMM. Parameter estimation of PMM models is done using Variational Bayesian methods in the work of Katherine Morales [37]. However, the effect of including the covariate x on the target variable y was not considered in their work. Therefore, as an extension of the proposed method, which replaces the HMM with the PMM, the inclusion of high-dimensional covariates in the PMM may yield more accurate predictions.
Author Contributions
Conceptualization, Y.Z. (Yao Zhai), W.L. and Y.J.; methodology, Y.Z. (Yao Zhai), W.L. and Y.Z. (Yanqing Zhang); software, W.L., Y.Z. (Yao Zhai) and Y.J.; validation, Y.Z. (Yao Zhai), W.L., Y.J. and Y.Z. (Yanqing Zhang); formal analysis, Y.Z. (Yao Zhai) and Y.J.; investigation, Y.Z. (Yao Zhai), W.L. and Y.J.; resources, Y.Z. (Yao Zhai) and Y.J.; data curation, Y.Z. (Yao Zhai); writing—original draft preparation, Y.Z.; writing—review and editing, Y.J. and Y.Z. (Yanqing Zhang); visualization, Y.J.; supervision, Y.J.; project administration, Y.J.; funding acquisition, Y.J. and Y.Z. (Yanqing Zhang). All authors have read and agreed to the published version of the manuscript.
Funding
This research was funded by the National Key R&D Program of China (No. 102022YFA1003701), the National Natural Science Foundation of China (No. 12271472, 12231017, 12001479, 11871420), the Natural Science Foundation of Yunnan Province of China (No. 202101AU070073 and 202201AT070101), and Yunnan University Graduate Student Research and Innovation Fund Project Grant (No. KC-22221108).
Data Availability Statement
The research data are available on the website https://archive.ics.uci.edu/dataset/501/beijing+multi+site+air+quality+data (accessed on 23 March 2024).
Acknowledgments
We would like to thank the action editors and referees for insightful comments and suggestions which improve the article significantly.
Conflicts of Interest
The authors declare no conflicts of interest.
Appendix A
Appendix A.1. Variational Posterior of Parameters
We derive the optimal variational densities based on Formula (8). The complete likelihood function of the model is:
We derive the conditional posterior distribution of A as:
So
According to Equation (10), The variational posterior distribution of is given by:
So .
Similarly, we derive the conditional posterior distribution of as:
The variational posterior distribution of is given by:
We derive the conditional posterior distribution of as:
The variational posterior distribution of is given by:
We derive the conditional posterior distribution of . Note that since the variational posterior of is difficult to obtain, we derive the variational posterior of as:
The variational posterior distribution of is given by:
where , , and .
We derive the conditional posterior distribution of as:
The variational posterior distribution of is given by:
where
We derive the conditional posterior distribution of :
The variational posterior distribution of is given by:
Finally, we derive the variational posterior of z. Based on the dependencies of hidden states, we divide the variational posterior of z into the following three parts.
We derive the conditional posterior distribution of as:
The variational posterior distribution of is given by:
We derive the conditional posterior distribution of for as:
The variational posterior distribution of for is given by:
We derive the conditional posterior distribution of as:
The variational posterior distribution of is given by:
Appendix A.2. Box Plots of the Estimator Values Based on 10 Experiments under p = 20, 40 and T = 200
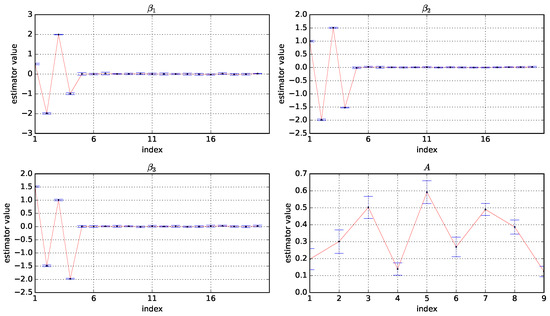
Figure A1.
Box plots of the estimator values of A, , , and based on 50 experiments under and . The horizontal coordinate is the index of the variables and the vertical coordinate is the values of the estimators.
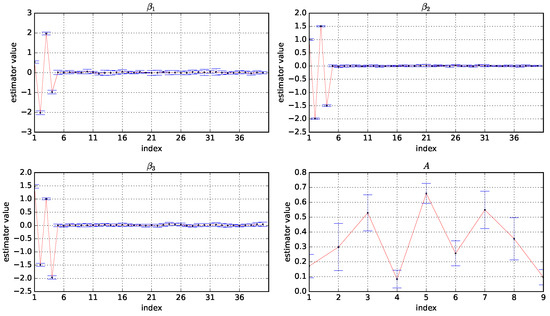
Figure A2.
Box plots of the estimator values of A, , , and based on 50 experiments under and . The horizontal coordinate is the index of the variables and the vertical coordinate is the values of the estimators.
Appendix A.3. Box Plots of the Estimator Values Based on 50 Experiments under p = 60, 120 and T = 600
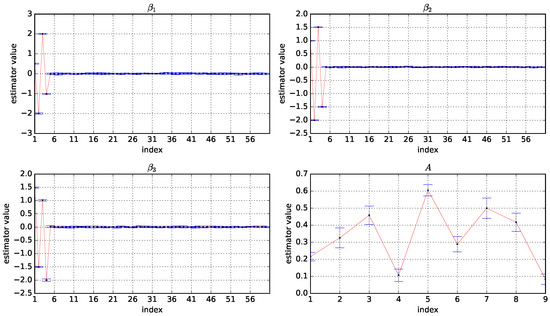
Figure A3.
Box plots of the estimator values of A, , , and based on 10 experiments under and . The horizontal coordinate is the index of the variables and the vertical coordinate is the values of the estimators.
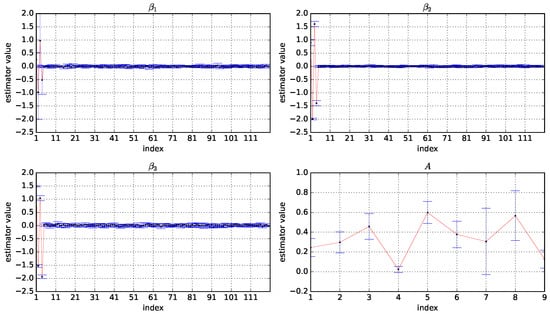
Figure A4.
Box plots of the estimator values of A, , , and based on 10 experiments under and . The horizontal coordinate is the index of the variables and the vertical coordinate is the values of the estimators.
Appendix A.4. Sensitivity Analysis Results for Different Hyperparameter Settings
To further understand whether the algorithm is sensitive to the choice of hyperparameters , we conduct experiments on simulated data with a sample size of 300 and a covariate dimension of 30 similar to Section 4. Consider the following experiments with three different hyperparameter settings, the first ; the second ; and the third , .

Table A1.
The hyperparameters were set to ; ; and , to compute the mean of the four metrics, with standard deviations in parentheses, based on 10 simulations under the conditions of , .
Table A1.
The hyperparameters were set to ; ; and , to compute the mean of the four metrics, with standard deviations in parentheses, based on 10 simulations under the conditions of , .
| p | Method | Estimate Performance | |||
|---|---|---|---|---|---|
| MAPE | RMSE | MAE | |||
The experimental results show that the estimation results are not sensitive to the choice of the two hyperparameters r and . The images of the Gamma distributions for the three different hyperparameter settings are very similar in shape. It implies that the performances of the proposed method are not sensitive to these hyperparameters for a certain range of variations in r and values.
References
- Baum, L.E.; Petrie, T.; Soules, G.; Weiss, N. A maximization technique occurring in the statistical analysis of probabilistic functions of Markov chains. Ann. Math. Stat. 1970, 41, 164–171. [Google Scholar] [CrossRef]
- Forney, G.D. The viterbi algorithm. Proc. IEEE 1973, 61, 268–278. [Google Scholar] [CrossRef]
- LeGland, F.; Mével, L. Recursive Estimation in Hidden Markov Models. In Proceedings of the 36th IEEE Conference on Decision and Control, San Diego, CA, USA, 12 December 1997; Volume 4, pp. 3468–3473. [Google Scholar]
- Ford, J.J.; Moore, J.B. Adaptive estimation of HMM transition probabilities. IEEE Trans. Signal Process. 1998, 46, 1374–1385. [Google Scholar] [CrossRef][Green Version]
- Djuric, P.M.; Chun, J.H. An MCMC sampling approach to estimation of nonstationary hidden Markov models. IEEE Trans. Signal Process. 2002, 50, 1113–1123. [Google Scholar] [CrossRef]
- Ma, Y.A.; Foti, N.J.; Fox, E.B. Stochastic gradient MCMC methods for Hidden Markov Models. In Proceedings of the International Conference on Machine Learning Research, Sydney, Australia, 6–11 August 2017; pp. 2265–2274. [Google Scholar]
- Dellaportas, P.; Roberts, G.O. An introduction to MCMC. In Spatial Statistics and Computational Methods; Springer: Berlin/Heidelberg, Germany, 2003; pp. 1–41. [Google Scholar]
- Neal, R.M. MCMC using Hamiltonian dynamics. Handb. Markov Chain. Monte Carlo 2011, 2, 2. [Google Scholar]
- Box, G.E.; Tiao, G.C. Bayesian Inference in Statistical Analysis; John Wiley & Sons: Hoboken, NJ, USA, 2011. [Google Scholar]
- Scott, S.L. Bayesian methods for Hidden Markov Models: Recursive computing in the 21st century. J. Am. Stat. Assoc. 2002, 97, 337–351. [Google Scholar] [CrossRef]
- Rydén, T. EM versus Markov chain Monte Carlo for estimation of hidden Markov models: A computational perspective. Bayesian Anal. 2008, 3, 659–688. [Google Scholar] [CrossRef]
- Brooks, S.P.; Roberts, G.O. Convergence assessment techniques for Markov chain Monte Carlo. Stat. Comput. 1998, 8, 319–335. [Google Scholar] [CrossRef]
- Jordan, M.I.; Ghahramani, Z.; Jaakkola, T.S.; Saul, L.K. An introduction to variational methods for graphical models. Mach. Learn. 1999, 37, 183–233. [Google Scholar] [CrossRef]
- Tzikas, D.G.; Likas, A.C.; Galatsanos, N.P. The variational approximation for Bayesian inference. IEEE Signal Process. Mag. 2008, 25, 131–146. [Google Scholar] [CrossRef]
- Hoffman, M.D.; Blei, D.M.; Wang, C.; Paisley, J. Stochastic variational inference. J. Mach. Learn. Res. 2013. [Google Scholar]
- Blei, D.M.; Kucukelbir, A.; McAuliffe, J.D. Variational inference: A review for statisticians. J. Am. Stat. Assoc. 2017, 112, 859–877. [Google Scholar] [CrossRef]
- Wang, Y.; Blei, D.M. Frequentist Consistency of Variational Bayes. J. Am. Stat. Assoc. 2019, 114, 1147–1161. [Google Scholar] [CrossRef]
- Han, W.; Yang, Y. Statistical inference in mean-field Variational Bayes. arXiv 2019, arXiv:1911.01525. [Google Scholar]
- Ranganath, R.; Gerrish, S.; Blei, D. Black box variational inference. In Proceedings of the Artificial Intelligence and Statistics, Reykjavik, Iceland, 22–25 April 2014; pp. 814–822. [Google Scholar]
- MacKay, D.J. Ensemble Learning for Hidden Markov Models; Technical Report; Cavendish Laboratory, University of Cambridge: Cambridge, UK, 1997. [Google Scholar]
- McGrory, C.A.; Titterington, D. Variational Bayesian analysis for Hidden Markov Models. Aust. N. Z. J. Stat. 2009, 51, 227–244. [Google Scholar] [CrossRef]
- Foti, N.; Xu, J.; Laird, D.; Fox, E. Stochastic variational inference for Hidden Markov Models. In Proceedings of the Advances in Neural Information Processing Systems, Vancouver, BC, Canada, 9–15 December 2014; pp. 1–9. [Google Scholar]
- Gruhl, C.; Sick, B. Variational Bayesian inference for Hidden Markov Models with multivariate Gaussian output distributions. arXiv 2016, arXiv:1605.08618. [Google Scholar]
- Ding, N.; Ou, Z. Variational nonparametric Bayesian Hidden Markov Model. In Proceedings of the 2010 IEEE International Conference on Acoustics, Speech and Signal Processing, Dallas, TX, USA, 14–19 March 2010; pp. 2098–2101. [Google Scholar]
- Park, T.; Casella, G. The bayesian lasso. J. Am. Stat. Assoc. 2008, 103, 681–686. [Google Scholar] [CrossRef]
- Meinshausen, N. Relaxed lasso. Comput. Stat. Data Anal. 2007, 52, 374–393. [Google Scholar] [CrossRef]
- Hans, C. Bayesian lasso regression. Biometrika 2009, 96, 835–845. [Google Scholar] [CrossRef]
- Ranstam, J.; Cook, J. LASSO regression. J. Br. Surg. 2018, 105, 1348. [Google Scholar] [CrossRef]
- Ye, L.; Beskos, A.; De Iorio, M.; Hao, J. Monte Carlo co-ordinate ascent variational inference. Stat. Comput. 2020, 30, 887–905. [Google Scholar] [CrossRef]
- Jaakkola, T.S. Tutorial on variational approximation methods. In Advanced Mean Field Methods: Theory and Practice; The MIT Press: Cambridge, MA, USA, 2000; pp. 129–159. [Google Scholar]
- Jaakkola, T.S.; Jordan, M. Bayesian parameter estimation via variational methods. Stat. Comput. 2000, 10, 25–37. [Google Scholar] [CrossRef]
- Tran, M.-N.; Nott, D.J.; Kuk, A.Y.C.; Kohn, R. Parallel Variational Bayes for Large Datasets with an Application to Generalized Linear Mixed Models. J. Comput. Graph. Stat. 2016, 25, 626–646. [Google Scholar] [CrossRef]
- Winn, J.; Bishop, C.M.; Jaakkola, T. Variational message passing. J. Mach. Learn. Res. 2005, 6, 661–694. [Google Scholar]
- Dofadar, D.F.; Khan, R.H.; Alam, M.G.R. COVID-19 Confirmed Cases and Deaths Prediction in Bangladesh Using Hidden Markov Model. In Proceedings of the 2021 4th International Conference on Bio-Engineering for Smart Technologies (BioSMART), Paris, France, 21 January 2022; pp. 1–4. [Google Scholar]
- Shoko, C.; Sigauke, C. Short-term forecasting of COVID-19 using support vector regression: An application using Zimbabwean data. Am. J. Infect. Control. 2023, 51, 1095–1107. [Google Scholar] [CrossRef]
- Gorynin, I.; Gangloff, H.; Monfrini, E.; Pieczynski, W. Assessing the segmentation performance of pairwise and triplet Markov models. Signal Process. 2018, 145, 183–192. [Google Scholar] [CrossRef]
- Morales, K.; Petetin, Y. Variational Bayesian inference for pairwise Markov models. In Proceedings of the 2021 IEEE Statistical Signal Processing Workshop (SSP), Rio de Janeiro, Brazil, 11–14 July 2021; pp. 251–255. [Google Scholar]
Disclaimer/Publisher’s Note: The statements, opinions and data contained in all publications are solely those of the individual author(s) and contributor(s) and not of MDPI and/or the editor(s). MDPI and/or the editor(s) disclaim responsibility for any injury to people or property resulting from any ideas, methods, instructions or products referred to in the content. |
© 2024 by the authors. Licensee MDPI, Basel, Switzerland. This article is an open access article distributed under the terms and conditions of the Creative Commons Attribution (CC BY) license (https://creativecommons.org/licenses/by/4.0/).