


A Fuzzy Logic Inference Model for the Evaluation of the Effect of Extrinsic Factors on the Transmission of Infectious Diseases


Abstract
1. Introduction
- A fuzzy logic model that can estimate the transmission and death rates of COVID-19 based on five factors: temperature, population density, life expectancy, smoking index, and outsiders’ effect.
- A fuzzy inference system (FIS) that can apply the fuzzy logic model to any country or region, using data from 95 top-affected countries as a sample.
- An analysis of the significance and limitations of the fuzzy logic model and the FIS.
- Providing a flexible and intuitive way to model and analyse the factors of infectious disease transmission and to estimate the infection risk in different settings.
- Identifying the most influential factors and their interactions that affect the spread and severity of COVID-19.
- Suggesting effective prevention and control strategies based on the estimated transmission and death rates and the implications of the fuzzy logic model.
2. Data Collection, Processing, and Analysis
2.1. Data Collection
2.2. Data Processing and Analysis
2.2.1. Data Processing
2.2.2. Data Analysis
3. Creating Input Weights for Fuzzy Logic Based on Statistical Results and Fuzzy Inference System (FIS)
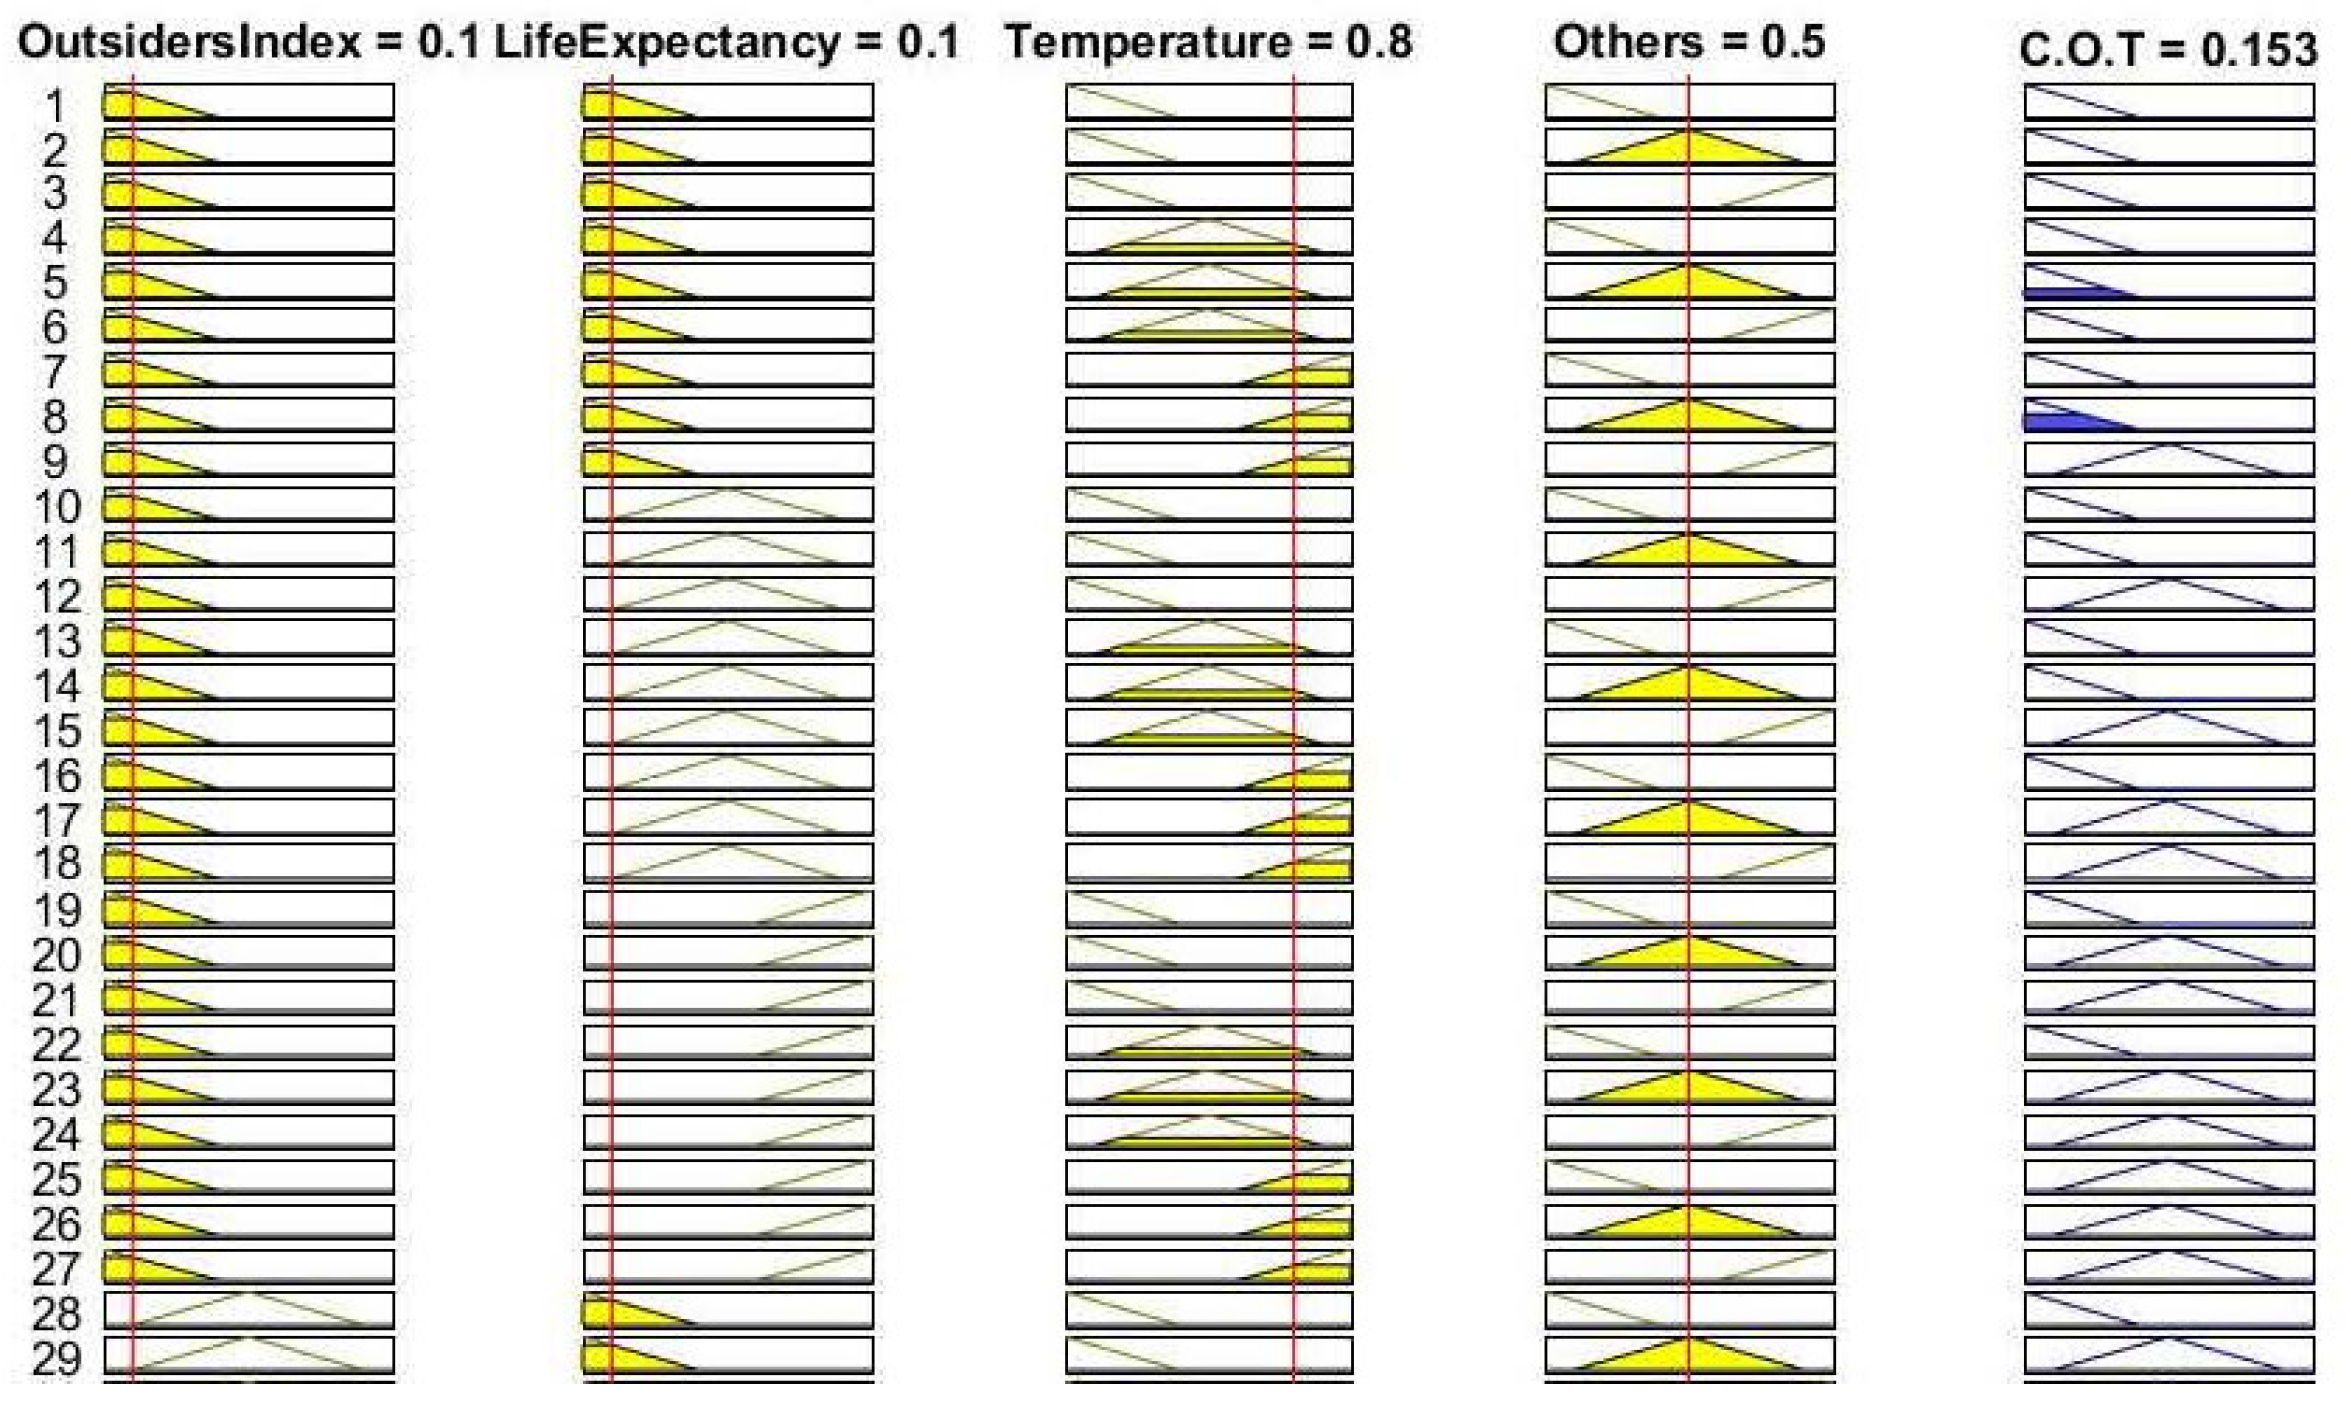
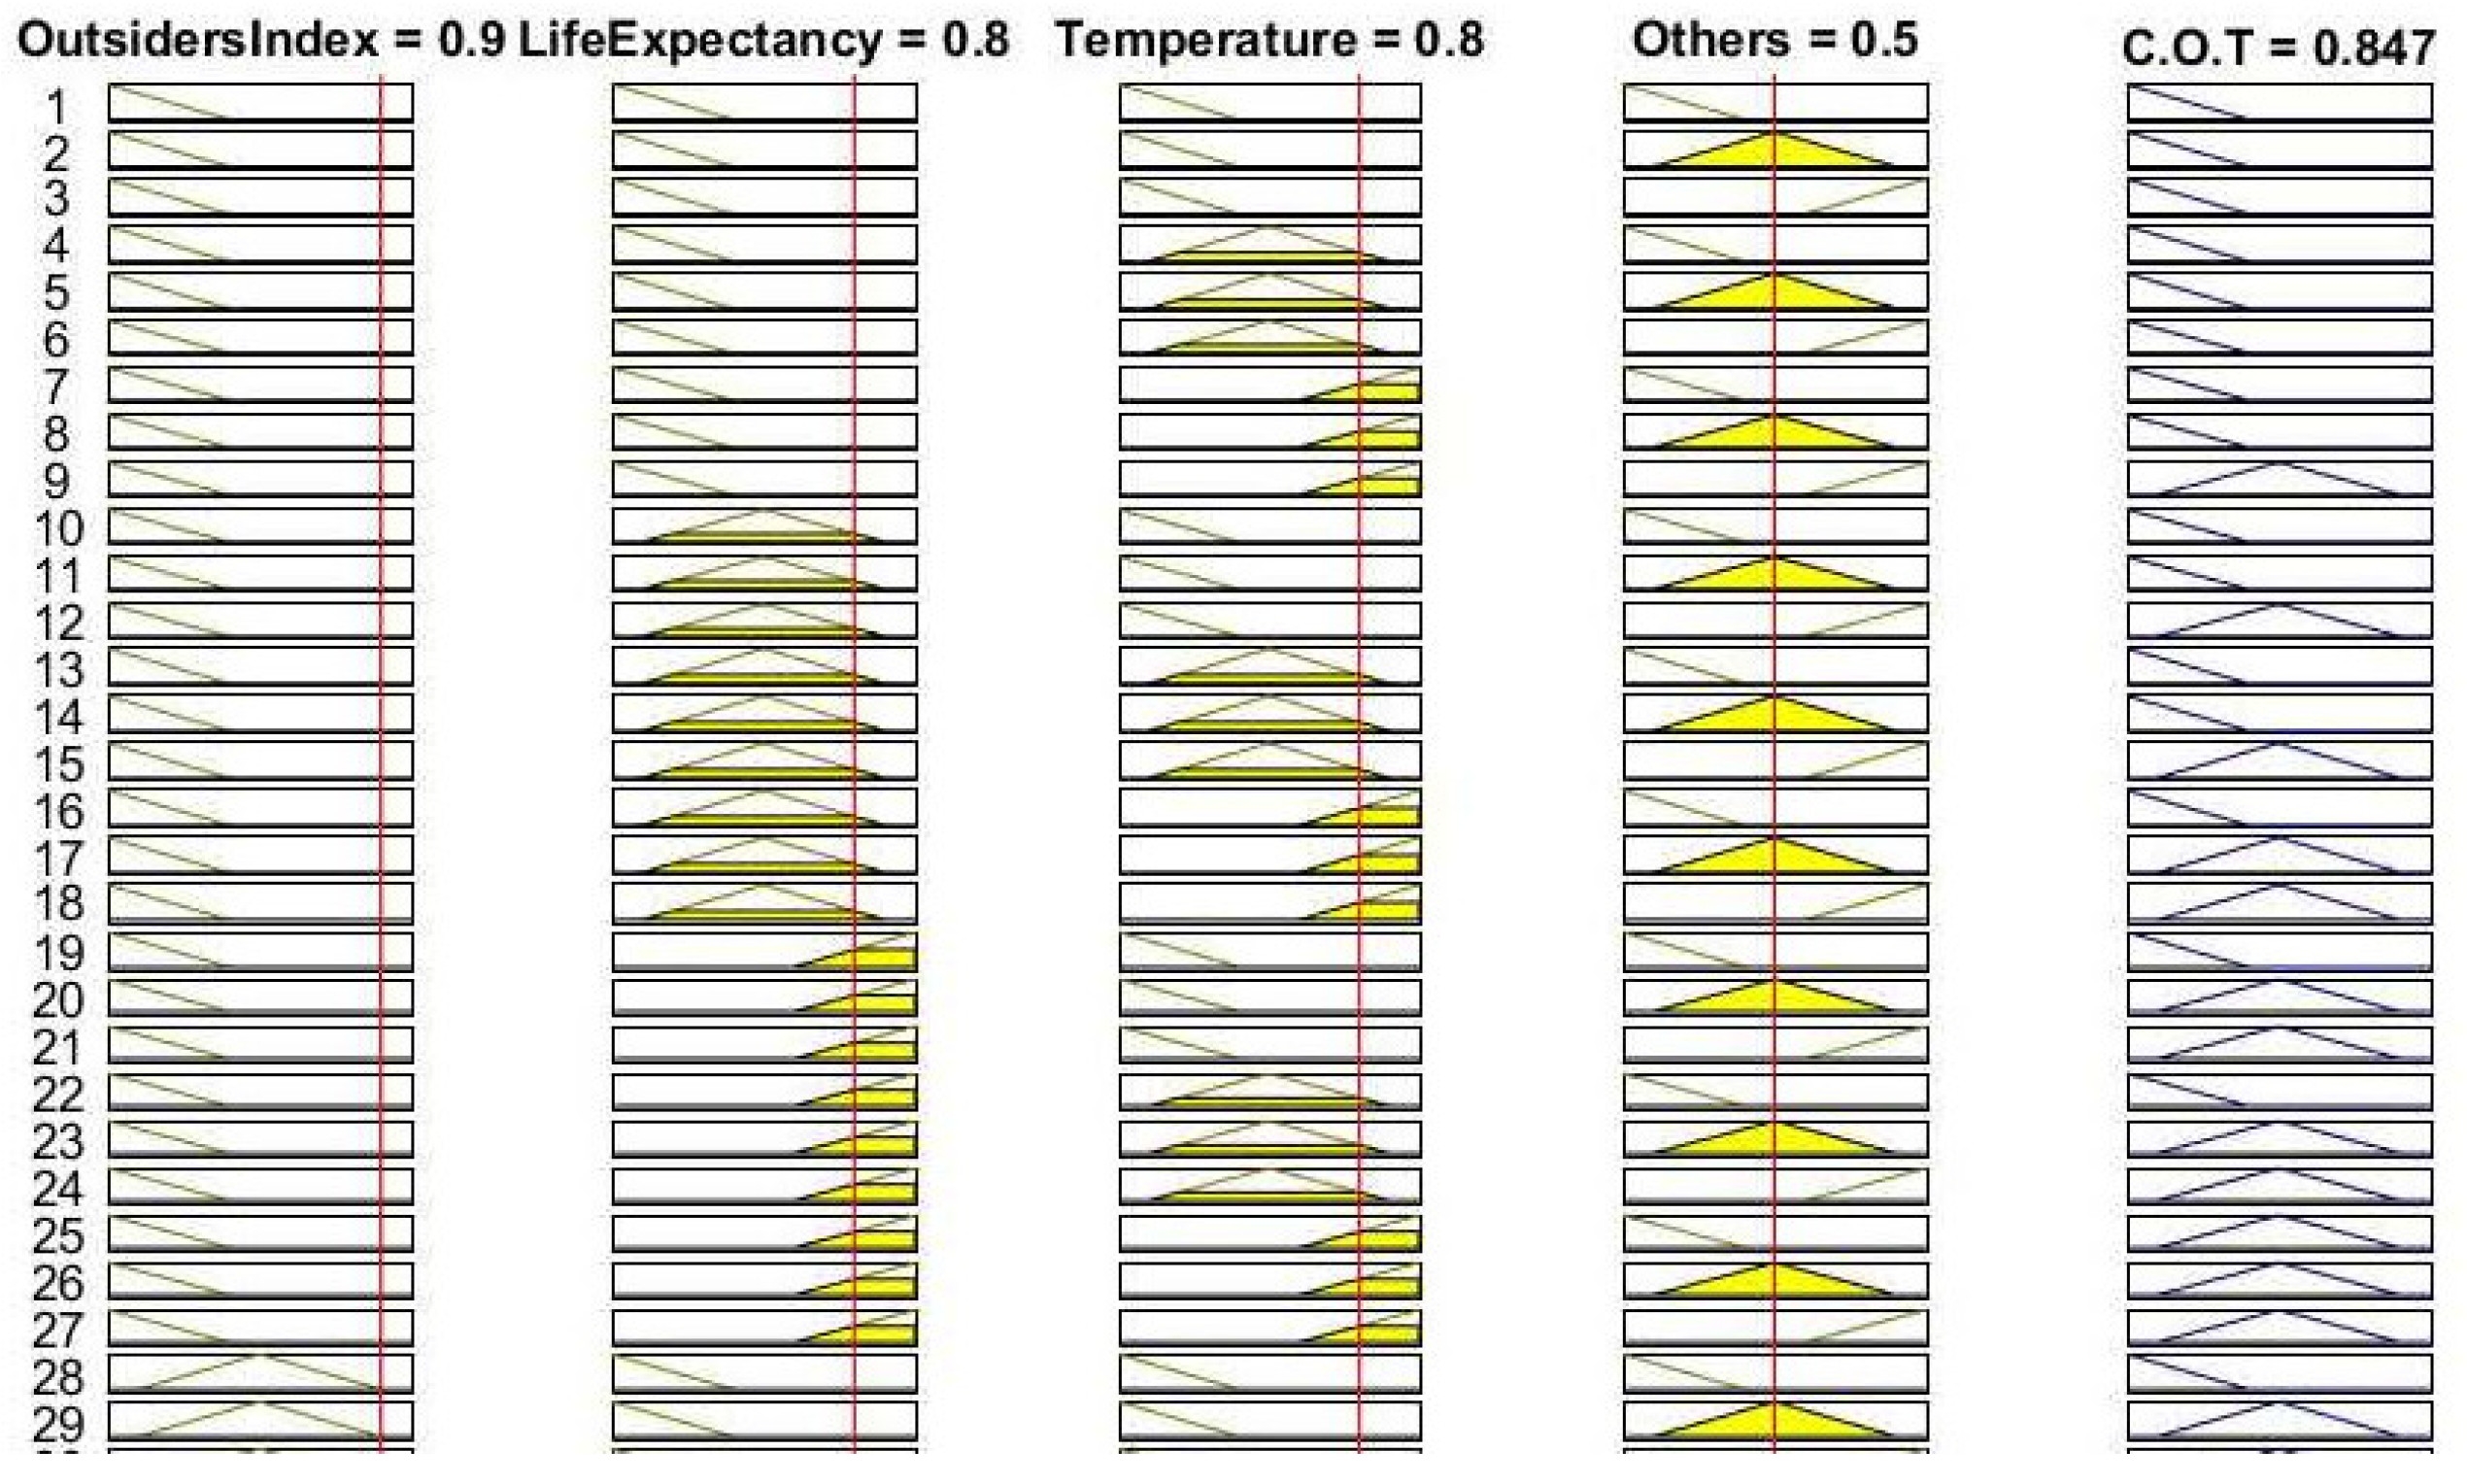
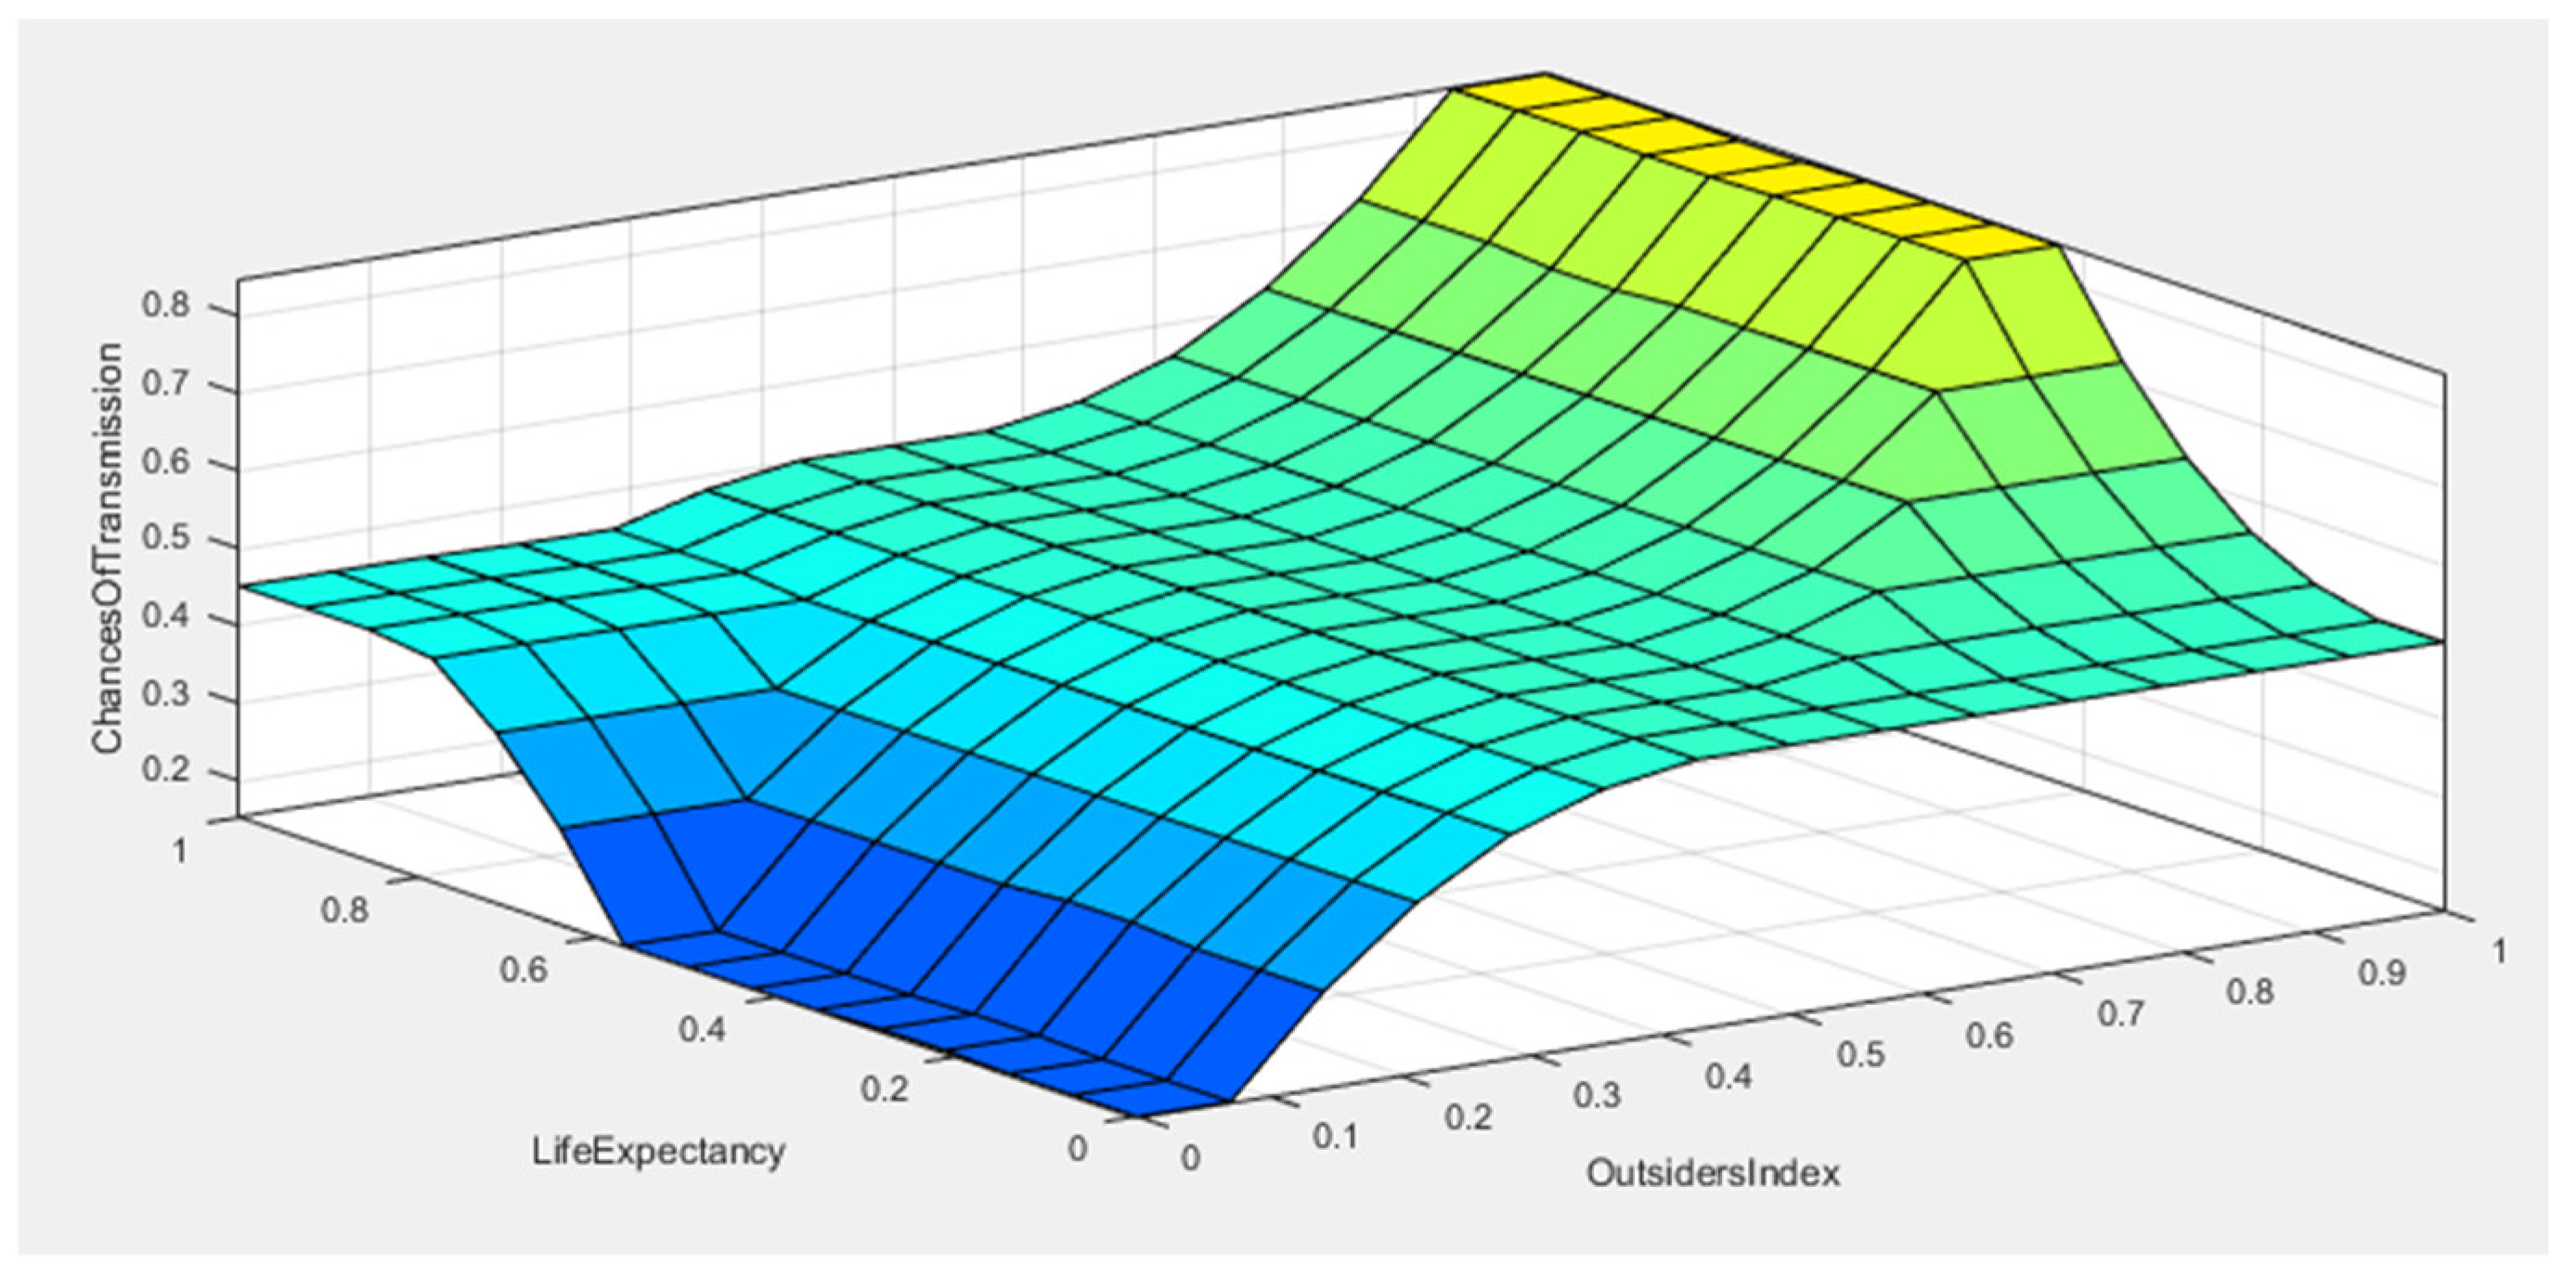
4. Fuzzy Inference System (FIS) to Find the Chance of Transmission of Some Infectious Agents in a Region/State
5. Results Analysis
6. Discussion
7. Conclusions
Future Work
Author Contributions
Funding
Data Availability Statement
Conflicts of Interest
Abbreviations
| M | Mean |
| V | Variance |
| O | Observation |
| PV | Pooled Variance |
| HMD | Hypothesised Mean Difference |
| df | Degrees of Freedom |
| tS | t Stat |
| P1 | p(T ≤ t) one-tail |
| tC1 | t Critical one-tail |
| P2 | p(T ≤ t) two-tail |
| tC2 | t Critical two-tail |
Appendix A

| Sl. No. | Country | Affected Cases | Total Cases/1 M | Death | Density (per sqkm) | Life Expectancy | Temperature (°C) | Smoking | Global Export Sharing |
|---|---|---|---|---|---|---|---|---|---|
| 1 | USA | 2,781,085 | 9545 | 130,813 | 35 | 79.11 | 27 | 0.137 | 8.6 |
| 2 | Brazil | 1,456,969 | 8073 | 60,813 | 25 | 76.57 | 24 | 0.153 | 1.9 |
| 12 | Russia | 661,165 | 4847 | 9683 | 9 | 72.99 | 22 | 0.409 | 2.3 |
| 8 | India | 606,907 | 559 | 17,860 | 420 | 70.42 | 39 | 0.1115 | 1.7 |
| 3 | UK | 313,483 | 4227 | 43,906 | 279 | 78.46 | 10 | 0.147 | 2.5 |
| 7 | Spain | 296,739 | 6408 | 28,363 | 92 | 83.99 | 32 | 0.292 | 1.7 |
| 10 | Peru | 288,477 | 9488 | 9860 | 26 | 77.44 | 16 | 0.054 | 0.2 |
| 16 | Chile | 282,043 | 15,852 | 5753 | 25 | 80.74 | 3 | 0.38 | 0.4 |
| 4 | Italy | 240,760 | 4005 | 34,788 | 201 | 84.01 | 33 | 0.24 | 2.8 |
| 9 | Iran | 232,863 | 2981 | 11,106 | 51 | 77.33 | 33 | 0.111 | 0.5 |
| 6 | Mexico | 231,770 | 2132 | 28,510 | 66 | 75.41 | 16 | 0.137 | 2.3 |
| 21 | Pakistan | 217,809 | 1090 | 4473 | 250 | 67.79 | 31 | 0.2245 | 0.1 |
| 18 | Turkey | 201,098 | 2477 | 5150 | 108 | 78.45 | 31 | 0.2595 | 0.9 |
| 29 | Saudi Arabia | 197,608 | 6322 | 1752 | 16 | 68.87 | 26 | 0.154 | 1.5 |
| 13 | Germany | 196,372 | 2373 | 9061 | 235 | 81.88 | 24 | 0.3035 | 8.1 |
| 5 | France | 165,719 | 2596 | 29,861 | 118 | 83.13 | 21 | 0.277 | 3 |
| 25 | South Africa | 159,333 | 3787 | 2749 | 49 | 83.5 | 21 | 0.1895 | 0.5 |
| 28 | Bangladesh | 153,277 | 1065 | 1926 | 1116 | 73.57 | 33 | 0.2025 | 0.2 |
| 14 | Canada | 104,271 | 2820 | 8615 | 4 | 82.96 | 26 | 0.1495 | 2.3 |
| 22 | Colombia | 102,009 | 2528 | 3470 | 45 | 77.87 | 14 | 0.111 | 0.2 |
| 73 | Qatar | 97,897 | 36,168 | 118 | 249 | 80.73 | 36 | 0.206 | 0.4 |
| 19 | China | 83,537 | 58 | 4634 | 148 | 77.47 | 27 | 0.247 | 12.9 |
| 23 | Egypt | 69,814 | 765 | 3034 | 102 | 72.54 | 36 | 0.251 | 0 |
| 17 | Sweden | 69,692 | 7312 | 5370 | 22 | 83.33 | 17 | 0.206 | 0.9 |
| 34 | Argentina | 67,197 | 1925 | 1351 | 16 | 77.17 | 8 | 0.2395 | 0.3 |
| 52 | Belarus | 62,698 | 6797 | 405 | 46 | 75.2 | 26 | 0.284 | 0.2 |
| 11 | Belgium | 61,598 | 5367 | 9761 | 380 | 82.17 | 20 | 0.2325 | 2.4 |
| 24 | Indonesia | 59,394 | 259 | 2987 | 144 | 72.32 | 27 | 0.399 | 0.9 |
| 20 | Ecuador | 58,257 | 3584 | 4576 | 64 | 77.71 | 9 | 0.0865 | 0.1 |
| 26 | Iraq | 51,524 | 1676 | 2050 | 92 | 71.08 | 44 | 0.31 | 0.5 |
| 15 | Netherlands | 50,335 | 2961 | 6113 | 409 | 82.78 | 19 | 0.2505 | 3 |
| 57 | UAE | 49,069 | 5416 | 316 | 118 | 72.5 | 28 | 0.24 | 1.6 |
| 53 | Kuwait | 47,859 | 12,370 | 359 | 240 | 75.85 | 43 | 0.225 | 0.4 |
| 37 | Ukraine | 45,887 | 1171 | 1185 | 72 | 81.77 | 31 | 0.317 | 0.2 |
| 92 | Singapore | 44,310 | 7763 | 26 | 8240 | 58.34 | 29 | 0.165 | 2.1 |
| 68 | Kazakhstan | 42,574 | 2823 | 188 | 7 | 73.9 | 21 | 0.266 | 0.3 |
| 69 | Oman | 42,555 | 10,126 | 188 | 16 | 78.58 | 33 | 0.11 | 0.2 |
| 32 | Portugal | 42,454 | 4400 | 1579 | 111 | 82.65 | 24 | 0.226 | 0.4 |
| 35 | Philippines | 38,805 | 472 | 1274 | 320 | 71.66 | 30 | 0.2575 | 0.3 |
| 33 | Poland | 35,146 | 976 | 1492 | 121 | 79.27 | 26 | 0.2805 | 1.4 |
| 44 | Panama | 34,463 | 9558 | 645 | 57 | 73.74 | 26 | 0.066 | 0 |
| 36 | Bolivia | 34,227 | 3681 | 1201 | 11 | 72.35 | 22 | 0.238 | 0 |
| 42 | Dominican Republic | 33,387 | 3649 | 754 | 223 | 74.65 | 26 | 0.141 | 0 |
| 41 | Afghanistan | 32,022 | 871 | 807 | 60 | 65.98 | 20 | 0.352 | 0 |
| 27 | Switzerland | 31,967 | 3765 | 1965 | 210 | 84.25 | 23 | 0.233 | 1.6 |
| 31 | Romania | 27,746 | 1601 | 1687 | 81 | 76.5 | 33 | 0.298 | 0.4 |
| 80 | Bahrain | 27,414 | 18,174 | 93 | 2224 | 77.73 | 36 | 0.282 | 0 |
| 51 | Armenia | 26,658 | 10,240 | 459 | 100 | 75.55 | 26 | 0.269 | 0 |
| 46 | Nigeria | 26,484 | 147 | 603 | 223 | 55.75 | 21 | 0.0925 | 0.3 |
| 56 | Israel | 26,452 | 3691 | 324 | 417 | 83.49 | 30 | 0.3025 | 0.3 |
| 30 | Ireland | 25,477 | 5172 | 1738 | 70 | 82.81 | 17 | 0.2215 | 0.9 |
| 50 | Honduras | 20,262 | 2622 | 542 | 88 | 75.87 | 24 | 0.177 | 0 |
| 40 | Guatemala | 19,011 | 1418 | 817 | 165 | 75.05 | 18 | 0.239 | 0 |
| 38 | Japan | 18,723 | 160 | 974 | 335 | 85.03 | 25 | 0.2215 | 3.8 |
| 74 | Ghana | 18,134 | 734 | 117 | 130 | 64.94 | 28 | 0.0675 | 0.1 |
| 64 | Azerbaijan | 18,112 | 2161 | 220 | 117 | 73.33 | 26 | 0.2345 | 0 |
| 43 | Austria | 17,941 | 2055 | 705 | 107 | 82.05 | 28 | 0.3515 | 0.9 |
| 49 | Moldova | 16,898 | 4579 | 549 | 119 | 72.3 | 33 | 0.2555 | 0 |
| 59 | Serbia | 15,195 | 1955 | 287 | 99 | 84.07 | 32 | 0.4165 | 0.1 |
| 90 | Nepal | 14,519 | 567 | 31 | 198 | 71.74 | 25 | 0.241 | 0 |
| 39 | Algeria | 14,272 | 396 | 920 | 18 | 77.5 | 28 | 0.156 | 0 |
| 60 | S. Korea | 12,904 | 259 | 282 | 512 | 75.69 | 12 | 0.45 | 3.1 |
| 63 | Morocco | 12,854 | 405 | 228 | 83 | 77.43 | 24 | 0.234 | 0.2 |
| 45 | Denmark | 12,815 | 2230 | 606 | 134 | 81.4 | 20 | 0.17 | 0.6 |
| 58 | Cameroon | 12,592 | 562 | 313 | 56 | 60.32 | 28 | 0.2235 | 0 |
| 54 | Czechia | 12,046 | 1197 | 349 | 136 | 79.85 | 21 | 0.383 | 0 |
| 82 | Ivory Coast | 9702 | 436 | 68 | 82 | 57.02 | 26 | 0.237 | 0.1 |
| 47 | Sudan | 9573 | 230 | 602 | 23 | 66.09 | 41 | 0.203 | 0 |
| 91 | Uzbekistan | 8996 | 336 | 27 | 75 | 72.04 | 30 | 0.131 | 0.1 |
| 61 | Norway | 8902 | 1651 | 251 | 17 | 82.94 | 13 | 0.2225 | 0.6 |
| 72 | Malaysia | 8643 | 268 | 121 | 98 | 76.65 | 30 | 0.222 | 1.3 |
| 78 | Australia | 8001 | 355 | 104 | 3 | 83.94 | 5 | 0.149 | 1.3 |
| 55 | Finland | 7241 | 1313 | 328 | 16 | 82.48 | 19 | 0.2085 | 0.4 |
| 71 | Senegal | 7054 | 465 | 121 | 85 | 76.47 | 29 | 0.1205 | 0 |
| 66 | El Salvador | 7000 | 1363 | 191 | 308 | 74.06 | 22 | 0.17 | 0 |
| 70 | Kenya | 6941 | 159 | 149 | 93 | 67.47 | 22 | 0.1335 | 0 |
| 83 | Kyrgyzstan | 6261 | 1356 | 66 | 33 | 71.95 | 28 | 0.27 | 0 |
| 86 | Venezuela | 6062 | 282 | 54 | 31 | 72.34 | 23 | 0.167 | 0.2 |
| 77 | Haiti | 6040 | 569 | 107 | 411 | 64.99 | 28 | 0.123 | 0 |
| 87 | Tajikistan | 6005 | 667 | 52 | 67 | 71.76 | 33 | 0.17 | 0 |
| 79 | Ethiopia | 5846 | 59 | 103 | 104 | 67.81 | 20 | 0.047 | 0 |
| 88 | Gabon | 5513 | 2637 | 42 | 8 | 67.03 | 28 | 0.147 | 0 |
| 89 | Guinea | 5404 | 434 | 33 | 53 | 62.64 | 26 | 0.069 | 0 |
| 62 | Bulgaria | 5154 | 913 | 232 | 63 | 75.49 | 31 | 0.353 | 0.2 |
| 67 | Bosnia and Herzegovina | 4788 | 1855 | 189 | 64 | 77.93 | 18 | 0.386 | 0 |
| 85 | Djibouti | 4704 | 4947 | 55 | 43 | 67.87 | 37 | 0.245 | 0 |
| 76 | Luxembourg | 4345 | 7426 | 110 | 242 | 82.79 | 20 | 0.236 | 0.1 |
| 94 | French Guiana | 4268 | 18,272 | 16 | 4 | 80.53 | 23 | 0.356 | 0 |
| 48 | Hungary | 4166 | 437 | 587 | 104 | 77.31 | 29 | 0.284 | 0.6 |
| 93 | Costa Rica | 3753 | 1145 | 17 | 100 | 80.94 | 25 | 0.134 | 0.1 |
| 65 | Greece | 3432 | 348 | 192 | 79 | 82.8 | 34 | 0.4265 | 0.2 |
| 84 | Thailand | 3179 | 46 | 58 | 136 | 77.74 | 28 | 0.2185 | 1.3 |
| 95 | Palestine | 2978 | 1023 | 8 | 820 | 79.1 | 20 | 0.22 | 0 |
| 81 | Somalia | 2924 | 190 | 90 | 25 | 64.88 | 29 | 0.24 | 0 |
| 75 | Croatia | 2912 | 832 | 110 | 73 | 79.02 | 29 | 0.3645 | 0.1 |
References
- Ganasegeran, K.; Jamil, M.F.A.; Ch’ng, A.S.H.; Looi, I.; Peariasamy, K.M. Influence of population density for COVID-19 spread in Malaysia: An ecological study. Int. J. Environ. Res. Public Health 2021, 18, 9866. [Google Scholar] [CrossRef] [PubMed]
- Bukhari, Q.; Jameel, Y. Will coronavirus pandemic diminish by summer? SSRN Electron. J. 2020, 3556998. [Google Scholar] [CrossRef]
- Arji, G.; Ahmadi, H.; Nilashi, M.; Rashid, T.A.; Ahmed, O.H.; Aljojo, N.; Zainol, A. Fuzzy logic approach for infectious disease diagnosis: A methodical evaluation, literature and classification. Biocybern. Biomed. Eng. 2019, 39, 937–955. [Google Scholar] [CrossRef] [PubMed]
- Trias-Llimós, S.; Bilal, U. Impact of the COVID-19 pandemic on life expectancy in Madrid (Spain). J. Public Health 2020, 42, 635–636. [Google Scholar] [CrossRef] [PubMed]
- Arcavi, L.; Benowitz, N.L. Cigarette smoking and infection. Arch. Intern. Med. 2004, 164, 2206–2216. [Google Scholar] [CrossRef] [PubMed]
- Liu, X.; Huang, J.; Li, C.; Zhao, Y.; Wang, D.; Huang, Z.; Yang, K. The role of seasonality in the spread of COVID-19 pandemic. Environ. Res. 2021, 195, 110874. [Google Scholar] [CrossRef] [PubMed]
- Lian, X.; Huang, J.; Li, H.; He, Y.; Ouyang, Z.; Fu, S.; Zhao, Y.; Wang, D.; Wang, R.; Guan, X. Heat waves accelerate the spread of infectious diseases. Environ. Res. 2023, 231, 116090. [Google Scholar] [CrossRef] [PubMed]
- Wang, M.; Jiang, A.; Gong, L.; Lu, L.; Guo, W.; Li, C.; Zheng, J.; Li, C.; Yang, B.; Zeng, J.; et al. Temperature significantly change COVID-19 transmission in 429 cities. medRxiv 2020. [Google Scholar] [CrossRef]
- Palialol, B.; Pereda, P.; Azzoni, C. Does weather influence COVID-19 transmission? Reg. Sci. Policy Pract. 2020, 12, 981–1004. [Google Scholar] [CrossRef]
- Prata, D.N.; Rodrigues, W.; Bermejo, P.H. Temperature significantly changes COVID-19 transmission in (sub) tropical cities of Brazil. Sci. Total Environ. 2020, 729, 138862. [Google Scholar] [CrossRef]
- Xie, J.; Zhu, Y. Association between ambient temperature and COVID-19 infection in 122 cities from China. Sci. Total Environ. 2020, 724, 138201. [Google Scholar] [CrossRef] [PubMed]
- Kjerulff, B.; Kaspersen, K.A.; Dinh, K.M.; Boldsen, J.; Mikkelsen, S.; Erikstrup, L.T.; Sørensen, E.; Nielsen, K.R.; Bruun, M.T.; Hjalgrim, H.; et al. Smoking is associated with infection risk in healthy blood donors. Clin. Microbiol. Infect. 2020, 29, 506–514. [Google Scholar] [CrossRef] [PubMed]
- Alqahtani, J.S.; Oyelade, T.; Aldhahir, A.M.; Alghamdi, S.M.; Almehmadi, M.; Alqahtani, A.S.; Quaderi, S.; Mandal, S.; Hurst, J.R. Prevalence, severity and mortality associated with COPD and smoking in patients with COVID-19: A rapid systematic review and meta-analysis. PLoS ONE 2020, 15, e0233147. [Google Scholar] [CrossRef] [PubMed]
- Patanavanich, R.; Glantz, S.A. Smoking is associated with COVID-19 progression: A meta-analysis. Nicotine Tob. Res. 2020, 22, 1653–1656. [Google Scholar] [CrossRef]
- Hamidi, S.; Sabouri, S.; Ewing, R. Does density aggravate the COVID-19 pandemic? Early findings and lessons for planners. J. Am. Plan. Assoc. 2020, 86, 495–509. [Google Scholar] [CrossRef]
- Trias-Llimós, S.; Riffe, T.; Bilal, U. Monitoring life expectancy levels during the COVID-19 pandemic: Example of the unequal impact of the first wave on Spanish regions. PLoS ONE 2020, 15, e0241952. [Google Scholar] [CrossRef] [PubMed]
- Cevik, M.; Tate, M.; Lloyd, O.; Maraolo, A.E.; Schafers, J.; Ho, A. SARS-CoV-2, SARS-CoV, and MERS-CoV viral load dynamics, duration of viral shedding, and infectiousness: A systematic review and meta-analysis. Lancet Microbe 2021, 2, e13–e22. [Google Scholar] [CrossRef] [PubMed]
- Samanta, S.; Dubey, V.K.; Das, K. Coopetition bunch graphs: Competition and cooperation on COVID-19 research. Inf. Sci. 2022, 589, 1–33. [Google Scholar] [CrossRef]
- Mahapatra, R.; Samanta, S.; Pal, M.; Lee, J.G.; Khan, S.K.; Naseem, U.; Bhadoria, R.S. Colouring of COVID-19 affected region based on fuzzy directed graphs. Comput. Mater. Contin. 2021, 68, 1219–1233. [Google Scholar] [CrossRef]
- Das, K.; Naseem, U.; Samanta, S.; Khan, S.K.; De, K. Fuzzy mixed graphs and its application to identification of COVID-19 affected central regions in India. J. Intell. Fuzzy Syst. 2021, 40, 1051–1064. [Google Scholar] [CrossRef]
- Dhiman, N.; Sharma, M.K. Fuzzy logic inference system for identification and prevention of Coronavirus (COVID-19). Int. J. Innov. Technol. Explor. Eng. 2020, 9, 2278–3075. [Google Scholar]
- Şimşek, H.; Yangın, E. An alternative approach to determination of COVID-19 personal risk index by using fuzzy logic. Health Technol. 2022, 12, 569–582. [Google Scholar] [CrossRef]
- Shatnawi, M.; Shatnawi, A.; AlShara, Z.; Husari, G. Symptoms-based fuzzy-logic approach for COVID-19 diagnosis. Int. J. Adv. Comput. Sci. Appl. 2021, 12, 444–452. [Google Scholar] [CrossRef]
- Ahmad, Z.; El-Kafrawy, S.A.; Alandijany, T.A.; Giannino, F.; Mirza, A.A.; El-Daly, M.M.; Faizo, A.A.; Bajrai, L.H.; Kamal, M.A.; Azhar, E.I. A global report on the dynamics of COVID-19 with quarantine and hospitalization: A fractional order model with non-local kernel. Comput. Biol. Chem. 2022, 98, 107645. [Google Scholar] [CrossRef] [PubMed]
- Okposo, N.I.; Adewole, M.O.; Okposo, E.N.; Ojarikre, H.I.; Abdullah, F.A. A mathematical study on a fractional COVID-19 transmission model within the framework of nonsingular and nonlocal kernel. Chaos Solitons Fractals 2021, 152, 111427. [Google Scholar] [CrossRef] [PubMed]
- Lu, H.; Giannino, F.; Tartakovsky, D.M. Parsimonious models of in-host viral dynamics and immune response. Appl. Math. Lett. 2023, 145, 108781. [Google Scholar] [CrossRef]
- Malik, A.; Alkholief, M.; Aldakhee, F.M.; Khan, A.A.; Ahmad, Z.; Kamal, W.; Gatasheh, M.K.; Alshamsan, A. Sensitivity analysis of COVID-19 with quarantine and vaccination: A fractal-fractional model. Alex. Eng. J. 2022, 61, 8859–8874. [Google Scholar] [CrossRef]
- Liu, P.; Huang, X.; Zarin, R.; Cui, T.; Din, A. Modeling and numerical analysis of a fractional order model for dual variants of SARS-CoV-2. Alex. Eng. J. 2023, 65, 427–442. [Google Scholar] [CrossRef]
- Trisilowati; Darti, I.; Musafir, R.R.; Rayungsari, M.; Suryanto, A. Dynamics of a Fractional-Order COVID-19 Epidemic Model with Quarantine and Standard Incidence Rate. Axioms 2023, 12, 591. [Google Scholar] [CrossRef]
- Das, K.; Samanta, S.; Naseem, U.; Khalid Khan, S.; De, K. Application of fuzzy logic in the ranking of academic institutions. Fuzzy Inf. Eng. 2019, 11, 295–306. [Google Scholar] [CrossRef]
- Das, K.; Samanta, S.; De, K.; Encarnacion, X.; Das, C.B. Ranking of educational institutions using fuzzy logic: A mathematical approach. Afr. Mat. 2020, 31, 1295–1310. [Google Scholar] [CrossRef]
- Zadeh, L.A. Fuzzy algorithms. Inf. Control 1968, 12, 94–102. [Google Scholar] [CrossRef]
- Mamdani, E.H.; Assilian, S. An experiment in linguistic synthesis with a fuzzy logic controller. Int. J. Man-Mach. Stud. 1975, 7, 1–13. [Google Scholar] [CrossRef]
- Aburto, J.M.; Schöley, J.; Kashnitsky, I.; Zhang, L.; Rahal, C.; Missov, T.I.; Mills, M.C.; Dowd, J.B.; Kashyap, R. Quantifying impacts of the COVID-19 pandemic through life-expectancy losses: A population-level study of 29 countries. Int. J. Epidemiol. 2022, 51, 63–74. [Google Scholar] [CrossRef]
- Muniyandi, M.; Singh, P.K.; Aanandh, Y.; Karikalan, N.; Padmapriyadarsini, C. A national-level analysis of life expectancy associated with the COVID-19 pandemic in India. Front. Public Health 2022, 10, 1000933. [Google Scholar] [CrossRef]
- Vasishtha, G.; Mohanty, S.K.; Mishra, U.S.; Dubey, M.; Sahoo, U. Impact of COVID-19 infection on life expectancy, premature mortality, and DALY in Maharashtra, India. BMC Infect. Dis. 2021, 21, 343. [Google Scholar] [CrossRef] [PubMed]
- Carozzi, F.; Provenzano, S.; Roth, S. Urban Density and COVID-19 (No. 108484); London School of Economics and Political Science, LSE Library: London, UK, 2020. [Google Scholar]
- Hsu, J. Population density does not doom cities to pandemic dangers. Scientific American, 16 September 2020. [Google Scholar]
- Chinazzi, M.; Davis, J.T.; Ajelli, M.; Gioannini, C.; Litvinova, M.; Merler, S.; Pastore y Piontti, A.; Mu, K.; Rossi, L.; Sun, K.; et al. The effect of travel restrictions on the spread of the 2019 novel coronavirus (COVID-19) outbreak. Science 2020, 368, 395–400. [Google Scholar] [CrossRef] [PubMed]
- Pullano, G.; Pinotti, F.; Valdano, E.; Boëlle, P.Y.; Poletto, C.; Colizza, V. Novel coronavirus (2019-nCoV) early-stage importation risk to Europe, January 2020. Eurosurveillance 2020, 25, 2000057. [Google Scholar] [CrossRef] [PubMed]
- Brockmann, D.; Helbing, D. The hidden geometry of complex, network-driven contagion phenomena. Science 2013, 342, 1337–1342. [Google Scholar] [CrossRef] [PubMed]
- Kraemer, M.U.G.; Yang, C.H.; Gutierrez, B.; Wu, C.H.; Klein, B.; Pigott, D.M.; Plessis, L.; Faria, N.R.; Li, R.; Hanage, W.P.; et al. The effect of human mobility and control measures on the COVID-19 epidemic in China. Science 2020, 368, 493–497. [Google Scholar] [CrossRef] [PubMed]
- Ruktanonchai, N.W.; Floyd, J.R.; Lai, S.; Ruktanonchai, C.W.; Sadilek, A.; Rente-Lourenco, P.; Ben, X.; Carioli, A.; Gwinn, J.; Steele, J.E.; et al. Assessing the impact of coordinated COVID-19 exit strategies across Europe. Science 2020, 369, 1465–1470. [Google Scholar] [CrossRef] [PubMed]

| Death Rate of Low Life Expectancy Countries | Death Rate of High Life Expectancy Countries | |
|---|---|---|
| Mean | 0.023584419 | 0.050352366 |
| Variance | 0.000448951 | 0.001959616 |
| Observations | 48 | 47 |
| Pooled Variance | 0.001196161 | |
| Hypothesised Mean Difference | 0 | |
| Degrees of Freedom | 93 | |
| t Stat | −3.771620183 | |
| pt) one-tail | 0.000142487 | |
| t Critical one-tail | 1.661403674 | |
| p t) two-tail | 0.000284975 | |
| t Critical two-tail | 1.985801814 |
| Death Rates of Low-Smoking-Index Countries | Death Rate of High-Smoking-Index Countries | |
|---|---|---|
| Mean | 0.031749961 | 0.042013 |
| Variance | 0.000926522 | 0.001787 |
| Observations | 48 | 47 |
| Pooled Variance | 0.001352228 | |
| Hypothesised Mean Difference | 0 | |
| Degrees of Freedom | 93 | |
| t Stat | −1.360074066 | |
| p(T ≤ t) one-tail | 0.088547179 | |
| t Critical one-tail | 1.661403674 | |
| p(T ≤ t) two-tail | 0.177094358 | |
| t Critical two-tail | 1.985801814 |
| Affected Cases in Low Density | Affected Cases in High Density | |
|---|---|---|
| Mean | 157,615.1458 | 67,599.87234 |
| Variance | 11,693,419,305 | |
| Observations | 48 | 47 |
| Pooled Variance | ||
| Hypothesised Mean Difference | 0 | |
| Degrees of Freedom | 93 | |
| t Stat | 1.330035917 | |
| p(T ≤ t) one-tail | 0.093379558 | |
| t Critical one-tail | 1.661403674 | |
| p(T ≤ t) two-tail | 0.186759117 | |
| t Critical two-tail | 1.985801814 |
| Total Cases/1 M in Low Density | Total Cases/1 M in High Density | |
|---|---|---|
| Mean | 3595.5 | 3507.297872 |
| Variance | 16,493,772.38 | 36,211,163.34 |
| Observations | 48 | 47 |
| Pooled Variance | 26,246,460.39 | |
| Hypothesised Mean Difference | 0 | |
| Degrees of Freedom | 93 | |
| t Stat | 0.083897967 | |
| p(T ≤ t) one-tail | 0.466658944 | |
| t Critical one-tail | 1.661403674 | |
| p(T ≤ t) two-tail | 0.933317888 | |
| t Critical two-tail | 1.985801814 |
| Affected Cases in Low Outsiders’ Effect | Affected Cases in High Outsiders’ Effect | |
|---|---|---|
| Mean | 31,275.59 | 200,222.11 |
| Variance | 2,965,654,152 | |
| Observations | 49 | 46 |
| Pooled Variance | ||
| Hypothesised Mean Difference | 0 | |
| Degrees of Freedom | 93 | |
| t Stat | −2.557220227 | |
| p(T ≤ t) one-tail | 0.006084732 | |
| t Critical one-tail | 1.661403674 | |
| p(T ≤ t) two-tail | 0.012169463 | |
| t Critical two-tail | 1.985801814 |
| Total Cases/1 M for Low Indicators Value | Total Cases/1 M for High Indicators Value | |
|---|---|---|
| Mean | 2965.86 | 4176.09 |
| Variance | 17,914,825.92 | 34,365,400.48 |
| Observations | 49 | 46 |
| Pooled Variance | 25,874,781.35 | |
| Hypothesised Mean Difference | 0 | |
| Degrees of Freedom | 93 | |
| t Stat | −1.158896514 | |
| p(T ≤ t) one-tail | 0.124732725 | |
| t Critical one-tail | 1.661403674 | |
| p(T ≤ t) two-tail | 0.249465449 | |
| t Critical two-tail | 1.985801814 |
| Affected Cases of Low Life Expectancy | Affected Cases of High Life Expectancy | |
|---|---|---|
| Mean | 92,724.85 | 133,870.81 |
| Variance | 57,743,028,575 | |
| Observations | 48 | 47 |
| Pooled Variance | ||
| Hypothesised Mean Difference | 0 | |
| Degrees of Freedom | 93 | |
| t Stat | −0.603435983 | |
| p(T ≤ t) one-tail | 0.273843824 | |
| t Critical one-tail | 1.661403674 | |
| p(T ≤ t) two-tail | 0.547687647 | |
| t Critical two-tail | 1.985801814 |
| Effected Cases for Low Temperature | Effected Cases for High Temperature | |
|---|---|---|
| Mean | 103,716.69 | 122,645.11 |
| Variance | 54,089,839,644 | |
| Observations | 48 | 47 |
| Pooled Variance | ||
| Hypothesised Mean Difference | 0 | |
| Degrees of Freedom | 93 | |
| t Stat | −0.277171863 | |
| p(T ≤ t) one-tail | 0.391131648 | |
| t Critical one-tail | 1.661403674 | |
| p(T ≤ t) two-tail | 0.782263295 | |
| t Critical two-tail | 1.985801814 |
| Affected Cases in Low-Smoking Countries | Affected Cases in High-Smoking Countries | |
|---|---|---|
| Mean | 157,971.35 | 67,236.09 |
| Variance | 13,200,648,298 | |
| Observations | 48 | 47 |
| Pooled Variance | ||
| Hypothesised Mean Difference | 0 | |
| Degrees of Freedom | 93 | |
| t Stat | 1.340879173 | |
| p(T ≤ t) one-tail | 0.091612808 | |
| t Critical one-tail | 1.661403674 | |
| p(T ≤ t) two-tail | 0.183225616 | |
| t Critical two-tail | 1.985801814 |
| Influencing Factors | 1 − p-Value | Weight Percentages |
|---|---|---|
| Outsiders’ effect | 0.987831 | 46 |
| Life expectancy index | 0.452312 | 21 |
| Temperature | 0.217737 | 10 |
| Others | 0.5 | 23 |
| Outsiders’ Index | Life Expectancy | Temperature | Others | Chances of Transmission | |
|---|---|---|---|---|---|
| low | 5 | 2 | 1 | 2 | [10,12.5] |
| medium | 7.5 | 3 | 1.5 | 3 | (12.5, 16.5) |
| high | 10 | 4 | 2 | 4 | [16.5,20] |
Disclaimer/Publisher’s Note: The statements, opinions and data contained in all publications are solely those of the individual author(s) and contributor(s) and not of MDPI and/or the editor(s). MDPI and/or the editor(s) disclaim responsibility for any injury to people or property resulting from any ideas, methods, instructions or products referred to in the content. |
© 2024 by the authors. Licensee MDPI, Basel, Switzerland. This article is an open access article distributed under the terms and conditions of the Creative Commons Attribution (CC BY) license (https://creativecommons.org/licenses/by/4.0/).
Share and Cite
Kalampakas, A.; Samanta, S.; Bera, J.; Das, K.C. A Fuzzy Logic Inference Model for the Evaluation of the Effect of Extrinsic Factors on the Transmission of Infectious Diseases. Mathematics 2024, 12, 648. https://doi.org/10.3390/math12050648
Kalampakas A, Samanta S, Bera J, Das KC. A Fuzzy Logic Inference Model for the Evaluation of the Effect of Extrinsic Factors on the Transmission of Infectious Diseases. Mathematics. 2024; 12(5):648. https://doi.org/10.3390/math12050648
Chicago/Turabian StyleKalampakas, Antonios, Sovan Samanta, Jayanta Bera, and Kinkar Chandra Das. 2024. "A Fuzzy Logic Inference Model for the Evaluation of the Effect of Extrinsic Factors on the Transmission of Infectious Diseases" Mathematics 12, no. 5: 648. https://doi.org/10.3390/math12050648
APA StyleKalampakas, A., Samanta, S., Bera, J., & Das, K. C. (2024). A Fuzzy Logic Inference Model for the Evaluation of the Effect of Extrinsic Factors on the Transmission of Infectious Diseases. Mathematics, 12(5), 648. https://doi.org/10.3390/math12050648