1. Introduction
The kidneys are intricate organs that serve as a filter system of the human body. The kidneys remove acids produced by body cells and maintain the balance of salts, minerals, such as calcium, sodium, potassium, and phosphorus, and water in the blood [
1]. Stones form in the kidneys when urine comprises crystal-forming constituents, such as uric acid, oxalate, and calcium. Concurrently, when urine lacks substances that prevent these crystals from joining together, there exists a chance for the development of an optimal environment for kidney stone formation. When a stone in the kidney becomes blocked in the ureters, it might block urine flow and result in kidney swelling. This also results in ureter contraction. This could be painful. Thus, it is crucial to prognosticate kidney stones. When such a circumstance is left untreated, it could block the ureters or narrow them [
2]. This would enhance infections, or urine might build up, adding strain to the kidneys. These issues are rare as kidney stone treatments are accomplished before complications occur. However, conventional techniques of gathering and testing urine infections seem to be a cumbersome process. This might also affect the treatment level.
Moreover, following the reports claimed in [
3], nearly 50% of women suffer from urinary infections in their lifetime. Thus, identifying such infections is crucial. As conventional process seems to be time consuming, adopting data-driven technologies, such as IoT assisted by AI and ML [
4], has revolutionized the medical sector by affording effective healthcare solution wherein kidney stone prediction is no longer an exception [
5]. The IoT includes a collection of connected devices with transmission abilities and data collection by wireless media [
6]. Such devices could generate huge amounts of health-related patient-centric data. Processing these data demands third-party cloud data centers.
Nevertheless, transferring huge data volumes to the cloud demands huge bandwidth. Besides, various cloud computing challenges, including location unawareness, less security, high latency, and downtime, make it infeasible for sensitive applications. Hence, a computing archetype has evolved, namely fog computing, that exists as a backbone of sensitive applications for affording users with services in real time [
7]. Moreover, conventional works have tried to regard various dimensions to prognosticate kidney stones by considering ML and AI.
The study [
8] evaluated the differences amongst profiles of chemistries in the initial period of kidney stone formers and controls. High resolution-1H NMR (Nuclear Magnetic Resonance) spectroscopy relying on metabolomic evaluation was undertaken using 24 h urine samples. Covariance was utilized for determining the relationship of the status of stone formers with urinary metabolites or chemistries after adjustment, while correcting for FR (False Rate). In addition, GBM (Gradient Boosting Machine) with nested cross-assessment was employed for identifying the status of stone formers. Though NMR-quantified metabolites did not enhance discrimination, various urine metabolic summaries were found that might enhance the comprehension of the development of kidney stones. To construct the WISQOL-MLA (Wisconsin Stone Quality of Life–Machine Learning Algorithm) for prognosticating the health quality of urolithiasis patients based on clinical data, symptomatic and demographic data were gathered using the WISQL questionnaire, and a HRQoL computation tool was designed for patients having kidney stones. The data were gathered from 3206 patients from sixteen centers. DL (Deep Learning) and gradient boosting frameworks were utilized for predicting HRQoL scores. The dataset was split with formal training and testing ratios. The regression performance was assessed with Pearson’s correlation. The classification performance was assessed with AUROC (Area under Receiver Operating Characteristic) curve. In addition, Gradient Boosting attained 0.62 as a test correlation.
Furthermore, multivariate regression accomplished correlation at a rate of 0.44. Quintile stratification in the WISQOL dataset attained an average value of 0.70. The suggested model worked better in finding the high and low quintiles of the HRQoL. Evaluating the feature significance exposed that the model weights were associated with factors used to compute the HRQoL, such as BMI (Body Mass Index), age, and symptomatic status [
9].
In addition, a retrospective study was undertaken by considering 358 patients who underwent SWL for prognosticating urine stones. Probable prognostic features were assessed inclusive of the patient population, characteristics of the urinary stone, etc. DT (Decision Tree)-based ML algorithms, including RF (Random Forest), LightGBM (Light Gradient Boosting), and XGBoost, were utilized. The accuracy rates were exposed to be 86%, 87.9%, and 87.5%. Among all the considered models, LightGBM had better accuracy rate [
10].
On the contrary, DL-based methods have also been used for predicting kidney stones. Accordingly, the study [
11] assessed the recall of the DL technique for the automatic detection of compositions of kidney stones. Overall, 63 kidney stones were attained from the laboratory, comprising CO monohydrate, uric acid, cystine stones, MAPH (Magnesium Ammonium Phosphate Hexahydrate), and CHPD (Calcium Hydrogen Phosphate Dihydrate). Deep CNN (Deep Convolutional Neural Network)-ResNet-101 was employed as a multi-classification framework. The overall prediction rate was exposed to be 85%. Thus, the issues of conventional urine testing and preference for quick prognostication of kidney stones require an immediate need for analyzing urine in an IoT-fog environment.
Though conventional research has endeavored to accomplish this, most of the studies have not employed the suggested methods in an IoT-fog environment. In contrast, others have lacked a focus on kidney stone prognostication. Though some studies have considered their research work in this aspect, they have been deficient regarding accuracy rate. Hence, there is a scope for enhancement in this area. Moreover, different IoT-permitted sensors embedded in toilets exist to gather information related to urine in real time. Thus, this study proposes a smart toilet monitoring framework that gathers urinary information and evaluates it with real-time data to accomplish early prognostications of kidney stones based on the below objectives. The main contributions of this study are as follows:
To design a smart toilet model in an IoT-fog environment with ML-based algorithms for detecting kidney stones from real-time data.
To select significant features from real-time data using the proposed Improved MBPSO (Improved Modified Binary Particle Swarm Optimization) for accomplishing better classification.
To prognosticate kidney stones with the proposed Modified XGBoost (Modified eXtreme Gradient Boosting) for determining the existence and absence of kidney stones.
To evaluate the performance of the proposed system by internal comparison with DT (Decision Tree) and NB (Naïve Bayes) for proving the efficacy of the proposed work.
The paper is organized in the following way, with
Section 2 providing a review of conventional works and problem identification.
Section 3 presents the proposed work with suitable flow, algorithm, and explanation. This is followed by
Section 4, wherein the results, dataset description, performance, and comparative analysis are described. Lastly, the entire study is summarized in
Section 5 with future recommendations.
2. Literature Review
Researchers have attempted to employ various ML-based approaches for detecting kidney stones based on various dimensions. The problems found during the analysis of conventional works are discussed in this section. ML algorithms could be utilized to predict kidney disease in the initial phase by evaluating symptoms. Accordingly, the study [
12] suggested an integration of BPSO and CFS to select ideal features for enhancing the accuracy rate of SVM to diagnose kidney disease. The outcomes exposed that the accuracy rate of SVM was 63.75%, while CFS had 88.75% accuracy. Furthermore, the accuracy rate of 10 SVM algorithms was attained by employing the integrations of selecting features (BPSO + CFS), and it was exposed to be 95%. Hence, it could be summarized that employing CFS-BPSO on SVM could enhance the outcomes. To optimize SVM, ensemble AdaBoost and PSO have been employed for improvising accuracy. PSO has been utilized for attaining ideal feature integration to perform classification, whereas AdaBoost has been utilized as an ensemble approach to enhance the accuracy of SVM. Without optimization, the accuracy rate seemed to be 63.3%, which increased after optimization [
13]. The quest to study the optimization issues have been considered in the long term [
14].
To improve the performance rate, the research [
15] used RFFS (Recursive Forest Feature Selection)-based EL (Ensemble Learning) method for predicting kidney disease. Additionally, DT (Decision Tree) was used for classification. Kappa scores and accuracy rates were utilized for finding the classification outcomes. Based on the outcomes of the suggested method’s performance analysis, EL classifiers outperformed other classifiers. However, considering various factors for identifying kidney disease minimizes the efficacy of the employed classifier, and suitable feature selection methods are suggested.
Accordingly, the study [
16] endorsed a model for classifying and predicting kidney disease. Three methods were utilized for feature selection, including ACO (Ant Colony Optimization), PSO (Particle Swarm Optimization), and GA (Genetic Algorithm). Following this, an LR (Logistic Regression) classifier was applied to accomplish classification. The efficacy of the suggested system was assessed, and the outcomes confirmed its better performance. As kidney disease detection has gained widespread attention, recently, detecting kidney stones has also gained huge attention. Correspondingly, the research [
17] intended to identify the existence of CO (Calcium Oxalate) kidney stones [
18,
19] based on gut microbiota features. Clinical information and gut microbiota from 180 subjects attending the WCH (West China Hospital) were gathered between June 2018 and January 2021. Following clinical data and microbiota collection, eight ML algorithms were assessed to detect the existence of CO kidney stones. Through a 5-fold cross-validation, the RF method showed better performance at a rate of 0.94. In addition, the study [
20] presented the implementation and design of multiple sensor platforms for computing and collecting four parameters of urine samples for assessing the risk associated with urolithiasis in the initial phase.
Additionally, a study used IoT (Internet of Things) based on data collection to assess the risks of urine stone formation by computing and storing four urine parameters: total dissolved solids, uric acid, and pH concentrations corresponding to ionized calcium. Computations gathered by the system from the results of healthy individuals and patients grouped by gender and age are maintained in the cloud. This will be utilized in training AI-based ML processes to use the proposed LR model. Evaluation with general solutions showed that the suggested system correlated with the computations from typical instruments. Furthermore, a prediction model was suggested with ML models inclusive of supervised classification and dimensionality reduction. Novel methodologies relying on the integration of FDA (Fisher’s Discriminant Analysis) and SFS (Sequential Forward Selection) were developed to minimize the feature space dimensionality, thereby enhancing the system performance. The suggested system was assessed for cross-validation. The outcomes were found to have 94.8% accuracy [
21].
To evaluate the accuracy rate of ML models in prognosticating the composition of kidney stones with variables obtained from EHR (Electronic Health Record), the study [
22] was undertaken. LR and XGBoost models were trained to determine stone composition using 24 h urine data and comorbidity and demographic data. Performance was assessed with AUC (Area under Curve)-ROC (Receiver Operating Characteristics). For discriminating the compositions of binary stone, the XGBoost method worked better than the LR, with 91% accuracy. Moreover, textural analysis was undertaken to determine the abnormalities and normalities of the kidneys. An optimized, integrated feature model was designed for identifying kidney stones. Each ROI (Region of Interest) obtained integrated 234 textural features. To resolve the data handling problem, a feature optimization system was employed, and 30 optimized features were acquired for individual ROI. The optimized integrated features of the dataset were utilized for four ML-based classifiers, namely MLP (Multi-Layer Perceptron), NB (Naïve Bayes), j48, and RF (Random Forest). It was found that the RF classifier had better outcomes (90% accuracy rate) [
23].
Similarly, the study [
24] suggested a model for decision support. In this case, data were gathered from 500 patients. The collected data were assessed with the WEKA toolkit, which affords various DM (Data Mining) approaches, including j48, NB, and DT. The outcomes confirmed the efficacy of the recommended system with NB for predicting kidney stones. Furthermore, existing works have considered various DL-based approaches to detect kidney stones [
25,
26]. By this, the article [
27] introduced a recognition technique relying on FCNN (Full Convolutional Neural Network) to evaluate the microscopic analysis of CO crystals in urinary sediments. The suggested methodology could automatically find the microscopic analysis of CO crystal computation, and the coincidence amount of fake identification with medical experts seemed to be high, at a rate of 74%.
To evaluate variables related to kidney stones, a univariate analysis was undertaken. Statistical ML and multivariate LR models were utilized for inferring the predictive models. Specific kidney stone compositions, laboratory results, and comprehensive demographics (277 patients) were included in the analysis. Several variables were significantly related to big stones in the univariate analysis. The overall model for prognosticating big stone size involves various variables from different domains, comprising protein percentage in stone composition, hypertension, and CO super-saturation. The endorsed model has an 83% sensitivity rate and a 56% specificity rate. ML-based models have found similar predictors; however, their performance has seemed to vary [
28]. In addition, the research [
29] was undertaken, which involved gathering healthcare information on patients with kidney stones, and their dietary behaviors were surveyed, including the quality of drinking water, to select an appropriate model for classification. The WEKA-ML model was utilized to assess the accuracy of the model, leading to better accuracy. Based on this research, C4.5 was found to be a robust classifier. To enhance the performance rate, the study [
30] included 59 patients with non-infectious kidney stones and 98 patients with healthcare-confirmed infectious kidney stones. A total of 54 radiomic features were retrieved and minimized to 27 features by the LASSO approach. To accomplish this, a radiomic signature was built with EL using bagged trees. Then, multivariable LR was utilized to develop a radiomic nomogram, including independent clinical variables and radiomic signatures. Radiomic signatures encompassing textural and morphological features were significantly related to infectious kidney stones. The EL-based bagged trees differentiated infectious kidney stones and non-infectious kidney stones at a rate of 90.7% accuracy. The predictors included in the distinct prediction nomograms encompassed radiomic signature, urine culture, and WBC (White Blood Cell) count. Evaluating the decision curve exposed that a radiomic nomogram has the potential to predict infectious kidney stones. Furthermore, identifying the existence of kidney stones has been achieved by utilizing keras and CNN. Vital integration of these methods has been confirmed to be a suitable approach for attaining better accuracy [
31].
The main problems identified during the evaluation of conventional works are discussed in this section. Based on an extensive analysis, it is found that traditional research for detecting kidney stones seems to be lacking. However, a few studies have endeavored to predict kidney stones based on ML. Accordingly, the study [
21] used FDA and SFS, showing 94.8% accuracy. The research [
22] employed LR and XGBoost, and the outcomes showed the better performance of XGBoost at a rate of 91%. Furthermore, the article [
9] applied the WISQOL-MLA (Wisconsin Stone Quality of Life–Machine Learning Algorithm), and the accuracy rate was found to be 0.83. Following this, RF was found to have 90% accuracy [
23], and NB showed 95% accuracy [
24]. Additionally, RF, LightGBM, and XGBoost have been assessed, and the outcomes achieve 86%, 87.9%, and 87.5% accuracy [
10]. Furthermore, DL-based prediction has also been undertaken. Accordingly, the study [
27] used fully CNN and found 74% accuracy. Despite several attempts by conventional works, there exists a scope for further enhancement concerning accuracy.
3. Proposed Methodology
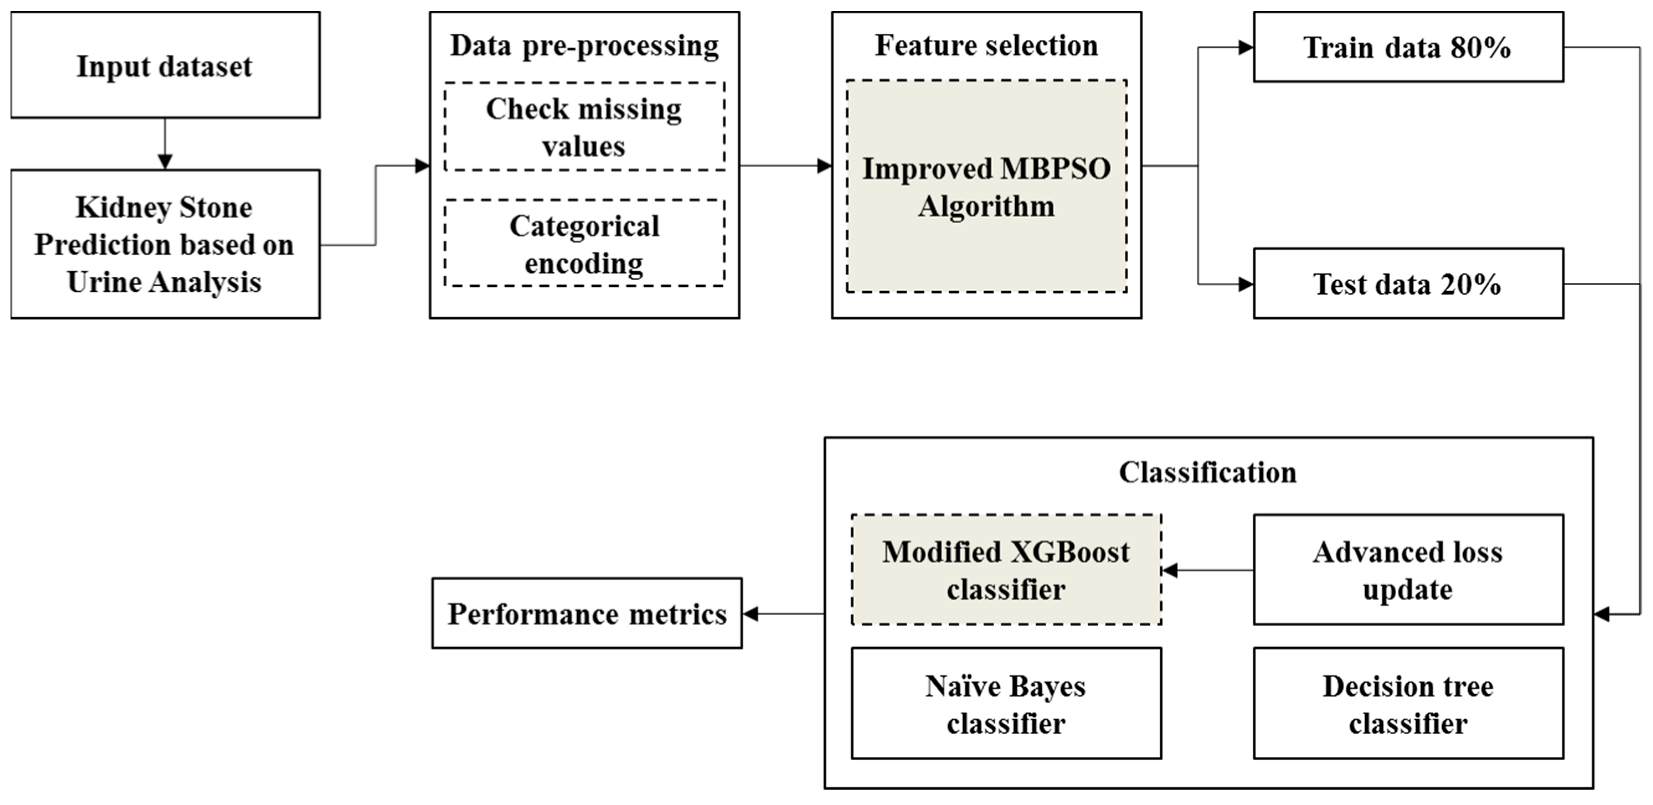
Kidney diseases, particularly kidney stones (urolithiasis), widely affect people throughout the world. Kidney stones occur due to various factors, which include diet, lifestyle, gender, socio-demographics, age, genetics, clinical features, and environmental features. Though limited studies have been conducted in the field of kidney stone prediction, an inclusive predictive model that identifies the fundamental features of kidney stones is still lacking, and there is still scope for further enhancement. The proposed method is undertaken in an IoT-fog environment that uses a real-time dataset. In the present study, the proposed method is Improved MBPSO for feature selection and Modified XGBoost algorithm for classification. The overall flow of the proposed system is shown in
Figure 1.
The real-time dataset is considered to perform kidney stone prediction based on urine analysis. The data are presented for pre-processing. During pre-processing, the data are checked for missing values, and categorical encoding is performed in which the data are transformed into integer format. Thereafter, the converted categorical data are given to the process of feature selection. The MBPSO method is utilized for feature selection. Thereby, the selection of the appropriate features for further process is improved and assists in the process of prediction of kidney stones. Feature selection is used to perform an accurate process by eliminating irrelevant and redundant data, increasing the prediction power. Then, 80% of the trained data and 20% of the test data are given to the classification process. The classification is performed by using a modified XGBoost algorithm, in which the algorithm is used to predict the presence of kidney stones with utmost accuracy. Additionally, the efficiency of the proposed method, which uses modified XGBoost, is evaluated based on an internal comparison with NB and DT classifiers. The standard evaluation metrics are utilized to assess the effectiveness of the proposed model.
3.1. Feature Selection Using Improved MBPSO Algorithm
PSO algorithm is a heuristic global optimization algorithm, and the main advantage of using PSO algorithm is its faster convergence capability and simple implementation. Hence, PSO algorithm is widely used in the feature selection process. While considering the standard PSO algorithm, every particle refers to a strong solution to the process around the search space. The velocity vector and position vector of the
ith particle in a D-dimensional space are given as
veli = (
veli1,
veli2,
veli3 … … …
veliD) and
posi = (
posi1,
posi2,
posi3 … … …
posiD), respectively. The position and velocity of the
ith particle after the particles are randomly initialized are given as follows in Equations (1) and (2):
where
ω refers to the inertia weight, which protects the new one from the previous velocity.
In addition, w
i refers to the optimal previous position of
ith individual; w
g refers to the optimal initial position of every particle in the present generation; and rv1 and rv2 refer to the random values that are generated separately and distributed uniformly in the range [0, 1]. The pseudo-code of the standard PSO is given below (Algorithm 1):
| Algorithm 1: Standard PSO. |
init population
for k = 1: maximum generation
for i = 1: population size
if f(posi,D(k)) < f(wg(k) then wg(k) = posi,D(k)
f(wg(k) = min(f(wi(k)))
end
for D = 1: dimension
veli,D(k + 1) = ωveli,D(k) + k1rv1(wi − pvi,D(k)) + k2rv2(wg − posi,D(k))
posi,D(k + 1) = posi,D(k) + veli,D(k + 1)
if veli,D(k + 1) > velmax then veli,D(k + 1) = velmax
else if vvi,D(k + 1) < vvmin then vvi,D(k + 1) = velmin
end
if posi(k + 1) > posmax then posi(k + 1) = posmax
else if posi(k + 1) > posmin then posi(k + 1) = posmin
end
end
end
end |
Though the PSO algorithm has various benefits, PSO possesses a few disadvantages, including it can get trapped easily in local optima while solving complex issues. Therefore, the disadvantages reduce the applications of the standard PSO algorithm. Hence, the present study uses an Improved MBPSO algorithm for feature selection as the standard PSO possesses some disadvantages. In this case, the sigmoid function is used to interpret the binary values better. It makes use of momentum and velocity to enhance performance. k1, and k2 parameters are two constants that are used to evaluate the weights of wi and wg, and the significance of k1 and k2 parameters lies in the ability for controlling the balance between exploration and exploitation at the optimization stage. A maximum k1 value affords a high weightage to the personal ideal solution of individual particles, which enhances exploitation by assisting the particles toward reliable search space areas. On the contrary, a maximum k2 value affords a high weightage to a global ideal solution that enhances exploration by assisting particles toward better search space areas.
The overall pseudo-code for the MBPSO is given below (Algorithm 2):
| Algorithm 2: Modified Binary PSO. |
Init MBP
wi(i) = 0; wg(i) = 0; k = 0;
While k < Max_Gen and wg < Max_fit
for each p i = 1, … n do
if f(i) > wi(i) then
wi(i) = f(i)
if f(i) > wg(i) then
wg(i) = f(i); wg = i
for each p i = 1, …, n do
for each dim d =1, …, N do
Vid(new) = w · velid(old) + φ1 · U(0,1)(posid − xid(old) + φ2 · U(0,1)(posgd − xid(old))
Vid(new) = γ[velid(old) + φ1 · U(0,1)(posid − xid(old) + φ2 · U(0,1)(posgd − xid(old)]
if velid(K + 1)E (Vmin, Vmax) then
velid(K + 1) = max(min(Vmax, velid(k + 1)), Vmin)
if (U(0,1) < S(velid(new) then xid(new) = 1 else xid(new) = 0
k = k + 1;
Output wg |
Here, wiwg = [1 0 1 1 1] and p i = [0 1 1 0 1]. The difference between wiwg − p i = [1 − 1 0 1 0] shows that the values of one should be selected and the value of negative one should not be selected, but the process is reversed, and the difference is calculated. The difference between the positive and negative values makes the particles highly explorative. When the bit of the particles is changed into the requisite 1 and 0 and compared with the distance value, the velocity of the sigmoid function is changed into the requisite 1 and 0 and compared with the random value with the interval [0.0, 1.0]. In this case, BPSO could encode the feature subset straightforwardly as an individual bit in the position of a particle as either 0 or 1. This represents if a feature is chosen or not. This approach iteratively places a mask upon features in every certain generation to stop the features from evolving.
Optimization includes the initialization of a population with the candidate solutions. Each of these are indicated by a binary string that encodes the absence or presence of individual features. Then, the fitness for individual candidate solutions is assessed by training and then testing the model with the respective binary string. The model is assessed in accordance with the performance metrics. The optimization process is iteratively proceeded, with each of the iterations involving the updation of velocity and position of candidate solutions relying on the ideal solution determined so far. This step permits the algorithm to expose effective search space and then converge toward an ideal solution. The value could be computed by running the optimization method for enough iterations and choosing the solution having a high fitness value.
The Improved MBPSO modifies the encoding scheme by including an additional parameter termed as the velocity vector. This indicates the magnitude and direction of movement corresponding to individual feature in a solution. During optimization, velocity vector updation is performed, which is eventually utilized for assisting in searching the ideal solution. Contrarily, in the Improved MBPSO, the decoding method is altered by including a threshold factor, which finds if a feature exists or not in a solution. Furthermore, the threshold factor is utilized for acclimatizing the feature probability existing in a solution relying on the velocity vector. Alteration in the encoding mechanism permits robust optimization with the inclusion of the velocity vector as an added factor. On the contrary, the decoding mechanism permits the algorithm to procure a definite solution from the binary form. Modification is performed by including a threshold factor that confirms that an optimized solution is attained in accordance with the velocity vector. This strategy could narrow the search space at the evolution stage, which is beneficial for the Modified Binary PSO to expose the optimal solutions in the search space.
3.2. Classification Using Modified XGBoost
XGBoost is generally capable of working in an effective form for both classification and regression. XGBoost is performed by using the framework of gradient boosting in which, to fit a value, new decision trees are used with residuals of multiple iterations, which enhances the efficiency of the classifier. In contrast to gradient boosting, Taylor expansion is used in XGBoost to approximate the loss function. In the Modified XGBoost, a group of ensemble decision trees is created in different iterations in which the final predicted residual from every iteration is considered to perform the objective function. The new iteration is started by calculating a new fitting model, which considers the residual fitting of the 1st and 2nd derivatives of the loss function matrix. The overall pseudo-code for the Modified XGBoost is given below (Algorithm 3):
| Algorithm 3: Modified XGBoost algorithm. |
|
3.3. Classification Using DT (Decision Tree) Classifier
DT is referred to as a supervised learning algorithm that could be used for both classification and regression issues. In general, it is promptly suitable for solving classification issues. The internal nodes of DT denote the dataset features, the branches denote the decision rules, and each leaf node denotes the outcome of the classifier. A DT algorithm splits data into branches for building a tree, which increases the accuracy of prediction. Input data are split into various subgroups, and the step is repeated in every node of the leaf until the tree is completely built. Typically, a DT model is a simple and automatic algorithm. It requires minimum exertion to prepare the data during pre-processing. DT does not need data standardization. Hence, DT is considered in this study for internal comparison. The algorithm for the DT classifier is given as follows:
From Algorithm 4, it is clear that the sample (Sp) and features (Fs) are taken as the input for the DT algorithm. The training dataset is split based on the optimal criterion. During the pruning phase, successive branches are minimized upon which the general model of the tree is built. The roots are formed based on the created node. With the help of the test condition, the optimal features and samples are selected. The completely grown tree is accessed, and the root represents the output of the classifier, which predicts the presence of kidney stones.
| Algorithm 4: Decision Tree Classifier. |
DT (Sample Sp, Features Fs)
Step 1: If stopping_condition (Sp, Fs) = true then
a. Leaf = createNode()
b. leafLabel = classify(s)
c. return leaf
Step 2. root = createNode()
Step 3. root.tes_condition = findBestSplit(Sp,Fs)
Step 4. V = {v|v a possible outcomefroot.test_condition}
Step 5. For each value vϵV:
a. Spv = {s|root.test_condition(s) = v and sϵSp};
b. Child(ch) = TreeGrowth (Spv,Fs);
c. Add ch as descent of root and edges are labelled {root → ch} as v
Step 6. return root |
3.4. Classification Using NB (Naïve Bayes) Classifier
NB is a simple learning algorithm but shows effective performance in the process of classification. In an NB classifier, the class that has a higher probability is returned to classify the instance. Training data are generally used to find the probability values, which follow Bayes’ rule. Improved classification accuracy can be attained by using an enhanced instance-weighting algorithm.
NB uses Bayes’ rule to classify the instance (
q1,
q2, … …
qm) and to find the class in which a higher probability delivers the attribute values of the instances.
where
c refers to the vector of class,
p(
c) refers to the probability of class c, and
p(
q1,
q2, … …
qm|
c) refers to the probability of attributes 1, 2, … m, which has the values of
q1,
q2, … …
qm given the class
c instance.
Every attribute has class values by using naïve assumptions in the algorithm. Hence,
Moreover, as a certain instance is given, for every class, the denominator is equal to
p(
q1,
q2, … …
qm); then, Equation (5) can be given as
The probability terms p(c) and p(q
j|c) are estimated by using the training data, as shown in Equations (6) and (7), respectively:
The accurate estimation of p(c) and p(q
j c) is responsible for the classification accuracy. A large weight instance has a higher influence in the estimation of p(c) and p(q
j c) in comparison with a small weight. Generally, NB possesses several merits, including easy execution, and probabilities could be computed directly with speed training. Due to these advantages, this study considers NB for internal comparison. The stepwise operation of the NB classifier is given in Algorithm 5.
| Algorithm 5: Naïve Bayes Classifier. |
|
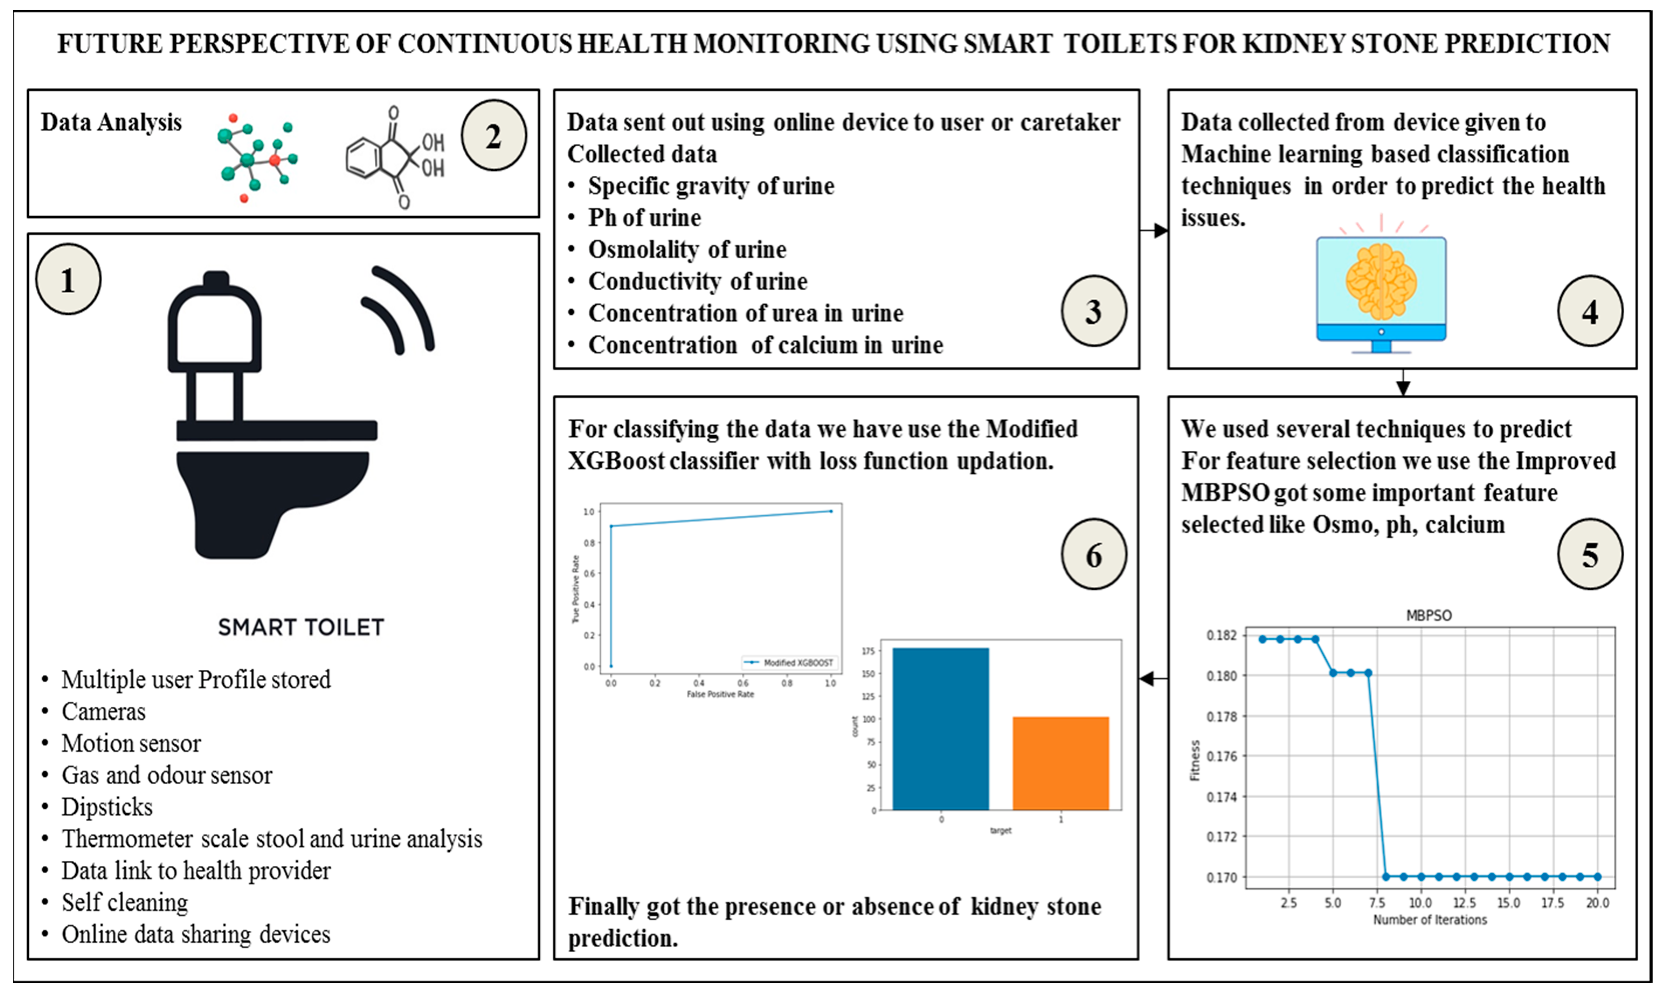
For a better understanding, the proposed work is presented using the illustrative diagram in
Figure 2. The illustrative diagram consists of images, notes, features to be selected, and the method used. The present work considers a real-time dataset. The smart toilet considers several attributes for the prediction of diseases. To perform that, the smart toilet consists of cameras, gas and odor sensors, a thermometer scale for stool and urine analysis, stored profiles of multiple users, motion sensors, dipsticks, data links to a health provider, and self-cleaning and online data sharing services.
By using sensors and various devices, data are collected. The collected data are analysed, and the collected data, including pH of urine, osmolality of urine, conductivity of urine, specific gravity of urine, concentration of calcium in urine, and concentration of urea in urine, are sent to the caretaker or user. ML algorithms are utilized for the prediction of kidney stones. For feature selection, an improved MBPSO method is used for selecting features, such as pH, calcium osmolality, and others. For classification, the Modified XGBoost classifier is utilized with the loss function updated for the prediction of kidney stones, and the outcomes show the presence and absence of kidney stones.
4. Results and Discussion
The results that have been attained by implementing the proposed system for the prediction of kidney stones are included in this section with dataset description, performance metrics, exploratory data analysis, implementation results, performance analysis, and internal results.
4.1. Dataset Description
The initial phase is to collect real-time data using the sensors to predict the existence of kidney stones (urolithiasis) based on urine analysis. IoT-based data collection is performed for the assessment or prediction of urolithiasis. Six characteristics of urine, including the pH of urine (pH), the osmolality of urine (osmo), the conductivity of urine (cond), the specific gravity of urine (gravity), the concentration of calcium in the urine (calc) and the concentration of urea in urine (urea), are considered. The values collected from both healthy persons and patients by using the system are used for the prediction of kidney stones.
4.2. Performance Metrics
4.2.1. Accuracy
The term accuracy can be referred to as the model classification rate that is provided through the proportion of correctly classified instances (Tru
Positive + Tru
Negative) to the sum of instances in the dataset (Tru
Positive + Fal
Positive + Tru
Negative + Fal
Negative). The following Equation (8) can be used to calculate the accuracy range:
4.2.2. Precision
The term precision is defined as the degree of covariance of the system that results from the correctly identified instances
TruPositive to the total number of instances that are correctly classified (
TruPositive +
FalPositive). It is measured by Equation (9) as follows:
In this equation, the variables are defined as FalNegative—False Negative, FalPositive—False Positive, TruNegative—True Negative, and TruPositive—True Positive.
4.2.3. F-Measure
F1-Score denotes the weighted harmonic mean value of (Rec) recall and (Prec) precision, and it is calculated using Equation (10):
4.2.4. Recall
The term recall refers to the ratio of real and retrieved data to the real data. It is computed using Equation (11):
where ‘ret’ refers to the retrieved data.
4.3. Exploratory Data Analysis
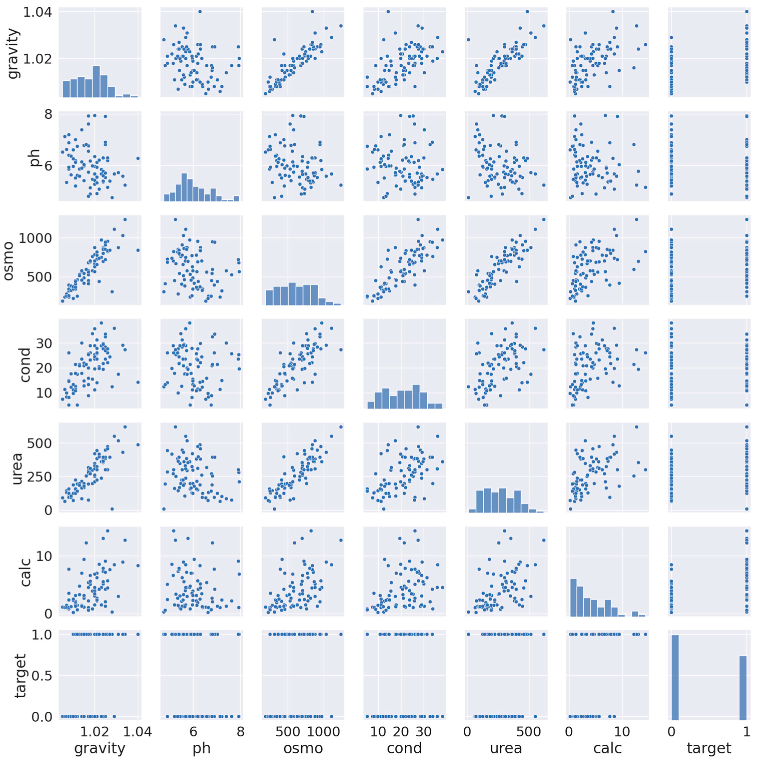
EDA denotes the necessary procedure of performing primary investigations on the data to realize patterns, experiment hypotheses, verify assumptions, and denote data characteristics with the help of graphical representations and summary statistics. This section discusses the exploratory data analysis of the proposed model in the present study by using an SNS plot, as shown in
Figure 3.
In the SNS plot, the significant features of the figure-level functions are specified and easily created by using multiple sub-plots. Selected features including (calc, gravity, Osmo, pH, cond, urea, and target) are represented in detail by using the SNS plot, as shown in
Figure 3.
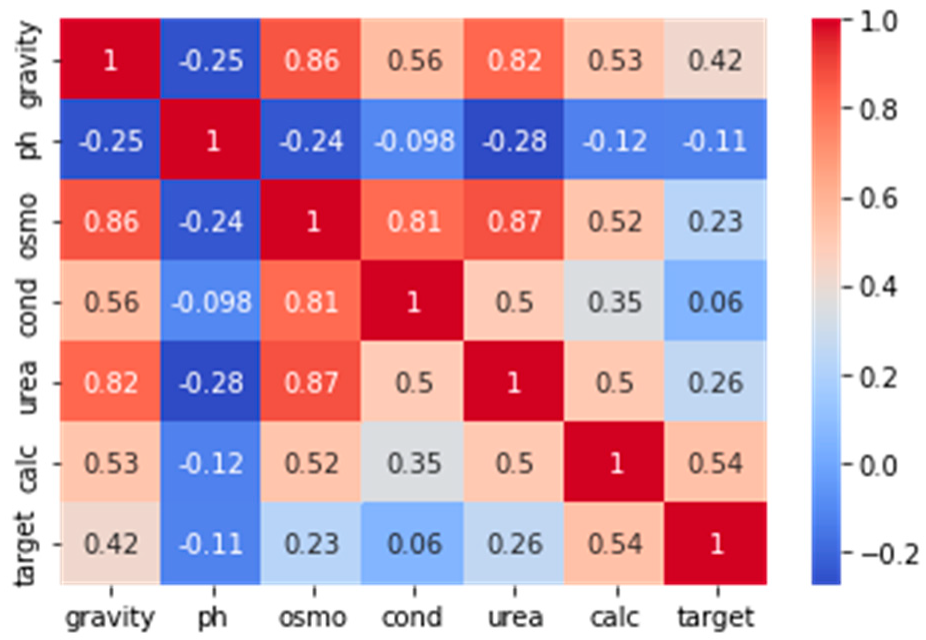
The correlation coefficients of the selected variables (calc, gravity, Osmo, pH, cond, urea and target) are shown in the correlation matrix. The correlations among the possible pairs are depicted in the matrix shown in
Figure 4.
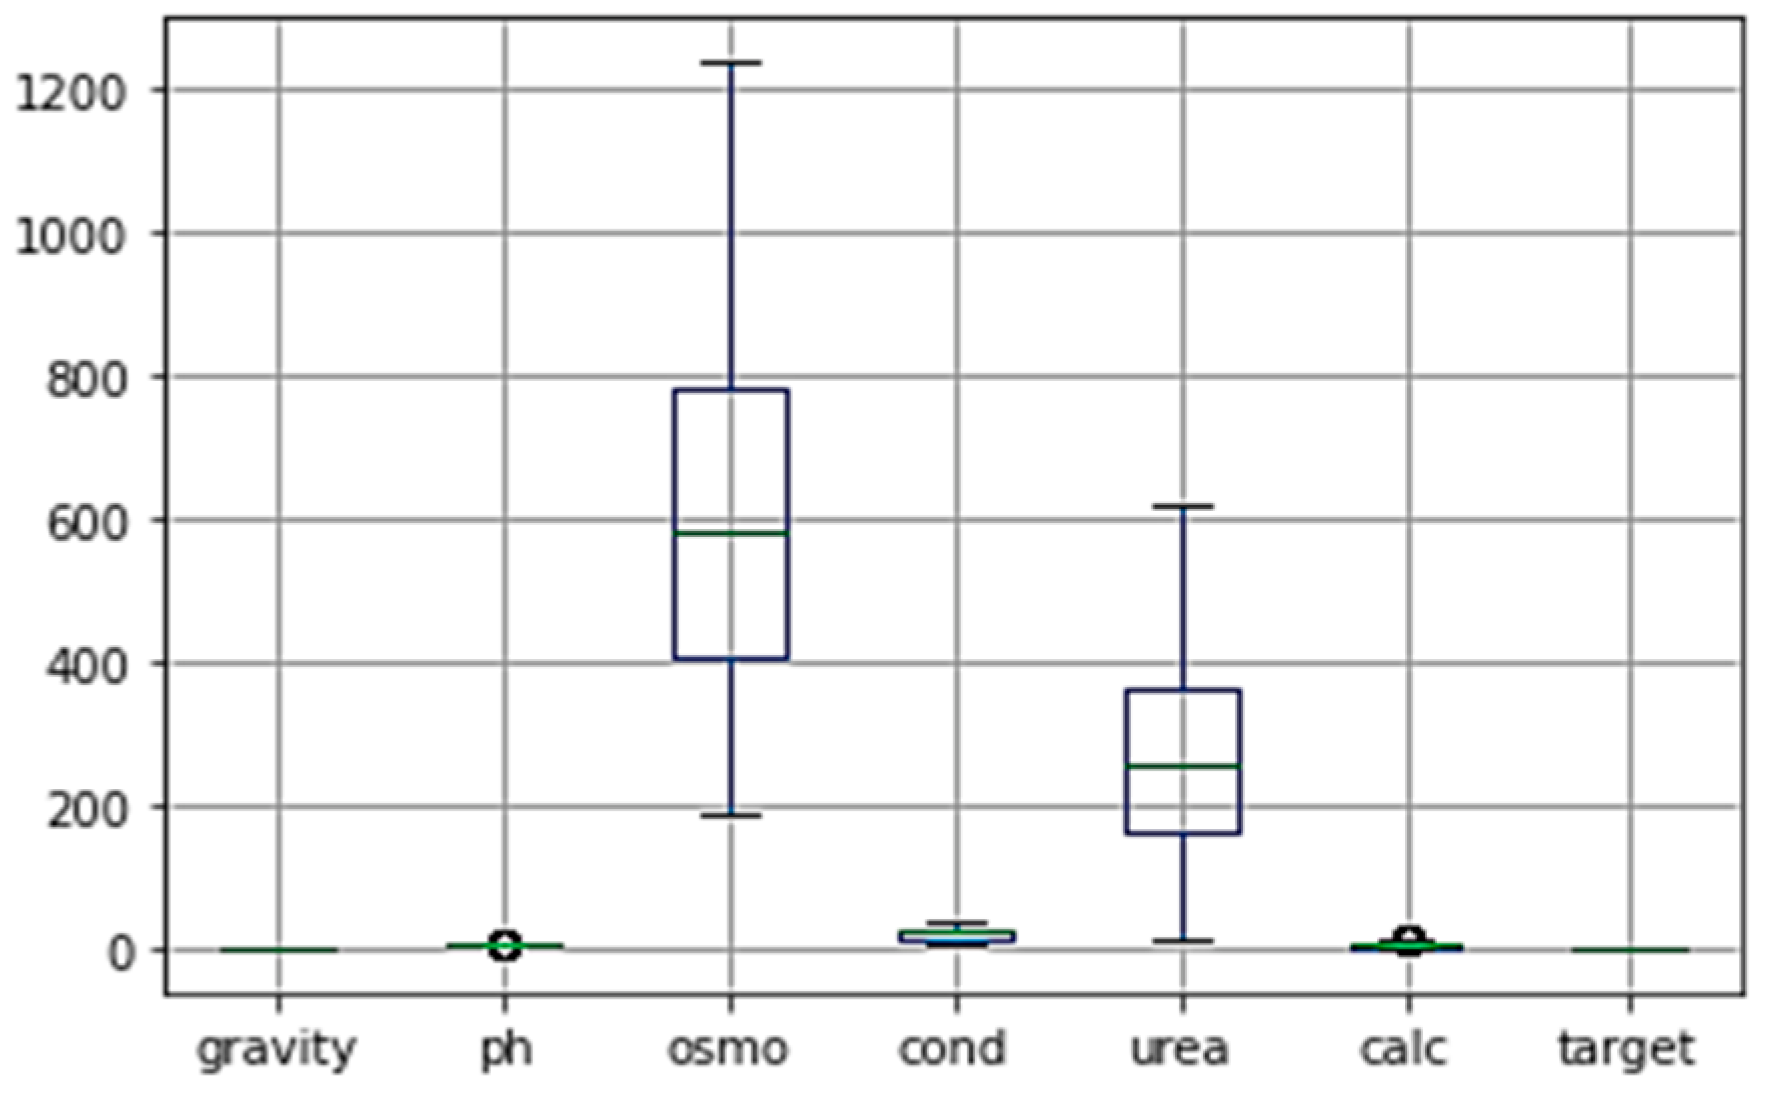
A box plot depicts a set of numerical data and provides a visual form of the data. By using a box plot, the attributes can be compared easily. It provides a graphical summary of the attributes, and the average value of the data is easily identified in the box plot of the selected data, as shown in
Figure 5.
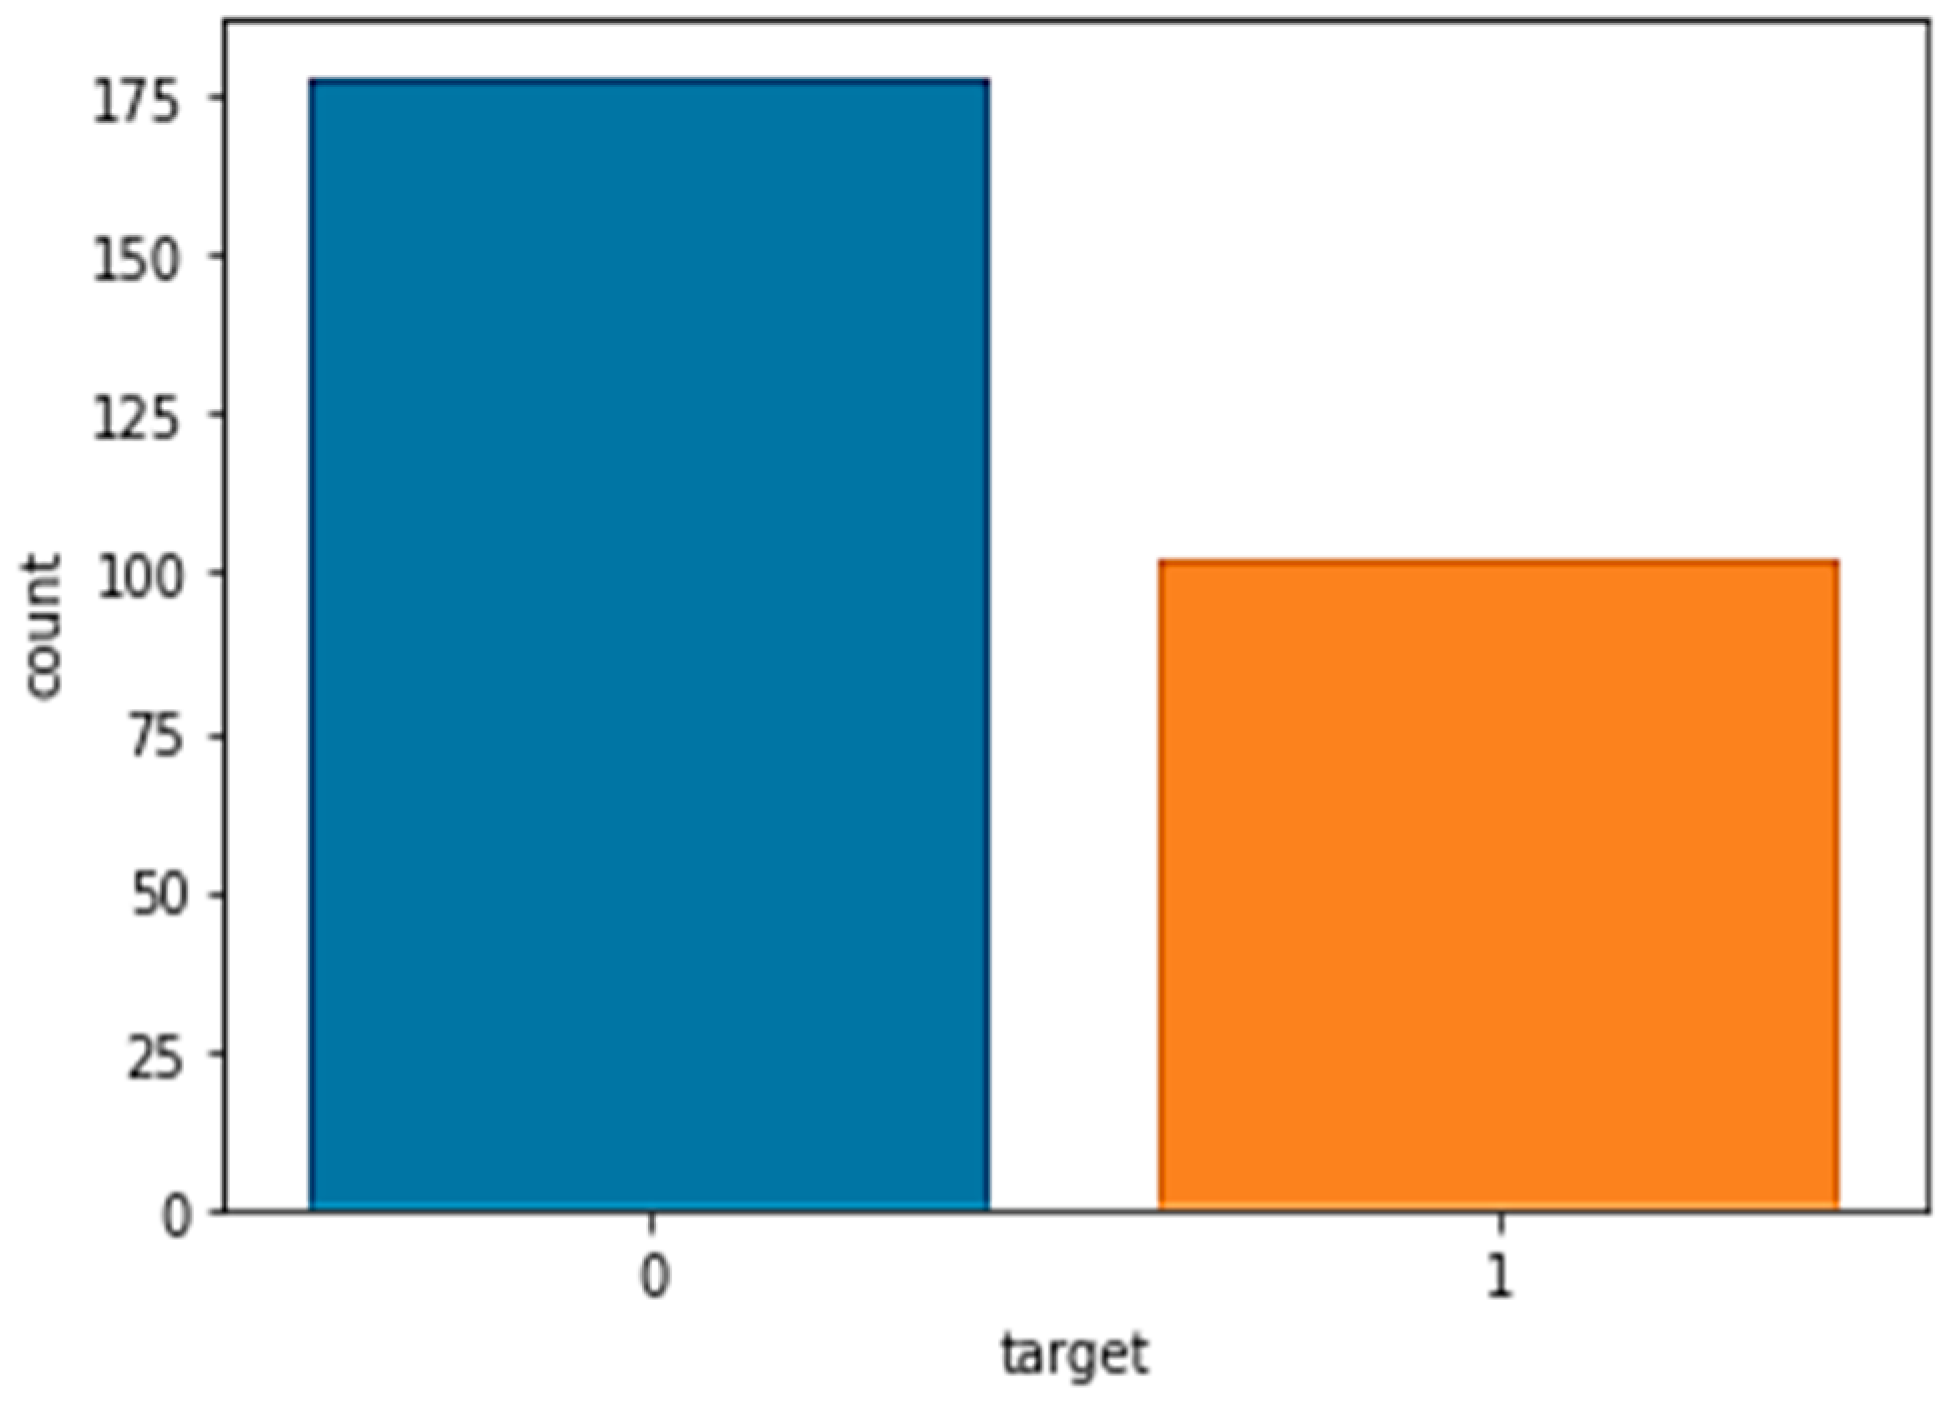
Target 0 represents the absence of kidney stones and target 1 represents the presence of kidney stones, which have been found by using the collected dataset and by analyzing the features of the data. The histogram that represents the presence and absence of kidney stones is shown in
Figure 6.
4.4. Implementation Results
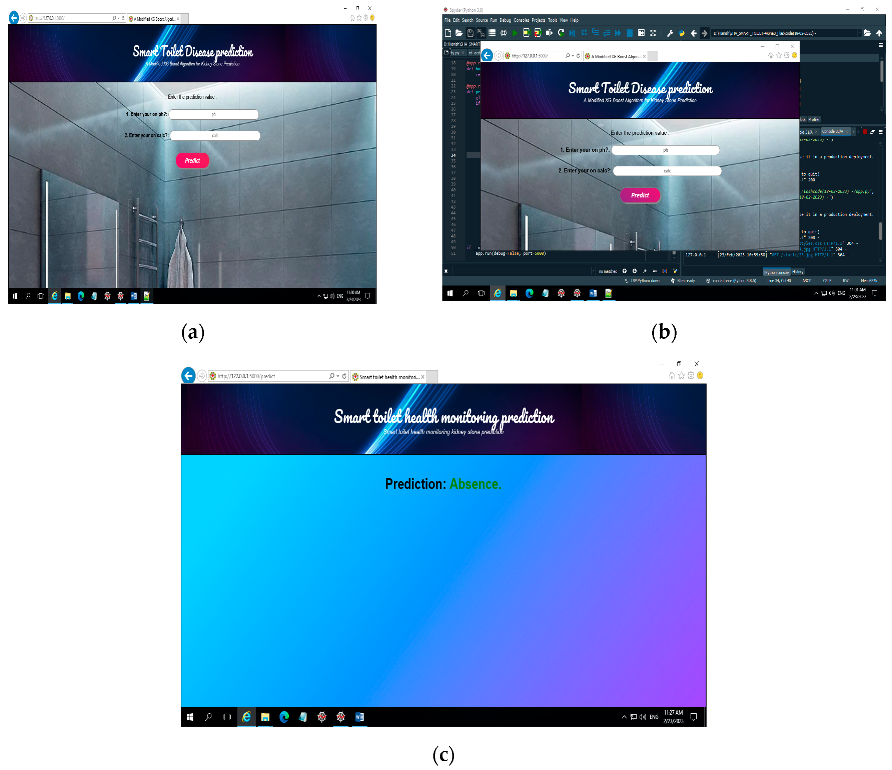
During the implementation process, the required data from the collected values (calc, gravity, Osmo, pH, cond, and urea) are given. Based on the values, the proposed model predicts the results. If a kidney stone is present, the outcome will be shown as ‘presence’; otherwise, it will show as ‘absence’.
Figure 7 show the implementation results of the proposed model.
4.5. Performance Analysis
The performance of the proposed system is assessed based on the ROC curve and confusion matrix. The corresponding outcomes are discussed in this section.
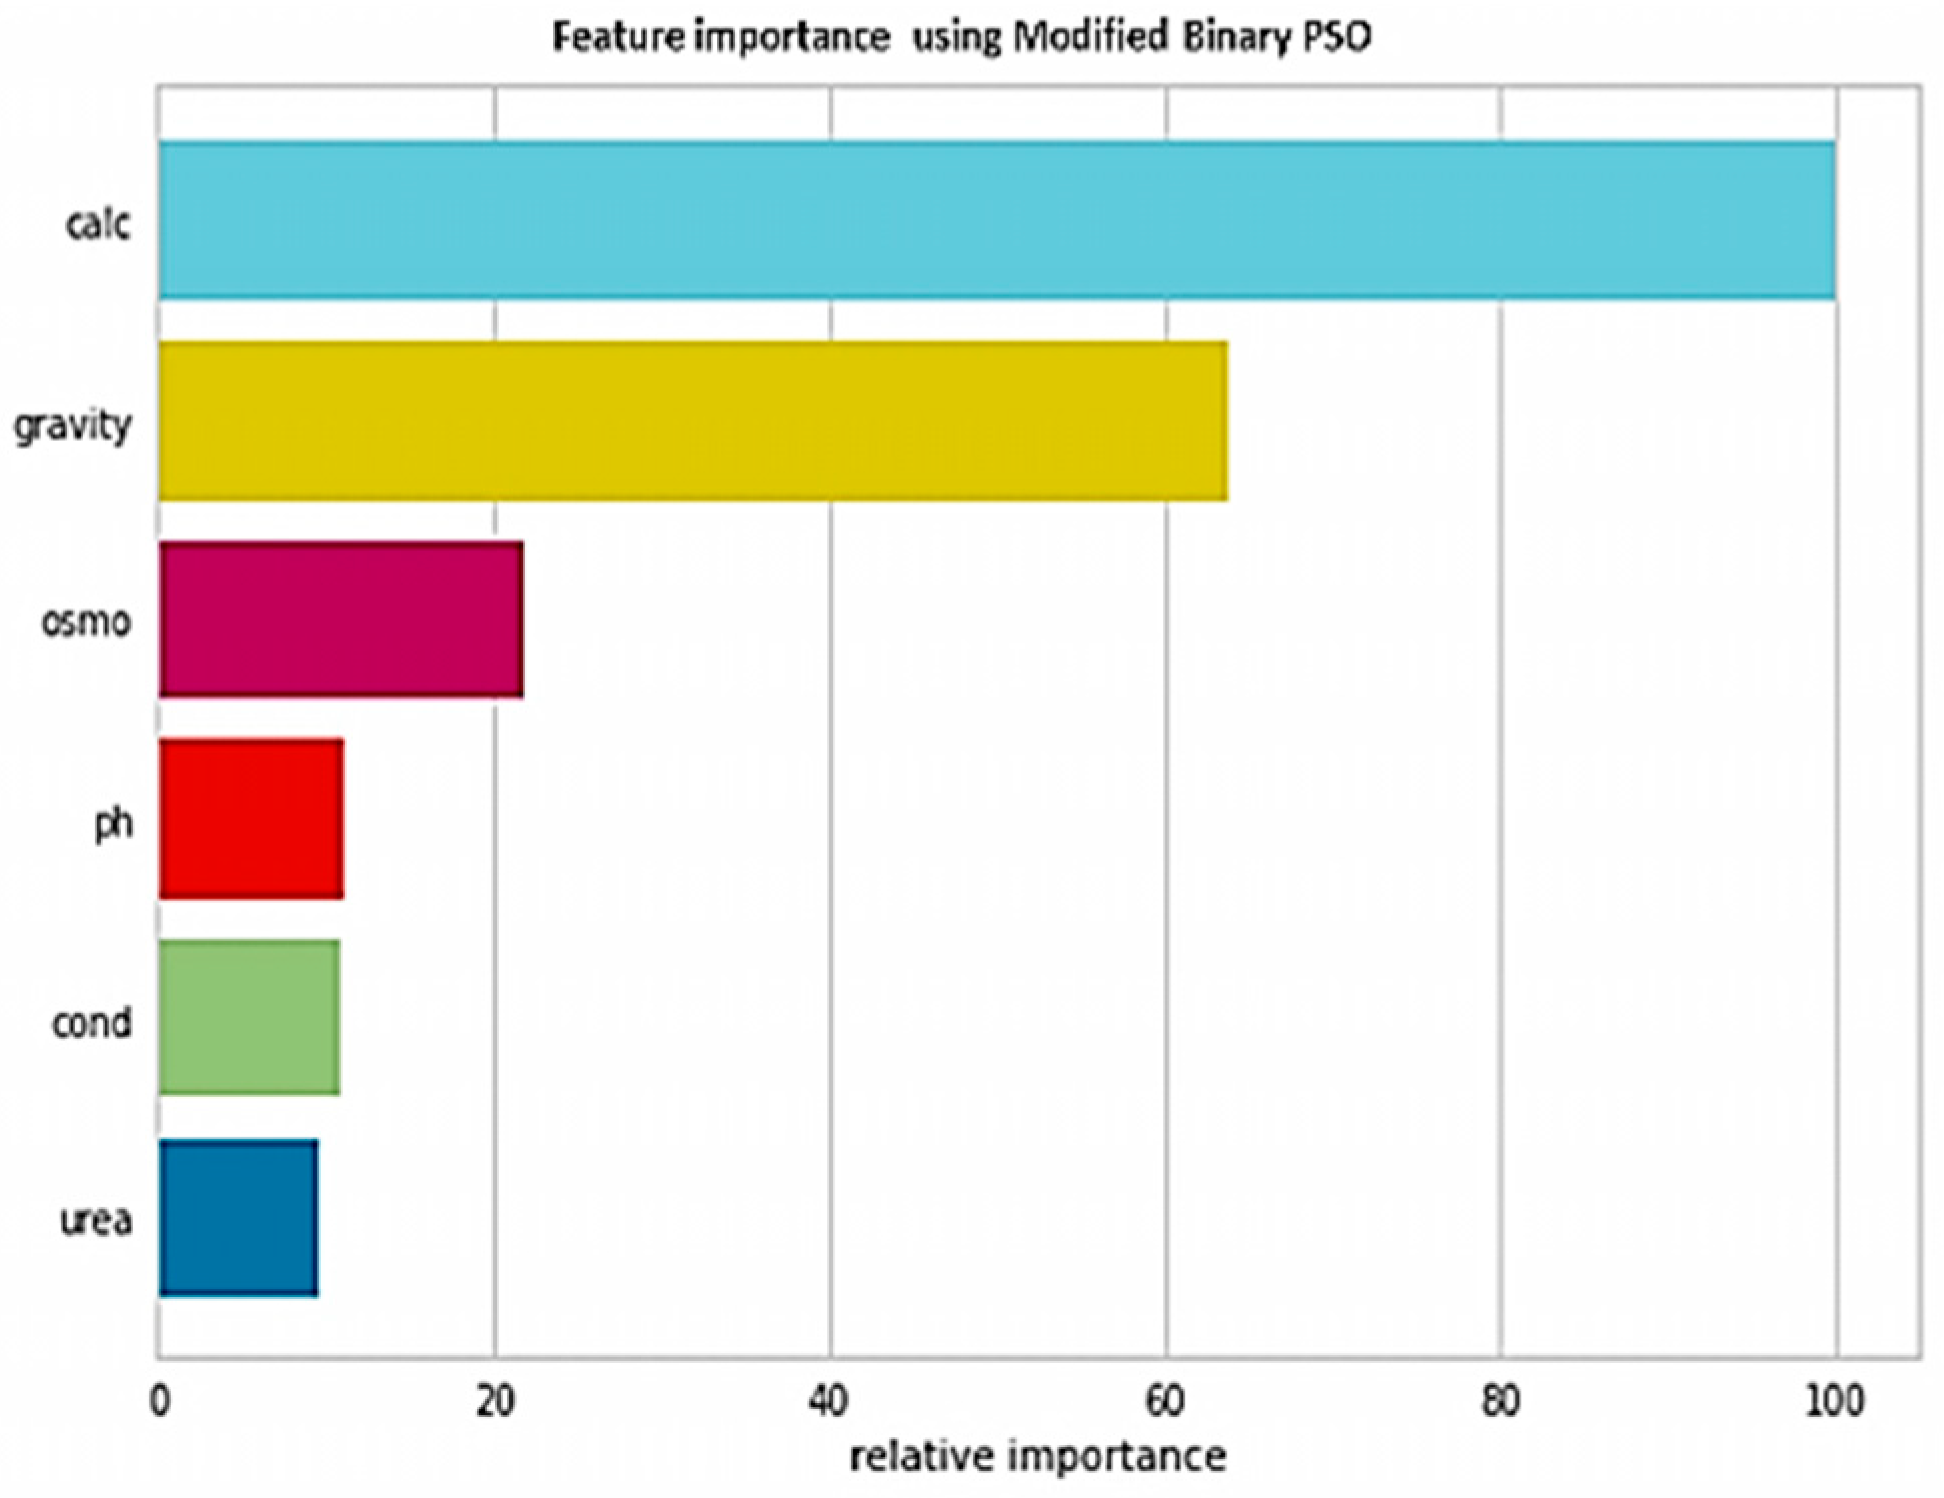
The data features, which include calc, gravity, Osmo, pH, cond, urea, and their relative importance, are shown in
Figure 8. From
Figure 8, it is observed that the calc feature has more importance in comparison with other features.
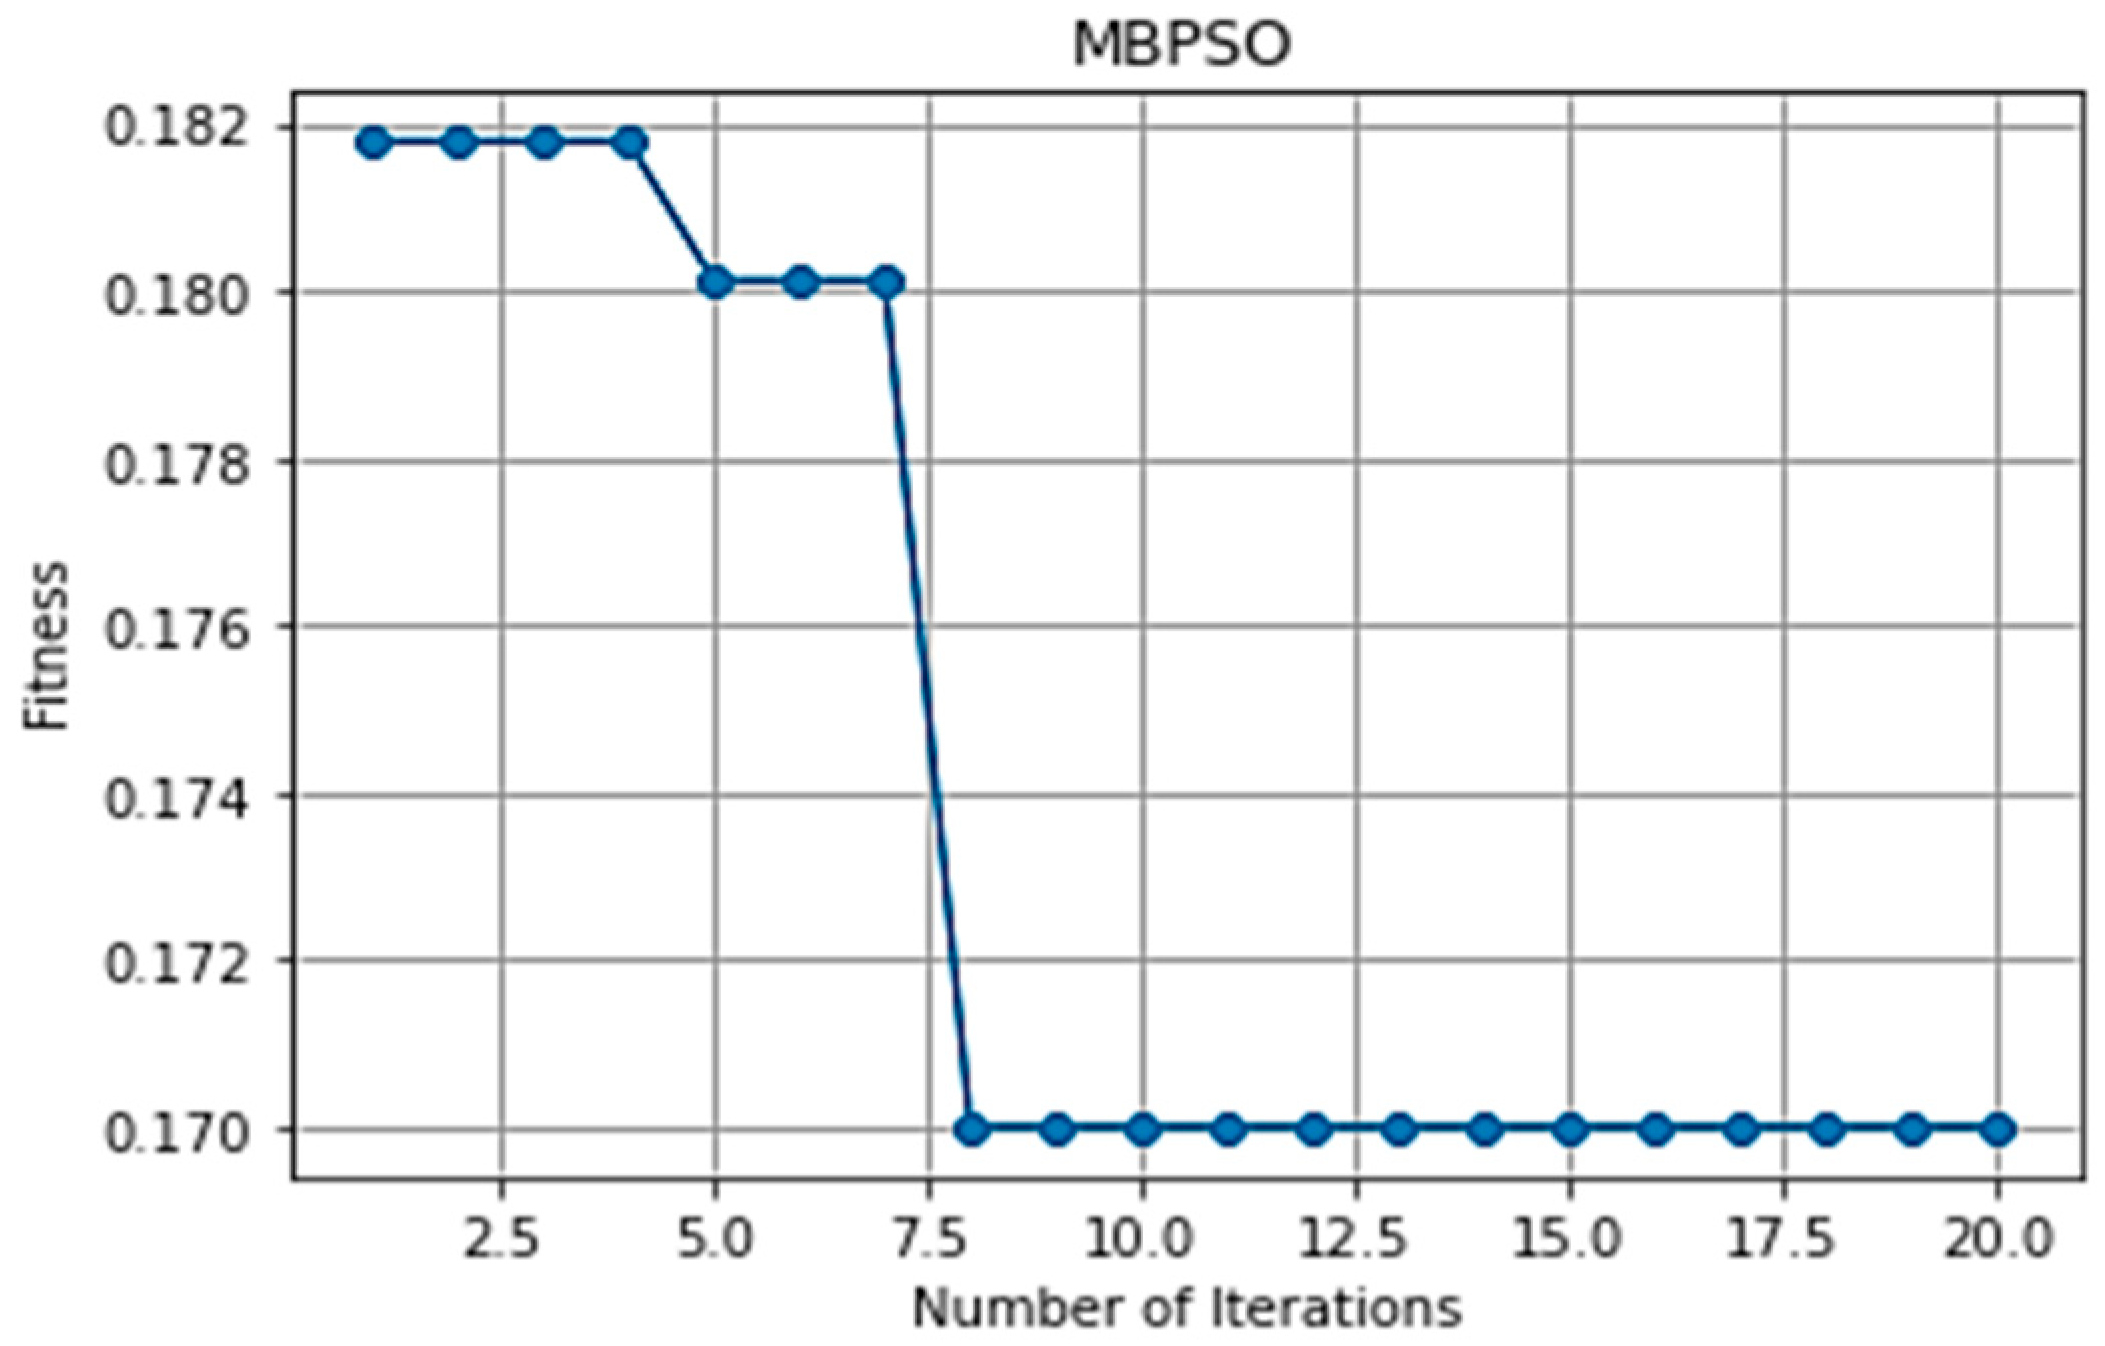
The feature selection process concerning the iterations is shown in
Figure 9. From
Figure 9, it is clear that during the initial iterations, the fitness of the features has some variations. After iteration (7.5), the fitness saturates, and the optimal features are selected.
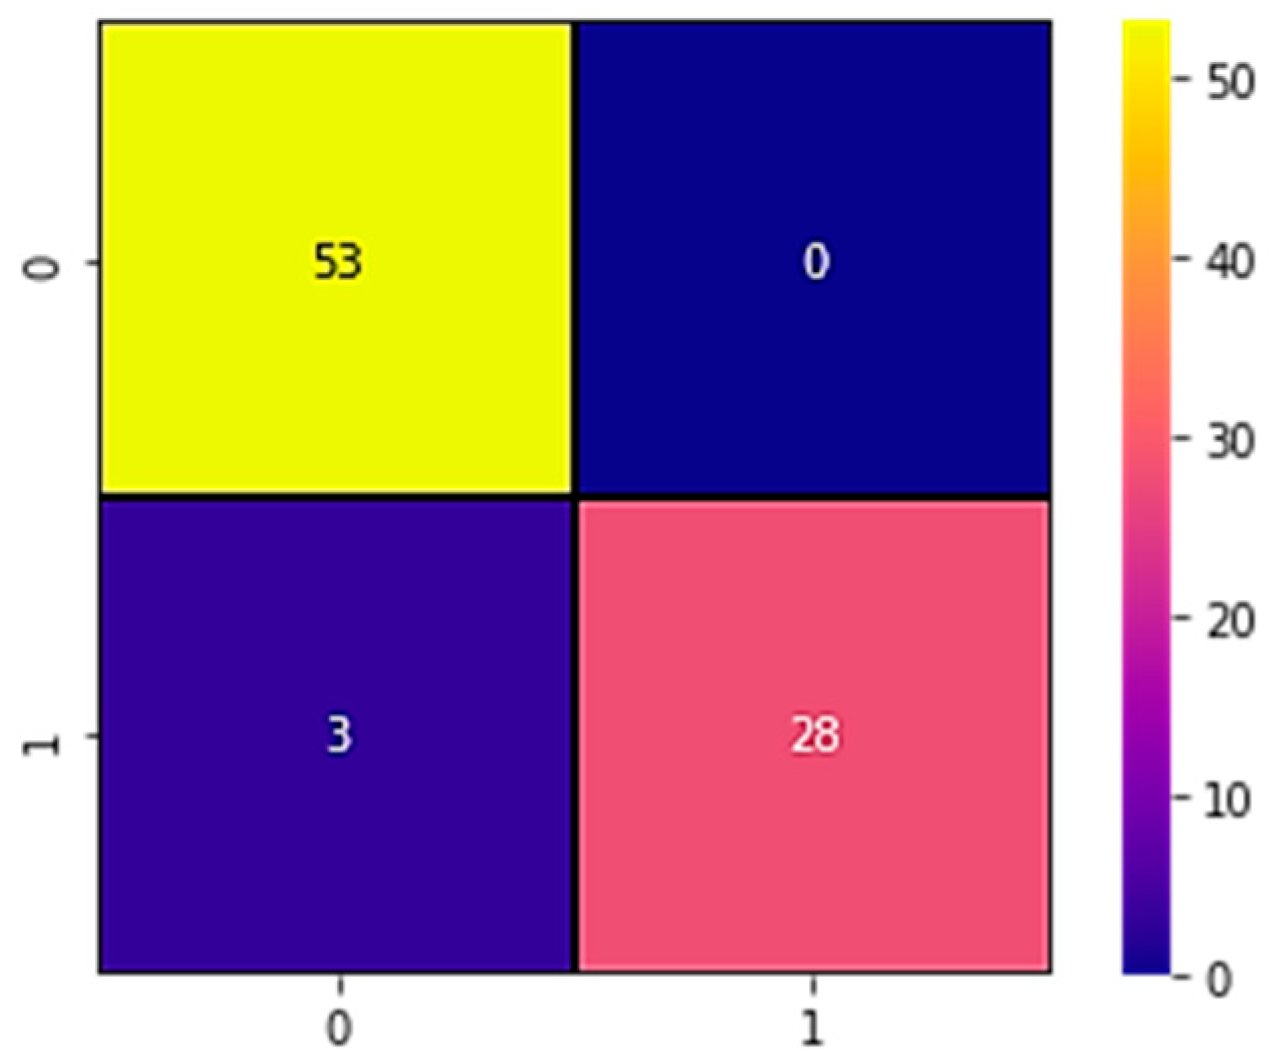
Figure 10 shows the confusion matrix of the Modified XGBoost classifier, which illustrates the prediction of kidney stones. By using the Modified XGBoost classifier, the correct predictions are given as 53—the absence of kidney stones and 28—the presence of kidney stones. However, three classifications have been misinterpreted as having no kidney stones, but the Modified XGBoost classifier predicts wrongly. Additionally,
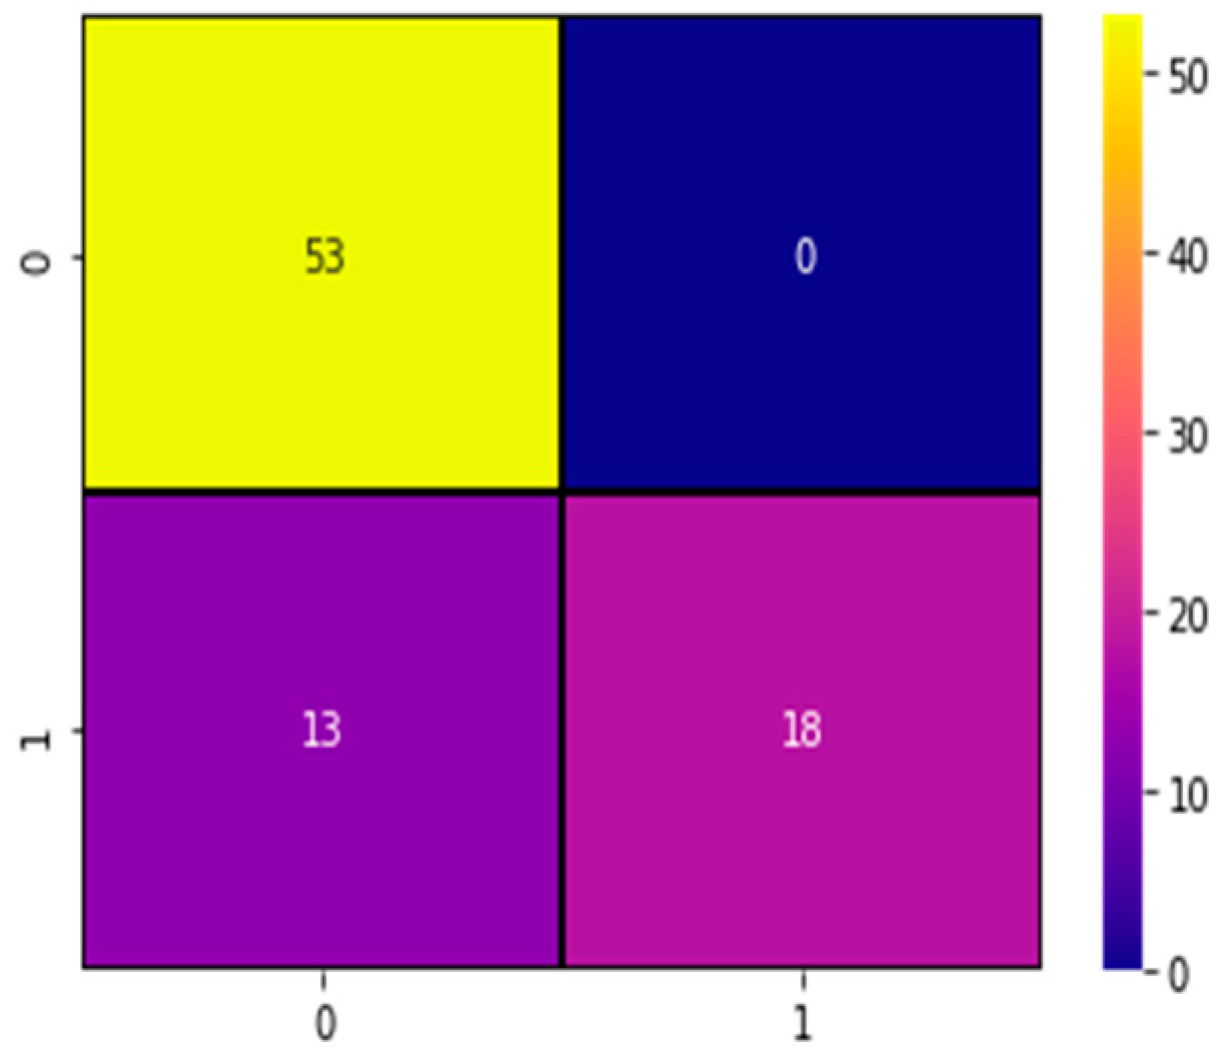
Figure 11 shows the confusion matrix of the DT classifier, which illustrates the prediction of kidney stones. Using the DT classifier, the correct predictions are 53—the absence of kidney stones and 18—the presence of kidney stones. However, 13 classifications are made wrongly in that the absence of kidney stones is predicted wrongly as the presence of kidney stones.
Figure 12 shows the confusion matrix of the NB classifier, which illustrates the prediction of kidney stones. Using the NB classifier, the correct predictions are 49—the absence of kidney stones and 13—the presence of kidney stones. However, 18 classifications are made wrongly in that the absence of a kidney stone is predicted wrongly as the presence of a kidney stone, and 4 wrong classifications are made in which the presence of a kidney stone is predicted wrongly as an absence.
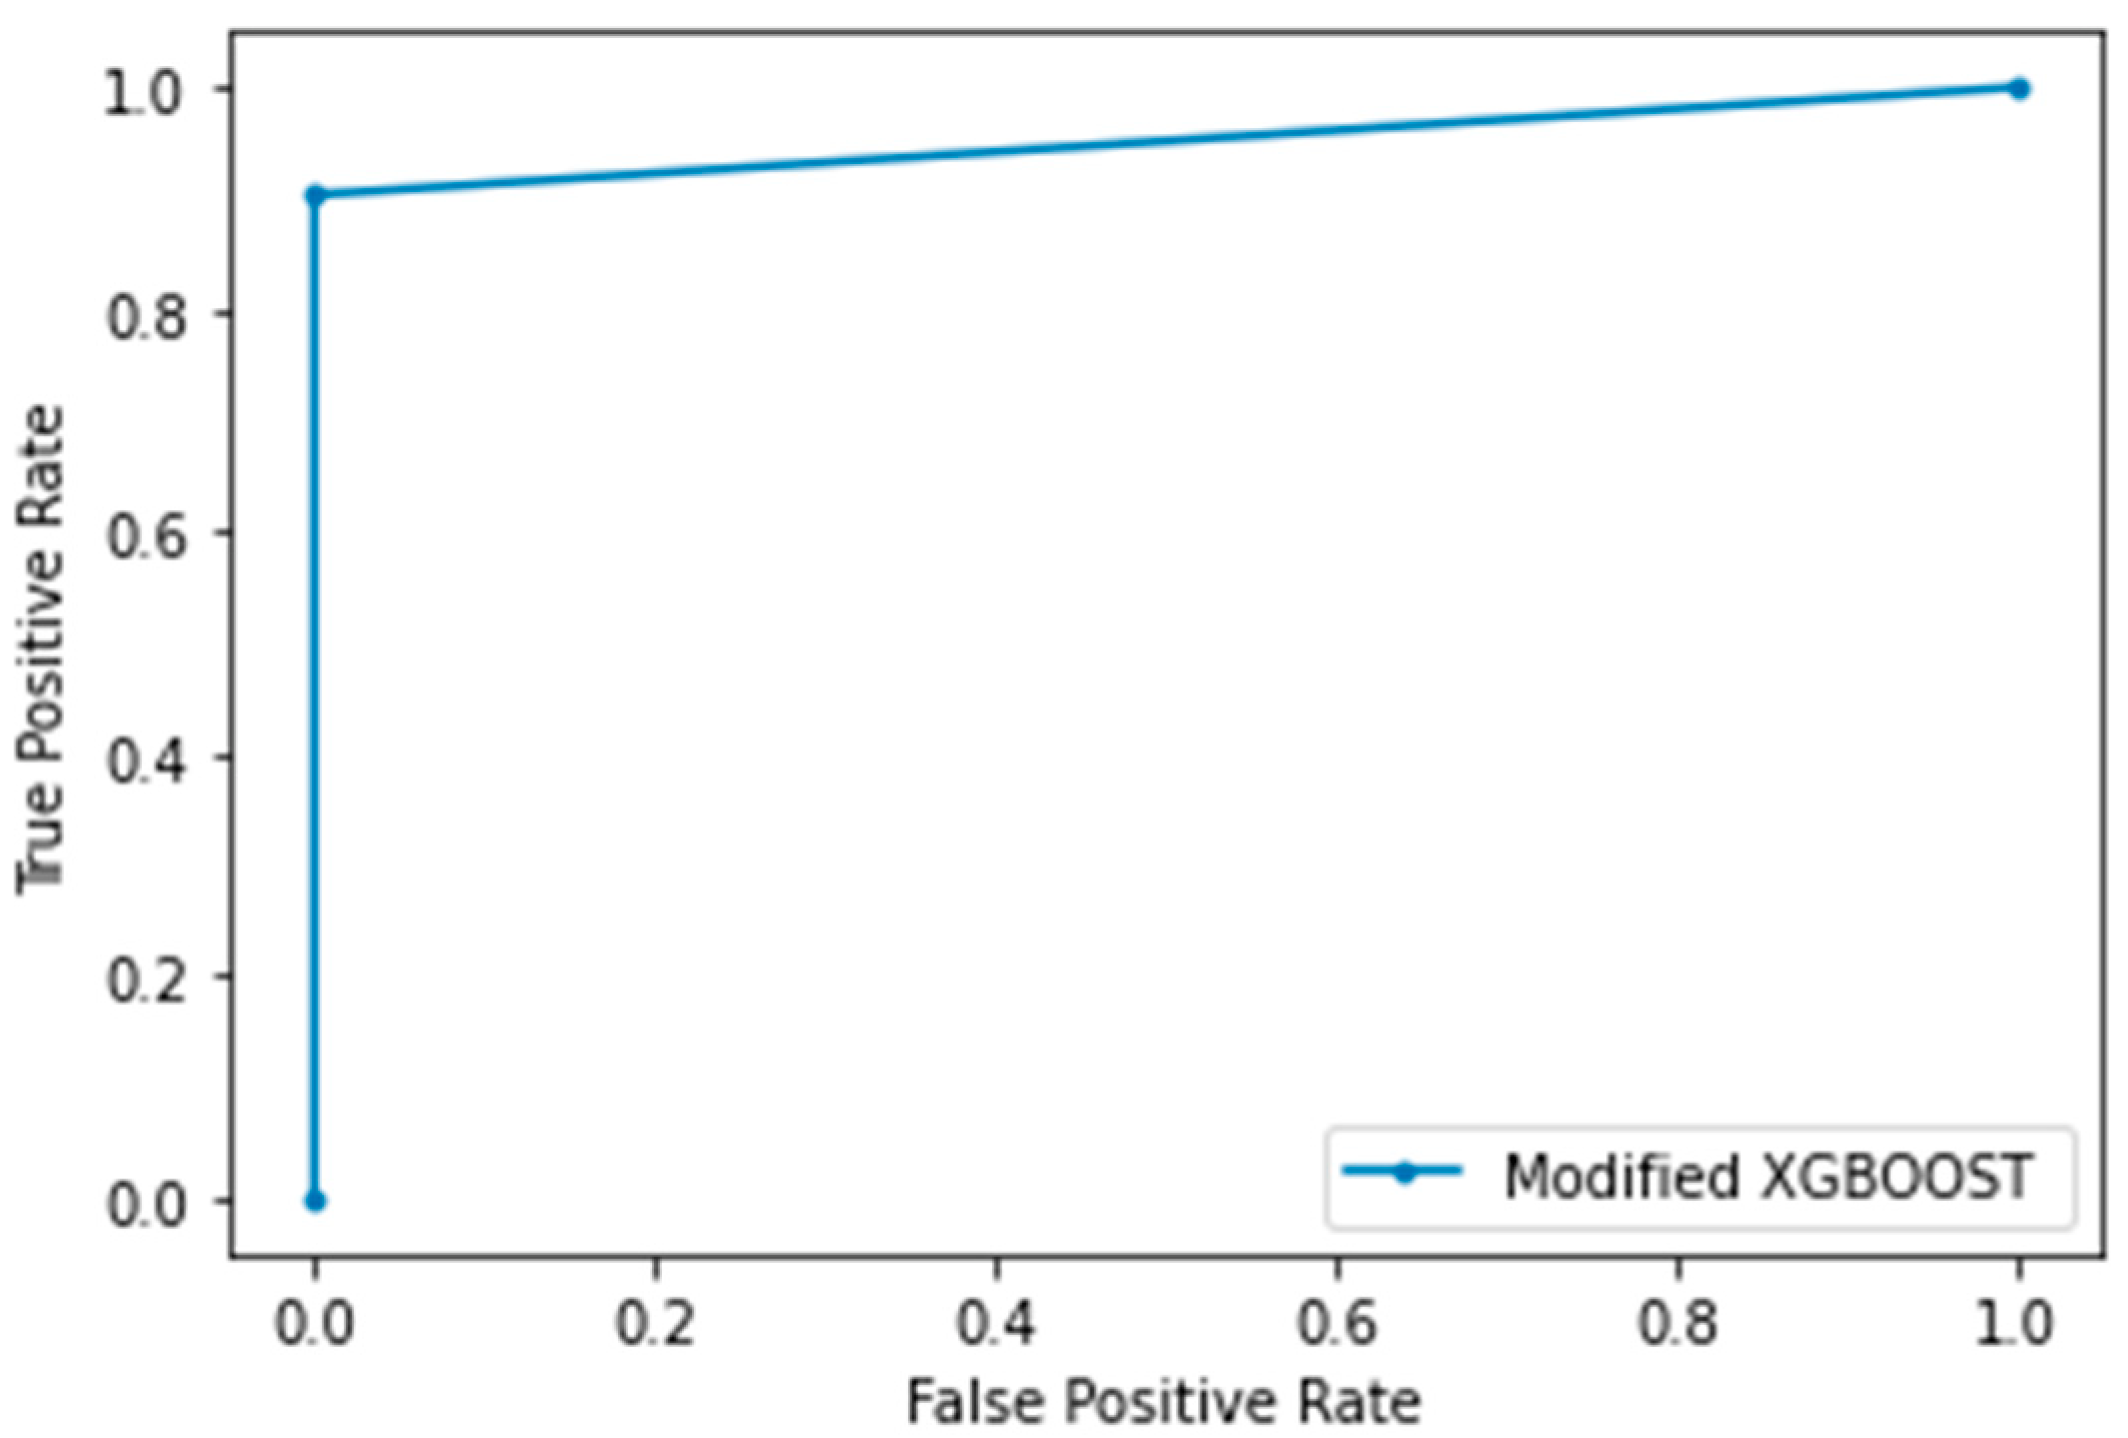
The performance of the classification technique by using a graph at each classification threshold is shown in the ROC curve. The curve uses two parameters (false positive rate and true positive rate). The ROC curve of the Modified XGBoost is shown in
Figure 13. The proposed model has attained the value of ‘1’, which indicates that the model has the utmost correct predictions.
4.6. Internal Comparison
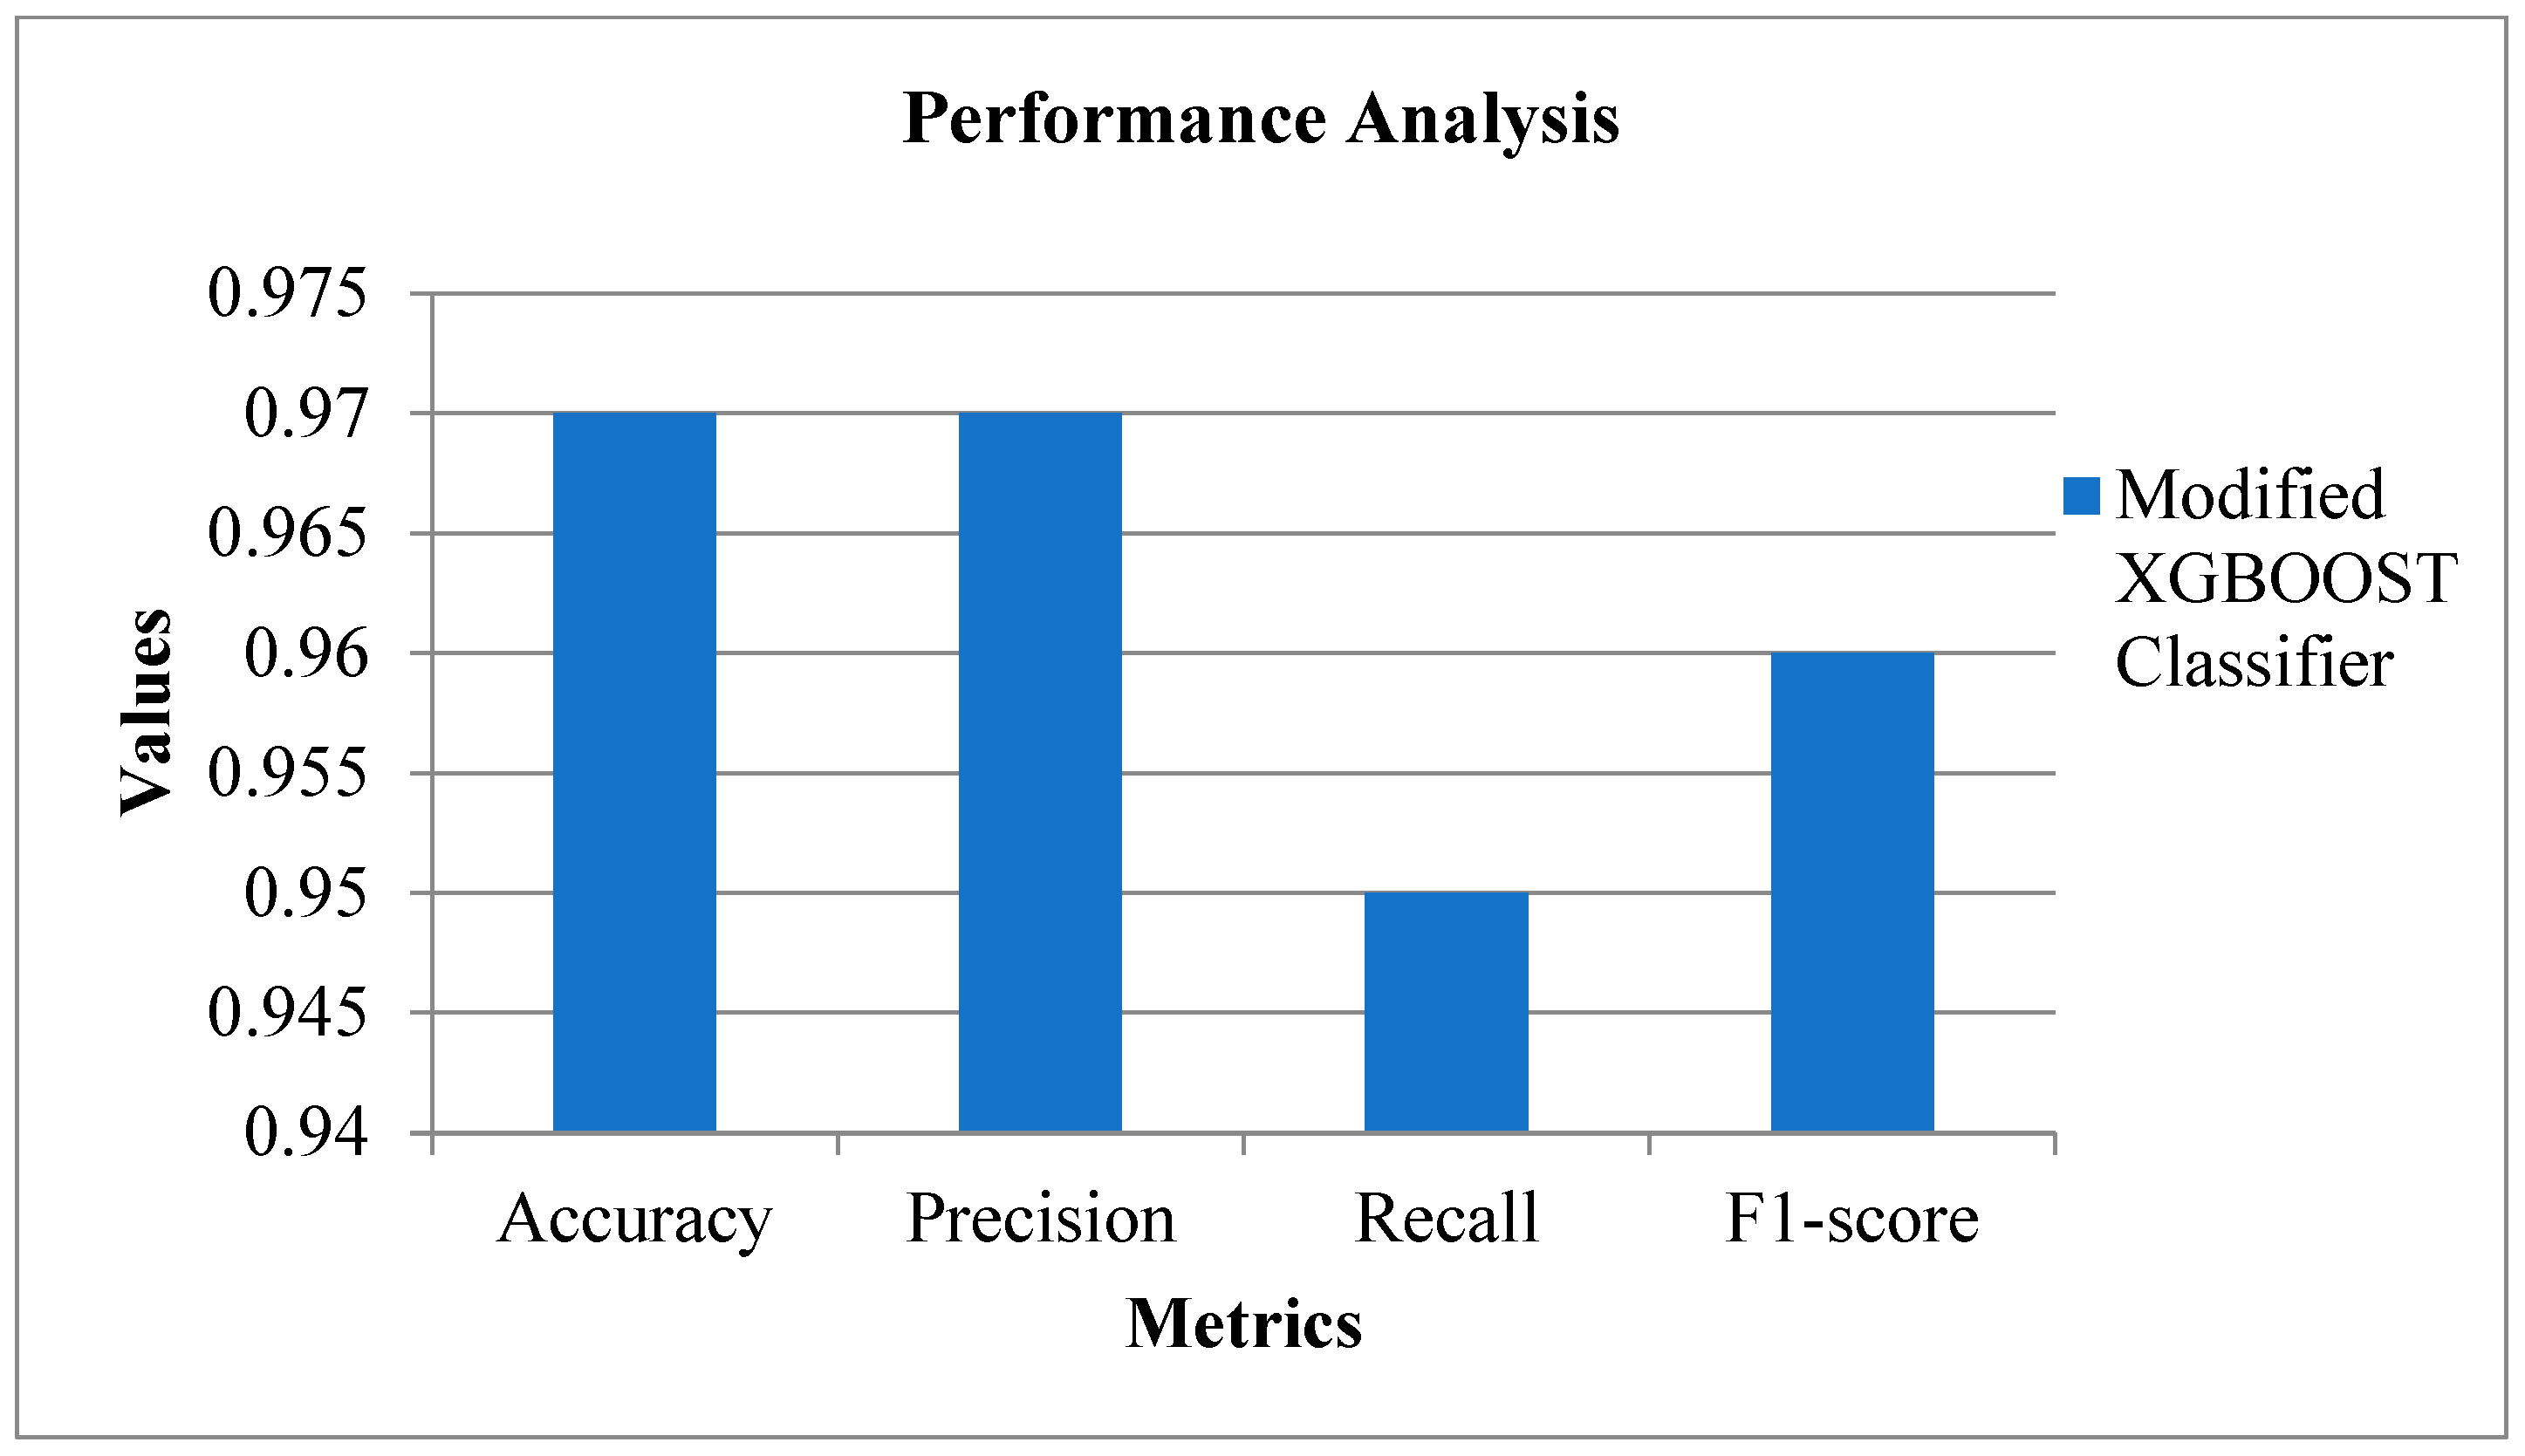
The performance metrics of the Modified XGBoost classifier attain 97% of accuracy, 96% of F1-Score, 95% of recall, and 97% of precision.
Table 1 and
Figure 14 show the performance metrics of the Modified XGBoost classifier.
From the extensive analysis, it has been found that, the studies in the field of prediction of kidney stones seems to be lagging, and the dataset used in the present study is a real-time dataset. Hence, it is difficult to perform a comparison with other studies. For that, to assess the efficiency of the present study, the proposed model is compared internally by using the DT and NB classifiers.
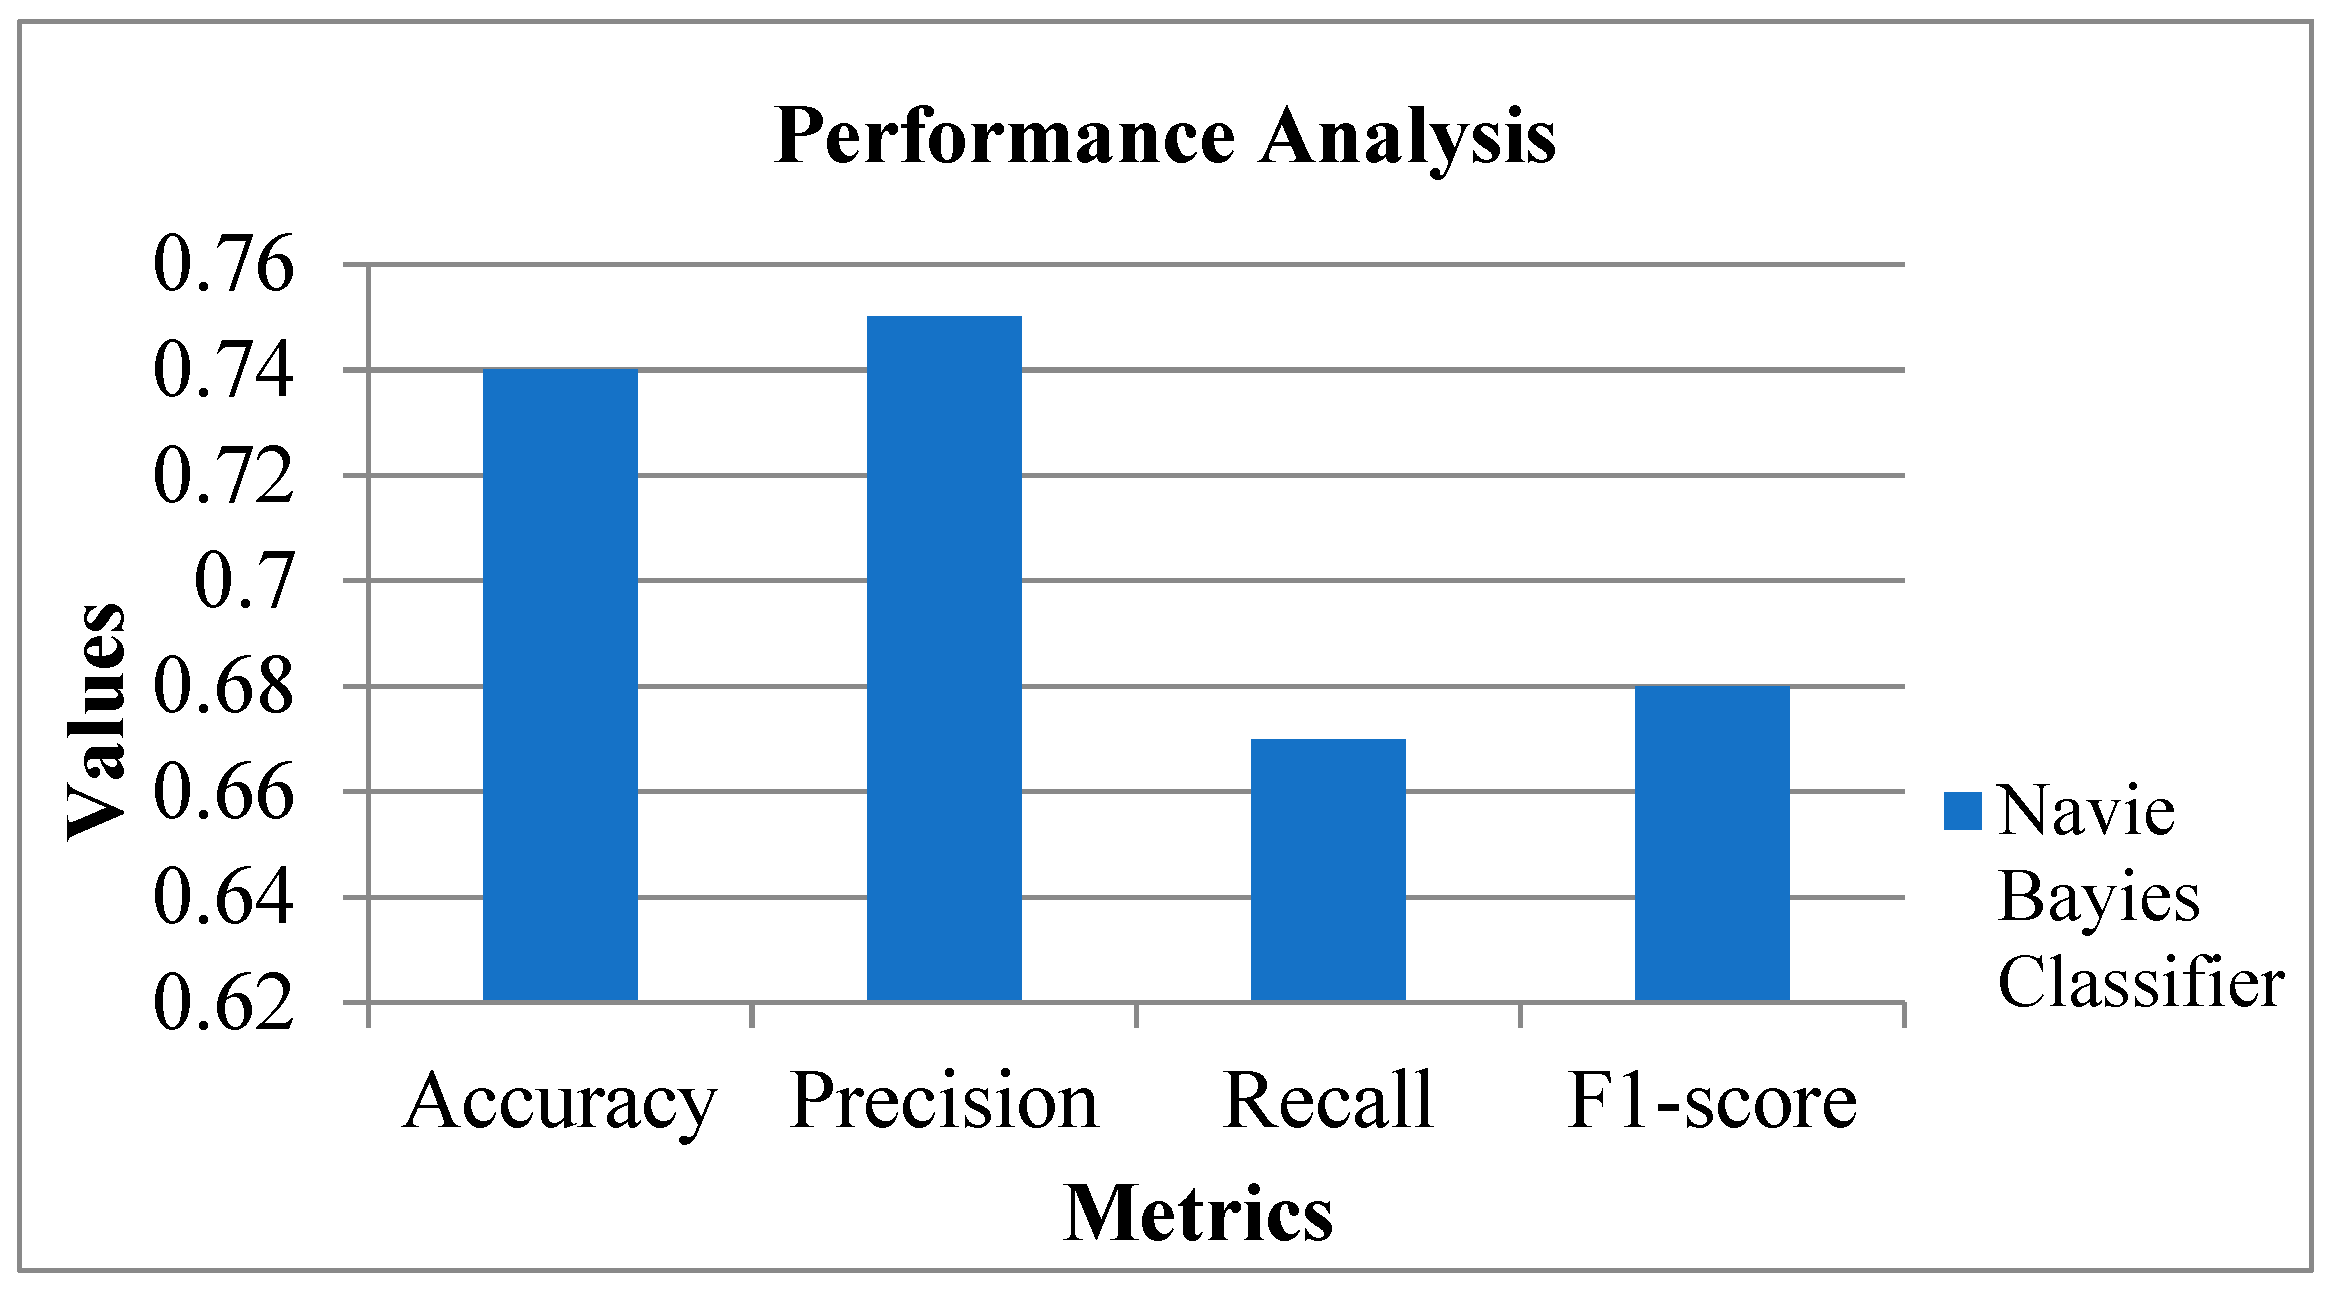
The performance metrics of the NB classifier attain 74% of accuracy, 68% of F1-Score, 67% of recall, and 75% of precision. The accuracy of the NB classifier is lower in comparison with the Modified XGBoost classifier.
Table 2 and
Figure 15 show the performance metrics of the NB classifier.
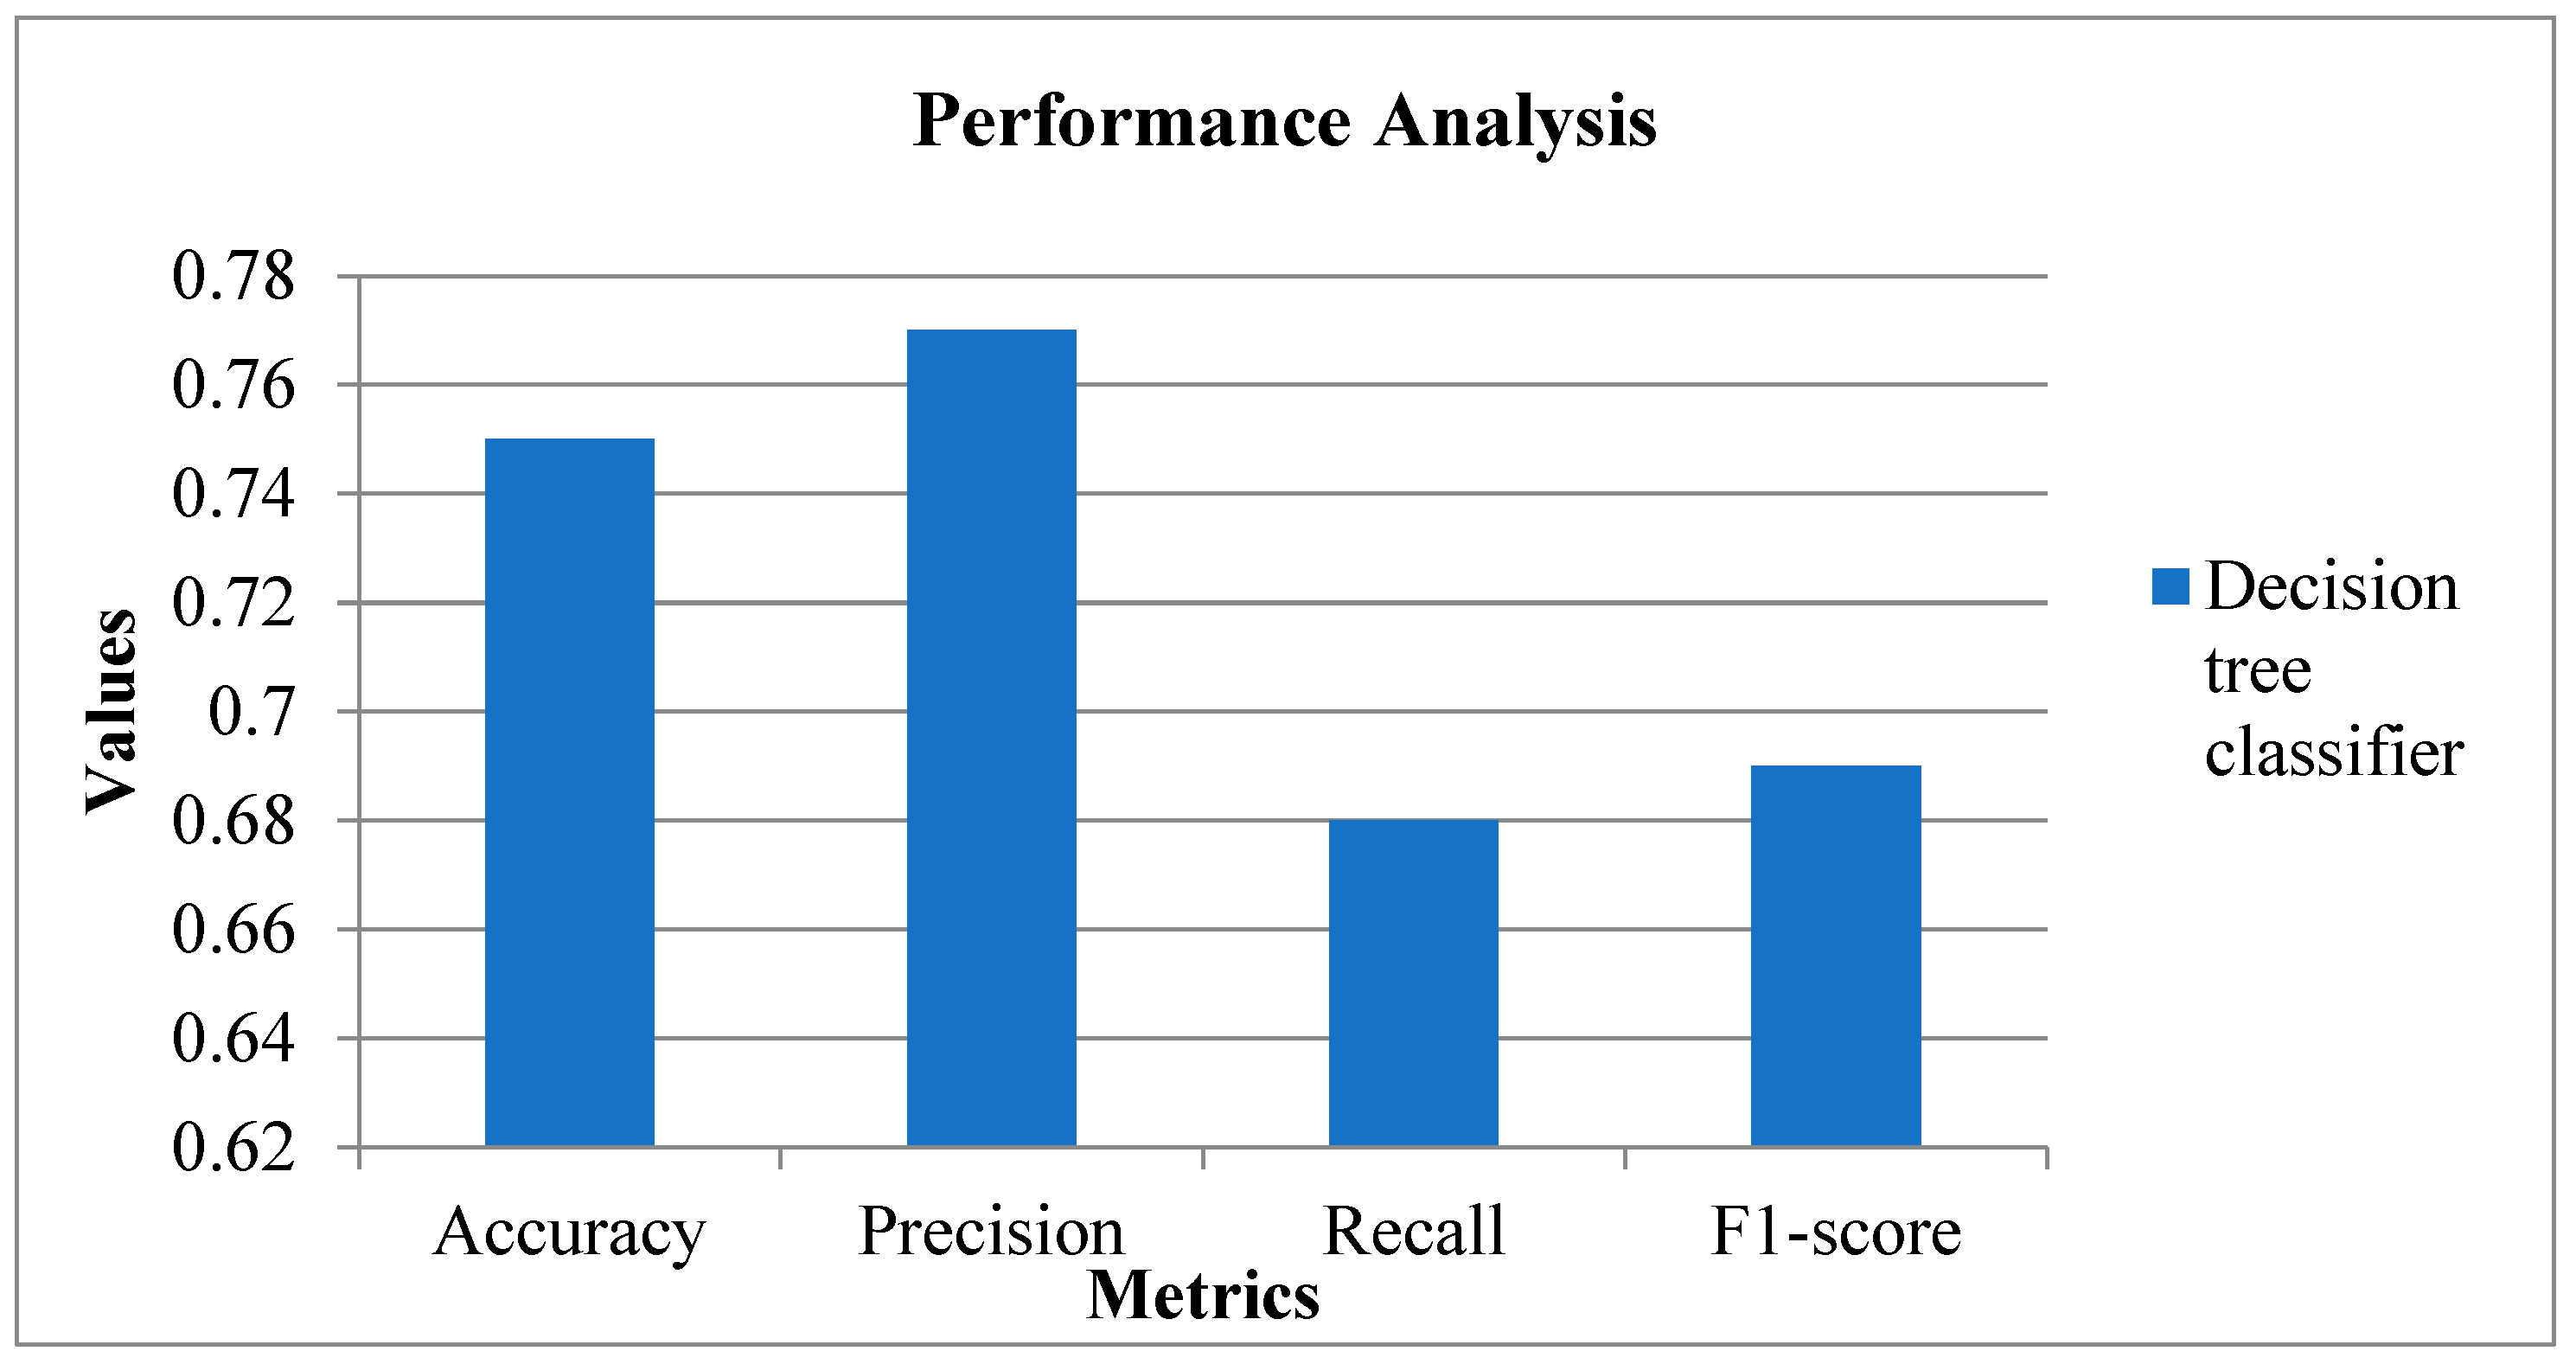
The performance metrics of the DT classifier attain 75% of accuracy, 69% of F1-Score, 68% of recall, and 77% of precision. The accuracy of the DT classifier is lower in comparison with the Modified XGBoost classifier.
Table 3 and
Figure 16 show the performance metrics of the DT classifier.
From the internal comparison, it is evident that the proposed method (Modified XGBoost) has attained better values in all the performance metrics, including precision, recall, accuracy, and F1-Score.
Table 4 shows the accuracy of the different classifiers with and without feature selection.
From
Table 4, the accuracy of the Modified XGBoost, NB, and DT classifiers with feature selection (MBPSO) is 97%, 73.571%, and 74.745%, respectively, whereas without feature selection (MBPSO), the accuracy of the Modified XGBoost, NB, and DT classifiers is 85.269%, 60.841%, and 65.789%, respectively. Hence, using the feature selection with MBPSO and the loss update function of the Modified XGBoost has tremendously increased the accuracy of the proposed model.
5. Conclusions
The present study aimed to predict the presence and absence of kidney stones in an IoT-fog environment by designing a smart toilet-based model. Several processes were undertaken to accomplish this. Accordingly, the optimal features were selected by using the Improved MBPSO, and classification was performed by using the Modified XGBoost technique. The dataset used in the proposed algorithm was a real-time dataset. Several features, such as the pH of urine, the osmolality of urine, the conductivity of urine, the specific gravity of urine, the concentration of calcium in urine, and the concentration of urea in urine, were selected by using the proposed MBPSO method. Some features, such as the concentration of calcium and the concentration of urea in urine, were responsible for crystal formation in the kidneys, which leads to the occurrence of kidney stones. The modified XGBoost algorithm was used to perform classification in an IoT-fog environment, and the attained accuracy of the proposed system was 97%. The efficiency of the proposed system was assessed by performing an internal comparison with the DT and NB classifiers, which showed the effectiveness of the proposed model. From the internal comparison, the DT classifier showed an accuracy rate of 0.75, while the NB classifier attainted an accuracy of 0.74. However, the proposed system revealed high accuracy rate of 0.97. Moreover, accuracy rate was assessed for the different classifiers with and without feature selection. The results revealed that the proposed method attained a high accuracy value with feature selection at a rate of 97%, whereas without feature selection, it was 85.269%.
This study possesses advantages with regard to speed and accuracy. However, it also comprises certain pitfalls. The proposed work was specifically outlined to prognosticate kidney stone and might not be applicable for other disease diagnoses. The proposed system demands expertise in XGBoost and PSO. This indicates that it might not be available to non-experts, which might restrict its acceptance in certain settings. Overall, though the proposed algorithm possesses various merits for prognosticating kidney stone, it also possesses certain limitations in terms of restricted applicability and requirement for expertise, which have to be considered for effective usage.
In the future, AI-based DL methods could be used as an alternative method to conventional analysis of kidney stones and in digital endoscopic platforms. Furthermore, the performance of the proposed work can be enhanced by gathering numerous data from several sources, which would assist in enhancing the model’s accuracy, thereby minimize overfitting. Moreover, with regard to feature selection, the proposed model could be optimized further with the usage of feature selection methods. This would assist in determining the crucial features that would contribute in predicting kidney stones. In addition, as interpretability is a significant factor in medical diagnosis, researchers could concentrate on making the Improved MBPSO more interpretable through which medical experts could comprehend the way in which the algorithm has evolved in its analysis. This work can be extended for application in other medical areas to perform prediction or diagnosis. For instance, the proposed approach could be utilized for predicting the possibility of developing various kinds of diseases or stones. Moreover, as the traditional way of predicting kidney stones seems to be a tedious process and requires human intervention, the effective performance of the proposed algorithm is capable of producing faster and more effective outcomes. It is also capable of becoming a useful tool to medical experts in treating and diagnosing kidney stones inclusive of other medical diagnoses.
