Abstract
This work addressed the problem regarding the optimal integration of battery systems (BS) in grid-connected networks (GCNs) with the purpose of reducing energy losses and CO2 emissions, for which it formulates a mathematical model that considers the constraints associated with the operation of GCNs in a distributed generation environment that includes BS and variable power generation related to photovoltaic (PV) distributed generation (DG) and demand. As solution strategies, three different master–slave methodologies are employed that are based on sequential programming methods, with the aim to avoid the implementation of commercial software. In the master stage, to solve the problem regarding the location and the type of batteries to be used, parallel-discrete versions of the Montecarlo method (PMC), a genetic algorithm (PDGA), and the search crow algorithm (PDSCA) are employed. In the slave stage, the particle swarm optimization algortihm (PSO) is employed to solve the problem pertaining to the operation of the batteries, using a matrix hourly power flow to assess the impact of each possible solution proposed by the master–slave methodologies on the objective functions and constraints. As a test scenario, a GCN based on the 33-bus test systems is used, which considers the generation, power demand, and CO2 emissions behavior of the city of Medellín (Colombia). Each algorithm is executed 1000 times, with the aim to evaluate the effectiveness of each solution in terms of its quality, standard deviation, and processing times. The simulation results obtained in this work demostrate that PMC/PSO is the master–slave methodology with the best performance in terms of solution quality, repeatability, and processing time.
Keywords:
grid connected network; optimization algorithm; master-slave strategy; parallel processing; photovoltaic generation; battery systems; energy loss; environmental emissions MSC:
65K05; 90C26; 90C27
1. Introduction
1.1. General Context
In the last decades, the continuous growth of the global population and the wide implementation of electrical devices have generated an increased energy demand, which is generally supplied with fossil fuels. This increases CO2 emissions and the energy losses associated with energy transport, directly affecting the quality of electrical services and the life conditions of GCN users [1]. With the aim to mitigate this issue, in the last years, grid operators and researchers have been given the task of integrating environmentally friendly distributed energy resources, which involves the smart integration and operation of renewable energy resources, battery systems, capacitor banks, and static compensators, among others [2,3]. BS have been the most widely installed and studied distributed energy resources in recent years, as they allow managing the energy of the grid, mitigating the variability of renewable energy resources, and improving the economic, technical, and environmental conditions of the network (i.e., the reduction of energy purchasing costs, energy losses, and CO2 emissions, as well as voltage profile improvements, among others) [4]. In turn, GCNs are the most widely studied electrical grids [5], as they are the most developed networks around the world and the ones with the most technical problems (i.e., energy losses, voltage profile limit violations, and line overloadability, among others) [6]. Furthermore, since they are located in cities and towns, fossil fuel-based generation contributes to CO2 emissions in their corresponding regions, affecting the health of their inhabitants. Based on the above, the authors of this work focus on the problem regarding the selection, location, and operation of BS in GCNs, with the aim to reduce energy losses and CO2 emissions.
1.2. State of the Art
Aiming to take advantage of the different benefits associated with the integration of BS in electrical GCNs, many researchers have proposed different strategies for the correct integration of BS in this kind of grid [7,8]. A large portion of these works has been oriented towards developing mathematical models that describe all of the technical and operating constraints involved in the operation of electrical networks within an environment of distributed energy resources (DERs) [9,10]. These mathematical models formulate the objective functions or goals to be achieved through the optimal integration and operation of BS in GCNs, with two the most studied being the reduction of energy production costs and energy losses [11,12]. In [13,14], a literature review on the objective functions used in the optimal integration of BS in electrical systems was carried out, finding that a large number of works focus on economic and technical indicators. Therefore, objective functions related to environmental indicators are a topic that requires exploration. By analyzing the different mathematical formulations reported in the literature to represent the problem regarding the optimal operation of BS in GCNs [13], it was possible to notice that the set of constraints that make up the problem under study must include active and reactive constraints, the power limitations of conventional and renewable generation resources, the power limitations and state of charge of the batteries, and the current line and voltage profile limits that represent the operating constraints of the GCN. It is necessary to include all of these constraints into the mathematical formulation, with the aim to reap the benefits associated with the studied objective functions, while also including the variations in power demand and renewable generation that are involved in the real behavior of a GCN.
To solve the problem regarding the optimal integration of BS in GCNs while considering technical and environmental aspects, many works have been reported in the specialized literature. An example of this is the work reported in [15], whose authors proposed a solution methodology for sizing and operating distributed generators and energy storage systems in an electrical system located in India, with the aim to improve its technical conditions. In this work, the authors considered the variation in power generation and demand, as well as all of the constraints that represent the analyzed electrical grid. However, this work considers a mono-nodal electrical system that ignores the complications related to the transport lines. Furthermore, the authors do not use comparison methods nor analyze the processing times required by the proposed solution. The work by [16] used the artificial electric field algorithm to size and operate distributed generators and BS in AC electrical networks, considering the reduction of CO2 emissions and the improvement of the technical aspects of the grid as objective functions. In this work, the authors compare the best and average solutions obtained by means of the proposed methodology against those of other works reported in the literature. However, they use a mono-nodal grid as a test system and do not analyze the reported processing times and standard deviation values. In addition, this work does not analyze the effectiveness of the studied solution methods regarding processing times and repeatability. The authors of [17] also locate and size BS in a mono-nodal grid. In this work, they describe the mathematical formulation for the integration of BS and other energy resources that compose the electrical grid, (i.e., distributed generators and loads, among others). This study considers economical and technical indicators as objective functions, comparing the results obtained with those of other works reported in the literature. The main problem with these works is associated with the fact that multi-nodal GCNs are more widely used in real life, which implies several constraints related to voltage profiles and line currents in their mathematical formulations, thus increasing the complexity of the problem. However, the analyzed works offer important information on the variable power generation and demand of electrical grids, as well as data related to the implementation of smart optimization methods in the problem regarding the optimal operation and location of BS in GCNs.
Regarding the integration and operation of BS while considering multi-nodal grids, different works based on specialized software and sequential programming methods have been proposed in the last years [8], with the latter being the most used for solving the problem regarding the integration of BS in GCN, as this kind of solution methodologies avoid the use of specialized software, which causes an increase in complexity and implementation costs [15]. Furthermore, exact optimization methods such as convex optimization and specialized software are not commonly used, since these solution methodologies are often stuck in local optima. This occurs due to the nonlinearities generated by the discrete variables that represent the selection of the bus where the battery will be located, as well as the kind of battery to be used. Based on the above, a large number of solution methodologies have been reported in the literature which use master–slave strategies based on sequential programming methods. Here, the master stage is entrusted with solving the location and selection problem of the BS to be installed in the GCN, while the slave stage deals with the power operation schedule of the BS, allowing to obtain the best impact on the objective function. These optimization methods use discrete (master stage) and continuous variables (slave stage) and complex solution space exploration processes to find the optimal power configuration for locating and operating batteries in GCNs.
Most of works reported in the literature focus on a single objective of the two analyzed in this research, namely, reducing the energy losses [13]. An example of this is the work presented in [18], where the authors propose a methodology based on genetic algorithms to solve the problem concerning the optimal integration of BS in GCNs. The authors compare their results to those of other methods reported in the literature in terms of the best solution. However, this work does not include or analyze the standard deviation and processing times required by the solutions methods. The authors of [19] use the coalition formation algorithm for solving the problem regarding the optimal integration of BS in GCN. Their results demonstrate the effectiveness of the proposed solution methodology. However, they do not analyze the processing times and the standard deviation values of the solution strategies under study. A methodology based on the coyote optimization algorithm is proposed in [20] with the purpose of reducing the energy losses in an electrical network by integrating BS. To assess the performance of this approach, different works in the literature are used for the sake of comparison. The authors of this work do not evaluate the repeatability and processing times of the solution methods employed. Another proposal for reducing energy losses is made in [21], where the authors use a sensitivity indicator to locate and operate BS in an electrical grid. These methods get stuck in local optima, as heuristic methods cannot escape from bad solution regions. The authors of [22] propose a methodology based on a discrete version of a continuous method for solving the problem regarding the integration of BS in GCNs, aiming to improve the operating conditions of the electrical system. This work highlights the advantage of using modified conventional continuous optimization methods (discrete versions) in order to solve problems involving discrete and binary variables. In the same way, different authors have recently addressed the problem regarding the selection and location of BS in GCNs [23,24,25].
The reduction of environmental impacts, however, is still a topic in development, with a small number of works reported in the literature. The work reported in [26] aimed to reduce CO2 emissions and energy power losses by using a non-linear mathematical formulation, which was solved with the GAMS software. Nevertheless, the results obtained were not compared with those of other works reported in the literature. By using specialized software, the authors of [27] obtained the optimal location and operation scheme of BS in an electrical grid, solving a second-order cone programming model with the MATLAB CVX tool. This work used different test systems, but comparison methods were not considered. In [28], a mixed-integer linear programming model was proposed for representing the problem pertaining to the location and operation of BS in electrical networks, in order to reduce investments and CO2 emissions from fossil fuel-based power generation. This work considered different kinds of batteries and load curves, with the aim to analyze the effect of different devices on the operation of an electrical system. Note that the works reported in the literature for reducing CO2 emissions with the operation of BS use specialized software for solving the proposed mathematical models. This is explained by the fact that the mathematical models used are still being built and validated. Therefore, there is a need to propose mathematical models that guarantee the correct operation of the grid when this environmental indicator is used, as well as solutions based on sequential programming methods that avoid the use of specialized software.
By analyzing the state of the art, it was possible to notice that it is currently necessary to propose optimization methodologies that address the problem regarding the optimal location and operation of BS in GCNs with the aim to reduce energy losses and CO2 emissions. Furthermore, these new methodologies must guarantee the best results in terms of technical and environmental indices, with the aim to obtain resilient strategies that consider the needs of the GCN and the community while avoiding the implementation of specialized software, which increases the costs and complexity of the solution methodologies [29]. Furthermore, these methodologies must be compared against other approaches, with the aim to identify the solution methodology with the best performance in terms of solution quality, repeatability, and processing times.
1.3. Scope and Main Contributions
Recognizing the advantage of discretizing continuous optimization methods for solving problems with binary and discrete variables, as well as the current needs to solve the optimal integration problem of BS in GCNs for reducing the energy losses and CO2 emissions, the authors of this paper propose a complete mathematical formulation of the problem regarding the selection, location, and operation of BS in GCN for reducing energy losses and CO2 emissions. All this is conducted while including all constraints related to the electrical network (global power balance and line current and voltage profile limits), conventional and distributed generators (power limits), and BS (discharging and charging power limits and state of charge limits). Furthermore, with the aim to use the high-performance methodologies reported in the literature for solving electrical problems similar to that studied herein, three discrete versions of some optimization methods were used in the master stage. The first of these is the parallel Montecarlo algorithm (PMC) [30], which employs a random search process to find the solution with the best performance while taking advantage of parallel processing, using all workers in the computer to reduce processing times. Moreover, following the suggestions made in the literature, this paper generated two parallel-discrete versions of two continuous optimization methods: the genetic (PDGA) and crow search (PDCSA) algorithms. For the slave stage, the particle optimization algorithm proposed in [31] was adapted. This algorithm was developed for operating batteries in direct current (DC) grids, with no application or validation in alternating current (AC) networks. By combining the three optimization methods proposed in master stage and PSO, it was possible to obtain three new master–slave methodologies for solving the problem under study, namely, PMC/PSO, PDGA/PSO, and PDCSA/PSO (hereinafter called PMC, PDGA, and PDCSA for the sake of simplicity). In addition, with the aim to evaluate the objective function and constraints related to each solution offered by these strategies, aiming for the shortest processing times and the best convergence, this study used the hourly power flow matrix based on successive approximations, as proposed in [23], which allows considering variations in distributed generation and power demand. As a test scenario, an adapted version of the 33-bus test system was used, which represents the technical and environmental conditions of the city of Medellín (Colombia), while considering the operation of three photovoltaic (PV) generators with maximum power point tracking, which is the traditional way to operate renewable generation technology in this country. Finally, to evaluate the performance of the proposed solution methodologies, 1000 executions of each one were carried out, with the aim to evaluate the minimum and average solution, as well as the standard deviation and average processing times. This analysis allowed selecting the optimization methodology with the best performance for solving the problem regarding the optimal integration and operation of BS in GCNs.
The main contributions of this paper regarding academic and industrial applications are described below:
1.3.1. Academic Contributions
- A mathematical model for the optimal integration of BS in GCN whose objective function is the reduction of energy losses and CO2 emissions, observing all of the constraints that represent the operation of a GCN in an environment of variable distributed generation and power demand.
- A discrete codification for the problem regarding the location and selection of BS.
- A continuous codification for the problem regarding the operation of the batteries located in the GCN.
- Three new master–slave strategies (PMC, PDGA, and PDCSA) for solving the problem regarding the optimal integration of BS in GCNs.
- The identification of PMC as the master–slave strategy with the best performance in terms of solution quality and its repeatability and processing times for solving the problem under study. This optimization methodology could be used in future works for the sake of comparison, with the aim to obtain methodologies with a better performance.
1.3.2. Industrial Applications
- A mathematical formulation that allows the grid operators to quantify energy losses and CO2 emissions before and after considering the integration of BS in GCNs.
- An effective and fast optimization method based on sequential programming, which allows determining the location and operation scheme of multiple batteries within the grid, with the purpose of reducing the energy losses and CO2 emissions while observing all operating constraints.
1.4. Paper Organization
The remainder of this paper is organized as follows. Section 2 describes the mathematical formulation of the problem regarding the optimal selection, location, and operation of BS in GCNs. Section 3 presents the proposed master–slave methodologies. Section 4 describes the GCN used as a test scenario and explains the PV generation and demand curves, as well as the technical and operating parameters of the electrical systems located in Medellín. Finally, Section 5 and Section 6, respectively, present the simulation results obtained by the proposed methodologies, as well as the conclusions and future works derived from this research.
2. Mathematical Formulation
In this mathematical formulation, two objective functions are employed which aim for reducing the energy losses and CO2 emissions in GCNs. Furthermore, this section describes all of the constraints related to the technical limitations of the devices that make up the grid, as well as the operation limits associated with voltage profiles and line currents.
The first objective function used in this paper corresponds to the reduction of the energy losses related to energy transport in the GCN, which is presented in Equation (1). Here, and represent the periods of time contained in the horizon under study and the total of nodes that make up the GCN, respectively. Furthermore, and are the magnitude and angle of the admittance of the line that interconnects nodes i and j, respectively. and are the voltage profile magnitudes of buses i and j, while and are their angles, respectively. Finally, is associated with the duration of each period of time (1 h for this work).
As it could be appreciated in Equation (1), this mathematical formulation does not implicitly include the variables associated with the power supplied by the BS. However, the effect of the location and operation of these devices is considered in the nodal voltage profiles included in the equation.
Equation (2) describes the mathematical formulation proposed to represent the second objective function, i.e., the reduction of emissions generated by the power supplied by the conventional and distributed generators located in the grid. In this equation, and are the binary variables, which take a value of 1 if a conventional or distributed generator is located at bus i, respectively; otherwise, they take a value of 0. and are the power supplied by the conventional and distributed generators at bus i in the hour h. and are the emissions factors for the two generation technologies considered in this work. is a variable that represents the behavior of the distributed generator installed at bus i in the hour h. This factor is in p.u. and changes every hour as a function of the technology used and the potential of the renewable energy in the region where the DG is located. In this objective function, the variables associated with the problem of integrating BS in the GCN are implicit.
The BS optimal integration problem is composed of multiple technical and operating constraints, which apply for all buses in the GCN and the period considered in the time horizon analyzed.
The first constraint is associated with the the active power balance in the electrical network. In this equation, is a binary variable that takes the value of 1 or 0 if a battery is located or not at bus i, respectively, while is the active power supplied or demanded by the BS located at bus i in the hour h.
Equation (4) ensures the reactive power balance in the grid. In this equation, and are, respectively, the reactive power generated and demanded by the conventional generators and loads located at bus i in the hour h. By analyzing this equation, it can be noted that this work does not consider the injection of reactive power by the distributed generator and batteries located in the GCN.
The maximum () and minimum () power to be supplied by the conventional generator located at bus i are modeled in Equation (5).
The reactive power limits associated with the conventional generators are presented in (6), where and denote the minimum and maximum reactive power to be supplied by these generators, respectively.
Equation (7) represents the power limits of the distributed generator located at bus i in the hour h. In this equation, and denote the minimum and maximum power, respectively, which are a function of the technology and renewable potential in the region where the generator is located.
The power in the batteries of the electrical system is controlled by Equation (8). The maximum charge and discharge powers are limited by and . To calculate these values, Equation (9) and (10) are used, where is the nominal power capacity of the BS located at bus i, while and are the charge and discharge times, respectively, required by the battery type, which is related to the BS technology.
Equation (11) allows calculating the state of charge at the hour h of the battery located at bus i (). This equation requires the state of charge of the previous hour (), the charging coefficient of the battery located at bus i (), the power supplied or stored by the same battery at the hour h (), and its time of charge or discharge, (). To calculate , Equation (12) is calculated, which is expressed in terms of the previously described parameters. On the other hand, Equations (13) and (14) define the initial () and final () state of charge of the battery located at bus i.
Finally, with the aim to integrate the operating constraints of the electrical distribution system, the mathematical formulation includes Equations (15) and (16), which ensure that the voltage profiles and the current that flows through the lines are within the technical limits set by the electrical operator and the manufacturer. In these equations, and correspond to the minimum and maximum nodal voltage at bus i, respectively, while and are the current flowing through the line that interconnects nodes i and j, respectively, whose maximum level is set during the design of the electrical network.
3. Proposed Solution Methodologies
3.1. Master–Slave Methodology and Codifications Used
To solve the problem regarding the optimal selection, location, and operation of BS in GCNs, this paper proposes the master–slave methodology illustrated in Figure 1.
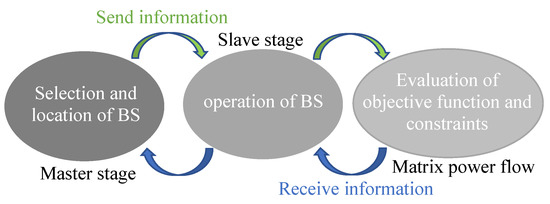
Figure 1.
Proposed master–slave methodology.
The master stage is entrusted with the selection and location of the batteries, a discrete problem that requires identifying the buses and battery types to be installed in the grid. For its codification, a vector of size 1 × 6 was used, where the number of columns corresponds to the three locations and types of batteries be to installed (Section 4). Figure 2 is presented as an example, where three A-, B-, and C-type batteries were located at buses 33, 12, and 3, respectively.

Figure 2.
Codification proposed for selecting and locating batteries in the GCN.
The slave stage is responsible for finding a battery power dispatch that allows for the maximum possible reduction of the objective function, using the location and type of batteries provided by the master stage. To this effect, the codification proposed in Figure 3 is employed. This codification includes a vector of size 1 × 72, in whose columns are 24 variables associated with the states of charge of each battery in the different periods of the time horizon analyzed.

Figure 3.
Codification used to find the operation scheme of the batteries selected and located by the master stage.
Due to the nature of electrical systems, in order to evaluate the impact on energy losses and CO2 emissions, as well as the constraints that make up the problem, it is necessary to determine the power flow for the different periods, with the aim to analyze the effect of the power generated and demanded by the loads, PV generators, and batteries installed in the GCN. After evaluating each period of time and obtaining the values associated with the objective function and constraints, this information is summarized with the aim to evaluate the effect of the batteries on the grid during an average day of operation. A power flow evaluation within a multi-hour scenario is known as an hourly power flow. In this work, a matrix hourly power flow based on successive approximations (MHPF) was selected, given the excellent results reported in [23]. Algorithm 1 describes this method:
| Algorithm 1: Algorithm proposed for the matrix hourly power flow based on successive approximations |
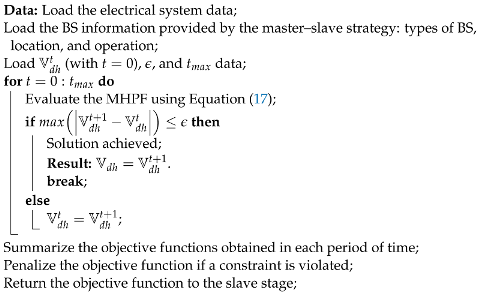 |
In the first step, the MHPF loads the electrical system data described in Section 4. Then, the information provided by the master–slave strategy is loaded (i.e., regarding the selection, location, and operation of the batteries during an average day. Next, these data on the BS are integrated into the hourly power flow, and the voltage profiles for all buses in the 24 h of operation are loaded as 1 < 0 by using , which is a matrix of size , with being the number of demand buses and the entirety of the time period analyzed (24). Furthermore, to control the iterative process, a maximum number of iterations () for the MHPF of 10,000 and a convergence error () of 1 were set. These values allow for a fast convergence and were heuristically selected.
After setting the initial parameters of the algorithm, the iterative process to solve the hourly power flow begins. In each iteration, the hourly power flow is simultaneously evaluated in all periods of time by using Equation (17). This is made possible by the fact that this power flow method uses the Hadamard product (∘) and division (⊘). In this equation, and represent the demand bus voltages in all periods considered in the current and previous iteration. These matrices are of size , where is the number of demand buses and the total of periods in the time horizon analyzed. Furthermore, in this equation, is a matrix of ones, and and correspond to a matrix composed of the power demand and the PV power generated in all periods. These matrices have the same size as . Finally, in this equation, and denote the components of the admittance matrix generated between the demand (d) and slack buses (s), with being the voltage in the slack buses, which are composed of (1 < 0) at all times (i.e., the nominal voltage of the GCN). In each iteration of the MHPF, this equation is evaluated by using the hourly voltage profiles of the current and previous iteration.
Then, in order to evaluate the hourly power flow via Equation (17), the MHPF evaluates the stopping criterion (convergence error). To this effect, the current and previous voltage profiles are compared. If is achieved, the iterative process ends; otherwise, it continues. When or is achieved, the objective function values obtained for the different periods are summarized, obtaining the objective function related to the whole operation day. Furthermore, the constraints associated with each period of time are analyzed. If any of them is violated, a high value is added to the objective function, with the aim to discard the solution from the master–slave strategy. This strategy allows obtaining a solution of good quality that satisfies all of the constraints involved in the studied problem. Finally, the MHPF returns the objective function to the slave stage, with the aim to continue with the iterative process of the master–slave strategy proposed in this work.
3.2. Master Stage
This work used three discrete optimization methods for the master stage: a parallel version of the Montecarlo method (PMC) and two parallel-discrete versions of traditional continuous optimization methods, i.e., the genetic and crow search algorithms. The selection of these methods was based on the excellent results reported in the literature with regard to the solution of similar electrical engineering problems [18,29,32,33]. This subsection outlines the iterative process of each of these algorithms. For a whole description of each algorithm, please refer to the cited papers.
3.2.1. Parallel Montecarlo Method (PMC)
The PMC is a random optimization method that evaluates multiple randomly proposed scenarios, thus allowing for a good-quality solution in a previously defined number of iterations. In each iteration, the PMC generates a population that contains different individuals, each of which represents a possible solution to the problem. After evaluating the objective function of each individual and confirming that it satisfies all constraints, the individual with the best solution (incumbent) is included in an elite list. This, in order to select the best solution from this list at the end of the iterative process. The random exploration of the algorithm allows covering the solution space in reduced processing times with low standard deviation values. The original PMC was proposed in [30]. However, with the aim to obtain the best performance, this paper used a PSO to tune the PMC parameters, as per the suggestions made by [29], obtaining 10 as the maximum number of iterations (). In each iteration, a population of 8 individuals was used, as this is the maximum number of workers in the workstation used. This limitation is explained by the fact that, in parallel processing, a population size higher than the number of workers is not recommended, as this does not ensure a single parallel process. This limitation applies to all solution algorithms used in this work. The iterative process of the PMC is presented in Algorithm 2 and described below.
| Algorithm 2: Algorithm proposed for the PMC |
 |
The PMC employs an iterative process that generates a random population by using the discrete codification proposed in Figure 2. After that, using the location and battery type proposed by each individual, the slave stage is used to evaluate the objective function. This stage uses PSO and the MHPF to find the power schedule (supply or storage) of the batteries in the GCN. This also includes the aim to obtain the minimum possible objective function (energy losses or CO2 emissions), satisfying the set of constraints that compose the problem under study. Therefore, each individual of the population must be processed by the slave stage, which implies long processing times. This is addressed by using parallel processing, with the aim to evaluate multiple individuals at the same time. After evaluating the objective function values of the population, the best solution is included in the elite list, a process that is repeated iteration to iteration until the maximum number of iterations is reached. When this occurs, the best solution of the elite list is selected as the solution to the problem. This solution contains the location, selection, and operation of the batteries for a day which yields the lowest objective function value.
3.2.2. Parallel-Discrete Genetic Algorithm (PDGA)
The parallel-discrete version of the genetic algorithm performs the selection, recombination, and mutation steps of traditional genetic algorithms (GA). However, this discrete version of the GA uses the codification proposed in Figure 2 and adapts the recombination and mutation steps to work with discrete variables, but the nature of the process is the same [23]. Algorithm 3 describes the iterative process of the PDGA.
| Algorithm 3: Iterative process of the PDGA |
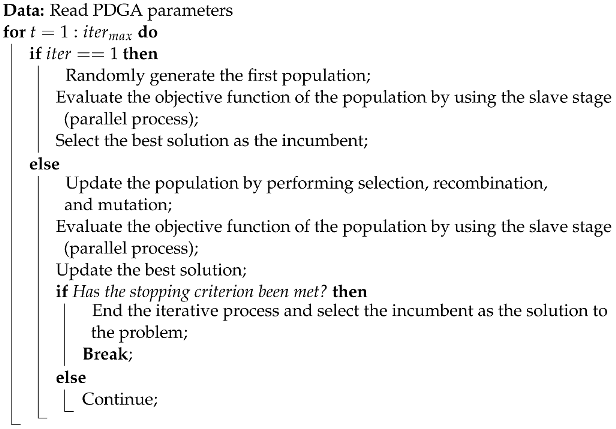 |
The PDGA starts by reading all of its parameters. In the particular case of this work, a population size of 8 individuals was used, as well as a recombination of 1 point and the mutation of 1 individual, and, as a stopping criterion, an of 1000 was employed. The tuning process of this algorithm was carried out with the same PSO used for PMC. This algorithm generates the first population by using the codification in Figure 2 and a random process. Subsequently, the objective function of each individual is evaluated by using the slave stage and the MHPF. With this information, the individual with the lowest objective function value is selected as the incumbent of the problem.
From the second iteration until the iterative process ends, the PDGA updates the population via selection, recombination, and mutation. Then, the objective function and constraints of each individual are calculated. Based on this information, the incumbent of the problem is updated (the best solution). After that, the stopping criterion () is evaluated. If it is met, the iterative process ends, and the incumbent is selected as the solution to the problem; otherwise, the algorithm continues. It is important to highlight that, as in the PMC, the incumbent contains the location, types, and operation scheme of the batteries that allow obtaining the lowest possible objective functions.
3.2.3. Parallel-Discrete Crow Search Algorithm (PDCSA)
The parallel-discrete version of the crow search algorithm uses the hunting strategies of crows and takes advantage of parallel processing to evaluate the objective function in each iteration of the algorithm. The iterative process of the PDCSA is presented in Algorithm 4 and described below.
| Algorithm 4: Iterative process of the PDCSA |
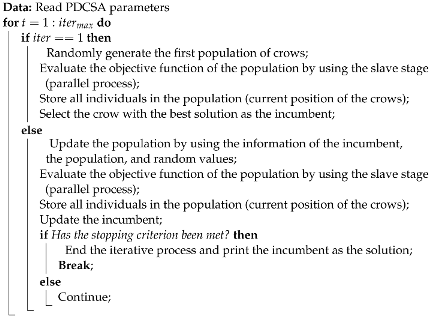 |
The conventional CSA works with a population of crows that, iteration to iteration, take the decision to follow the leader or go their own way [34,35]. In the first iteration, the PDCSA reads the parameters and randomly generates the initial population by using the discrete codification proposed in Figure 2. Then, as with the PMC and the PDGA, this optimization algorithm evaluates the objective function of the population via the slave stage and a parallel process. Subsequently, the information of all individuals is stored, and the crow with the best solution is selected as the incumbent, i.e., the leader.
From the second iteration until the iterative process ends, the position of all crows is updated. In other words, the information of the population is renewed. To this effect, each individual decides to follow the leader or take a different path. This is made possible by using a random value. In this case, if the random value is higher than 0.5, the crow follows the leader; otherwise, its position is updated by using random values between the maximum and minimum ones allowed (number of buses and battery types). After updating the position of the crows, these values are stored and the incumbent is updated. Subsequently, it is verified whether the maximum number of iterations has been met. If this is true, the iterative process ends, and the incumbent is printed as the solution; otherwise, the algorithm continues.
As with the other solution methodologies employed in the master stage, the PDCSA was tuned via the PSO suggested in [29]. Thus, a population size of 8 individuals and a maximum number of iterations of 1000 were obtained.
3.3. Slave Stage
For solving the problem regarding the optimal operation of BS in GCN, this paper uses the PSO proposed in [31], given the excellent results reported by the authors. Furthermore, as the Montercalo method and the genetic and crow search algorithms have been traditionally used the in the literature for solving continuous problems, as is the case of the one studied herein, these optimization methods were validated in this research, with a low performance in comparison with PSO. Additionally, to obtain these results, it is necessary to present a lot of information that does not contribute to the state of the art. For this reason, only PSO was used in the slave stage, which is presented in Algorithm 5 and described below.
| Algorithm 5: Iterative process proposed for the PSO used in the slave stage |
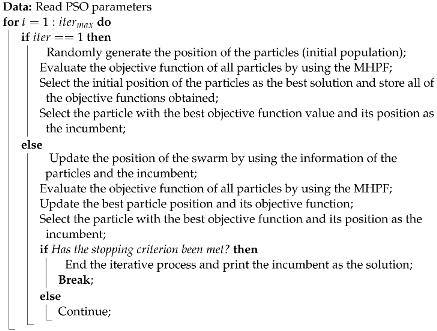 |
The PSO used to solve the problem under study starts by reading the optimizer parameters. Using the same methodology as the master stage, the following values were obtained: a population of 60 individuals, a maximum number of iterations of 971, a cognitive constant of 1.5922, a social constant of 2, and an initial and final inertia of 0.0022 and 0.0477, respectively. Note that the PSO does not consider the population size as the maximum number of workers; it does not employ parallel processing.
In order to read the initial parameters, the PSO generates the initial population by randomly spreading the particles throughout the solution space. This step is carried out by using the codification presented in Figure 3, which assigns the state of charge for each period of operation for the three batteries located by the master stage. After that, the objective functions of all particles are evaluated by using the MHPF and observing all constraints. If any constraint is violated, the objective function is penalized with a value of 100,000. This value was heuristically obtained for both objective functions under study. With the values of the objective functions, the first iteration selects the initial position of the particles as the best solution and stores all of these values as the best ones found by each particle. Furthermore, it selects the particle with the best objective function as the incumbent, storing its location and objective function value.
From the second iteration until the end of the iterative process, the location of the particle swarms is updated by using the information on the best particle position and the incumbent. Then, the objective function of the swarms is calculated by analyzing the constraints in order to penalize any solution that violates the technical and operating limits. With the objective function values, the best position and objective function of the particles are updated, as well as the incumbent of the problem. Subsequently, it is verified whether the stopping criterion has been met. If this is true, the iterative process ends, and the incumbent returns to the master stage with the power dispatch of the BS located in the GCN; otherwise, the iterative process continues until the maximum number of iterations is reached, sending the information of the last incumbent to the master stage.
4. Test Scenarios and Considerations
Figure 4 presents the electrical diagram of the GCN used in this work.

Figure 4.
Electrical diagram of the GCN.
Table 1 describes the electrical parameters of the test system regarding line and power demand capacity. This table presents, from left to right, the line number l, the sending bus i, the receiving bus j, the resistance and reactance of the line that interconnects buses i and j, the active and nominal power demanded at bus j, and the maximum current allowed by each line considered. Furthermore, for the voltage profile limits, this paper follows the Colombian electrical regulations for electrical distribution networks, which stipulates a bus voltage variation of +/− 10% of the main generator’s nominal voltage [36]. In this particular case, the nominal and base voltage is 12.66 kV, with a base power of 100 kW.

Table 1.
Technical parameters of the 33-node test system (urban network).
In this figure, it can be noted that this work proposes a modified version of the 33-bus test system, which is highly used in the literature to validate planing and operation strategies in electrical distribution networks [37,38,39]. The test scenario employed considers the power energy solar production, power demand, and CO2 emissions from conventional generators (electrical grid) of the city of Medellín (Colombia), as well as PV-DGs and three different kinds of lithium-ion batteries (types A, B, and C), with different power capacities and charge and discharge times [27]. Lithium-ion batteries are a type of rechargeable battery which uses the reversible reduction of lithium ions to store energy. They are highly used in the literature because they have a higher energy density, a higher efficiency, and a longer useful life. Traditional lead acid batteries allow 1500 life-cycles, while lithium battery technology offers a duration of up to 2500 [40].
In the test system used, the PV-DGs were located at buses 13, 25, and 36, with nominal power capacities of 1.125, 1.320, and 0.999 MW, respectively [29]. The behavior of the solar energy production and power demand of Medellín was taken from [23]. In the particular case of PV generation, the temperature and solar radiation data reported by NASA [41] were used, as well as technical data on the polycrystalline PV panels, in order obtain a curve that represents the average behavior of the solar production in an average operation day (see Figure 5a). Furthermore, this study obtained a power demand curve that represents the average behavior of the users in Medellín by using power demand data reported by the local operator, Empresas Públicas de Medellín, [42] (see Figure 5b). All of the data used to elaborate these curves correspond to 2019. This year was selected with the aim to eliminate the effect of the COVID-19 pandemic on power consumption.
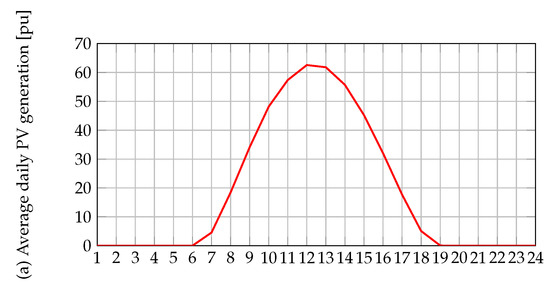
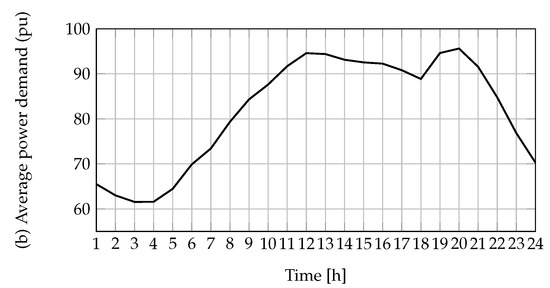
Figure 5.
Average daily PV power generation power demand in the city of Medellín (Colombia).
This work considered three kinds of lithium-ion batteries, denoted with types A, B, and C. Table 2 describes the technical parameters of the BS employed. It presents, from left to right, the type of BSS, the nominal capacity in kWh, and the charge and discharge time in hours. With these values and the equations presented in Section 2 of this manuscript, it is possible to obtain all parameters for the operation of the batteries [18]. As the maximum and minimum SOC for these batteries, the following limits were set for the lithium-ion batteries [17]: 0.1 (10%) and 0.9 (90%), respectively. Finally, to obtain the best performance out of the BS, an initial and final state of charge of 0.5 (50%) was used, following the suggestions made in [31].

Table 2.
Parameters of the batteries.
Finally, in order to calculate the CO2 emissions associated with the generators located in the grid, this work considered 0.1644 kg of CO2 per kWh as the emissions factor for the conventional generators, as well as a value of 0 kg of CO2 per kWh for the PV-DGs, as this kind of generator does not emit greenhouse gases or release carbon-based pollutants when producing energy [43]. The authors of this paper acknowledge the environmental impact of constructing PV modules, just as well as the fact that this technology does not affect environmental conditions when used for generating energy.
5. Simulation Results
This section presents the simulation results obtained after evaluating the master–slave methodologies proposed for solving the problem regarding the optimal integration of BS in GCNs with the aim to reduce energy losses and CO2 emissions. All simulations were carried out in the Matlab 2023 software, on a Dell Workstation with an Intel(R) Xeon(R) E5-1660 v3 3.0 GHz processor, 16 GB DDR4 RAM, and a 480 GB 2.5″ solid state hard drive, with 8 workers running on Windows 11 Pro. All simulations were executed 1000 times in order to evaluate performance in terms of the average solution and processing times, as well as regarding the standard deviation.
Table 3 presents the minimum solutions (i.e., the highest reduction in the objective function) and the average reductions achieved by the three different master–slave methodologies, as well as the standard deviation and the average processing times.

Table 3.
Simulation results obtained by the proposed master–slave methodologies.
To analyze the impact of the master–slave strategies on the GNC, the energy losses and CO2 emissions were analyzed without considering the BS installed in the grid. Thus, the base scenario involved variable power demand and the PV distributed generators operating in maximum power point tracking (MPPT) mode (Figure 5). This scenario obtained values of 2484.5746 kWh for energy losses and 9887.4082 kg of CO2 (9.88 Ton) for the CO2 emissions.
Figure 6a compares these values against those of the PMC, PDGA, and PDCSA. This figure presents the minimum and average reductions obtained by the solution methodologies for both objective functions with regard to the base case. Note that all solution methods reduce the objective functions. In the particular case of Eloss, a minimum reduction of 130.0287 kWh was obtained, while the average reduction was 117.5107 kWh (5.2334% and 4.72961%, respectively). These reductions are significant for the GCN; in order to highlight their importance, note that they imply a reduction of 42.8914 MWh for a year of operation.
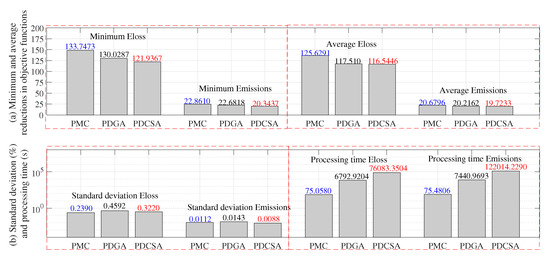
Figure 6.
Reductions obtained by the proposed master–slave methodologies regarding the base case: (a) minimum and average reductions of the objective function and (b) standard deviation (percentage) and processing times.
The obtained emissions reductions are presented in Figure 6a. In the particular case of the minimum emissions, the master–slave strategies obtained an average a value of 22.6818 kg of CO2. The average reduction in this environmental index (after 100 executions) was 20.2162 kg of CO2. With respect to the base case, these values correspond to reductions of 0.2294% and 0.2044%, respectively. As in the case of the , considering a year of operation, the optimization methods would achieve a total reduction of 7.37 Ton of CO2 on average, thus demonstrating the environmental importance and effectiveness of the integration, selection, and smart operation of BS in GCNs.
Finally, Figure 6b presents the standard deviation and the processing times required by the solution methodologies. In terms of the former, average values of 0.3220% and 0.0112% were obtained for and , respectively. These values demonstrate the repeatability of the methodologies under study. In terms of the processing times, average times of 6792.9204 () and 7440.969347 s () were obtained. These processing times are short given the complexity of the problem and its large solution space, and these values show the importance of the matrix hourly power flow used for calculating the objective functions and constraints in all evaluated scenarios.
Figure 6 highlights, in blue and red, the methods with the best and worst performance, respectively. By analyzing this figure, it is possible to appreciate that, in all indicators, the PMC achieved the best results, which makes it the best solution method among those analyzed in this study. Figure 7 illustrates the improvements obtained by the PMC when compared to the other solution methods.
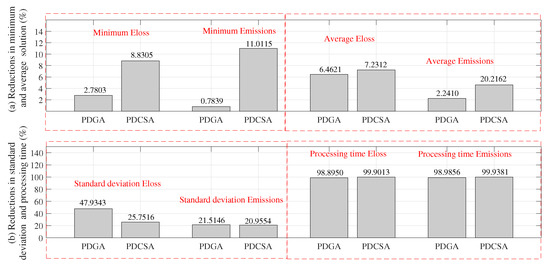
Figure 7.
Percent reductions obtained by the PMC with regard to the other comparison methods: (a) in the minimum and average objective function values, (b) in the standard deviation and processing times.
Figure 7a presents the reductions obtained by the PMC with regard to the minimum objective function values, i.e., 5.8054% and 5.8977% when compared to the other solution methodologies. Furthermore, the PMC achieved reductions of 6.8467% and 3.4328% in the average and , respectively. By analyzing the standard deviation, it is possible to calculate average reductions of 36.8430% and 21.2350% in and . Finally, the PMC is the fastest solution method, as its processing times for calculating the and were reduced by 99.3982% and 99.4618%, respectively, thus demonstrating the superiority of the PMC with respect to the PDGA and the PDCSA.
Finally, with the purpose of demonstrating that the PMC satisfies all technical and operating limits set for the GCN located in Medellín, Figure 8, Figure 9 and Figure 10 are presented. It is important to highlight that all master–slave strategies in this paper satisfy the technical and operating constraints associated with a GCN in an environment of DERs. However, this article only describes and analyzes the technical and operating behavior of the PMC, as explaining the performance of the other methods would require a lot of unnecessary information. Furthermore, in future works, comparisons should only be made with the most efficient method, which is the PMC.
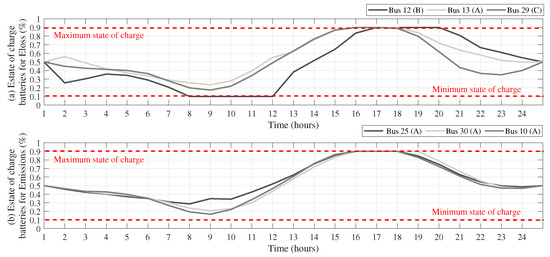
Figure 8.
State of charge set by the PMC: reductions in (a) energy losses and (b) CO2 emissions.
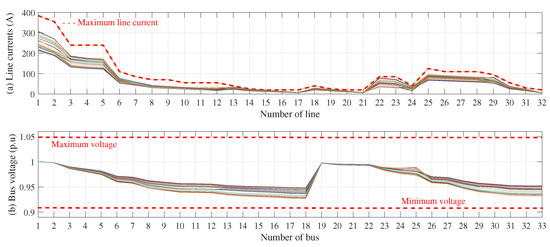
Figure 9.
Values obtained by the PMC regarding energy loss reductions: (a) line current (A), (b) bus voltage (p.u.).
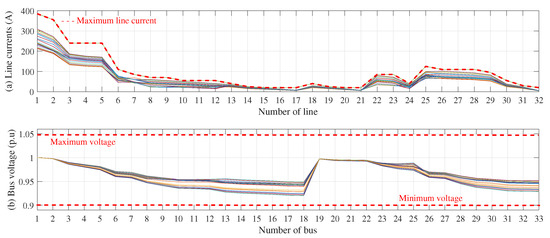
Figure 10.
Values obtained by the PMC regarding CO2 emissions reductions: (a) line current (A), (b) bus voltage (p.u.).
Figure 8 describes the dynamics of the state of charge of the three BS integrated into the GCN, considering an average day of power demand and PV generation in Medellín. It is important to highlight that, following the suggestions made in [31] for obtaining the best performance of the batteries, all BS start and finish with 0.5 (50%) of the SOC. Figure 8a illustrates that, for , BS were installed at buses 12, 13, and 29 (types B, A, and C, respectively). Note that the behavior of the power supplied is similar for all three batteries, with low dynamics in the first hours, complete charging before hour 17—when the power demand of the system increases—and maximum demand on hour 20. The battery installed at bus 12 supplies energy until it achieves the final state of charge (50%), the battery at bus 13 achieves the final SOC on hour 24, and the one at bus 29 supplies energy until hour 23, starting its charging process until the last hour of the horizon, when it achieves the final SOC. Note that, according to this figure, all BS satisfy their maximum and minimum SOC of lithium-ion batteries: 0.1 (10%) and 0.9 (90%), respectively.
The operation of the BS regarding the reduction of CO2 emissions is illustrated in Figure 8b. In this case, the BS were located at buses 25, 30, and 10 (all of them type A). The batteries follow the same dynamics: they start at 50% SOC, discharging all batteries until hour 9. They start the charging process from this hour until hour 16, and they discharge until hour 24, achieving the final SOC (50%). The batteries satisfy the state-of-charge limits at all times.
Finally, Figure 9 and Figure 10 present the line currents and voltage profiles for the different operation hours. By analyzing the current limits, it is possible to note that the maximum line current limits are satisfied at all times. In the same way, all voltage profiles are within the voltage limits set for the GCN (+/− 10% of the nominal voltage: 1 p.u.).
The above demonstrates that the solution obtained by the PMC with regard to the objective functions satisfies all operating and technical constraints of the mathematical model for the problem studied herein.
6. Conclusions and Future Work
This work formulated the problem regarding the optimal integration and operation of BS in GCN in order to reduce energy losses and CO2 emissions. As solution methods, three different master–slave methodologies were proposed. In the master stage, the PMC, PDGA, and PDCSA were employed for selecting and locating three different BS types in a GCN. Furthermore, the slave stage used PSO for the operation of the batteries, as well as a matrix hourly power flow to calculate the objective functions and evaluate the technical and operating constraints involved in the mathematical formulation. Finally, with the aim to identify the solution methodology with the best performance, each algorithm was executed 1000 times, analyzing the best and average solutions, the standard deviation, and the processing times. The 33-bus test system was used for validation, which was adapted to represent the power demand and PV power generation of the city of Medellín (Colombia). This city constitutes an excellent test scenario, given its high energy losses and CO2 emissions levels, as well as its excellent conditions for PV generation (this kind of renewable energy is widely used in the city). In this paper, the PV-DGs were considered to operate in maximum power point tracking mode, with the aim to make the best out of this resource.
All methods achieved excellent results in terms of solution quality and processing times. The master–slave strategies obtained average reductions of 4.72% and 0.20% regarding energy losses and CO2 emissions for an average operation day, respectively. These reductions are equivalent to 42.89 MWh and 7.37 Ton of CO2 in a year of operation. These values are significant for the operation of grid-connected electrical distribution systems, as they imply commercial and environmental benefits. In addition, the proposed solution methodologies reported a low standard deviation, with average values of 0.3220% and 0.01124% for energy losses and CO2 emissions, respectively. Moreover, in a problem as demanding as the integration of BS in GCN, the implementation of a matrix hourly power flow based on successive approximations allowed reducing the processing times by about 68%, with values of 6792.92 and 7440.969347 s regarding energy losses and CO2 emissions. With this information, it can be concluded that these strategies allow solving the problem regarding the selection, location, and operation of multiple BS in a GCN in about 2 h, which allows electrical operators to evaluate multiple generation and demand scenarios, as well as different electrical systems, in reduced times, which is very important for public bidding processes.
The above demonstrates that all master–slave strategies are suitable for solving the problem under study. However, the PMC was the best solution methodology in terms of solution quality, repeatability, and processing time, for which it obtained average reductions of 5.13%, 29.03%, and 99.42%, respectively.
The main limitation associated with the proposed methodology corresponds to the implementation of single-objective optimization algorithms, which is why a multi-objective analysis is not possible. However, the proposed methodologies obtained the best results regarding the reduction of energy losses and CO2 emissions.
Future work could consider the implementation of new optimization methods that allow improving the results reported in this paper. Furthermore, it is possible to include variations in the power supplied by the PV generators, with the aim to achieve the best solution quality. This, while allowing for the relocation of PV generators in the GCN. In addition, other kinds of distributed energy resources could be included, such as capacitors and reactive static compensators, among others, with the aim to increase the reductions in energy losses and CO2 emissions. Finally, the mathematical formulation could include economical indicators with regard to the cost of the BS, by using multi-objective functions that consider the improvement of technical, economical, and environmental indicators.
Author Contributions
Conceptualization, methodology, software, and writing (review and editing), L.F.G.-N., O.D.M. and A.-J.P.-M. All authors read and agreed to the published version of the manuscript.
Funding
This research received no external funding.
Acknowledgments
This research was supported by University of Talca (Chile), Universidad Distrital Francisco José de Caldas (Colombia), and Universidad de Córdoba (España).
Conflicts of Interest
The authors declare no conflict of interest.
Abbreviations
| BS | Battery systems. |
| GCN | Grid-connected network. |
| PV | Photovoltaic. |
| DG | Distributed generator. |
| PMC | Parallel-discrete version of the Montecarlo method. |
| PDGA | Parallel-discrete version of the genetic algorithm. |
| PDSCA | Parallel-discrete version of the search crow algorihm. |
| PSO | Particle swarm optimization algorithm. |
| CO2 | Carbon dioxide. |
| GAMS | General Algebraic Modeling System. |
References
- Kumar, C.M.S.; Singh, S.; Gupta, M.K.; Nimdeo, Y.M.; Raushan, R.; Deorankar, A.V.; Kumar, T.A.; Rout, P.K.; Chanotiya, C.; Pakhale, V.D.; et al. Solar energy: A promising renewable source for meeting energy demand in Indian agriculture applications. Sustain. Energy Technol. Assessments 2023, 55, 102905. [Google Scholar] [CrossRef]
- Ahmadipour, M.; Othman, M.M.; Salam, Z.; Alrifaey, M.; Ridha, H.M.; Veerasamy, V. Optimal load shedding scheme using grasshopper optimization algorithm for islanded power system with distributed energy resources. Ain Shams Eng. J. 2023, 14, 101835. [Google Scholar] [CrossRef]
- Henrique, L.F.; Silva, W.N.; Silva, C.C.; Dias, B.H.; Oliveira, L.W.; de Almeida, M.C. Optimal siting and sizing of distributed energy resources in a Smart Campus. Electr. Power Syst. Res. 2023, 217, 109095. [Google Scholar] [CrossRef]
- Gómez, J.C.; Morcos, M.M. Impact of EV battery chargers on the power quality of distribution systems. IEEE Trans. Power Deliv. 2003, 18, 975–981. [Google Scholar] [CrossRef]
- Qian, K.; Zhou, C.; Allan, M.; Yuan, Y. Modeling of load demand due to EV battery charging in distribution systems. IEEE Trans. Power Syst. 2010, 26, 802–810. [Google Scholar] [CrossRef]
- Resch, M.; Buehler, J.; Klausen, M.; Sumper, A. Impact of operation strategies of large scale battery systems on distribution grid planning in Germany. Renew. Sustain. Energy Rev. 2017, 74, 1042–1063. [Google Scholar] [CrossRef]
- Zichen, W.; Changqing, D. A comprehensive review on thermal management systems for power lithium-ion batteries. Renew. Sustain. Energy Rev. 2021, 139, 110685. [Google Scholar] [CrossRef]
- Twaha, S.; Ramli, M.A. A review of optimization approaches for hybrid distributed energy generation systems: Off-grid and grid-connected systems. Sustain. Cities Soc. 2018, 41, 320–331. [Google Scholar] [CrossRef]
- Ramadesigan, V.; Northrop, P.W.; De, S.; Santhanagopalan, S.; Braatz, R.D.; Subramanian, V.R. Modeling and simulation of lithium-ion batteries from a systems engineering perspective. J. Electrochem. Soc. 2012, 159, R31. [Google Scholar] [CrossRef]
- Allison, J. Robust multi-objective control of hybrid renewable microgeneration systems with energy storage. Appl. Therm. Eng. 2017, 114, 1498–1506. [Google Scholar] [CrossRef]
- Yang, Y.; Bremner, S.; Menictas, C.; Kay, M. Battery energy storage system size determination in renewable energy systems: A review. Renew. Sustain. Energy Rev. 2018, 91, 109–125. [Google Scholar] [CrossRef]
- Sharma, P.; Naidu, R.C. Optimization techniques for grid-connected pv with retired ev batteries in centralized charging station with challenges and future possibilities: A review. Ain Shams Eng. J. 2022, 101985. [Google Scholar] [CrossRef]
- Grisales-Noreña, L.F.; Restrepo-Cuestas, B.J.; Cortés-Caicedo, B.; Montano, J.; Rosales-Muñoz, A.A.; Rivera, M. Optimal Location and Sizing of Distributed Generators and Energy Storage Systems in Microgrids: A Review. Energies 2023, 16, 106. [Google Scholar] [CrossRef]
- Khezri, R.; Mahmoudi, A.; Aki, H. Optimal planning of solar photovoltaic and battery storage systems for grid-connected residential sector: Review, challenges and new perspectives. Renew. Sustain. Energy Rev. 2022, 153, 111763. [Google Scholar] [CrossRef]
- Kumar, N.M.; Chopra, S.S.; Chand, A.A.; Elavarasan, R.M.; Shafiullah, G. Hybrid renewable energy microgrid for a residential community: A techno-economic and environmental perspective in the context of the SDG7. Sustainability 2020, 12, 3944. [Google Scholar] [CrossRef]
- Naderipour, A.; Kamyab, H.; Klemeš, J.J.; Ebrahimi, R.; Chelliapan, S.; Nowdeh, S.A.; Abdullah, A.; Marzbali, M.H. Optimal design of hybrid grid-connected photovoltaic/wind/battery sustainable energy system improving reliability, cost and emission. Energy 2022, 257, 124679. [Google Scholar] [CrossRef]
- Wang, P.; Wang, W.; Xu, D. Optimal sizing of distributed generations in DC microgrids with comprehensive consideration of system operation modes and operation targets. IEEE Access 2018, 6, 31129–31140. [Google Scholar] [CrossRef]
- Grisales-Noreña, L.; Montoya, O.D.; Gil-Gonzalez, W. Integration of energy storage systems in AC distribution networks: Optimal location, selecting, and operation approach based on genetic algorithms. J. Energy Storage 2019, 25, 100891. [Google Scholar] [CrossRef]
- Wei, C.; Fadlullah, Z.M.; Kato, N.; Stojmenovic, I. On optimally reducing power loss in micro-grids with power storage devices. IEEE J. Sel. Areas Commun. 2014, 32, 1361–1370. [Google Scholar] [CrossRef]
- Yuan, Z.; Wang, W.; Wang, H.; Yildizbasi, A. A new methodology for optimal location and sizing of battery energy storage system in distribution networks for loss reduction. J. Energy Storage 2020, 29, 101368. [Google Scholar] [CrossRef]
- Karanki, S.B.; Xu, D.; Venkatesh, B.; Singh, B.N. Optimal location of battery energy storage systems in power distribution network for integrating renewable energy sources. In Proceedings of the 2013 IEEE Energy Conversion Congress and Exposition, Denver, CO, USA, 15–19 September 2013; pp. 4553–4558. [Google Scholar]
- Mohamed, S.; Shaaban, M.F.; Ismail, M.; Serpedin, E.; Qaraqe, K.A. An efficient planning algorithm for hybrid remote microgrids. IEEE Trans. Sustain. Energy 2018, 10, 257–267. [Google Scholar] [CrossRef]
- Grisales-Noreña, L.F.; Rosales-Muñoz, A.A.; Cortés-Caicedo, B.; Montoya, O.D.; Andrade, F. Optimal Operation of PV Sources in DC Grids for Improving Technical, Economical, and Environmental Conditions by Using Vortex Search Algorithm and a Matrix Hourly Power Flow. Mathematics 2023, 11, 93. [Google Scholar] [CrossRef]
- Revankar, S.R.; Kalkhambkar, V.N. Grid integration of battery swapping station: A review. J. Energy Storage 2021, 41, 102937. [Google Scholar] [CrossRef]
- Zhan, W.; Wang, Z.; Zhang, L.; Liu, P.; Cui, D.; Dorrell, D.G. A review of siting, sizing, optimal scheduling, and cost-benefit analysis for battery swapping stations. Energy 2022, 124723. [Google Scholar] [CrossRef]
- Molina-Martin, F.; Montoya, O.D.; Grisales-Noreña, L.F.; Hernández, J.C.; Ramírez-Vanegas, C.A. Simultaneous minimization of energy losses and greenhouse gas emissions in AC distribution networks using BESS. Electronics 2021, 10, 1002. [Google Scholar] [CrossRef]
- Gil-González, W.; Montoya, O.D.; Grisales-Noreña, L.F.; Escobar-Mejía, A. Optimal Economic–Environmental Operation of BESS in AC Distribution Systems: A Convex Multi-Objective Formulation. Computation 2021, 9, 137. [Google Scholar] [CrossRef]
- Terlouw, T.; AlSkaif, T.; Bauer, C.; van Sark, W. Multi-objective optimization of energy arbitrage in community energy storage systems using different battery technologies. Appl. Energy 2019, 239, 356–372. [Google Scholar] [CrossRef]
- Grisales-Noreña, L.F.; Gonzalez Montoya, D.; Ramos-Paja, C.A. Optimal sizing and location of distributed generators based on PBIL and PSO techniques. Energies 2018, 11, 1018. [Google Scholar] [CrossRef]
- Martinez, J.A.; Guerra, G. A parallel Monte Carlo method for optimum allocation of distributed generation. IEEE Trans. Power Syst. 2014, 29, 2926–2933. [Google Scholar] [CrossRef]
- Grisales-Noreña, L.F.; Montoya, O.D.; Ramos-Paja, C.A. An energy management system for optimal operation of BSS in DC distributed generation environments based on a parallel PSO algorithm. J. Energy Storage 2020, 29, 101488. [Google Scholar] [CrossRef]
- Abdelaziz, A.Y.; Fathy, A. A novel approach based on crow search algorithm for optimal selection of conductor size in radial distribution networks. Eng. Sci. Technol. Int. J. 2017, 20, 391–402. [Google Scholar] [CrossRef]
- da Cruz Souza, J.; Soares, S.F.; de Paula, L.C.M.; Coelho, C.J.; de Araújo, M.C.U.; da Silva, E.C. Bat algorithm for variable selection in multivariate classification modeling using linear discriminant analysis. Microchem. J. 2023, 187, 108382. [Google Scholar] [CrossRef]
- Askarzadeh, A. A novel metaheuristic method for solving constrained engineering optimization problems: Crow search algorithm. Comput. Struct. 2016, 169, 1–12. [Google Scholar] [CrossRef]
- Grisales-Noreña, L.F.; Cortés-Caicedo, B.; Alcalá, G.; Montoya, O.D. Applying the Crow Search Algorithm for the Optimal Integration of PV Generation Units in DC Networks. Mathematics 2023, 11, 387. [Google Scholar] [CrossRef]
- Instituto Colombiano de Normas Técnicas y Certificación (ICONTEC). TENSIONES Y FRECUENCIA NOMINALES EN SISTEMAS DE ENERGÍA ELÉCTRICA EN REDES DE SERVICIO PÚBLICO NTC1340. Bogotá DC 2004. [Google Scholar]
- Noreña, L.F.G.; Rivera, O.D.G.; Toro, J.A.O.; Paja, C.A.R.; Cabal, M.A.R. Metaheuristic optimization methods for optimal power flow analysis in DC distribution networks. Trans. Energy Syst. Eng. Appl. 2020, 1, 13–31. [Google Scholar] [CrossRef]
- Dolatabadi, S.H.; Ghorbanian, M.; Siano, P.; Hatziargyriou, N.D. An enhanced IEEE 33 bus benchmark test system for distribution system studies. IEEE Trans. Power Syst. 2020, 36, 2565–2572. [Google Scholar] [CrossRef]
- Shawon, S.M.R.H.; Liang, X.; Janbakhsh, M. Optimal Placement of Distributed Generation Units for Microgrid Planning in Distribution Networks. IEEE Trans. Ind. Appl. 2023. [Google Scholar] [CrossRef]
- May, G.J.; Davidson, A.; Monahov, B. Lead batteries for utility energy storage: A review. J. Energy Storage 2018, 15, 145–157. [Google Scholar] [CrossRef]
- NASA. NASA Prediction Of Worldwide Energy Resources, Washington, D.C., United States. Available online: https://power.larc.nasa.gov/ (accessed on 21 January 2023).
- XM SA ESP. Sinergox Database, Colombia. Available online: https://sinergox.xm.com.co/Paginas/Home.aspx (accessed on 21 January 2023).
- Tawalbeh, M.; Al-Othman, A.; Kafiah, F.; Abdelsalam, E.; Almomani, F.; Alkasrawi, M. Environmental impacts of solar photovoltaic systems: A critical review of recent progress and future outlook. Sci. Total Environ. 2021, 759, 143528. [Google Scholar] [CrossRef]
Disclaimer/Publisher’s Note: The statements, opinions and data contained in all publications are solely those of the individual author(s) and contributor(s) and not of MDPI and/or the editor(s). MDPI and/or the editor(s) disclaim responsibility for any injury to people or property resulting from any ideas, methods, instructions or products referred to in the content. |
© 2023 by the authors. Licensee MDPI, Basel, Switzerland. This article is an open access article distributed under the terms and conditions of the Creative Commons Attribution (CC BY) license (https://creativecommons.org/licenses/by/4.0/).