Article

An Unsupervised Rapid Network Alignment Framework via Network Coarsening

1
School of Mathematics and Computer Science, Tongling University, Tongling 244061, China
2
School of Computer Science and Technology, Anhui University, Hefei 230601, China
*
Author to whom correspondence should be addressed.
Mathematics 2023, 11(3), 573; https://doi.org/10.3390/math11030573
Submission received: 22 November 2022 / Revised: 13 January 2023 / Accepted: 19 January 2023 / Published: 21 January 2023
(This article belongs to the Special Issue Soft Computing and Uncertainty Learning with Applications)

Abstract

:
Network alignment aims to identify the correspondence of nodes between two or more networks. It is the cornerstone of many network mining tasks, such as cross-platform recommendation and cross-network data aggregation. Recently, with the development of network representation learning techniques, researchers have proposed many embedding-based network alignment methods. The effect is better than traditional methods. However, several issues and challenges remain for network alignment tasks, such as lack of labeled data, mapping across network embedding spaces, and computational efficiency. Based on the graph neural network (GNN), we propose the URNA (unsupervised rapid network alignment) framework to achieve an effective balance between accuracy and efficiency. There are two phases: model training and network alignment. We exploit coarse networks to accelerate the training of GNN after first compressing the original networks into small networks. We also use parameter sharing to guarantee the consistency of embedding spaces and an unsupervised loss function to update the parameters. In the network alignment phase, we first use a once-pass forward propagation to learn node embeddings of original networks, and then we use multi-order embeddings from the outputs of all convolutional layers to calculate the similarity of nodes between the two networks via vector inner product for alignment. Experimental results on real-world datasets show that the proposed method can significantly reduce running time and memory requirements while guaranteeing alignment performance.

1. Introduction

In the real world, distinct objects as nodes link and communicate through certain established relationships, organizing and building various networks, such as citation networks, social networks, and protein–protein interaction (PPI) networks. Many network data mining tasks involve converging data from multiple networks for joint analysis to receive further information about objects. For instance, analyzing evolutionary relationships between various species requires comparing different PPI network structures [1], detecting money laundering requires collecting transaction records of suspects across various financial platforms [2], and personalized recommendation across platforms requires identifying accounts of users across various social media platforms [3].
Network alignment is the first problem faced when fusing data from multiple networks. The main goal is to identify the node correspondence between two or more networks through analysis of network structure and node attributes, which is the basis of multi-source information fusion [4]. Earlier works mainly rely on explicit node similarity computation and iterative matching optimization for network alignment, resulting in limited alignment effects [5]. Since network representation learning approaches outperform other methods in network feature extraction, researchers have applied network representation learning techniques to solve network alignment in recent years [6].
By constraining proximity between nodes, network representation learning (aka network embedding) learns a low-dimensional vector for each node, and the learned node embeddings contain implicit features of the network [7]. Network embedding techniques have provided novel solutions to network alignment. While solving the network alignment, researchers typically model it as a three stage process. The first stage is to learn the embedding of unified length for each node, the second stage is to map embedding spaces of different networks into the same vector space, and the third stage is to compare the distance or similarity between nodes in the same embedding space to obtain the node alignment results. In addition, most methods also introduce an iterative optimization strategy or an alignment results refinement method. Currently, embedding-based methods have become the dominant technique for solving network alignment and have achieved good results. With the development of deep learning, some neural network models have been used to solve network alignment [8].
The current embedding-based network alignment approaches have two main challenges: (1) the embedding process of most methods is independent, and it is impossible to align nodes directly because the embedding spaces of different networks are independent of each other [9]. The connection of the two networks mainly relies on pre-aligned nodes (anchor links), using these anchor links to unify the embedding space of the two networks by transforming and calibrating different vector spaces. Therefore, most related works focus on supervised learning [10,11,12,13,14]. Their common drawback is that training requires a certain number of anchor links. However, since anchor links are rare in real-world applications, these strategies are not applicable in situations. Some unsupervised methods introduce an iterative mechanism to select high-confidence seed node pairs from the results computed by the algorithm for the next training round [15,16]. Training node alignments use linear transformations via seed information. Some methods use an adversarial mechanism to maintain the alignment of the embedding distribution [17,18]. These strategies might significantly reduce the efficiency of the algorithm. (2) Networks in actual applications may be large in scale, containing millions or even tens of millions of nodes, such as the user-item network in the recommendation system and the user network in the social network. For large-scale networks, network alignment algorithms need to consider execution efficiency and accuracy. So far, the existing methods either have poor alignment performance, or the training time is long, and the complexity is high, which is difficult to meet the actual needs. How to solve the network alignment on the large-scale graph within the acceptable time and space is also a challenge.
To address the above challenges, we propose an unsupervised rapid network alignment framework, called URNA. Given the strong robustness and generalization ability of GNN, our method uses a GNN model to learn the embedding of nodes in implicit spaces by aggregating topological and node attribute information. For challenge (1), we train the GNN model by unsupervised learning, and employ the weight-parameter sharing to learn the multi-layer embedding of nodes under the same coding rules to achieve direct alignment of nodes. For challenge (2), we approximate the original networks to the smaller coarsen networks that keep the propagation characteristics and use the coarsen networks to train the GNN model to reduce the training time and memory overhead. Then we infer node embeddings of the original networks through once forward propagation. Our method has two phases: (1) we select a suitable coarsening algorithm to reduce input networks, and output coarse networks of smaller scale than the original networks and then train the GNN model based on coarsened networks, (2) we infer the node embedding of the original networks through the weight parameters sharing mechanism, and then achieve the alignment directly by calculating the inner product of node vectors. Our method does not involve many complex computations and has low memory consumption and rapid running time.
The main contributions of this paper are as follows:
(1)
We propose an unsupervised rapid network alignment framework, URNA, which has sub-linear training time and space cost by integrating multiple strategies. To be more specific, URNA trains a GNN by the coarsest networks to achieve fast network embedding, and adopts the parameter sharing model so that nodes of two networks have the same encoding rules to achieve fast alignment.
(2)
We exploit the multi-layer embeddings created by the GNN to compute the alignment matrix, which raises the accuracy of alignment.
(3)
We conduct extensive experiments on several real-world datasets, and the experimental results confirm the effectiveness of our approach, which implements a balance between expressiveness and efficiency and has high scalability.
The rest of the paper is organized as follows. In Section 2, we review related work on embedding-based network alignment. The problem definition of network alignment is presented in Section 3. The design ideas and implementation process of our approach are covered in Section 4. The experimental results are reported in Section 5. The paper is concluded in Section 6.

2. Related Work

Network alignment is essentially a graph isomorphism problem, described as identifying anchor nodes between two or more networks belonging to the same entity. Most network alignment approaches have used the network embedding technique in recent years, which solves the problem of the difficulty of node feature extraction by traditional methods. Embedding-based network alignment methods are typical components of three modules: embedding, interaction, and alignment. The function of the embedding module is to produce node embeddings of the network by leveraging existing embedding techniques and their improved series, and network topology and node attributes are the two main pieces of information used by the embedding module. The role of the interaction module is mainly to map the embedding spaces of different networks into the same vector space. The primary function of the alignment module is to compute the embedding distance between nodes. Depending on whether to use labeled data, we classify network alignment methods as supervised, semi-supervised, and unsupervised.

2.1. Supervised and Semi-Supervised Network Alignment Methods

Supervised methods are the most basic and generic, and they were the first to be proposed. These methods typically learn a suitable matching function to identify unlabeled node pairs using features learned from anchor node pairs. Man et al. [11] proposed PALE, a robust supervised alignment model, which uses network embedding and the anchor links as supervised information to capture structural rules and further learn an identifiable cross-network node alignment mapping for predicting anchor links. Zhang et al. [12] proposed FINAL, an attributed network alignment method, which models the consistent alignment principle of attributes and structures from the perspective of matrix optimization and gives an efficient and scalable solution algorithm and a linear complexity query algorithm that balances accuracy and efficiency. However, the absence of anchor links, which are challenging to collect in the real world, may occasionally be a limitation for these algorithms. As a result, the supervised methods are not applicable without sufficient numbers of anchor links.
To overcome the lack of labeled data, many researchers have proposed semi-supervised solutions using small numbers of anchor links. These algorithms employ both labeled and unlabeled nodes during training, and during testing, it checks whether the nodes of different networks align with each other. Liu et al. [13] proposed IONE, a typical semi-supervised model, which learns network embeddings by explicitly modeling the input and output contexts to preserve the similarity of the users in follower/followee relationships. To ease the context transference, they incorporate known and potential anchor links. In addition, they unify the embedding and alignment steps under a common framework and use stochastic gradient descent and negative sampling to learn the model. Zhou et al. [14] proposed DeepLink, which learns node embedding by sampling the networks using random walks and then uses a deep neural network to align anchor nodes.

2.2. Unsupervised Network Alignment Method

Because anchor nodes are difficult to obtain, some methods use unsupervised learning. Heimann et al. [19] proposed the REGAL framework, which aligns networks by matching latent node embeddings. After extracting the structural and attribute information from the nodes, they learn the node embeddings by factorizing a similarity matrix of the node attributes and using an extension of the Nystrom [20] method for low-rank matrix approximation to prevent the need for excessive computation. Finally, they align nodes by greedily matching their embeddings. Nguyen et al. [17] proposed NAWAL, which learns node embeddings using a known network embedding algorithm and then uses an unsupervised end-to-end neural network model to align the embedding space of two networks via adversarial training. Chen et al. [21] proposed CONE-Align, which learns node embeddings based on a random walk embedding algorithm. It utilizes node embeddings to model intra-network proximity to complete embedding subspaces alignment, and it uses embeddings similarity to match nodes across networks. Zhang et al. [22] proposed a multi-granularity network alignment method, MOANA, which takes advantage of the hierarchical nature of the network and provides an unsupervised three-stage “coarsen–align–interpolation” strategy. First, input networks are coarsened, then coarsened node embeddings are learned. Second, the coarsened networks are aligned to obtain the alignment matrix. Finally, the final alignment matrix is computed by interpolation. Since there is no prior knowledge, the alignment effect of most unsupervised methods is not desirable.
As deep learning techniques have advanced rapidly in recent years, researchers have used graph neural network models to solve network alignment problems. Qin et al. [23] proposed G-CREWE, a network alignment framework based on the graph convolutional network [24] (GCN), using node embedding, which integrates graph compression and network alignment operations to align networks at two resolution levels. When there is more edge noise in the network, appropriate network compression can achieve relatively fast alignment while retaining high accuracy. Tuynh et al. [15] proposed GAlign, an unsupervised network alignment approach for attributed networks, which learns node multi-order embeddings via GCN and uses an alignment refinement method to detect potential noise and adjust the embeddings accordingly. It aims to make the alignment output robust to structural differences and attribute mismatching. Xiao et al. [25] proposed GATAL, which replaces the GCN model in GAlign and uses the GAT [26] model to learn node embeddings of the networks. Gao et al. [18] proposed WAlign, a network alignment framework, which designs a lightweight graph neural network to capture the inherent correlations between graph topology and node attributes. The framework uses a Wasserstein distance discriminator to find the corresponding pairs and further updates the embedding by using these pairs. Park et al. [16] proposed Grad-Align, a network alignment framework based on graph isomorphic networks [27] (GIN) to learn multi-layer embeddings, using iterative updating of the double-sensing similarity composed of embedment similarity and Tversky similarity [28] to enable gradual matching.
The embedding module based on GNN can efficiently aggregate network structure and attribute information. Many recent algorithms have increased network alignment accuracy by utilizing the GNN model of various frameworks; however, some intrinsic flaws of graph neural networks may impair network alignment performance. For example, as propagation deepens, node features become indistinguishable [29], causing uncertainty in matching during network alignment. At the moment, training by gradient descent has a high computational cost that grows exponentially with the number of layers of a graph neural network in the training process, and they require a large amount of memory space to save the input network and embed each node in memory [30]. As a result, most network alignment methods based on graph neural networks are unsuitable for large-scale networks.

3. Problems and Definitions

In this section, we first introduce some of the related definitions and then give a formal definition of the network alignment problem.
Definition 1 (Network).
We define a network as an undirected graph G = { V , E , A , X } , where, V is the set of nodes, E is the set of edges, A n × n is the adjacency matrix, X n × f is the attribute matrix, n represents the total number of nodes in the network, and f represents the node attribute dimension.
Definition 2 (Source network and Target network).
This paper mainly researches network alignment between two networks. We name these two networks as the source network and the target network respectively, where G s = { V s , E s , A s , X s } represents the source network, and G t = { V t , E t , A t , X t } represents the target network.
Definition 3 (Network Alignment).
Given two networks, G s and G t , with n 1 and n 2 nodes, respectively. Network alignment refers to finding nodes in the source network that might correspond to them in the target network, and outputting a soft alignment matrix S n 1 × n 2 , which S ( i , j ) represents to what extent a node i in G s is aligned with a node j in G t .

4. URNA Model

URNA is an unsupervised network alignment method that does not require anchor nodes to train the model. We divide it into two phases: model training and network alignment. We illustrate our framework’s structure in Figure 1. During the model training phase, we train the GNN model using two coarse networks of source and target network. In the network alignment phase, we use the parameter sharing mechanism to capture the multi-layer embeddings of two networks, then calculate the inner product of the vectors to obtain alignment matrices.

4.1. Network Coarsening

To reduce the overhead of GNN training, we train the GNN model with two coarsen networks as the source and target networks. In this section, we introduce the network coarsening method that we use in our framework. The goal of network coarsening is to approximate a large-scale network to a smaller small-scale network while retaining propagation properties. We define a coarsening function π : ( G , r ) G r , which takes a network G = ( V , E , X ) with n nodes and a network compression ratio r ( 0 , 1 ) as inputs and returns an appropriate coarsen network G r = ( V r , E r , X r ) with n = r × n nodes. Ideally, the coarsen network should keep the key topological structure and attribute information of the original network. Each node of the coarsen network can be viewed as a hyper node V j r V r , corresponding to a set of nodes C = π 1 ( V j r ) V , and the attribute of the hyper node V j r is formed by merging attributes of all nodes in C .
Most current methods, such as the normalized heavy edge matching method [31] or the community detection algorithm [32], can be used in the coarsening function. We employ Loukas’ variation neighborhoods coarsening method [33] to build coarsen networks. We obtained the Loukas method’s source code from https://github.com/loukasa/graph-coarsening (accessed on 12 October 2022).
The Loukas method can reduce the size of a network without significantly altering its basic properties. The method handles the network reduction problem using restricted spectral approximation, which is a modification of the spectral similarity metric used for graph scarification. For further information, please see the original paper [33]. When compared to both standard and advanced graph reduction methods, Loukas’ method produces high-quality coarsen networks.
In summary, the coarsening process consists of two parts. The coarsening function is used to output a normalized partition matrix P n × n , and the partition matrix decides which neighbors can join together to form super nodes. The second step is to calculate the coarsen network’s attribute matrix based on the partition matrix, and the formula is as follows:
X r = P T X

4.2. Convolution Graph Neural Network

We employ the GNN model to learn topological and node attribute information to learn the multi-layer embedding of cross-network nodes in the low-dimensional hidden space. This subsection does not distinguish between source and target networks for clarity. Assuming that the embedding of node i at layer k is h i ( k ) , we denote the embedding of node i at layer k 1 as h i ( k 1 ) . The network convolution propagation rule for the layer k is then written as follows:
h i ( k ) = σ ( W 1 ( k ) h i ( k 1 ) + W 2 ( k ) j N ( i ) e j , i h j ( k 1 ) )
where N ( i ) is the neighbor set of node i , e j , i denotes the edge weight from source node j to target node i , W 1 ( k ) and W 2 ( k ) are weight matrices at layer k . σ ( ) is an activation function, and we use the function Tanh ( ) in the GNN.
GNN learns node embeddings by recursively aggregating features of neighboring nodes, and high-order node features are obtained by superimposing convolutional layers. Convolutional layers of different depths capture different semantic information, with shallow layers influenced by node features and focused on network local information, and deep layers influenced by network topology and focused on network global information. In GNN, we save the output of each convolutional layer to obtain multi-layer embeddings, which are then used to improve the performance of subsequent network alignment tasks.
To introduce the rest of the URNA more clearly, we define the output of the k layer as Tanh ( G c o n v ( G ; Θ ( k ) ) ) , where G c o n v ( ) is the convolutional network layer and Θ ( k ) is the training parameter to be learned for aggregation and updating in the k layer. The training weight parameters are shared in two networks. In GNN, the two networks share training parameters for all layers. This assures that the same coding rules are applied to all nodes, which will better fit the needs of eventual network alignment operations.
We use a consistency loss function [15] to train the GNN model. Its optimization objective is to encourage nodes with similar neighborhood structures to have similar embeddings and uncorrelated nodes with high discrimination. While low-order embeddings can capture local information, since some nodes in a network may be far apart but have similar features, this leads to low-order embeddings that are similar to these nodes. Moreover, higher-order embeddings of numerous nodes are too similar due to the over-smoothing problem in GNN. This can lead to matching confusion problems during network alignment. In this way, we compute the loss function from the embeddings at all layers to complement each other. The objective function at the layer k is designed as follows:
L o s s G ( k ) = A h a t ( k ) H ( k ) H ( k ) T F 2
where F is the Frobenius norm, which allows us to measure the distance between matrices. A h a t ( k ) is the symmetric normalized Laplacian matrix at layer k. We designed different A h a t for different convolutional layers to allow different convolutional layers to learn their unique information and achieve variability in the embedding representation of different layers. The computation of A h a t is performed as follows:
A h a t ( k ) = D ˜ ( k ) 1 / 2 A ˜ ( k ) D ˜ ( k ) 1 / 2
A ˜ c a n ( k + 1 ) = A ˜ ( k ) A ˜ c a n ( k )
A ˜ ( k + 1 ) = A ˜ ( k ) + A ˜ c a n ( k + 1 )
where A ˜ ( 0 ) = A + I n , I n n × n is the identity matrix, n is the number of nodes in the network, D ˜ ( k ) is a diagonal matrix, D i i ( k ) represents the degree of the i-th node and D i i ( k ) = j A ˜ i , j ( k ) , A ˜ c a n ( 0 ) = A ˜ ( 0 ) .

4.3. Network Alignment

In this subsection, we describe our embedding-based network alignment. First, we input the source and target networks to the GNN model that has completed training, and then we use a forward propagation step to infer the node embeddings of the networks. Since we use weight parameter sharing, there is no need to use a mapping function to map the network embeddings into a common vector space.
To achieve alignment, we directly calculate the similarity between vectors. The correlation between two nodes is stronger the higher the similarity value. There are numerous methods to determine how similar two nodes are, including cosine similarity, Euclidean distance similarity, and Hamming distance similarity. We use the inner product kernel function to gauge how similar the two samples are. A higher value of the inner product of two more similar pairs of nodes indicates a higher likelihood of an edge between those pairs.
Let H s ( k ) and H t ( k ) be the low-dimensional vector matrices of the source and target networks at layer k, respectively, and then calculate the alignment matrix at layer k as follows:
S ( k ) = H s ( k ) H t ( k ) T
The final alignment matrix S is obtained by fusing all the alignment matrices. The execution process of the URNA algorithm is summarized as Algorithm 1:
Algorithm 1: URNA
Input: source network Gs, target network Gt, compression ratio r, embedding dimension d, layers k, epochs.
Output: alignment matrix S
  • Apply Loukas’ method on G s and G t , and output two coarsen networks G s r , G t r , and two normalized partition matrixes P s , P t .
2.
Compute coarsened feature matrices X s r and X t r by Equation (1).
3.
Compute A s , h a t r ( k ) and A t , h a t r ( k ) by Equations (4)–(6).
4.
for some epochs do
5.
for i = 1 to k do
6.
   H s r ( k ) = Tanh ( G c o n v ( G s r ; Θ ( k ) ) ) .
7.
   H s t ( k ) = Tanh ( G c o n v ( G s t ; Θ ( k ) ) ) .
8.
  Evaluate the loss function by Equation (3) and get L o s s G s r ( k ) and L o s s G t r ( k ) .
9.
L o s s = L o s s G s r ( k ) + L o s s G t r ( k ) .
10.
 Back propagate by gradient descent.
11.
S = O m × n .
12.
fori = 1 to k do
13.
H s ( k ) = Tanh ( G c o n v ( G s ; Θ ( k ) ) ) .
14.
H s ( k ) = Tanh ( G c o n v ( G t ; Θ ( k ) ) ) .
15.
S ( k ) = H s ( k ) H t ( k ) T .
16.
S = S + ( 1 / ( k + 1 ) ) S ( k ) .
17.
Return S
The time complexity analysis of the URNA is performed below. The time complexity of network coarsening is O ( V 2 ) , and it needs to be carried out just once before training. The time complexity of the normalized Laplacian matrix is O ( k E ) , while the time complexity of the computation for the GNN model is O ( k ( V d + E d 2 ) ) . V d denotes the feature’s multiplication link with the parameter matrix, and E d 2 denotes the time consumption of the neighborhood aggregation procedure. Because URNA employs small-scale networks, the network’s compression ratio is assumed to be r , the number of nodes in the coarsen network G r is V r = ( 1 r ) V , and the upper bound of the number of edges is min ( E , ( 1 r ) 2 V 2 ) . This means that training on the coarsen networks will have a worst-case computational complexity (1 − r) times that of the original networks.

5. Experiments

In this section, we present the experimental part. We first introduce the evaluation metrics, a comparison of methods and datasets, and parameter settings. Then, we give the experimental results and analysis. Finally, we study model parameter selection and parameter sensitivity. The hardware environment of the experiment is Intel (R) Core (TM) i7-4790 CPU (processor base frequency is 3.60 GHz, total cores are 8), 32G memory, and the Windows 10 operating system. We use Python to write codes and implement them based on the PyTorch deep learning framework.

5.1. Evaluation Metrics

The experiments evaluate the network alignment effects using four metrics, including Accuracy [6], MAP [15], Hit-precision [6], and Precision@K [15], to verify the performance of the proposed method and baselines.
Accuracy is a straightforward metric. The larger the value of Accuracy, the better the performance of network alignment methods. After obtaining the alignment matrix S, we use the heuristic greedy matching algorithm as a post-processing step for each algorithm. The heuristic algorithm iterates over the alignment matrix S to find the largest score S i , j and record the node pair ( i , j ) , then deletes any scores involving node i or nodes from the matrix (replace them with zero values). The following formula calculates Accuracy:
A c c u r a c y = # P c o r r # N a
where P c o r r denotes the correctly identified node pairs, N a denotes the truly aligned node pairs.
Accuracy is a metric of direct alignment that requires one-to-one node alignment, where to select the node with the highest similarity is the sole pair of aligned nodes. Without loss of generality, we use three metrics to evaluate the performance of network alignment from ranking and prediction.
For ranking metrics, we employ MAP (Mean Average Precision) and Hit-Precision.
MAP is defined as
M A P = 1 # N a ( i N a 1 r a n k i )
Hit-Precision is defined as
H i t p r e c i s i o n = 1 # N a ( i N a ( K + 2 ) r a n k i K + 1 )
We construct a candidate list for the node i in the source network, select the Top-K potential nodes most similar to the node i from the target network, and add them to the candidate list. r a n k i is the index value of the node in the candidate list that correctly matches the node i . MAP and Hit-Precision focus on the ranking value of correctly matched nodes in the candidate list.
For prediction, we employ a general metric Precision@K. We calculate the similarity of the node i in the source network and each node in the target network, rank them in descending order, and take Top-K nodes as the potential matching nodes of the node i . We compare the Id of the candidate matching node with the Id of the true matching node in sequence, and if there is a hit, the nodes match successfully. The following formula calculates Precision@K:
P r e c i s i o n @ K = 1 # N a i N a I i { S u c c e s s @ K }
where I i { } is the indicating function, I i { T r u e } = 1 , I i { F a l s e } = 0 , For a node i in the source network, proposition S u c c e s s @ K represents if the true alignment node exists in the potential matching nodes.

5.2. Baselines and Datasets

For the examination, we selected five state-of-the-art unsupervised embedding-based network alignment methods for comparison with the URNA. We divide the baselines into two categories: network alignment methods based on traditional representation learning and graph neural networks. In the first type, REGAL [19] uses the low-rank matrix factorization method, xNetMF, to learn node embeddings, and NAWAL [17] uses the DeepWalk [34] to learn node embeddings. DeepWalk adopts random walk to sample node sequences, and the node embeddings in the same sequence are closer to each other, preserving the homogeneity of nodes. In the second type, GAlign [15] uses GCN [24] to learn embeddings for each node, and uses a data augmentation and refinement mechanism to adapt the method to coincidence conflicts and noise. WAlign [18] learns embeddings of the nodes using a lightweight graph neural network (LGCN) [18] with a flat structure and then uses the Wasserstein distance discriminator to discover candidate node pairs to update the node embeddings. Grad-Align [16] learns node embeddings using a Graph Isomorphism Network (GIN) [27]. GIN can collect higher-order node features. Grad-Align uses the generated embedding similarity and Tversky similarity [28] to align node pairs progressively.
We used four public datasets with attribute information: douban [6], allmv/imdb [15], flickr/myspace [6], and flickr/lastfm [6]. Each dataset contains two real-world networks, and we present the basic statistics for these datasets in Table 1. Dataset douban comes from a social network with two sub-networks: an offline activity network and an online follower network. Each node is a user. Offline activity networks connect users based on their co-occurrence in offline activities. Each edge of the online following network presents who follows who in Douban. The node attribute is the location information of the user. Dataset allmv/imdb comes from two Internet movie databases, AllMovie and Internet Movie Database (IMDB). Each node is a movie, and the edge means that at least one actor is the same in both films. Datasets flickr/myspace and flickr/lastfm come from three different online social platforms, Flickr, MySpace, and Last. FM, where each node is a user and node attributes are part of the user’s profile information.

5.3. Parameter Setting

To ensure the fairness of the trial, the comparison algorithms all use the default parameters of their papers. When the settings used for initialization are repeated, the URNA and comparison algorithms keep the same parameter values. For URNA, we set the network compression ratio r = 0.8, the embedding dimension d = 200, the number of convolutional layers k = 2, the intermediate layer dimension to the same as the embedding dimension, the Adam optimizer to 0.001, and the weight decay rate to 5 × 10⁻⁴.

5.4. Experimental Results and Analysis

To evaluate the performance of FSNA, we first evaluate the computational efficiency and alignment performance of FSNA and baselines on the datasets douban, allmv/imdb, flickr/myspace, and flickr/lastfm by three metrics, namely Accuracy, MAP, and Hit-precision, and the experimental results are shown in Table 2.
According to the experimental results shown in Table 2, REGAL, which uses matrix factorization to learn node embeddings, is more computationally time efficient than the baselines based on graph neural networks, but has lower alignment performance. In terms of time complexity, GAlign < WAlign < Grad-Align for the baselines based on graph neural networks. WAlign uses adversarial training to map the embedding space of the two networks to the same vector space. While this End-to-End training approach can update embeddings in real-time and enhance alignment precision, it also adds the computational burden of the model. Grad-Align uses an iterative mechanism to select node pairs with high similarity by node embeddings and gradually align nodes in combination with Tversky similarity; however, this strategy consumes a significant amount of memory space and significantly lengthens the computation time of the algorithm. Our method has a significant computational speed advantage on the four datasets and performs best on all data sets except for the douban dataset, where the computational time efficiency is slightly lower than that of REGAL. Compared to GAlign, running time is reduced by 77.59% on the dual dataset, 81.61% on the allmv/imdb dataset, 95.69% on the flickr/myspace dataset, and 96.85% on the flickr/lastfm dataset. The experimental results validate the efficiency of URNA. The advantage of URNA becomes more apparent as network size rises, and it can use for network alignment tasks on large-scale networks.
On four datasets, the alignment performance of different algorithms varies significantly in terms of Accuracy, MAP, and Hit-precision. Among them, DeepWalk-based NAWAL performs the worst and is nearly comparable to random alignment, which is logically reasonable given that it cannot capture the similarity of nodes between the two networks. REGAL requires information on the degrees of neighbors of different orders as structural features to express nodes. We cannot obtain the experimental results because the allmv/imdb dataset contains some isolated nodes. It can be seen that baselines using the graph neural network have a better and more stable network alignment performance. On all four datasets, URNA achieved optimal results. Experimental results validate the usefulness of URNA in network alignment tasks.
Next, we evaluate the soft alignment performance of all algorithms using the metric Precision@K, and the experimental results are shown in Table 3, Table 4, Table 5 and Table 6. Experimental results show that URNA exhibits excellent performance overall. For the soft alignment, the GNN-based GAlign, WAlign, and Grad-Align algorithms also show stable and better performance in different K values. GAlign outperforms the other baselines on the datasets douban and allmv/imdb, which have the most attribute information, and WAlign outperforms the other baselines on the datasets flickr/myspace and flickr/lastfm, which have little attribute information, demonstrating that using training methods based on generative adversarial methods can exploit uncertain information in the network to improve network alignment correctness. On the four datasets, URNA outperforms the other baselines. Precision@1 outperforms the best-performing Grad-Align on the douban dataset by 23.45%, the best-performing WAlign on the allmv/imdb dataset by 4.78%, the best-performing WAlign in the baselines on the flickr/myspace dataset by 56.25%, and the best-performing WAlign in the baselines on the flickr/lastfm dataset by 49.44%. In conclusion, the URNA outperforms other baselines in datasets of various sizes in terms of running time and alignment accuracy.

5.5. Hyper-Parameter Sensitivity Analysis

We analyze the sensitivity of the hyper-parameters affecting our method on four datasets to investigate the effect of different hyper-parameters on the experimental results. The network compression ratio r, the embedding dimension d, and the number of convolutional layers k are compared. The hyper-parameters are r = 0.8, d = 200, and k = 2 if not indicated otherwise. The variation of hyper-parameters reflects the relevance of the elements that affect our strategy. The metric Precision@5 is used to compare network alignment effects.
First, we investigated the hyper-parameter r. During the experiment, we kept the other parameters constant, and increased the r value from 0.1 to 0.9, increasing it by 0.1 each time, and the experimental results are shown in Figure 2 and Figure 3. Figure 2 indicates the trend of our method’s running time in the four data sets with the change of the r value. Figure 3 represents the trend of our method’s metric Precision@5 in the four data sets with the change of r value. As can be observed in Figure 2, the computational time efficiency of the model increases significantly with increasing r values in the four datasets. The dataset flickr/lastfm shows the most significant improvement in the computational efficiency of the model when compared to the other three datasets. When the r value hits 0.8, the model’s running time on the four datasets lowers by 75.11%, 74.52%, 90.69%, and 94.04%, respectively, when compared to the un-coarsened network.
For Precision@5, the fluctuation amplitude of the four broken lines in Figure 3 is small, indicating that the value of r has little influence on the performance index within the above value range, indicating that our method has low sensitivity to parameter r. Even when the d value reaches 0.8, it still maintains good performance. Compared to the un-coarsened network, the Precision@5 in the dataset douban increases by 0.60%, in the dataset allmv/imdb, the Precision@5 drops by 6.42%, and the same level is maintained in the Precision@5 in the dataset flickr/myspace, and in the dataset flickr/lastfm, the Precision@5 increases by 25.00 percent. In general, as the value of r increases, the alignment performance of our approach does not change significantly. As a result, by greatly compressing the network size, we can guarantee the alignment accuracy of the network and reduce the training time and memory requirements of the GNN model to achieve more outstanding performance on large-scale datasets.
Next, we study how the embedding dimension d affects the performance of URNA. In the experiments, we set the values of d to 5, 10, 25, 50, 100, 150, and 200 in order, while keeping the other parameters fixed. Figure 4 shows the experimental results, which depict the trend in the variation of the metric Precision@5 for different values of d on the four datasets. We can see from Figure 4 that the metric values change differently for the four datasets as the value of d increases. Overall, the metric Precision@5 increases steadily with an increasing value of d. On the dataset Douban, the metric reaches its optimal value for d = 150, and on the datasets allmv/imdb and flickr/myspace, the metric reaches its optimal value for d = 200. On the other hand, on the dataset flickr/lastfm, the metric value is optimal when the value of d = 50, which may be related to the large size of the dataset. On the other hand, on the flickr/myspace and flickr/lastfm datasets, the model effects fluctuate with increasing values of d, which may be related to the fact that the datasets have too few attributes.
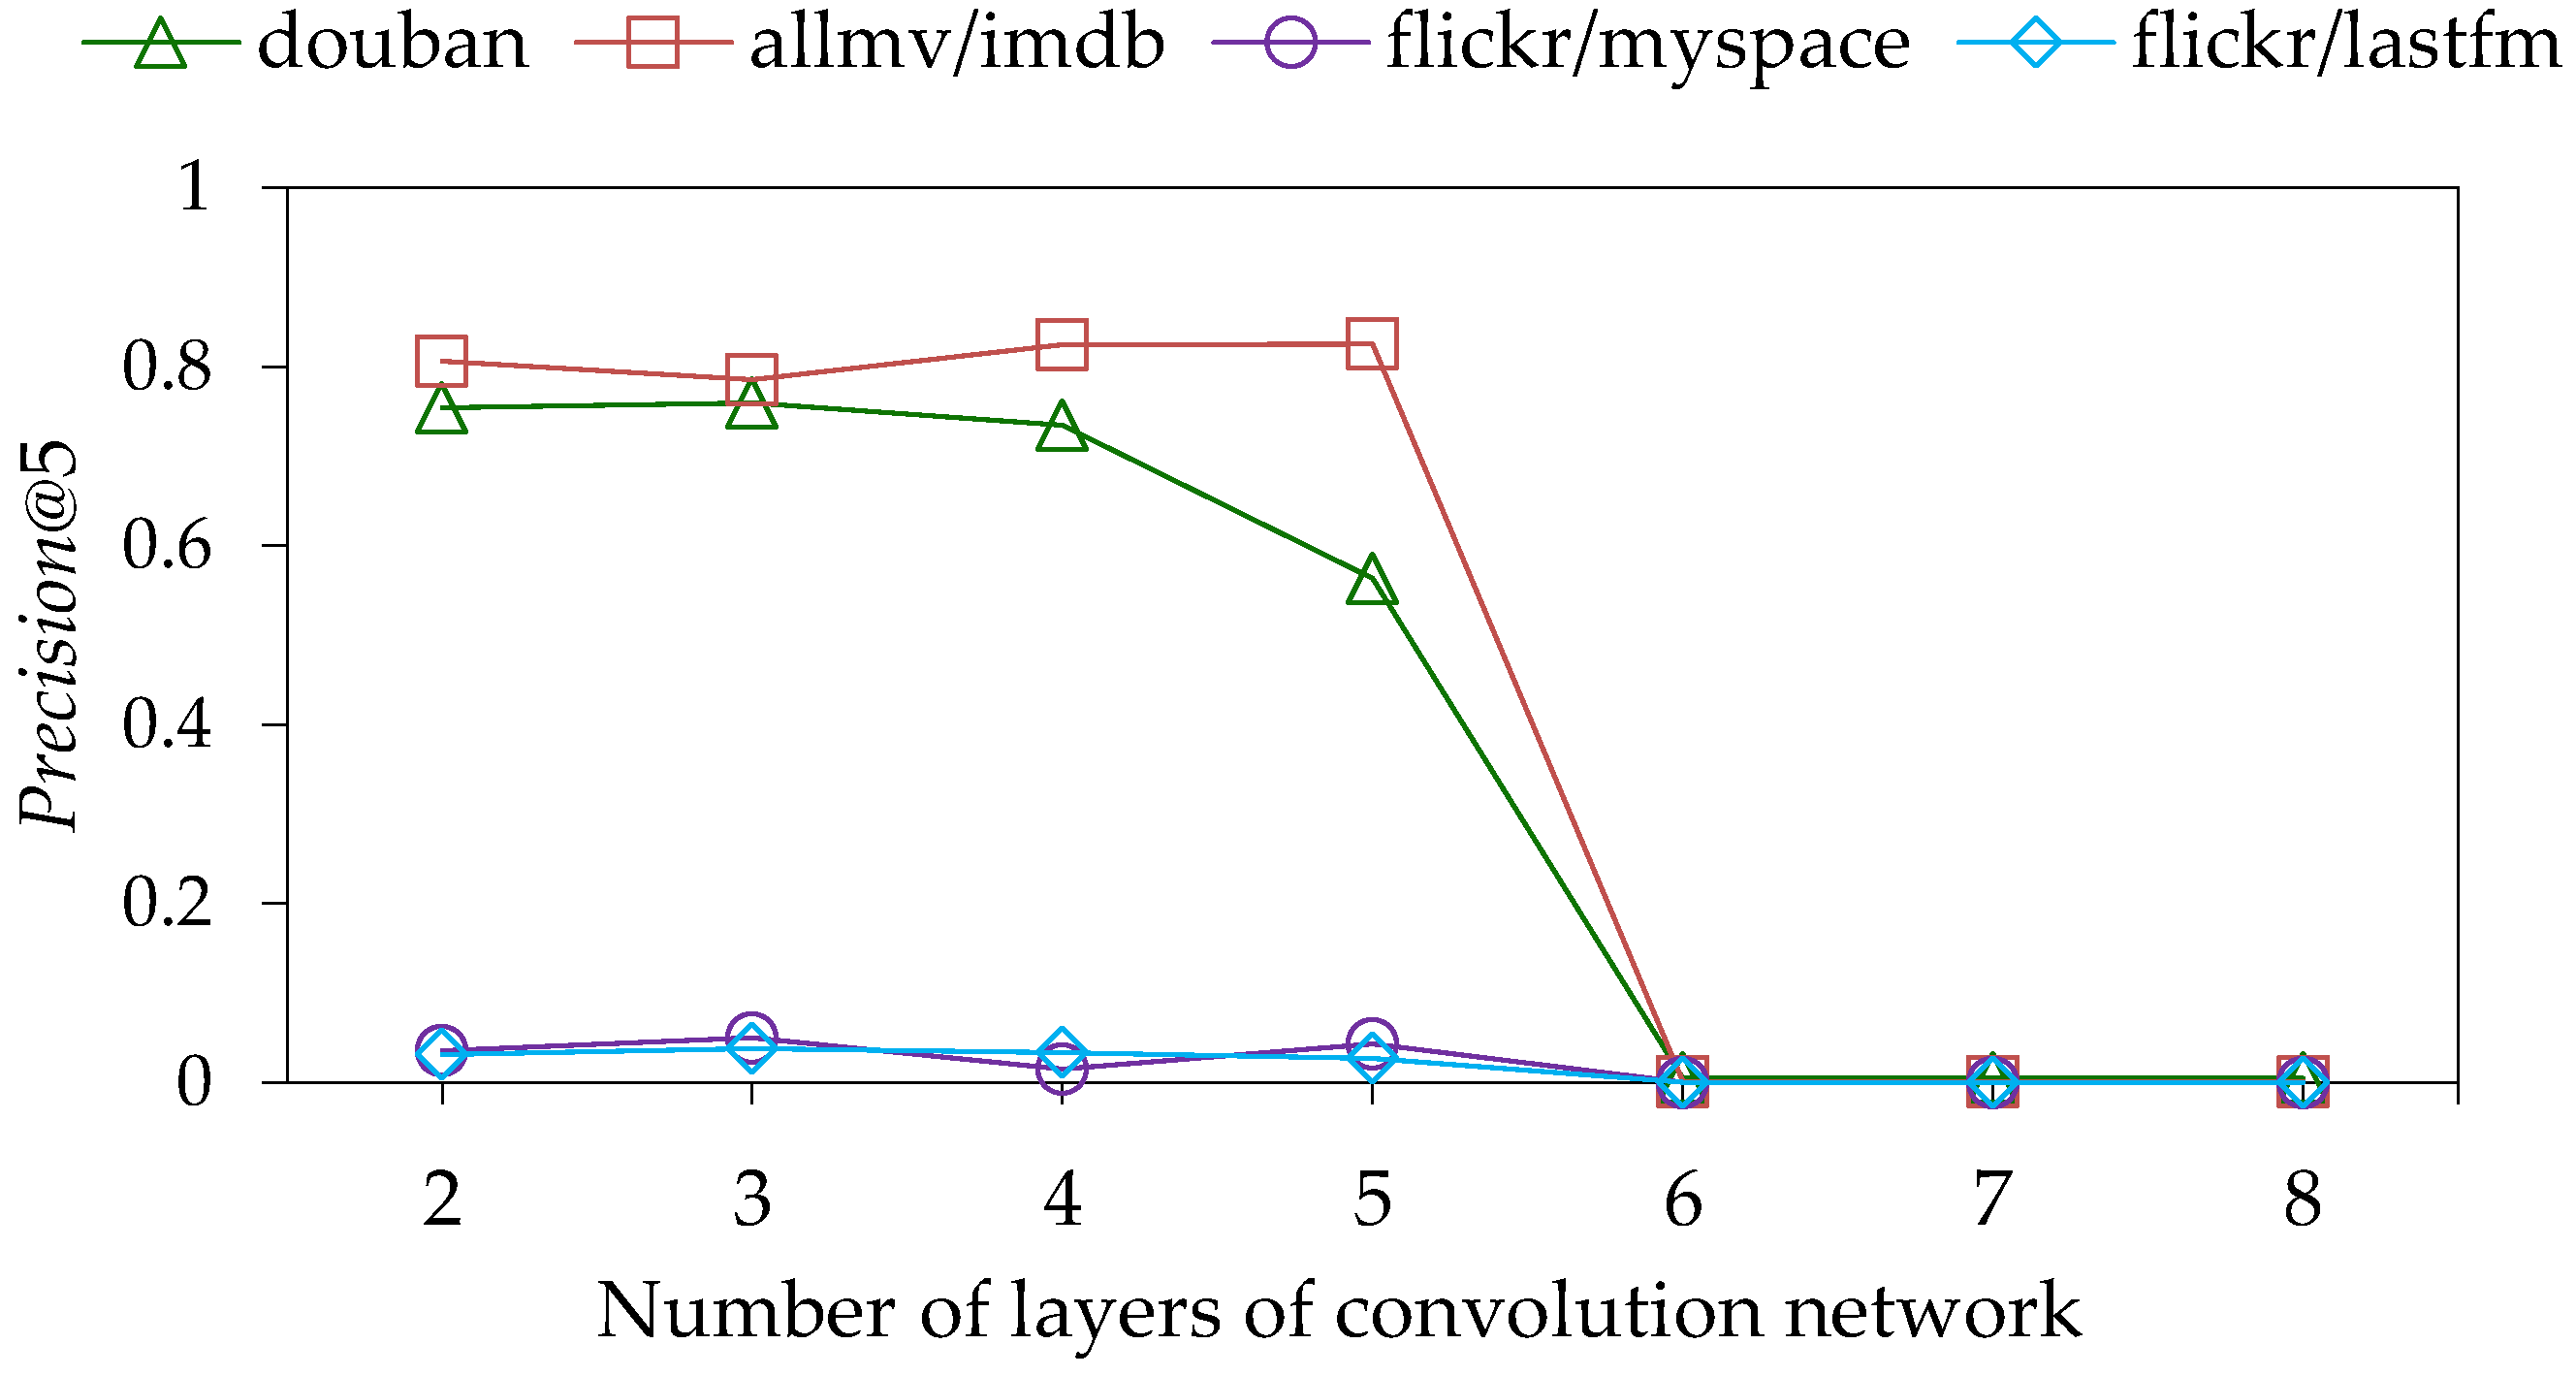
Finally, we study how the number of convolutional layers k affects the performance of URNA. In the experiments, we kept the other parameters fixed and increased the value of k from 2 to 8, increasing it by 1 each time. The experimental results are shown in Figure 5. We can observe that the metric Precision@5 achieves better results for a smaller number of k values on the four datasets. For values of k above 5, the effect of the model decreases precipitously. This is because we stack multiple convolutional layers by cascade. Although the deeper convolution layer aggregates the higher-order features of the nodes, it also leads to the over-smoothing of the node embedding [29]. More similar node embeddings lead to the matching confusion problem during network alignment. In addition, we do not distinguish the importance of different alignment matrices, resulting in a significant worsening of the alignment effect. The difference is that the metric Precision@5 reaches optimal at k = 3 for the datasets douban, flickr/myspace, and flickr/lastfm, and at k =5 for the dataset allmv/imdb, which may be related to the excessive number of edges in the dataset allmv/imdb relative to the number of nodes.

6. Conclusions

We propose URNA, an unsupervised rapid network alignment algorithm based on GNN with two phases: model training and network alignment. During the model training phase, we use the coarsening function to approximate the input networks to smaller-scale coarse networks that keep the propagation properties, then train a GNN model using coarsen networks, which significantly reduces the training overhead of the GNN. The main goal of the network alignment phase is to use the trained GNN to infer embeddings for the two networks and achieve direct alignment. Our framework uses two parameter sharing mechanisms, one between coarse and original networks and one across networks. In addition, the proposed framework can learn node embeddings at multiple convolutional layers, preserving local and global semantic information in the network. Comparative experimental results show that our proposed network alignment method generally outperforms existing embedding-based network alignment algorithms, guaranteeing model operation efficiency while achieving fast alignment. Overall, URNA is practical and scalable and can be applied to large-scale network alignment tasks. Although the proposed network alignment algorithm outperforms the existing methods, there is still room for improvement in the accuracy rate. For example, introducing an attention mechanism and assigning different weights to each alignment matrix will continue to improve the performance of the model in the network alignment task.

Author Contributions

Methodology, L.Z. and F.Q.; software, validation, L.Z. and F.Q.; data curation, F.Q.; writing—original draft preparation, L.Z. and F.Q.; writing—review and editing, L.Z., F.Q. and J.C.; supervision, S.Z.; funding acquisition, L.Z., F.Q. and S.Z. All authors have read and agreed to the published version of the manuscript.

Funding

This work was funded by the National Natural Science Foundation of China (Grant No. 61876001), the Scientific Research Programs at Universities in Anhui Province (Grant No. 2022AH051749), the Excellent Young Talent Support Programs at Universities in Anhui Province (Grant No. gxyq2020054), the Excellent Young Backbone Talent Home and Abroad Visiting and Research Programs at Universities in Anhui Province (Grant No. gxgnfx2021148).

Data Availability Statement

Conflicts of Interest

The authors declare no conflict of interest.

References

  1. Milano, M.; Zucco, C.; Settino, M.; Cannataro, M. An extensive assessment of network embedding in PPI network alignment. Entropy 2022, 24, 730. [Google Scholar] [CrossRef] [PubMed]
  2. Zhou, Y.D.; Wang, X.M.; Zhang, J.J.; Zhang, P.; Liu, L.L.; Jin, H.; Jin, H.B. Analyzing and detecting money-laundering accounts in online social networks. IEEE Netw. 2018, 32, 115–121. [Google Scholar] [CrossRef]
  3. Bastani, H.; Harsha, P.; Perakis, G.; Singhvi, D. Learning personalized product recommendations with customer disengagement. Manuf. Serv. Oper. Manag. 2022, 24, 2010–2028. [Google Scholar] [CrossRef]
  4. Saxena, S.; Chakraborty, R.; Chandra, J. HCNA: Hyperbolic contrastive learning framework for self-supervised network alignment. Inf. Process. Manag. 2022, 59, 103021. [Google Scholar] [CrossRef]
  5. Koutra, D.; Tong, H.H.; Lubensky, D.M. BIG-ALIGN: Fast bipartite graph alignment. In Proceedings of the 13th International Conference on Data Mining, Dallas, TX, USA, 7–10 December 2013; pp. 389–398. [Google Scholar]
  6. Huynh, T.T.; Toan, N.T.; Tong, V.V.; Hoang, T.D.; Thang, D.C.; Hung, N.Q.V.; Sattar, A. A comparative study on network alignment techniques. Expert Syst. Appl. 2020, 140, 112883. [Google Scholar]
  7. Liu, X.Y.; Tang, J. Network representation learning: A macro and micro view. AI Open 2021, 2, 43–64. [Google Scholar] [CrossRef]
  8. Du, X.B.; Yan, J.C.; Zhang, R.; Zha, H.Y. Cross-network skip-gram embedding for joint network alignment and link prediction. IEEE Trans. Knowl. Data Eng. 2022, 34, 1080–1095. [Google Scholar] [CrossRef]
  9. Heimann, M.; Chen, X.Y.; Vahedian, F.; Koutra, D. Refining network alignment to improve matched neighborhood consistency. In Proceedings of the 2021 SIAM International Conference on Data Mining, Virtual Event, 29 April—1 May 2021; pp. 172–180. [Google Scholar]
  10. Zheng, C.H.; Pan, L.; Wu, P.P. CAMU: Cycle-consistent adversarial mapping model for user alignment across social networks. IEEE Trans. Cybern. 2022, 52, 10709–10720. [Google Scholar] [CrossRef] [PubMed]
  11. Man, T.; Shen, H.W.; Liu, S.H.; Jin, X.L.; Cheng, X.Q. Predict anchor links across social networks via an embedding approach. In Proceedings of the 25th International Joint Conference on Artificial Intelligence, New York, NY, USA, 9–15 July 2016; pp. 1823–1829. [Google Scholar]
  12. Zhang, S.; Tong, H.H. FINAL: Fast attributed network alignment. In Proceedings of the 22th ACM SIGKDD International Conference on Knowledge Discovery and Data Mining, San Francisco, CA, USA, 13–17 August 2016; pp. 1345–1354. [Google Scholar]
  13. Liu, L.; Cheung, W.K.; Li, X.; Liao, L.J. Aligning users across social networks using network embedding. In Proceedings of the 25th International Joint Conference on Artificial Intelligence, New York, NY, USA, 9–15 July 2016; pp. 1774–1780. [Google Scholar]
  14. Zhou, F.; Liu, L.; Zhang, K.P.; Trajcevski, G.; Wu, J.; Zhong, T. DeepLink: A deep learning approach for user identity linkage. In Proceedings of the 2018 IEEE Conference on Computer Communications, Honolulu, HI, USA, 16–19 April 2018; pp. 1313–1321. [Google Scholar]
  15. Huynh, T.T.; Tong, V.V.; Nguyen, T.T.; Yin, H.Z.; Weidlich, M.; Hung, N.Q.V. Adaptive network alignment with unsupervised and multi-order convolutional networks. In Proceedings of the 36th IEEE International Conference on Data Engineering, Dallas, TX, USA, 20–24 April 2020; pp. 85–96. [Google Scholar]
  16. Park, J.D.; Tran, C.; Shin, W.Y.; Cao, X. Grad-Align: Gradual network alignment via graph neural networks (student abstract). In Proceedings of the 36th AAAI Conference on Artificial Intelligence, Virtual Event, 22 February–1 March 2022; pp. 13027–13028. [Google Scholar]
  17. Nguyen, T.T.; Pham, M.T.; Nguyen, T.T.; Huynh, T.H.; Tong, V.V.; Nguyen, Q.V.H.; Quan, T.T. Structural representation learning for network alignment with self-supervised anchor links. Expert Syst. Appl. 2021, 165, 113857. [Google Scholar] [CrossRef]
  18. Gao, J.; Huang, X.; Li, J.D. Unsupervised graph alignment with Wasserstein distance discriminator. In Proceedings of the 27th ACM SIGKDD Conference on Knowledge Discovery and Data Mining, Virtual Event, Singapore, 14–18 August 2021; pp. 426–435. [Google Scholar]
  19. Heimann, M.; Shen, H.M.; Safavi, T.; Koutra, D. REGAL: Representation learning-based graph alignment. In Proceedings of the 27th ACM International Conference on Information and Knowledge Management, Torino, Italy, 22–26 October 2018; pp. 117–126. [Google Scholar]
  20. Drineas, P.; Mahoney, M.W. On the Nyström method for approximating a gram matrix for improved kernel-based learning. J. Mach. Learn. Res. 2005, 6, 2153–2175. [Google Scholar]
  21. Chen, X.Y.; Heimann, M.; Vahedian, F.; Koutra, D. CONE-Align: Consistent network alignment with proximity-preserving node embedding. In Proceedings of the 29th ACM International Conference on Information and Knowledge Management, Virtual Event, Ireland, 19–23 October 2020; pp. 1985–1988. [Google Scholar]
  22. Zhang, S.; Tong, H.H.; Maciejewski, R.; Eliassi-Rad, T. Multilevel network alignment. In Proceedings of the 2019 World Wide Web Conference, San Francisco, CA, USA, 13–17 May 2019; pp. 2344–2354. [Google Scholar]
  23. Qin, K.K.; Salim, F.D.; Ren, Y.L.; Shao, W.; Heimann, M.; Koutra, D. G-CREWE: Graph compression with embedding for network alignment. In Proceedings of the 29th ACM International Conference on Information and Knowledge Management, Virtual Event, Ireland, 19–23 October 2020; pp. 1255–1264. [Google Scholar]
  24. Kipf, T.N.; Welling, M. Semi-supervised classification with graph convolutional networks. In Proceedings of the 5th International Conference on Learning Representations, Toulon, France, 24–26 April 2017. [Google Scholar]
  25. Xiao, Y.L.; Hu, R.M.; Li, D.S.; Wu, J.H.; Zhen, Y.; Ren, L.F. Multi-level graph attention network based unsupervised network alignment. In Proceedings of the 46th IEEE Conference on Local Computer Networks, Edmonton, AB, Canada, 4–7 October 2021; pp. 217–224. [Google Scholar]
  26. Velickovic, P.; Cucurull, G.; Casanova, A.; Romero, A.; Liò, P.; Bengio, Y. Graph attention networks. In Proceedings of the 6th International Conference on Learning Representations, Vancouver, BC, Canada, 30 April–3 May 2018. [Google Scholar]
  27. Xu, K.; Hu, W.H.; Leskovec, J.; Jegelka, S. How powerful are graph neural networks? In Proceedings of the 7th International Conference on Learning Representations, New Orleans, LA, USA, 6–9 May 2019. [Google Scholar]
  28. Bel, K.N.S.; Sam, I.S. Black hole entropic fuzzy clustering-based image indexing and Tversky index-feature matching for image retrieval in cloud computing environment. Inf. Sci. 2021, 560, 1–19. [Google Scholar] [CrossRef]
  29. Wu, X.Y.; Chen, Z.D.; Wang, W.; Jadbabaie, A. A non-asymptotic analysis of oversmoothing in graph neural networks. arXiv 2022, arXiv:2212.10701. [Google Scholar]
  30. Chiang, W.L.; Liu, X.Q.; Si, S.; Li, Y.; Bengio, S.; Hsieh, C.J. Cluster-GCN: An efficient algorithm for training deep and large graph convolutional networks. In Proceedings of the 25th ACM SIGKDD International Conference on Knowledge Discovery & Data Mining, Anchorage, AK, USA, 4–8 August 2019; pp. 257–266. [Google Scholar]
  31. Zhu, J.; Koutra, D.; Heimann, M. CAPER: Coarsen, align, project, refine—A general multilevel framework for network alignment. In Proceedings of the 31st ACM International Conference on Information & Knowledge Management, Atlanta, GA, USA, 17–21 October 2022; pp. 4747–4751. [Google Scholar]
  32. Zhao, S.; Du, Z.W.; Chen, J.; Zhang, Y.P.; Tang, J.; Yu, P.S. Hierarchical representation learning for attributed networks. In Proceedings of the 38th IEEE International Conference on Data Engineering, Kuala Lumpur, Malaysia, 9–12 May 2022; pp. 1497–1498. [Google Scholar]
  33. Loukas, A.; Vandergheynst, P. Spectrally approximating large graphs with smaller graphs. In Proceedings of the 35th International Conference on Machine Learning, Stockholmsmässan, Stockholm, Sweden, 10–15 July 2018; pp. 3243–3252. [Google Scholar]
  34. Perozzi, B.; Al-Rfou, R.; Skiena, S. DeepWalk: Online learning of social representations. In Proceedings of the 20th ACM SIGKDD International Conference on Knowledge Discovery and Data Mining, New York, NY, USA, 24–27 August 2014; pp. 701–710. [Google Scholar]
Figure 1. Overview of URNA framework.
Mathematics 11 00573 g001
Figure 2. Effect of compression ratio on running time.
Mathematics 11 00573 g002
Figure 3. Effect of compression ratio on Precision@5.
Mathematics 11 00573 g003
Figure 4. Effect of embedding dimension on Precision@5.
Mathematics 11 00573 g004
Figure 5. Effect of the number of convolutional layers on Precision@5.
Mathematics 11 00573 g005
Table 1. Statistics of the datasets. Here, the symbol # means “number of”.
Datasets# Nodes# Edges# Attributes# Anchor Links
douban online/offline3906/11188164/15115381118
allmv/imdb6011/5713124,709/119,073145175
flickr/myspace6714/10,7337333/11,0813267
flickr/lastfm12,974/15,43616,149/16,3193451
Table 2. Network alignment comparison of four real-world datasets. Here, the best and second best performers are highlighted by bold and underline, respectively.
Evaluation MetricsREGALGAlignNAWALWAlignGrad-AlignURNA
doubanAccuracy0.00630.24780.00000.21200.40160.4435
MAP0.06520.54710.00890.32650.59330.6340
Hit-precision0.87850.98990.52300.97540.98730.9934
Time(s)11.5078.44774.65203.55389.1617.58
allmv/imdbAccuracy/0.64100.00020.63700.47410.6924
MAP/0.68980.00170.67510.60190.7216
Hit-precision/0.99610.50890.99540.99310.9961
Time(s)/353.691832.61654.137141.3665.02
flickr/myspaceAccuracy0.00370.00000.00000.00370.00000.0150
MAP0.01320.02300.00280.03080.00850.0350
Hit-precision0.68890.51380.49310.86180.57410.8791
Time(s)42.08636.142274.721262.1814,327.6927.41
flickr/lastfmAccuracy0.00000.00220.00000.00670.00440.0111
MAP0.00730.02070.00040.02860.02290.0360
Hit-precision0.82050.83960.46190.90110.81110.9524
Time(s)75.961685.544389.223589.5354,327.6953.08
Table 3. Experimental results on Douban given different Precision@K settings. Here, the best and second best performers are highlighted by bold and underline, respectively.
Precision@K151015202530
REGAL0.02240.09120.14580.18960.22630.26480.2871
GAlign0.43110.66460.77010.83090.86230.88730.8989
NAWAL0.00180.00720.00890.01160.01880.02590.0304
WAlign0.21560.43290.55010.63060.68870.71470.7451
Grad-Align0.48750.71200.78090.81220.83270.84620.8649
URNA0.53220.75400.83180.87210.89800.92130.9320
Table 4. Experimental results on allmv/imdb given different Precision@K settings. Here, the best and second best performers are highlighted by bold and underline, respectively.
Precision@K151015202530
REGAL///////
GAlign0.61770.76990.82260.85070.86920.88140.8924
NAWAL0.00040.00080.00170.00230.00350.00370.0048
WAlign0.60390.75540.80450.83500.85160.86550.8754
Grad-Align0.49170.73180.80180.83330.85550.87380.8881
URNA0.64720.81010.85220.87420.89160.90240.9121
Table 5. Experimental results on flickr/myspace given different Precision@K settings. Here, the best and second best performers are highlighted by bold and underline, respectively.
Precision@K151015202530
REGAL0.00370.01120.01120.02250.03750.05620.0562
GAlign0.00750.03000.04120.05240.06740.07870.0824
NAWAL0.00000.00370.00370.00370.00370.00370.0037
WAlign0.01120.03750.05620.07490.10860.12360.1311
Grad-Align0.00000.01120.01500.02250.04120.05240.0562
URNA0.01750.03820.05650.07870.11490.12610.1315
Table 6. Experimental results on flickr/lastfm given different Precision@K settings. Here, the best and second best performers are highlighted by bold and underline, respectively.
Precision@K151015202530
REGAL0.00000.00220.00670.01770.02440.04430.0554
GAlign0.00220.03330.04210.07540.08650.11090.1197
NAWAL0.00000.00000.00000.00000.00000.00000.0000
WAlign0.00890.03770.06210.07760.09760.10860.1220
Grad-Align0.00440.02880.05100.07100.09530.11530.1397
URNA0.01330.03860.06210.09760.12200.16190.1774
Disclaimer/Publisher’s Note: The statements, opinions and data contained in all publications are solely those of the individual author(s) and contributor(s) and not of MDPI and/or the editor(s). MDPI and/or the editor(s) disclaim responsibility for any injury to people or property resulting from any ideas, methods, instructions or products referred to in the content.

