Article

Sizing, Modeling, and Performance Comparison of Squirrel-Cage Induction and Wound-Field Flux Switching Motors

by
Chiweta E. Abunike
1,2,
Udochukwu B. Akuru
3,4,*,
Ogbonnaya I. Okoro
1 and
Chukwuemeka C. Awah
1
1
Department of Electrical and Electronic Engineering, Michael Okpara University of Agriculture, Umudike 440101, Abia State, Nigeria
2
School of Engineering, University of Aberdeen, Aberdeen AB24 3UE, UK
3
Department of Electrical Engineering, Tshwane University of Technology, Pretoria 0183, South Africa
4
Department of Electrical Engineering, University of Nigeria, Nsukka 410001, Enugu State, Nigeria
*
Author to whom correspondence should be addressed.
Mathematics 2023, 11(16), 3596; https://doi.org/10.3390/math11163596
Submission received: 20 July 2023 / Revised: 16 August 2023 / Accepted: 17 August 2023 / Published: 19 August 2023

Abstract

:
In this study, the analytical design and electromagnetic performance comparison of a squirrel-cage induction motor (SCIM) and a wound-field flux switching motor (WFFSM) for high-speed brushless industrial motor drives is undertaken for the first time. The study uses analytical sizing techniques and finite element analysis (FEA) to model and predict the performance of both motors at a 7.5 kW output power. This study includes detailed equations and algorithms for sizing and modeling of both types of motors, as well as performance calculations that aid in motor selection, design optimization, and system integration. The main findings show that the SCIM has superior torque performance for starting and overload conditions, while the WFFSM offers advantages in power factor, efficiency over a wide operating range, and potential for higher peak power output. To this end, the WFFSM is capable of high-speed and high-efficiency operation while the SCIM is suitable for applications requiring variable speed operation. The validation study shows good agreement between analytical and FEA calculations for both motors. The results provide insights into the design and performance characteristics of both motors, enabling researchers to explore innovative approaches for improving their efficiency, reliability, and overall performance.

1. Introduction

Electric motors play a critical role in global energy conservation efforts, accounting for about half of all electrical energy consumed globally [1]. In recent years, there has been increasing interest in high-speed motors with low or no permanent magnet (PM) materials due to issues such as high cost, uncontrollable flux, and limited operating temperature associated with PM machines. Some examples of non-PM motors are squirrel-cage induction motors (SCIMs) and switched reluctance motors (SRMs). SCIMs have been widely used historically due to their robustness, low cost, manufacturing simplicity, and easy adaptation to high-speed operation [2,3]. In contrast, a relatively new class of machines belonging to the flux modulation family has recently emerged, such as the wound-field flux switching motor (WFFSM), which is characterized by features such as high torque density, robust rotor structure, and high-speed operation [4].
SCIMs consist of short-circuit copper or aluminum rotor bars that fit into rotor slots, requiring less conductor material due to the absence of brushes, commutators, and sliprings compared with slip-ring induction motors (SRIMs). As a result, SCIMs have higher efficiency than SRIMs. SCIMs are commonly used in various industrial applications, such as centrifugal pumps, industrial drives (e.g., running conveyor belts), large blowers and fans, machine tools, lathes, and other turning equipment [1]. Despite the advantages offered by SCIMs, they suffer some drawbacks such as high starting current and low efficiency under partial loads [2,5]. Similarly, although WFFSMs offer some attractive features as mentioned earlier, they are nonetheless prone to low power factor due to high leakage flux and high torque ripple due to the double-salient structure [6,7].
Therefore, the aim of this study is to compare SCIMs and WFFSMs, which, as magnetless and brushless motors, both offer low-cost and robust designs for high-speed industrial motor drives. While some studies have presented comparisons of WFFSMs to other machines, mainly in terms of wind generator and electric traction applications, there is little research on comparing SCIMs and WFFSMs to the family of three-phase low-power industrial motors. For example, WFFSMs have been compared to ferrite PM flux switching machines (PMFSMs) as wind generators [8] and switched reluctance machines (SRMs) as electric vehicle motors [9], with the ferrite PMFSM exhibiting higher torque density and efficiency and SRM displaying lower torque capability, saturation withstand capability and higher torque ripple, compared with WFFSM, respectively. On the other hand, SCIMs have been compared to other motors, such as line-start permanent magnet synchronous motors (LSPMSMs) [10], synchronous reluctance motors (SynRMs) [11], and SRMs [12], with the SCIM found to operate at a lower efficiency than all three motors.
To this end, the current study compares SCIMs and WFFSMs by using analytical sizing techniques to model, evaluate, and compare their electromagnetic performance based on the finite-element analysis (FEA) method. While both SCIMs and WFFSMs have distinct pros and cons, there has been limited research comparing their sizing, modeling, and performance specifically for high-speed industrial drive applications in the lower power range. SCIMs are commonly used in industry, but they face efficiency challenges at partial loads. WFFSMs show potential but need further evaluation across operating regimes. This study aims to provide a detailed comparison between SCIMs and WFFSMs based on analytical and FEA techniques. The results can guide design trade-offs and technology selection decisions for various industrial end-uses. This study considers the high-speed operating regimes of both machines at 7.5 kW output power, representing typical operating requirements. The analysis provides insights into the electromagnetic performance differences between the two machines. The rest of the paper is organized as follows: Section 2 presents the semi-analytical design and performance modeling techniques of the proposed SCIM and WFFSM. Section 3 reports the FEA no-load and on-load electromagnetic performance comparison, while Section 4 presents and discusses the electromagnetic performance comparison in terms of analytic and FEA calculations. The concluding remarks are provided in Section 5.

2. Sizing-Design Algorithms and Analytical Performance Calculations for SCIM and WF-FSM

SCIMs and WFFSMs represent very different motor technologies in terms of their operating principles. Their analytical designs are based on sizing equations that give the machine’s outer diameter as a function of design specifications such as the leakage factor (ke) and aspect ratio (kL). Performance-related values, such as efficiency (η), power factor (cosϕ), maximum airgap flux density (Bgmax), and stator electrical loading (As), are then imposed based on the machine type.

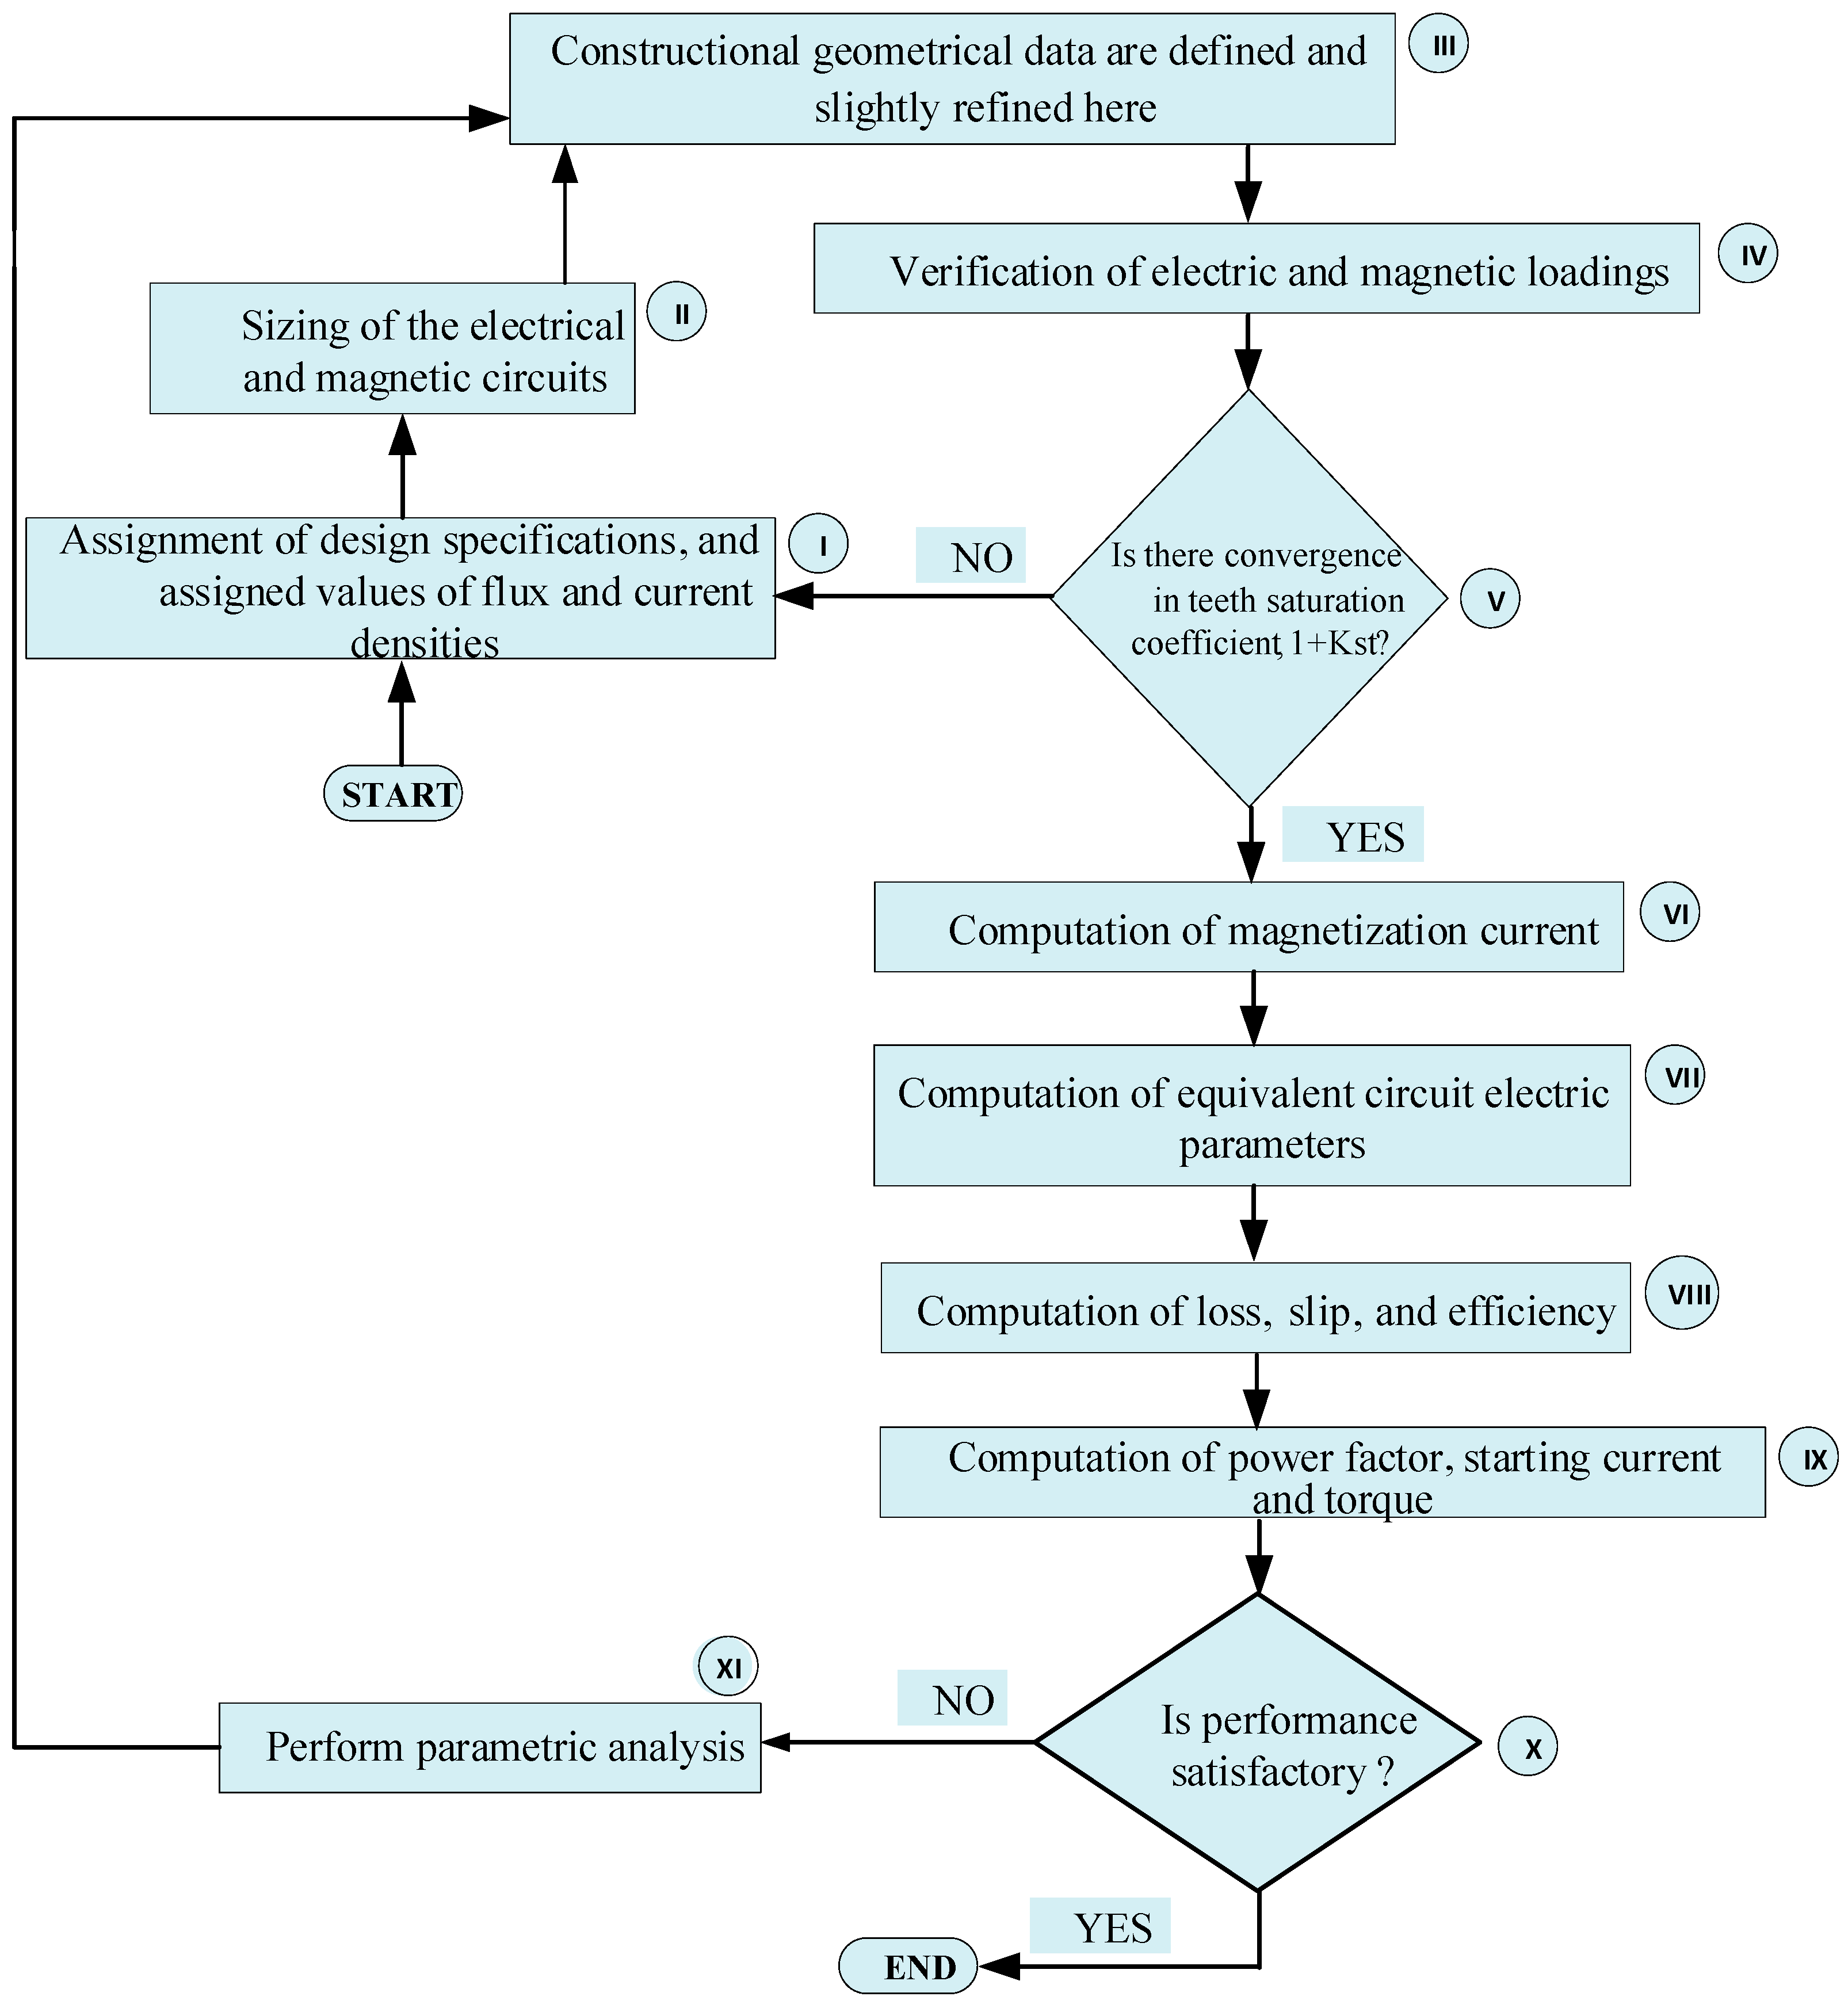
2.1. Design Process of SCIM

The operating principle of SCIM is based on the interaction between the rotating mutual airgap magnetic field and the rotor currents. As a varying magnetic field is required to produce the rotor current, there is a torque-proportional speed difference, commonly known as slip, between the airgap field and the rotor. The design steps for SCIM are shown in Figure 1.
As shown in Figure 1, the design process for SCIMs begins with establishing the design specifications in I, while the assigned values of flux densities and current densities are calculated in II. The stator bore diameter (Dis), stack length, stator slots, stator outer diameter, and stator and rotor slot dimensions are then determined in III, with all dimensions adjusted to standardized values. Electric and magnetic loadings are verified in IV. In V, the design process loops back to I and the tooth flux density is adjusted until the magnetic saturation coefficient (1 + Kst) of the stator and rotor teeth are equal to prescribed values. Once this loop is completed, stages VI to IX are processed by computing the magnetization current in VI, equivalent circuit parameters in VII, losses, rated slip (Sn), and efficiency in VIII, and then determining the power factor, locked rotor current and torque, breakdown torque, and temperature rise in IX. In step X, all performance metrics are checked, initiating a potential process reset in I if any metrics are found unsatisfactory. During this reset, geometrical data are refined via parametric analysis. These new optimal values are then implemented, allowing the process to progress until reaching step X once again. The iterative cycle continues until the point when performance criteria are met satisfactorily, signifying the termination of the process.

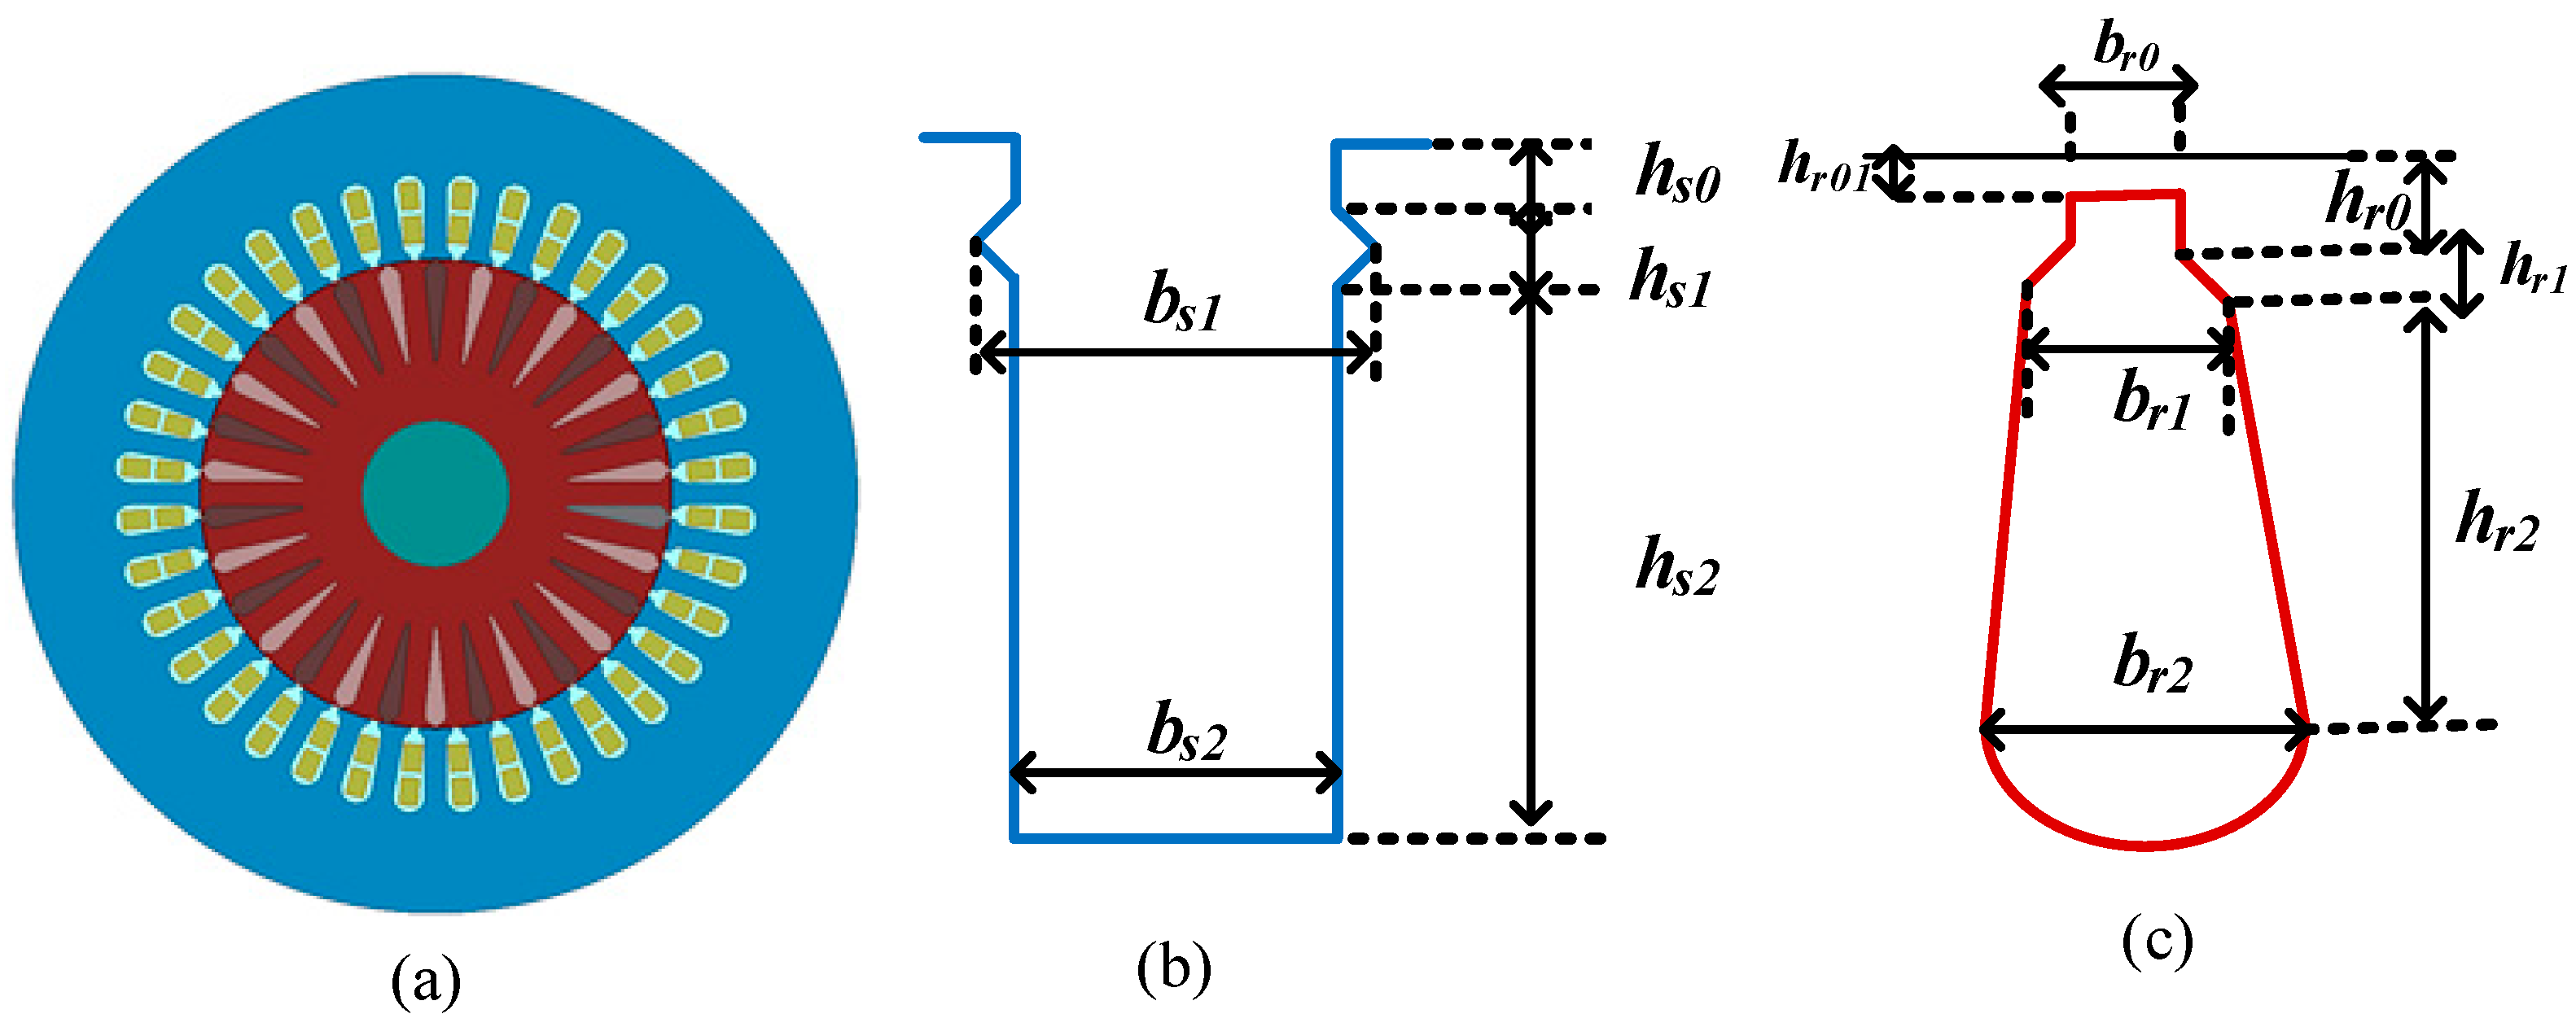
2.1.1. Design Sizing for SCIM

The stator bore diameter of the SCIM is given as [13]:
D i s S C I M = 2 p 1 2 S g a p π λ f C 0 3 ,
where p1, Sgap, λ, f, and C0 represent pole pairs, apparent airgap power, aspect ratio, supply frequency, and Esson’s constant (which is 147 × 10 3   J / m 3 ), respectively.
The pole pitch, τ S C I M , stack length, Lst(SCIM), and slot pitch, τ s S C I M , for dimensioning the SCIM are derived as follows:
τ S C I M = π D i s S C I M 2 p 1 ,   L s t S C I M = λ τ S C I M ,   τ s S C I M = τ S C I M 3 q .
The aspect ratio, pole pitch, stator slots per pole, are respectively represented as λ, τ S C I M , and q, while the stator outer diameter, Dos(SCIM), airgap length, and rotor outer diameter are approximated as follows:
D o s S C I M = D i s S C I M 0.62 ,
g S C I M = 0.1 + 0.012 × P n 3 ,
D o r S C I M = D i s S C I M g S C I M .
The rated power is denoted as Pn. The determination of the number of turns per phase, W1, depends on the airgap flux density, Bg(SCIM), and is evaluated as follows:
W 1 = 0.22 V S C I M K w 1 f α i τ S C I M L s t S C I M B g S C I M ,
where VSCIM, Kw1, and α i , represent supply voltage, stator winding factor, and pole spanning coefficient, respectively. The number of conductors per slot, nc(SCIM), is given as:
n c S C I M = a 1 W 1 p 1 q .
The number of current paths in parallel is denoted as a1. It should be emphasized that an even number of slots is required in a double-layer winding since there are two separate coils per slot. The rated current, Iin, and wire gauge diameter, dco, are defined as follows:
I i n = P n η cos ϕ 3 V S C I M ,
d c o = 2 I i n π a p J S C I M ,
where ap, J(SCIM), and ƞ represent conductors in parallel, current density, and efficiency, respectively.
Assuming all the airgap flux passes through the stator teeth, the useful slot area, Asu, and stator tooth width, bts, are respectively given as:
A s u = π d c o 2 a p n c S C I M 4 K f i l l ,
b t s = B g S C I M τ S C I M 0.96 B t s .
The fill factor and stator tooth flux density are represented by Kfill and Bts, respectively. For stator slot sizing, the lower width, bs1, higher width, bs2, and slot height, hs, are given as:
b s 1 = π D i n S C I M + 2 h o s + 2 h w N s b t s ,
b s 2 = 4 A s u t a n π N s + b s 1 2 ,
h s 2 = 2 A s u b s 1 + b s 2 .  
The lower slot height, wedge height, slot effective area, and number of stator slots are denoted as hos, hW, Asu, and Ns, respectively. If stator and rotor teeth produce the same effects, the teeth saturation factor (1 + Kst) is calculated as follows:
1 + K s t = 1 + F m t s + F m t r F m g ,
where Fmts, Fmtr, and Fmg represent stator tooth, rotor tooth, and airgap MMFs, respectively.
The end-ring current, Ier, and magnetization current, Iµ, are respectively calculated as:
I e r = I b 2 s i n π p 1 N r ,  
I μ = π p 1 F 2 2 3 W 1 K w 1 ,
where Ib, Nr, and F are the rotor bar current, number of rotor slots, and the magnetization MMF, respectively.
For the rotor slot sizing, the rotor slot pitch, τ r , and tooth width, btr, are respectively calculated as:
τ r = π D i n S C I M 2 g S C I M N r ,
b t r = τ r B g S C I M 0.96 B t r .
The rotor tooth flux density is represented as Btr. The rotor slot geometry is obtained by using the slot area, Ab, equation given as follows:
A b = π 8 d 1 2 + d 2 2 + d 1 + d 2 h r 2 .  
The diameters d1 and d2 are obtained simultaneously from
d 1 = π D r e 2 h o r N r b t r π + N r   and   d 1 d 2 = 2 h r t a n π N r .  
The outer diameter of the rotor, rotor slot height, height of rotor back core, and lower height of the rotor slot are denoted as Dor(SCIM), hr, hcr, and hor, respectively. The maximum diameter of the shaft, Dshaft, is obtained as follows:
D s h a f t m a x D i s S C I M 2 g S C I M 2 h o r + d 1 + d 2 2 + h r + h c r .
The selection of the shaft diameter is determined by the rated torque, taking into account mechanical design considerations and previous knowledge. It is crucial to emphasize that these parameters will be recalculated if they do not meet the design objectives.

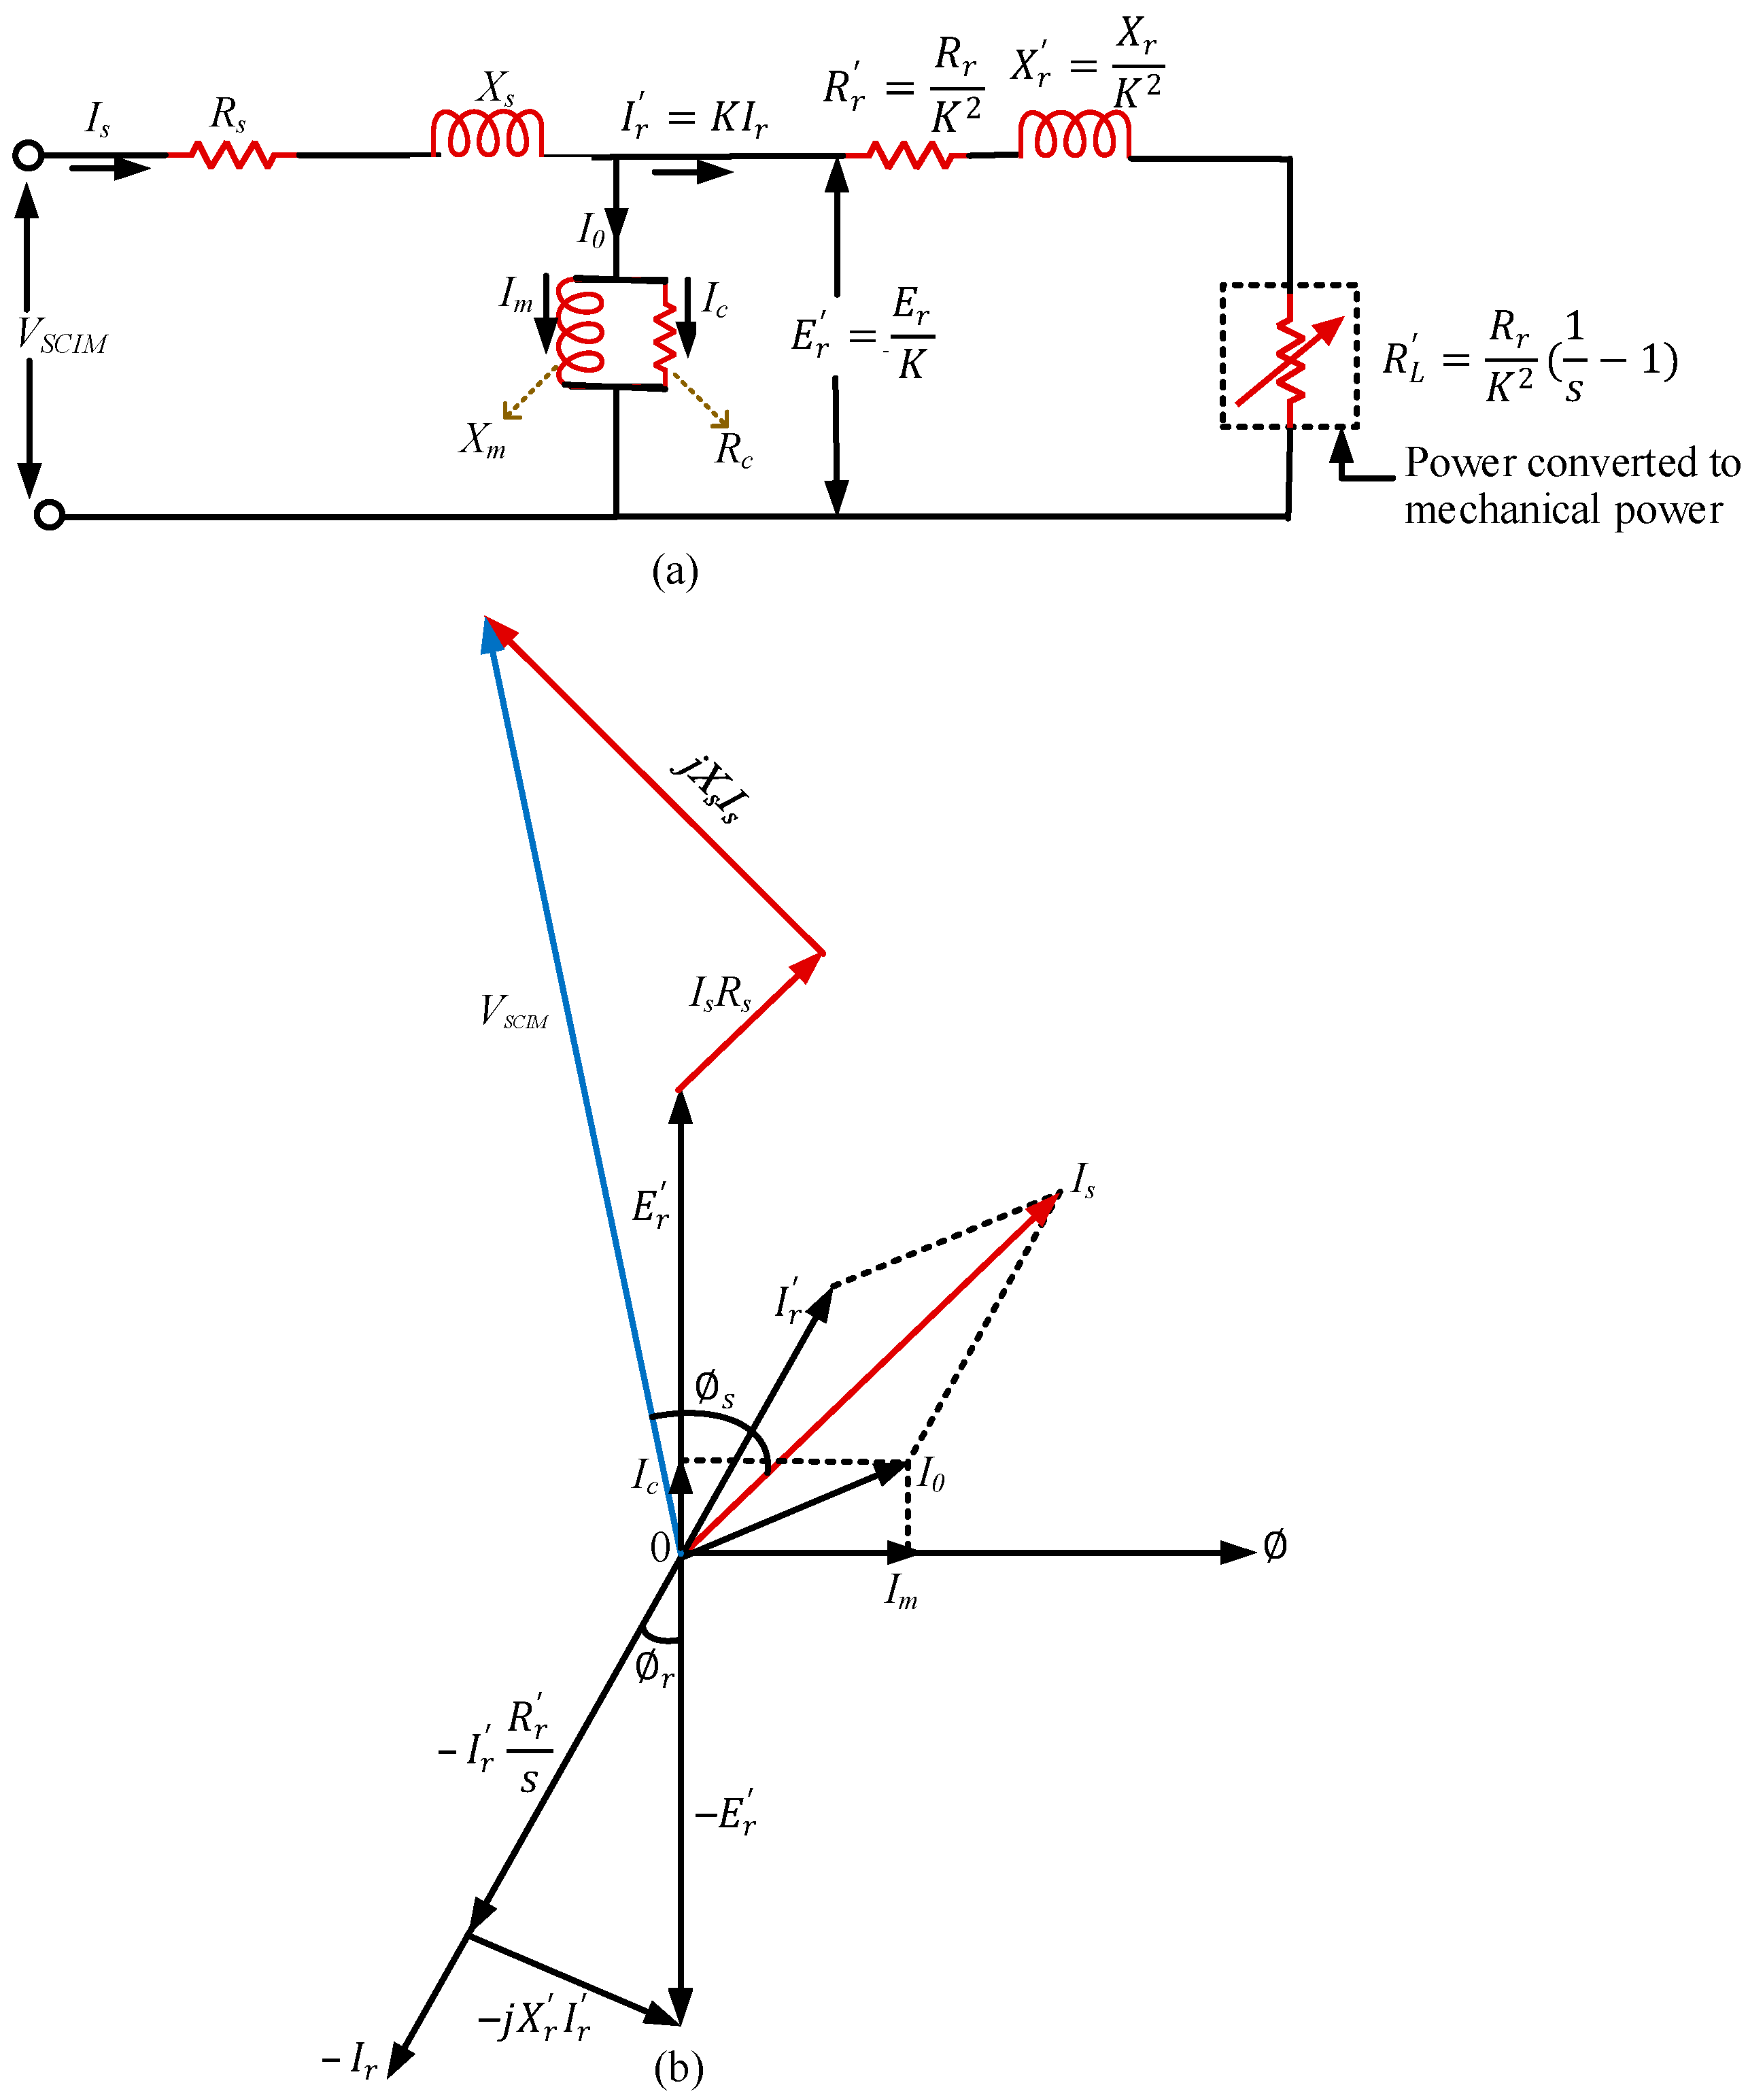
2.1.2. Performance Calculations for SCIM

The equivalent circuit and phasor diagrams of the SCIM, which are vital tools for understanding its performance behavior, are presented in Figure 2.
The equivalent circuit in Figure 2a, simplifies the SCIM’s electrical representation, enabling analysis of current flow, voltage drop, and power transfer. On the other hand, the phasor diagram of Figure 2b graphically depicts the motor’s voltages and currents, facilitating visualization of phase relationships. In Figure 2, Rs, Xs, Xm, Rc, R r , Rr, X r , Xr, K, and R L represent stator resistance, stator inductive reactance, magnetizing reactance, core loss component, rotor resistance referred to stator, rotor resistance, rotor inductive reactance referred to stator, transformation ratio, and load resistance referred to the stator, respectively. These parameters aid in the calculation of performance characteristics such as power factor, rated slip, rated torque, efficiency, and magnetization behavior of the motor. The phase parameters of stator and rotor are respectively given as:
R s = ρ c o L c W 1 A c o a 1 ,
X s = 2 μ 0 ω 1 L W 1 2 λ s + λ d s + λ e c p 1 q ,
R r = 4 m W 1 K w 1 2 R b e N r ,
X r = 4 m W 1 K w 1 2 X b e N r ,
while the magnetizing reactance is computed as:
X m = V S C I M I μ 2 R s 2 X s L .
The coil length, copper resistivity, permeability of free space, magnetic wire cross section, slot differential and end ring connection coefficients, equivalent rotor bar resistance and reactance, and phase rotor resistance are denoted as Lc, ρ c o , μo, Aco, λs, λds, λec, Rbe, and Xbe, respectively.
The rated slip sn, starting current Istr, and starting torque Tstr of the motor are respectively defined as:
s n = P A l P n + P A l + P m v + P s t r a y ,
I s t r = V S C I M E r j X s = V S C I M R s + R r s = 1 2 + X s + X r s = 1 2 ,
T s t r = 3 p 1 R r s = 1 I s t r 2 ω n ,  
where PAl, Pmv, and Pstray represent rotor cage losses, mechanical/ventilation losses, and stray losses, respectively.
The power factor of the electrical motor is computed as:
P F = P i n 3 V r m s I r m s = cos θ v θ i ,  
where Pin is the input power of the motor, Irms and Vrms are the root mean square (RMS) values of both the current (IS) and voltage (VSCIM), while θ v and θ i are the phase of voltage and current, respectively.
On the other hand, the rated shaft torque, Tn, and torque ripple, TR, are respectively computed as follows:
T n = P n 2 π f p 1 1 s n ,
T R = T m a x T m i n T a v g ,
where T(max) is the maximum torque, T(min) is the minimum torque, and Tavg is the average torque.
While the motion equation is given as:
T n T L = J d ω r d t ,
where TL is the load torque and J is the inertia constant.
Based on the classical equation, efficiency of the electrical machine is defined as:
η = P o u t P i n = P o u t P o u t + P l o s s ,
with the Pout and total loss (Ploss) calculated as
P o u t = 3 I r 2 R r 1 s s P m v P s t r a y ,
P l o s s = P c u + P A l + P i r o n + P m v + P s t r a y ,
where Pcu is the stator winding losses and Piron is the core loss.
The core loss is computed based on the formula proposed by [13] as:
P i r o n = 7.16 f 50 1.3 G t s + 5.12 f 50 1.3 G y l + 31.03 × 10 7 N r f P n 2 G t s + N s f P n 2 G t r ,  
where Gts, Gyl, and Gtr stand for stator tooth, yoke, and rotor tooth masses, respectively.
The other loss components are defined as:
P c u = 3 R s I i n 2 ,   P A l = 3 R r I i n 2 ,   P m v = 0.01 P n ,   P s t r a y = 0.01 P n .
In the study, Pmv represents mechanical losses that are assumed to be 1% of the nominal power Pn. This value is chosen based on standards referenced in [13], which suggest using 0.01 Pn. Pstray represents stray load losses, which account for additional losses due to harmonic fields and leakage fluxes not accounted for in the analytical model. Based on [13], we conservatively assume these to be 1% of Pn. The reason for choosing these specific values is the challenge of accurately measuring losses in high-efficiency machines. Even small measurement errors can cause significant uncertainty in calculated loss percentages. Given the four-pole design of our SCIM, the 1% contributions for both Pmv and Pstray follow recommended practice to ensure the overall losses and efficiency are within acceptable bounds.
The calculations in this section provide valuable insights into the performance of SCIM, enabling informed decisions for motor selection, design optimization, and system integration. Furthermore, a comprehensive understanding of the performance characteristics empowers researchers to explore innovative approaches and strategies for improving the efficiency, reliability, and overall performance of SCIMs.

2.2. Design Process of WFFSM

WFFSM is a double-salient pole motor with a robust rotor and yields sinusoidal flux linkages. The operating theory of the WFFSM, whereby the flux generated in the stator by the field coils is switched between adjacent armature coils and then linked through the rotor, is clearly elucidated in ref. [14].

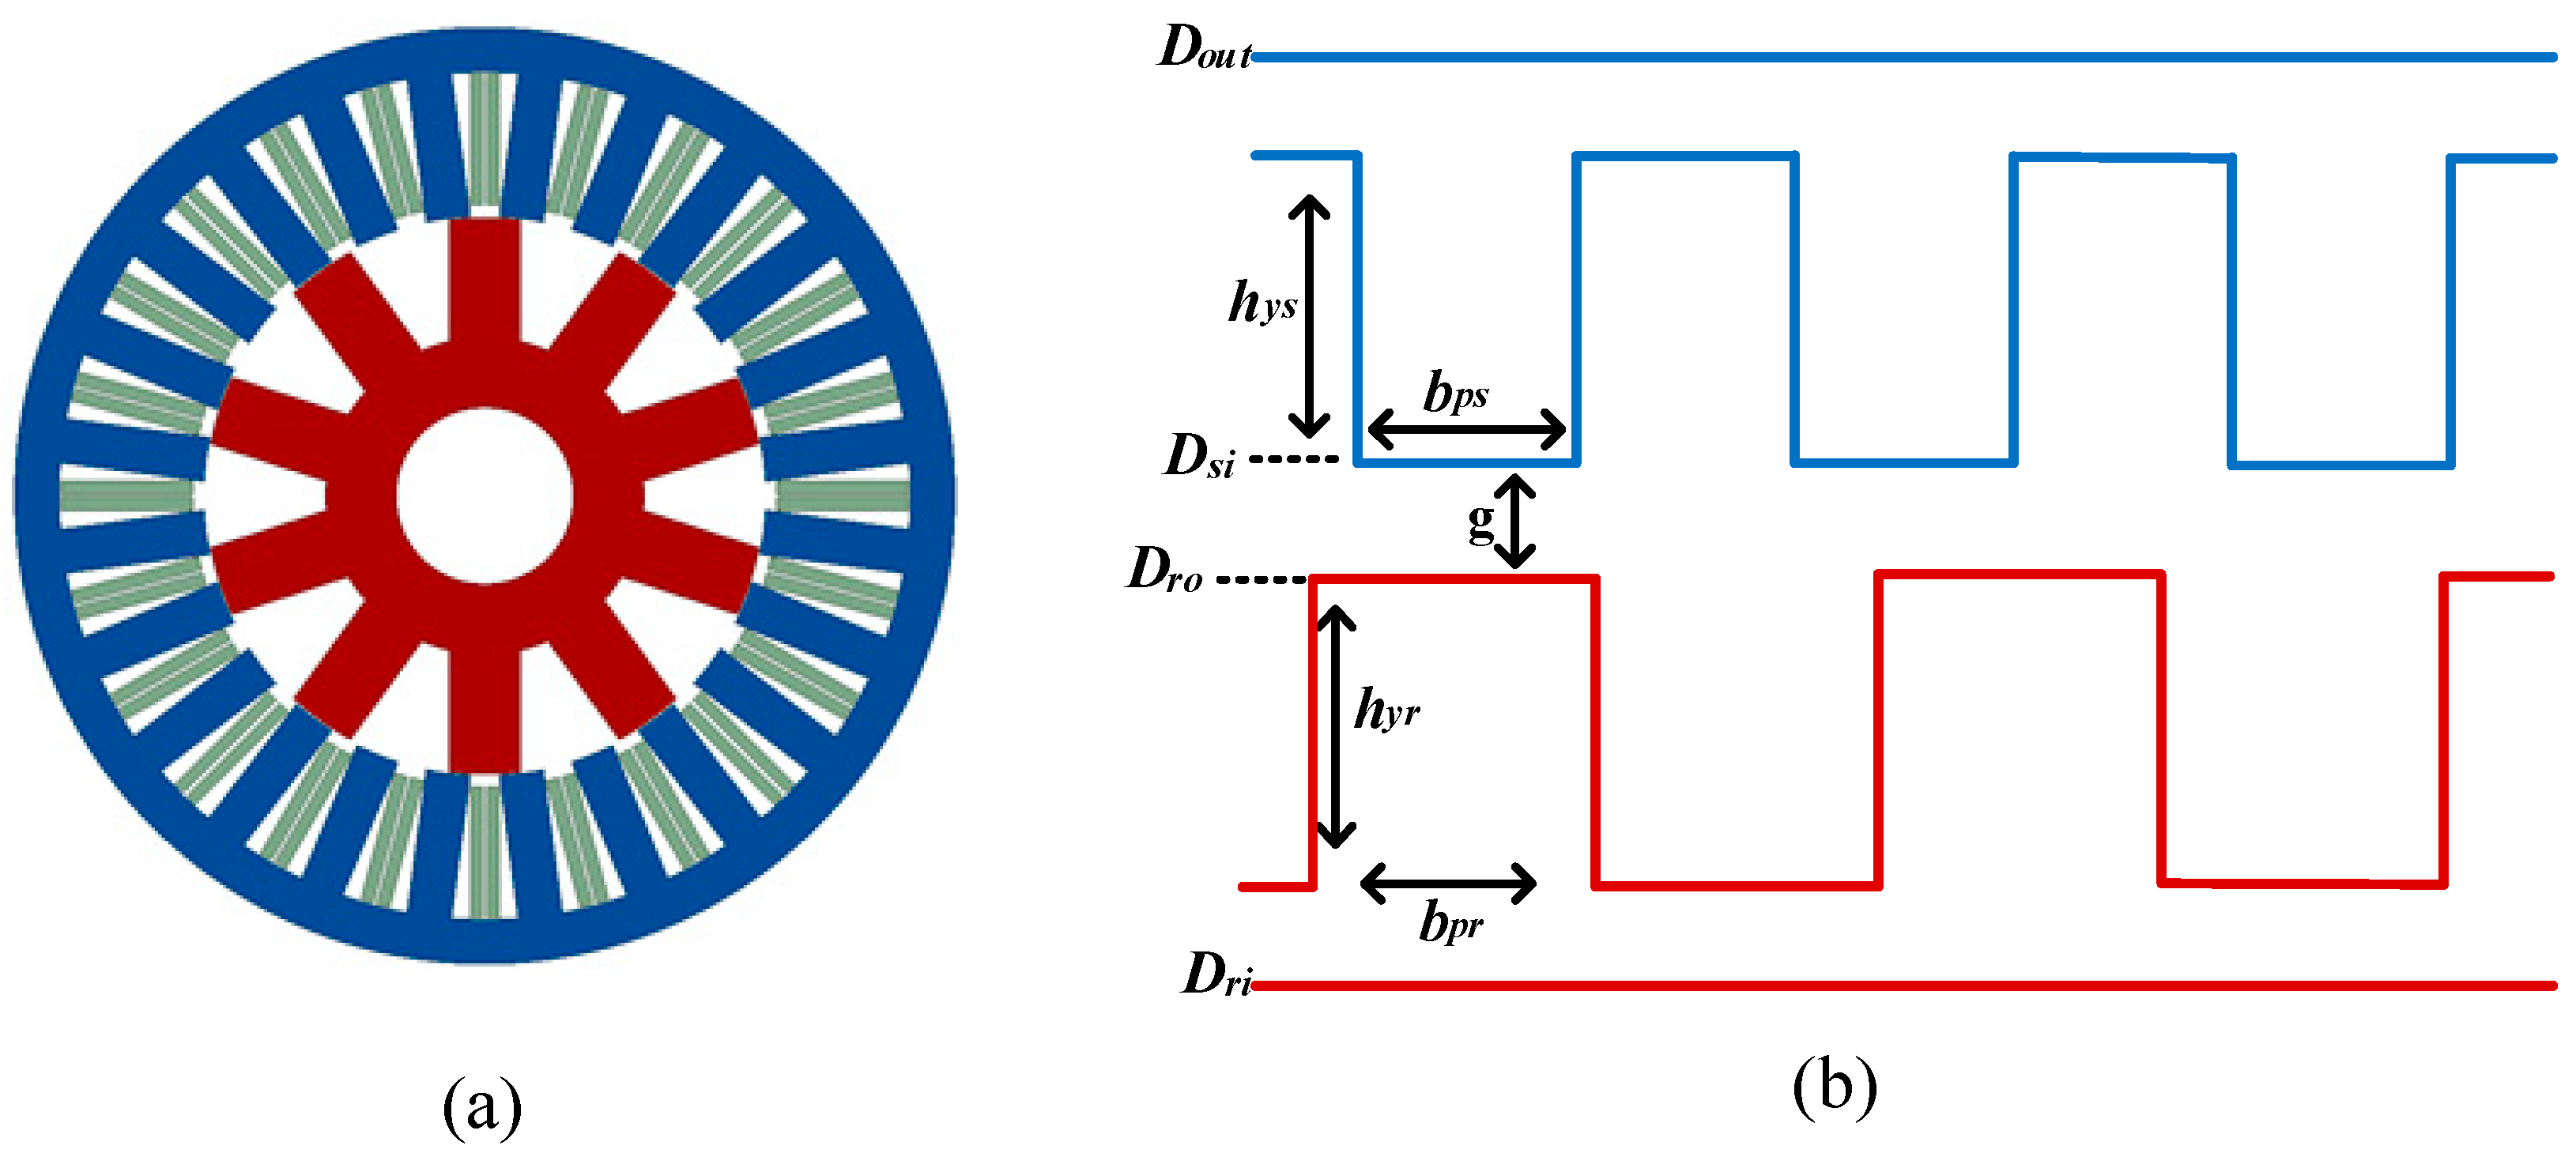
2.2.1. Design Sizing for WFFSM

Figure 3 shows the flowchart for setting up the design process of the WFFSM. The design process starts at I with a selection of appropriate topology of the machine (slots/pole combination) which normally should consider the rotor mechanical phase and phase number of the proposed motor. Thereafter, the complete specification of the technical data, such as rated torque, power factor, target efficiency, and supply voltage, is made in II. In III, the machine is then sized based on the generic torque per rotor volume (TRV) equation as follows [15]:
D o u t = 4 T e P s π 2 P r k e k L Λ 0 3 A Σ B g η c s 3 ,
where Dout is the stator outer diameter, Te is electromagnetic torque, Λ 0 is the split ratio, Ps is the number of slots for the phase windings, Pr is the number of rotor slots, ke is a factor that accounts for leakage, As is the electrical loading of the phase windings, Bg is the peak airgap flux density, η is the efficiency, kL is the aspect ratio, cs is the stator tooth arc factor, and A is the summation of the preselected electrical loading for both the phase and field windings.
Thereafter, parameters such as outer and inner diameter of stator and rotor and stack length are obtained. In IV, the stator and rotor dimensions such as stator pole width (bps), stator yoke height (hys), rotor pole width (bpr), and rotor yoke height (hyr) are scaled to the same value as follows:
b p s = h y s = b p r = h y r = π D i n W F F S M P s ,
where Din(WFFSM) is the stator inner diameter and Ps is the stator slot number.
If the design topology is not satisfied in VII, parametric analysis will be carried out in VIII to fine tune the stator and rotor dimensions. These new optimal values are subsequently integrated into the 2D FEM modeling phase of step VI and the iterative cycle continues until the design topology is achieved.

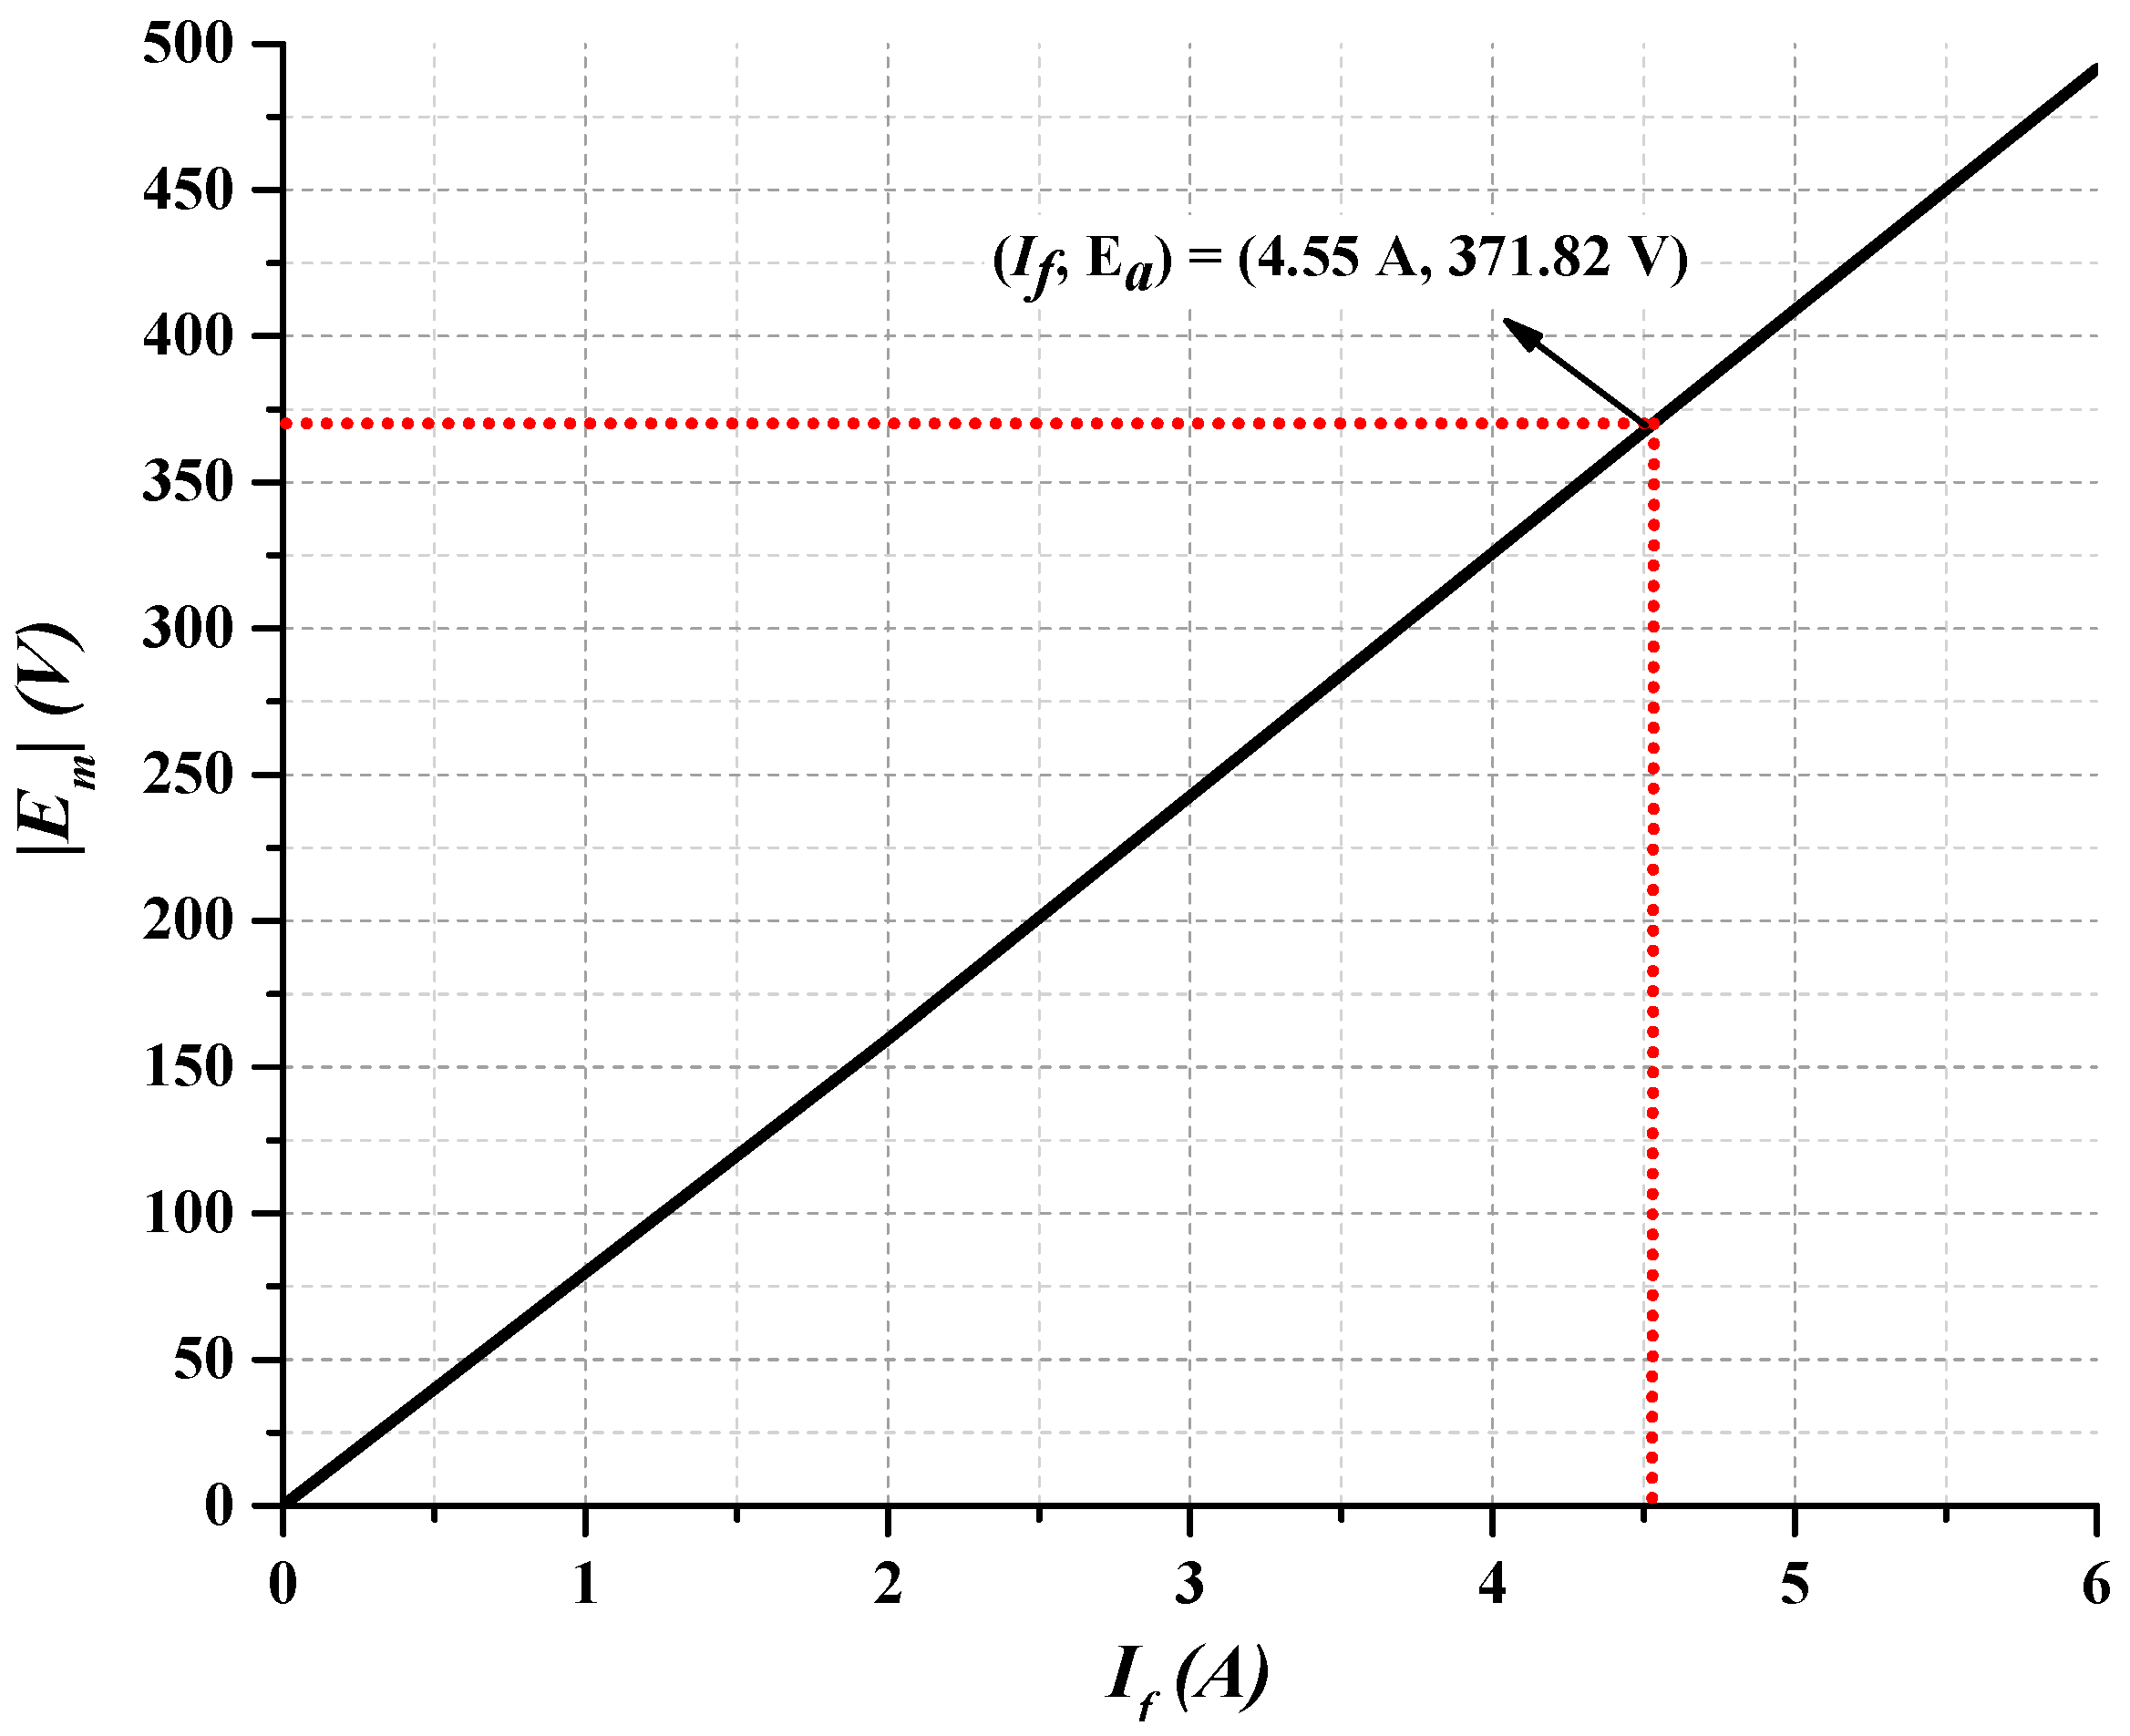
2.2.2. Performance Calculations for WFFSM

The performance characteristics of a WFFSM are crucial for optimizing its design and understanding its capabilities. By analyzing parameters such as power, electromotive force (EMF), current, torque, efficiency, and core loss, engineers gain valuable insights into the machine’s performance, aiding in the selection of optimal designs. In this section, we establish and relate these performance characteristics with those of the SCIM. Additionally, the equivalent circuit and phasor diagram of the WFFSM are presented in Figure 4 to provide model representation of the motor.
The equivalent circuit and phasor diagram in Figure 4 provide valuable insights into the motor behavior of the WFFSM. These representations promote the analysis of the flow of current, voltage distribution, and power transfer within the motor. By examining the equivalent circuit and phasor diagram, a deeper understanding of the interplay between the field winding, armature winding, and the magnetic field is achieved, providing a foundation for studying the motor’s performance characteristics and optimizing its design. In Figure 4, Vs, Ia, Ra, Ls, Xs, Za, Ea, Rf, If, , and δ represent phase voltage, armature current, armature resistance, WFFSM inductance, reactance, impedance, back-EMF, field resistance, field current, phasor angle, and load angle, respectively.
Assuming that sinusoidal armature current is injected into phase winding of the WFFSM in phase with back-EMF to produce unidirectional power, the input power, considering negligible resistance, is expressed as follows:
P i n = 1 T 0 T e a t · i a t d t ,
where e a t = E m s i n 2 π T t and i a t = I m s i n 2 π T t , m is the phase number, and Em and Im are the magnitude of sinusoidal phase back-EMF and current, respectively. Also, ea(t) can be calculated as:
e a t = d ψ m d t = n p h d ϕ m d θ d θ d t = n p h d ϕ m d θ ω r = ω r i f d M f a d θ ,  
where ψm, nph, θ, ϕ m , ωr, if, and Mfa are total flux linkage, winding turns per phase, rotor position, flux per turn, rotor electrical angle velocity, field current, and mutual inductance between the field and armature windings, respectively.
The peak and field currents for the WFFSM can be calculated as:
I m = 2 P i n 3 E m P F ,  
i f = J f α S f N f ,  
where PF, Jf, α, Sf, and Nf are power factor, current density, slot filling factor, slot area, and number of turns of the field windings, respectively. Moreover, by applying the co-energy concept to the basic geometry of WFFSM, it has been shown in [16] that the electromagnetic torque (Te) is given as:
T e = i a i f d M f a d θ .
The importance of Equation (46) is that, as in the DC machine, torque can be independently controlled using either the armature or field currents.
Since the WFFSM is doubly excited, unlike the SCIM, the following equation is devised based on Figure 4 to numerically approximate the rated field current from the back-EMF (Em):
E a = V s I a R a 1 j .  
The phase resistance (Ra) and the field winding (Rf) resistance are evaluated using cross-sections of the slot phase winding information as in [15]:
R a = 2 Z a N p h 2 ρ c u L s t A p h ,  
R f = 2 Z f N f 2 ρ c u L s t A f ,  
where Nph and Nf are the turns number per coil for the phase and field windings, ρ c u is the resistivity of copper at room temperature, Aph and Af are the area per coil for the phase and field windings, and Za and Zf are the number of coils for the armature and field windings. The phase and field winding copper losses at rated conditions are calculated respectively as:
P c u = 3 I a 2 R a ,
P f = I f 2 R f .
The core losses are approximated from the sum of the hysteresis and eddy current losses and calculated by means of the modified Steinmetz empirical equation given in [15] as:
P c o r e = C m B g m a x σ f e β G ,  
where Cm, G, β, σ, and B g m a x represent the material coefficient, the mass of the corresponding iron part, the exponent of the machine’s electrical frequency, the exponent of the peak airgap flux density, and the maximum flux density of the airgap, respectively.
The output power is evaluated as:
P o u t = 2 π n s 60 T a v g .  
The output power as a function of the load-angle ( δ ) is given as:
P o u t = 3 V s E a X s sin δ ,  
where ns is the motor speed in rpm and Tavg is the average torque.
The power factor and efficiency are calculated as the same equations of (31) and (35), respectively. Lastly, the torque per volume (Td) and torque per mass (Tm) of the motors can be determined using:
T d = 4 T a v g π D o u t 2 L s t ,
T m = T a v g m a s s .
In summary, this section outlines the sizing, design algorithms, and analytical performance calculations for both the SCIM and WFFSM. The step-by-step design processes are presented for each machine, highlighting key equations for determining dimensions, winding parameters, and performance metrics.
For the SCIM, the design process focuses on establishing specifications, calculating flux densities and current densities, determining stator and rotor dimensions, verifying loadings, and iteratively adjusting parameters until performance criteria are met. Critical sizing equations defines the stator bore diameter, stack length, slot pitch, and outer diameter. Performance calculations enable analysis of the equivalent circuit, losses, rated slip, efficiency, and other characteristics.
The design process for the WFFSM begins with selecting an appropriate slots/pole combination and specifying technical data such as rated torque and power factor. The machine is then sized based on the torque per rotor volume equation. Stator and rotor dimensions are scaled and parametric analysis fine-tunes the geometry. Back EMF, torque, power, losses, and other performance metrics are analytically derived.
In summary, the theoretical design algorithms and performance calculations provide valuable insights into the electrical and mechanical characteristics of the SCIM and WFFSM. The next section focuses on FEA modeling of both machines. By combining theoretical foundations with computational simulations, more accurate and efficient models can be developed to conclusively compare the two motors. This will elucidate their strengths and weaknesses, guiding future optimization for high-speed brushless industrial AC motors.

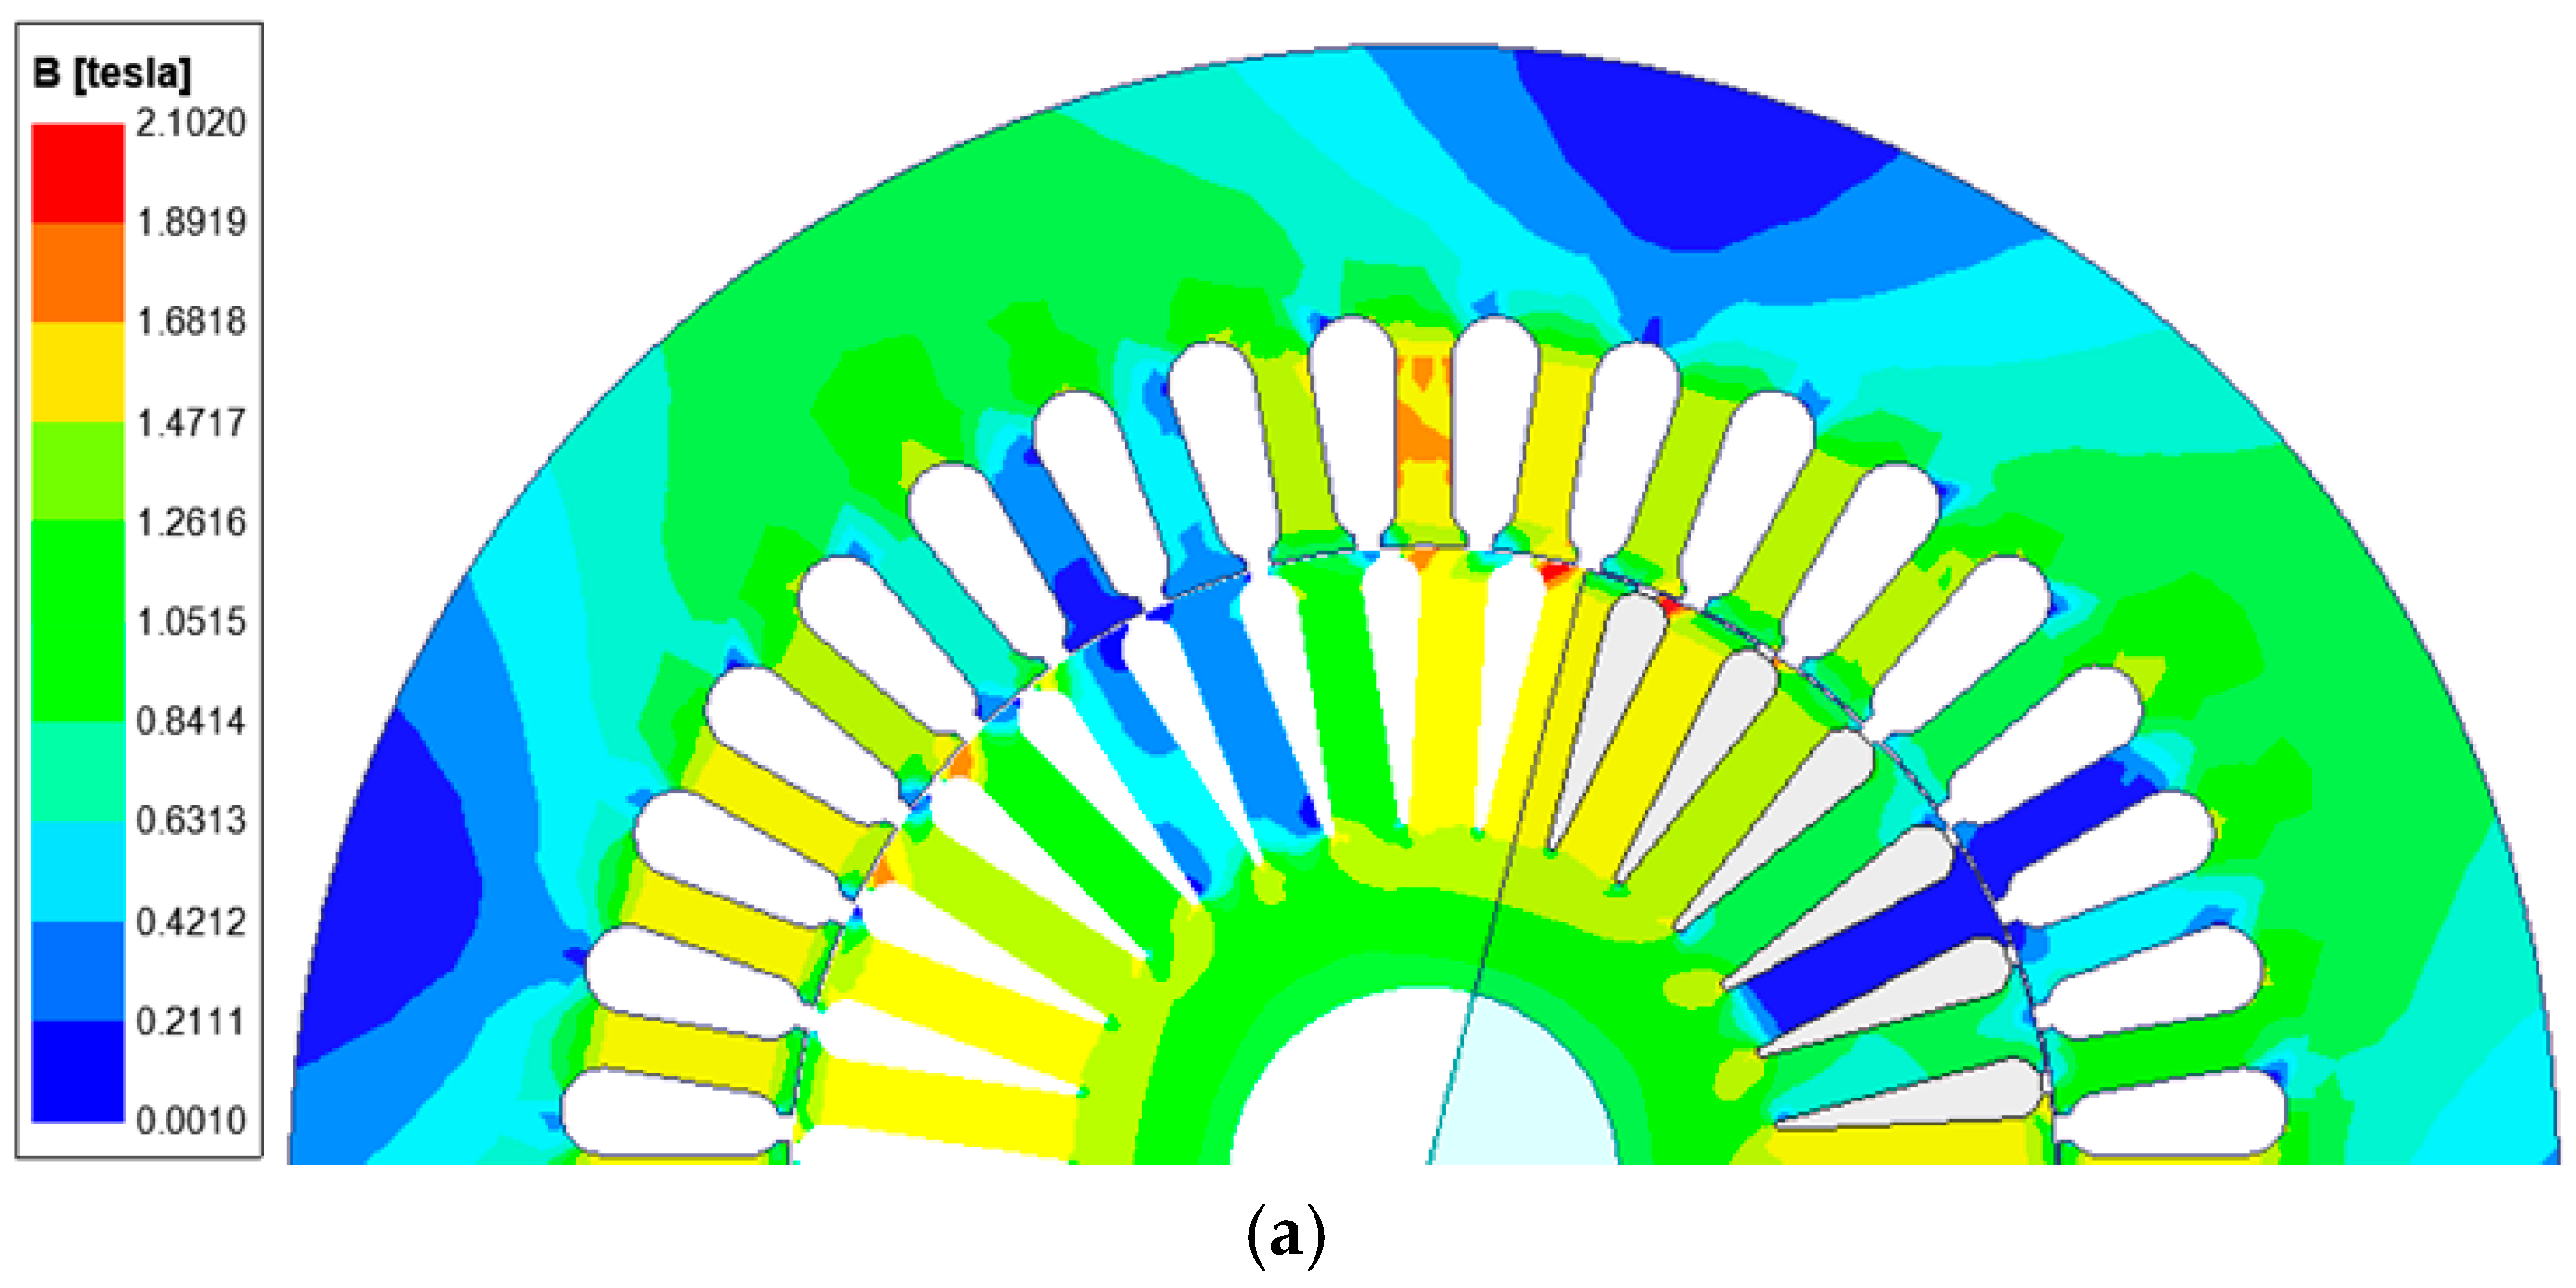
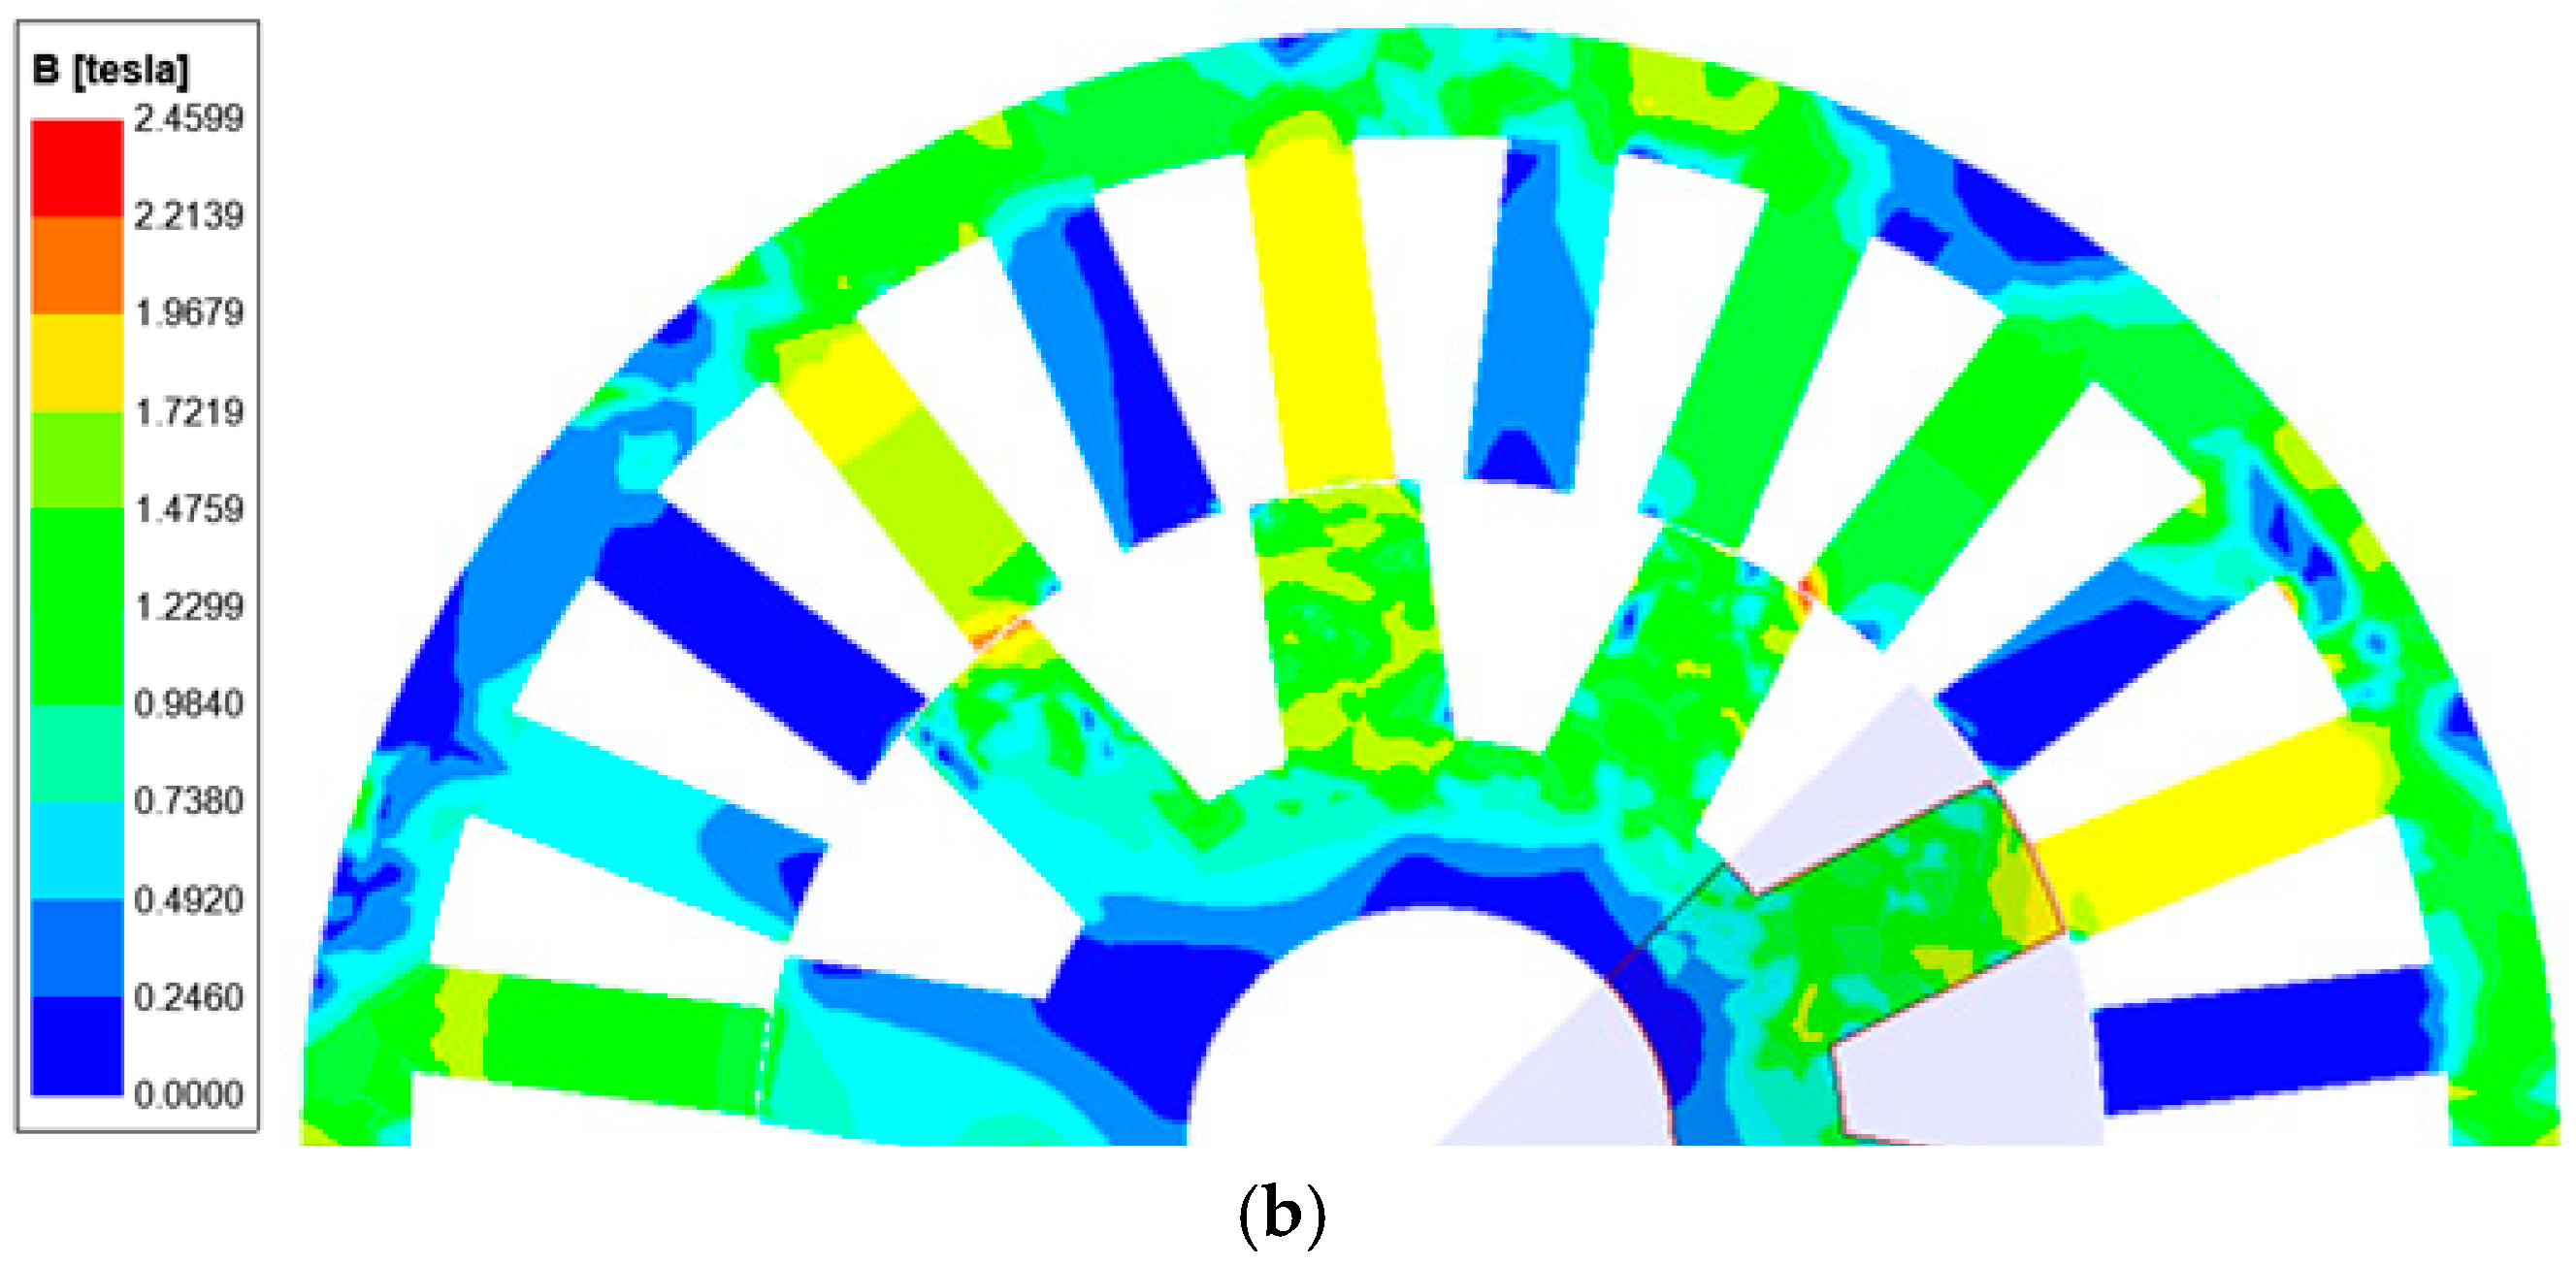
3. FEA Design and Modeling

The selected SCIM is a three-phase four-pole motor with 48 stator slots and 44 rotor bars. Figure 5 is the preliminary design of the SCIM in FEA software, as well as the stator and rotor slot dimensions. The specifications and sizing parameters, which are based on equations in Section 2.1.1., are presented in Table 1.
For the WFFSM, a 24-stator slot 10-rotor pole design is selected. In the preliminary design, the split ratio, Ʌ0, is maintained, same as for the SCIM. For fair comparison, other parameters of the WFFSM that are kept similar to those of the SCIM are output power (7.5 kW), supply frequency (50 Hz), number of phases (3), fill factor (0.45), target power factor (0.83), and target efficiency (0.895 p.u.). Also, the core material used in both SCIM and WFFSM is M400-50A. The FEA model and slot dimensions of the WFFSM are shown in Figure 6. The design parameters of the WFFSM evinced from Section 2.2.1 are presented in Table 2.
Based on Table 1 and Table 2, it can be observed that both SCIM and WFFSM have different stator outer diameters of 210.8 mm and 254 mm, respectively. These variations can be attributed to their structural differences and operating principles. The WFFSM incorporates a wound-field configuration, which requires additional space for the field winding and magnetic components, leading to a larger outer diameter. Meanwhile, the SCIM utilizes squirrel-cage windings for its magnetic-field generation, resulting in a comparatively smaller outer diameter.
The back-EMF of the WFFSM, as evaluated using the technique proposed in Equation (46), is 371.8 V. The field current, when varied from 0 to 4.55 A, yields the no-load characteristic curve shown in Figure 7. For rated conditions, the field current value was later extrapolated to 7.25 A to achieve the target output power.
The calculated flux density maps for the SCIM and WFFSM are compared under rated conditions in a static 2D-FEA transient simulation, as shown in Figure 8. The flux density plots of the WFFSM and SCIM show distinct differences in airgap flux density. The WFFSM exhibits a higher peak value of 2.5 T compared with the SCIM’s peak value of 2.1 T. These variations stem from the different design and operational principles of the machines, with the WFFSM’s flux modulating configuration contributing to its higher airgap flux density, with potential to enhance torque production and overall machine performance.

4. Results and Discussion

This section is used to present results on the electromagnetic evaluation and performance comparison of the SCIM and WFFSM under transient steady-state and dynamic on-load conditions. The motor inertia and damping constants are set the same during the simulation of both motors to accurately predict their response under varying load inputs. The highlight of incorporating the motor inertia is to determine how quickly the sampled motors will respond to changes in the load torque, as well as the ability to maintain stable speed under different loads. Damping, on the other hand, is a measure of the motors’ resistance to oscillation or vibration. For this study, the motors’ inertia and damping constant are both set at 0.0901 kg∙m2 and 0.00932 Nm∙s/rad, respectively.

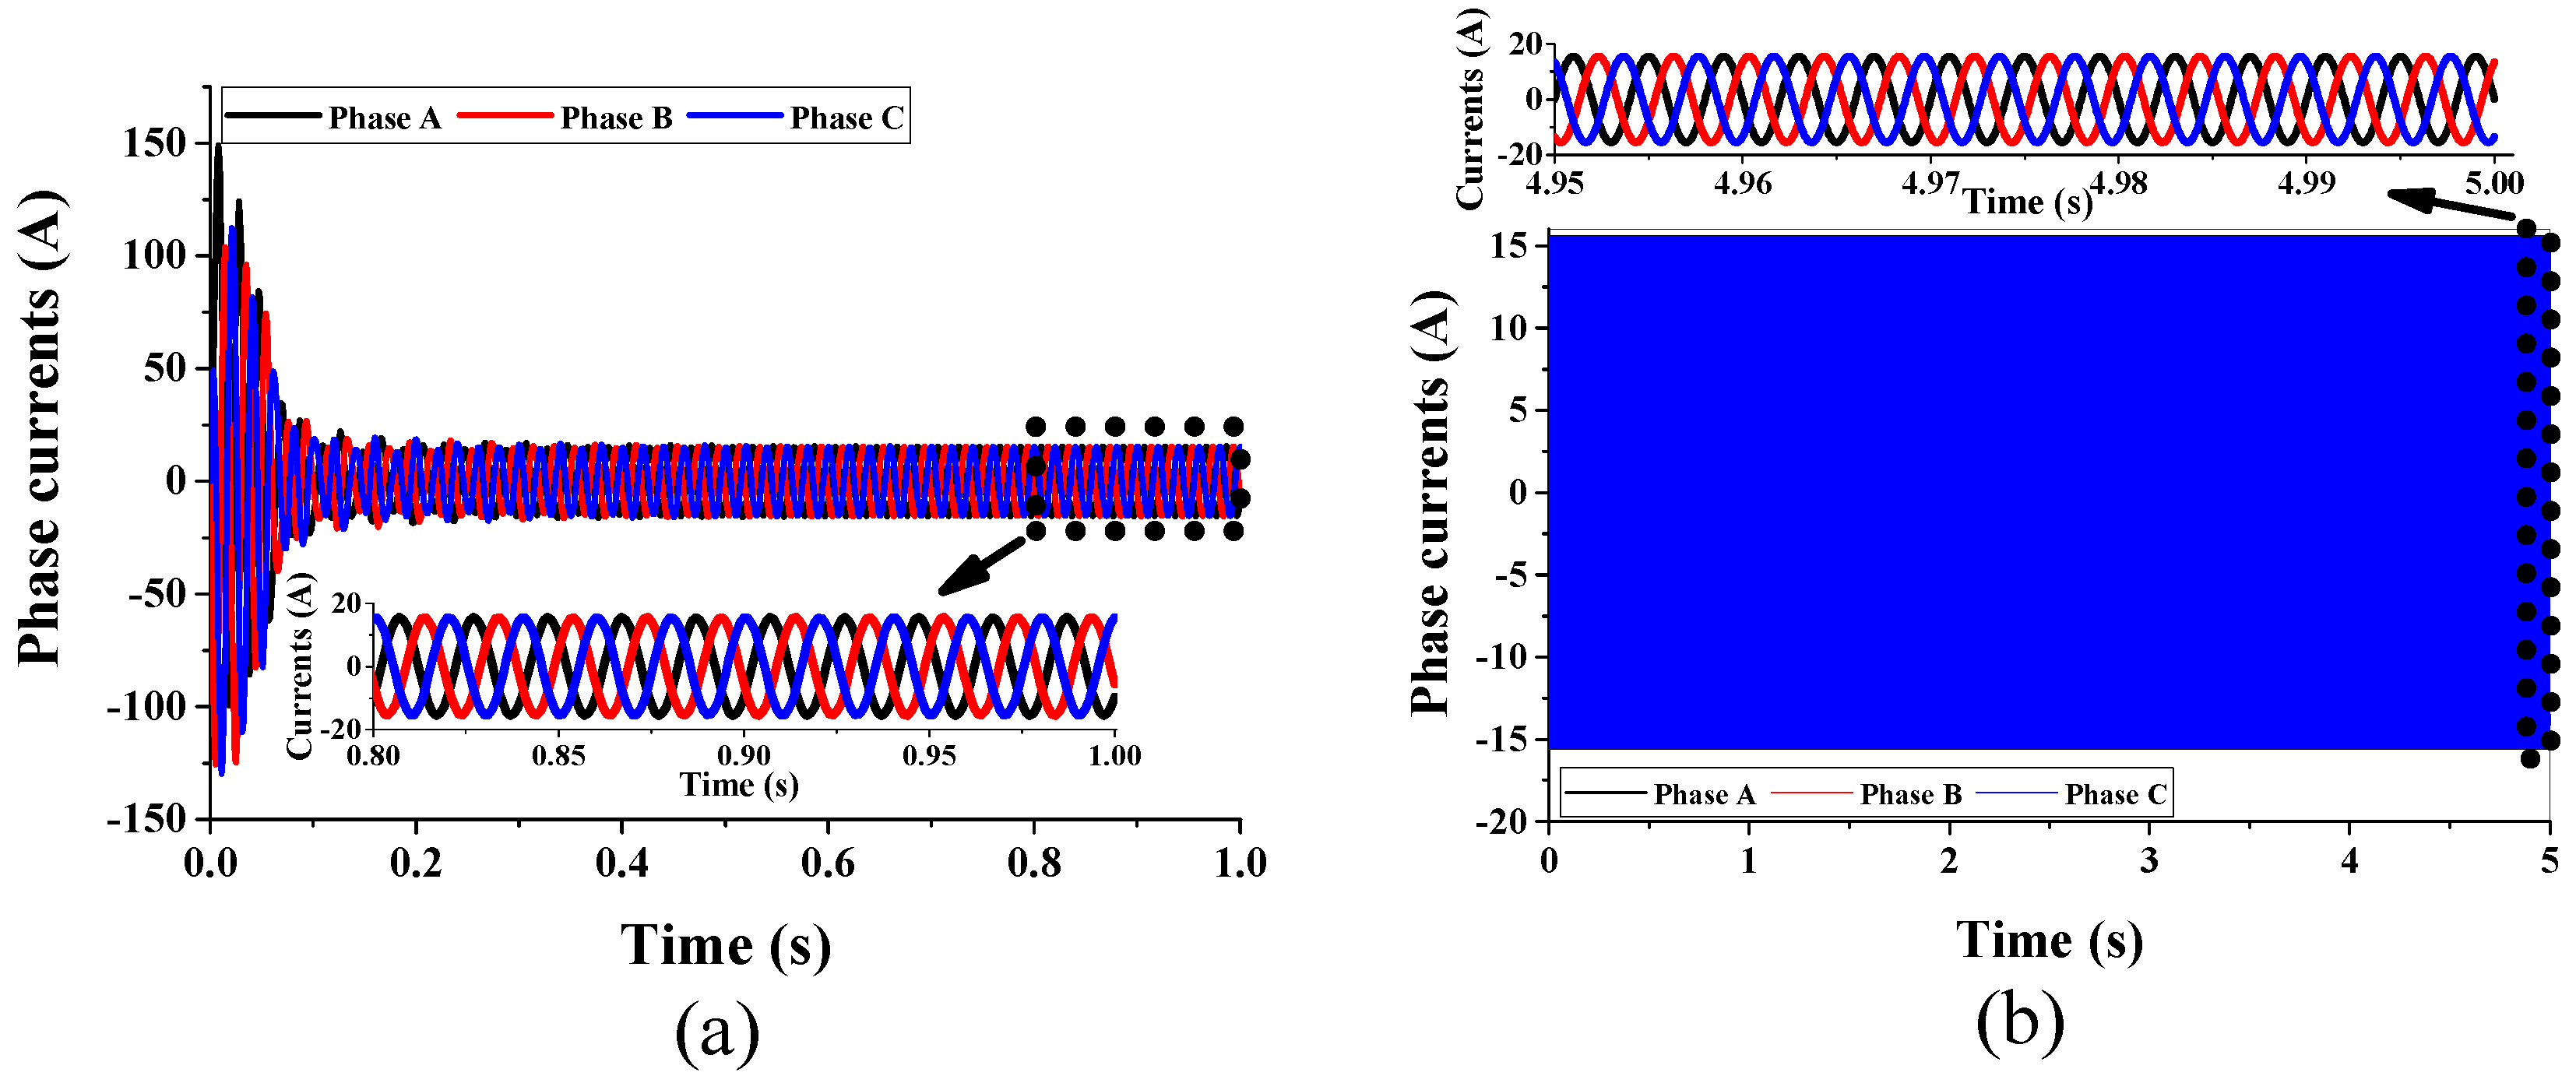
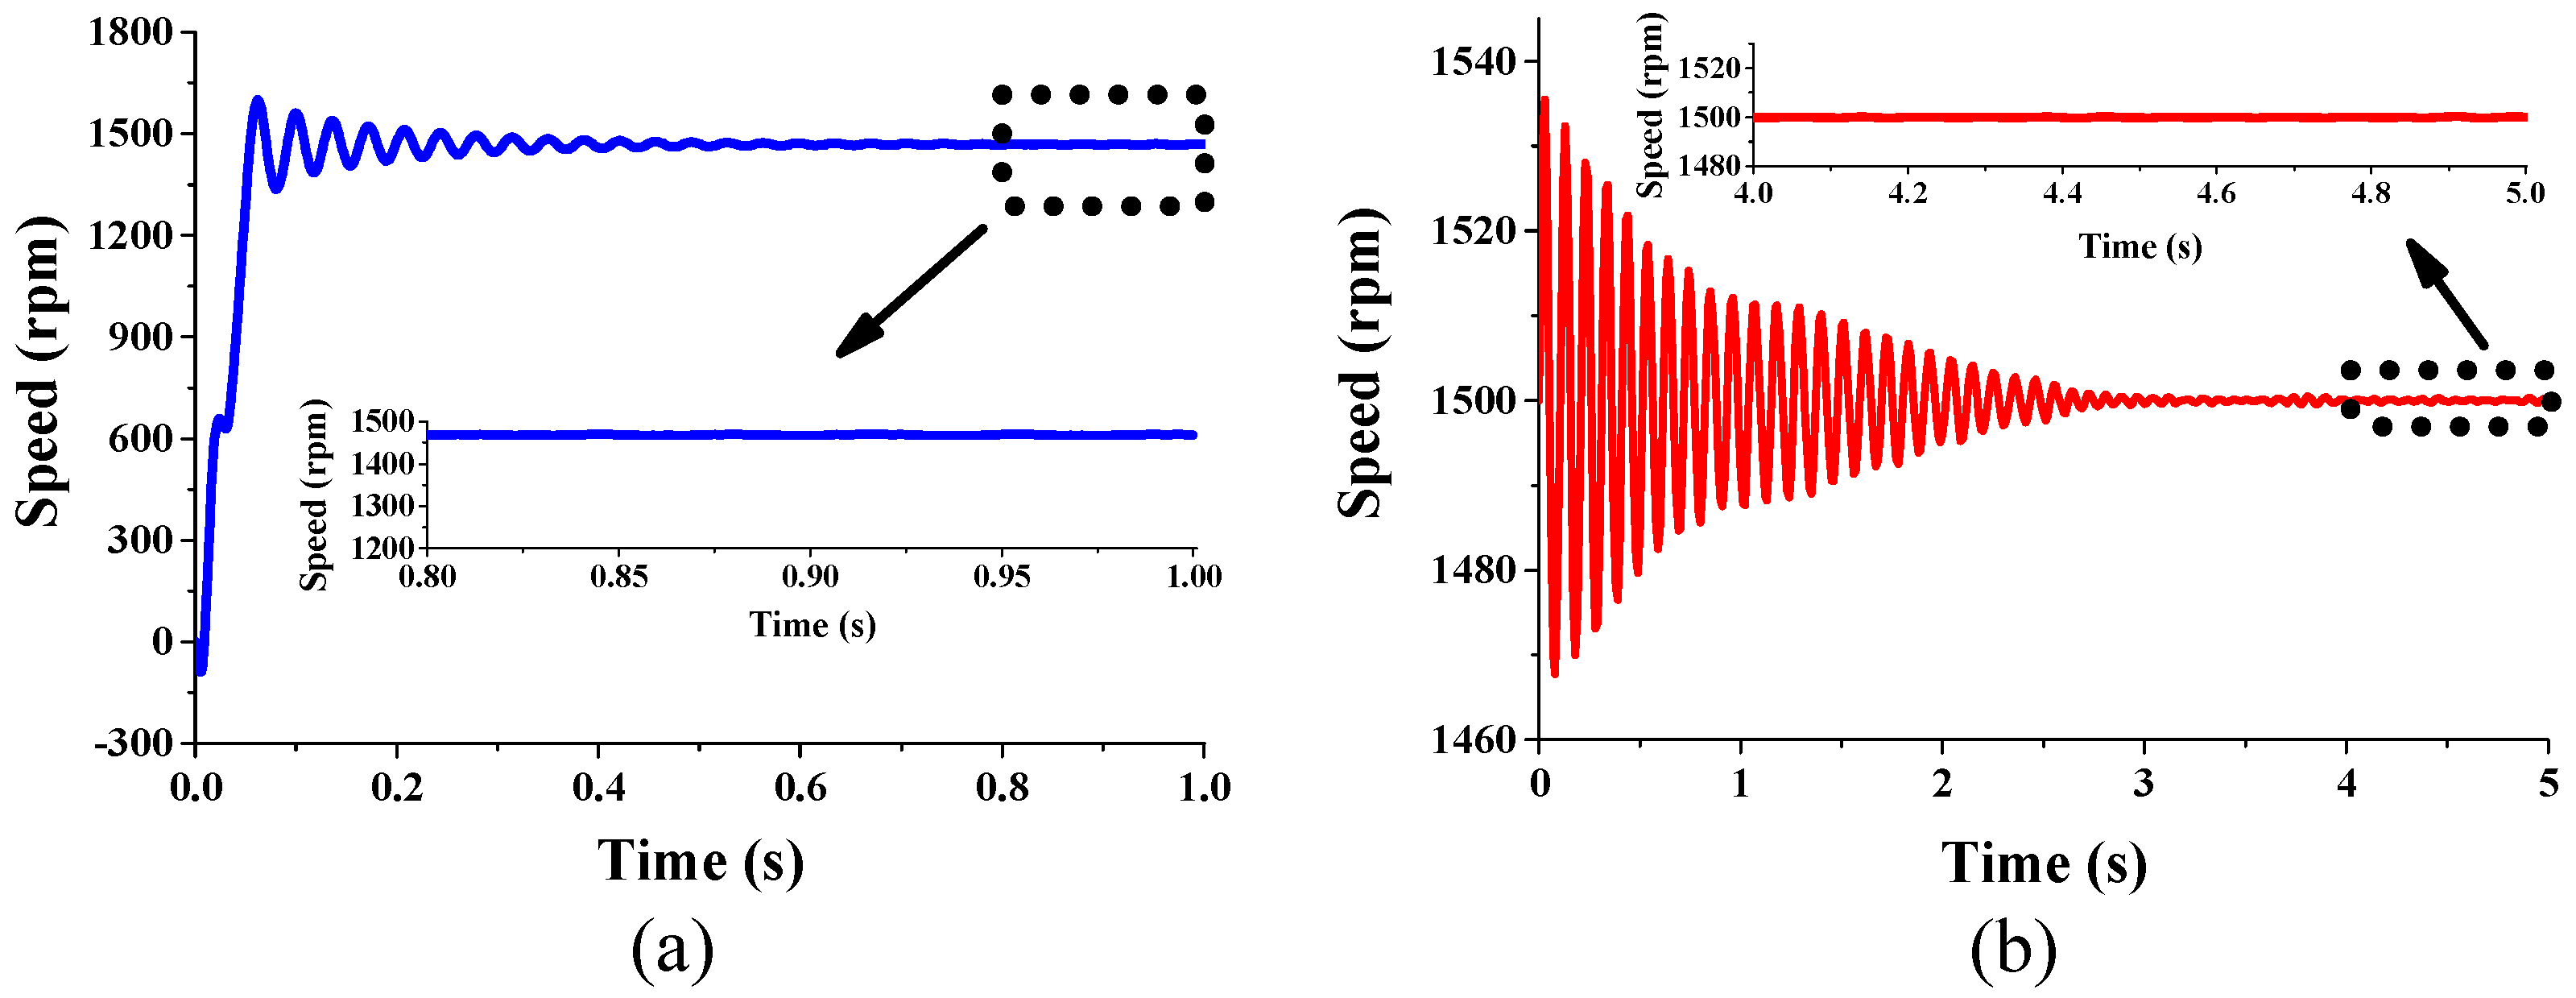
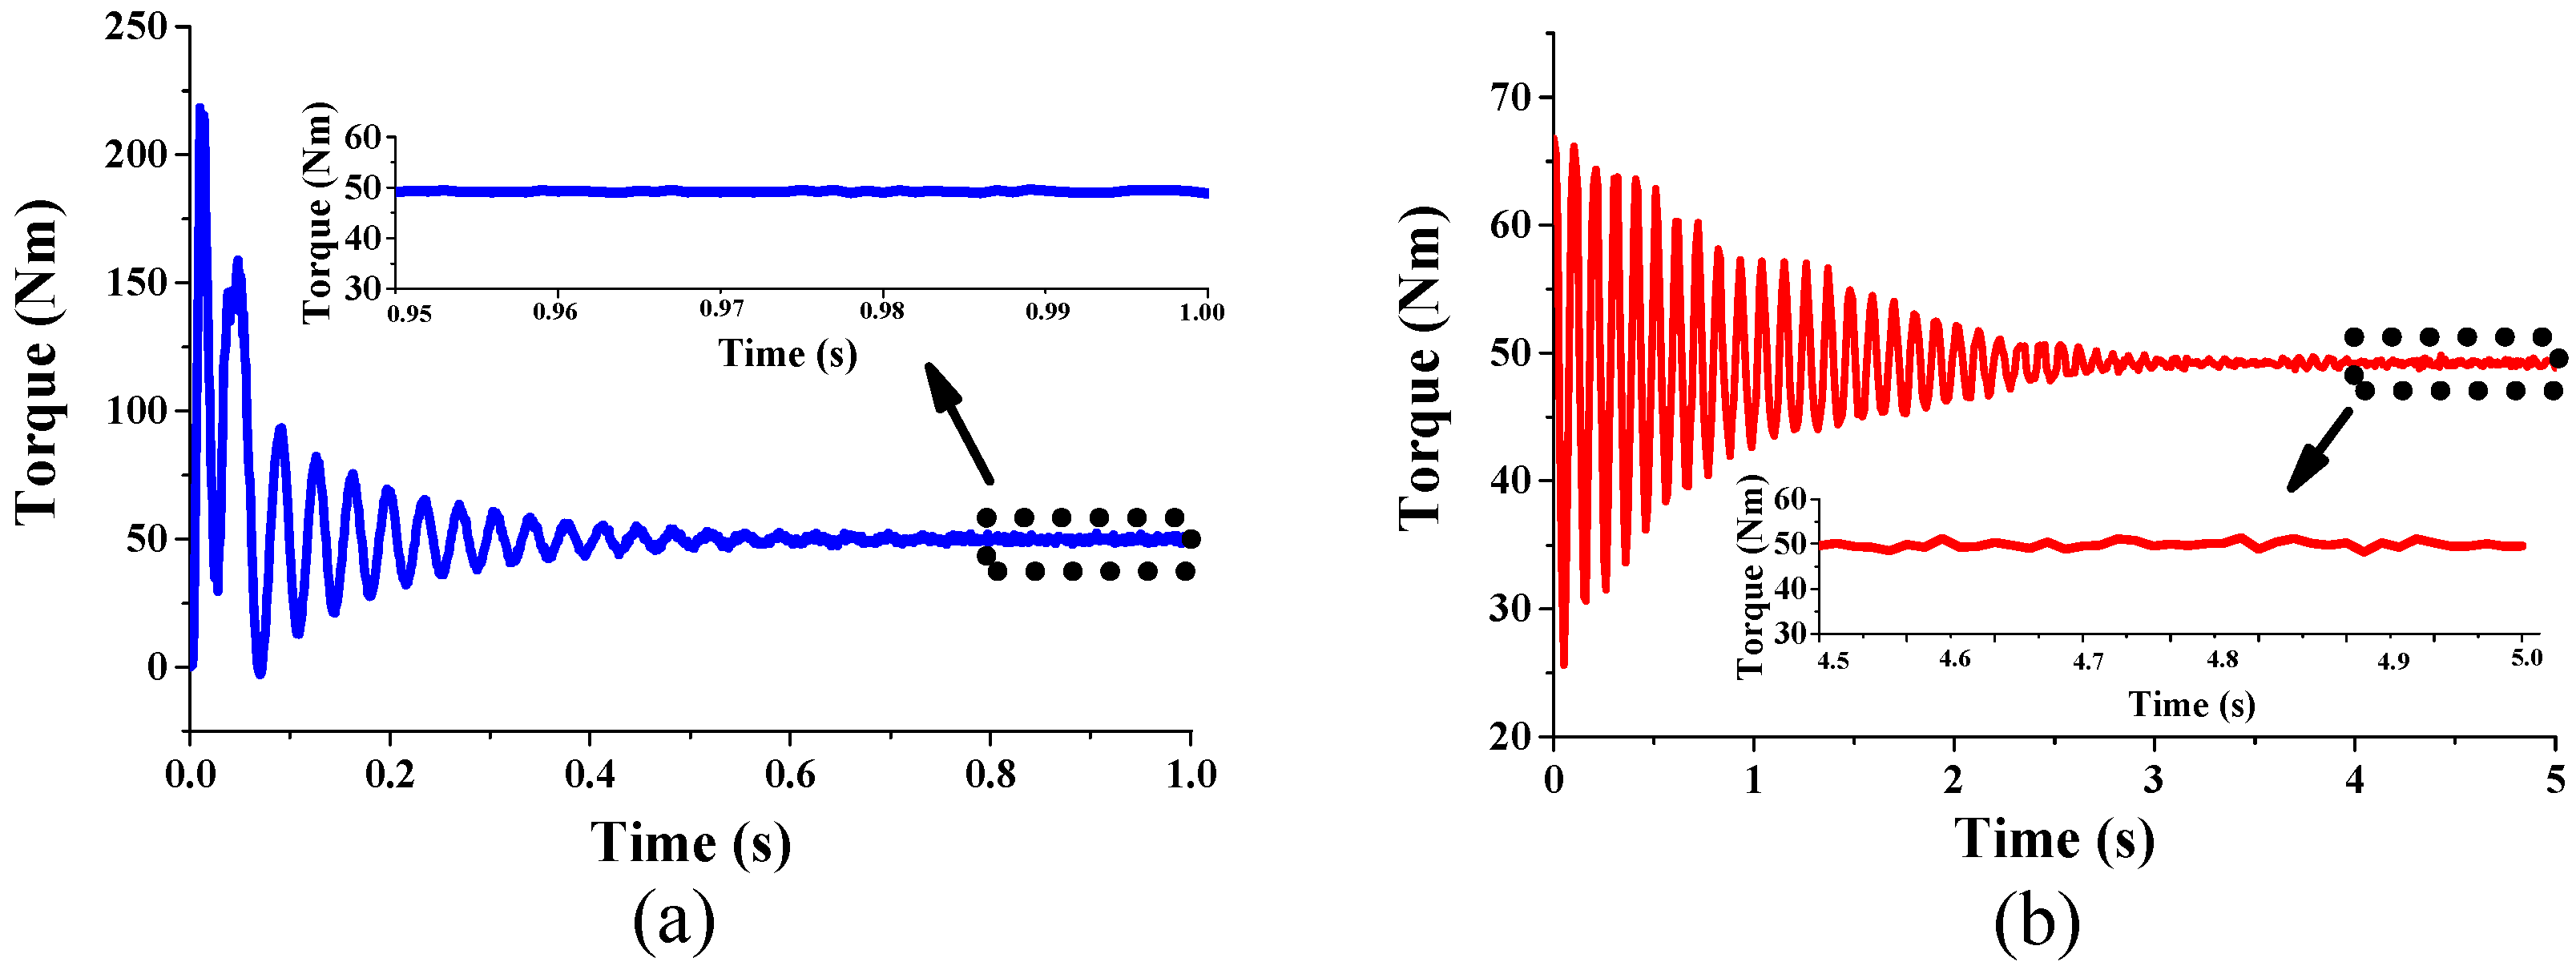
4.1. Steady-State Transient Motor Characteristics

Figure 9, Figure 10 and Figure 11 show the respective transient steady-state FEA results of supply currents, mechanical speeds, and electromagnetic torque profiles for both motors at the rated condition. These figures provide valuable insights into the transient steady-state behavior and motor characteristics for comparative performance analysis.
The discrepancy in the starting behavior of the two motors in Figure 9 is primarily due to their different starting mechanisms. In the SCIM, the rotor consists of conductive bars that are short-circuited at each end by two end rings. During startup, as the rotor is at rest, there is no induced voltage in the rotor bars. Consequently, the rotor current is limited only by the resistance of the bars, which is relatively low. This results in a high initial surge in current, observed as approximately 6.2 times its full load current in Figure 9a. On the other hand, the WFFSM has its windings connected to an external circuit, which limits the current flow to the winding. This results in a lower starting current, as seen in Figure 9b. While the high starting current of the SCIM offers benefits in certain applications, it comes with potential drawbacks, such as increased electrical stress on the motor and power supply system. Additionally, over time, it may lead to reduced efficiency and increased energy costs.
Meanwhile, in Figure 10a, it is observed that the SCIM reaches steady-state time faster compared with the WFFSM in Figure 10b. The speed plot of the SCIM accelerates before meeting the steady-state position at 0.8 s, as indicated in the zoomed plot of Figure 10a, while the WFFSM takes longer to reach its steady-state phase, attaining this at 4 s, which is evident in the zoomed plot of Figure 10b. Under the same inertia, the WFFSM, acting as a synchronous motor, requires more time to synchronize its speed with the frequency of the power supply, resulting in a slower acceleration. On the other hand, the SCIM does not require synchronized field winding excitation when starting up. It can draw high starting current and get up to speed quickly. The SCIM also slips and has a lower synchronous speed compared with the WFFSM operating at the supply frequency. This allows it to accelerate to the working speed more quickly. Lastly, the SCIM has a wider stable operating range and no issues with pull-out during transient conditions, but the WFFSM needs to avoid loss of synchronism during acceleration.
It is important to highlight that, while the high starting current of the SCIM may have its drawbacks, it also results in a higher starting torque, as evident in Figure 11a. This characteristic can be advantageous in applications where quick starts or overcoming high inertia loads are necessary. However, the WFFSM delivers approximately 15.47% more average torque than the SCIM, albeit exhibiting higher torque ripple. This higher torque ripple may introduce mechanical vibrations and other undesirable effects that should be addressed, possibly through future optimization studies to optimize torque performance.
In general, the selection of the appropriate motor type should carefully consider the specific application requirements, balancing the advantages of higher starting torque and quicker starts with potential drawbacks, such as torque ripple. By doing so, the optimal motor can be chosen to meet the specific needs while ensuring efficient and effective performance.

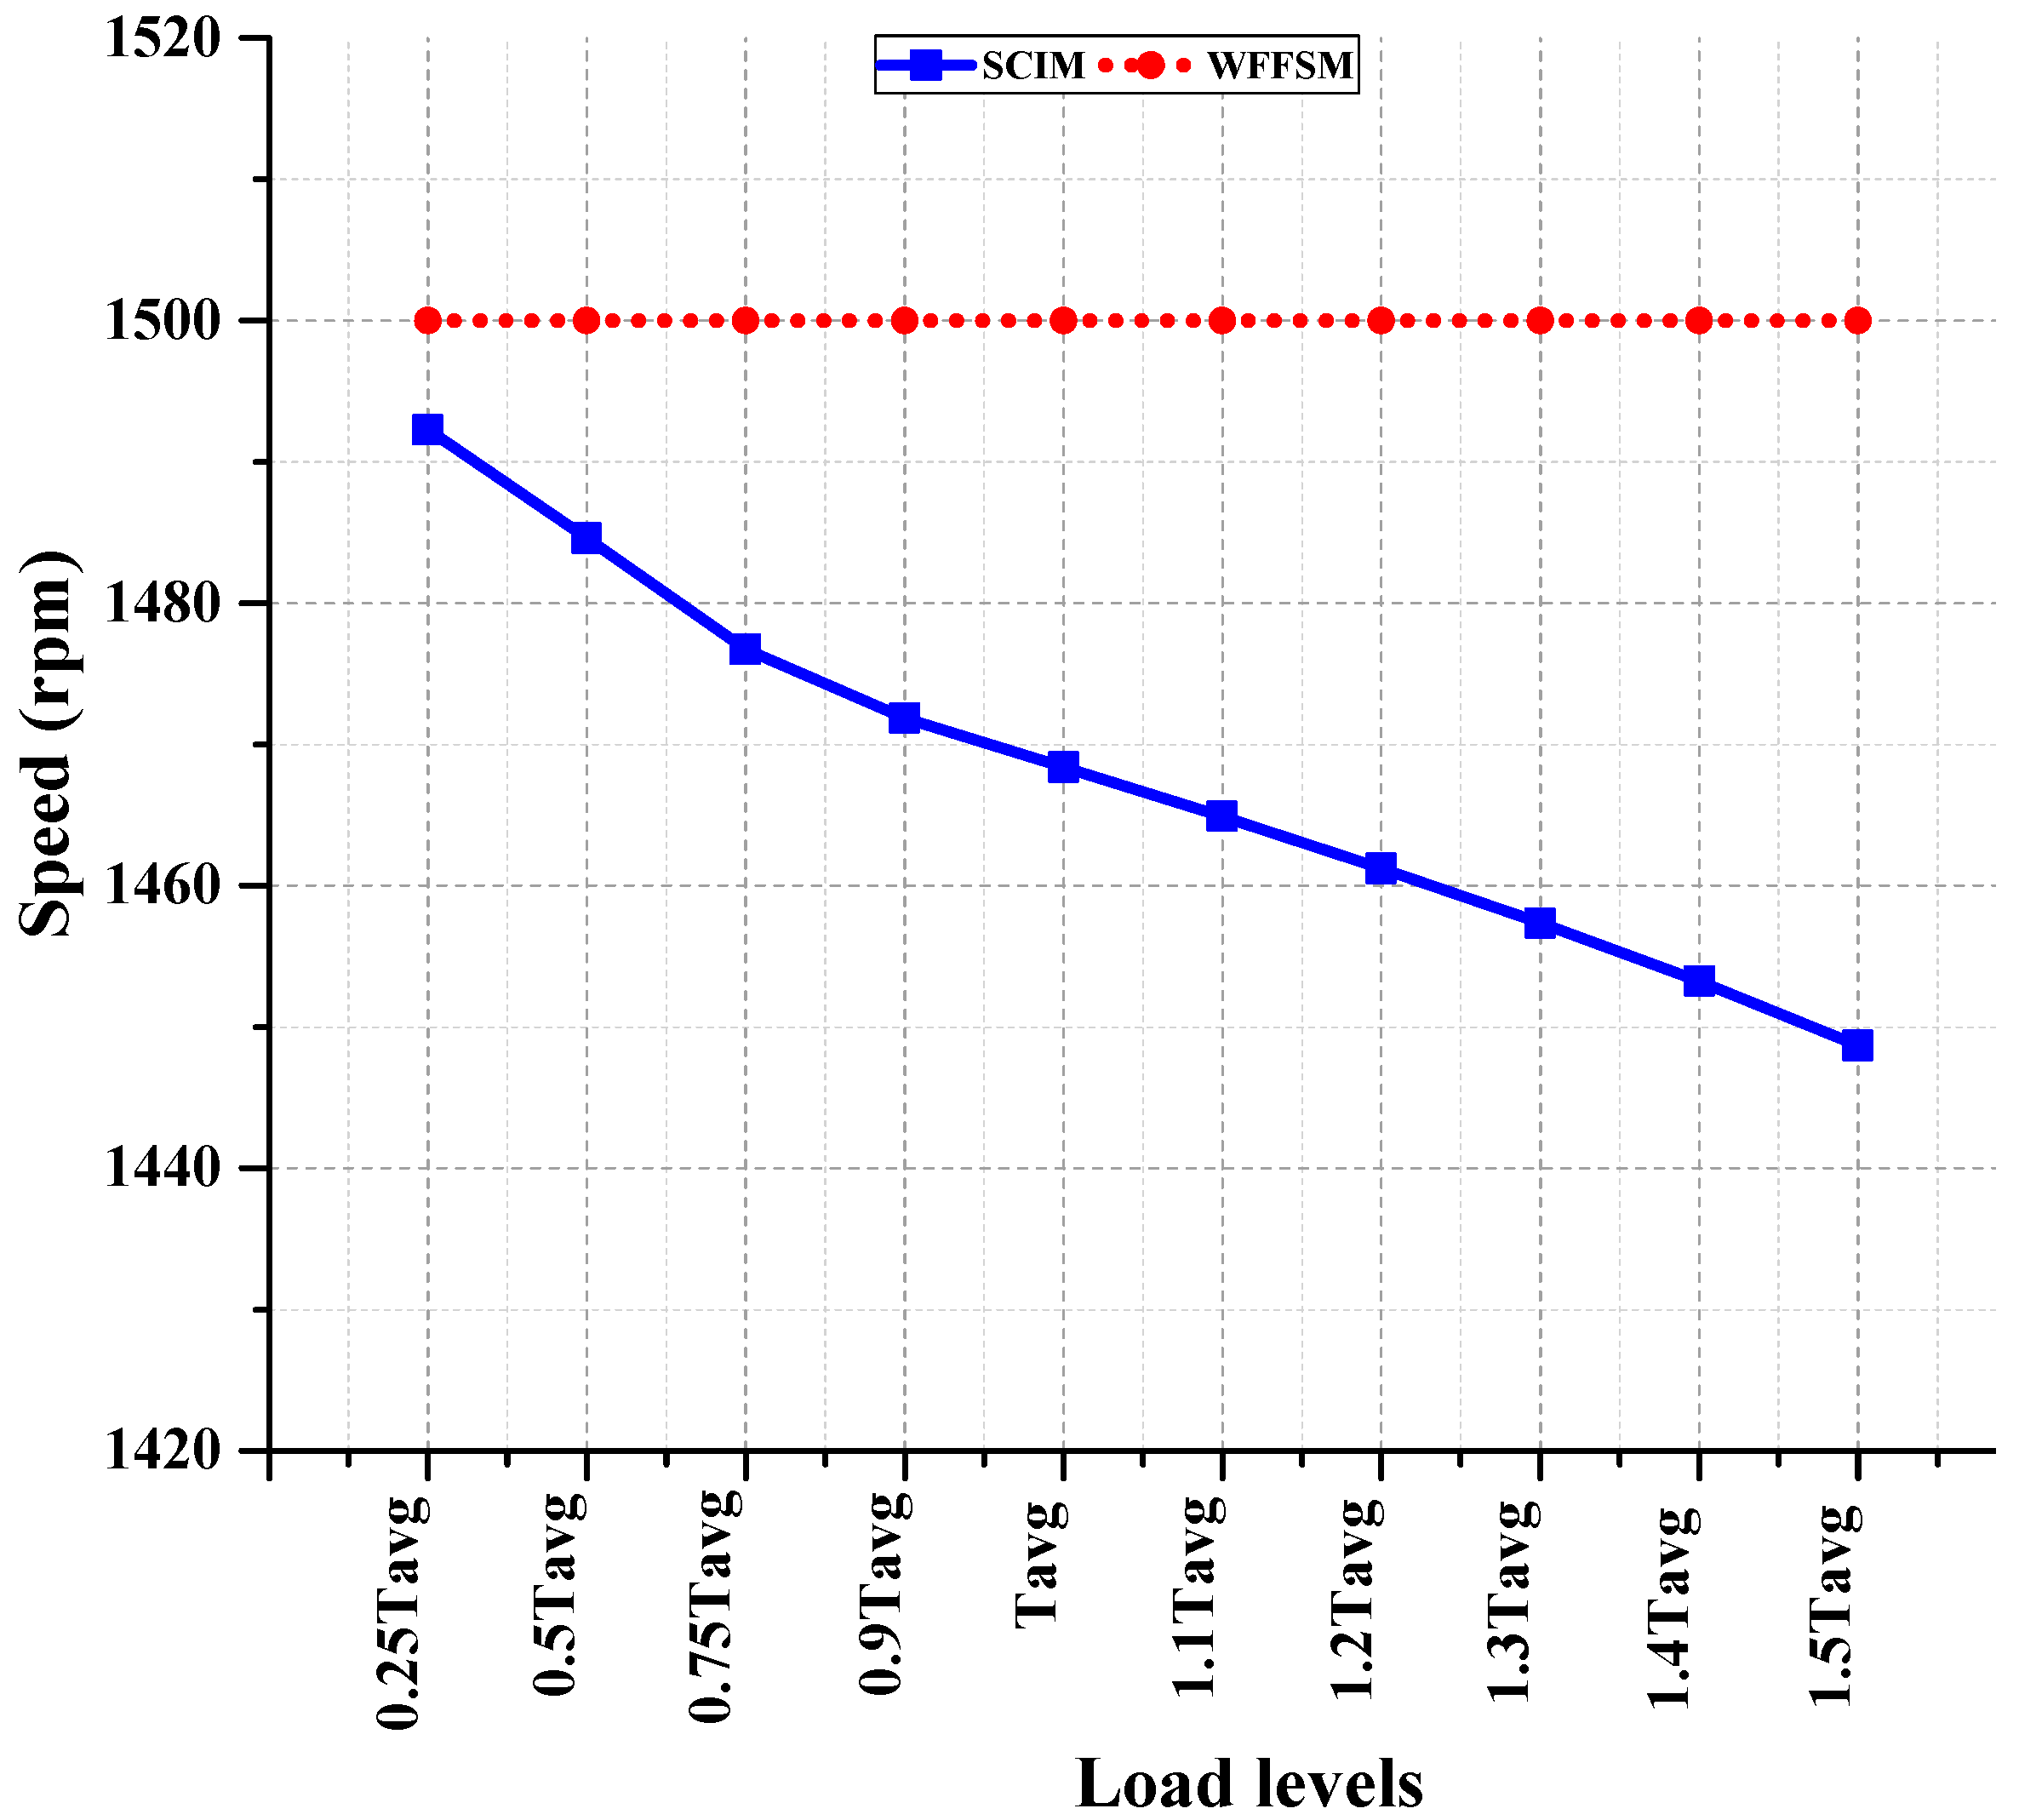
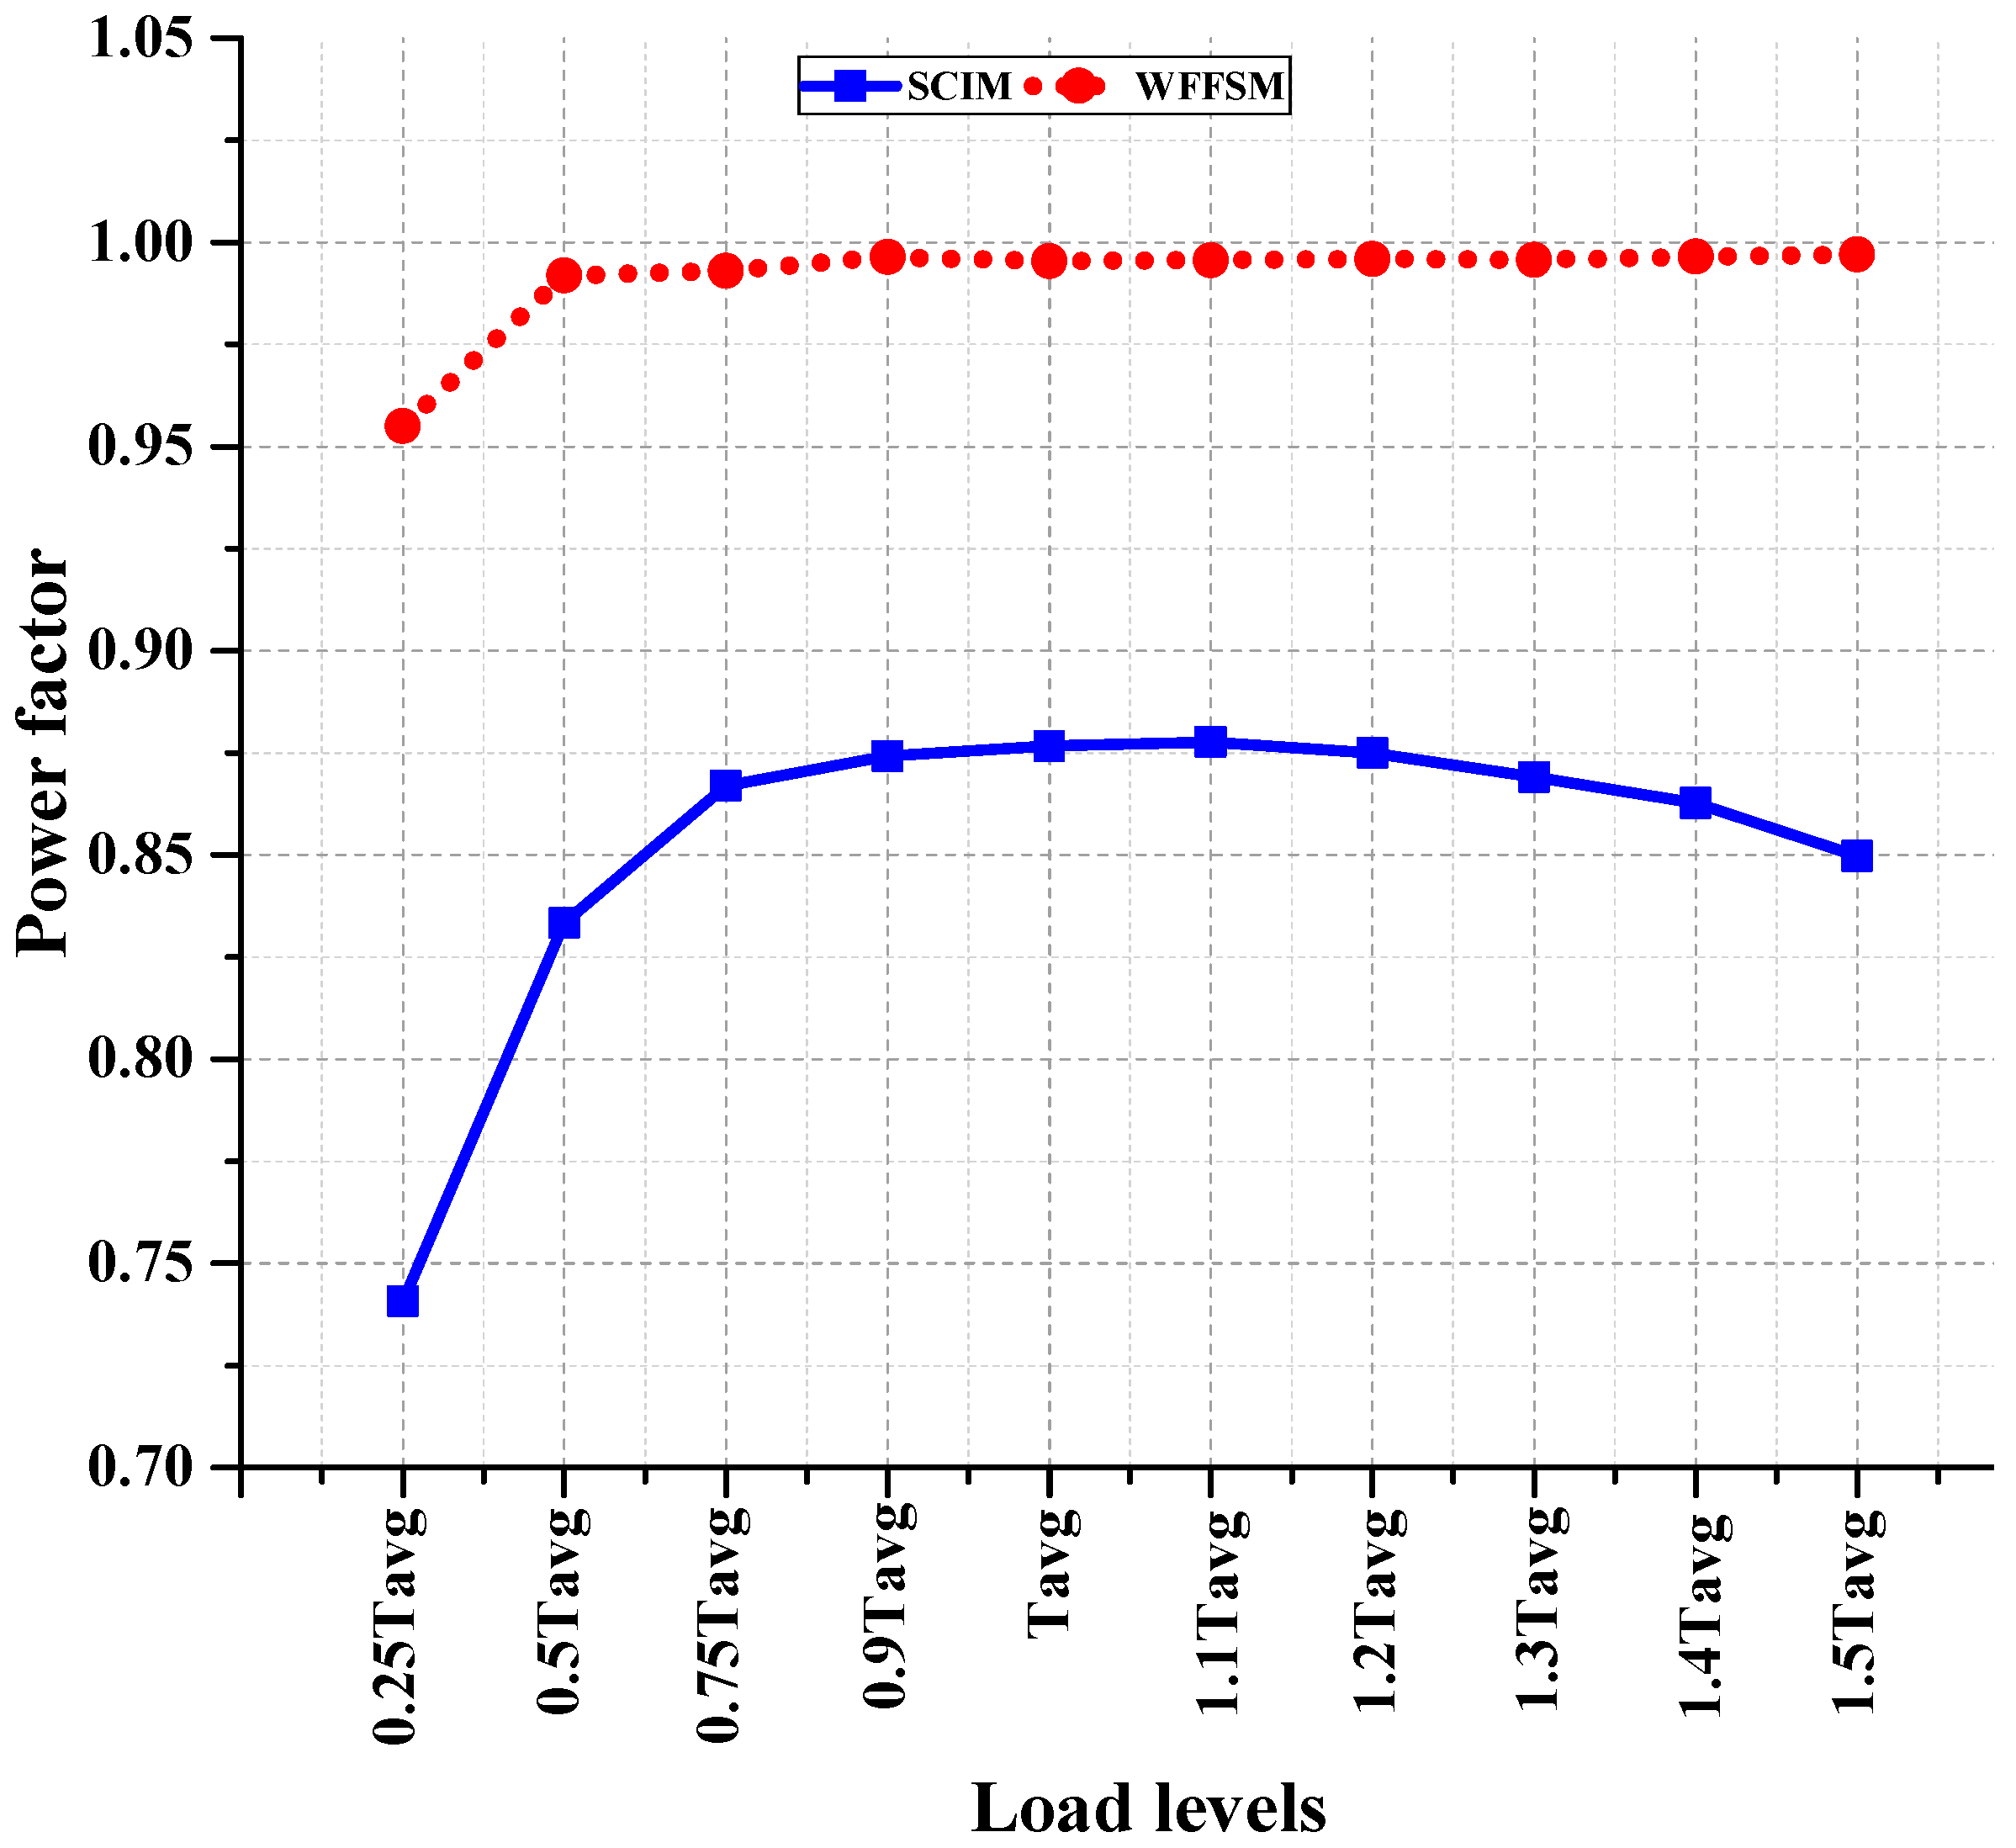
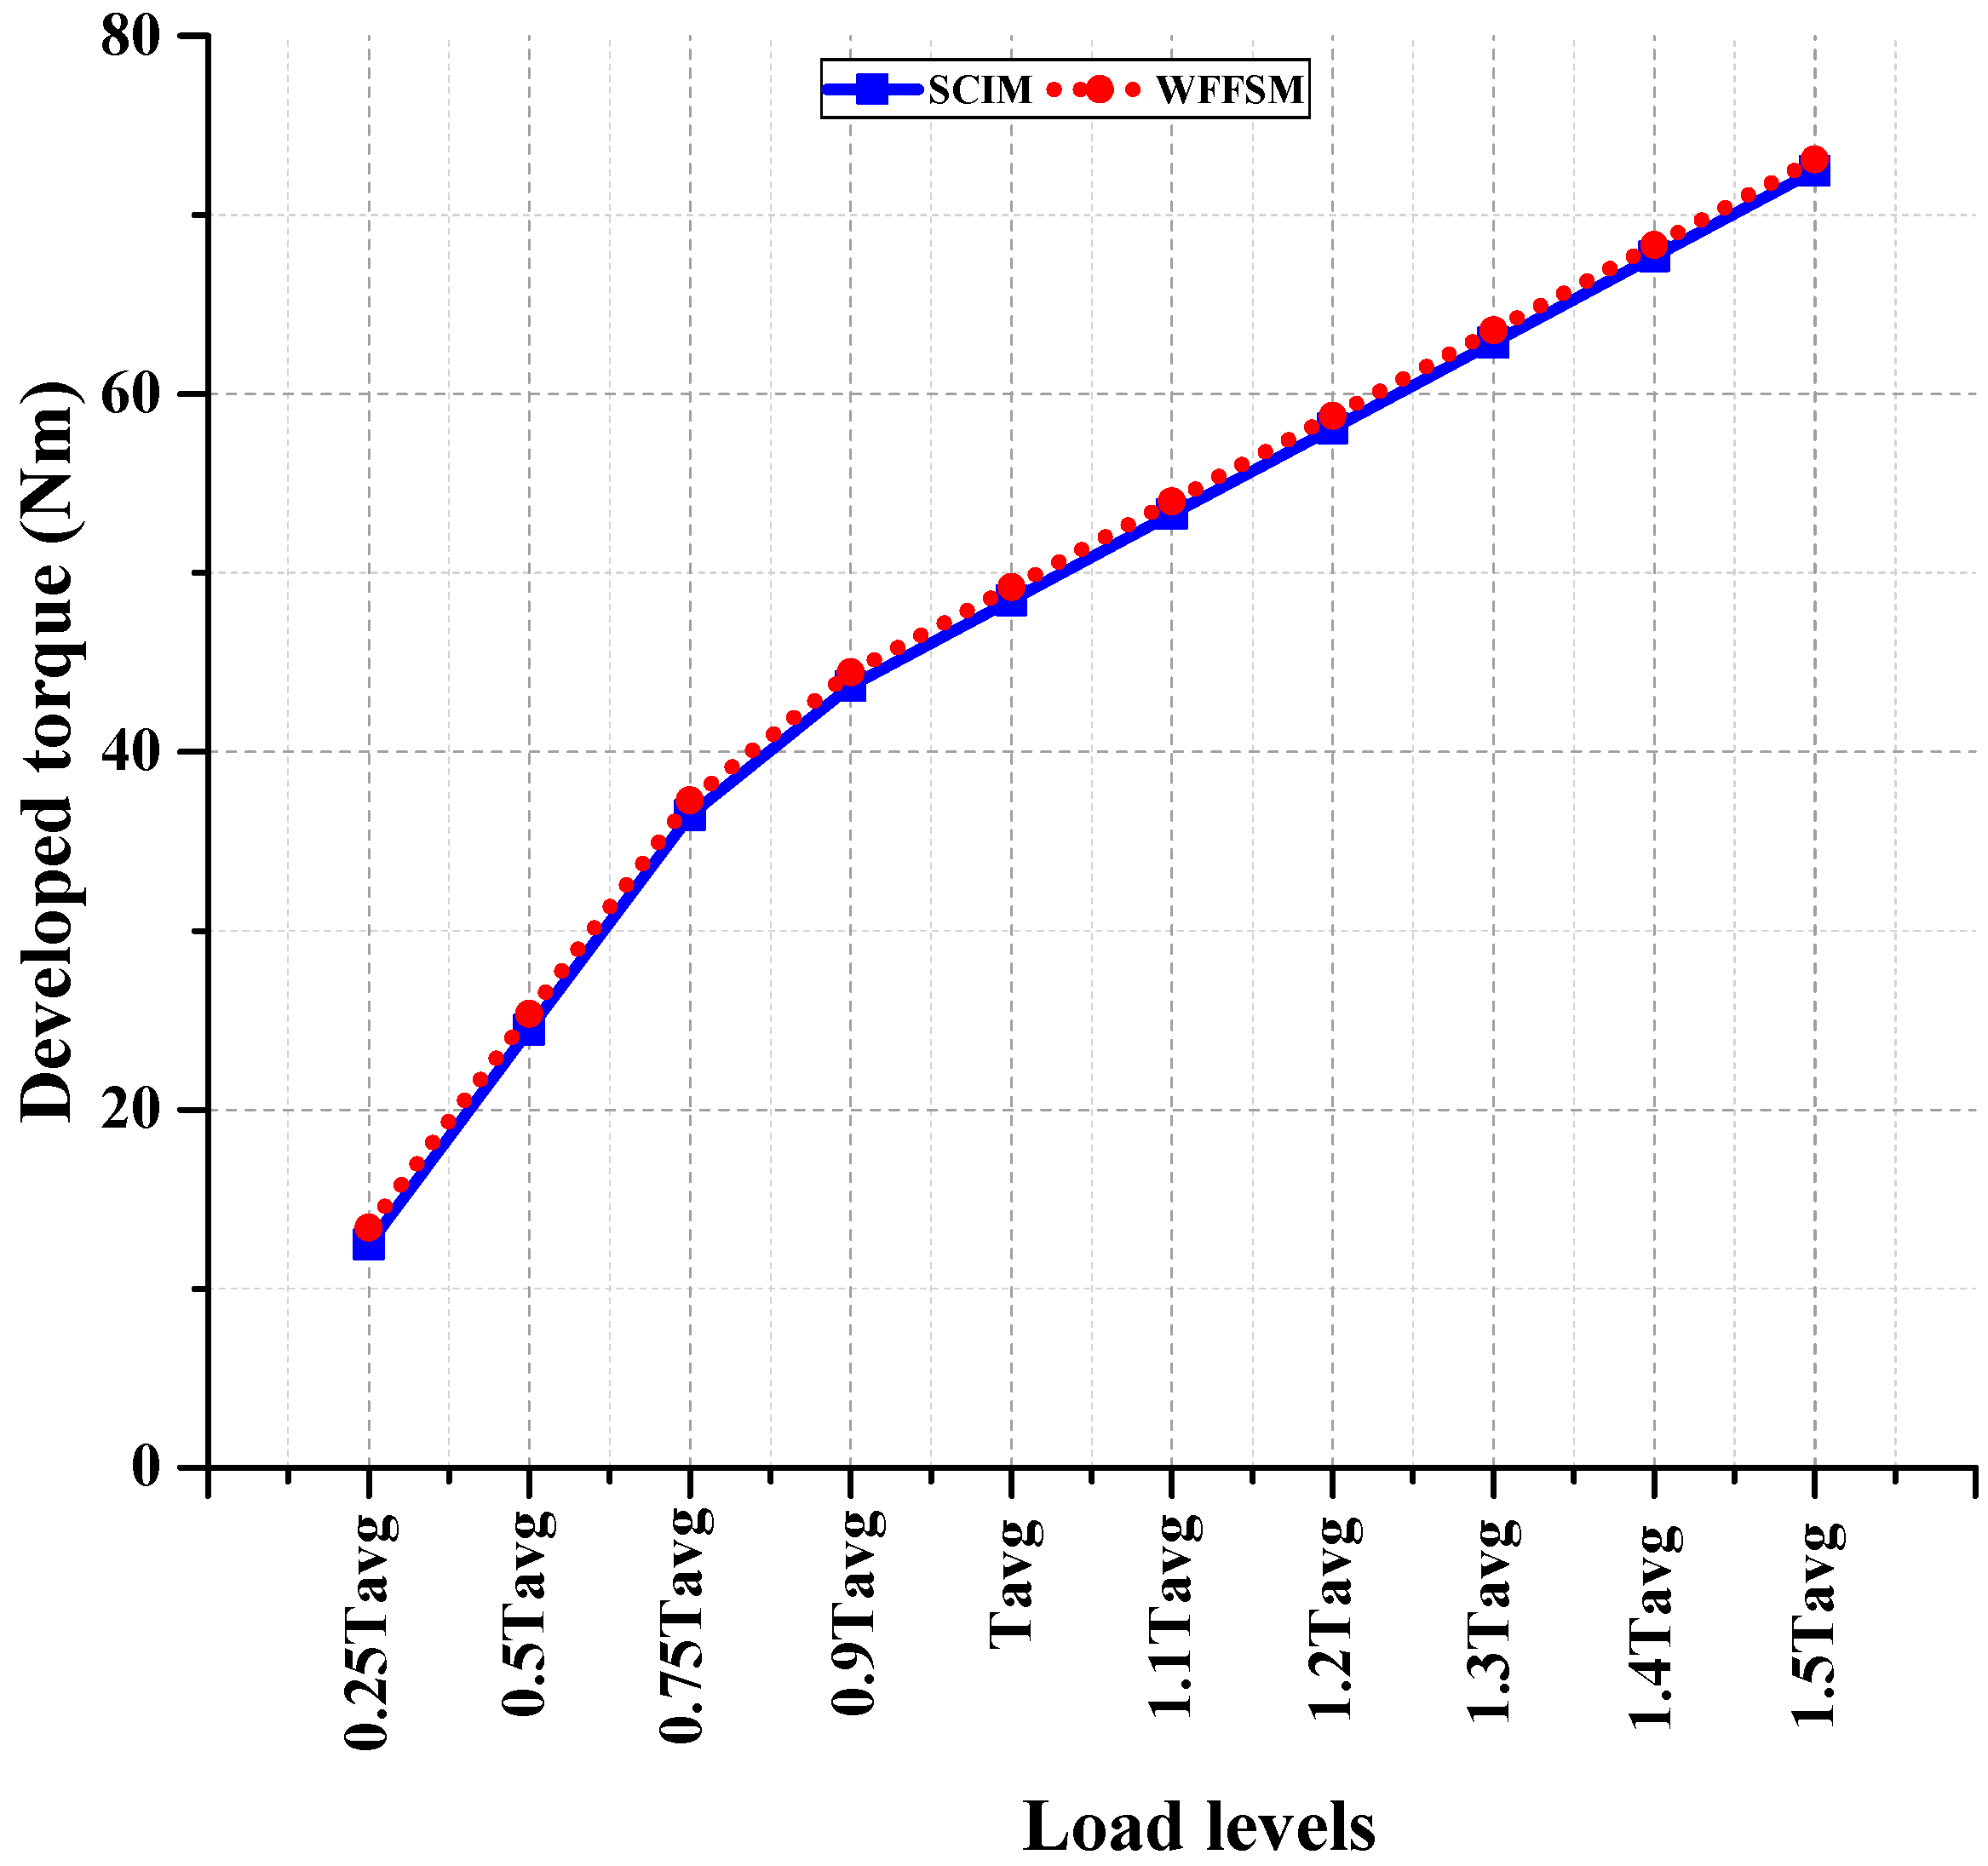
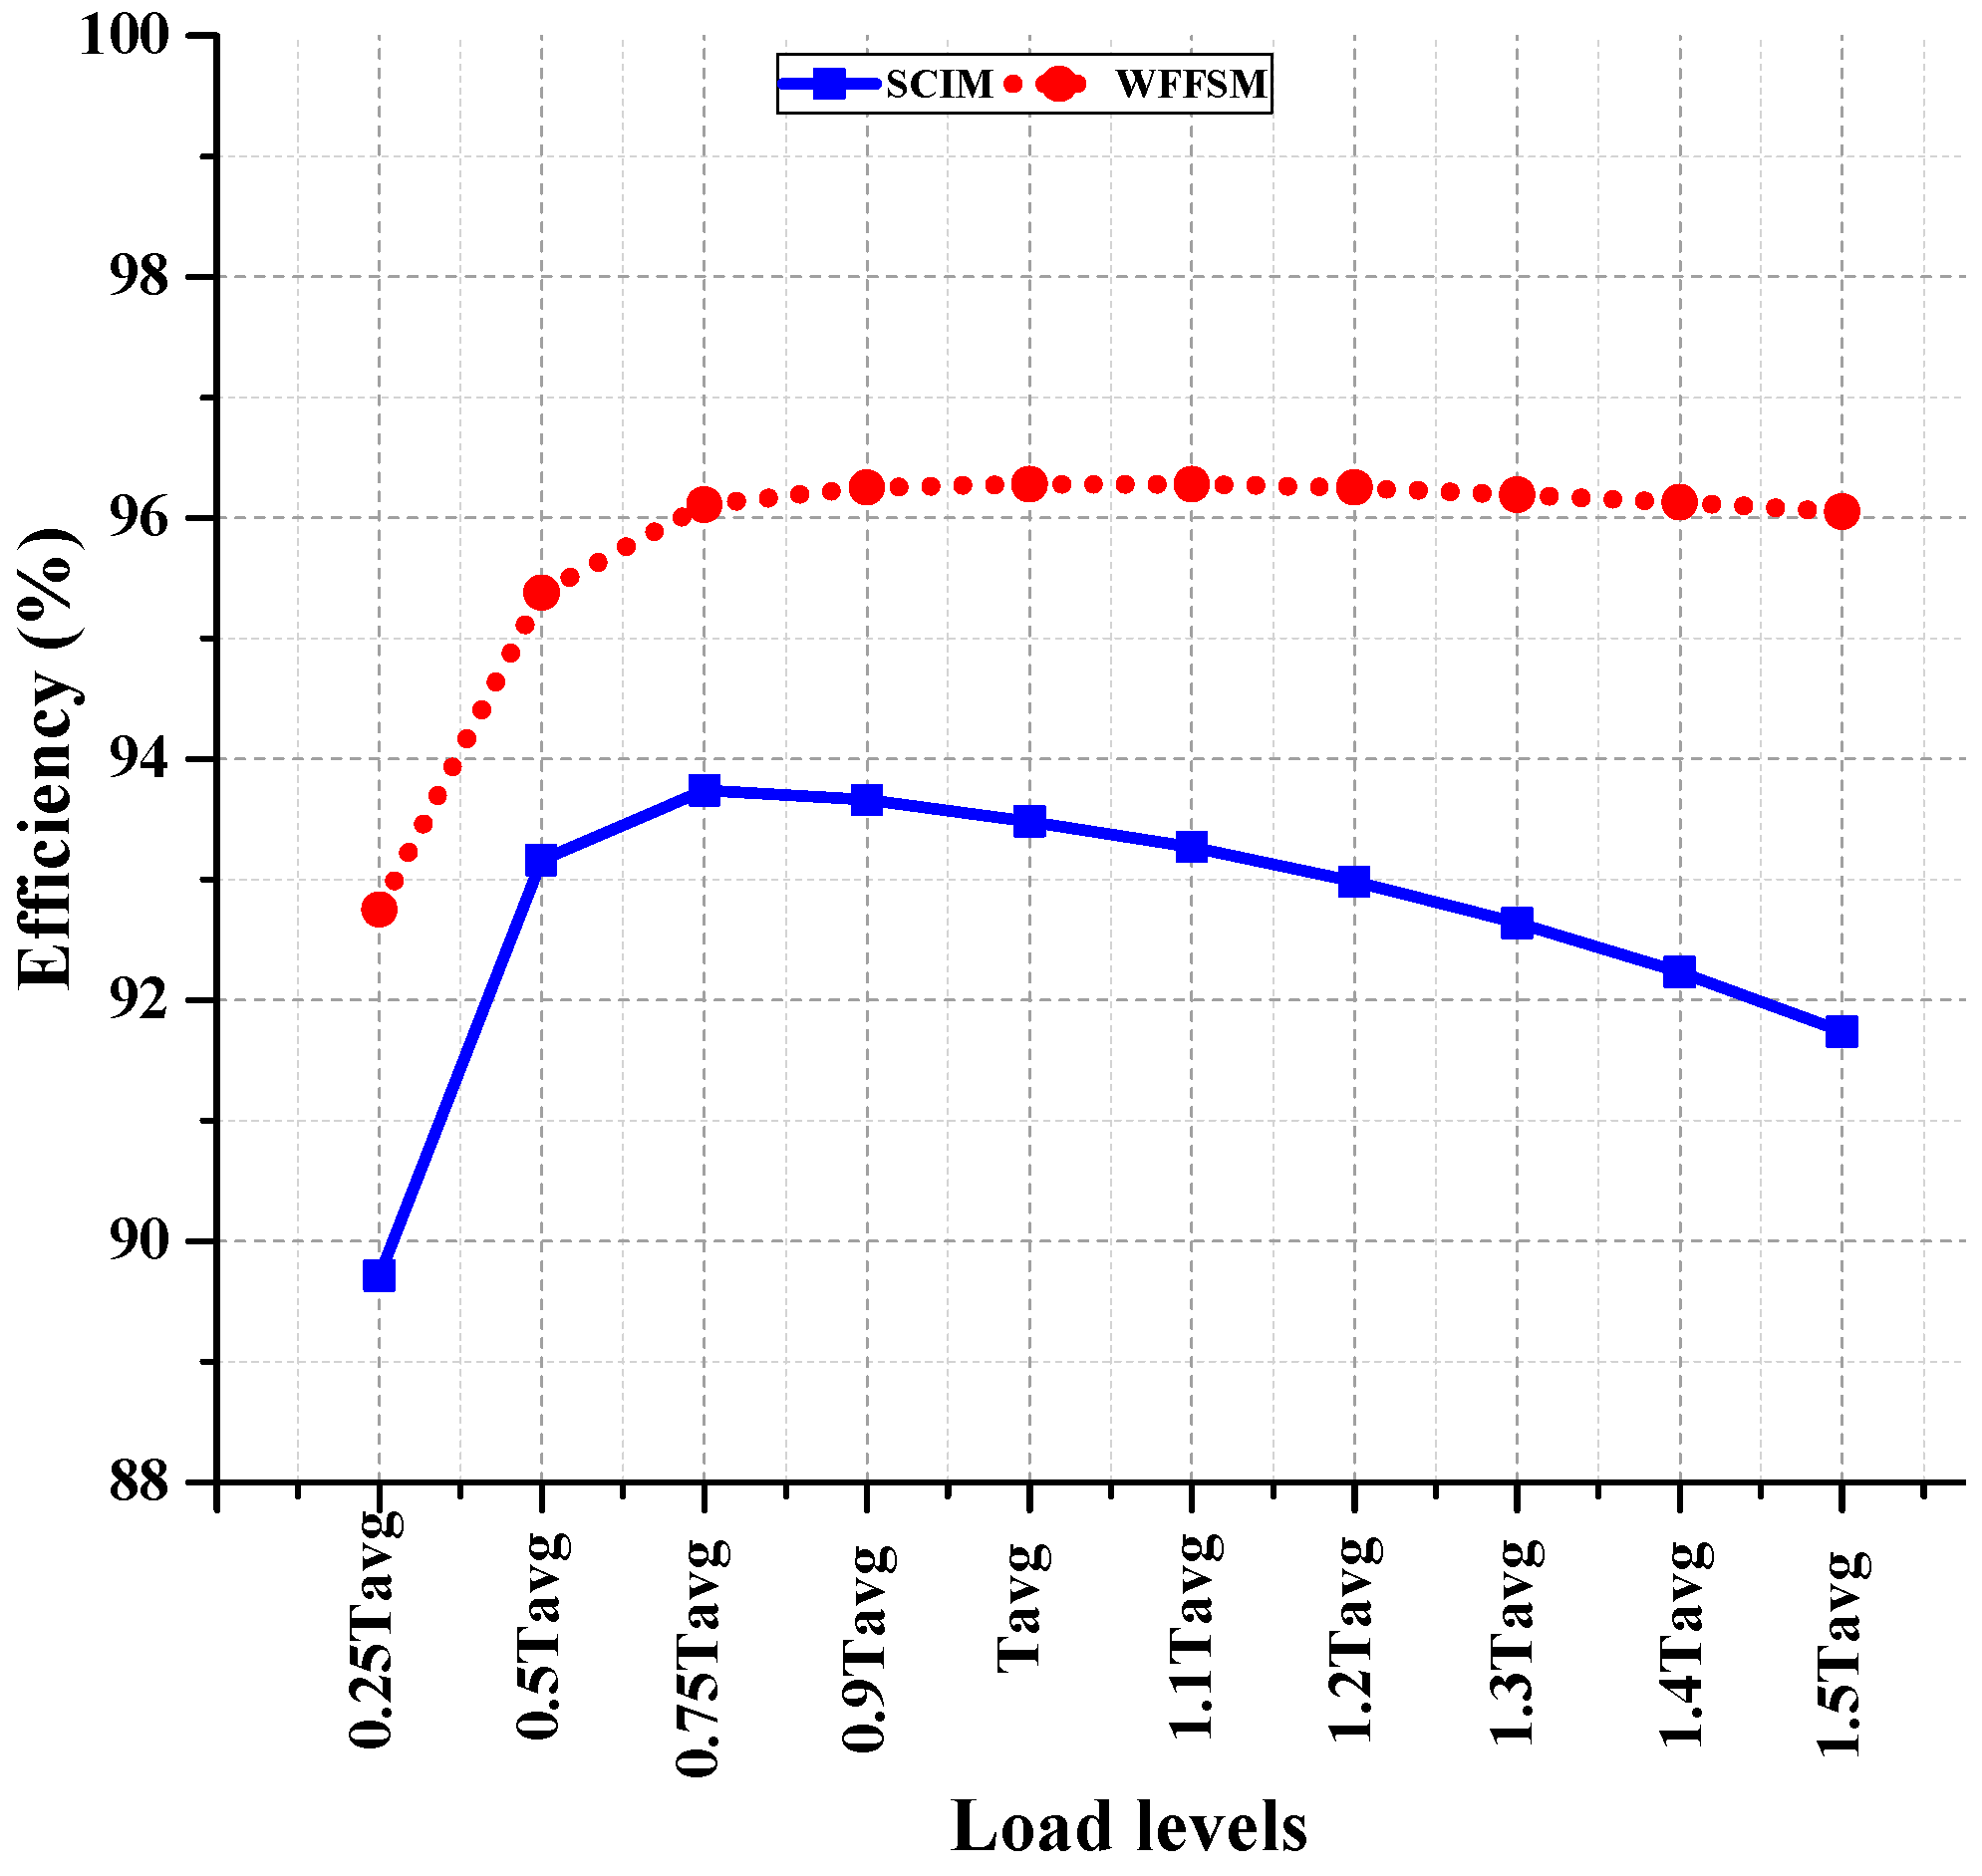
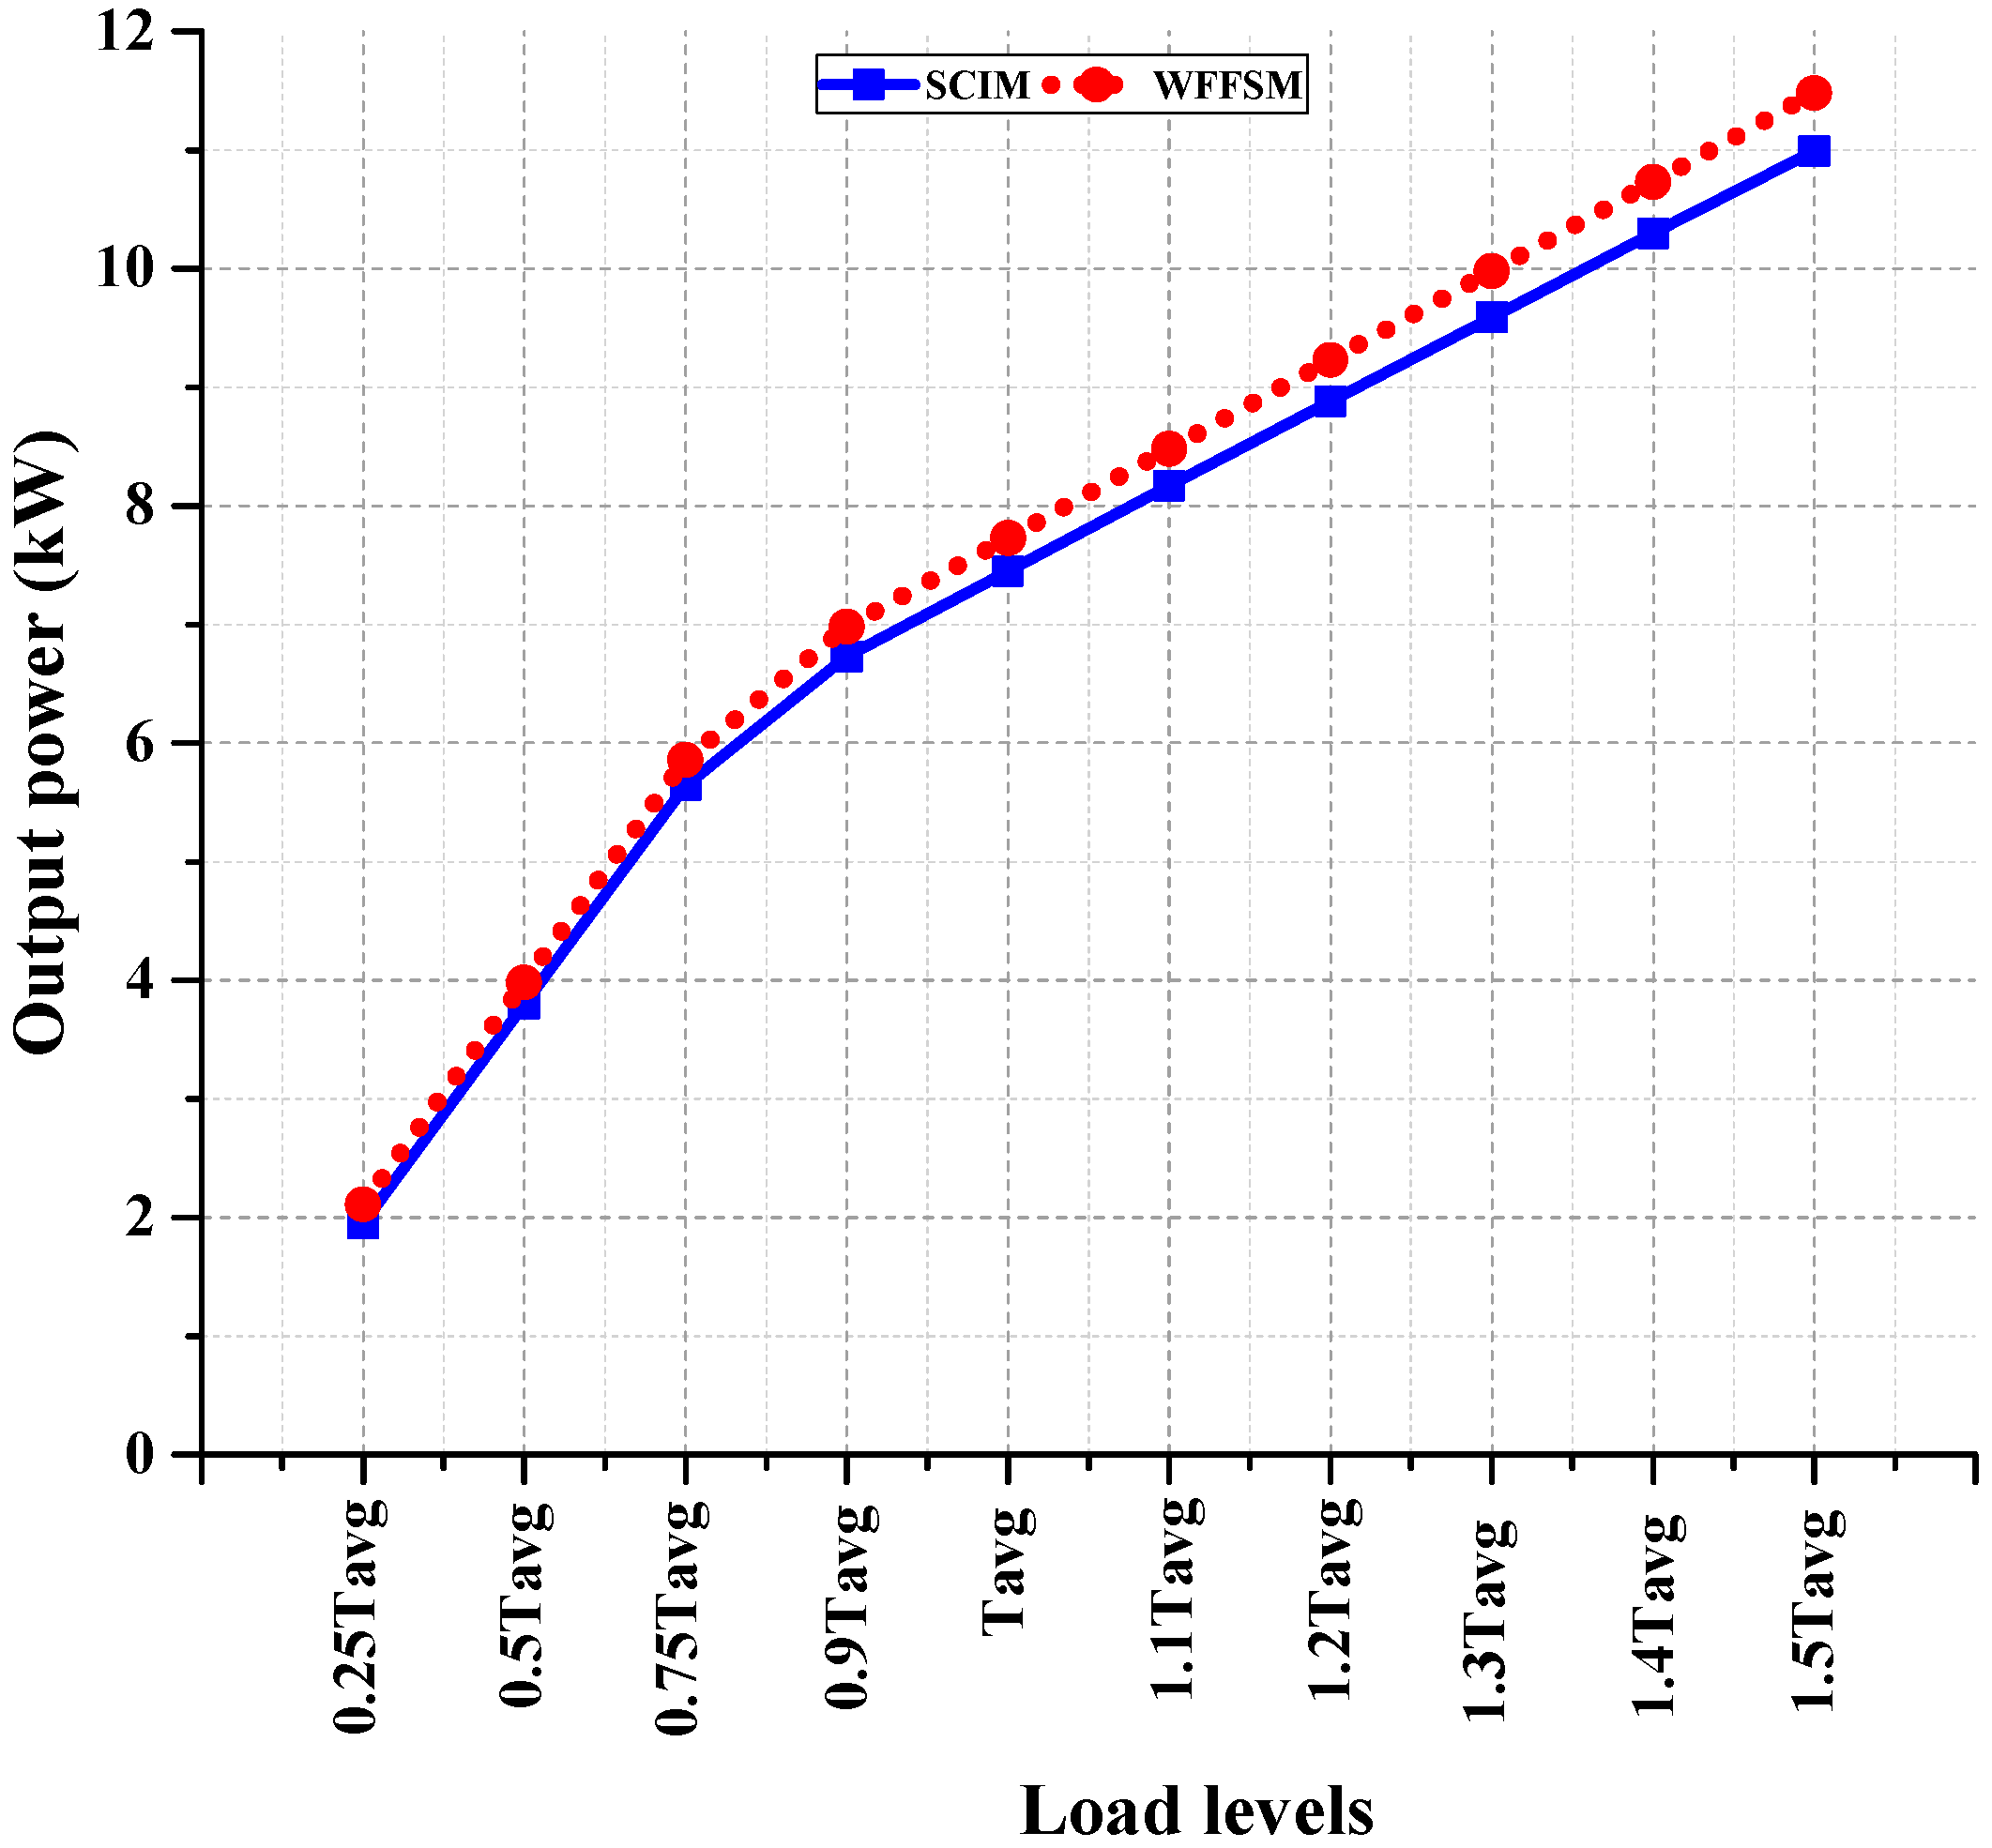
4.2. Dynamic On-Load Transient Motor Characteristics

In this section, SCIM and WFFSM are analyzed using transient FEA with the same inertia and damping constant. We then increase the load torque to investigate the dynamic performance of both motors in terms of mechanical speed, developed torque, power factor, output power, and efficiency. Our results show that the SCIM and WFFSM exhibit different behaviors under dynamic load conditions.
For the SCIM, the speed of the rotor decreases as the load torque increases, as shown in Figure 12, which is characteristic of the negative slope of its speed-torque curve. In contrast, the WFFSM maintains a constant and higher speed throughout, as is characteristic for synchronous motors, which means that the speed of the rotor is determined by the frequency of the AC voltage applied to the phase winding, making it more suitable for applications requiring constant speed.
With an increase in load torque, the developed torque of both the SCIM and WFFSM increases, as shown in Figure 13. For the SCIM, it is because, as the load torque increases, it causes the rotor to slow down slightly; this increases the slip between the rotor speed and the synchronous speed. A higher slip results in increased induced rotor currents, viz. higher rotor torque and overall developed torque. On the other hand, the developed torque of the WFFSM increases with load, which is consistent with the theory in Equation (46).
The power factor of both motors varies with the load torque, as shown in Figure 14. The power factor of the WFFSM is higher than the SCIM across the load regime. For the SCIM, it appears to increase initially but peaks at rated load torque and then begins to reduce at load torque above 1.1 p.u. For the WFFSM, the power factor is fairly constant throughout the load regime. This is perhaps due to good balance between both MMFs of the excitation of the field and of armature windings to produce the given reference torque of the WFFSM in this study [17]. The reduction in the power factor for the SCIM at higher loads is due to the increased reactive power demand.
As shown in Figure 15, the efficiency of the SCIM and WFFSM are varied, with increasing load torque accordingly. For the SCIM, it is observed that the efficiency peaks at 0.75 p.u. of the load torque and then begins to decrease due to the increased losses associated with increased slip viz. reduced speed of the rotor. The efficiency is fairly constant throughout the load regime for the WFFSM and higher throughout compared with the SCIM. This is because DC excitation losses in the field winding are very low since they do not vary significantly with load, unlike the SCIM. Moreover, it is already noticed that the WFFSM operates at near unity power factor, which translates to minimal reactive power, thus lower ohmic losses. Comparing the dynamic performance of both machines so far, it is found that the WFFSM presents a higher but constant speed, slightly higher developed torque, higher efficiency and power factor, and thus higher output power, as shown in Figure 16. Also, based on overload capability studies, the service factor of the SCIM is lower than that of the WFFSM [18].
To present a summary of the dynamic performance of both motors, the motor performance characteristics curves are generated and presented, as shown in Figure 17 and Figure 18, for the SCIM and WFFSM, respectively. The starting torque capability of the SCIM is clearly elucidated in Figure 17 compared with the WFFSM, which displays no starting torque in Figure 18. It is observed that the starting torque of the SCIM is about three times (142 Nm) its rated torque, while the pull-out torque occurs at four times (200 Nm), as indicated in Figure 17. The high starting torque of the SCIM allows for direct on-line starting of loads, while the large pull-out torque is an indication of wide stable operating range.
On the other hand, Figure 18 shows the power/torque-speed characteristic curves of the WFFSM based on Equation (54). Since the WFFSM is not self-starting, it requires variable frequency drives or other external means for starting. The load angle of the WFFSM at the rated power is 11.5°, which is an indication of a narrow stability range, but it can potentially achieve a higher peak power output considering that the maximum power (where the pull-out torque occurs) is seen to be more than five times (42 kW) the nominal power of the motor.
Overall, the use of field and armature coils allows for precise control of the magnetic field and torque production in WFFSMs, making them suitable for applications where precise control of torque and speed are required. In contrast, the SCIM has a less precise control of torque and speed due to the inherent slip between the rotor and the stator magnetic field. Additionally, WFFSMs can operate at higher speeds without the risk of overheating or damaging the motor compared with the SCIM due to the absence of slip between the rotor and the stator magnetic field, as well as the presence of a robust rotor. This makes the WFFSM suitable for applications where high speeds are required, such as in high-speed machinery; whereas, with a higher starting and pull-out torque, the SCIM is suitable for applications requiring variable speed operation.

4.3. Validation and Cost Analysis Studies

Table 3 presents a summary of the comparative cost analysis and electromagnetic performance of both motors based on rated analytical and steady-state FEA results. The WFFSM has a higher average torque but higher torque ripple than the SCIM, an indication of its flux modulating operation and double-salient topology, respectively [19]. It is observed that the WFFSM has a higher torque-to-mass ratio (1.57 Nm/kg) compared with the SCIM (1.34 Nm/kg), although the torque ripple is ~40% lower in the latter. The output power of the WFFSM is slightly higher than that of the SCIM, although it does not translate to higher torque density (Td) as indicated, since both machines are yet to be optimized. Moreover, the WFFSM, as a stator-mounted double-excited motor with both its field and armature windings co-located on the stator, has a characteristic high split ratio [20].
Unlike the WFFSM, the SCIM exploits its squirrel-cage rotor windings to create a rotor magnetic field that interacts with the stator magnetic field to produce torque. Therefore, the copper losses of the WFFSM are observed to be significantly lower than the SCIM, because copper is used for the field windings in the former compared with the latter, whose short-circuited rotor bars are designed using aluminum. Furthermore, the presence of slip in the SCIM results in reduced copper losses. However, the core losses of the WFFSM are higher than the SCIM due to the high number of poles for the WFFSM, which translates to higher electrical frequencies viz. higher core losses [21,22]. Notwithstanding, the efficiency of the WFFSM is seen to be higher than that of the SCIM because of its zero slip, which means that the rotor speed is always synchronous with the stator field, hence with higher output power and efficiency.
In addition, the power factor of the WFFSM is observed to be significantly higher than the SCIM due to reduced reactive power demand. As already indicated, the field and armature windings in WFFSMs are separately excited, making it possible for the field current to be controlled to optimize the power factor. In SCIMs, the magnetizing current is part of the stator current, which reduces the power factor.
The cost analysis is also presented in Table 3, showing the material costs of the WFFSM to be 27% higher than the SCIM. Since the WFFSM is not optimized, this cost differential is expected to be reduced with improved performance benefits. Furthermore, the SCIM rotor bars are designed using aluminum, which costs half the price of copper, as shown in Table 4. But, as already indicated, the higher torque-to-mass ratio of the WFFSM partially offsets the cost differences in applications where torque output is critical.
In summary, the results in Table 3 validate the sizing and analytical modeling techniques developed in this study, with good agreement between the analytical and FEA calculations for both motors, which successfully achieve the prescribed design targets with only marginal differences. The comparative performance tradeoffs between the SCIM and WFFSM highlight that electrical machine design inherently requires balancing strengths and weaknesses based on the intended application. This interim study shows that the SCIM provides lower material cost, torque ripple, and core losses compared with higher torque-per-mass ratio, efficiency, and power factor recorded in the WFFSM. While this initial comparative study reveals distinct performance advantages of both the SCIM and the WFFSM, more extensive and robust multi-objective optimization is required before definitive conclusions can be made regarding the ideal machine design for a given application based on factors such as cost, efficiency, power density, and power quality.

5. Conclusions

In this paper, we present the design process and analytical performance calculations for two different types of brushless motors: SCIM and WFFSM. The design process for both motors involves determining the design specifications, calculating the flux densities and current densities, sizing the stator and rotor components, verifying electric and magnetic loadings, and computing various performance metrics such as torque, efficiency, and power factor. A comparative analysis of the performance of both motors under transient FEA steady-state and dynamic on-load conditions is then undertaken after the initial sizing study. The study reveals key differences between the SCIM and WFFSM.
The transient analysis shows the SCIM reaches steady state in 0.8 s, while the WFFSM takes 4 s to synchronize and stabilize. The SCIM exhibits a starting torque of 142 Nm, close to three times its 48.5 Nm rated torque. In contrast, the WFFSM has no inherent starting torque but can rise to four times the nominal torque to potentially achieve a higher peak power output.
The SCIM’s simple squirrel-cage design enables quick starts but requires slip for induction torque production. At a nominal rated load, the SCIM operates with a 5% steady-state slip. In comparison, the WFFSM achieves synchronous speed but needs external methods for starting. The WFFSM also demonstrates superior efficiency across the load range due to stable and higher operating speed, exceeding 96% at below (0.75 p.u.) and above (1.5 p.u.) rated load.
With a higher torque-to-mass ratio of 1.57 Nm/kg versus 1.34 Nm/kg for the SCIM, the WFFSM provides superior power density, offsetting its 27% higher material costs. For budget-driven applications, comprehensive cost analysis beyond initial material costs, evaluating maintenance, operational expenses, and motor lifecycle costs is imperative.
In conclusion, the SCIM and WFFSM offer complementary strengths and weaknesses. The selection of the appropriate motor type should carefully consider the specific application requirements, balancing the advantages of each motor type with potential drawbacks. Therefore, this initial comparative study of the SCIM and WFFSM reveals distinct advantages and tradeoffs for each machine type to inform more extensive multi-objective optimization and design decisions.

Author Contributions

Conceptualization, U.B.A. and O.I.O.; formal analysis, U.B.A. and C.E.A.; funding acquisition, O.I.O., U.B.A. and C.C.A.; investigation, U.B.A., O.I.O. and C.C.A.; methodology, U.B.A., C.E.A. and C.C.A.; project administration, O.I.O.; resources, C.E.A., U.B.A. and O.I.O.; software, U.B.A., C.E.A., C.C.A. and O.I.O.; supervision, U.B.A. and O.I.O.; validation, U.B.A., C.E.A. and C.C.A.; visualization, C.E.A., U.B.A. and C.C.A.; writing—original draft, C.E.A. and U.B.A.; writing—review and editing, C.E.A., U.B.A., O.I.O. and C.C.A. All authors have read and agreed to the published version of the manuscript.

Funding

This research is funded by the 2020 TETFUND National Research Fund (NRF) Intervention (grant number NRF/SET1/III/00055).

Data Availability Statement

Not applicable.

Acknowledgments

The authors wish to thank TETFUND National Research Fund Intervention for their support in carrying out this research.

Conflicts of Interest

The authors declare no conflict of interest.

References

  1. Trianni, A.; Cagno, E.; Accordini, D. Energy efficiency measures in electric motors systems: A novel classification highlighting specific implications in their adoption. Appl. Energy 2019, 252, 113481. [Google Scholar] [CrossRef]
  2. Almeida, A.T.; Ferreira, F.J.; Baoming, G. Beyond Induction Motors—Technology Trends to Move Up Efficiency. IEEE Trans. Ind. Appl. 2014, 50, 2103–2114. [Google Scholar] [CrossRef]
  3. De Souza, D.F.; Salotti, F.A.M.; Sauer, I.L.; Tatizawa, H.; de Almeida, A.T.; Kanashiro, A.G. A Performance Evaluation of Three-Phase Induction Electric Motors between 1945 and 2020. Energies 2022, 15, 2002. [Google Scholar] [CrossRef]
  4. Khan, F.; Sulaiman, E.; Ahmad Md, Z. Review of switched flux wound-field machines technology. IETE Tech. Rev. 2017, 34, 343–352. [Google Scholar] [CrossRef]
  5. Melfi, M.J.; Umans, S.D. Squirrel-Cage Induction Motors: Understanding Starting Transients. IEEE Ind. Appl. Mag. 2012, 18, 28–36. [Google Scholar] [CrossRef]
  6. Wu, Z.; Zhu, Z.Q.; Hua, W.; Akehurst, S.; Zhu, X.; Zhang, W.; Hu, J.; Li, H.; Zhu, J. Analysis and suppression of induced voltage pulsation in DC winding of five-phase wound-field switched flux machines. IEEE Trans. Energy Convers. 2019, 34, 1890–1905. [Google Scholar] [CrossRef]
  7. Akuru, U.B.; Kamper, M.J. Potentials of Locally Manufactured Wound-Field Flux Switching Wind Generator in South Africa. J. Energy S. Afr. 2019, 30, 110–117. [Google Scholar] [CrossRef]
  8. Akuru, U.B.; Kamper, M.J. Performance Comparison of Optimum Wound-field and Ferrite PM Flux Switching Machines for Wind Energy Applications. In Proceedings of the 2016 XXII International Conference on Electrical Machines (ICEM), Lausanne, Switzerland, 4–7 September 2016; pp. 2478–2485. [Google Scholar] [CrossRef]
  9. Zhao, G.; Hua, W.; Qi, J. Comparative Study of Wound-Field Flux-Switching Machines and Switched Reluctance Machines. IEEE Trans. Ind. Appl. 2019, 55, 2581–2591. [Google Scholar] [CrossRef]
  10. Sethupathi, P.; Senthilnathan, N. Comparative analysis of line-start permanent magnet synchronous motor and squirrel cage induction motor under customary power quality indices. Electr. Eng. 2020, 102, 1339–1349. [Google Scholar] [CrossRef]
  11. Muteba, M. Comparison of Dynamic Behaviors between a Synchronous Reluctance Motor with Brass Rotor Bars and a Squirrel Cage Induction Motor. In Proceedings of the 2019 IEEE PES/IAS PowerAfrica, Abuja, Nigeria, 20–23 August 2019; pp. 374–378. [Google Scholar] [CrossRef]
  12. Ozcelik, N.G.; Dogru, U.E.; Imeryuz, M.; Ergene, L.T. Synchronous Reluctance Motor vs. Induction Motor at Low-Power Industrial Applications: Design and Comparison. Energies 2019, 12, 2190. [Google Scholar] [CrossRef]
  13. Boldea, I. Induction Machines Handbook; CRC Press: Boca Raton, FL, USA, 2020. [Google Scholar]
  14. Cao, R.; Yuan, X.; Jin, Y.; Zhang, Z. MW-Class Stator Wound Field Flux-Switching Motor for Semidirect Drive Wind Power Generation System. IEEE Trans. Ind. Electron. 2019, 66, 795–805. [Google Scholar] [CrossRef]
  15. Akuru, U.B.; Kamper, M.J. Formulation and multiobjective design optimization of wound-field flux switching machines for wind energy drives. IEEE Trans. Ind. Electron. 2018, 65, 1828–1836. [Google Scholar] [CrossRef]
  16. Zulu, A.; Mecrow, B.C.; Armstrong, M. A wound-field three-phase flux-switching synchronous motor with all excitation sources on the stator. IEEE Trans. Ind. Appl. 2010, 46, 2363–2371. [Google Scholar] [CrossRef]
  17. Sulaiman, E.B.; Kosaka, T.; Matsui, N. Design study and experimental analysis of wound field flux switching motor for HEV applications. In Proceedings of the XXth International Conference on Electrical Machines, Marseille, France, 2–5 September 2012; pp. 1269–1275. [Google Scholar]
  18. Campbell, B.; Galleno, J. Motor life: The effects of loading, service factor and temperature rise on insulation life. In Proceedings of the IEEE Industry Applications Society 45th Annual Petroleum and Chemical Industry Conference, Indianapolis, Indiana, 28–30 September 1998; pp. 303–310. [Google Scholar]
  19. Udosen, D.; Kalengo, K.; Akuru, U.B.; Popoola, O.; Munda, J.L. Non-Conventional, Non-Permanent Magnet Wind Generator Candidates. Wind 2022, 2, 429–450. [Google Scholar] [CrossRef]
  20. Akuru, U.B.; Kamper, M.J. Intriguing Behavioral Characteristics of Rare-Earth-Free Flux Switching Wind Generators at Small- and Large-Scale Power Levels. IEEE Trans. Ind. Appl. 2018, 54, 5772–5782. [Google Scholar] [CrossRef]
  21. Yu, W.; Hua, W.; Zhang, Z. High-Frequency Core Loss Analysis of High-Speed Flux-Switching Permanent Magnet Machines. Electronics 2021, 10, 1076. [Google Scholar] [CrossRef]
  22. Fukami, T.; Aoki, B.; Shima, K.; Momiyama, M.; Kawamura, M. Assessment of Core Losses in a Flux-Modulating Synchronous Machine. IEEE Trans. Ind. Appl. 2012, 48, 603–611. [Google Scholar] [CrossRef]
Figure 1. Flowchart for SCIM semi-analytical design process.
Mathematics 11 03596 g001
Figure 2. Model representation of SCIM: (a) per phase equivalent circuit and (b) phasor diagram.
Mathematics 11 03596 g002
Figure 3. Flowchart for WFFSM semi-analytical design process.
Mathematics 11 03596 g003
Figure 4. Model representation of WFFSM: (a) per phase equivalent circuit and (b) phasor diagram.
Mathematics 11 03596 g004
Figure 5. SCIM cross-sectional and slot parameters: (a) FEA model, (b) stator slot, and (c) rotor slot.
Mathematics 11 03596 g005
Figure 6. WFFSM cross-sectional and parameters: (a) FEA model and (b) cross-sectional design.
Mathematics 11 03596 g006
Figure 7. The relationship between no-load voltage and field current.
Mathematics 11 03596 g007
Figure 8. Static 2D-FEA flux density plots: (a) SCIM (rotor position of 255.15°) and (b) WFFSM (rotor position of 315.64°).
Mathematics 11 03596 g008aMathematics 11 03596 g008b
Figure 9. Transient phase current results at rated condition: (a) SCIM and (b) WFFSM.
Mathematics 11 03596 g009
Figure 10. Transient speed results at rated condition: (a) SCIM and (b) WFFSM.
Mathematics 11 03596 g010
Figure 11. Transient torque results at rated condition: (a) SCIM and (b) WFFSM.
Mathematics 11 03596 g011
Figure 12. Speed comparison of SCIM and WFFSM at different load levels.
Mathematics 11 03596 g012
Figure 13. Developed torque comparison of SCIM and WFFSM at different load levels.
Mathematics 11 03596 g013
Figure 14. Power factor comparison of SCIM and WFFSM at different load levels.
Mathematics 11 03596 g014
Figure 15. Efficiency comparison of SCIM and WFFSM at different load levels.
Mathematics 11 03596 g015
Figure 16. Output power comparison of SCIM and WFFSM at different load levels.
Mathematics 11 03596 g016
Figure 17. SCIM power/torque-speed characteristic curves.
Mathematics 11 03596 g017
Figure 18. WFFSM power/torque-speed characteristic curves.
Mathematics 11 03596 g018
Table 1. Specifications and calculated parameters of the SCIM.
DescriptionParameterValue
Rated speed (rpm)ωs1450
Number of polesP14
Number of stator slots Ns36
Split ratioKD0.62
Stack length (mm)Lst(SCIM)154
Stator outer diameter (mm)Dos(SCIM)210.8
Stator inner diameter (mm)Dis(SCIM)130.7
Stator slot height (mm)hs00.8
Number of turns per phaseW148
Number of rotor slotsNr30
Airgap length (mm)g(SCIM)0.33
Rotor outer diameter (mm)Dor(SCIM)130.37
Rotor slot height (mm)hr00.5
Table 2. Design parameters of the WF-FSM model.
DescriptionParameterValues
Rated speed (rpm)ωr1500
Stack length (mm)Lst107
Aspect ratioKL0.7
Split ratioɅ00.6
Number of stator slots Ps24
Stator outer diameter (mm)Dout254
Stator inner diameter (mm)Din152
Stator tooth arc factorCs0.25
Number of rotor slotsPr10
Airgap length (mm)g0.5
Rotor outer diameter (mm)Dor151.5
Slot filling factoraf0.45
Area of field coils (mm2)Sf124
Table 3. Comparison of SCIM and WFFSM at rated condition.
Performance QuantitySCIM WFFSM
Analytical ResultsFEA ResultsAnalytical ResultsFEA Results
Tavg (Nm)49.3948.4747.7549.22
TR (%)-2.58-3.60
Pout (kW)7.507.457.507.73
Slip (%)3.102.93--
Pcu (W)181.23176.38135.45107.39
Pcore (W)119.41104.23-191.18
Ƞ (%)89.5093.4889.5096.28
PF0.83000.87670.83000.9954
Tm (Nm/Kg)1.34-1.57-
Td (kNm/m3)9.179.158.819.08
Cost (€)53.50-65.45-
Table 4. Material cost of SCIM and WFFSM.
Motor PartsSCIM WFFSM
Mass (Kg)Cost (€/Kg)Mass (Kg)Cost (€/Kg)
Stator17.60117.301
Rotor15.2018.361
Copper coils2.4575.687
Aluminum bars1.013.5--
Disclaimer/Publisher’s Note: The statements, opinions and data contained in all publications are solely those of the individual author(s) and contributor(s) and not of MDPI and/or the editor(s). MDPI and/or the editor(s) disclaim responsibility for any injury to people or property resulting from any ideas, methods, instructions or products referred to in the content.

