
Task-Offloading Strategy Based on Performance Prediction in Vehicular Edge Computing


Abstract
:1. Introduction
- (1)
- We propose a task-offloading scheme based on deep-learning-based prediction, in which a binary classifier is responsible for predicting the offloading result (success/failure) and a regressor is responsible for service-delay prediction. The model is trained with history offloading data to predict the performance of task offloading, and to make task-offloading decisions based on the predicted results.
- (2)
- We propose an automatic feature-generation model based on convolutional neural networks (CNN). Our approach uses the convolutional layer to capture intersections between raw features to generate new features, avoid the unstable performance caused by manually designed features, and improve the practicability and robustness of prediction models.
2. Related Work
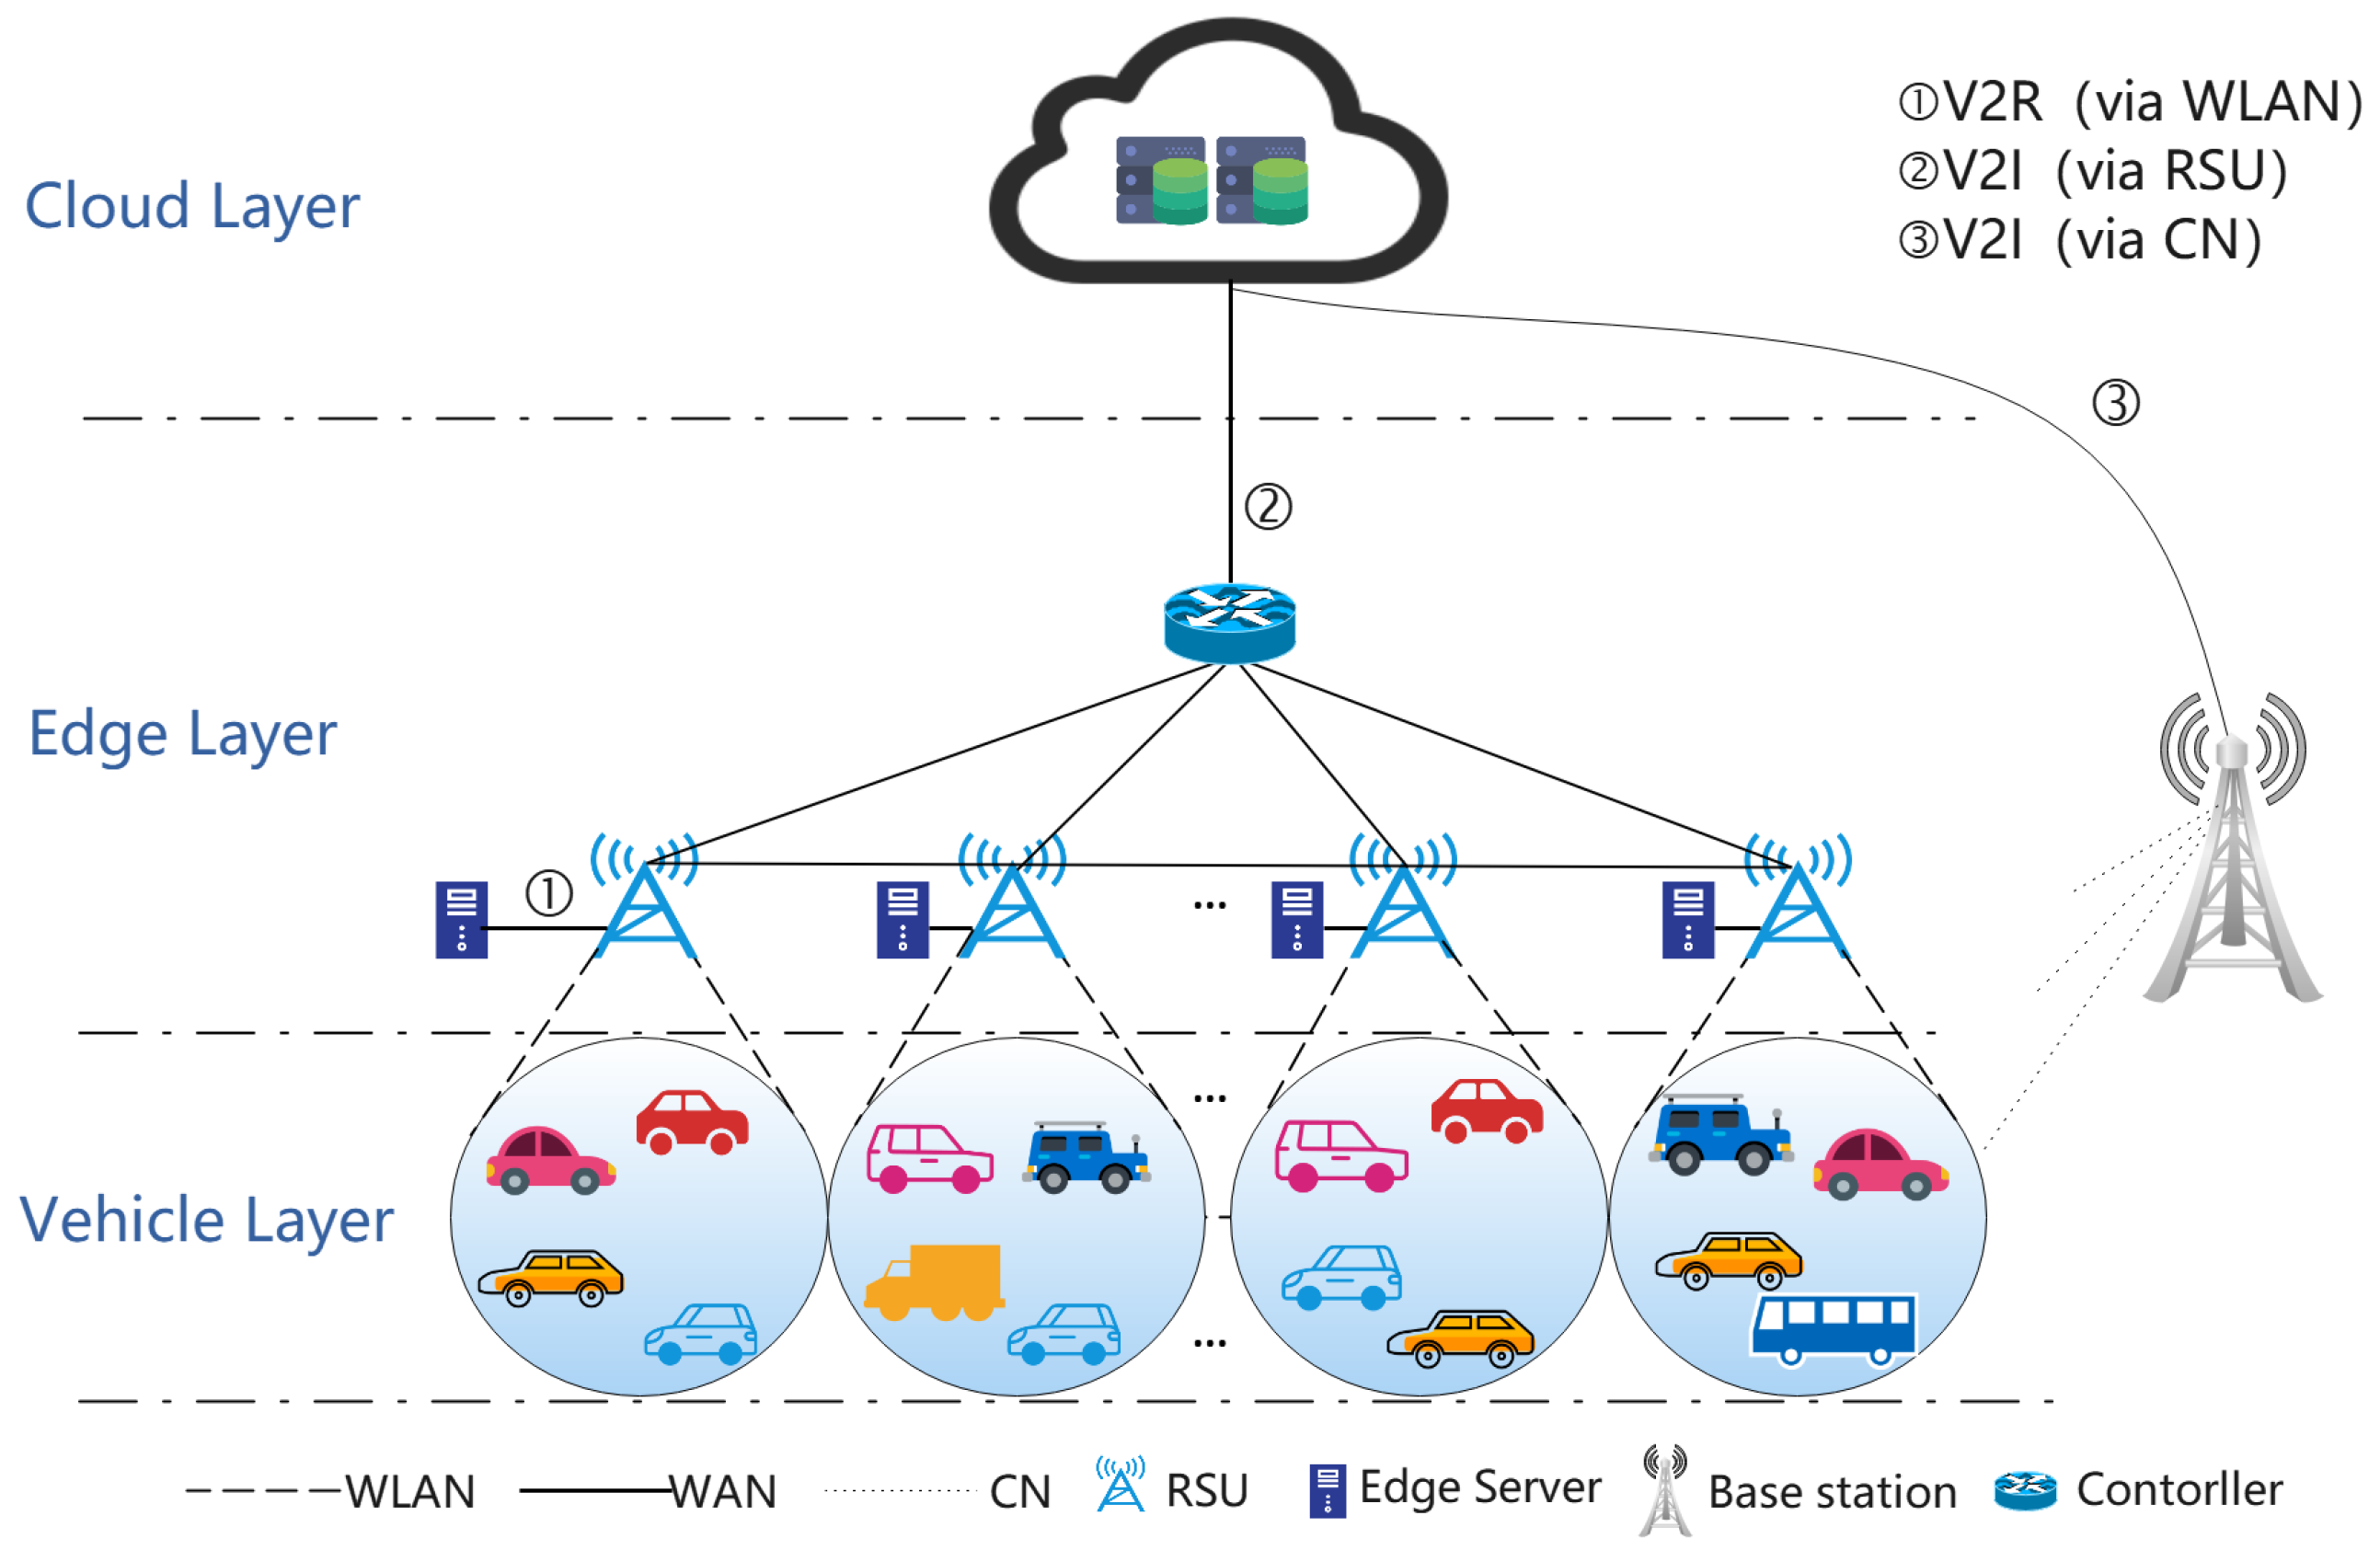
3. System Model
4. Task-Offloading Strategy Based on Performance Prediction
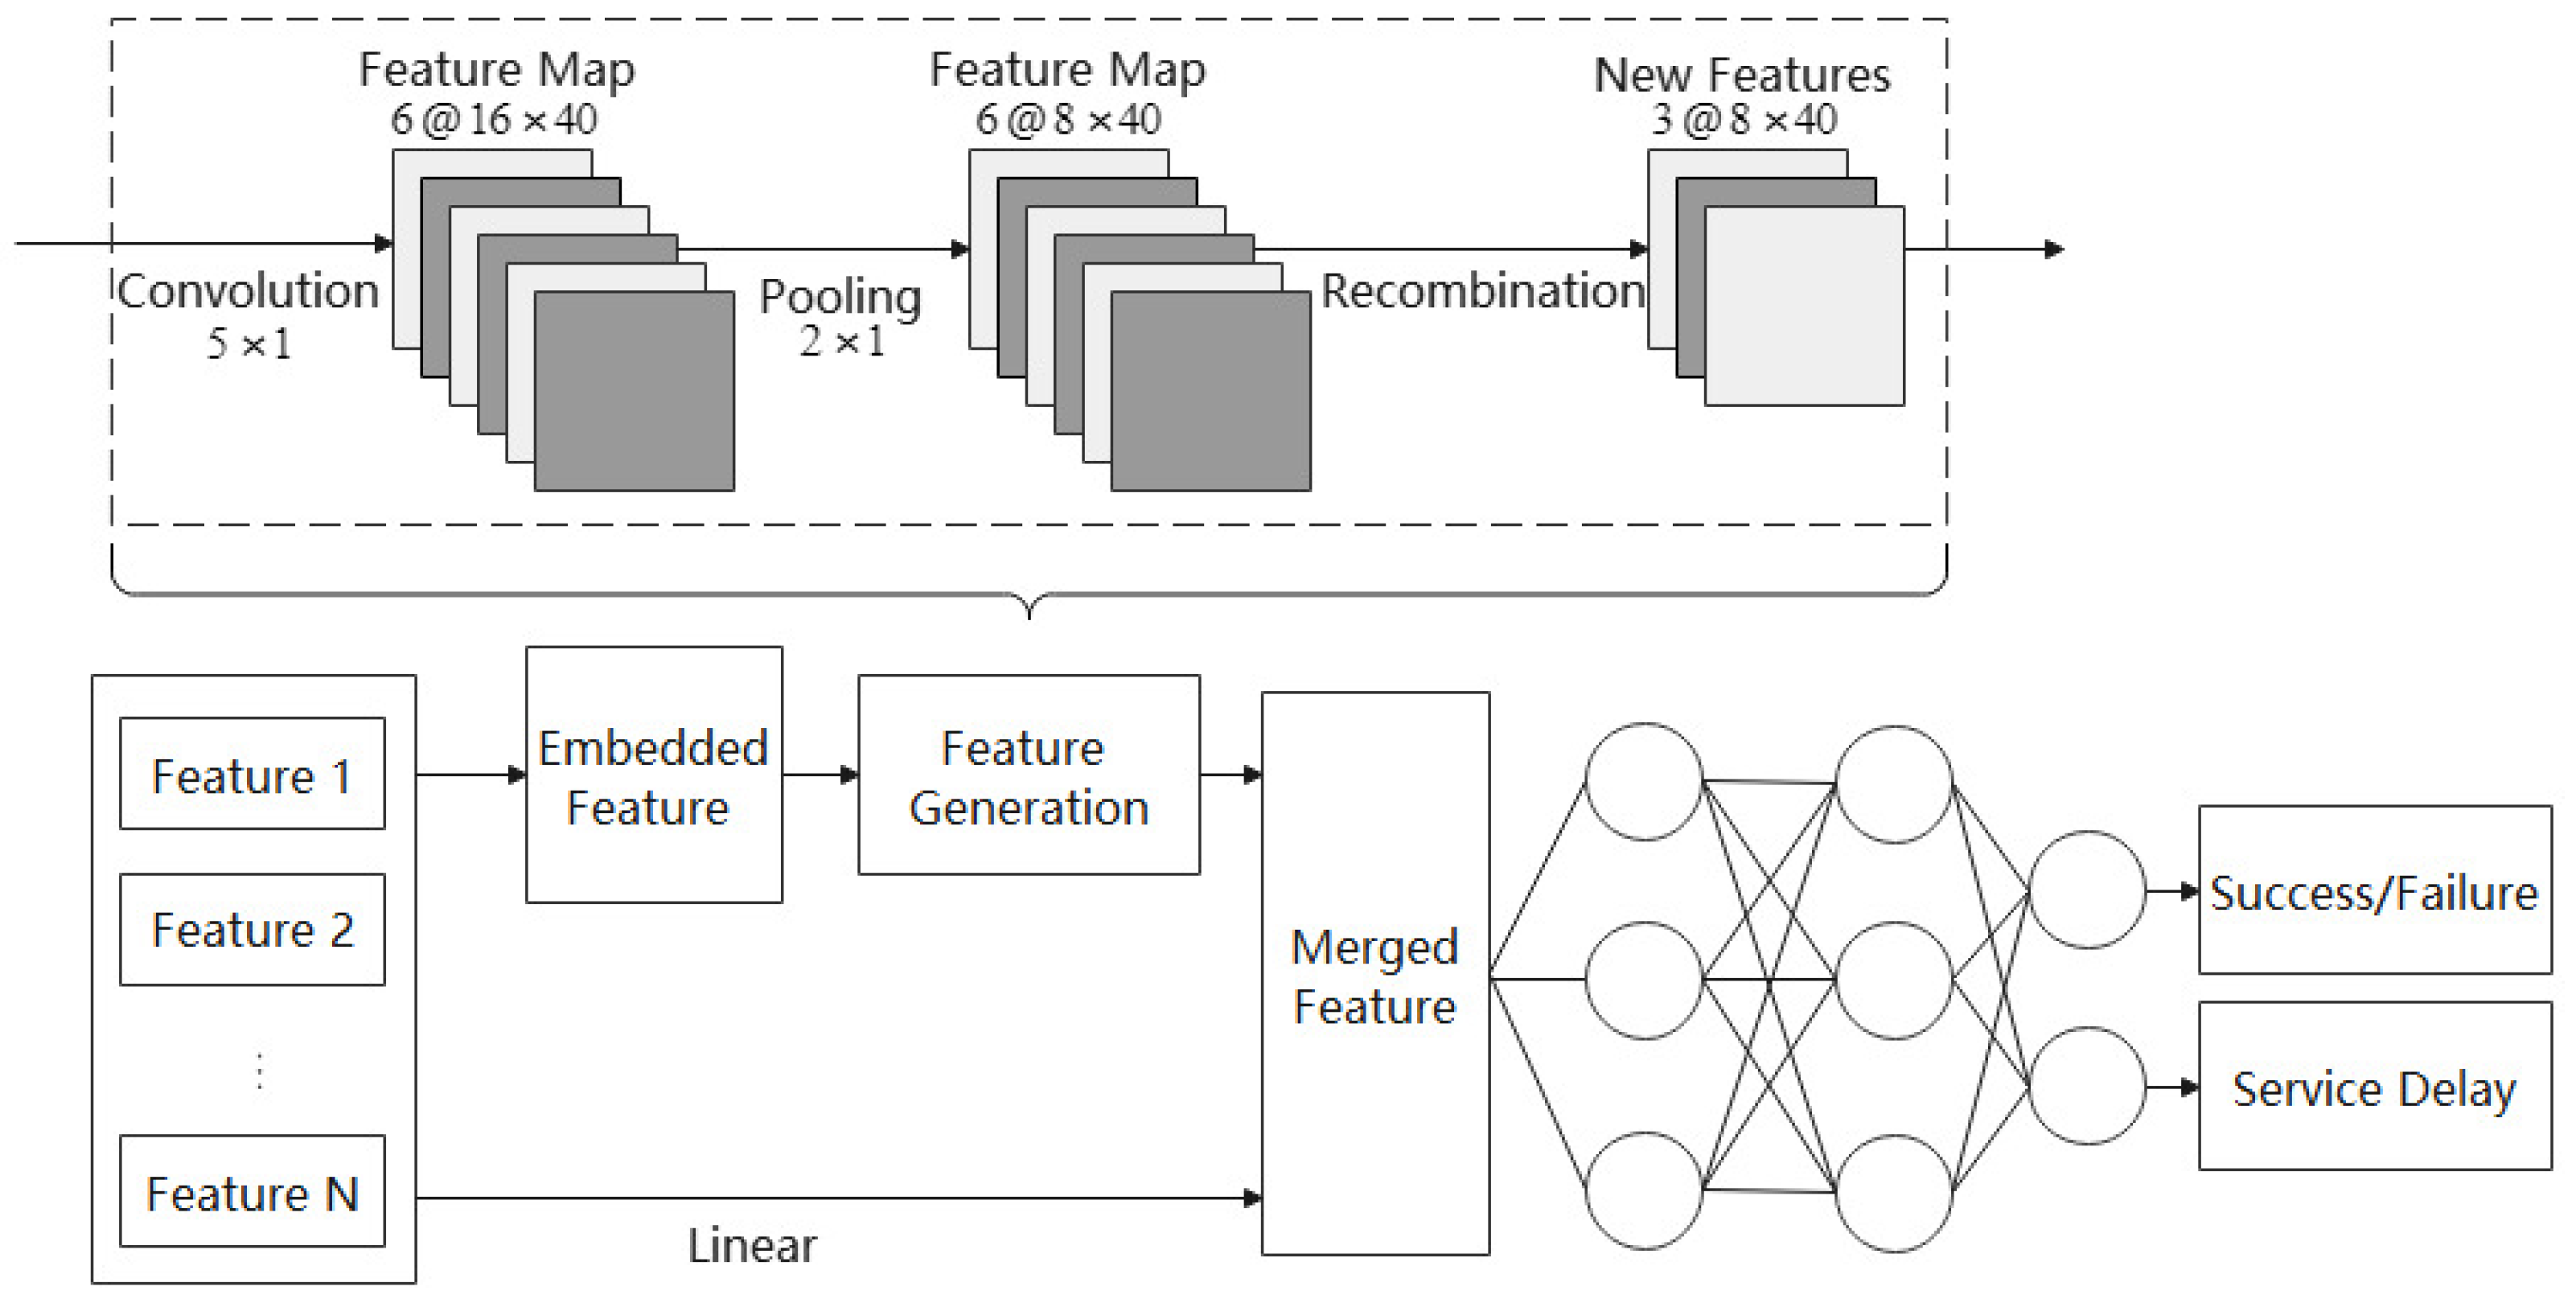
4.1. Prediction Model with Automatic Feature Generation
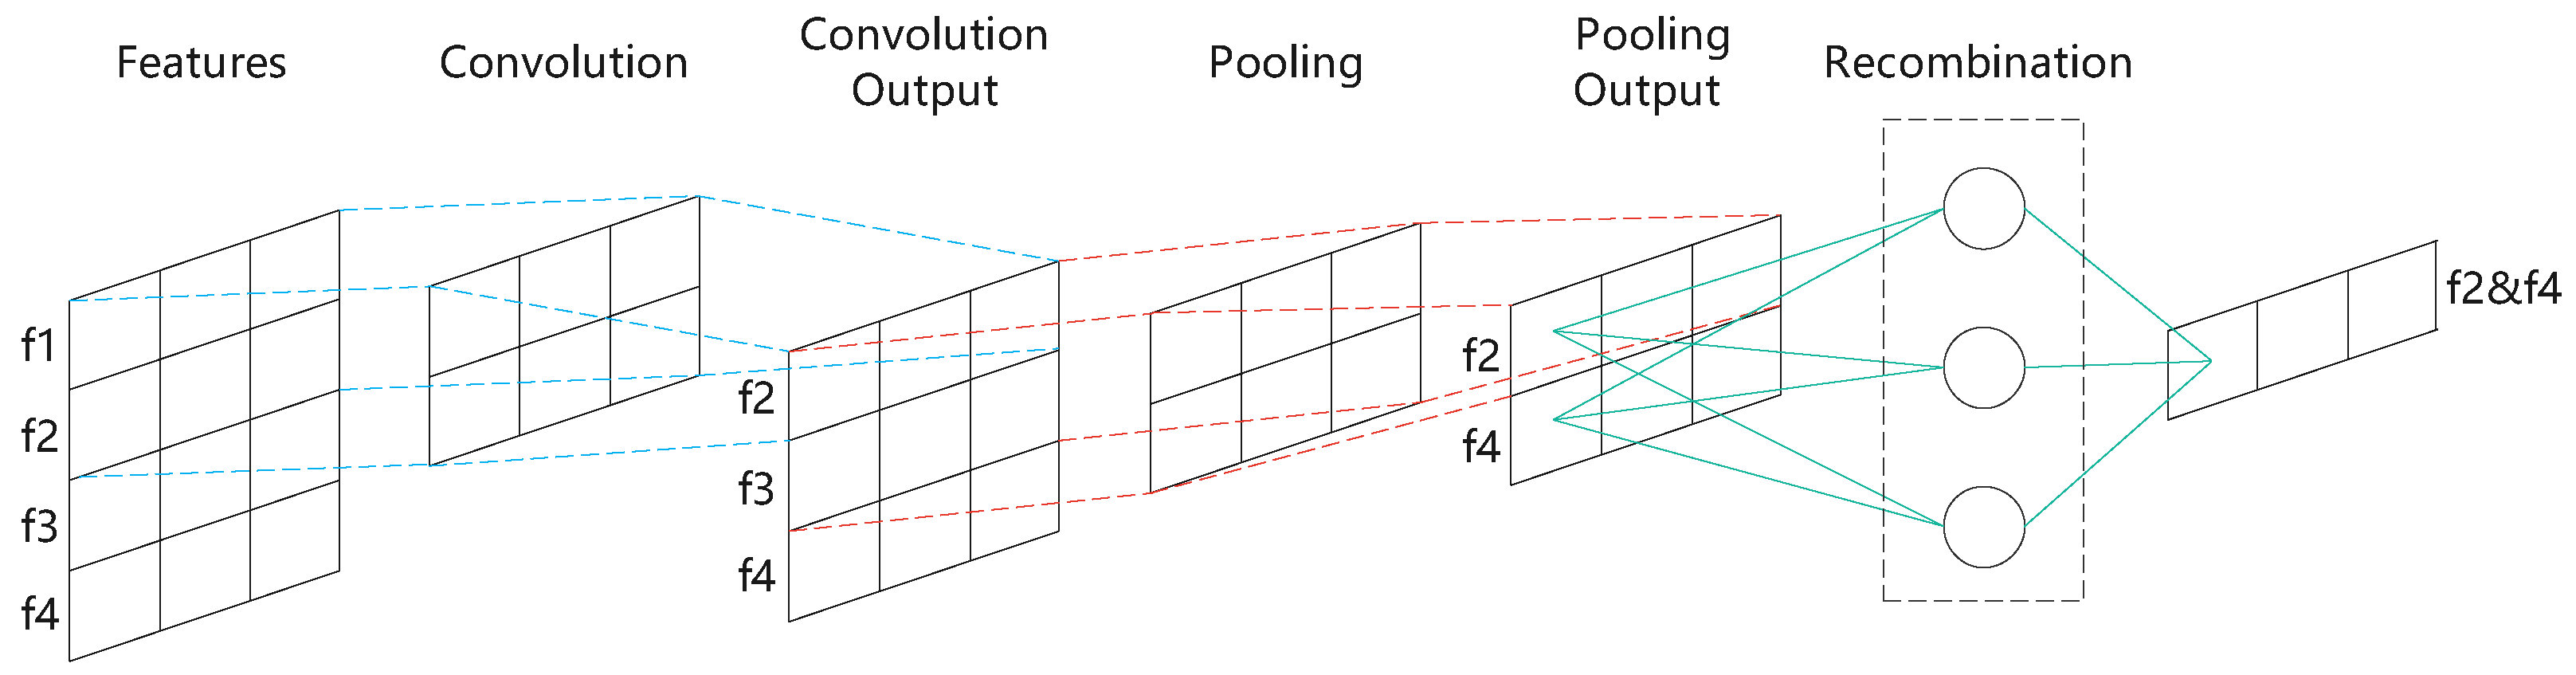
4.1.1. Feature-Generation Module
- (1)
- Convolution layer
- (2)
- Pooling layer
- (3)
- Recombination layer
4.1.2. Task-Offloading Result Prediction Module
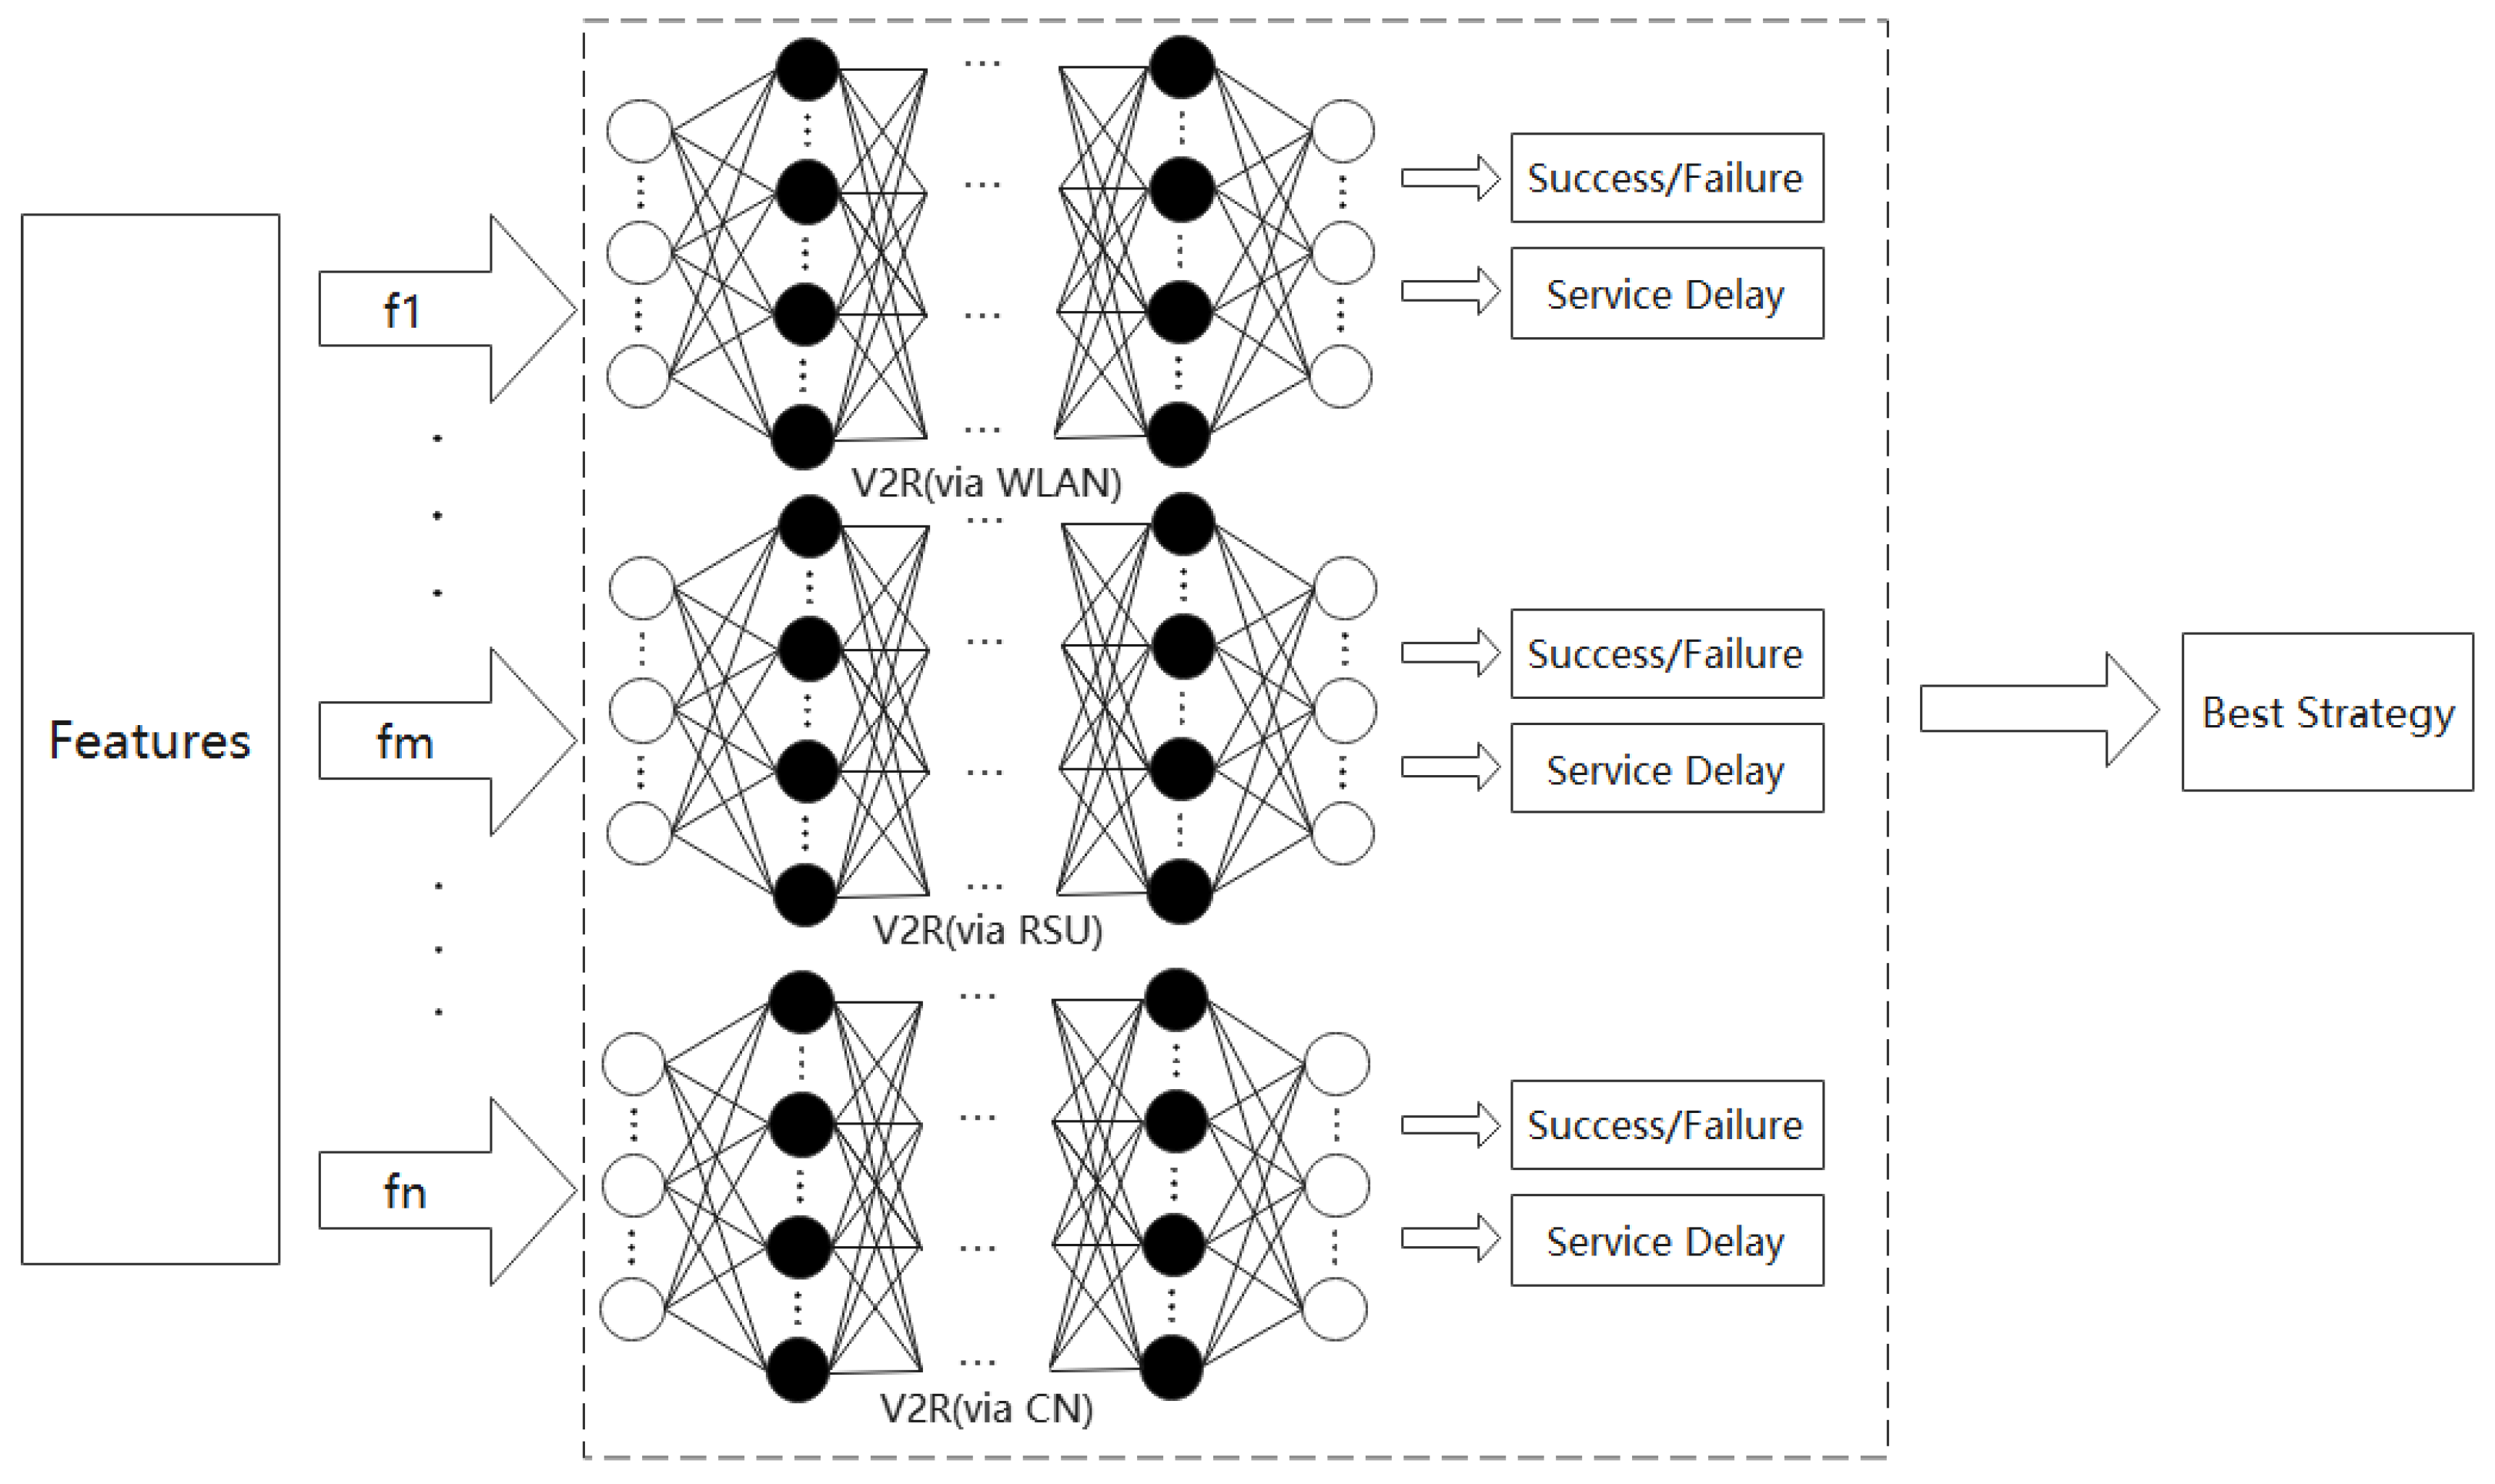
4.2. Task-Offloading Strategy Based on Performance Prediction
| Algorithm 1 Task-offloading strategy based on performance prediction | |
| Require:: 14 selected features of a task; : the proposed model; : | |
| vehicles communicate with RSUs via WLAN; : vehicle-to-infrastructure via RSUs; | |
| : vehicle-to-infrastructure via CN; | |
| Ensure:i: selected the i-th offloading strategy; | |
| 1: | function BestStrategy () |
| 2: | |
| 3: | |
| 4: | |
| 5: | |
| 6: | |
| 7: | for each do |
| 8: | if ≠ 0 then |
| 9: | if == 0 or > then |
| 10: | |
| 11: | |
| 12: | end if |
| 13: | end if |
| 14: | end for |
| 15: | return |
| 16: | end function |
5. Performance Evaluation
5.1. Feature Selection
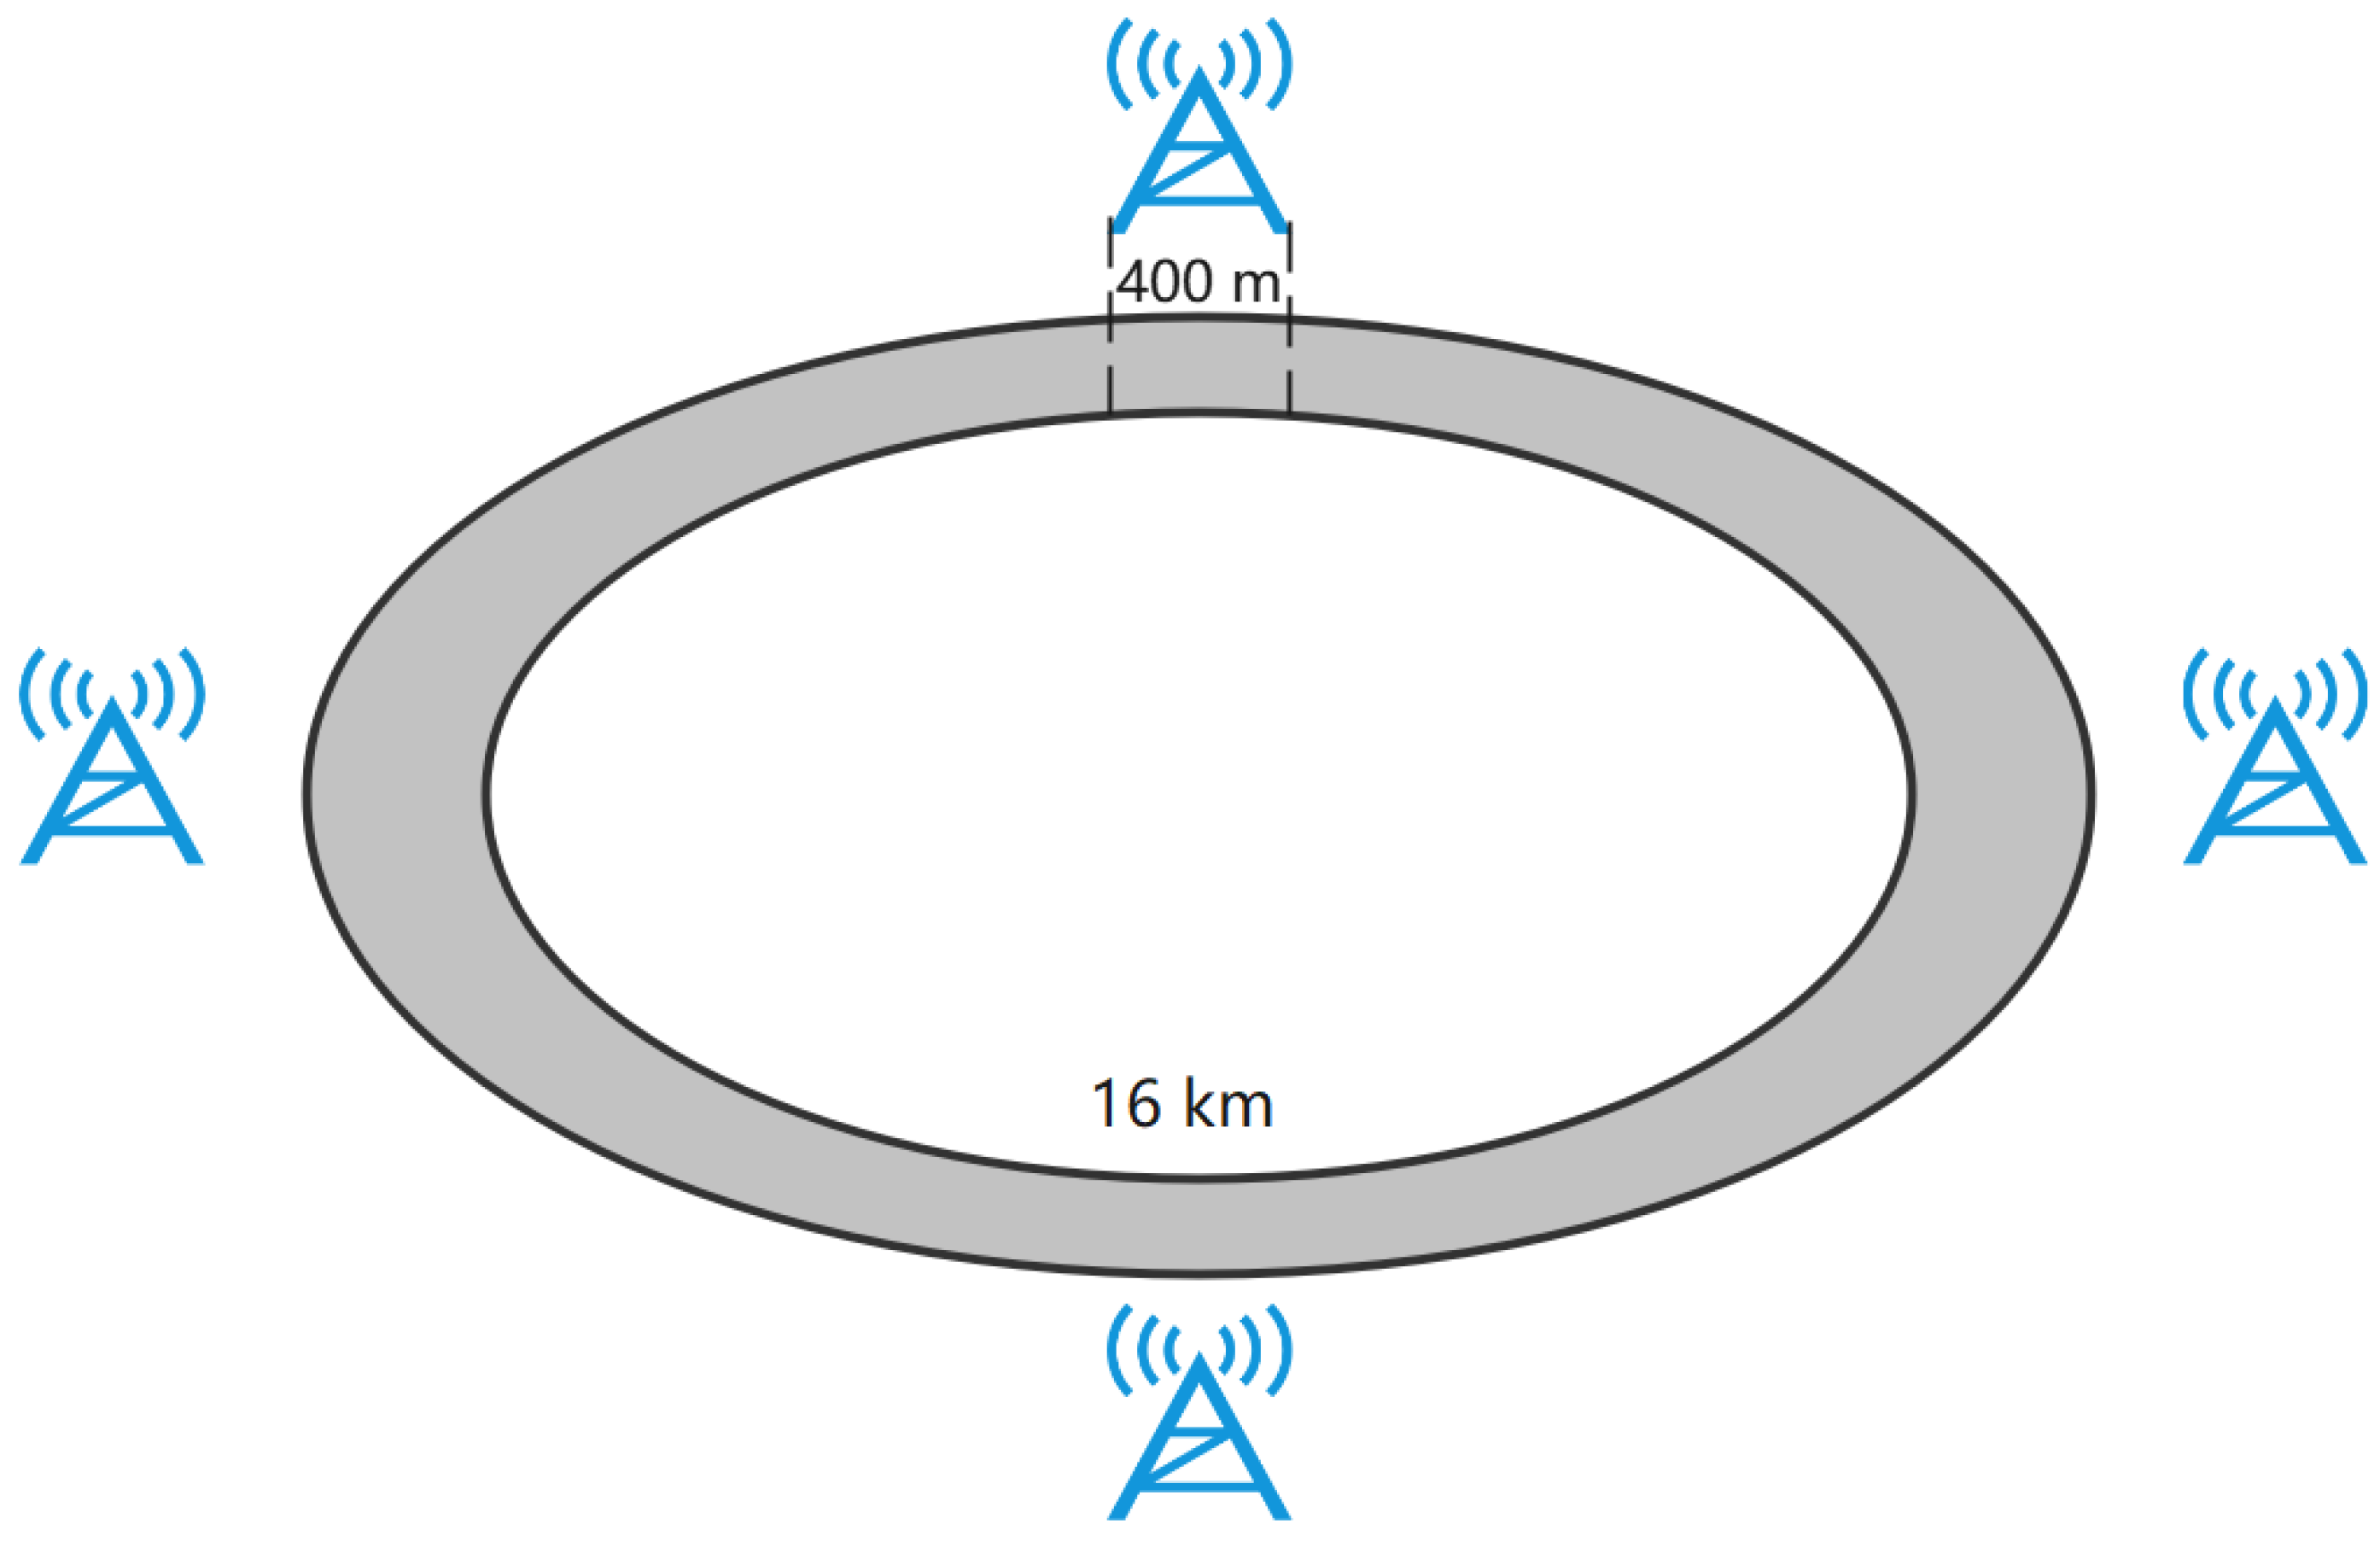
5.2. Simulation Setting
5.3. Simulation Results and Analysis
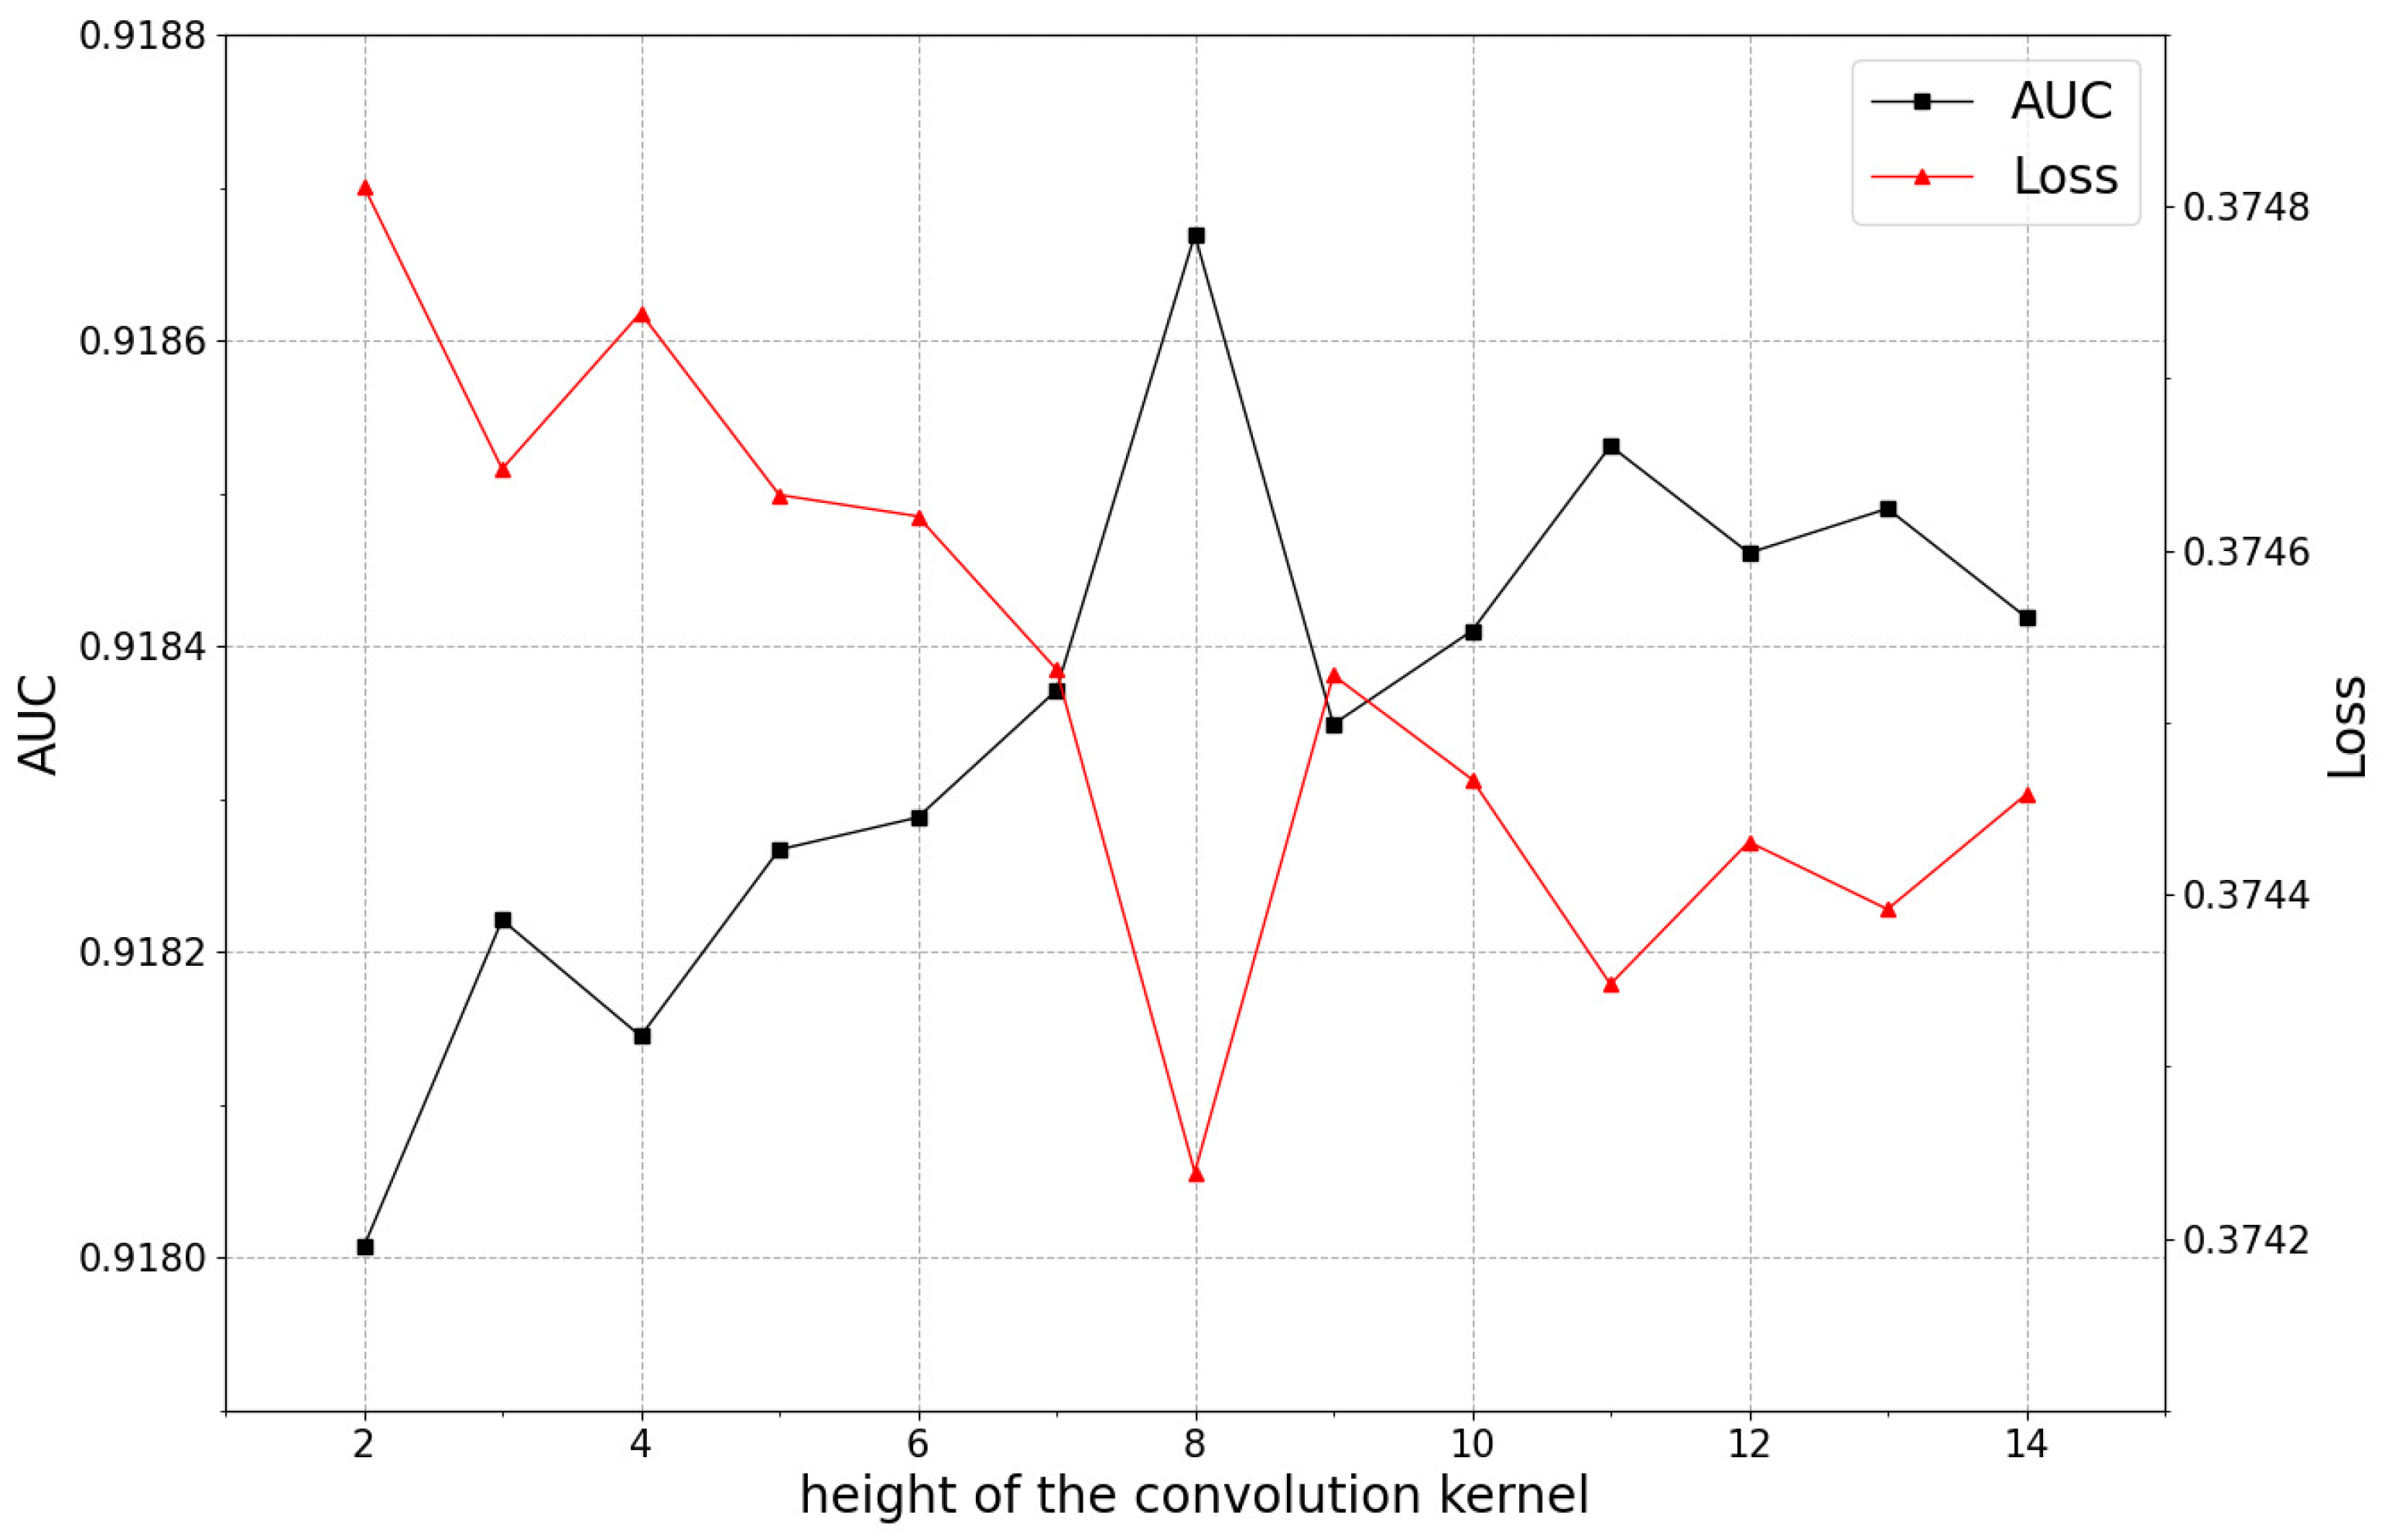
5.3.1. The Impact of the Height of Convolution Kernel on Model Performance
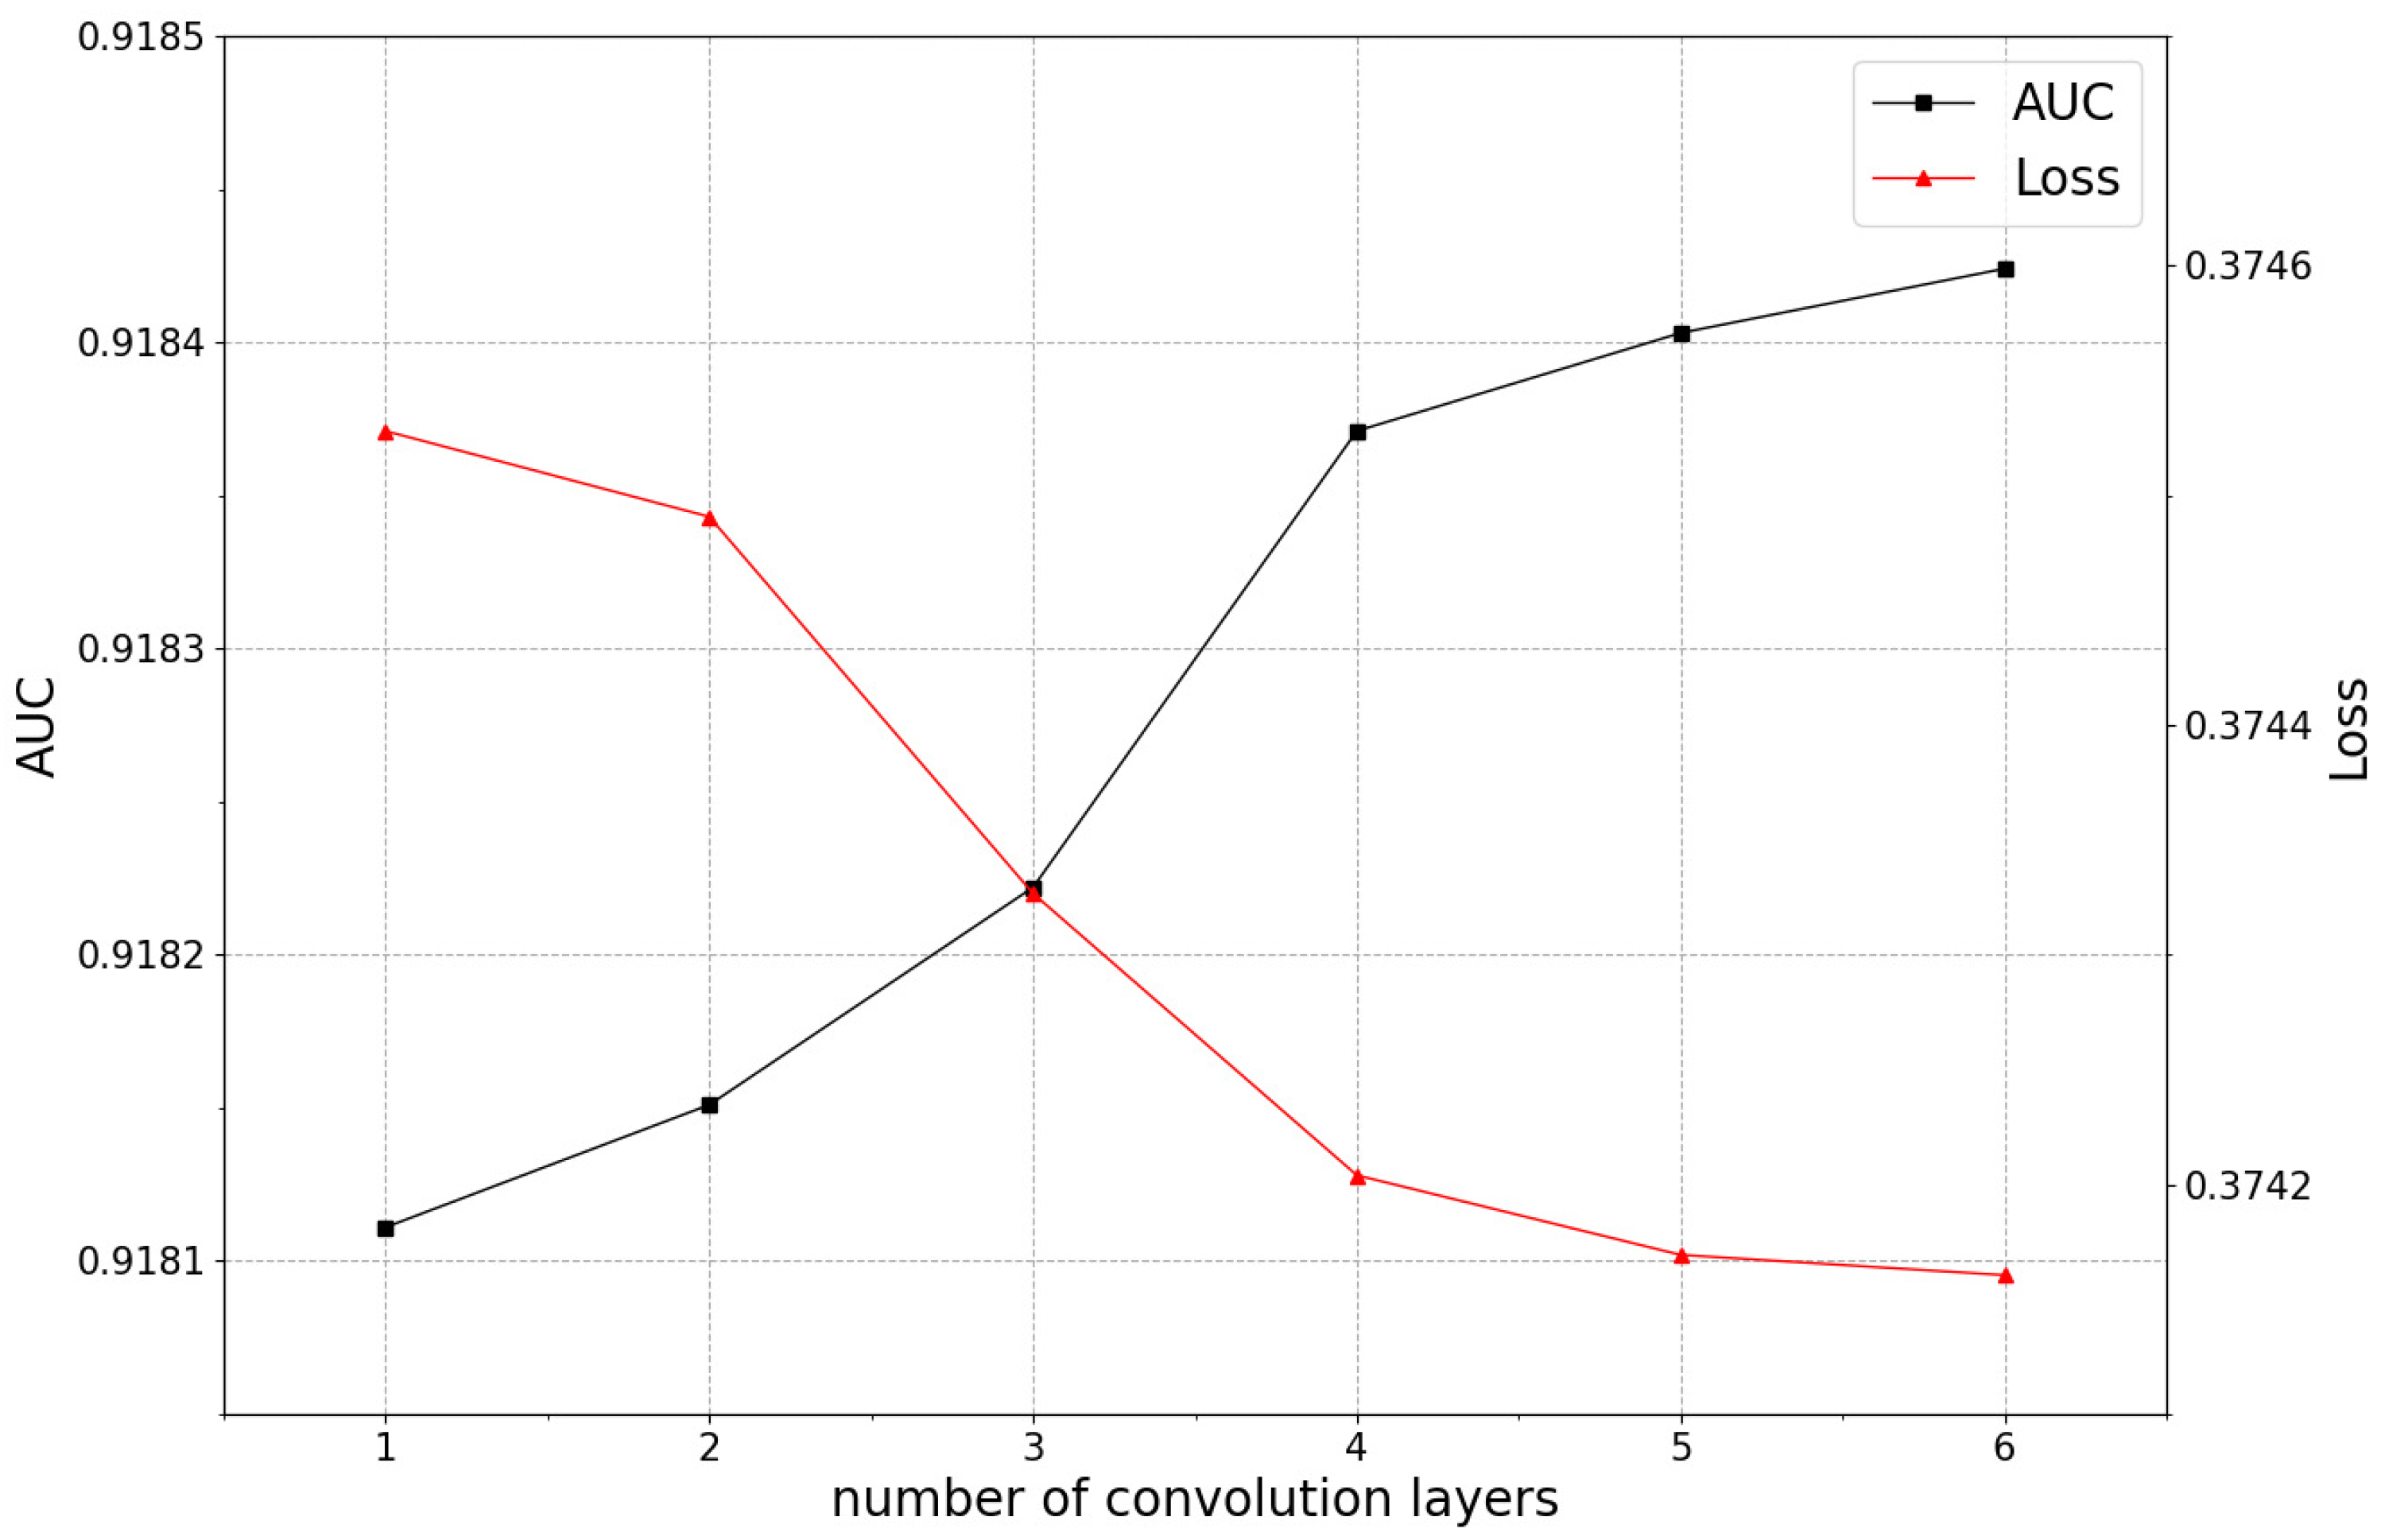
5.3.2. The Impact of the Number of Convolution Layers on Model Performance
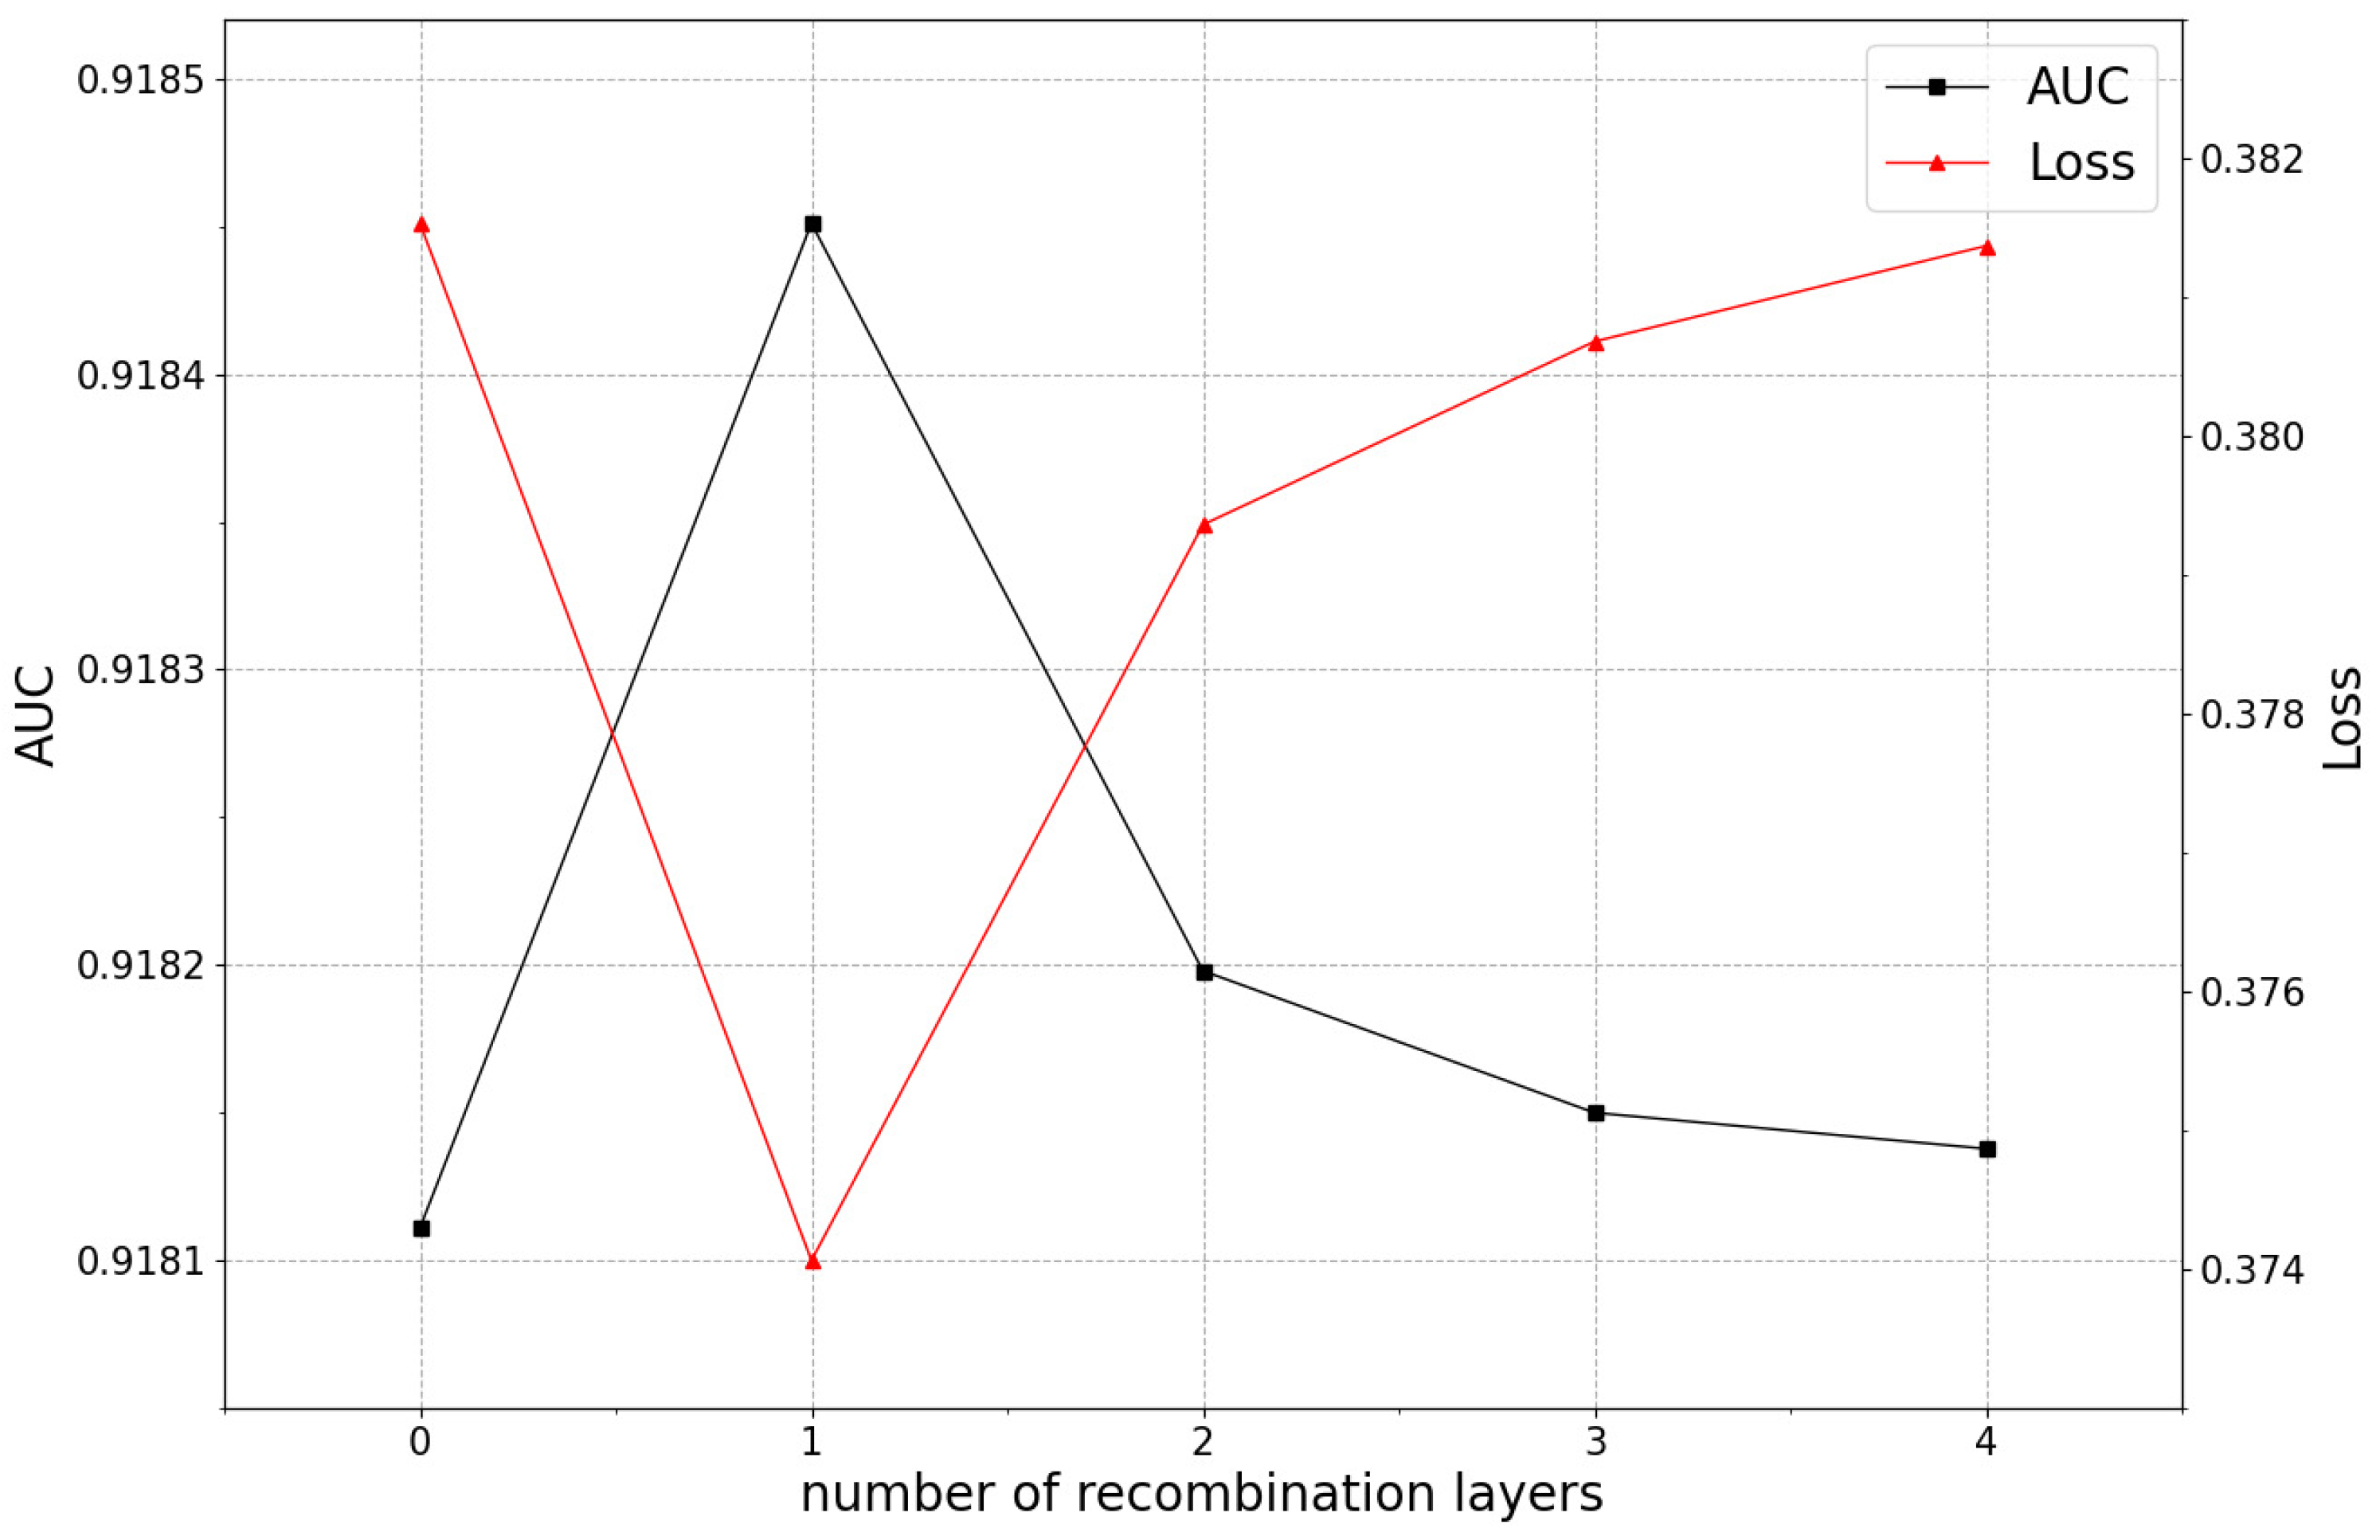
5.3.3. The Impact of the Number of Recombination Layers on Model Performance
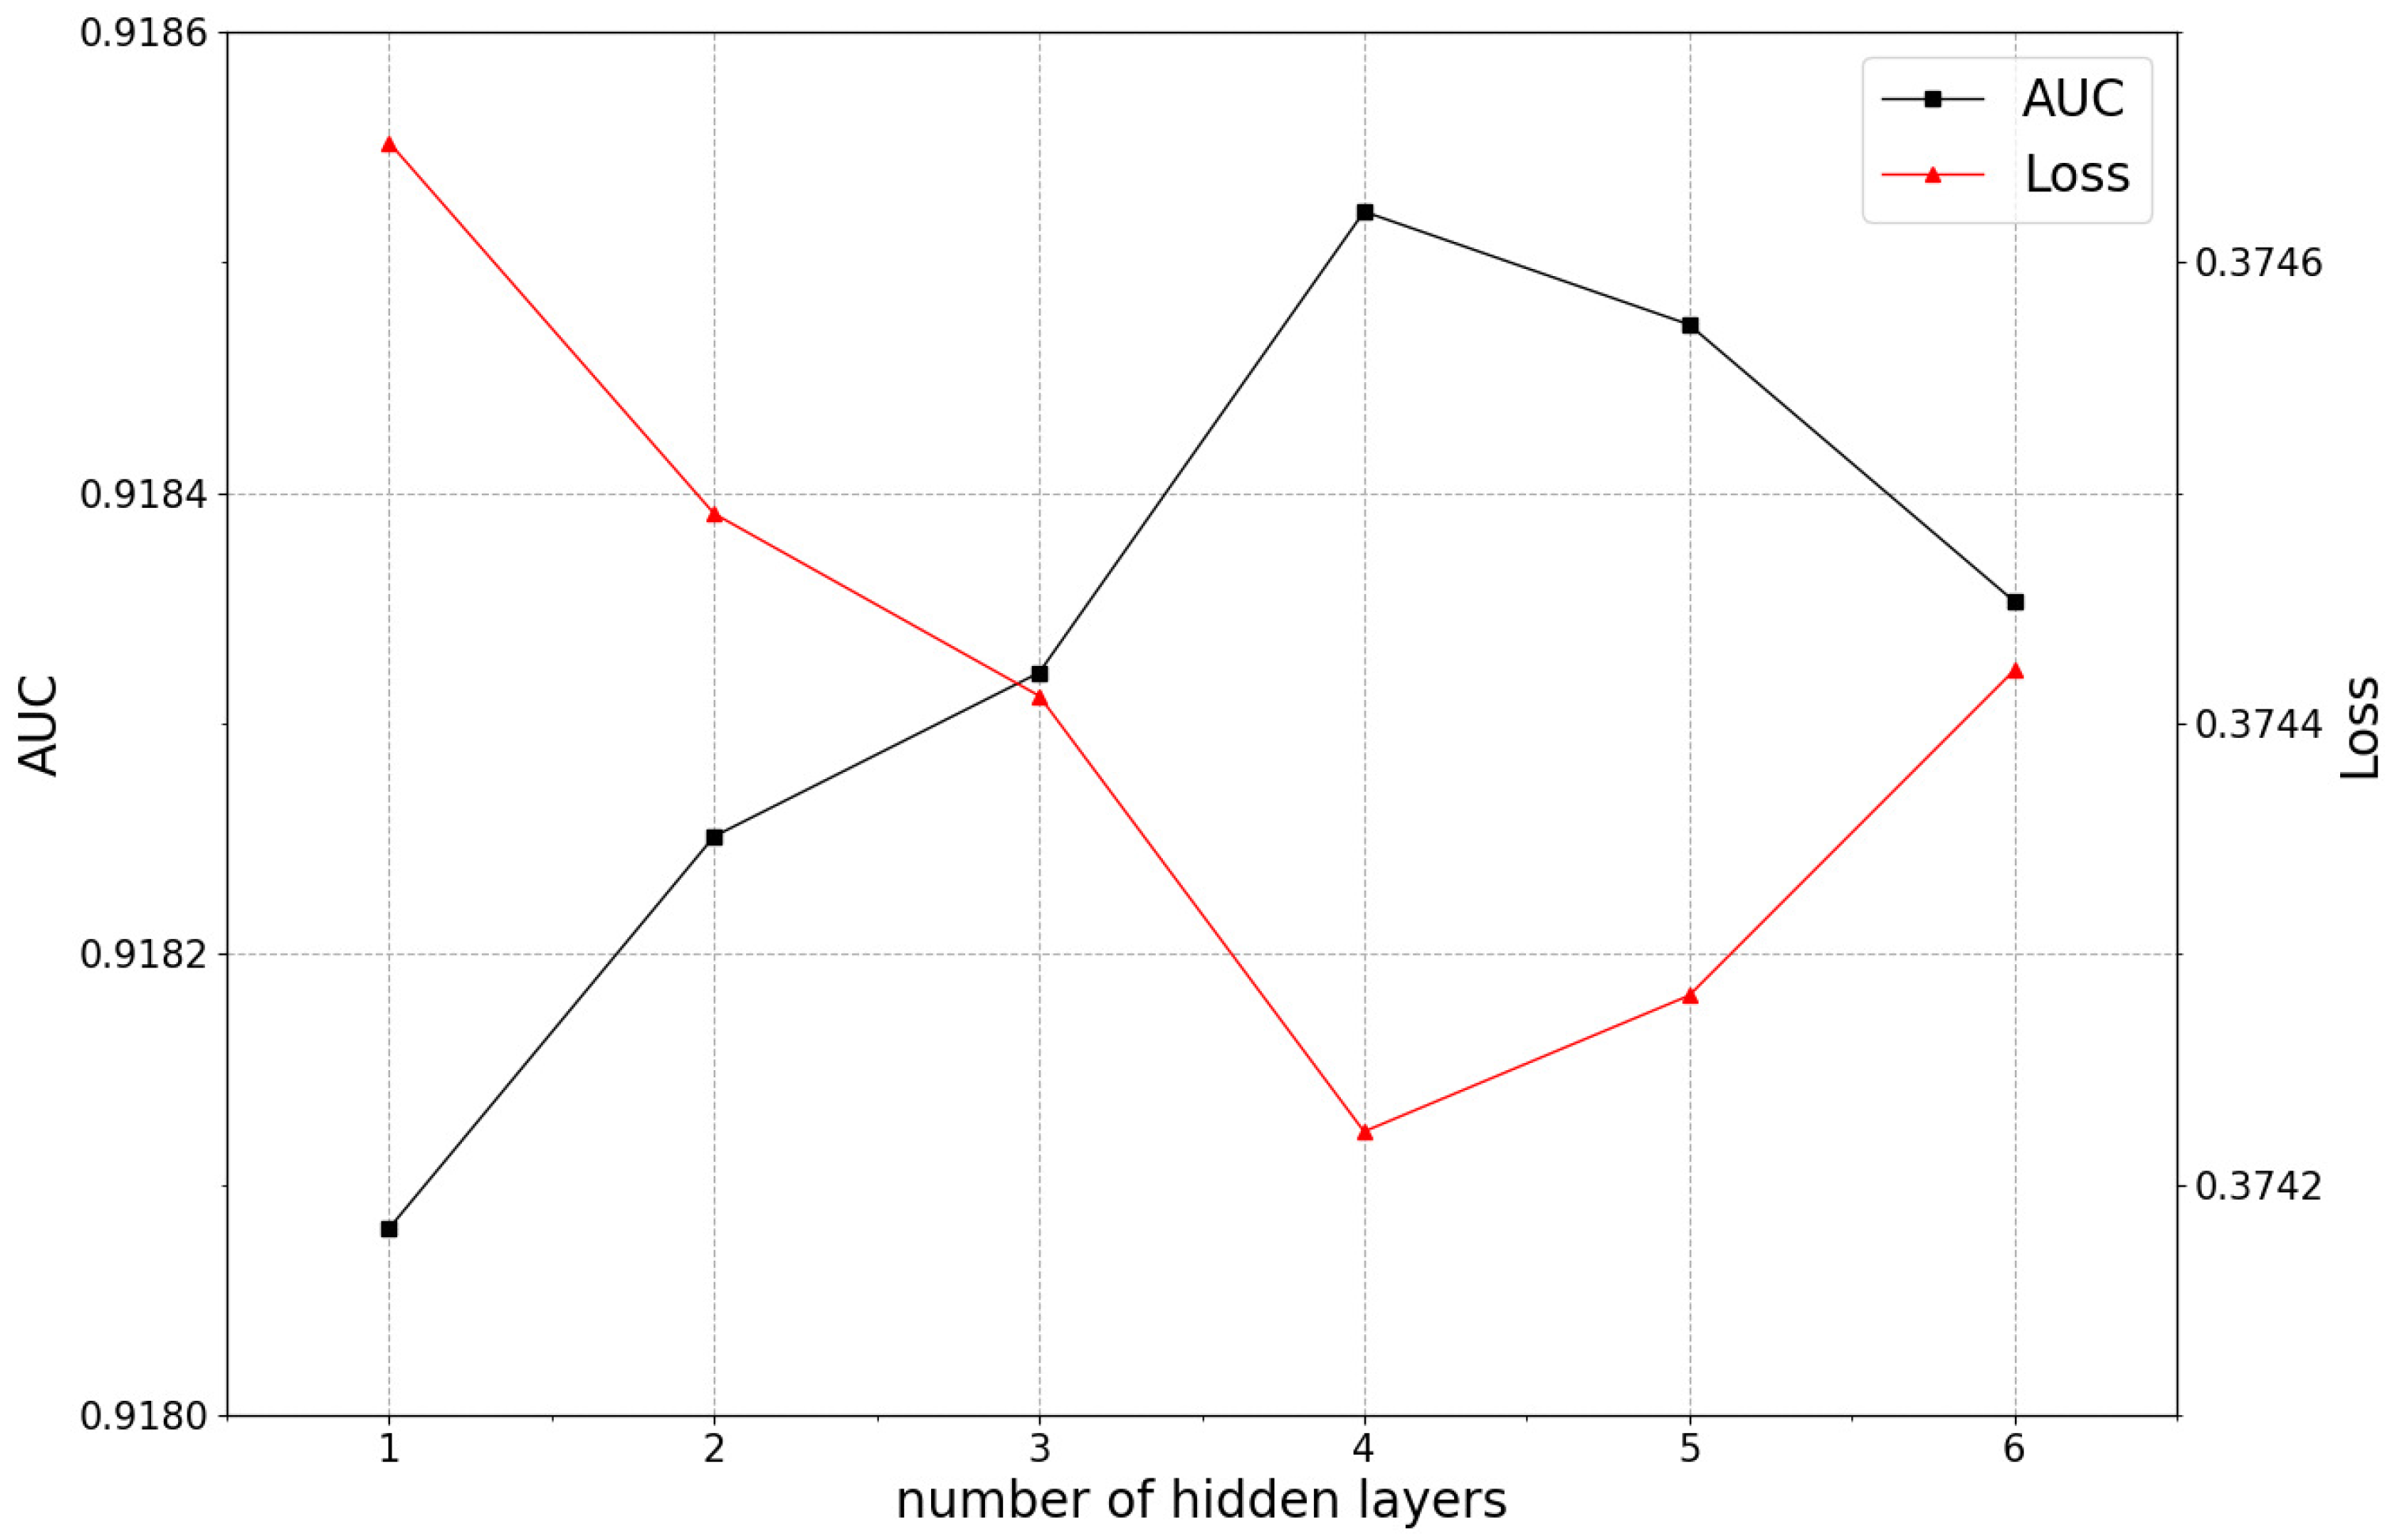
5.3.4. The Impact of the Number of Hidden Layers on Model Performance
5.3.5. The Impact of Different Parts of Feature-Generation Module on Model Performance
- (1)
- The benchmark model is a complete model for task offloading based on CNN automatic feature generation, which serves as a control group for the entire experiment.
- (2)
- The model with the removal of the raw features means that after features are generated, only new features are the input into the prediction model, and raw features are discarded. This is mainly used to examine the impact of the raw features on the performance.
- (3)
- The model with the removal of new features means that newly generated features are not input into the model, and the model is equivalent to the ordinary DNN neural network, which is mainly used to examine the impact of newly generated feature on the performance.
- (4)
- The model with the removal of recombination layer means that newly generated features are the input to the prediction model together with the raw features. However, in this model, the raw features are not recombined after the convolutional layer and the pooling layer, and the output is directly input to the predictive model to evaluate the impact of the recombination layers on the performance.
5.3.6. Performance Comparison with Other Models
6. Conclusions
Author Contributions
Funding
Institutional Review Board Statement
Informed Consent Statement
Data Availability Statement
Conflicts of Interest
References
- Olariu, S. A Survey of Vehicular Cloud Research: Trends, Applications and Challenges. IEEE Trans. Intell. Transp. Syst. 2020, 21, 2648–2663. [Google Scholar] [CrossRef]
- Foh, C.H.; Kantarci, B.; Chatzimisios, P.; Wu, J.; Gao, D. IEEE Access Special Section Editorial: Advances in Vehicular Clouds. IEEE Access 2016, 4, 10315–10317. [Google Scholar] [CrossRef]
- Liu, L.; Chen, C.; Pei, Q.; Maharjan, S.; Zhang, Y. Vehicular Edge Computing and Networking: A Survey. Mob. Netw. Appl. 2021, 26, 1145–1168. [Google Scholar] [CrossRef]
- Wang, R.; Zeng, F.; Yao, L.; Wu, J. Game-Theoretic Algorithm Designs and Analysis for Interactions among Contributors in Mobile Crowdsourcing with Word of Mouth. IEEE Internet Things J. 2020, 7, 8271–8286. [Google Scholar] [CrossRef]
- Feng, J.; Liu, Z.; Wu, C.; Ji, Y. AVE: Autonomous Vehicular Edge Computing Framework with ACO-Based Scheduling. IEEE Trans. Veh. Technol. 2017, 66, 10660–10675. [Google Scholar] [CrossRef]
- Ahmed, A.; Ahmed, E. A Survey on Mobile Edge Computing. In Proceedings of the 2016 10th International Conference on Intelligent Systems and Control (ISCO), Coimbatore, India, 7–8 January 2016; pp. 1–8. [Google Scholar] [CrossRef]
- Abbas, N.; Zhang, Y.; Taherkordi, A.; Skeie, T. Mobile Edge Computing: A Survey. IEEE Internet Things J. 2018, 5, 450–465. [Google Scholar] [CrossRef] [Green Version]
- Rasheed, A.; Chong, P.H.J.; Ho, I.W.H.; Li, X.J.; Liu, W. An Overview of Mobile Edge Computing: Architecture, Technology and Direction. KSII Trans. Internet Inf. Syst. (TIIS) 2019, 13, 4849–4864. [Google Scholar] [CrossRef]
- Raza, S.; Wang, S.; Ahmed, M.; Anwar, M. A Survey on Vehicular Edge Computing: Architecture, Applications, Technical Issues, and Future Directions. Wirel. Commun. Mob. Comput. 2019, 2019, 3159762. [Google Scholar] [CrossRef]
- Zeng, F.; Chen, Q.; Meng, L.; Wu, J. Volunteer Assisted Collaborative Offloading and Resource Allocation in Vehicular Edge Computing. IEEE Trans. Intell. Transp. Syst. 2021, 22, 3247–3257. [Google Scholar] [CrossRef]
- Wu, G.; Li, Z. Task Offloading Strategy and Simulation Platform Construction in Multi-User Edge Computing Scenario. Electronics 2021, 10, 3038. [Google Scholar] [CrossRef]
- Chen, J.; Yang, Y.; Wang, C.; Zhang, H.; Qiu, C.; Wang, X. Multi-Task Offloading Strategy Optimization based on Directed Acyclic Graphs for Edge Computing. IEEE Internet Things J. (Early Access). 2021. [Google Scholar] [CrossRef]
- Wang, K.; Wang, X.; Liu, X.; Jolfaei, A. Task Offloading Strategy Based on Reinforcement Learning Computing in Edge Computing Architecture of Internet of Vehicles. IEEE Access 2020, 8, 173779–173789. [Google Scholar] [CrossRef]
- Kang, J.; Yu, R.; Huang, X.; Wu, M.; Maharjan, S.; Xie, S.; Zhang, Y. Blockchain for secure and efficient data sharing in vehicular edge computing and networks. IEEE Internet Things J. 2019, 6, 4660–4670. [Google Scholar] [CrossRef]
- Astarita, V.; Giofrè, V.P.; Mirabelli, G.; Solina, V. A Review of Blockchain-Based Systems in Transportation. Information 2020, 11, 21. [Google Scholar] [CrossRef] [Green Version]
- Tanwar, S.; Bhatia, Q.; Patel, P.; Kumari, A.; Singh, P.K.; Hong, W.-C. Machine Learning Adoption in Blockchain-Based Smart Applications: The Challenges, and a Way Forward. IEEE Access 2020, 8, 474–488. [Google Scholar] [CrossRef]
- Liu, P.; Li, J.; Sun, Z. Matching-Based Task Offloading for Vehicular Edge Computing. IEEE Access 2019, 7, 27628–27640. [Google Scholar] [CrossRef]
- Feng, J.; Liu, Z.; Wu, C.; Ji, Y. Mobile Edge Computing for the Internet of Vehicles: Offloading Framework and Job Scheduling. IEEE Veh. Technol. Mag. 2019, 14, 28–36. [Google Scholar] [CrossRef]
- Sonmez, C.; Tunca, C.; Ozgovde, A.; Ersoy, C. Machine Learning-Based Workload Orchestrator for Vehicular Edge Computing. IEEE Trans. Intell. Transp. Syst. 2021, 22, 2239–2251. [Google Scholar] [CrossRef]
- Yang, B.; Cao, X.; Li, X.; Zhang, Q.; Qian, L. Mobile-Edge-Computing-Based Hierarchical Machine Learning Tasks Distribution for IIoT. IEEE Internet Things J. 2020, 7, 2169–2180. [Google Scholar] [CrossRef]
- Yang, B.; Cao, X.; Li, X.; Kroecker, T.; Qian, L. Joint Communication and Computing Optimization for Hierarchical Machine Learning Tasks Distribution. In Proceedings of the 2019 IEEE Symposium on Computers and Communications (ISCC), Barcelona, Spain, 29 June–3 July 2019; pp. 1–6. [Google Scholar] [CrossRef]
- Wu, H.; Zhang, Z.; Guan, C.; Wolter, K.; Xu, M. Collaborate Edge and Cloud Computing With Distributed Deep Learning for Smart City Internet of Things. IEEE Internet Things J. 2020, 7, 8099–8110. [Google Scholar] [CrossRef]
- Wang, X.; Wei, X.; Wang, L. A deep learning based energy-efficient computational offloading method in Internet of vehicles. China Commun. 2019, 16, 81–91. [Google Scholar] [CrossRef]
- Wu, S.; Xia, W.; Cui, W.; Chao, Q.; Lan, Z.; Yan, F.; Shen, L. An Efficient Offloading Algorithm Based on Support Vector Machine for Mobile Edge Computing in Vehicular Networks. In Proceedings of the 2018 10th International Conference on Wireless Communications and Signal Processing (WCSP), Hangzhou, China, 18–20 October 2018; pp. 1–6. [Google Scholar] [CrossRef]
- Zeng, F.; Liu, C.; Tang, J.; Li, W. Deep Learning-Based Task Offloading for Vehicular Edge Computing. In Proceedings of the International Conference on Wireless Algorithms, Systems, and Applications (WASA 2021), Nanjing, China,, 25–27 June 2021; Volume 12939, pp. 291–298. [Google Scholar] [CrossRef]
- Sonmez, C.; Ozgovde, A.; Ersoy, C. EdgeCloudSim: An environment for performance evaluation of Edge Computing systems. In Proceedings of the 2017 Second International Conference on Fog and Mobile Edge Computing (FMEC), Valencia, Spain, 8–11 May 2017; pp. 39–44. [Google Scholar] [CrossRef]
- Liu, B.; Tang, R.; Chen, Y.; Yu, J.; Guo, H.; Zhang, Y. Feature Generation by Convolutional Neural Network for Click-Through Rate Prediction. In Proceedings of the World Wide Web Conference on—WWW ’19, San Francisco, CA, USA, 13–17 May 2019. [Google Scholar] [CrossRef] [Green Version]


| Name | Description | Data type |
|---|---|---|
| TaskLength | Task size | Integer |
| TaskInput | Input data size | Integer |
| TaskOutput | Output data size | Integer |
| WLANUpDelay | WLAN uplink latency | Float |
| WLANDownDelay | WLAN download latency | Float |
| GSMUpDelay | GSM uplink delay | Float |
| GSMDownDelay | GSM download delay | Float |
| WANUpDelay | WAN uplink delay | Float |
| WANDownDelay | WAN download delay | Float |
| AvgEdgeUtilization | Edge server utilization | Float |
| NumoffloadTask | Number of recent uninstalls | Integer |
| VehicleCount | Number of vehicles | Integer |
| Navigation Tasks | Assisted Driving Tasks | Infotainment Tasks | |
|---|---|---|---|
| Specific gravity (%) | 35 | 35 | 30 |
| Interval (s) | 3 | 4 | 40 |
| Upload/download volume (KB) | 20/20 | 40/20 | 20/80 |
| Maximum time delay (s) | 0.5 | 1 | 2 |
| Length of assignment (GI) | 3 | 10 | 5 |
| Parameters | Value |
|---|---|
| WAN network bandwidth | 1000 Mbs |
| WLAN network bandwidth | 100 Mbs |
| CN network bandwidth | 10 Mbs |
| RSU coverage radius | 200 m |
| VEC execution speed | 800 GIPS |
| Cloud execution speed | 3000 GIPS |
| Number of vehicles | 100–2200 |
| Number of simulation rounds | 100 |
Publisher’s Note: MDPI stays neutral with regard to jurisdictional claims in published maps and institutional affiliations. |
© 2022 by the authors. Licensee MDPI, Basel, Switzerland. This article is an open access article distributed under the terms and conditions of the Creative Commons Attribution (CC BY) license (https://creativecommons.org/licenses/by/4.0/).
Share and Cite
Zeng, F.; Tang, J.; Liu, C.; Deng, X.; Li, W. Task-Offloading Strategy Based on Performance Prediction in Vehicular Edge Computing. Mathematics 2022, 10, 1010. https://doi.org/10.3390/math10071010
Zeng F, Tang J, Liu C, Deng X, Li W. Task-Offloading Strategy Based on Performance Prediction in Vehicular Edge Computing. Mathematics. 2022; 10(7):1010. https://doi.org/10.3390/math10071010
Chicago/Turabian StyleZeng, Feng, Jiangjunzhe Tang, Chengsheng Liu, Xiaoheng Deng, and Wenjia Li. 2022. "Task-Offloading Strategy Based on Performance Prediction in Vehicular Edge Computing" Mathematics 10, no. 7: 1010. https://doi.org/10.3390/math10071010
APA StyleZeng, F., Tang, J., Liu, C., Deng, X., & Li, W. (2022). Task-Offloading Strategy Based on Performance Prediction in Vehicular Edge Computing. Mathematics, 10(7), 1010. https://doi.org/10.3390/math10071010