Abstract
Regulated exocytosis enables temporal and spatial control over the secretion of biologically active compounds; however, the mechanism by which Ca2+ modulates different stages of exocytosis is still poorly understood. For an unbiased, top-down proteomic approach, select thiol- reactive reagents were used to investigate this process in release-ready native secretory vesicles. We previously characterized a biphasic effect of these reagents on Ca2+-triggered exocytosis: low doses potentiated Ca2+ sensitivity, whereas high doses inhibited Ca2+ sensitivity and extent of vesicle fusion. Capitalizing on this novel potentiating effect, we have now identified fluorescent thiol- reactive reagents producing the same effects: Lucifer yellow iodoacetamide, monobromobimane, and dibromobimane. Top-down proteomic analyses of fluorescently labeled proteins from total and cholesterol-enriched vesicle membrane fractions using two-dimensional gel electrophoresis coupled with mass spectrometry identified several candidate targets, some of which have been previously linked to the late steps of regulated exocytosis and some of which are novel. Initial validation studies indicate that Rab proteins are involved in the modulation of Ca2+ sensitivity, and thus the efficiency of membrane fusion, which may, in part, be linked to their previously identified upstream roles in vesicle docking.
1. Introduction
Regulated exocytosis is a fundamental process for the release of bioactive molecules from cells. Several discrete stages are involved in the exocytotic pathway, including trafficking of secretory vesicles containing cellular cargo to the appropriate target membrane, tethering and docking for attachment of secretory vesicles to release sites, priming of the vesicles to render them fusion competent, Ca2+ sensing and triggering events to regulate and facilitate fusion of the secretory vesicle and plasma membranes (PM), and thus merger of the two lipid bilayers to form a fusion pore releasing vesicular contents. This involves the coordinated actions of both lipid and protein components of the secretory vesicle membrane, particularly the later steps of Ca2+-triggered exocytosis. There have been recent advances in understanding how the lipid matrix may modulate upstream docking/priming steps [1,2,3,4,5,6,7], regulate the Ca2+ sensitivity and efficiency of fusion [5,6,7,8,9,10,11], and facilitate or impede the merger of biological membranes [1,6,7,9,12,13,14]. However, there remains debate regarding the identity of proteins involved in the Ca2+-sensing and triggering steps that regulate the efficiency of exocytosis.
The molecular mechanisms underlying regulated exocytosis are highly conserved across numerous secretory cell types, including neurons, endocrine and exocrine cells, immune cells and oocytes [15]. The lipid and protein composition of secretory vesicles are, thus, similar across various cell types [16,17,18,19]. Homologues of several proteins involved in membrane trafficking pathways are present in species ranging from unicellular organisms to humans [20,21,22]. Thiol-reactive reagents, such as N- ethylmaleimide (NEM), have historically been shown to inhibit membrane trafficking events, which subsequently led to the discovery of NEM-sensitive factor (NSF) [23], soluble NSF attachment protein (α-SNAP) [24] and SNAP receptors (SNAREs) [25]. Members of the SNARE family (syntaxin, SNAP-25 and VAMP), along with interaction partners, such as Sec1/MUNC (SM) proteins, are proposed to be key players in the late steps of exocytosis [26]. A more recent study also employed NEM to further elucidate the intricate roles of NSF, MUNC-18 and MUNC-13 in regulating SNARE complex assembly during priming and de-priming steps [27]. Among other proteins enriched on secretory vesicles, Rab GTPases and synapotagmins have been implicated in tethering/docking and Ca2+ sensing, respectively [26]. While these secretory vesicle proteins all have critical roles in the exocytotic pathway, the exact nature of their function(s) at each stage remains unknown [28,29,30,31,32].
Isolated secretory vesicles—cortical vesicles (CVs) from sea urchin oocytes—provide a well characterized model for investigating the fundamental molecular machinery involved in regulated exocytosis in native membranes [22,33,34]. Isolated CVs undergo homotypic fusion through the same conserved mechanism underlying CV–PM fusion, indicating that the vesicles contain the minimal essential components for docking/priming, Ca2+-sensing/triggering and membrane merging [35] Interfering with the proper function of native proteins on CVs, through non-selective degradation or chemical modification, enables the dissection of functions in the late steps of exocytosis [30,31,32,35,36,37,38]. As in other model systems, NEM inhibits the Ca2+-sensitivity, rate and extent of CV–PM [37,38] and CV–CV [30,35] fusion, which is independent of NSF [36]. Previously, we characterized a novel effect of thiol reagents—an enhancement of the Ca2+-sensitivity and rate of CV–PM and CV–CV fusion after treatment with iodoacetamide (IA) [39]. Further investigation determined that hydrophobic and hydrophilic reagents had a greater propensity for inhibiting or potentiating Ca2+-triggered membrane fusion, respectively [40] (for structures of thiol-reactive reagents, see Figure S1). This suggested, in agreement with studies using Ca2+ mimetics [30], that multiple proteins work in cooperation to modulate the efficiency of regulated exocytosis.
Here, we employ fluorescent thiol-reactive reagents in an un-biased, top-down proteomic approach to identify proteoforms that modulate the efficiency of Ca2+-triggered exocytosis. These reagents can be used to tightly couple sensitive functional and molecular analyses of native secretory vesicles (i.e., CVs), simultaneously enhancing Ca2+-sensitivity while labeling select components of the membrane proteome. We have previously shown the feasibility of this approach with the fluorescent thiol-reagent, Lucifer yellow iodoacetamide (LYIA) [40]. As thiol-reactive reagents are non-selective, numerous ‘background’ proteins become labeled. Thus, to narrow the list of candidate proteins, multiple fluorescent thiol reagents were characterized for their ability to potentiate fusion. LYIA, along with monobromobimane (mBB) and dibromobimane (dBB), were used as functional tags to identify a common set of proteoforms involved in the Ca2+ sensing steps of regulated membrane fusion. As a well-established top-down approach, labeled proteoforms were analyzed by high- resolution, two-dimensional gel electrophoresis (2DE) followed by mass spectrometric analysis of tryptic spot digests for protein identification (i.e., MALDI-TOF/TOF or LC/MS/MS) [41,42,43,44]. Considering the evidence for lipid microdomain involvement in the exocytotic mechanism [8,9,10,11,45,46], labeled proteoforms from both total CV membrane and cholesterol-enriched CV membrane isolates were resolved by 2DE. Protein spots labeled by all three reagents, and detected in cholesterol- enriched membranes, included several Rab GTPases. Further investigation indicated that Rab proteins may act in multiple steps to modulate the efficiency of exocytosis. Other identified proteoforms will be interesting subjects for further investigation, particularly as some may provide critical links between lipid and protein contributions to the late steps of regulated exocytosis.
2. Materials and Methods
2.1. CV Isolation and Fusion Assays
The isolation of CVs from unfertilized oocytes of Strongylocentrotus purpuratus (Westwind, Victoria, BC, Canada) was performed as previously described [3,6,9,10,11,12,39,40]. For thiol treatments, isolated CVs were suspended in baseline intracellular media (BIM; 210 mM potassium glutamate, 500 mM glycine, 10 mM NaCl, 10 mM Pipes, 0.05 mM CaCl2, 1 mM MgCl2, 1 mM EGTA, pH 6.7) supplemented with 2.5 mM ATP and broad-spectrum protease inhibitors. Stock solutions of fluorescent thiol reagents (Molecular Probes; ThermoFisher Scientific) were made in dimethyl sulfoxide (DMSO) or dimethylformamide (DMF). Treatments were delivered by spiking a small volume of stock solution directly into CV suspensions of optical density (OD) = 1.0–1.1. Final solvent concentrations were ≤1% and showed no effect on fusion parameters. Free-floating CVs were incubated with thiol reagents for 20 min at 25 °C, then centrifuged at 2000× g to wash out excess reagent. Samples were suspended in fresh BIM, then aliquoted for functional and molecular analyses. Aliquots for functional assays were diluted to a working OD = 0.30–0.35. Aliquots for molecular analyses were centrifuged (2000× g) and the pellet stored at −80 °C until further analyses.
For analysis of GTP and Rab GTPase function, isolated CVs were suspended in BIM (pH 6.7) supplemented with protease inhibitor cocktail without ATP. GTP or GTPγS were added to CV suspensions of OD 0.30–0.35 to the final concentrations indicated. The free-floating CV suspensions were allowed to equilibrate for 10 min on ice, then immediately assayed for fusion parameters in the presence of the nucleotide. A RAB peptide, including a portion of the effector binding domain (rab3 GTPase; NP_001116967 a.a. 52-67 (vstvgidfkvktvfrq) [47]), and a scrambled (SC) peptide (vfvdvtkqvsgrftik) were commercially synthesized (Biomatik, Cambridge, ON, Canada). Peptides were added to CV suspensions of OD 0.30–0.35 to the final concentrations indicated and supplemented with 100 µM GTPγS. The free-floating CV suspensions were incubated for 30 min at 25 °C, then immediately assayed for fusion parameters in the presence of the peptide. For thiol pre- treatments, a stock solution of IA (Sigma) in water was delivered to CV suspensions of OD = 1.0–1.1 and incubated for 30 min at 25 °C. To washout excess reagent, CVs were centrifuged at 2000× g and suspended in fresh BIM prior to the addition of GTPγS and peptides.
CV–CV fusion assays were carried out at room temperature using a straightforward light-scattering paradigm, in which the ∆OD observed upon hydration and dispersal of CV contents were used to quantify the extent of fusion [33,35,37]. For standard endpoint and kinetic assays, free-floating vesicles were brought into contact at the bottom of multi-well plates by low speed centrifugation to bypass upstream stages of exocytosis, ensuring optimal inter-membrane contact before the addition of Ca2+ or Sr2+ [3,6,9,10,11,12,30,39]. In some cases, a modified endpoint assay in which vesicles were allowed to settle into contact was also used to assess the capacity of the native vesicular machinery for tethering/docking/priming [3,6,30,39]. Fusion data for both endpoint and kinetic assays were normalized to control conditions, with the ∆OD at the low and high [Ca2+]free plateaus defining 0% and 100% fusion, respectively; Sr2+ data were normalized to control Ca2+ data determined in parallel, as previously described [30,39]. Final [Ca2+]free were measured with a Ca2+ sensitive electrode (World Precision Instruments, Sarasota, FL) and final [Sr2+]free were calculated using MaxChelator (WINMAXC32 v2.50). Endpoint activity curves were fit using a log-normal cumulative function to determine the extent, slope and Ca2+-sensitivity of fusion [48]. Control conditions were fit to a 2-parameter model (with fusion extent set to 100%, by definition) and treatment conditions were fit to a 3-parameter model using TableCurve 2D (v5.0, SYSTAT, Richmond, CA). For each experiment (n), all conditions were tested in technical replicates of 3–6. Data are reported as mean ± SEM; one way ANOVA and Bonferroni post-hoc analyses were carried out to identify significant differences compared to controls.
2.2. Proteome Resolution by 2DE
The isolation of total CV membrane [49] and cholesterol-enriched CV membrane [45] were performed as previously described. In brief, CV pellets were lysed in hypotonic buffer (10 mM PIPES; pH 6.7) supplemented with 5 mM tris(2-carboxyethyl) phosphine (TCEP), 5 mM IA and broad-spectrum protease, kinase and phosphatase inhibitors [49,50]. Membrane fragments were isolated by centrifugation at 120,000× g. Cholesterol-enriched membrane fragments were further fractionated by density centrifugation on sucrose gradients (40%/30%/22%/10% sucrose, 25 mM Tris; pH 7), collected from the 22%/10% interface, washed in 25 mM Tris buffer and then isolated by centrifugation at 120,000× g. Membrane pellets were solubilized in 2DE sample buffer (8 M urea, 2 M thiourea, 4% CHAPS), supplemented with the broad-spectrum protease inhibitor cocktail, and protein concentration was determined using the EZQ Protein Quantitation Kit (ThermoFisher). Membrane proteins were resolved by well-established, optimized 2DE protocols, with slight modifications [2,8,40,50]. In the first dimension, proteins were resolved on immobilized nonlinear pH 3–10 gradients (3–10 NL IPG; Bio-Rad). Prior to loading, samples were reduced with 5 mM TCEP for 1 h, followed by alkylation with 230 mM acrylamide for 1 h at 25 °C. A total of 100 µg or 300 µg protein was loaded onto 7 cm (mini format) or 17 cm (large format) IPG strips, respectively, by passive rehydration for 12–14 h at 25 °C. Isoelectric focusing (IEF) was carried out at 4000 V for a total of 37,500 Vh across 7 cm IPG, or at 10,000 V for a total of 75,000 Vh for 17 cm IPG at 17 °C; voltage was ramped to 250 for 15 min, and then ramped linearly for 2 h at 50 µA/gel. IPG strips were treated in equilibration buffer (6 M urea, 2% SDS (w/v), 20% glycerol (w/v), 375 mM Tris; pH 8.8) supplemented with 5 mM TCEP for 10 min, followed by equilibration buffer supplemented with 350 mM acrylamide for 10 min. The second-dimension resolution was in large format SDS-PAGE gradient gels (10–14% T; 3.6% C) at a constant current of 100 mA. To improve the detection of thiol-labels, proteomes were electro-transferred to 0.2 µm polyvinylidenefluoride (PVDF) membrane (Millipore-Sigma or GE Life Sciences) using modified Towbin buffer at a constant current of 50 mA for 14 h at 4 °C [40]. Parallel samples were resolved for the detection of fluorescent thiol-labelled proteins (excitation/emission: LYIA 450/530, mBB 390/530 and dBB 390/530) on PVDF membranes, and total protein (ex/em: SyproRuby 480/620; Bio-Rad) in SDS-PAGE gels. Images were acquired using the ProXpress Proteomic Imaging System (Perkin-Elmer, Boston MA) and analyzed with Delta2D (Decodon, Greifswald, Germany). Following spot matching and warping, gel images for each experimental group were merged pixel-by-pixel, yielding an average proteome map.
2.3. Mass Spectrometry
For mass spectrometric analyses, spots of interest were excised from 2DE gels by visualization under a UV light source. Proteins underwent in-gel digestion, as previously described [51,52]. Briefly, gel pieces were dried in a vacuum centrifuge and then incubated with 200 ng of modified trypsin (Promega, Madison, WI) in 100 mM ammonium bicarbonate overnight at 37 °C. The peptides were extracted from the gel pieces using 5% formic acid: acetonitrile (1:1, v/v) followed by a second extraction with 5% formic acid: acetonitrile (5:95, v/v). The peptide extracts were vacuum-dried, solubilized in 0.1% trifluoroacetic acid (TFA) and cleaned using C18 ZipTips (Millipore, Billerica, MA). The resulting peptides were analyzed by MALDI-TOF/TOF using an ABI 4800 Proteomics Analyzer (Applied Biosystems, Foster City, CA) and/or by LC-ESI/MS/MS using an LCQ DECA ion trap mass spectrometer (ThermoFisher, Waltham, MA).
MS and MS/MS spectra from both the MALDI and LC-ESI measurements were then analyzed. Both b and y ion series were used to match to protein sequences present in the “other metazoa” subset (5,474,206 sequences) of NCBIprot database (29 April 2018) using the Mascot v 2.2 (Matrix Science, Boston, MA) search program. Parameters for the database search with Mascot MS/MS Ions Search software were set as follows: enzyme, trypsin; one missed tryptic cleavage site permitted; fixed modification, carbamidomethylation of cysteine; variable modification, methionine oxidation. For MALDI TOF-TOF data, mass tolerance for precursor ions was set at ±0.15 Da and mass tolerance for fragment ions ±0.06 Da. The instrument was mass calibrated by the plate model method using ABI peptide standards applied to the calibration wells; mass calibration was verified using the masses of trypsin autolysis peptides in each sample or from spectra of known peptide standards spotted in nearby wells to the sample spots. For LC/ESI ion trap data, precursor ion ±1.2 Da and fragment ion ±0.6 Da were used. The cut-off for peptide identification was set at greater than 95.0% probability and protein identification at greater than 99.0% probability. Protein identifications based on a minimum of 2 fragmented peptides are reported.
3. Results
3.1. Fluorescent Thiol-Reactive Reagents Modulate the Ca2+ Sensitivity and Rate of Membrane fusion
Ca2+ activity curves for homotypic CV–CV fusion (n = 24) yielded a typical sigmodal shape [48] with an EC50 of 16.3 ± 1.3 µM [Ca2+]free (Figure 1A). The thiol reagents used have a biphasic effect, with low concentrations potentiating fusion parameters and high concentrations inhibiting all parameters of Ca2+-triggered membrane fusion [39,40]. Three fluorescent thiol reagents were found to enhance the efficiency of fusion at low concentrations with short incubation times. Treatment of CV with 750 µM LYIA (n = 8), 2 mM mBB (n = 7) and 500 µM dBB (n = 9) for 20 min resulted in leftward shifts in Ca2+ sensitivity to respective EC50’s of 10.8 ± 1.4 µM, 10.9 ± 0.7 µM and 7.8 ± 1.0 µM [Ca2+]free (Figure 1A). An enhancement of late kinetics in response to low [Ca2+]free = 24.3 ± 2.2 µM was also observed with 750 µM LYIA (n = 7), 2 mM mBB (n = 6) and 500 µM dBB (n = 8) treatments (Figure 1A, inset). To further elucidate the involvement of thiol sites in modulating the Ca2+ sensitivity of triggered exocytosis, a weak Ca2+ mimetic was used [30,39]. The resulting Sr2+ activity curves had a similar sigmodal shape to the Ca2+ activity curves; however, Sr2+ is much less efficient at triggering CV–CV fusion, requiring 100-fold higher concentrations. Thus, Sr2+ activity curves from untreated CV (n = 12) had an EC50 of 2600.6 ± 374.8 µM [Sr2+]free (Figure 1B). Treatment of CV with 750 µM LYIA (n = 7), 2 mM mBB (n = 6) and 500 µM dBB (n = 7) for 20 min resulted in leftward shifts in Sr2+ sensitivity to EC50’s of 1222.2 ± 334.3 µM, 1148.7 ± 89.4 µM and 1072.8 ± 159.8 µM [Sr2+]free, respectively (Figure 1B). There was also an enhancement of initial kinetics with 750 µM LYIA treatment (n = 4), and late kinetics with 2 mM mBB (n = 4) and 500 µM dBB (n = 6) treatments, in response to low [Sr2+]free = 3110 µM (Figure 1B, inset). The potentiation of the Ca2+-sensitivity of CV–CV fusion was observed for these fluorescent thiol reagents across treatments in the high micromolar to low millimolar range (Figure 1C,D), while higher treatment concentrations resulted in the inhibition of the Ca2+-sensitivity and extent of fusion (Figure S2).
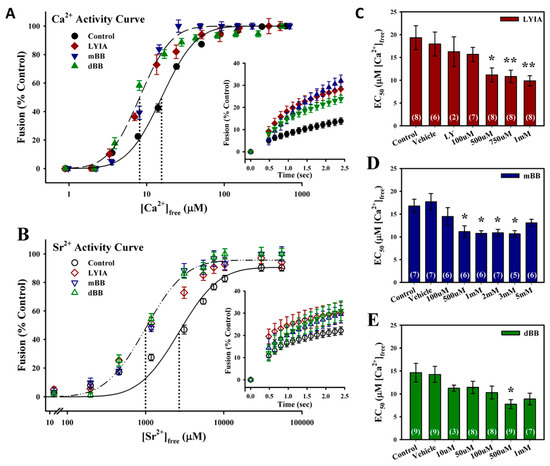
Figure 1.
Promotion of the Ca2+-triggered steps of exocytosis with fluorescent thiol reagents. (A) Ca2+ activity curves (n = 7–9) for cortical vesicle (CV)–CV fusion after 20 min treatment with 750 µM LYIA, 2 mM mBB or 500 µM dBB. Fusion kinetics in response to 24.3 ± 2.2 µM [Ca2+]free (inset; n = 6–8). (B) Sr2+ activity curves (n = 6 or 7) for CV–CV fusion after 20 min treatment with 750 µM LYIA, 2 mM mBB or 500 µM dBB. Fusion kinetics in response to 3110 µM [Sr2+]free (inset; n = 5 or 6). (C–E) Summary of concentration-dependent effects of LYIA (C), mBB (D) and dBB (E) on the Ca2+-sensitivity of CV–CV fusion. Data presented as mean ± SEM; statistical analysis by one-way ANOVA with Bonferroni multiple comparison test versus control (* p< 0.05, ** p< 0.01, *** p < 0.001).
3.2. Identification of Fluorescently Labeled Candidate Proteoforms
To focus on proteoforms potentially involved in regulating the efficiency of Ca2+-triggered membrane fusion, CVs were exposed to thiol treatments and then subjected to molecular analyses to identify fluorescently labeled species. Proteoforms from both total and cholesterol-enriched CV membrane isolates were resolved by 2DE. The total CV membrane proteome resolved on mini-format 7 cm IPG strips revealed eight regions of interest having spots that were labeled by all three reagents with 100% reproducibility across all trials (n = 4 individual experiments per thiol reagent) (Figure 2 and Figure 3). In addition, a number of labeled spots were present in the low molecular weight peptide front were labeled (Figure 2; open arrow head). Strong labeling was also observed across several high abundance, high molecular weight streaks (Figure 2; open and closed arrows), which correspond to similar spot patterns in CV content proteomes (Figure S3). To better resolve labeled proteoforms for identification, equal amounts of remaining samples for each fluorescent thiol regent (ie., 75 µg protein) were pooled and resolved on large-format 17 cm IPG strips in the first dimension (n = 2 replicates per thiol reagent). In the eight boxed regions on the resulting 2D gels, a total of thirty-seven protein spots were observed that were labeled with LYIA, mBB and dBB (Figure 3). These spots were excised and analyzed by MALDI-TOF/TOF (Table 1).
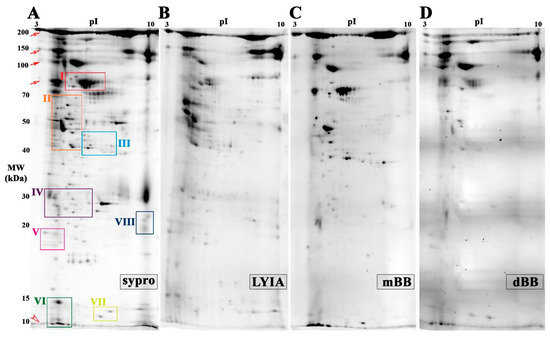
Figure 2.
Total membrane proteome of CV treated with fluorescent thiol reagents. (A) Average two-dimensional gel electrophoresis (2DE) gel image of total membrane proteome from untreated CV resolved by mini 3–10 NL IPG and large 10%–14% SDS-PAGE format, stained for total protein with Sypro Ruby (n = 10). The average PVDF blot images (n = 4) scanned for LYIA (B), mBB (C) and dBB (D); addition of negatively charged LYIA shifts pIs of proteoforms relative to other labels. Open and closed arrows indicate background labeling of CV proteins that are normally released to form the fertilization envelope. Open arrow head indicates low abundance, poorly resolved peptides co-migrating at the gel front. Boxed regions of interest contain spots labeled by all three fluorescent reagents are shown in greater detail in Figure 3.
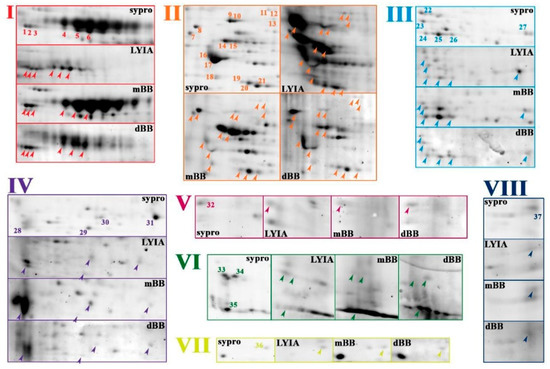
Figure 3.
Fluorescent thiol-labeled spots excised from total membrane proteome.To improve resolution of protein spots, pooled CV membrane protein samples for each condition were resolved in duplicate by large format 2DE (i.e., 17 cm 3–10 NL IPG and large 10%–14% SDS-PAGE). A montage of boxed regions of interest indicated in Figure 2 is shown from representative gel image of untreated CV stained for total protein (Sypro ruby) and representative PVDF blot images for LYIA, mBB and dBB; addition of negatively charged LYIA shifts pIs of proteoforms relative to other labels. Protein spots reproducibly labeled with LYIA, mBB and dBB in both mini and large formats, as indicated by numbers in total protein images and arrowheads in thiol-labelled images, were excised for identification. The contrast level on each panel has been adjusted to visualize low-abundance-labeled spots; for full blot images refer to Figure 2.

Table 1.
Thiol-labelled protein spots identified from total and cholesterol-enriched CV membrane proteomes.
To further narrow the number of candidate proteoforms of interest, the isolation of cholesterol- enriched membrane fragments was used as a prefractionation tool. Cholesterol- and sphingomyelin-enriched domains regulate the efficiency of exocytosis by organizing critical components near the fusion site [8,9,10,11,45,46]. To this end, cholesterol was used as ‘bait’ to enrich proteoforms involved in regulated exocytosis, both to reduce the complexity of the proteome and improve the detection of low abundance labeled proteoforms [40,45]. The cholesterol-enriched CV membrane proteome (Figure 4; Figure S4) contained nineteen spots that corresponded to similar pI-and-MW as labeled spots from total CV membrane (Figure 3). Selective enrichment of certain proteoforms occurred in the cholesterol-enriched membrane proteome (Figure S5). For example, there was an apparent decrease in high molecular weight streaking (Figure 4A; open and closed arrows) whereas there was an apparent increase in the peptides that co-migrate at the gel front (Figure 4A; open arrow head). In Box V, one spot (#32) was reproducibly detected with total protein stain Sypro Ruby in the CV membrane proteome (Figure 2 and Figure 3), while several spots (#32a–e) were reproducibly detected in the cholesterol-enriched CV membrane proteome (Figure 4). In box II, there were two areas that appeared to have altered patterns of labeled spots (#8 and #15) compared to the total CV membrane proteome (Figure 2 and Figure 3). Of these, a total of thirteen spots were observed to be labeled by all three reagents with 100% reproducibility across all trials (n = 3 individual experiments per thiol reagent) (Figure 4B; labeled in bold). These spots were excised and analyzed by MALDI-TOF/TOF and/or LC-MS/MS (Table 1).
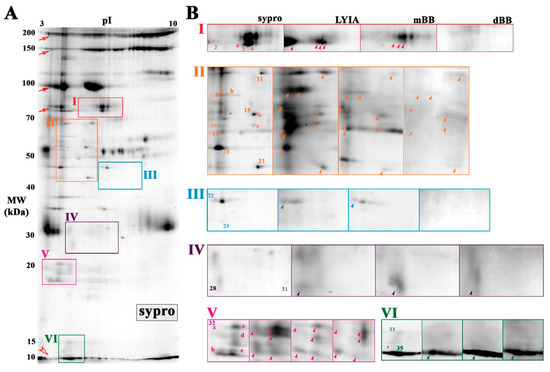
Figure 4.
Cholesterol-enriched membrane proteome of CV treated with fluorescent thiol reagents. (A) Average 2DE gel image of cholesterol-enriched membrane proteome from untreated CV resolved on mini 3-10 NL IPG and large 10%–14% SDS-PAGE, stained with Sypro Ruby (n = 6). Boxed regions correspond to the same regions of interest shown for total membrane proteome. (B) A montage of boxed regions is shown from average gel image of untreated CV stained for total protein (Sypro ruby; n = 6) and average PVDF blot images (n = 3) scanned for LYIA, mBB and dBB. Protein spots corresponding to labeled proteins from the total membrane proteome are numbered accordingly. Open and closed arrows indicate background labeling of CV content proteins that are normally released to form the fertilization envelope. An open arrow head indicates labeled peptides co-migrating at the dye front. Protein spots reproducibly labeled with LYIA, mBB and dBB, as indicated by bold numbers in the total protein image and arrowheads in thiol-labelled images, were excised for identification. The contrast level on each panel has been adjusted to visualize low-abundance-labeled spots; for full blot images refer to Figure S4.
Mascot searches of the NCBIprot database resulted in the identification of the highest abundance protein species in thirty of the thirty-seven spots from the total CV membrane proteome, yielding up to a total of twenty-seven unique proteins that were reproducibly labeled. Many of these were also identified from corresponding spots (i.e., comparable pIs and MWs) in the cholesterol-enriched membrane proteomes, plus an additional eleven spots identified from the latter. All proteoforms identified (Table 1) contain at least one cysteine residue which may be modified; however, it may be the case that labeled and un-labeled proteoforms co-migrated. The proteoforms identified can be divided into seven broad canonical categories based on known biological function: metabolic processes, protein biosynthesis and folding, signal transduction, ion transport, cytoskeletal organization, vesicular transport and uncharacterized. Several gel plugs taken from the low molecular weight peptide front (Figure 2 and Figure 4; open arrowhead) did not yield protein identifications. A majority of the thiol-labeled proteoforms identified have defined functions in cellular metabolism, and these were initially considered to be less likely as candidates that may potentially modulate the Ca2+-sensitivity of regulated exocytosis. Among the most likely candidates were cytoskeletal proteins and Rab GTPases, which have both previously been implicated in vesicular trafficking. Several Rab GTPases were not only consistently labeled by all three fluorescent thiol reagents, but were also isolated in the cholesterol-enriched membrane proteome. We, therefore, chose to test these low MW G-proteins in a series of validation trials using the well-established CV–CV fusion assays.
3.3. Rab-GTPases Modulate the Efficiency of Exocytosis
Synergistic effects between Ca2+ and GTP have been observed in different models of regulated secretion. While the only requirement for CV–CV fusion is an increase in [Ca2+]free [53], GTP may modulate the efficiency of exocytosis. To explore this possibility, BIM media (without ATP) was supplemented with GTP or GTPγs immediately prior to fusion assays. While low concentrations had no effect on fusion, high concentrations of the nucleotide decreased the Ca2+ sensitivity and rate of CV–CV fusion (Figure 5A). Treatment with 10 mM GTP resulted in a rightward shift in EC50 from 37.1 ± 4.4 µm [Ca2+]free under control conditions to 78.6 ± 13.3 µm [Ca2+]free (n = 6; p ≤ 0.01). Initial fusion kinetics were also inhibited in response to 33.7 ± 2.7 µm [Ca2+]free (n = 3; p ≤ 0.05), but not at higher [Ca2+]free. The addition of a nonhydrolyzable analogue GTPγS did not reduce the concentration of nucleotide required to inhibit fusion (n = 4) (Figure 5B). Furthermore, lengthening the incubation time to 30 min at 25 °C with GTP or GTPγS did not increase the potency of inhibition (data not shown).
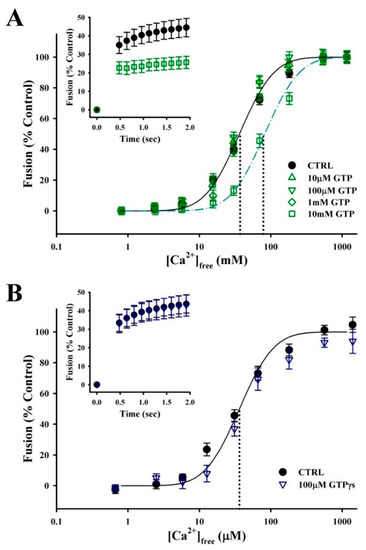
Figure 5.
GTP has minimal impact on the efficiency of Ca2+-triggered exocytosis. (A) Ca2+ activity curves for standard CV–CV fusion assays supplemented with GTP (n = 5–6) and fusion kinetics in response to 33.7 ± 2.7 µM [Ca2+]free (inset; n = 3). (B) Ca2+ activity curves for standard CV–CV fusion assay supplemented with GTPγS (n = 4) and fusion kinetics in response to 33.7 ± 2.7 µM [Ca2+]free (inset; n = 3).
To directly investigate the role of Rab-GTPases in modulating the late steps of Ca2+-triggered exocytosis, an exogenous RAB3 effector domain peptide was used [47]; this peptide contains the G2- box/Rab Family 1 motif which shares 50%–67% identity (67%–100% similarity) with the S. purpuratus Rab GTPases identified (Table 2). The addition of the RAB effector binding domain, in the presence of GTPγS, resulted in a concentration-dependent inhibition of CV–CV fusion (Figure 6A). Treatment with 200 µg/mL RAB peptide for 30 min decreased the extent of fusion to 54.0 ± 9.1% (n = 6; p ≤ 0.001), but no effect on Ca2+ sensitivity was observed (control EC50 = 32.1 ± 2.4 µm; 200 µg/mL RAB EC50 = 36.6 ± 2.3 µm). The initial fusion kinetics were also inhibited in response to 41.8 ± 3.5 µm [Ca2+]free (n = 6; p ≤ 0.05). To determine whether the effect of the RAB peptide was, in part, due to modulation of vesicle priming/docking, a modified fusion assay in which CVs were allowed to settle into contact was also carried out (Figure 6B) [3,6,30,39]. In the settle assay, treatment with 200 µg/mL RAB peptide for 30 min decreased the extent of CV–CV fusion to 37.0% ± 11.7% (n = 2; p ≤ 0.05). As with the standard fusion assay, there was no effect on Ca2+ sensitivity (Control EC50 = 40.7 ± 13.7 µm; 200 µg/mL RAB EC50 = 39.4 ± 10.8 µm). The addition of 200 µg/mL scrambled peptide had no effect on the Ca2+ sensitivity, kinetics or extent of fusion in either the standard or settle assays.
Table 2.
Conserved sequence of RAB peptide effector domain.
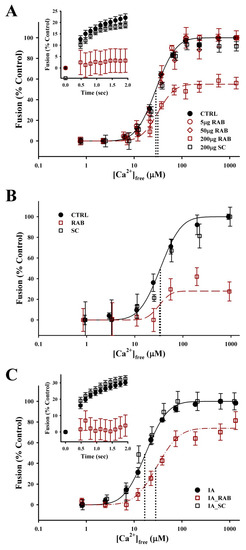
Figure 6.
Rab-GTPase modulates the efficiency of Ca2+-triggered exocytosis. (A) Ca2+ activity curves for the standard CV–CV fusion assay supplemented with 100 µM GTPγS (CTRL; n = 11), plus the addition of 5 µg/mL RAB (n = 5), 50 µg/mL RAB (n = 5), and 200 µg/mL RAB (n = 6) or 200 µg/mL scrambled (SC; n = 4) peptide for 30 min. Fusion kinetics (inset; n = 4–9) in response to 41.8 ± 3.5 µM [Ca2+]free shown for CTRL, 200 µg/mL RAB and 200 µg/mL SC peptide. (B) Ca2+ activity curves for the modified settle assay supplemented with 100 µM GTPγS (CTRL; n = 3), plus the addition of 200 µg/mL RAB (n = 2) or 200 µg/mL SC (n = 2) peptide for 30 min. (C) Ca2+ activity curves for standard CV–CV fusion assay pre-treated with 20 mM IA for 20 min. IA treatment was followed by a second incubation in fresh BIM supplemented with 100 µM GTPγS (IA control; n = 5), plus the addition of 200 µg/mL RAB (n = 5) or 200 µg/mL SC (n = 3) peptide for 30 min. Fusion kinetics (inset; n = 3–4) in response to 45.4 ± 6.2 µM [Ca2+]free are shown.
While no effect on Ca2+-sensitivity was observed with the addition of RAB peptide alone, we tested for an interaction between thiol treatment and Rab GTPase function. CVs were pretreated with 20 mM IA for 20 min which resulted in a typical leftward shift in EC50 (Figure 6C). Following the washout with IA, CVs were treated with 200 µg/mL of the RAB effector domain peptide or 200 µg/mL of the scrambled peptide, in the presence of GTPγS, for 30 min. Treatment with the RAB peptide shifted the EC50 rightward back toward that of naïve, untreated CV (IA EC50 = 16.7 ± 2.6 µm versus IA_ RAB EC50 = 28.2 ± 5.3 µm; n = 5; p = 0.0865). The extent of fusion in CV pretreated with IA followed by treatment with RAB peptide was 74.6% ± 19.2%. Initial fusion kinetics were also inhibited in response to 48.5 ± 6.6 µm [Ca2+]free (n = 4; p ≤ 0.05). The Ca2+ sensitivity, kinetics or extent of fusion in CV pretreated with IA followed by treatment with scrambled peptide did not differ from the IA pretreatment condition.
4. Discussion
Thiol-reactive agents are powerful tools in an unbiased approach to investigating proteoform functions in regulated exocytosis [35,37,38,39,40,45]. However, as these reagents are also non-selective, promiscuously labeling free sulfhydryl groups on multiple proteins, several strategies were taken to reduce the complexity of the labeled proteome. First, isolation of native secretory vesicles from urchin oocytes provided a stage-specific preparation for studying the late steps of Ca2+-triggered exocytosis. Second, several fluorescent thiol reagents that potentiate the Ca2+ sensitivity and kinetics of CV–CV fusion were characterized and employed as ‘functional’ tags to label CV membrane proteoforms involved. Third, prefractionation of total CV membrane or cholesterol-enriched CV membrane, followed by high-resolution 2DE, was carried out to target downstream mass spectrometric analyses on the identification of reproducibly labeled, secretory vesicle membrane proteoforms. This rigorous approach using a top-down proteomic methodology identified several viable proteoform candidates, and validation studies suggest multiple roles for Rab-GTPases in modulating the efficiency of exocytosis.
The urchin CV model system provides an in vitro preparation of native secretory vesicles amenable to tightly coupled functional and molecular analyses [22,33,34]. CVs and other secretory vesicles have similar lipid compositions [9,16,17] and contain homologues of the major membrane trafficking proteins [18,30,31,32]. Isolated CVs retain all the critical cellular components to support fast, Ca2+-triggered exocytosis [33,35]. Furthermore, unlike other types of secretory vesicles, isolated CVs remain primed and fusion competent, requiring only an increase in [Ca2+]free to trigger membrane fusion [35,53]. With ~15,000 CVs per oocyte [33], ample material can be obtained for both functional and proteomic analysis from a single preparation. The removal of other cellular components, including the cytosol and PM, minimizes ‘background’ proteins in the proteome, enabling targeted studies on the molecular mechanisms underlying regulated exocytosis.
Thiol-reactive reagents have a biphasic effect on the Ca2+-triggering steps of exocytosis [39,40]. Many of these reagents (i.e., NEM) inhibit CV fusion at low millimolar concentrations [30,35,36,37,38,39,40]; on the other hand, IA potentiates at low millimolar concentrations and inhibits at high millimolar concentrations [39]. The ability of thiol reagents to potentiate or inhibit the Ca2+-triggering steps of exocytosis appears to be dependent of their hydrophobicity (Figure S1). Addition of a fluorescein tag (IAF) results in more potent inhibition, whereas a lucifer yellow tag (LYIA) with charged sulfate groups retains the ability to enhance Ca2+ sensitivity [39,40]. Given that bromobimanes have similar molecular structures to iodoacetamides, both in terms of the thiol-reactive halogen moieties and the polar nature of the oxygen and iodide/bromide groups, it was likely that they would exhibit similar effects. Treatment with these fluorescent thiol reagents resulted in average leftward shifts in Ca2+ sensitivity in the range of 5–10 µM [Ca2+]free ― LYIA ∆pCa = −0.25 ± 0.05, mBB ∆pCa = −0.18 ± 0.06 and dBB ∆pCa = −0.27 ± 0.04 ― which is of comparable magnitude to the previously observed effects of IA (∆pCa = −0.27 ± 0.06 [39]). Furthermore, these reagents had an even more profound effect on Sr2+-triggered fusion, resulting in average leftward shifts in Sr2+ sensitivity in the range of 1–2 mM ― LYIA ∆pMe = −0.40 ± 0.8, mBB ∆pMe = −0.38 ± 0.10 and dBB ∆pMe = −0.40 ± 0.05. It has been suggested that Ca2+ mimetics, such as Sr2+, retain the ability to trigger membrane fusion, but have a lower affinity for those Me2+ binding sites that regulate the efficiency exocytosis [30,39]. The data suggest that all three of these fluorescent reagents act on common thiol sites not directly involved in the membrane fusion mechanism per se, but that modulate the Ca2+ sensitivity of the late steps of exocytosis.
These fluorescent thiol-reactive reagents enhance the Ca2+ sensitivity and kinetics of exocytosis and concomitantly labeled candidate CV membrane proteoforms, mediating these functional effects. In total, thirty-eight proteoforms were identified from fluorescently labeled spots in 2DE gels: twenty-one from the total CV membrane proteome, eleven from the cholesterol-enriched CV membrane proteome, and six from both proteomes. Numerous high abundance, high molecular weight proteins were found to correspond to CV and/or yolk granule content proteins (e.g., apolipoprotein, rendezvin, major yolk protein and vitellogenin; data not shown). This was not entirely unexpected, as these vesicles contain many glycoproteins that undergo extensive crosslinking to form the fertilization envelope [54,55], which would retain strong interactions with the CV membrane during isolation. Although we were able to identify co-resolving proteoforms (e.g., long-chain-fatty-acid- CoA ligase 1), the presence of these high abundance content proteins may well have interfered to some extent with the identification of lower abundance CV membrane proteoforms. The optimizations of 2DE workflows to improve in the resolution and detection of low abundance CV membrane proteoforms, including the prefractionation of membrane isolates, transfer of proteins to PVDF membrane to improve signal from fluorescent labels, separation on large format IPG strips, third dimension separations and pooling of spots from replicate gels, were thus employed. Despite these efforts, seven of the labeled spots, as well as numerous areas of the peptide front, yielded no significant database matches. Although the genome of S. purpuratus has been sequenced [56], there is still limited annotation and under-representation of the entire proteome. Many of the proteoforms identified are predicted based on genome sequences, and therefore have little experimental evidence at the protein (i.e., amino acid sequence) level so far.
Of the labeled proteoforms identified, approximately half were associated with the endomembrane system (~55%) and half were metabolic enzymes (~47%) that are typically associated with mitochondria (i.e., canonical protein association), with a small amount of overlap (~10%). This raises the question of whether other organelles (or fragments of these organelles) co-purify or whether these metabolic enzymes are actually located on (or within) secretory vesicles; the purity of these well-established CV preparations at the level of electron microscopy [54] suggest the latter. Indeed, resident mitochondrial and endoplasmic reticulum (ER) proteins are commonly identified in other purified secretory vesicle preparations [16,19]. While a minimal amount of contamination from other organelles would be expected, the abundance of these metabolic enzymes seems more indicative of a local function on secretory vesicles. A recent large-scale proteomic study of human cell lines revealed that over 50% of proteins map to more than one subcellular location [57]; thus, the use of top-down analytical approaches, such as high-resolution 2DE, to resolve and identify proteoforms, is critical to genuinely understand molecular mechanisms and cellular processes [41,58,59]. The distribution of protein species across compartments in the endomembrane system would be a predictable consequence of transport vesicles budding from one site and being delivered to another. This would certainly be the case with Rab-GTPases, which play an important role in targeting and tethering vesicles from one compartment to the next [60]. For instance, during oocyte maturation, CVs are produced by the fusion of smaller transport vesicles, and then move to their docking/fusion sites at the PM. Other known vesicular membrane proteins identified were two subunits of the V-type ATPase involved in proton transport and two CV proteins (18 kDa and 34 kDa) for which functions are largely uncharacterized. In addition, cytoskeletal proteoforms were also identified.
Two major cytoskeletal components, actin and tubulin, were both found to be labeled. The cytoskeleton is important for vesicle mobilization and transport [61,62,63,64,65], but additional roles in later stages of regulated secretion have also been proposed. A dense cortical actin network is closely associated with release sites in secretory cells [62], and both actin and tubulin are isolated with the membranes of secretory vesicles [16,19,49]. Pharmacological disruption of actin filaments has been shown to enhance the efficiency of exocytosis, suggesting that the cytoskeleton acts as a barrier to secretion [66], which is supported by imaging of actin remodeling at vesicular release sites [61,67,68]. This is consistent with experiments using the CV model in which pharmacological treatments with actin or tubulin stabilizing and destabilizing reagents, or the addition of exogenous cytoskeletal components, do not alter the Ca2+-sensitivity, kinetics or extent of fusion [49] (Figure S6). These data indicate that actin and tubulin act at upstream stages of exocytosis (which, fully-docked and release-ready CV have already passed through), and are not minimally essential to the fundamental Ca2+-triggering and membrane merger steps. The cystoskeleton may, nonetheless, modulate these late steps of exocytosis in intact cells by either organizing critical membrane components at release sites and/or exerting tension to facilitate fusion pore expansion [62,63], but, as previously demonstrated with CV, are not essential to the Ca2+-triggered membrane fusion mechanism per se [49].
The largest number of thiol-labeled CV membrane proteoforms belong to the Rab family of GTPases, which have well-characterized roles in vesicular trafficking [60,69,70,71]. Rab proteins associate with cholesterol-enriched membrane domains through their prenylation anchors [72]. Rabs cycle between membrane-associated and cytosolic distributions in their GTP and GDP-bound states which are regulated by nucleotide exchange factors (GEFs) and GTPase activating proteins (GAPs), respectively. When Rabs are delivered to the membrane by GDP-dissociation inhibitors (GDIs), GDIs are removed by GDI-displacement factors (GDFs) and subsequently GDP is converted to GTP by GEFs. In the active GTP-bound form, Rabs recruit effector proteins, including a myriad of sorting adaptors, tethering factors, motor proteins, kinases, phosphatases, Ca2+/phospholipid binding proteins and other GEFs/GAPs [69,70,71]. Thus, it is postulated that a cascade of Rab- dependent interactions coordinate the translocation of vesicles throughout the cell [60]. Different Rab GTPases localize to select ‘Rab’ domains on distinct intracellular organelles, providing a level of specificity for targeting and tethering transport vesicles to various cellular compartments [69]. Yet, the number of Rab GTPases associated with membranes of isolated CVs (at least eight Rabs—Rab1, Rab2, Rab5, Rab7, Rab11, Rab13, Rab33 – Rab3 [47]), insulin granules (14 Rabs [73]) and synaptic vesicles (>20 Rabs [16,74]) is indicative of overlapping localization, if not also a redundancy in function. Furthermore, a single Rab GTPase may regulate the function of several effector proteins, and in turn, a single effector protein may be regulated by multiple Rabs [69,70].
To this end, we further explored the role of Rab GTPases in regulated exocytosis in the urchin CV model. An exogenous RAB peptide, containing the effector domain of Rab3 [47], was found to inhibit CV–CV fusion. This Rab family 1 motif is largely conserved (>50%) among the Rab GTPases and across different species (Table 2), and this effector domain peptide has been previously shown to interfere with the formation of the fertilization envelope in urchin oocytes [47]. An addition of exogenous RAB peptide inhibited the extent of fusion by ~63% in the modified settle assay, compared to ~46% in the standard assay; this strongly indicates an effect on upstream stages of CV tethering/docking/priming [1,2,3,6,8,30,39]. With the addition of the RAB effector domain, there was no effect on Ca2+-sensitivity; however, after pretreatment with IA, treatment with the RAB peptide resulted in a decrease in Ca2+-sensitivity, mitigating the potentiation effect of IA. Previously, we postulated that thiol reagents may enhance the Ca2+-sensing steps of regulated secretion by either directly acting on a Ca2+-binding protein or by acting on an accessory protein that interacts with the Ca2+-binding protein and/or other components of the exocytic machinery [39]. In this scenario, we speculate that Rab GTPases may continue to interact with proteins at vesicular release sites subsequent to the completion of tethering and docking. Treatment with thiol reagents would block this interaction, releasing the Rab effector and allowing the later steps of Ca2+-triggered membrane fusion to proceed unhindered. This would be consistent with observations that an increase in [Ca2+]free can partially overcome the inhibition of fertilization envelope formation by exogenous RAB peptide in intact oocytes [47]. Furthermore, the data are consistent with evidence that Rab3 acts through a negative, clamp-like mechanism to regulate the late steps of exocytosis in neuronal [75] and neuroendocrine [76,77] cells.
These data highlight the dual role of specific proteoforms in exocytosis, acting as both positive and negative modulators of regulated secretion, depending on the steps of the pathway being investigated. Several Rab GTPases are associated with secretory vesicles: Rab1, Rab2, Rab3, Rab4, Rab5, Rab7, Rab10, Rab11, Rab14 and Rab27 all co-purify (i.e., enrichment) during the isolation of synaptic vesicles [74], and we have found several of these to be thiol-labeled in the CV membrane proteome. Rab3 and Rab 27 have gained the most interest in Ca2+-triggered exocytosis [70]; however, Rab11 and Rab4 have been shown to regulate Ca2+-dependent secretion in (neuro)endocrine cells [78,79] and platelets [80], respectively. While Rab proteins have critical upstream roles in vesicle targeting, tethering and docking [60,69,70,71], they also appear to have modulatory effects on the efficiency of exocytosis, even the fusion of fully release-ready vesicles. Rabs have been shown to modulate SNARE function, both through interactions with SM proteins [81,82,83] and via their other effectors [84,85,86,87,88]. This suggests that disassociation of the Rab/effector complex from the SNARE complex is required for vesicles to reach a fully docked and primed state [88]. Additionally, many Rab effectors, such as Rabphilin and synaptotagmin-like proteins (Slp1-5), contain C2A/C2B domains capable of binding Ca2+ and phospholipids [70] which may mediate any additional SNARE-independent modulation of exocytosis. Rab effectors have also been shown to regulate phosphoinositide conversion [89,90], which has been previously shown to modulate the efficiency of CV–CV fusion, possibly by regulating late priming steps [6,7]. Further elucidation of the function of each Rab GTPase, and their selective or non-selective effectors, will shed additional light on the regulatory mechanisms of the late steps of regulated exocytosis. The ability of Rabs, and other upstream exocytotic proteins, to modulate the efficiency of Ca2+-triggered membrane fusion increases the complexity of control over this tightly regulated process, allowing for graded responses to different external stimuli.
This does not preclude other thiol-labeled proteoforms from also contributing to efficiency of regulated exocytosis. The presence of several metabolic enzymes on secretory vesicles suggests local regulatory mechanisms to ensure optimal lipid and protein function. Along with cholesterol- and sphingomyelin-enriched membrane domains [8,9,10,11,45,46], other lipid species, such as phosphoinositides, participate in the organization of the exocytotic machinery at release sites [4]. The generation of phospholipid metabolites from phospholipase D [3] and phospholipase A [2] can also modulate the efficiency of exocytosis via roles in upstream stages, such as docking/priming. Here, we have identified two labeled enzymes involved in lipid metabolism, long-chain-fatty-acid-CoA ligase 1 and long-chain specific acyl-CoA dehydrogenase, which may have roles in regulating local fatty acid metabolism in secretory vesicles. Long chain acyl-CoA has been shown to enhance secretion in pancreatic beta-cells, perhaps through direct interaction with exocytotic proteins [91]. Furthermore, several proteoforms with chaperone functions were labeled, including calreticulin, calcistorin, disulfide-isomerase 2-like, protein disulfide-isomerase A3, 60 kDa heat shock protein and elongation factor Tu. While some may be involved in packaging of content into CV (ie., calreticulin), others may interact with proteins involved in exocytosis. Numerous protein chaperones operate in nerve terminals to maintain the proper conformation and function of proteins at different steps of the exocytotic pathway [92,93,94]. These thiol-labeled proteoforms, along with uncharacterized or unidentified proteins from our study, warrant further investigation. As our understanding of the molecular mechanisms underlying different steps of Ca2+-triggered exocytosis evolves, it becomes increasingly apparent that the coordinated action of a multitude of proteins and lipids are required for fast, efficient cellular secretion, and that many aspects of exocytotic pathway are very highly conserved.
5. Conclusions
In this study, we have taken a top-down proteomic approach to studying the molecular mechanisms underlying the late steps of Ca2+-triggered exocytosis. Thiol-reactive reagents were employed as functional tags to label candidate proteoforms that regulated the Ca2+-sensitivity and the kinetics of secretory vesicle (i.e., CV) fusion. A targeted experimental paradigm, including subcellular fractionation and optimized 2DE resolution of labeled proteoforms, yielded a targeted list of proteins for further investigation. While a majority evidence suggests Rab GTPases have roles upstream in tethering/docking, the data here are unique in also indicating a role in later steps that modulate Ca2+-sensitivity. Furthermore, several other labeled proteoforms may have additional roles that ensure optimal function of the exocytotic machinery (both proteins and lipids) in regulated secretion.
Supplementary Materials
The following are available online at https://www.mdpi.com/2227-7382/7/4/34/s1, Figure S1: Chemical structures of common thiol-reactive reagents; Figure S2: Inhibition of Ca2+-triggered exocytosis with fluorescent thiol reagents; Figure S3: Soluble proteome of CV treated with fluorescent thiol reagents; Figure S4: Cholesterol- enriched membrane proteome of CV treated with fluorescent thiol reagents; Figure S5: Comparison of total CV membrane and cholesterol-enriched CV membrane proteomes; Figure S6: Tubulin does not regulate the efficiency of Ca2+-triggered exocytosis.
Author Contributions
Conceptualization, J.R.C. and K.L.F.; methodology, J.R.C, K.L.F., A.L.Y. and P.S.B.; formal analysis, K.L.F, A.L.Y. and P.S.B.; investigation, K.L.F, A.L.Y. and P.S.B.; data curation, P.S.B.; writing—original draft preparation, K.L.F.; writing—review and editing, J.R.C. and K.L.F.; supervision, J.R.C.; project administration, J.R.C.; funding acquisition, J.R.C.
Funding
This research was funded by the Canadian Institutes of Health Research (CIHR) and the Natural Sciences and Engineering Research Council of Canada (NSERC); additionally, J.R.C. is a Senior Scholar of the Alberta Heritage Foundation for Medical Research. The mass spectrometry work was supported by the Division of Intramural Research, Eunice Kennedy Shriver National Institute of Child Health and Human Development, National Institutes of Health. K.L.F. was supported by a CIHR Canadian Graduate Scholarship—Doctoral Award and an Alberta Heritage Foundation for Medical Research Graduate Studentship.
Conflicts of Interest
The authors declare no conflict of interest.
References
- Dabral, D.; Coorssen, J.R. Arachidonic acid and lysophosphatidylcholine inhibit multiple late steps of regulated exocytosis. Biochem. Biophys. Res. Commun. 2019, 515, 261–267. [Google Scholar] [CrossRef] [PubMed]
- Dabral, D.; Coorssen, J.R. Combined targeted Omic and Functional Assays Identify Phospholipases A(2) that Regulate Docking/Priming in Calcium-Triggered Exocytosis. Cells 2019, 8, 303. [Google Scholar] [CrossRef] [PubMed]
- Rogasevskaia, T.P.; Coorssen, J.R. The Role of Phospholipase D in Regulated Exocytosis. J. Biol. Chem. 2015, 290, 28683–28696. [Google Scholar] [CrossRef] [PubMed]
- James, D.J.; Khodthong, C.; Kowalchyk, J.A.; Martin, T.F. Phosphatidylinositol 4,5-bisphosphate regulates SNARE-dependent membrane fusion. J. Cell Biol. 2008, 182, 355–366. [Google Scholar] [CrossRef] [PubMed]
- Lang, T.; Bruns, D.; Wenzel, D.; Riedel, D.; Holroyd, P.; Thiele, C.; Jahn, R. SNAREs are concentrated in cholesterol-dependent clusters that define docking and fusion sites for exocytosis. EMBO J. 2001, 20, 2202–2213. [Google Scholar] [CrossRef] [PubMed]
- Rogasevskaia, T.P.; Churchward, M.A.; Coorssen, J.R. Anionic lipids in Ca(2+)-triggered fusion. Cell Calcium 2012, 52, 259–269. [Google Scholar] [CrossRef] [PubMed]
- Rogasevskaia, T.P.; Coorssen, J.R. A new approach to the molecular analysis of docking, priming, and regulated membrane fusion. J. Chem. Biol. 2011, 4, 117–136. [Google Scholar] [CrossRef][Green Version]
- Abbineni, P.S.; Coorssen, J.R. Sphingolipids modulate docking, Ca(2+) sensitivity and membrane fusion of native cortical vesicles. Int. J. Biochem. Cell Biol. 2018, 104, 43–54. [Google Scholar] [CrossRef]
- Churchward, M.A.; Rogasevskaia, T.; Hofgen, J.; Bau, J.; Coorssen, J.R. Cholesterol facilitates the native mechanism of Ca2+-triggered membrane fusion. J. Cell. Sci. 2005, 118, 4833–4848. [Google Scholar] [CrossRef]
- Mahadeo, M.; Furber, K.L.; Lam, S.; Coorssen, J.R.; Prenner, E.J. Secretory vesicle cholesterol: Correlating lipid domain organization and Ca2+ triggered fusion. Biochim. Biophys. Acta 2015, 1848, 1165–1174. [Google Scholar] [CrossRef]
- Rogasevskaia, T.; Coorssen, J.R. Sphingomyelin-enriched microdomains define the efficiency of native Ca(2+)-triggered membrane fusion. J. Cell Sci. 2006, 119, 2688–2694. [Google Scholar] [CrossRef]
- Churchward, M.A.; Rogasevskaia, T.; Brandman, D.M.; Khosravani, H.; Nava, P.; Atkinson, J.K.; Coorssen, J.R. Specific lipids supply critical negative spontaneous curvature—An essential component of native Ca2+-triggered membrane fusion. Biophys. J. 2008, 94, 3976–3986. [Google Scholar] [CrossRef]
- Chernomordik, L.V.; Vogel, S.S.; Sokoloff, A.; Onaran, H.O.; Leikina, E.A.; Zimmerberg, J. Lysolipids reversibly inhibit Ca(2+)-, GTP- and pH-dependent fusion of biological membranes. FEBS Lett. 1993, 318, 71–76. [Google Scholar] [CrossRef]
- Kreutzberger, A.J.B.; Kiessling, V.; Liang, B.; Yang, S.T.; Castle, J.D.; Tamm, L.K. Asymmetric Phosphatidylethanolamine Distribution Controls Fusion Pore Lifetime and Probability. Biophys. J. 2017, 113, 1912–1915. [Google Scholar] [CrossRef]
- Burgoyne, R.D.; Morgan, A. Secretory granule exocytosis. Physiol. Rev. 2003, 83, 581–632. [Google Scholar] [CrossRef]
- Takamori, S.; Holt, M.; Stenius, K.; Lemke, E.A.; Gronborg, M.; Riedel, D.; Urlaub, H.; Schenck, S.; Brugger, B.; Ringler, P.; et al. Molecular anatomy of a trafficking organelle. Cell 2006, 127, 831–846. [Google Scholar] [CrossRef]
- Churchward, M.A.; Brandman, D.M.; Rogasevskaia, T.; Coorssen, J.R. Copper (II) sulfate charring for high sensitivity on-plate fluorescent detection of lipids and sterols: Quantitative analyses of the composition of functional secretory vesicles. J. Chem. Biol. 2008, 1, 79–87. [Google Scholar] [CrossRef]
- Coorssen, J.R.; Blank, P.S.; Albertorio, F.; Bezrukov, L.; Kolosova, I.; Backlund, P.S., Jr.; Zimmerberg, J. Quantitative femto- to attomole immunodetection of regulated secretory vesicle proteins critical to exocytosis. Anal. Biochem. 2002, 307, 54–62. [Google Scholar] [CrossRef]
- Burré, J.; Beckhaus, T.; Schägger, H.; Corvey, C.; Hofmann, S.; Karas, M.; Zimmermann, H.; Volknandt, W. Analysis of the synaptic vesicle proteome using three gel-based protein separation techniques. Proteomics 2006, 6, 6250–6262. [Google Scholar] [CrossRef]
- Bennett, M.K.; Scheller, R.H. The molecular machinery for secretion is conserved from yeast to neurons. Proc. Natl. Acad. Sci. USA 1993, 90, 2559–2563. [Google Scholar] [CrossRef]
- Fasshauer, D.; Sutton, R.B.; Brunger, A.T.; Jahn, R. Conserved structural features of the synaptic fusion complex: SNARE proteins reclassified as Q- and R-SNAREs. Proc. Natl. Acad. Sci. USA 1998, 95, 15781–15786. [Google Scholar] [CrossRef]
- Abbineni, P.S.; Hibbert, J.E.; Coorssen, J.R. Critical role of cortical vesicles in dissecting regulated exocytosis: Overview of insights into fundamental molecular mechanisms. Biol. Bull. 2013, 224, 200–217. [Google Scholar] [CrossRef]
- Block, M.R.; Glick, B.S.; Wilcox, C.A.; Wieland, F.T.; Rothman, J.E. Purification of an N-ethylmaleimide-sensitive protein catalyzing vesicular transport. Proc. Natl. Acad. Sci. USA 1988, 85, 7852–7856. [Google Scholar] [CrossRef]
- Weidman, P.J.; Melancon, P.; Block, M.R.; Rothman, J.E. Binding of an N-ethylmaleimide-sensitive fusion protein to Golgi membranes requires both a soluble protein(s) and an integral membrane receptor. J. Cell Biol. 1989, 108, 1589–1596. [Google Scholar] [CrossRef]
- Söllner, T.; Whiteheart, S.W.; Brunner, M.; Erdjument-Bromage, H.; Geromanos, S.; Tempst, P.; Rothman, J.E. SNAP receptors implicated in vesicle targeting and fusion. Nature 1993, 362, 318–324. [Google Scholar] [CrossRef]
- Sudhof, T.C. Neurotransmitter release: The last millisecond in the life of a synaptic vesicle. Neuron 2013, 80, 675–690. [Google Scholar] [CrossRef]
- He, E.; Wierda, K.; van Westen, R.; Broeke, J.H.; Toonen, R.F.; Cornelisse, L.N.; Verhage, M. Munc13-1 and Munc18-1 together prevent NSF-dependent de-priming of synaptic vesicles. Nat. Commun. 2017, 8, 15915. [Google Scholar] [CrossRef]
- Szule, J.A.; Coorssen, J.R. Revisiting the role of SNAREs in exocytosis and membrane fusion. Biochim. Biophys. Acta 2003, 1641, 121–135. [Google Scholar] [CrossRef][Green Version]
- Rizo, J.; Sudhof, T.C. The membrane fusion enigma: SNAREs, Sec1/Munc18 proteins, and their accomplices—Guilty as charged? Annu. Rev. Cell Dev. Biol. 2012, 28, 279–308. [Google Scholar] [CrossRef]
- Coorssen, J.R.; Blank, P.S.; Tahara, M.; Zimmerberg, J. Biochemical and functional studies of cortical vesicle fusion: The SNARE complex and Ca2+ sensitivity. J. Cell Biol. 1998, 143, 1845–1857. [Google Scholar] [CrossRef]
- Coorssen, J.R.; Blank, P.S.; Albertorio, F.; Bezrukov, L.; Kolosova, I.; Chen, X.; Backlund, P.S., Jr.; Zimmerberg, J. Regulated secretion: SNARE density, vesicle fusion and calcium dependence. J. Cell Sci. 2003, 116, 2087–2097. [Google Scholar] [CrossRef]
- Szule, J.A.; Jarvis, S.E.; Hibbert, J.E.; Spafford, J.D.; Braun, J.E.; Zamponi, G.W.; Wessel, G.M.; Coorssen, J.R. Calcium-triggered membrane fusion proceeds independently of specific presynaptic proteins. J. Biol. Chem. 2003, 278, 24251–24254. [Google Scholar] [CrossRef]
- Zimmerberg, J.; Blank, P.S.; Kolosova, I.; Cho, M.S.; Tahara, M.; Coorssen, J.R. A stage-specific preparation to study the Ca(2+)-triggered fusion steps of exocytosis: Rationale and perspectives. Biochimie 2000, 82, 303–314. [Google Scholar] [CrossRef]
- Abbineni, P.S.; Wright, E.P.; Rogasevskaia, T.P.; Killingsworth, M.C.; Malladi, C.S.; Coorssen, J.R. The Sea Urchin Egg and Cortical Vesicles as Model Systems to Dissect the Fast, Ca2+-Triggered Steps of Regulated Exocytosis. Neuromethods 2014, 83. [Google Scholar] [CrossRef]
- Vogel, S.S.; Chernomordik, L.V.; Zimmerberg, J. Calcium-triggered fusion of exocytotic granules requires proteins in only one membrane. J. Biol. Chem. 1992, 267, 25640–25643. [Google Scholar]
- Whalley, T.; Timmers, K.; Coorssen, J.; Bezrukov, L.; Kingsley, D.H.; Zimmerberg, J. Membrane fusion of secretory vesicles of the sea urchin egg in the absence of NSF. J. Cell Sci. 2004, 117, 2345–2356. [Google Scholar] [CrossRef]
- Haggerty, J.G.; Jackson, R.C. Release of granule contents from sea urchin egg cortices. New assay procedures and inhibition by sulfhydryl-modifying reagents. J. Biol. Chem. 1983, 258, 1819–1825. [Google Scholar]
- Vogel, S.S.; Blank, P.S.; Zimmerberg, J. Poisson-distributed active fusion complexes underlie the control of the rate and extent of exocytosis by calcium. J. Cell Biol. 1996, 134, 329–338. [Google Scholar] [CrossRef]
- Furber, K.L.; Brandman, D.M.; Coorssen, J.R. Enhancement of the Ca(2+)-triggering steps of native membrane fusion via thiol-reactivity. J. Chem. Biol. 2009, 2, 27–37. [Google Scholar] [CrossRef][Green Version]
- Furber, K.L.; Dean, K.T.; Coorssen, J.R. Dissecting the mechanism of Ca2+-triggered membrane fusion: Probing protein function using thiol reactivity. Clin. Exp. Pharmacol. Physiol. 2010, 37, 208–217. [Google Scholar] [CrossRef][Green Version]
- Coorssen, J.R.; Yergey, A.L. Proteomics Is Analytical Chemistry: Fitness-for-Purpose in the Application of Top-Down and Bottom-Up Analyses. Proteomes 2015, 3, 440–453. [Google Scholar] [CrossRef]
- Padula, M.P.; Berry, I.J.; MB, O.R.; Raymond, B.B.; Santos, J.; Djordjevic, S.P. A Comprehensive Guide for Performing Sample Preparation and Top-Down Protein Analysis. Proteomes 2017, 5, 11. [Google Scholar] [CrossRef]
- Zhan, X.; Yang, H.; Peng, F.; Li, J.; Mu, Y.; Long, Y.; Cheng, T.; Huang, Y.; Li, Z.; Lu, M.; et al. How many proteins can be identified in a 2DE gel spot within an analysis of a complex human cancer tissue proteome? Electrophoresis 2018, 39, 965–980. [Google Scholar] [CrossRef]
- Thiede, B.; Koehler, C.J.; Strozynski, M.; Treumann, A.; Stein, R.; Zimny-Arndt, U.; Schmid, M.; Jungblut, P.R. High resolution quantitative proteomics of HeLa cells protein species using stable isotope labeling with amino acids in cell culture (SILAC), two-dimensional gel electrophoresis (2DE) and nano-liquid chromatograpohy coupled to an LTQ-OrbitrapMass spectrometer. Mol. Cell Proteomics 2013, 12, 529–538. [Google Scholar] [CrossRef]
- Furber, K.L.; Churchward, M.A.; Rogasevskaia, T.P.; Coorssen, J.R. Identifying critical components of native Ca2+-triggered membrane fusion. Integrating studies of proteins and lipids. Ann. N. Y. Acad. Sci. 2009, 1152, 121–134. [Google Scholar] [CrossRef]
- Churchward, M.A.; Coorssen, J.R. Cholesterol, regulated exocytosis and the physiological fusion machine. Biochem. J. 2009, 423, 1–14. [Google Scholar] [CrossRef]
- Conner, S.; Wessel, G.M. rab3 mediates cortical granule exocytosis in the sea urchin egg. Dev. Biol. 1998, 203, 334–344. [Google Scholar] [CrossRef][Green Version]
- Blank, P.S.; Cho, M.S.; Vogel, S.S.; Kaplan, D.; Kang, A.; Malley, J.; Zimmerberg, J. Submaximal responses in calcium-triggered exocytosis are explained by differences in the calcium sensitivity of individual secretory vesicles. J. Gen. Physiol. 1998, 112, 559–567. [Google Scholar] [CrossRef]
- Hibbert, J.E.; Butt, R.H.; Coorssen, J.R. Actin is not an essential component in the mechanism of calcium-triggered vesicle fusion. Int. J. Biochem. Cell Biol. 2006, 38, 461–471. [Google Scholar] [CrossRef]
- Butt, R.H.; Coorssen, J.R. Postfractionation for enhanced proteomic analyses: Routine electrophoretic methods increase the resolution of standard 2D-PAGE. J. Proteome Res. 2005, 4, 982–991. [Google Scholar] [CrossRef]
- Jiang, X.S.; Backlund, P.S.; Wassif, C.A.; Yergey, A.L.; Porter, F.D. Quantitative proteomics analysis of inborn errors of cholesterol synthesis: Identification of altered metabolic pathways in DHCR7 and SC5D deficiency. Mol. Cell Proteomics 2010, 9, 1461–1475. [Google Scholar] [CrossRef] [PubMed]
- Hellman, U.; Wernstedt, C.; Gonez, J.; Heldin, C.H. Improvement of an “In-Gel” digestion procedure for the micropreparation of internal protein fragments for amino acid sequencing. Anal. Biochem. 1995, 224, 451–455. [Google Scholar] [CrossRef] [PubMed]
- Vacquier, V.D. The isolation of intact cortical granules from sea urchin eggs: Calcium ions trigger granule discharge. Dev. Biol. 1975, 43, 62–74. [Google Scholar] [CrossRef]
- Decker, S.J.; Kinsey, W.H. Characterization of cortical secretory vesicles from the sea urchin egg. Dev. Biol. 1983, 96, 37–45. [Google Scholar] [CrossRef]
- Roux, M.M.; Radeke, M.J.; Goel, M.; Mushegian, A.; Foltz, K.R. 2DE identification of proteins exhibiting turnover and phosphorylation dynamics during sea urchin egg activation. Dev. Biol. 2008, 313, 630–647. [Google Scholar] [CrossRef] [PubMed][Green Version]
- Sodergren, E.; Weinstock, G.M.; Davidson, E.H.; Cameron, R.A.; Gibbs, R.A.; Angerer, R.C.; Coffman, J.A. The genome of the sea urchin Strongylocentrotus purpuratus. Science 2006, 314, 941–952. [Google Scholar] [CrossRef]
- Thul, P.J.; Åkesson, L.; Wiking, M.; Mahdessian, D.; Geladaki, A.; Ait Blal, H.; Alm, T.; Asplund, A.; Björk, L.; Breckels, L.M.; et al. A subcellular map of the human proteome. Science 2017, 356, eaal3321. [Google Scholar] [CrossRef]
- Oliveira, B.M.; Coorssen, J.R.; Martins-de-Souza, D. 2DE: The phoenix of proteomics. J. Proteomics 2014, 104, 140–150. [Google Scholar] [CrossRef]
- Naryzhny, S. Inventory of proteoforms as a current challenge of proteomics: Some technical aspects. J. Proteomics 2019, 191, 22–28. [Google Scholar] [CrossRef]
- Pfeffer, S.R. Rab GTPases: Master regulators that establish the secretory and endocytic pathways. Mol. Biol. Cell 2017, 28, 712–715. [Google Scholar] [CrossRef]
- Trifaró, J.M.; Gasman, S.; Gutiérrez, L.M. Cytoskeletal control of vesicle transport and exocytosis in chromaffin cells. Acta Physiol. 2008, 192, 165–172. [Google Scholar] [CrossRef]
- Li, P.; Bademosi, A.T.; Luo, J.; Meunier, F.A. Actin Remodeling in Regulated Exocytosis: Toward a Mesoscopic View. Trends Cell Biol. 2018, 28, 685–697. [Google Scholar] [CrossRef]
- Papadopulos, A. Membrane shaping by actin and myosin during regulated exocytosis. Mol. Cell Neurosci. 2017, 84, 93–99. [Google Scholar] [CrossRef][Green Version]
- Noordstra, I.; Akhmanova, A. Linking cortical microtubule attachment and exocytosis. F1000 Res. 2017, 6, 469. [Google Scholar] [CrossRef]
- Ñeco, P.; Giner, D.; del Mar Francés, M.; Viniegra, S.; Gutiérrez, L.M. Differential participation of actin- and tubulin-based vesicle transport systems during secretion in bovine chromaffin cells. Eur. J. Neurosci. 2003, 18, 733–742. [Google Scholar] [CrossRef]
- Trifaró, J.M.; Rodríguez del Castillo, A.; Vitale, M.L. Dynamic changes in chromaffin cell cytoskeleton as prelude to exocytosis. Mol. Neurobiol. 1992, 6, 339–358. [Google Scholar] [CrossRef]
- Tran, D.T.; Ten Hagen, K.G. Real-time insights into regulated exocytosis. J. Cell Sci. 2017, 130, 1355–1363. [Google Scholar] [CrossRef]
- Wollman, R.; Meyer, T. Coordinated oscillations in cortical actin and Ca2+ correlate with cycles of vesicle secretion. Nat. Cell Biol. 2012, 14, 1261–1269. [Google Scholar] [CrossRef]
- Stenmark, H. Rab GTPases as coordinators of vesicle traffic. Nat. Rev. Mol. Cell Biol. 2009, 10, 513–525. [Google Scholar] [CrossRef]
- Fukuda, M. Regulation of secretory vesicle traffic by Rab small GTPases. Cell Mol. Life Sci. 2008, 65, 2801–2813. [Google Scholar] [CrossRef]
- Grosshans, B.L.; Ortiz, D.; Novick, P. Rabs and their effectors: Achieving specificity in membrane traffic. Proc. Natl. Acad. Sci. USA 2006, 103, 11821–11827. [Google Scholar] [CrossRef] [PubMed]
- Jia, J.Y.; Lamer, S.; Schümann, M.; Schmidt, M.R.; Krause, E.; Haucke, V. Quantitative proteomics analysis of detergent-resistant membranes from chemical synapses: Evidence for cholesterol as spatial organizer of synaptic vesicle cycling. Mol. Cell. Proteomics 2006, 5, 2060–2071. [Google Scholar] [CrossRef] [PubMed]
- Brunner, Y.; Couté, Y.; Iezzi, M.; Foti, M.; Fukuda, M.; Hochstrasser, D.F.; Wollheim, C.B.; Sanchez, J.C. Proteomics analysis of insulin secretory granules. Mol. Cell. Proteomics 2007, 6, 1007–1017. [Google Scholar] [CrossRef] [PubMed]
- Pavlos, N.J.; Grønborg, M.; Riedel, D.; Chua, J.J.; Boyken, J.; Kloepper, T.H.; Urlaub, H.; Rizzoli, S.O.; Jahn, R. Quantitative analysis of synaptic vesicle Rabs uncovers distinct yet overlapping roles for Rab3a and Rab27b in Ca2+-triggered exocytosis. J. Neurosci. 2010, 30, 13441–13453. [Google Scholar] [CrossRef]
- Geppert, M.; Goda, Y.; Stevens, C.F.; Südhof, T.C. The small GTP-binding protein Rab3A regulates a late step in synaptic vesicle fusion. Nature 1997, 387, 810–814. [Google Scholar] [CrossRef]
- Holz, R.W.; Brondyk, W.H.; Senter, R.A.; Kuizon, L.; Macara, I.G. Evidence for the involvement of Rab3A in Ca(2+)-dependent exocytosis from adrenal chromaffin cells. J. Biol. Chem. 1994, 269, 10229–10234. [Google Scholar] [PubMed]
- Johannes, L.; Lledo, P.M.; Roa, M.; Vincent, J.D.; Henry, J.P.; Darchen, F. The GTPase Rab3a negatively controls calcium-dependent exocytosis in neuroendocrine cells. EMBO J. 1994, 13, 2029–2037. [Google Scholar] [CrossRef]
- Khvotchev, M.V.; Ren, M.; Takamori, S.; Jahn, R.; Südhof, T.C. Divergent functions of neuronal Rab11b in Ca2+-regulated versus constitutive exocytosis. J. Neurosci. 2003, 23, 10531–10539. [Google Scholar] [CrossRef] [PubMed]
- Sugawara, K.; Shibasaki, T.; Mizoguchi, A.; Saito, T.; Seino, S. Rab11 and its effector Rip11 participate in regulation of insulin granule exocytosis. Genes Cells 2009, 14, 445–456. [Google Scholar] [CrossRef]
- Shirakawa, R.; Yoshioka, A.; Horiuchi, H.; Nishioka, H.; Tabuchi, A.; Kita, T. Small GTPase Rab4 regulates Ca2+-induced alpha-granule secretion in platelets. J. Biol. Chem. 2000, 275, 33844–33849. [Google Scholar] [CrossRef]
- Graham, M.E.; Handley, M.T.; Barclay, J.W.; Ciufo, L.F.; Barrow, S.L.; Morgan, A.; Burgoyne, R.D. A gain-of-function mutant of Munc18-1 stimulates secretory granule recruitment and exocytosis and reveals a direct interaction of Munc18-1 with Rab3. Biochem. J. 2008, 409, 407–416. [Google Scholar] [CrossRef]
- Johnson, J.L.; He, J.; Ramadass, M.; Pestonjamasp, K.; Kiosses, W.B.; Zhang, J.; Catz, S.D. Munc13-4 Is a Rab11-binding Protein That Regulates Rab11-positive Vesicle Trafficking and Docking at the Plasma Membrane. J. Biol. Chem. 2016, 291, 3423–3438. [Google Scholar] [CrossRef]
- Neeft, M.; Wieffer, M.; de Jong, A.S.; Negroiu, G.; Metz, C.H.; van Loon, A.; Griffith, J.; Krijgsveld, J.; Wulffraat, N.; Koch, H.; et al. Munc13-4 is an effector of rab27a and controls secretion of lysosomes in hematopoietic cells. Mol. Biol. Cell 2005, 16, 731–741. [Google Scholar] [CrossRef]
- Tsuboi, T.; Fukuda, M. The C2B domain of rabphilin directly interacts with SNAP-25 and regulates the docking step of dense core vesicle exocytosis in PC12 cells. J. Biol. Chem. 2005, 280, 39253–39259. [Google Scholar] [CrossRef]
- Ferrer-Orta, C.; Perez-Sanchez, M.D.; Coronado-Parra, T.; Silva, C.; Lopez-Martinez, D.; Baltanas-Copado, J.; Gomez-Fernandez, J.C.; Corbalan-Garcia, S.; Verdaguer, N. Structural characterization of the Rabphilin-3A-SNAP25 interaction. Proc. Natl. Acad. Sci. USA 2017, 114, E5343–E5351. [Google Scholar] [CrossRef]
- Gomi, H.; Mizutani, S.; Kasai, K.; Itohara, S.; Izumi, T. Granuphilin molecularly docks insulin granules to the fusion machinery. J. Cell Biol. 2005, 171, 99–109. [Google Scholar] [CrossRef]
- Torii, S.; Takeuchi, T.; Nagamatsu, S.; Izumi, T. Rab27 effector granuphilin promotes the plasma membrane targeting of insulin granules via interaction with syntaxin 1a. J. Biol. Chem. 2004, 279, 22532–22538. [Google Scholar] [CrossRef]
- Deak, F.; Shin, O.H.; Tang, J.; Hanson, P.; Ubach, J.; Jahn, R.; Rizo, J.; Kavalali, E.T.; Sudhof, T.C. Rabphilin regulates SNARE-dependent re-priming of synaptic vesicles for fusion. EMBO J. 2006, 25, 2856–2866. [Google Scholar] [CrossRef]
- Shin, H.W.; Hayashi, M.; Christoforidis, S.; Lacas-Gervais, S.; Hoepfner, S.; Wenk, M.R.; Modregger, J.; Uttenweiler-Joseph, S.; Wilm, M.; Nystuen, A.; et al. An enzymatic cascade of Rab5 effectors regulates phosphoinositide turnover in the endocytic pathway. J. Cell Biol. 2005, 170, 607–618. [Google Scholar] [CrossRef]
- Christoforidis, S.; Miaczynska, M.; Ashman, K.; Wilm, M.; Zhao, L.; Yip, S.; Waterfield, M.D.; Backer, J.M.; Zerial, M. Phosphatidylinositol-3-OH kinases are Rab5 effectors. Nat. Cell Biol. 1999, 1, 249–252. [Google Scholar] [CrossRef]
- Martin, T.F. PI(4,5)P2-binding effector proteins for vesicle exocytosis. Biochim. Biophys. Acta 2015, 1851, 785–793. [Google Scholar] [CrossRef] [PubMed]
- Deeney, J.T.; Gromada, J.; Høy, M.; Olsen, H.L.; Rhodes, C.J.; Prentki, M.; Berggren, P.O.; Corkey, B.E. Acute stimulation with long chain acyl-CoA enhances exocytosis in insulin-secreting cells (HIT T-15 and NMRI beta-cells). J. Biol. Chem. 2000, 275, 9363–9368. [Google Scholar] [CrossRef] [PubMed]
- Zinsmaier, K.E.; Bronk, P. Molecular chaperones and the regulation of neurotransmitter exocytosis. Biochem. Pharmacol. 2001, 62, 1–11. [Google Scholar] [CrossRef]
- Gorenberg, E.L.; Chandra, S.S. The Role of Co-chaperones in Synaptic Proteostasis and Neurodegenerative Disease. Front. Neurosci. 2017, 11, 248. [Google Scholar] [CrossRef] [PubMed]
© 2019 by the authors. Licensee MDPI, Basel, Switzerland. This article is an open access article distributed under the terms and conditions of the Creative Commons Attribution (CC BY) license (http://creativecommons.org/licenses/by/4.0/).