1. Introduction
Inclusive education aims to ensure that learners with diverse developmental, cognitive, linguistic, sensory and learning profiles can participate meaningfully in mainstream educational settings (
UNESCO & Ministry of Education and Science Spain, 1994). Universal Design for Learning (UDL) emphasizes the adaptation of instructional content, pace, assessment procedures and learning activities according to students’ individual needs, strengths, preferences, and learning profiles. This perspective is particularly relevant for neurodivergent school-age children, including autistic children and children with dyslexia, whose educational participation may be influenced by differences in social attention, executive functioning, language processing, reading-related skills and responses to instructional demands (
Aminpour et al., 2025;
Tīģere et al., 2025).
Current U.S. surveillance data indicate that approximately 1 in 31 8-year-old children meet criteria for ASD (
Shaw et al., 2025), while a recent global meta-analysis estimated the pooled prevalence of developmental dyslexia in primary school children at 7.10% (
Yang et al., 2022). Given these prevalence rates, inclusive assessment tools that can accommodate both profiles are of direct relevance to mainstream educational settings. In autism, differences in joint attention, theory of mind, social cue processing and executive functioning may influence how children orient to socially relevant information and coordinate attention within dynamic interactional contexts (
De Belen et al., 2023;
Lu et al., 2024). In dyslexia, educational participation is most directly associated with reading and writing demands. However, classroom learning also draws on working memory, visual attention, processing speed, and the ability to regulate responses under competing demands, processes that extend well beyond phonological skills alone (
Pennington, 2006). Previous work has linked dyslexia with variability in working memory and executive function-related processes, such as inhibition, switching, updating, planning and visual scanning (
Gray et al., 2019;
Kouklari et al., 2024;
Smith-Spark & Fisk, 2007;
Taran et al., 2022).
Difficulties with these constructs translate directly into classroom demands. A child who struggles to follow a teacher’s or peer’s gaze and attentional cues, a joint attention difficulty common in autism, may miss the nonverbal scaffolding that accompanies verbal instruction, and reduced theory of mind can further limit a child’s ability to infer what a teacher or peer intends beyond what is explicitly stated (
Mundy et al., 2017;
Schneider et al., 2014;
Stallworthy et al., 2021). In dyslexia, weaker working memory and slower processing speed constrain more than decoding, affecting the ability to follow multi-step instructions and keep pace with classroom activities, independent of phonological skill (
Gray et al., 2019;
Smith-Spark & Fisk, 2007). Inhibitory control cuts across both profiles, since classroom tasks frequently require suppressing a salient but incorrect response in favor of a subtler, contextually cued one (
Kouklari et al., 2024). Because each of these constructs shapes daily classroom participation, their systematic evaluation is important for identifying the support autistic children and children with dyslexia may need (
Lu et al., 2024).
Many assessment tools rely on explicit verbal responses, structured examiner-led tasks and outcome-based scoring. As a result, they may provide limited information about the real-time processes that contribute to a child’s performance, such as how the child pays attention, responds to social or instructional cues, manages competing information and adjusts responses after feedback. For example, false-belief tasks are widely used to assess theory of mind but they also often require verbal comprehension, metacognitive reflection and a single correct or incorrect response. This can hide how children think and process social information in real time. Therefore, complementary methods that capture process-level indicators may provide more educationally informative data for individualized support planning (
Lu et al., 2024;
Schneider et al., 2014).
Eye-tracking technology can strengthen process-oriented assessment by providing time-sensitive, moment-by-moment information about how learners visually attend to a task, information that outcome scores alone cannot capture (
Toki, 2024;
Nguyen et al., 2024). In educational research, eye tracking has been used to examine cognitive processes such as information selection, organization, integration, cognitive load, reading behavior, problem-solving strategies and performance in computer-based assessments (
Nguyen et al., 2024;
Toki, 2024;
Toki et al., 2022;
Taran et al., 2022).
In dyslexia research, eye tracking has most often been applied to reading-related tasks where gaze patterns may inform understanding of reading fluency, visual attention, processing speed and individualized instructional adjustments (
Nguyen et al., 2024;
Toki, 2024). In autism research, gaze-based methods have been used to examine attention to social and non-social stimuli, including how children orient to faces, emotional expressions, and socially relevant cues in dynamic contexts (
De Belen et al., 2023;
Jording et al., 2024;
Swanson & Siller, 2013). This attention to faces, however, is not fixed or task-independent: evidence indicates that face-orienting and looking time to faces in autism are strongly task-dependent, with the proportion of first fixations to faces comparable between autistic and non-autistic groups, while overall looking time varies according to task demands (
Del Bianco et al., 2018). This suggests that gaze-based indicators of engagement need not be confounded by group differences in spontaneous social orienting, provided the task itself makes a gaze response functionally necessary rather than relying on passive viewing alone. Gaze-based indicators may therefore offer complementary information about task engagement, attentional allocation and processing demands (
De Belen et al., 2023;
Del Bianco et al., 2018), which may help professionals better understand how learners interact with educational materials and task conditions.
Game-based assessment and serious educational games offer one way to address this need. They embed assessment within structured, interactive, and goal-directed digital environments. Serious educational games are not designed only for entertainment. They can also support learning, skill development, practice, and assessment through rule-based and purposeful tasks. Unlike gamification, which involves adding game elements to non-game contexts, serious games are developed as complete interactive environments aligned with educational or assessment-related goals. In these environments, children’s repeated decisions, response timing, persistence, strategy use and adaptation across trials can be recorded continuously. This allows assessment to move beyond a single final score (
Gomez et al., 2023;
Rodríguez-Ferrer et al., 2023). Previous research suggests that game-based and simulation-based environments may increase motivation, support active engagement and provide opportunities to observe how learners respond to feedback and changing task demands (
Azizah et al., 2026;
Chien et al., 2023;
Gomez et al., 2023). A growing body of the literature supports the use of serious games and gamified environments to support learning and engagement in both autistic children and children with dyslexia. A recent review documents positive effects on motivation, self-control, and social–emotional skills in autistic populations (
López-Bouzas & Del Moral-Pérez, 2023), while game-based digital interventions for dyslexia, including rhythm- and language-based training tools, have shown measurable gains in reading-related and cognitive outcomes (
Vonthron et al., 2024;
Descamps et al., 2025).
The combined use of game-based assessment and eye tracking in inclusive educational contexts is limited. As a result, assessment tools may not fully capture how children with diverse cognitive profiles engage with tasks, which can limit the information available for individualized support planning. Technology-enhanced, process-oriented approaches may help to address this by generating continuous behavioral data on attention, pacing, and response patterns. Within a Universal Design for Learning framework, such data may help shift the focus of assessment from identifying deficits toward identifying the conditions under which each learner can participate most effectively.
The present exploratory study introduces a game-based, gaze-contingent eye-tracking paradigm developed in Unity 3D to examine process-level indicators in autistic school-age children, children with dyslexia, and neurotypical children. The task was designed to measure how children follow gaze cues from the avatar, handle distractions, and adapt their performance across trials. The broader aim is to explore whether such indicators can complement standardized assessments and inform more individualized educational support. Accordingly, the study addressed the following research questions:
Do gaze-based indicators of task engagement, attention allocation, inhibitory control, task duration, and learning efficiency differ among autistic children, children with dyslexia and neurotypical children?
Are gaze-based indicators associated with standardized measures of joint attention, theory of mind, working memory, and processing speed?
What process-level indicators derived from gaze-based task engagement may be relevant for informing individualized educational support for autistic learners and learners with dyslexia in inclusive settings?
2. Materials and Methods
2.1. Participants
Children in the ASD and dyslexia groups had received formal diagnoses prior to participation in the study. These diagnoses were based on national procedures in Turkey, where each child held a ÇÖZGER (Çocuklar İçin Özel Gereksinim Raporu- Special Needs Report for Children), issued by a hospital-based medical board. These diagnoses were further confirmed through evaluations conducted at Rehberlik ve Araştırma Merkezleri (RAM) (Guidance and Research Centers), state-authorized institutions responsible for educational assessments, diagnostic classification, and decisions regarding access to special education services. Children in the neurotypical (typical development; TD) group were recruited from community networks and had no reported developmental, neurological, or learning difficulties.
Participants were required to meet the following inclusion criteria: (a) be between 6 and 14 years of age (school-age), (b) have no additional neurological, developmental, or visual impairments, and (c) obtain a full-scale and nonverbal IQ score of 70 or above on the Wechsler Intelligence Scale for Children—Fourth Edition (WISC-IV-Turkish Edition) (
Uluç et al., 2011). Additionally, children in the autistic group were required to fall within the mild range on the Turkish version of the Gilliam Autism Rating Scale- Second Edition, Turkish Version (GARS-2 TR) (
Diken et al., 2012).
An a priori power analysis (GPower 3.1; f = 0.25, power = 0.80, α = 0.05) indicated that 53 participants per group would be required for a full-scale investigation. The present study recruited 15 participants per group as a preliminary feasibility sample (
Hertzog, 2008), and findings should be interpreted accordingly.
The 6–14 year age range was selected for two main reasons. First, it corresponds to Turkey’s compulsory basic education period, during which children with autism and dyslexia are mandated to be placed in inclusive classrooms, making inclusive assessment tools particularly necessary during these years. Second, it spans the years during which formal diagnostic confirmation, individualized education plans, and classroom-based assessment decisions are most actively made, and it was wide enough to recruit a feasibility sample of 15 children per diagnostic group within the study’s timeframe.
There was no fixed initial pool of candidates; rather, children referred from clinical settings were assessed sequentially. Due to the interactive nature of the eye-tracking paradigm, it was necessary that participants possessed a sufficient cognitive baseline to comprehend the task, ensuring that social cognition findings were not confounded by global intellectual disability. During the consecutive screening process, 12 children referred with an autism diagnosis and 3 children referred with a dyslexia diagnosis did not meet the WISC-IV inclusion cutoff (Full-Scale and/or nonverbal IQ below 70) and were therefore excluded before the eye-tracking task. The screening and exclusion process continued systematically until exactly 15 eligible participants were successfully recruited for each group.
The gender distribution within the groups was 4 females and 11 males in both the neurotypical and ASD groups, and 3 females and 12 males in the dyslexia group. The mean age of participants was 113.47 months, SD = 22.59, for the neurotypical group; 92.53 months, SD = 18.09, for the autistic group; and 105.67 months, SD = 16.72, for the dyslexia group. Although chronological age was not strictly matched, all participants were school-aged children with the sufficient cognitive capacity to independently perform the eye-tracking task. Age ranged from 87 to 156 months (7;3–13;0) in the neurotypical group, 74 to 133 months (6;2–11;1) in the autistic group, and 72 to 123 months (6;0–10;3) in the dyslexia group.
2.2. Measures
2.2.1. Standardized Assessments
Sally-Ann Task
The Sally-Ann task (
Wimmer & Perner, 1983) was used to assess explicit theory of mind. This classic first-order false-belief task evaluates whether a child can infer that another person holds a belief that is different from reality. In the task, the participant must predict where a character (Sally) will look for an object, based on what Sally knows, not what the participant knows. Success on the task indicates an understanding that others can hold beliefs that differ from one’s own knowledge or reality (
Küçük, 2018). In this study, the test was included as a clinical comparison parameter to evaluate how traditional false-belief performance relates to eye-tracking data. The test provided the necessary variance in the ASD and dyslexia groups for correlation analyses. It was administered by a single trained examiner (first author) using predefined objective criteria.
Childhood Joint Attention Rating Scale (C-JARS)
Childhood Joint Attention Rating Scale (C-JARS) (
Mundy et al., 2017) is a standardized caregiver rating scale designed to evaluate joint attention behaviors in children aged 6 to 16. It includes 60 items that assess verbal and non-verbal components of joint attention, including initiation and maintenance. Higher scores reflect stronger joint attention abilities. The Turkish adaptation (
Alev-Savtak, 2022) demonstrated acceptable psychometric properties, including high internal consistency (Cronbach’s alpha = 0.85) indicating its suitability for use in this population. While joint attention is conceptually linked to various executive functions, C-JARS specifically measures the overt behavioral manifestations of joint attention as perceived in daily life.
Wechsler Intelligence Scale for Children-4 (WISC-IV)
The Turkish adaptation of the WISC-IV (
Wechsler, 2003;
Uluç et al., 2011) was used for two purposes. Full-Scale IQ served as an inclusion criterion, ensuring all participants scored 70 or above. The Working Memory Index (Digit Span, Letter–Number Sequencing) and Processing Speed Index (Coding, Symbol Search) were used as variables in correlation analyses.
2.2.2. Eye-Tracking Task
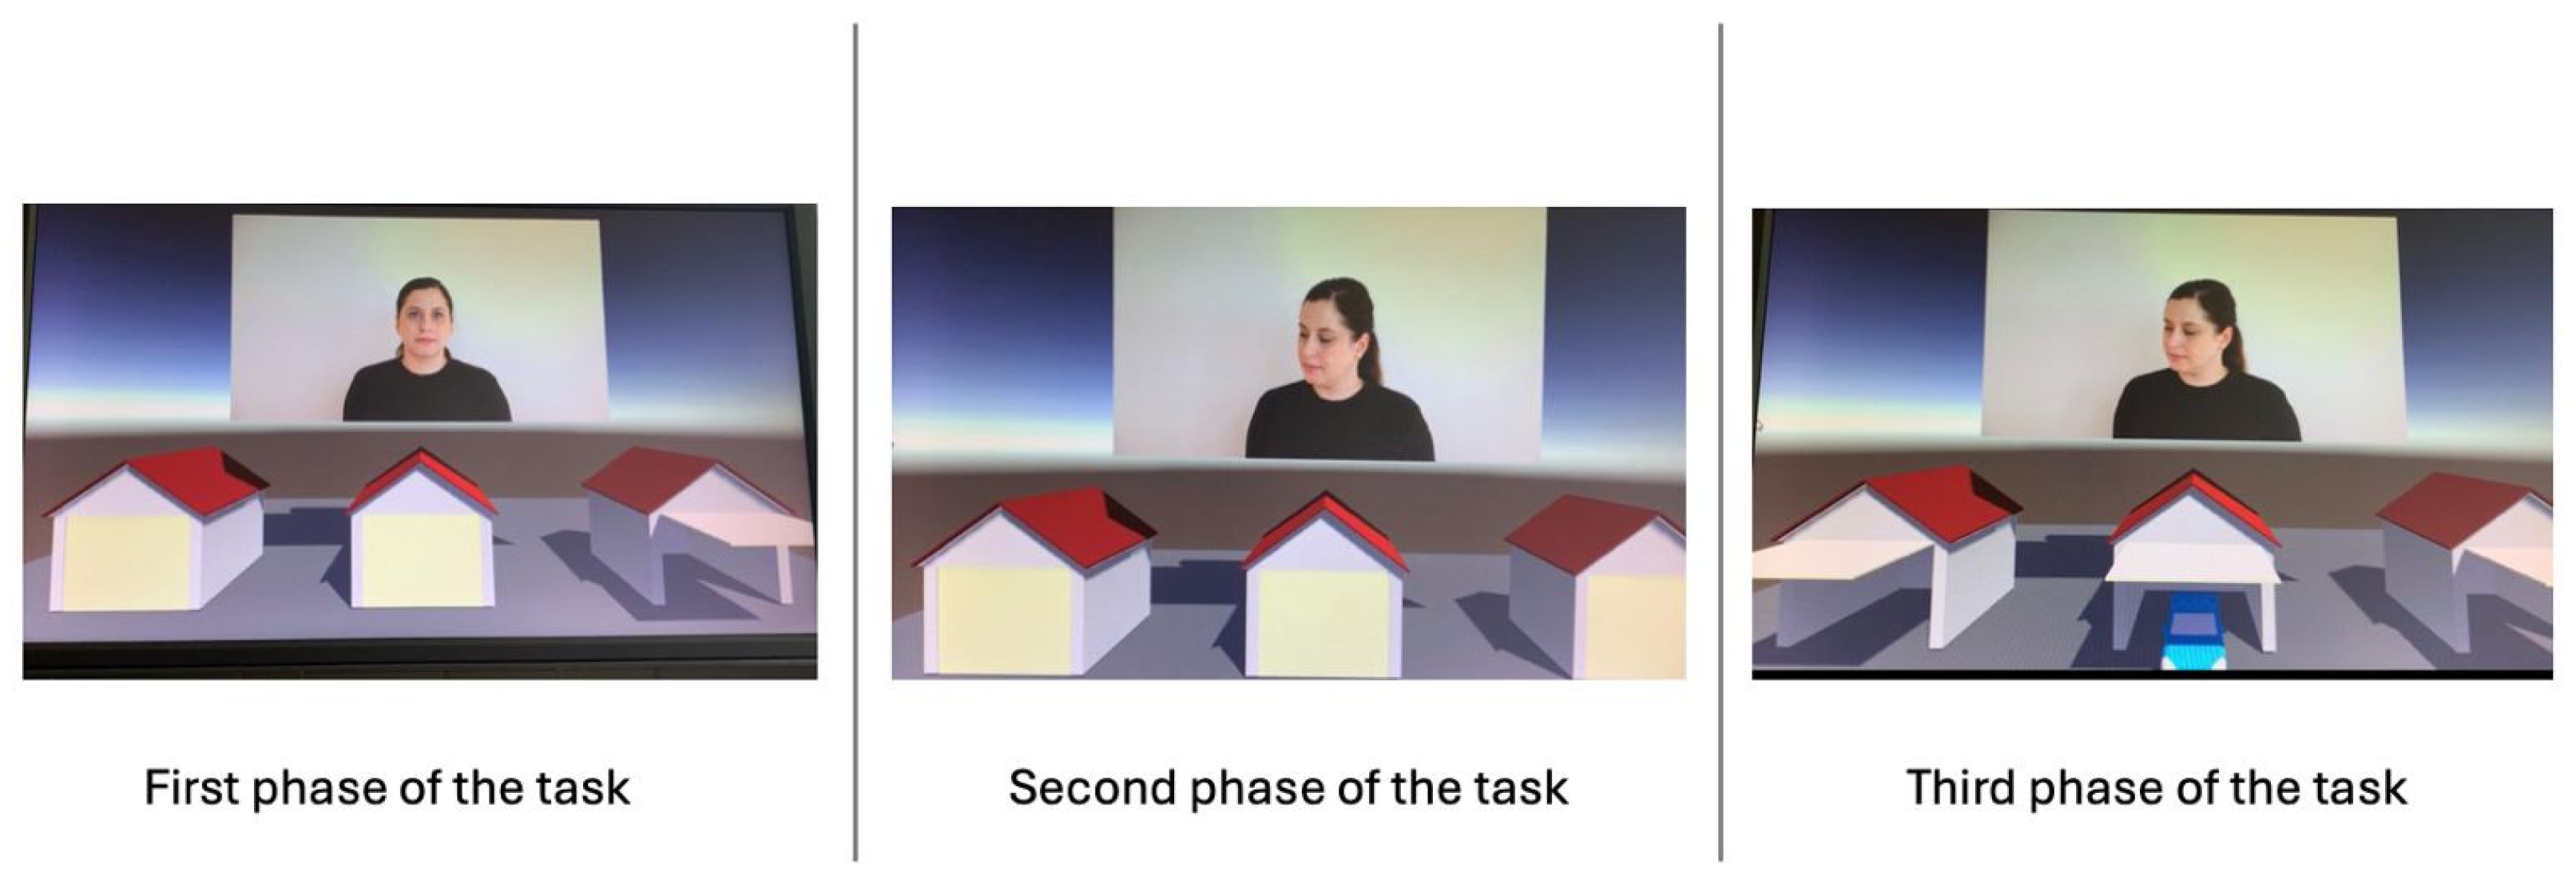
A custom-designed eye-tracking task developed in Unity 3D was used to assess implicit joint attention and executive functioning and to examine behavioral correlates of theory of mind, in a dynamic and interactive setting. The Tobii TX300 Eye Tracker (Tobii Technology AB, Danderyd, Sweden) recorded participants’ gaze behaviors in real time. Data outputs included fixation duration, time to first fixation, and gaze distribution across predefined areas of interest (AOIs). Further details about the experimental design and operationalization of constructs are provided in the
Figure 1.
2.3. Procedure
Assessments were conducted individually in a quiet room at a speech and language therapy center, equipped with a desktop computer, Tobii TX300 Eye Tracker, and standardized lighting. This setting provided an ecologically relevant context that more closely reflects the environments in which educational and clinical assessment typically occurs for this population. All sessions were administered by the first author, a trained speech and language therapist with clinical experience in the assessment of neurodivergent children. Informed consent was obtained from parents/guardians and assent from children. Each participant completed the protocol in one or two sessions depending on attention and fatigue. Session one included the WISC-IV, C-JARS, and Sally-Ann task; session two involved a Unity-based eye-tracking task after 5-point calibration. Children sat ~60 cm from the eye tracker, and gaze responses to social cues were recorded. The eye-tracking task, including calibration, lasted a maximum of 15 min per participant. All assessments were completed within two weeks for consistency across participants.
2.3.1. Data Quality and Calibration
Prior to the experiment, a 5-point calibration procedure was conducted. An animated Mickey Mouse image, rather than a plain dot, was used purely as the calibration fixation target to help maintain attention during this brief technical step; the main task itself used a neutral human avatar (see
Figure 1), not Mickey Mouse. Calibration validity was automated by the Tobii Studio software. To ensure data quality did not differ systematically between groups, a strict inclusion threshold was applied: participants who failed to achieve successful calibration (e.g., due to excessive movement or physiological features like long eyelashes) were excluded from the study. Two initial candidates in the neurotypical group were excluded and replaced for this reason: one wore glasses that interfered with corneal reflection tracking, and one had unusually long, dark eyelashes that repeatedly obscured pupil detection. No participants in the autistic or dyslexia groups required replacement for calibration failure. Both replacement participants subsequently completed the WISC-IV and eye-tracking protocol without difficulty.
2.3.2. Trial Sequence
The task utilized a gaze-contingent design to ensure attentional engagement. Each trial followed a strict sequence (see
Figure 1): (1) initial contact: the trial initiated only when the participant fixated on the avatar’s face; (2) observation: a garage door opened to reveal it was empty; (3) re-establishing contact: the participant was required to look back at the avatar’s face and the avatar remained static until the participant’s gaze was detected within the face AOI; and (4) cue and response: once fixation was established, the avatar shifted gaze to a specific garage (the deceptive cue), and the system waited for the participant to select a garage by looking at it. At trial end, all doors opened for feedback. Critically, the avatar’s gaze cue was consistently, and across every trial, directed toward an incorrect garage; the cue was never a reliable indicator of the car’s true location. Successful performance therefore required the participant to detect this systematic pattern of misdirection, rather than a one-off or occasional inaccuracy, and to use this inference about the avatar’s consistent intent to guide their own garage selection. Trials were presented consecutively without a fixed inter-trial interval; however, the task was inherently self-paced, as the initiation of each new trial was contingent upon the participant re-establishing fixation on the avatar. Car location and avatar gaze were randomized.
The avatar was a static human figure rendered against a plain white background, styled with a dark top and hair tied back to minimize incidental fixation targets; it was not gendered or aged to represent a specific demographic and served only as a gaze-cue source. The face Area of Interest (AOI) was defined to cover the avatar’s eyes, nose, and forehead, sized so that a fixation anywhere within this region counted as face-directed gaze; the three garage AOIs were equally sized and positioned in the same horizontal plane to avoid location-based fixation bias. Garage selection was registered when the participant’s gaze was detected within a garage’s AOI for a sustained fixation, at which point that garage’s door opened; car location and the avatar’s gaze direction were fully randomized on every trial, and garage door color was likewise randomized to prevent color-position confounds. Fixations were classified using Tobii Studio’s built-in fixation filter setting.
2.3.3. Operationalization of Eye-Tracking Variables
Six gaze-based metrics were derived from the task. Average Joint Attention was the mean duration required for the participant to fixate on the avatar’s face at the start of each trial, from trial onset until the face AOI was fixated; shorter durations indicate faster, more efficient re-establishment of joint attention with the avatar. Average Total Trial was the mean duration per trial across the full session. Number of attempts to reach the correct answer was the total trials needed to achieve five consecutive correct selections (maximum: 100 trials). Number of views on the first shown garage was the total fixation count on the garage revealed to be empty at trial onset, an index of inhibitory control; repeated fixation on this location may also reflect exploratory behavior or a failure to retain the location’s status in working memory, and this measure should therefore be interpreted as a general index of task efficiency rather than a pure or exclusive measure of inhibitory control. Number of views on an empty garage was the total fixation count on the non-target garage. Time to reach the correct answer was the total session duration from start to criterion.
2.4. Data Analyses
All data were screened for outliers, missing values, and entry errors; extreme values were winsorized to the 95th percentile to preserve distribution. Item and total scores were checked for consistency, and standardized tests were interpreted using Turkish norms. Eye-tracking data were processed in Tobii Studio, with AOIs predefined and measures (fixation time, number, latency, trial duration) exported to Excel.
Statistical analyses were performed using IBM SPSS Statistics version 26.0 (IBM Corp., Armonk, NY, USA) and R version 4.3.0 (R Foundation for Statistical Computing, Vienna, Austria), implemented in the RStudio environment (version 2025.09.2+418). Descriptive statistics were calculated for all study variables. The normality of continuous variables was evaluated using the Shapiro–Wilk test. Between-group differences in demographic and clinical assessment variables were examined using the Kruskal–Wallis test, followed by Dunn–Bonferroni-adjusted pairwise comparisons when appropriate. Effect sizes for Kruskal–Wallis analyses were reported as epsilon squared (ε2). Because significant between-group differences were observed in chronological age and Full-Scale IQ, and not all eye-tracking variables satisfied parametric assumptions, eye-tracking outcomes were analyzed using permutation-based analysis of covariance (permutation ANCOVA) based on the Freedman–Lane permutation procedure, with chronological age and Full-Scale IQ included as covariates. Pairwise comparisons were performed using Bonferroni-adjusted estimated marginal means, and effect sizes were reported as partial eta squared (ηp2). Hypothesis-driven associations between selected eye-tracking measures and clinical assessment scores were examined separately for the ASD and dyslexia groups using Spearman’s rank-order correlation coefficient (ρ). To control for multiple testing, Holm-adjusted p values were calculated separately within each group. Statistical significance was set at p < 0.05.
3. Results
Distributional characteristics varied by variable: Average Joint Attention, Average Trial Duration, and Total Time were normally distributed across all three groups (all
p > 0.05), whereas First Empty Views, Total Trials, and Distractor Views deviated from normality in at least one group (see
Section 2.4 for the resulting analytical approach).
After statistically controlling for chronological age and Full-Scale IQ (
Table 1), significant group differences remained for Average Joint Attention (F = 9.70, permutation
p = 0.001, ηp
2 = 0.33), First Empty Views (F = 38.30, permutation
p < 0.001, ηp
2 = 0.66), Total Trials (F = 82.92, permutation
p < 0.001, ηp
2 = 0.81), Distractor Views (F = 47.42, permutation
p < 0.001, ηp
2 = 0.70), and Total Time (F = 29.04, permutation
p < 0.001, ηp
2 = 0.59). In contrast, no significant group difference was observed for Average Trial Duration after adjustment for these covariates (F = 1.84, permutation
p = 0.181). Bonferroni-adjusted pairwise comparisons indicated that the ASD group differed significantly from both the TD and dyslexia groups across all significant eye-tracking measures, whereas no significant differences were observed between the TD and dyslexia groups. Overall, these findings indicate that the observed group differences persisted after adjustment for chronological age and Full-Scale IQ. All significant group differences were associated with large effect sizes (ηp
2 = 0.33–0.81).
Clinical assessment scores differed significantly across the three groups for all measures (
Table 2). Significant between-group differences were observed for C-JARS (H(2) = 36.87,
p < 0.001, ε
2 = 0.83), Sally-Ann Task (H(2) = 31.73,
p < 0.001, ε
2 = 0.71), Full-Scale IQ (H(2) = 21.15,
p < 0.001, ε
2 = 0.46), Working Memory Index (H(2) = 25.99,
p < 0.001, ε
2 = 0.57), and Processing Speed Index (H(2) = 20.60,
p < 0.001, ε
2 = 0.44). According to conventional benchmarks for epsilon squared, all observed group differences were associated with large effect sizes (all ε
2 > 0.26). Dunn–Bonferroni-adjusted pairwise comparisons indicated that the TD group obtained significantly higher scores than both the ASD and dyslexia groups on Full-Scale IQ, Working Memory Index, and Processing Speed Index. For C-JARS, all pairwise comparisons were significant, with the TD group showing the highest scores, followed by the dyslexia group, and the ASD group showing the lowest scores. For the Sally-Ann Task, both the TD and dyslexia groups outperformed the ASD group, whereas no significant difference was observed between the TD and dyslexia groups.
Spearman rank-order correlation analyses were conducted separately for the ASD and dyslexia groups to examine the pre-specified associations between selected eye-tracking measures and clinical assessment scores (
Table 3). To reduce the risk of Type I error, Holm-adjusted
p values were calculated separately within each group. In the ASD group, a strong negative correlation was observed between Total Trials and Sally-Ann Task performance (
ρ = −0.83, Holm-adjusted
p < 0.001), indicating that participants who required a greater number of trials to reach the correct response tended to obtain lower scores on the Sally-Ann Task. None of the remaining correlations reached statistical significance after Holm correction. In the dyslexia group, none of the pre-specified associations remained statistically significant after adjustment for multiple comparisons, although a moderate negative association between First Empty Views and Working Memory Index was observed before correction (
ρ = −0.60, unadjusted
p = 0.018; Holm-adjusted
p = 0.089). Overall, these findings indicate that statistically reliable associations between eye-tracking and clinical assessment measures were limited, with only the relationship between Total Trials and Sally-Ann Task performance remaining statistically reliable after correction for multiple testing.
4. Discussion
4.1. Group Differences in Gaze-Based Task Engagement
Significant group differences were observed across all six eye-tracking metrics. However, because chronological age and Full-Scale IQ also differed significantly between groups, all metrics were re-examined using permutation-based ANCOVA controlling for these two variables. After this adjustment, significant group differences remained for five of the six metrics, all with large effect sizes (partial η2 = 0.33–0.81); only Average Trial Duration no longer differed significantly between groups once age and IQ were accounted for. The neurotypical group demonstrated the most efficient performance, characterized by rapid joint attention, fewer attempts, minimal fixation on non-target stimuli, and shorter task duration. The autistic group showed the highest values across all metrics associated with processing difficulty; critically, this pattern persisted even after statistically controlling for the group differences in chronological age and Full-Scale IQ, indicating that the ASD group’s difficulty on this paradigm is not simply attributable to these confounds. Bonferroni-adjusted pairwise comparisons indicated that the ASD group differed significantly from both the neurotypical and dyslexia groups on all five significant metrics, whereas the neurotypical and dyslexia groups did not differ significantly from each other on any metric. The dyslexia group’s values were therefore numerically intermediate on most metrics, but this intermediate position did not reach statistical significance relative to the neurotypical group.
All children in both clinical groups eventually reached criterion and completed the task. The higher attempt counts therefore reflect an extended but successful learning trajectory, not failure. A fixed-trial protocol would have cut many of these children off before they reached a solution. The self-paced structure made this adaptive engagement visible in a way that conventional instruments cannot (
Stallworthy et al., 2021). Children in the autistic group also tended to explore the scene more broadly before selecting a target, rather than following the avatar’s gaze directly, a strategy that carried a higher processing cost but ultimately led to the correct response and one that may reflect an adaptive perceptual approach rather than a deficit: atypical visual attention patterns in autism, including reduced or delayed orienting to socially salient targets, have been theorized as adaptive strategies in complex or unpredictable environments (
Chilà et al., 2026;
Jording et al., 2024). Viewed this way, the broader scanning observed here may represent a valid alternative strategy for building situational understanding before committing to a response, rather than a marker of impairment alone.
The numerically intermediate, but not statistically distinct, profile of the dyslexia group is nonetheless worth theoretical comment. Dyslexia is primarily associated with phonological processing and reading difficulties, and children in this group showed only slightly elevated fixation on non-target areas, attempts, and task durations relative to neurotypical peers on this non-reading, visual–social task, a difference that did not reach statistical significance once age and IQ were controlled for. This suggests that the visual-attention and executive demands of the present paradigm, integrating a dynamic social gaze cue, suppressing attention to a distractor location, and updating a response strategy across trials, were not, on their own, sufficient to reliably distinguish the dyslexia group from neurotypical peers in this sample, in contrast to our original expectation. This null finding is itself informative and consistent with the broader literature indicating that visual-attention and executive-function differences in dyslexia are typically more subtle and variable than the social–cognitive differences seen in autism (
J. Liu et al., 2023;
Özyurt et al., 2024;
Taran et al., 2022;
Valdois, 2022).
Across groups, the implicit game-based structure of the paradigm made processing differences visible without requiring explicit verbal responses. Neurotypical children integrated the avatar’s gaze cue efficiently, consistent with coordinated joint attention in typical development. For autistic children, eye-tracking metrics revealed social–cognitive patterns that would not be apparent from outcome scores alone and that remained significant even after adjusting for age and IQ (
Chien et al., 2023;
L. Liu et al., 2024;
Swanson & Siller, 2013).
4.2. Associations Between Gaze-Based Metrics and Standardized Assessments
Based on the pattern of group differences reported above, five theoretically motivated, hypothesis-driven correlations were specified a priori between eye-tracking metrics and standardized clinical measures, examined separately in the ASD and dyslexia groups; ceiling effects in the neurotypical group precluded meaningful correlational analysis in that group.
In the ASD group, a strong negative correlation was observed between Total Trials and Sally-Ann Task performance (ρ = −0.83, Holm-adjusted
p < 0.001), indicating that autistic children who required more attempts to reach criterion tended to score lower on the Sally-Ann Task, consistent with evidence linking implicit task performance to explicit theory-of-mind ability in autism (
De Belen et al., 2023;
Lu et al., 2024). None of the remaining pre-specified associations, including those involving C-JARS, the Working Memory Index, or the Processing Speed Index, reached statistical significance after correction for multiple comparisons.
In the dyslexia group, none of the five pre-specified associations remained statistically significant after Holm correction. A moderate negative association between First Empty Views and the Working Memory Index was observed before correction (ρ = −0.60, unadjusted
p = 0.018) but did not survive Holm adjustment (
p = 0.089) and is therefore not interpreted as a reliable association, despite prior evidence linking working memory to executive and attentional demands in dyslexia (
Taran et al., 2022).
4.3. Implications for Inclusive Educational Assessment
Traditional assessments yield a single outcome score at a fixed point in time, with little information about how a child attended, responded to cues, or adapted across trials. The present paradigm captured this process dimension by recording continuous gaze data across repeated trials, connecting with dynamic assessment approaches that prioritize learning trajectories over single performance snapshots (
Gomez et al., 2023;
Stallworthy et al., 2021).
The digital avatar served a specific function here. For autistic children, interaction with an unfamiliar examiner can introduce social anxiety that obscures cognitive capacity. By replacing the examiner with an avatar, the task reduced this pressure while preserving the joint attention demands central to the paradigm. The game-based format similarly reduced reliance on verbal responses, lowering participation barriers for children who struggle in traditional assessment contexts. In the future, the task structure could also be adapted for intervention, for instance by adjusting trial pacing or cue timing to target specific attentional processes (
Azizah et al., 2026;
Chien et al., 2023;
Jording et al., 2024).
The extended exploration seen in the autistic group, who required more attempts and longer task durations than the other two groups even after adjustment for age and IQ, suggests these children in particular need time and repetition to build their understanding of the task. Future feedback mechanisms should therefore be adaptive rather than immediately corrective, consistent with scaffolding principles in educational technology (
Rodríguez-Ferrer et al., 2023).
These design choices are also consistent with UDL principles shown in empirical work with autistic students to support engagement and participation (
Barrera Ciurana & Moliner García, 2024;
Tīģere et al., 2025): specifically, Multiple Means of Representation (non-verbal gaze cues in place of spoken instruction) and Multiple Means of Action and Expression (gaze-only responding). Similarly structured, self-paced, gaze- or selection-based tasks could therefore be incorporated into classroom-based assessment activities more broadly. For example, gaze data showing a child needs repeated exposure to a visual cue before responding could prompt a teacher to increase the salience or repetition of that cue during instruction; a longer time-to-criterion could inform adjustments to task pacing, allowing more processing time before introducing the next step; and frequent fixation on distractor locations could signal a need to reduce distractor load in the immediate learning environment or to build in more explicit, immediate feedback during practice.
4.4. Accessibility, Implementation Feasibility, and Technical Considerations
The development of the present paradigm illustrates some of the practical challenges associated with deploying eye-tracking technology in clinical and educational contexts. The gaze-contingent task was built using the Unity 3D game engine integrated with the Tobii TX300 eye tracker and required iterative development across ten successive versions before a stable task structure was achieved. Technical issues encountered across development cycles included non-random trial sequencing, gaze-response latency, software incompatibilities following firmware updates, and unintended variation in visual stimuli. Each required targeted re-engineering in collaboration with a software engineer. The hardware requirements of the paradigm, including a high-specification eye tracker, controlled lighting, and a soundproofed assessment room, also represent practical barriers to school-based implementation at scale. Calibration presented an additional difficulty, as two participants could not be successfully calibrated and had to be replaced; children with more pronounced sensory or motor profiles may face comparable challenges.
Beyond hardware and calibration constraints, the broader implementation of eye-tracking tools in educational settings raises questions of digital equity and data privacy. Access to high-specification equipment is unlikely to be uniform across schools with different resource levels, which may limit equitable uptake. Additionally, the collection of continuous gaze data from children requires clear informed consent procedures, transparent data governance, and adherence to child data protection frameworks. These considerations are reported to support reproducibility and inform future implementations in inclusive educational settings.
4.5. Limitations
The findings should be interpreted considering several constraints. The sample of 15 participants per group was relatively small, limiting statistical power and generalizability. Therefore, results should be considered preliminary pending replication in larger and more diverse samples.
The three groups were not fully matched on chronological age or Full-Scale IQ, and both differed significantly between groups. To address this, all eye-tracking outcomes were re-analyzed controlling for age and IQ; significant group differences persisted for five of the six measures with large effect sizes, indicating the effects were not simply attributable to age or IQ. Although this statistical control strengthens confidence in the observed group differences, residual confounding cannot be fully excluded given the small, non-matched sample, and these findings should therefore be interpreted cautiously and treated as preliminary rather than definitive; future studies should consider age- and IQ-matched recruitment with larger samples. Relatedly, both the exclusion of 15 children whose WISC-IV scores fell below the IQ cutoff and the inclusion criterion requiring the absence of additional neurological or developmental impairments mean the ASD sample does not reflect the substantial proportion of autistic children with co-occurring conditions (e.g., ADHD, anxiety, intellectual disability); the present findings should therefore be generalized only to autistic children without such co-occurring conditions. The Sally-Ann Task showed ceiling performance in the TD group, limiting variability in theory of mind scores; future research may consider more sensitive instruments such as second-order false-belief tasks or the Strange Stories Test.
The psychometric stability of the gaze-based metrics has not yet been established. Classical test–retest and split-half approaches are not well suited to this paradigm given its criterion-based, learning-dependent design; future work could consider generalizability-theory or parallel-forms approaches instead. Finally, the study was conducted within a specific clinical and cultural context in Turkey; replication in other settings will be necessary to evaluate generalizability.
5. Conclusions
This exploratory study investigated whether a game-based, gaze-contingent eye-tracking paradigm could yield process-level indicators relevant to inclusive educational assessment. Significant group differences emerged across five of the six gaze-based metrics after statistically controlling for chronological age and Full-Scale IQ, with large effect sizes throughout; these differences were driven primarily by the autistic group, which differed significantly from both the neurotypical and dyslexia groups on nearly every metric, while the neurotypical and dyslexia groups did not differ significantly from each other. Correlational analyses, using a small set of pre-specified, Holm-corrected hypotheses, identified one statistically robust association: task efficiency in the autistic group showed a behavioral correlate of theory of mind, linked to an independent, standardized theory-of-mind measure rather than reflecting direct assessment by the paradigm itself. This finding offers preliminary support for the paradigm’s relevance to social–cognitive functioning in autism specifically, but the present data do not support broader claims of distinct, clearly dissociated cognitive profiles across the autistic and dyslexia groups and should be interpreted as a narrow, preliminary indication rather than a confirmed pattern.
The paradigm’s implicit structure, self-paced design, and avatar-mediated context are broadly consistent with Universal Design for Learning principles. Given the small sample and exploratory design, however, these findings should be treated as preliminary. Replication in larger, age- and IQ-matched samples, evaluation of the paradigm’s psychometric stability through designs suited to its learning-dependent structure, and feasibility testing in real school contexts are needed before any conclusions about educational utility can be drawn.