1. Introduction
Dropout is still an ongoing and expensive problem for post-compulsory education systems globally, with implications not only for individual educational biographies but also for institutional efficiency, equity, and economy (
Androulakis et al., 2020,
2021;
Tinto, 1975,
2022). Dropout is not an act but a result of an ongoing and complex process, during which academic, personal, social, institutional, and economic elements intertwine (
Pusztai et al., 2022;
Samoila & Vrabie, 2023). Recent scholarship is generally consistent with the position that preventing dropout requires an interest in students’ experiences and the processes by which risks are accumulated prior to an individual’s withdrawal from an institution turning irreversible (
Bulotaitė et al., 2024;
Perkmann et al., 2021;
Tinto, 1975).
This framing builds on a long-standing body of highly cited retention and attrition theory. Early sociological and organizational models conceptualized dropout as a process shaped by academic performance, social integration, institutional fit, background characteristics, and external commitments rather than as a single academic failure event (
Bean, 1980;
Bean & Metzner, 1985;
Spady, 1970;
Tinto, 1993,
2006). These foundational works remain important because they established the multidimensional logic that continues to guide contemporary studies of dropout risk, persistence, and student support.
Within this area, academic engagement has emerged as a key construct explaining persistence. Theories of integration and involvement propose that students who invest their time, effort, and psychological resources into academic and social activities and feel a sense of institutional membership are more likely to persist (
Astin, 1999;
Metz, 2004;
Samoila & Vrabie, 2023). This perspective is also consistent with the student-engagement tradition, in which students’ time, effort, and participation in educationally purposeful activities are treated as central indicators of learning quality, institutional effectiveness, and persistence (
Kuh, 2001,
2003;
Pascarella & Terenzini, 2005).
Research on academic engagement refined and extended this view by defining academic engagement as a multidimensional construct that includes behavior, feelings, and cognitions (
Fredricks et al., 2004). Summaries further highlight that academic engagement is influenced by motivation, student–faculty interaction, institutional support, and participation (
E. Kahu et al., 2015;
Zepke & Leach, 2010). Empirical research indicates that low academic engagement is consistently linked to strong intentions to dropout and weaker outcomes (
López-Angulo et al., 2023;
Truta et al., 2018).
The association between engagement and dropout is inconsistent. Studies show that vigor, dedication, and absorption vary inconsistently among at-risk students, suggesting that engagement may function differently at various levels of vulnerability (
Truta et al., 2018). Other studies emphasize engagement as a mediator linking social integration, satisfaction, or self-regulated learning to dropout intention, positioning engagement as a proximal mechanism rather than a distal outcome (
Bernardo et al., 2022;
Galve-González et al., 2024). Psychosocial frameworks demonstrate that emotions, wellbeing, and perceptions of fairness or support can initiate upward or downward engagement spirals that precede withdrawal (
E. R. Kahu, 2013;
E. R. Kahu & Nelson, 2018). These findings emphasize the significance of engagement while exposing conceptual and measurement uncertainties.
In parallel studies, dropout is increasingly framed as a multifaceted risk profile. Research shows institutional practices, social integration, financial strain, and social background often have effects that are on par with or more potent than academic difficulty alone (
Androulakis et al., 2020,
2021;
Tinto, 1975,
2022). The prediction of dropout intention is dominated by psychological, academic, and social integration factors, as confirmed by systematic reviews. However, these reviews also highlight the heterogeneity of measures and models, which limits comparability and practical translation (
Fredricks et al., 2004;
Perkmann et al., 2021;
Samoila & Vrabie, 2023;
Véliz Palomino & Ortega, 2023). Relying on composite scores and traditional reliability indices, which mask how well instruments perform across risk levels, is a persistent drawback.
A central limitation in the student dropout literature is not simply the absence of predictors, but the limited psychometric precision with which engagement and dropout risk are typically assessed. This study is an effort to address these gaps by using Item Response Theory (
Embretson, 2000;
Krabbe, 2017) to combine academic engagement and dropout propensity into one psychometric framework (
Lerdpornkulrat et al., 2018;
Sharkness & DeAngelo, 2011). This study transcends global composites by integrating the UWES-9 (
Schaufeli et al., 2006), which assesses vigor, dedication, and absorption, with the multidimensional APrISE-15 (
Modiati et al., 2026), thereby investigating the contexts and populations for which these measures exhibit optimal precision (
Tinto, 2022). Although prior research has identified academic, social, institutional, and psychological correlates of persistence, the field still relies heavily on composite scores and classical test theory approaches that assume uniform measurement precision across the latent trait continuum. This is a substantial limitation because dropout risk is rarely distributed evenly: institutions are especially concerned with students located near critical vulnerability thresholds, where screening accuracy and differentiation matter most. As a result, existing studies often clarify whether engagement and dropout are related, but provide less evidence about how well commonly used instruments distinguish among students at different levels of risk, where they are most informative, and whether they are equally useful for early identification purposes.
The present study addresses this gap by applying an Item Response Theory framework to the joint examination of academic engagement and dropout propensity. Specifically, it integrates the UWES-9, which captures vigor, dedication, and absorption, with the multidimensional APrISE-15 in order to evaluate item discrimination (
Modiati et al., 2026), category thresholds, and test information across the underlying continuum. Empirically, the study draws on a university-wide sample of 3099 students from the University of Patras, covering 31 departments and multiple areas of study rather than a single course, programme, or disciplinary field. In doing so, the study moves beyond average-score comparisons and offers a more diagnostically informative account of how these constructs operate psychometrically. Its contribution is therefore both methodological and practical: methodologically, it demonstrates the value of IRT for refining higher education risk assessment; practically, it provides evidence on the precision and screening utility of two widely relevant instruments, thereby informing early-warning systems and more targeted student-support interventions within university settings.
3. Research Methodology
3.1. Why Item Response Theory and the Graded Response Model Matter for Diagnostic Screening
Although classical test theory (CTT) remains widely used in the measurement of engagement and dropout, its main limitation for diagnostic screening is that reliability is usually treated as a global property of a total score, for example through Cronbach’s alpha. This limits the ability to determine whether a scale is equally precise for students at low, moderate, or elevated levels of engagement and dropout propensity. Item Response Theory (IRT) addresses this limitation by modelling responses at the item level and estimating where items and scales provide the greatest information along the latent continuum. Foundational IRT sources emphasize that item parameters and information functions allow researchers to assess conditional precision, optimize item sets, and interpret scores in ways that are directly relevant to screening and early-warning assessment (
De Ayala, n.d.;
De Ayala, 2022;
Embretson, 2000).
Because the present study uses ordered Likert-type responses, the graded response model (GRM) was selected as the main IRT framework. The GRM, originally developed by
Samejima (
1969), estimates item discrimination and category thresholds, making it possible to identify which items distinguish students most clearly and at which levels of the latent trait they are most informative. This is particularly relevant for early-warning assessment, where the central issue is not only whether engagement and dropout scores are related but also whether the instruments provide sufficient precision in the regions of the continuum where risk identification is most important.
Prior higher education research supports this approach. IRT-based studies of student engagement and dropout-related measures show that item-level modelling can reveal differences in scale precision that are not visible through global reliability indices or observed-score composites alone (
Carle et al., 2009;
Sharkness & DeAngelo, 2011;
Schmitt et al., 2021;
Yupanqui-Lorenzo et al., 2024). Methodological work further emphasizes the importance of considering ordinal response structure, model assumptions, and possible conditional dependence when applying GRM-type models to Likert-scale psychological and educational data (
De Carolis et al., 2025;
Ferrando, 1999). Accordingly, the present study uses GRM-based item parameters and information functions to evaluate whether the UWES-9 and APrISE-15 provide diagnostically useful information across the engagement–dropout risk continuum. The specific contribution of each methodological source to the rationale and structure of the study is summarized in
Table 1.
3.2. Study Design and Participants
This study used a cross-sectional, questionnaire-based design to examine academic engagement and dropout propensity among university students. Data were collected in person at the University of Patras, Greece, between November and December 2023 using the APrISE-15 Dropout Tool and the UWES-9 engagement scale. A total of 3099 students completed the survey. Missing data at the item level were minimal, resulting in only slight variation in valid case numbers across the main study composites, with approximately 3090 to 3100 responses available for the principal analyses.
The sample was university-wide rather than restricted to a specific course, programme, or department. It included students from 31 departments of the University of Patras, covering multiple areas of study across the institution. Women constituted the majority of the sample (57.3%), whereas men accounted for 42.7%. Participants were drawn from first year through extended-study status, with first-year students forming the largest subgroup (42.5%). Students were represented across different years of study: 11.1% were in the second year, 23.2% in the third year, 15.6% in the fourth year, 2.9% in the fifth year, and 4.7% in a later year of study. Most students had completed high school in a different region from the one in which they attended university, indicating substantial geographic mobility within the sample. Overall, the sample provided wide disciplinary and demographic coverage for examining the focal constructs of engagement and dropout risk.
3.3. Measures
Student engagement (UWES-S/UWES-9S). Student engagement was assessed with the 9-item student version of the Utrecht Work Engagement Scale (UWES-S; short form often referred to as UWES-9S). The student version reformulates the original work-related items for the context of university studies. Items are rated on a 7-point frequency scale ranging from 0 (never) to 6 (always). The scale comprises three 3-item subscales: Vigor, Dedication, and Absorption.
Dropout tendency (APrISE-15 Dropout Tool). Dropout tendency was assessed with the APrISE-15 Dropout Tool. The instrument includes 15 items rated on a 7-point scale from 1 (completely disagree) to 7 (completely agree). It comprises five subscales: Academic, Personal, Institutional, Social, and Economic. Each subscale includes three items. Thirteen items are positively worded; for example, items referring to satisfaction with academic level or the adequacy of university support. These items were reverse-coded so that higher values consistently indicated greater dropout tendency. The only exceptions were Personal item 1, which captures disappointment with studies, and Personal item 2, which captures considering dropout due to exhaustion, because these items are negative by nature and therefore did not require reverse coding.
The complete questionnaire materials, including the UWES-9 and APrISE-15 instruments used in the study, are available as supplemental materials in the project GitHub repository.
4. Data Analysis
4.1. Data Preparation and Missing Data Handling
Item responses were first examined for completeness and scored in accordance with the instrument guidelines. Missing data were minimal and occurred mainly at the item level rather than as systematic non-response across the questionnaire. Therefore, the full dataset of 3099 respondents was retained, and exclusions were applied only at the level of specific analyses requiring complete information for the relevant scale or composite.
For IRT-derived composites, participants were excluded only when they had missing values in one or more items contributing to the specific latent score being estimated. This analysis-specific listwise approach was used because IRT-based domain scores require complete information for the relevant item set to ensure comparable score estimation across respondents. As a result, the effective sample size varied only slightly across analyses, with approximately 3090 to 3100 valid responses available for the principal composites.
For correlational analyses, pairwise complete observations were used so that each association was estimated using the maximum available number of valid cases for the two variables involved. This approach avoided unnecessary deletion of participants from unrelated analyses while maintaining complete data for each reported association. Given the very low level of missingness, this procedure was considered unlikely to bias the substantive conclusions and enabled the largest possible amount of available information to be retained.
The IRT-derived scores were used primarily to support psychometric interpretation, item-information analysis, and domain-level screening interpretation. The correlation analyses were therefore treated as descriptive and robustness-oriented evidence of association rather than as a full latent structural model of the mechanisms linking engagement to dropout propensity.
4.2. Scoring Approach
Two parallel scoring methodologies were employed: (a) IRT-based factor analytic scoring (primary) and (b) standard observed-score composites (robustness check).
To venture beyond classical test theory summaries (like Cronbach’s alpha (
Tavakol & Dennick, 2011)) and to inquire into measurement accuracy across the latent continuum, we used an item response theory (IRT) method that works for ordered Likert-type responses. Subscales were estimated utilizing a graded response model (GRM), executed in R (package psych (
Revelle, 2011)), which facilitates the examination of item and test precision based on respondents’ latent trait levels (θ), rather than depending exclusively on observed-score averages.
The primary method of scoring was IRT-based factor analysis. The engagement subscales (Vigor, Dedication, Absorption) and the dropout subscales (Academic, Personal, Institutional, Social, Economic) were each modeled as separate one-factor scales with three items per subscale. We utilized the standard normal cumulative distribution function to turn the latent person scores (θ) for each subscale into a 0–100 metric that could be understood:
IRT score = 100 × Φ(θ). Scores were rounded at the subscale level to facilitate interpretation. Composite indices were then computed as the mean of subscale scores:
Engagement.irt = mean(Absorption.irt, Dedication.irt, Vigor.irt);
Dropout.irt = mean(Academic.irt, Personal.irt, Institutional.irt, Social.irt, Economic.irt).
Descriptive cutoffs were used to summarize the tails of each distribution on the 0–100 metric: low engagement was defined as <25, and high dropout tendency as >75.
Standard Observed-Score Composites (Robustness)
To assess robustness to scoring methodology, conventional composite scores were calculated based on the original response metrics. For the UWES-9, the mean of the three items for each engagement facet was computed to determine the engagement score for that facet. The mean of the three facets (or the mean of all nine items) was employed to identify the overall engagement score. For Aprise-15, the aforementioned reverse-coding rule was utilized, subscale means were calculated (three items each), and the overall dropout tendency was determined as the mean of the five subscales. We used these observed-score composites to check the core Dropout–Engagement relationship against the IRT-based results.
4.3. Primary Inferential Analysis and Robustness Checks
Descriptive statistics (mean, standard deviation, median, interquartile range, skewness, and kurtosis) were calculated for each IRT-derived composite and subscale. The percentage of respondents in the lower tail for engagement (<25) and the upper tail for dropout (>75) on the 0–100 scale was also used to summarize distributions. For assistance in interpretation and robustness reporting, parallel descriptive statistics (means and standard deviations) were calculated for the standard observed-score composites.
The primary analysis used Pearson product-moment correlations (
Humphreys et al., 2019;
Rupinski & Dunlap, 1996) between the IRT-based composites and subscales to investigate the relationship between dropout tendency and engagement. The primary findings concentrated on (a) the overall relationship between Dropout.irt and Engagement.irt and (b) the pattern of relationships between each engagement facet (Vigor, Dedication, Absorption) and each dropout subscale (Academic, Personal, Institutional, Social, Economic). Two-tailed tests with α = 0.05 were used to assess statistical significance; given the large sample size, effect size magnitude and pattern consistency across facets were prioritized over statistical significance alone. For descriptive interpretation, absolute Pearson correlation coefficients were classified as negligible when |r| < 0.10, weak when 0.10 ≤ |r| < 0.30, moderate when 0.30 ≤ |r| < 0.50, and strong when |r| ≥ 0.50.
The core Dropout–Engagement correlation determined via IRT-based composites was compared to the corresponding correlation calculated using standard observed-score composites as a sensitivity analysis. The conclusion that the dropout–engagement relationship was independent of the scoring method (IRT-based latent scoring vs. equally weighted observed-score averaging) was supported by robustness, which was deduced when the two estimates displayed the same direction and comparable magnitude.
5. Results
5.1. Engagement
5.1.1. Composite Scoring and Overall Engagement IRT Scoring
IRT-based factor analytic scoring was used to estimate the three UWES-9 engagement subscales: Absorption, Dedication, and Vigor. Person scores (θ) from the subscale models were transformed to a 0–100 metric using the normal cumulative distribution function (IRT score = 100 × Φ[θ]). The overall engagement index was then calculated as the mean of the three transformed subscale scores (Engagement.irt = mean of Absorption.irt, Dedication.irt, and Vigor.irt). Participants with missing values in any component required for a given composite were excluded only from that specific composite calculation.
Table 2 summarizes the descriptive profile of the engagement IRT scores. The overall Engagement.irt score was centered close to the midpoint of the 0–100 scale (M = 50.02, SD = 33.23; median = 49.33), with substantial variability across students (IQR = 61.67). The distribution was approximately symmetric (skew = −0.01) and platykurtic (kurtosis = −1.37), indicating broad dispersion rather than concentration around a narrow range of engagement. Using a low-score threshold of <25, 29.58% of respondents were classified in the lower engagement range.
At the subscale level, Absorption, Dedication, and Vigor were also centered near the midpoint of the scale, with means ranging from 49.24 to 50.80 and wide interquartile ranges. The proportion of students below the low-score threshold was 35.42% for Absorption, 35.98% for Dedication, and 38.35% for Vigor. Thus,
Table 2 indicates that the engagement scores were broadly distributed across the student sample, while
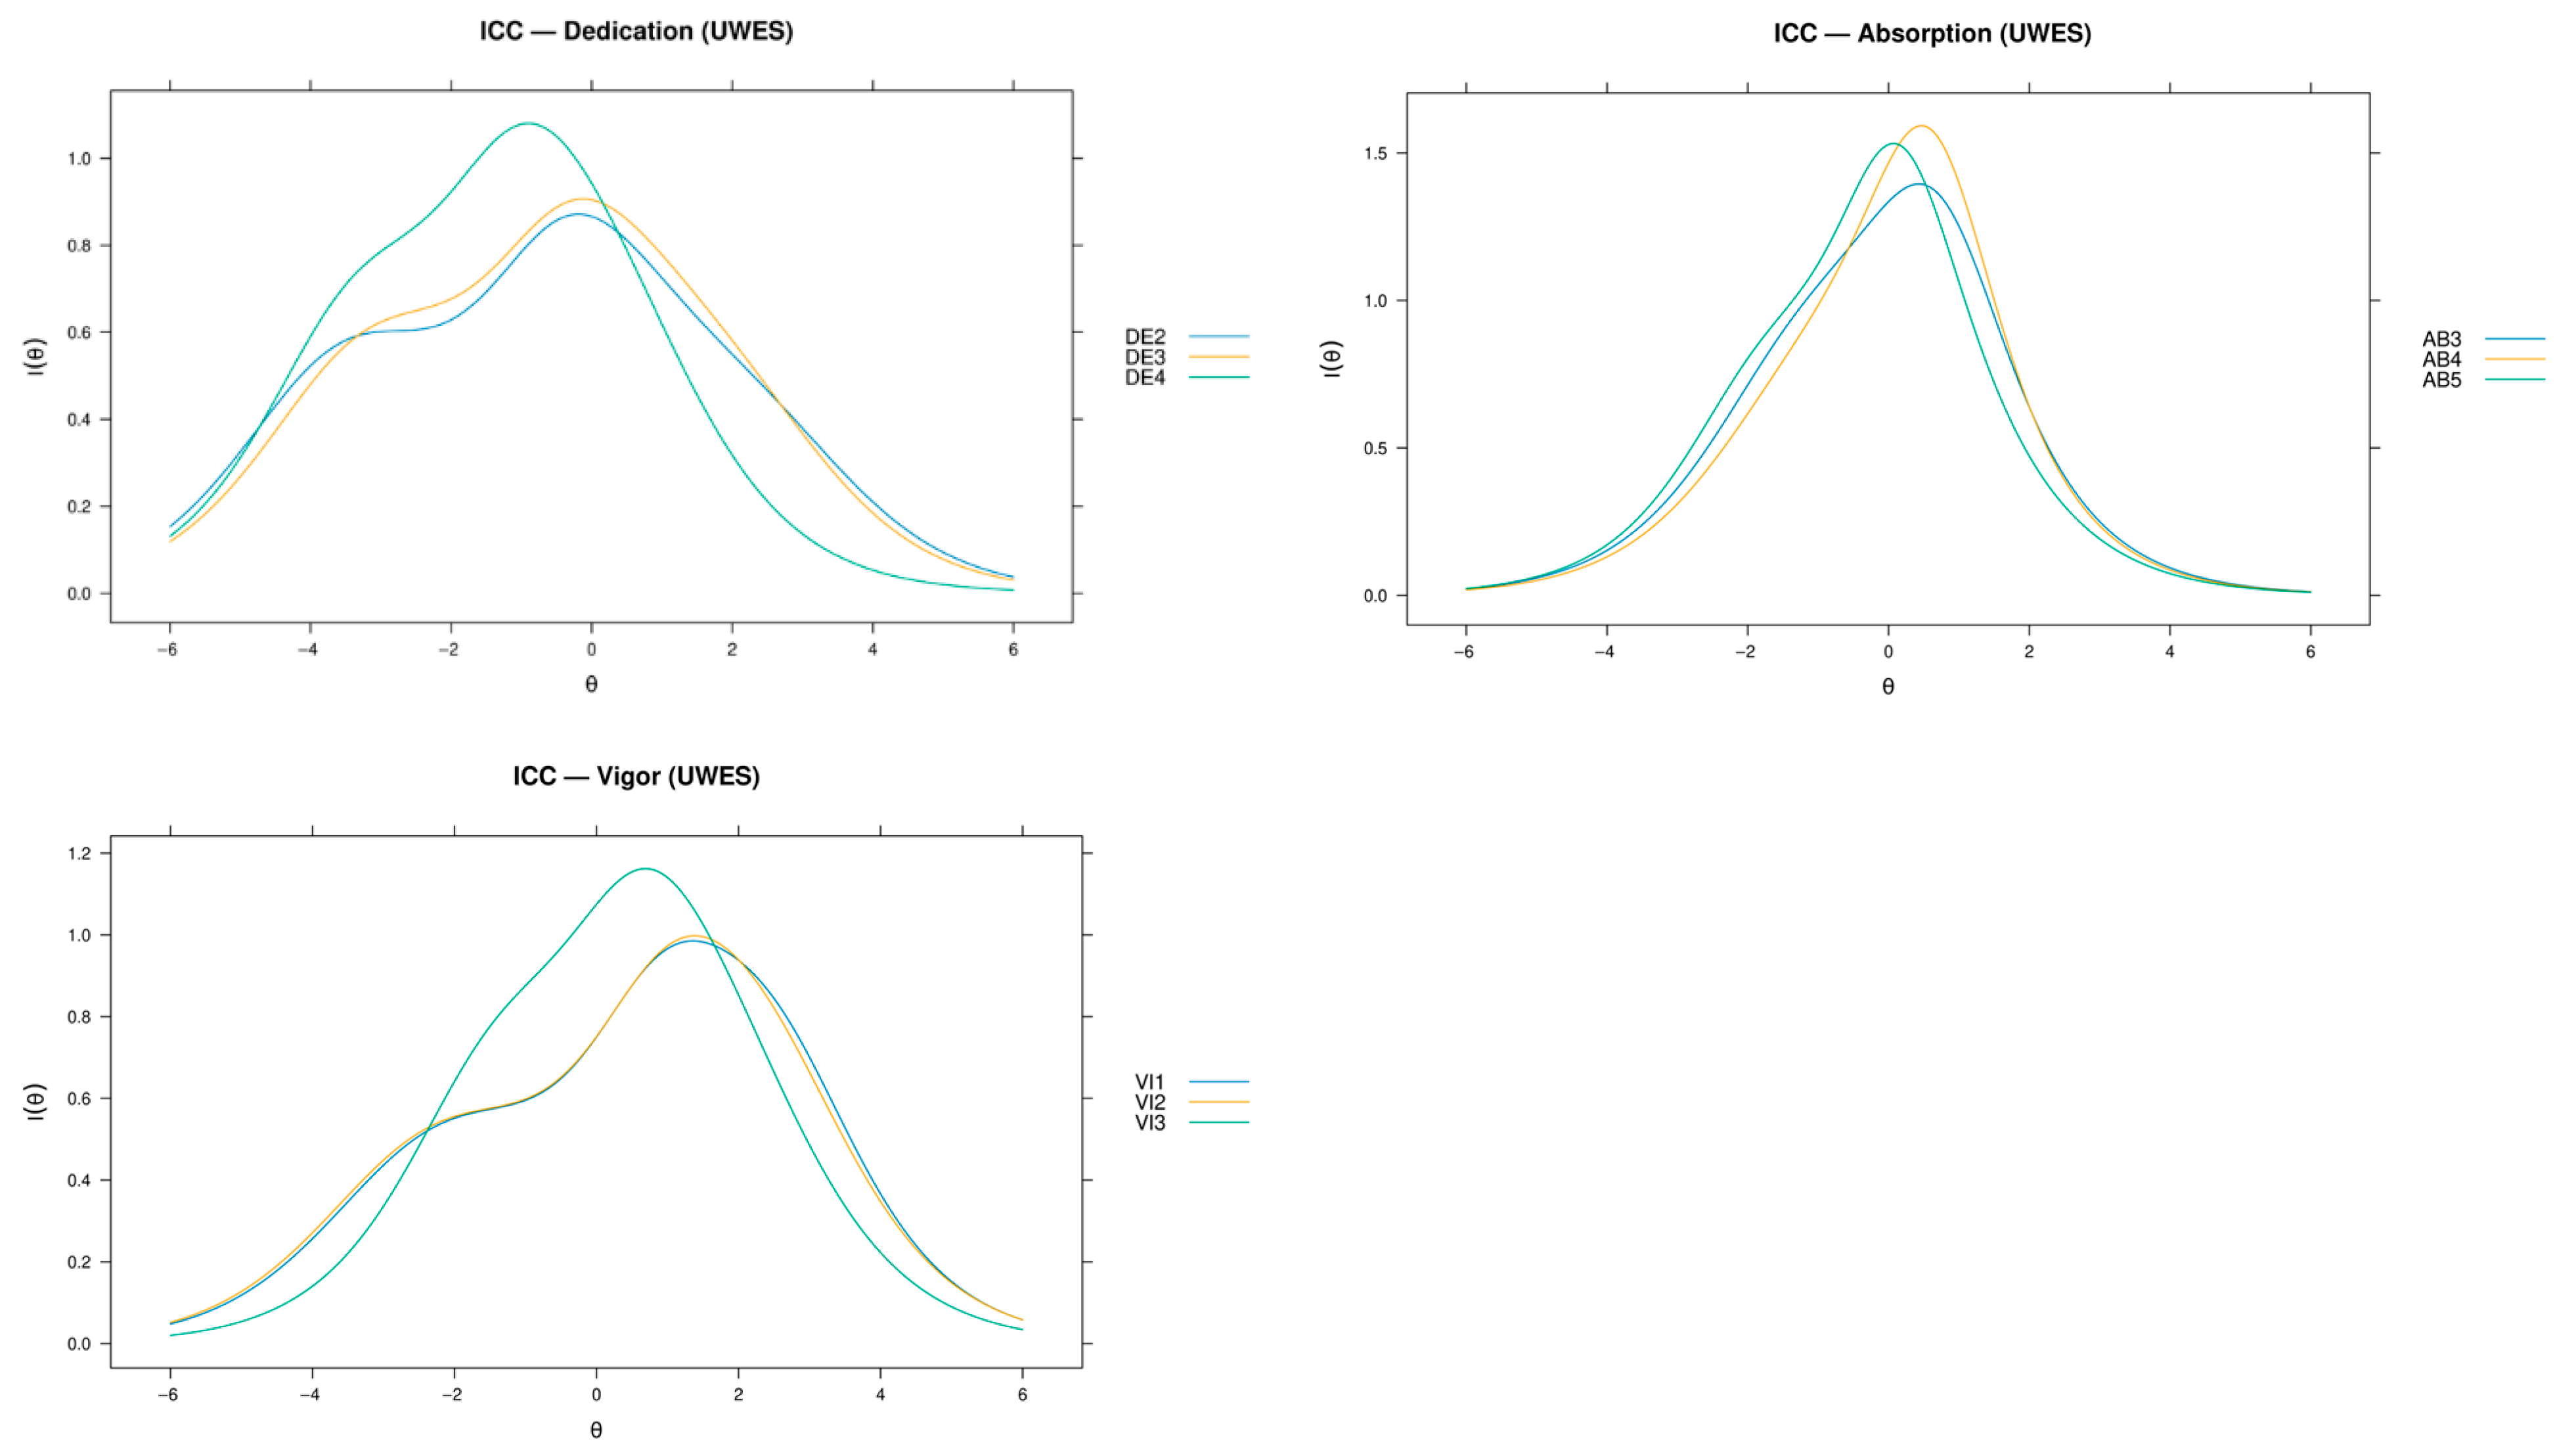
Figure 1 summarizes the item-level information patterns for the UWES-9 engagement subscales.
5.1.2. Item Information Localization for UWES-9
Item parameter patterns indicated that the three engagement facets were measured most accurately near the center of the latent continuum (
Table 3). This is in line with a scale that is best at identifying meaningful differences in the “typical” student range, not just extreme engagement. In Vigor, the morning-energy indicator (VI2) had the highest discrimination (a = 3.08) and the strongest reliability for the facet (Max reliability ≈ 0.73). The information was mostly about average to moderately high engagement (θ ≈ 0 to +2), which means that VI2 is the most sensitive marker of positive activation and persistence. The inspiration item (DE2) in Dedication gave the clearest signal (a = 2.11; Max reliability ≈ 0.76), with the most information coming in just below the mean (θ ≈ −1 to 0). Thus, dedication is measured most accurately in the range where students start to move from low meaning/enthusiasm to more positive commitment. The “being fully absorbed” indicator (AB5) within Absorption provided the most information (a = 2.02; Max reliability ≈ 0.71), peaking near θ ≈ 0. This suggests that absorption is best measured at levels that are typical of the general student population.
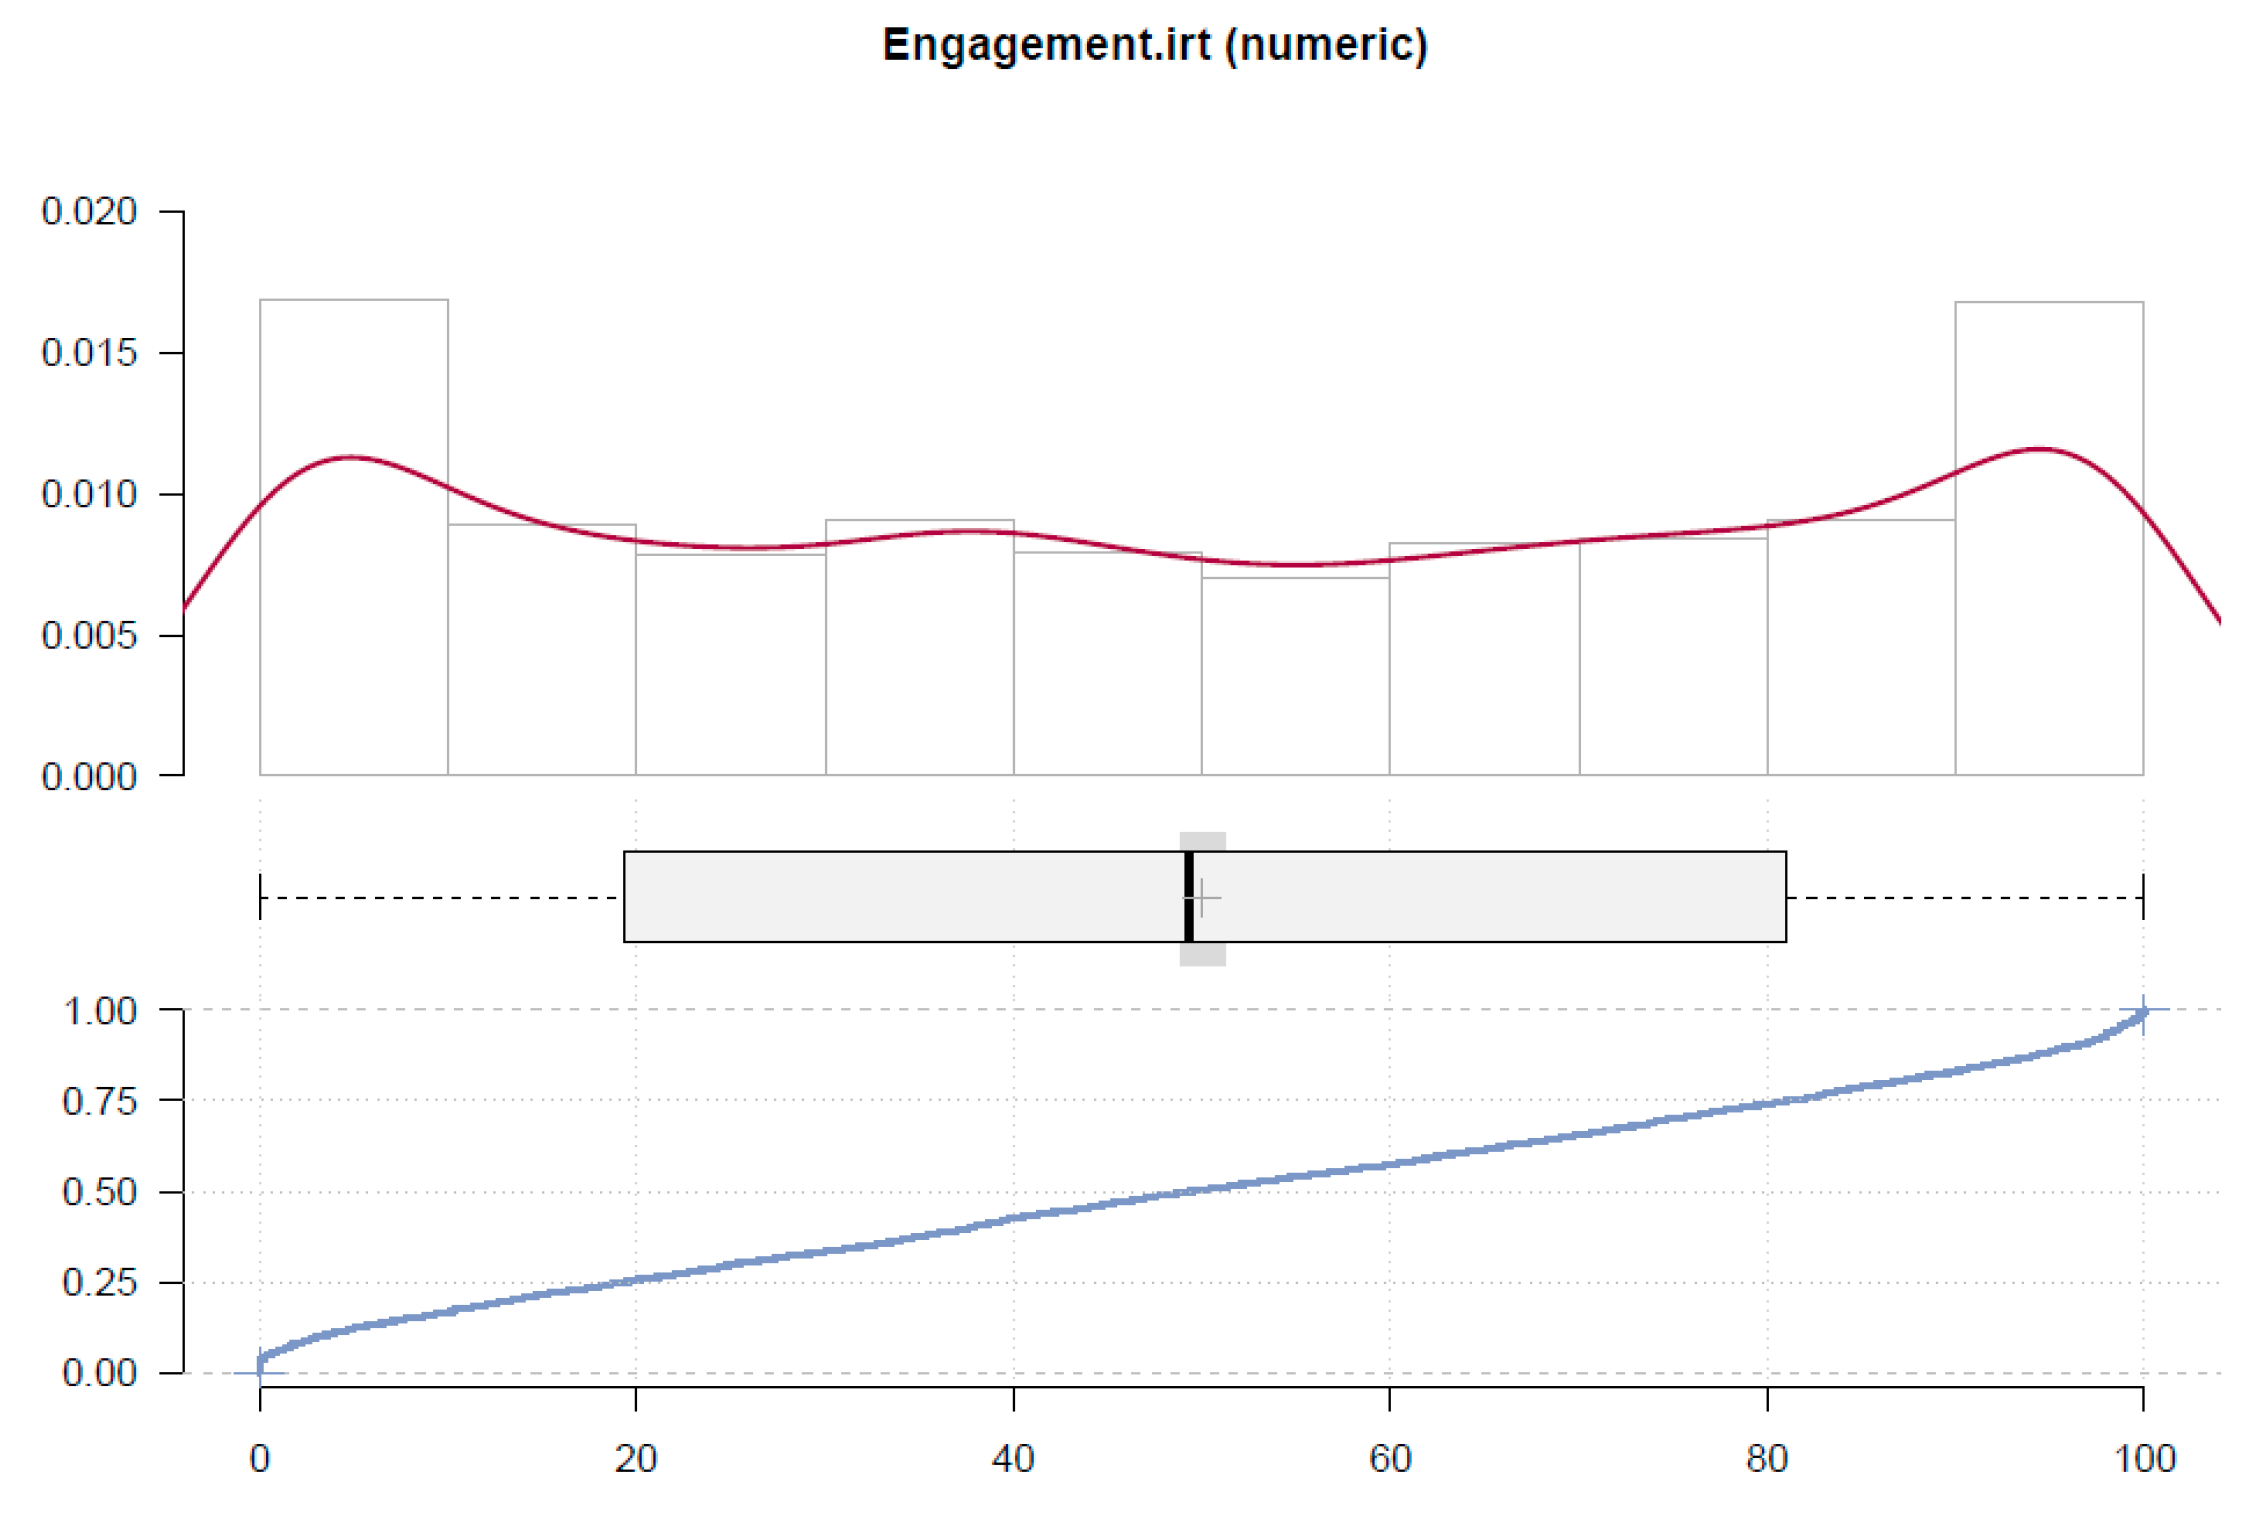
The overall engagement scores showed significant dispersion (wide IQR) and were centered close to the midpoint of the 0–100 scale (median ≈ 49), suggesting significant variation in student engagement. With significant mass at both the low and high ends of the scale, the density curve and ECDF point to a wide, nearly symmetric distribution rather than a strong skew, which is consistent with a meaningful separation between respondents with lower and higher levels of engagement, as measured by the IRT composite (
Figure 2).
5.2. Dropout Propensity
5.2.1. Overall Dropout IRT Composite and Subscale Scores
An overall dropout tendency index was calculated by averaging the IRT-transformed subscale scores for the Academic, Personal, Institutional, Social, and Economic dropout domains (i.e., Dropout.irt = mean of the five subscale IRT scores). The resulting 0–100 composite had a mean of 53.15 (SD = 19.45) and a median of 53.40. The distribution was approximately symmetric, with modest positive skewness (skew = 0.04) and slight platykurtosis (kurtosis = −0.64). The interquartile range was 28.40, with the middle 50% of scores falling between 38.60 and 67.00. Using a high-score threshold of >75 on the 0–100 scale, 14.59% of respondents were classified in the upper tail of dropout tendency.
Separate one-factor IRT-based models were estimated for each dropout subdimension: Academic, Personal, Institutional, Social, and Economic. Each subscale included three items. Person scores (θ) were transformed to a 0–100 scale using the standard normal cumulative distribution function (IRT score = 100 × Φ[θ], rounded). Descriptive statistics showed that the subscale means ranged from 46.80 for Institutional dropout to 63.43 for Personal dropout, with moderate to large dispersion (SDs = 23.33–38.42). To characterize the upper tail of dropout propensity, the percentage of respondents scoring above 75 was calculated for each subscale: Academic = 21.66%, Personal = 35.25%, Institutional = 24.24%, Social = 39.36%, and Economic = 34.58% (
Table 4).
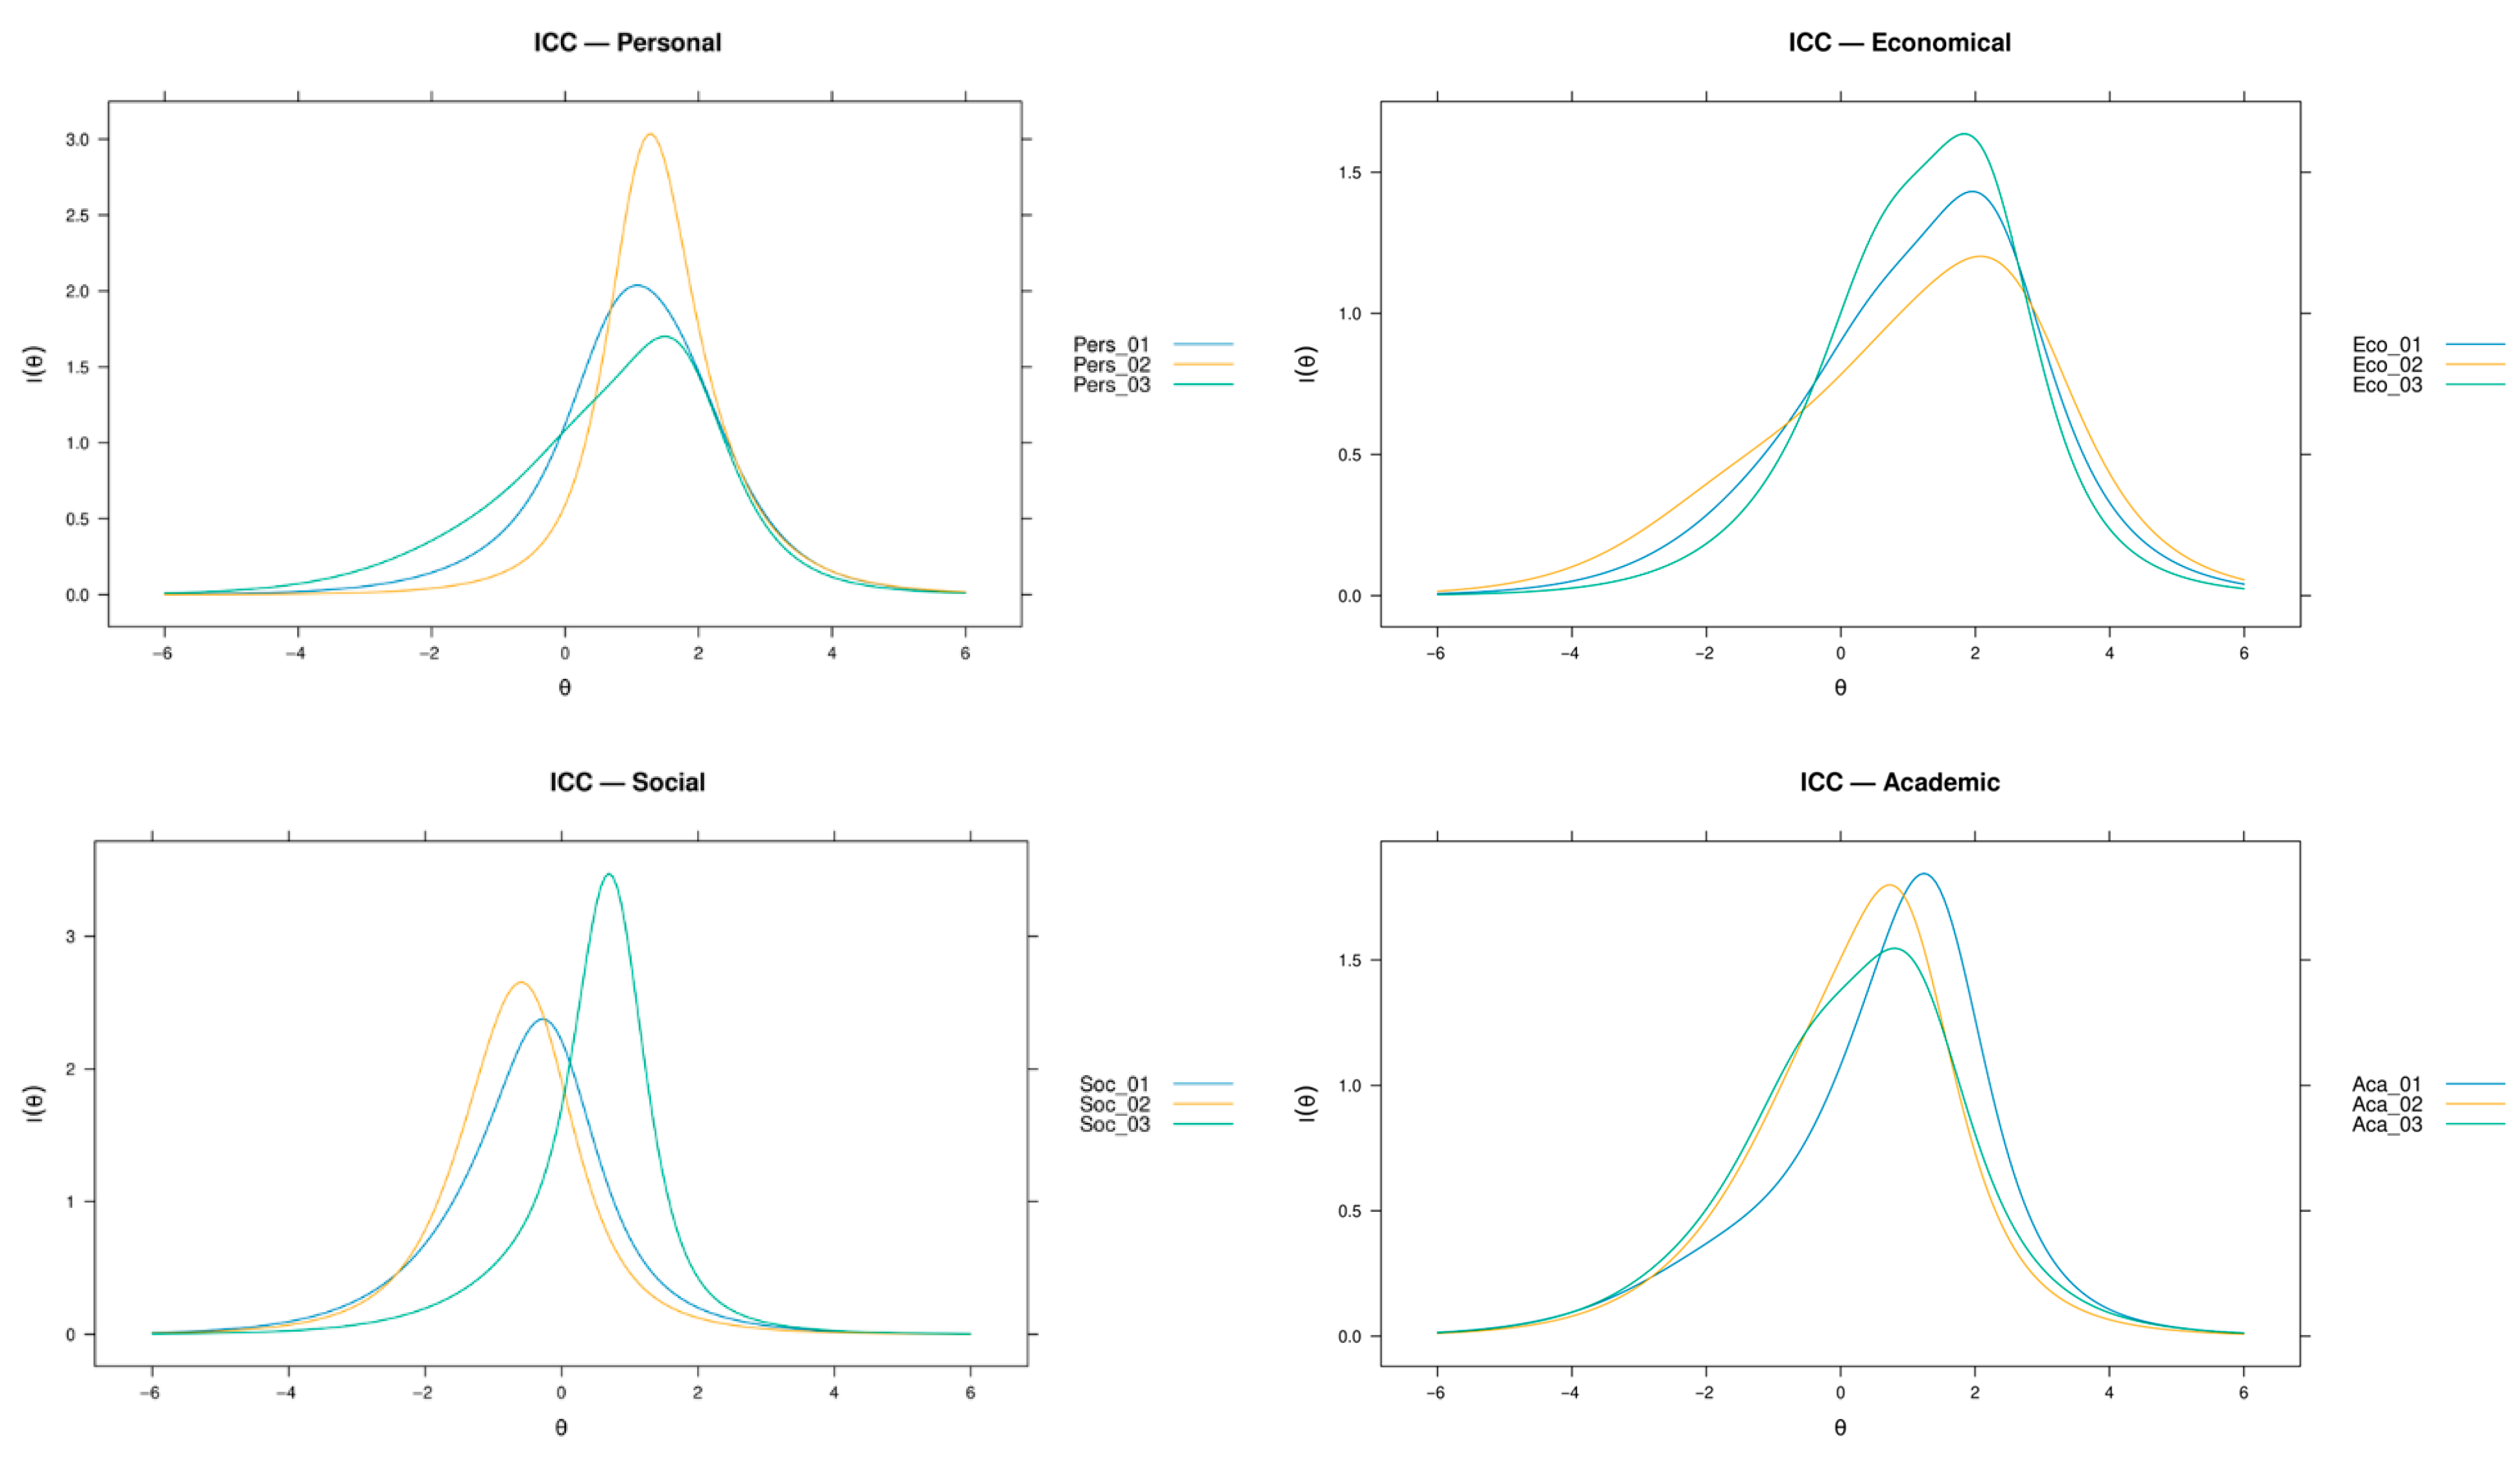
Item precision varied across subscales and across the latent trait continuum (θ) (
Figure 3). In the Academic domain, Aca_01 appeared to provide the strongest information at relatively higher levels of dropout propensity, whereas Aca_02 was more informative around the mid-range of θ and Aca_03 contributed comparatively less overall precision. In the Personal domain, Pers_02 provided the strongest information at higher θ values, indicating better discrimination among students with elevated personal dropout risk, whereas Pers_01 contributed more broadly across the continuum and Pers_03 was comparatively more modest. In the Institutional domain, Inst_03 appeared to dominate information across a broad mid-range of θ, while Inst_01 and Inst_02 contributed more moderate precision. In the Social domain, Soc_01 provided the strongest information across a substantial part of the latent continuum, whereas Soc_02 contributed more locally and Soc_03 appeared more sharply concentrated in a narrower θ region. Finally, in the Economical domain, measurement precision was stronger at moderate-to-higher levels of dropout propensity than at very low levels; Eco_01 and Eco_03 provided the greatest information, particularly toward the upper θ range, whereas Eco_02 contributed less overall.
5.2.2. Item Information Localization for APrISE-15
In contrast to the engagement facets, which focused information primarily on the mean, the dropout subscales exhibited a more pronounced information shift towards elevated levels of the latent risk continuum across various domains. Personal dropout showed strong high-end sensitivity, with Pers08 showing high discrimination (a = 1.56) and high reliability (Max reliability ≈ 0.76). The highest point was at θ ≈ +2, which is consistent with a measure that best distinguishes between students with more severe personal strain. In a similar way, Economic dropout was the most “compact” dimension overall (Max reliability ≈ 0.79), with Eco1 showing high discrimination (a = 2.08) and peak information at θ ≈ +2. This means that the economic domain measures most accurately when financial pressures are high. Academic dropout showed less discrimination (Aca01: a = 0.98; Max reliability ≈ 0.51) with information peaking around θ ≈ +1, which suggests that it is more sensitive to early or emerging academic risk than to extreme cases. These patterns indicate a functional “dual system” among instruments: the UWES-9 mainly measures general engagement levels within the average student range, while key APrISE-15 dropout domains, particularly Personal and Economic, function more as early warning/risk-escalation indicators, gaining reliability as dropout propensity rises (θ ≈ +1 to +2).
Within the Social dropout domain, all three indicators contributed useful information, but they did so at somewhat different regions of the latent continuum. Soc_01 and Soc_02 appeared to provide strong precision around lower-to-mid levels of θ, whereas Soc_03 showed a sharper and more concentrated information peak closer to the positive side of the continuum. This pattern suggests that the Social domain captures multiple aspects of social dropout propensity rather than being dominated by a single weak item. Given the brief three-item structure of the domain, these differences are best interpreted as variation in targeting across θ rather than as evidence that one item should be removed.
5.3. Test Information Function (TIF) Comparison Across Domains
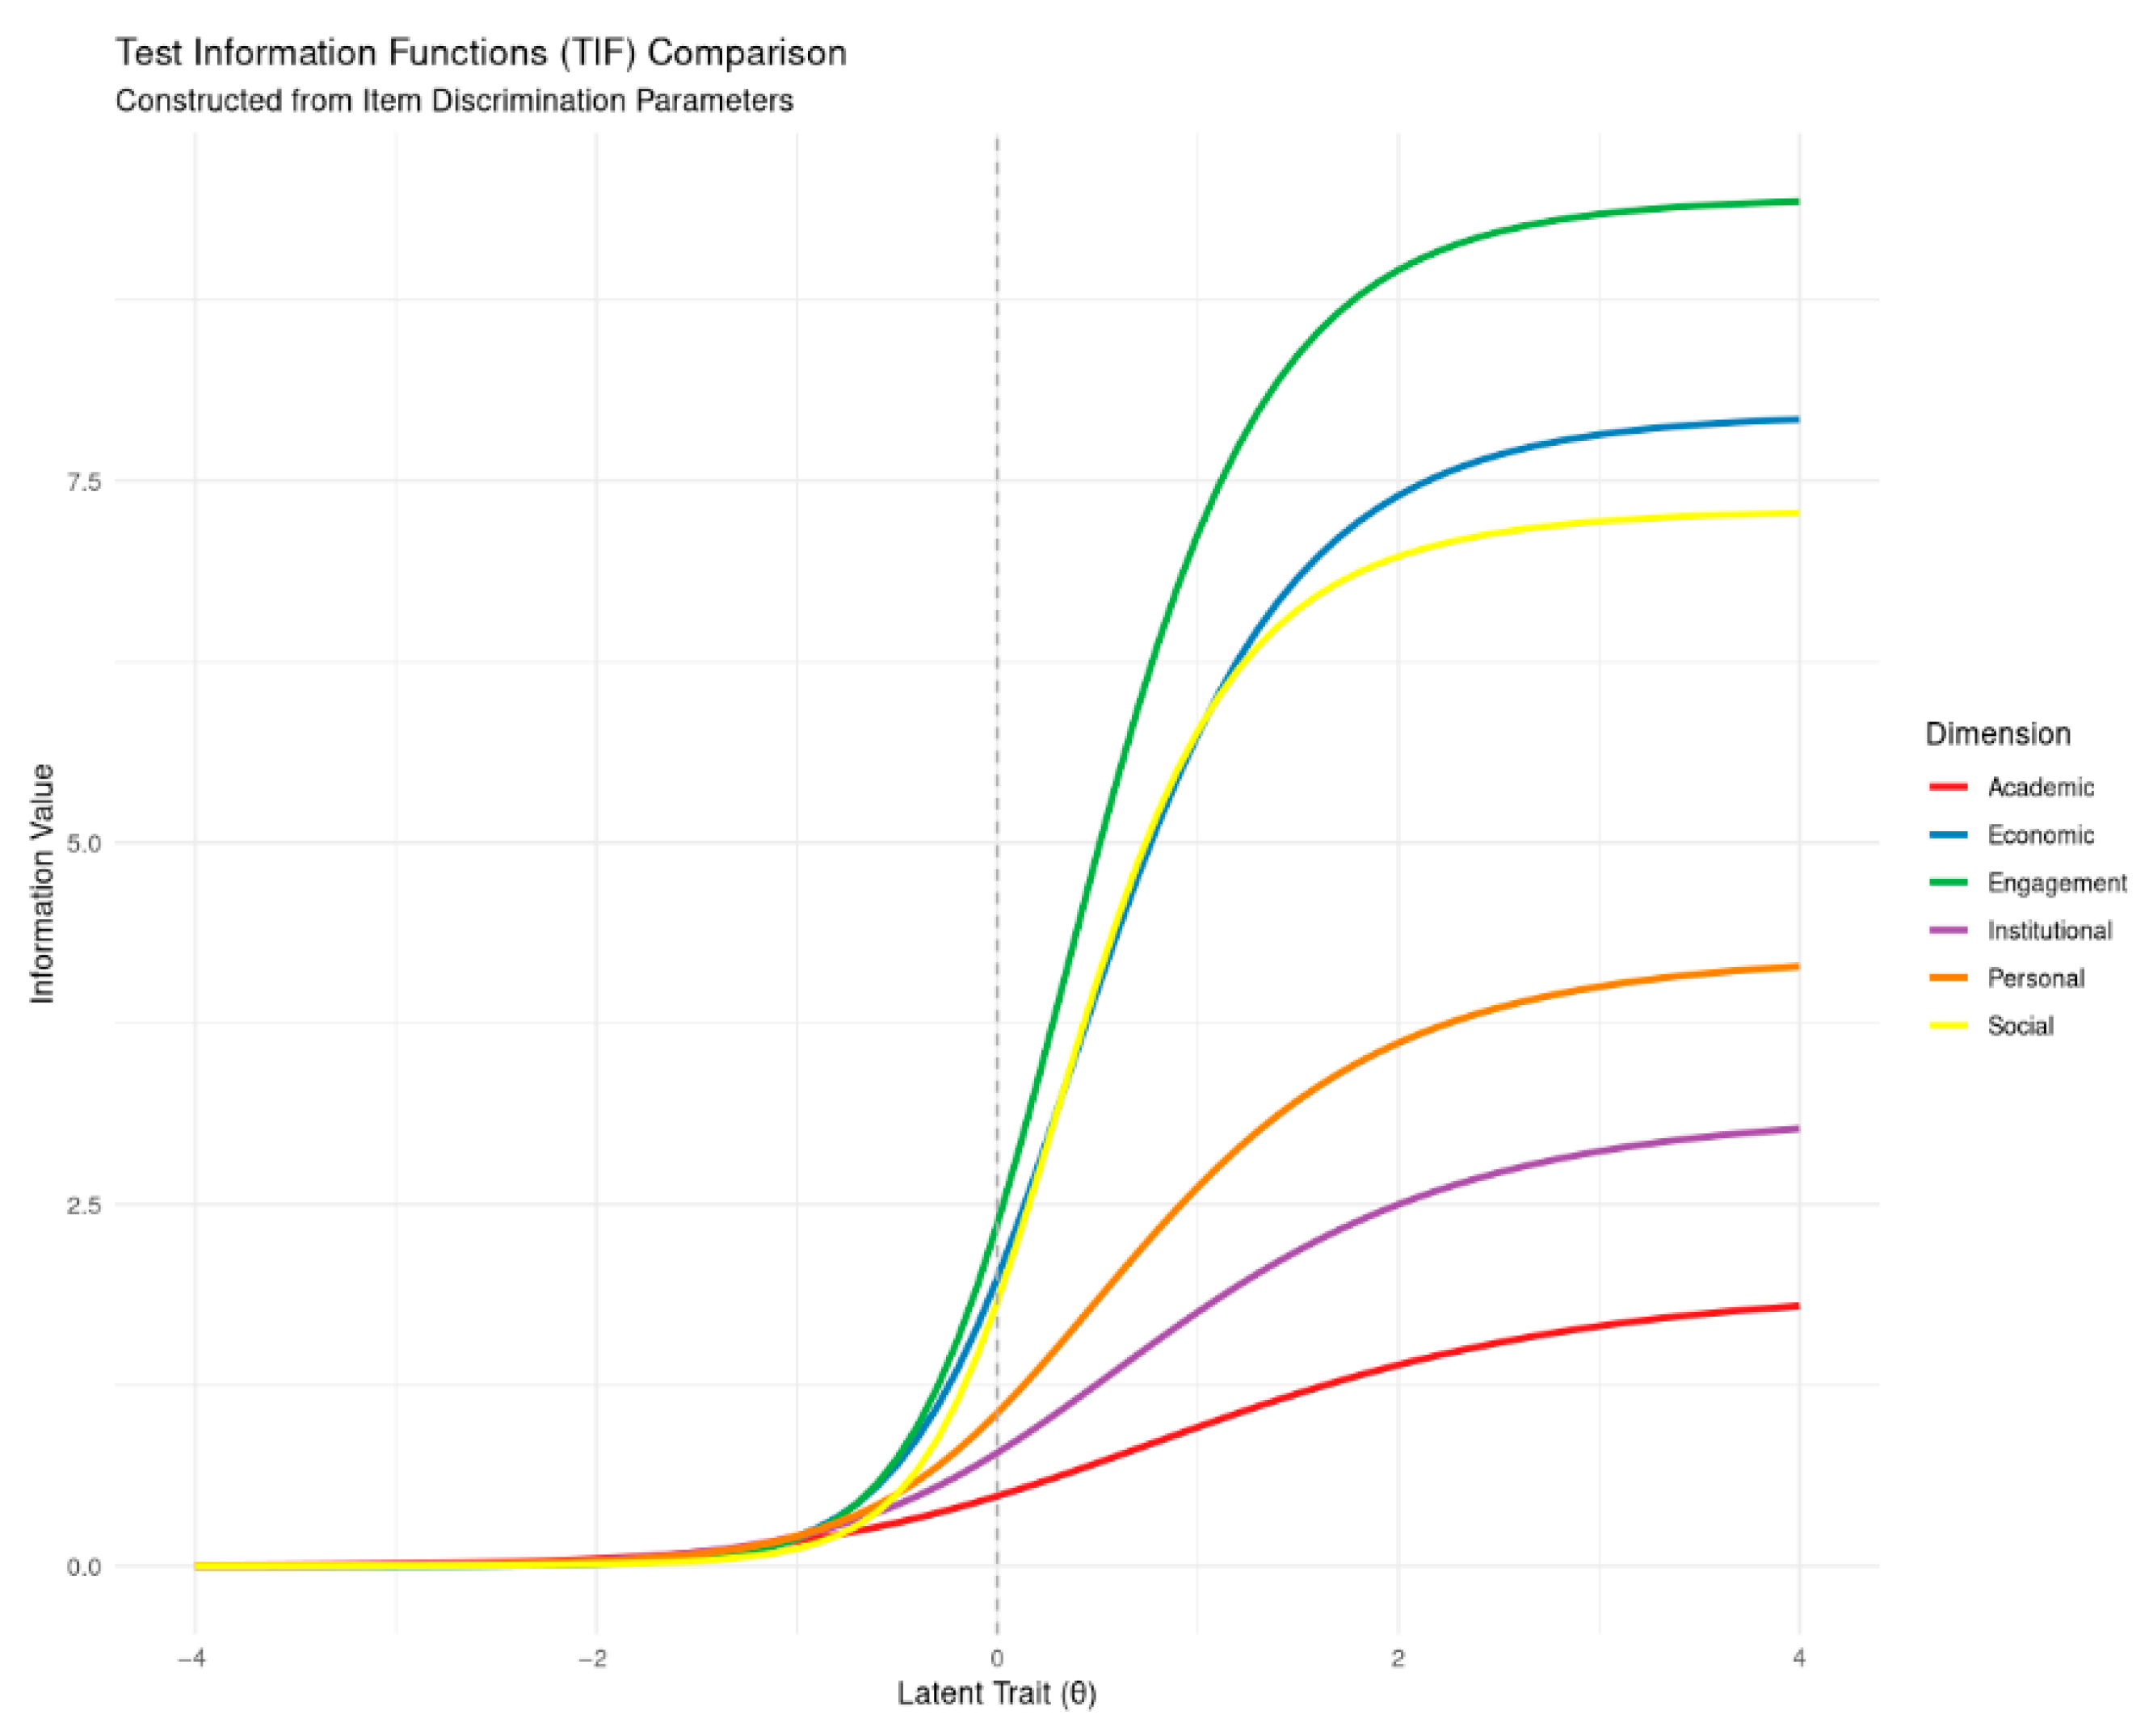
As a function of the latent trait (θ), test information functions across Engagement and the five dropout domains are compared in
Figure 4. Strong precision for differentiating students at average-to-higher engagement levels was demonstrated by Engagement, which had the highest test information overall (information value > 9) and increased sharply beyond θ = 0. Economic and Social showed the strongest information profiles (roughly 7.5–8.0) among the dropout domains, indicating relatively high diagnostic precision for these risk channels, especially as θ increases. The majority of dropout-domain curves reached their maximum values on the right side of the continuum (θ > 0), which is consistent with a screening-oriented pattern. This suggests that measurement precision is highest where latent dropout propensity is elevated (θ ≈ 2–4). Academic dropout, on the other hand, displayed the lowest level of information (below ~2.5), suggesting less discrimination in this context compared to other dropout domains. The APrISE-15’s interpretation as a screening tool rather than a uniformly precise “general” scale is supported by the right-shifted peaks (θ > 1), which indicate that precision is allocated where risk is elevated (
Figure 4).
5.4. Domain-Level Targeting and Discrimination (Test-Level Parameters)
We utilized test-level discrimination (a) and difficulty/targeting (b) parameters to summarize each domain in addition to the TIF comparison (
Table 5). Engagement exhibited the highest discrimination (a = 1.72) and a negative targeting parameter (b = −0.88), suggesting that UWES-9 most accurately distinguishes within the average-to-higher engagement spectrum. Economic dropout had both high discrimination (a = 1.58) and high targeting (b = 1.34), which means that financial strain is a clear sign of a problem mostly in the high-risk area (θ > 1). Personal dropout had the highest targeting (b = 1.54; a = 1.14), which is in line with a domain that is most informative in more extreme right-tail cases. Social dropout had moderate discrimination (a = 1.25) but earlier targeting (b = −0.67). This suggests that problems with social integration may be a sign of risk at lower to average levels of dropout propensity. Academic dropout exhibited the least discrimination (a = 0.78; b = 0.54), suggesting a relatively lower diagnostic distinction compared to other dropout categories in this context, whereas institutional dropout presented a moderate profile (a = 1.00; b = 0.15).
In the GRM framework, the targeting/difficulty parameter (b) shows where the domain offers maximal differentiation along the latent continuum, while the discrimination parameter (a) shows how sharply a domain differentiates between respondents at nearby levels of θ. Economic dropout (a = 1.58) and engagement (a = 1.72) demonstrated the strongest diagnostic separation in this study. In contrast, the higher positive b values for Economic (b = 1.34) and Personal dropout (b = 1.54) suggest that these domains “activate” under more severe risk profiles and become most informative mainly at elevated levels of latent dropout propensity (θ > 1).
The domain-level TIFs demonstrated that the dropout instrument’s measurement precision was mostly on the right side of the latent continuum. In particular, information for the APrISE-15 domains increased most significantly at higher levels of dropout propensity (θ > 0), aligning with a screening-oriented trend where the tool’s reliability peaks when risk is substantially elevated. The Economic and Social dimensions exhibited the strongest information profiles (highest conditional precision) among the dropout domains, while the Academic dropout category displayed the least information, indicating relatively diminished diagnostic differentiation in this context. Overall, these results support the idea that the APrISE-15 is an early warning/risk identification tool that is best at finding students who are closer to dropping out than differentiating finely among low-risk students.
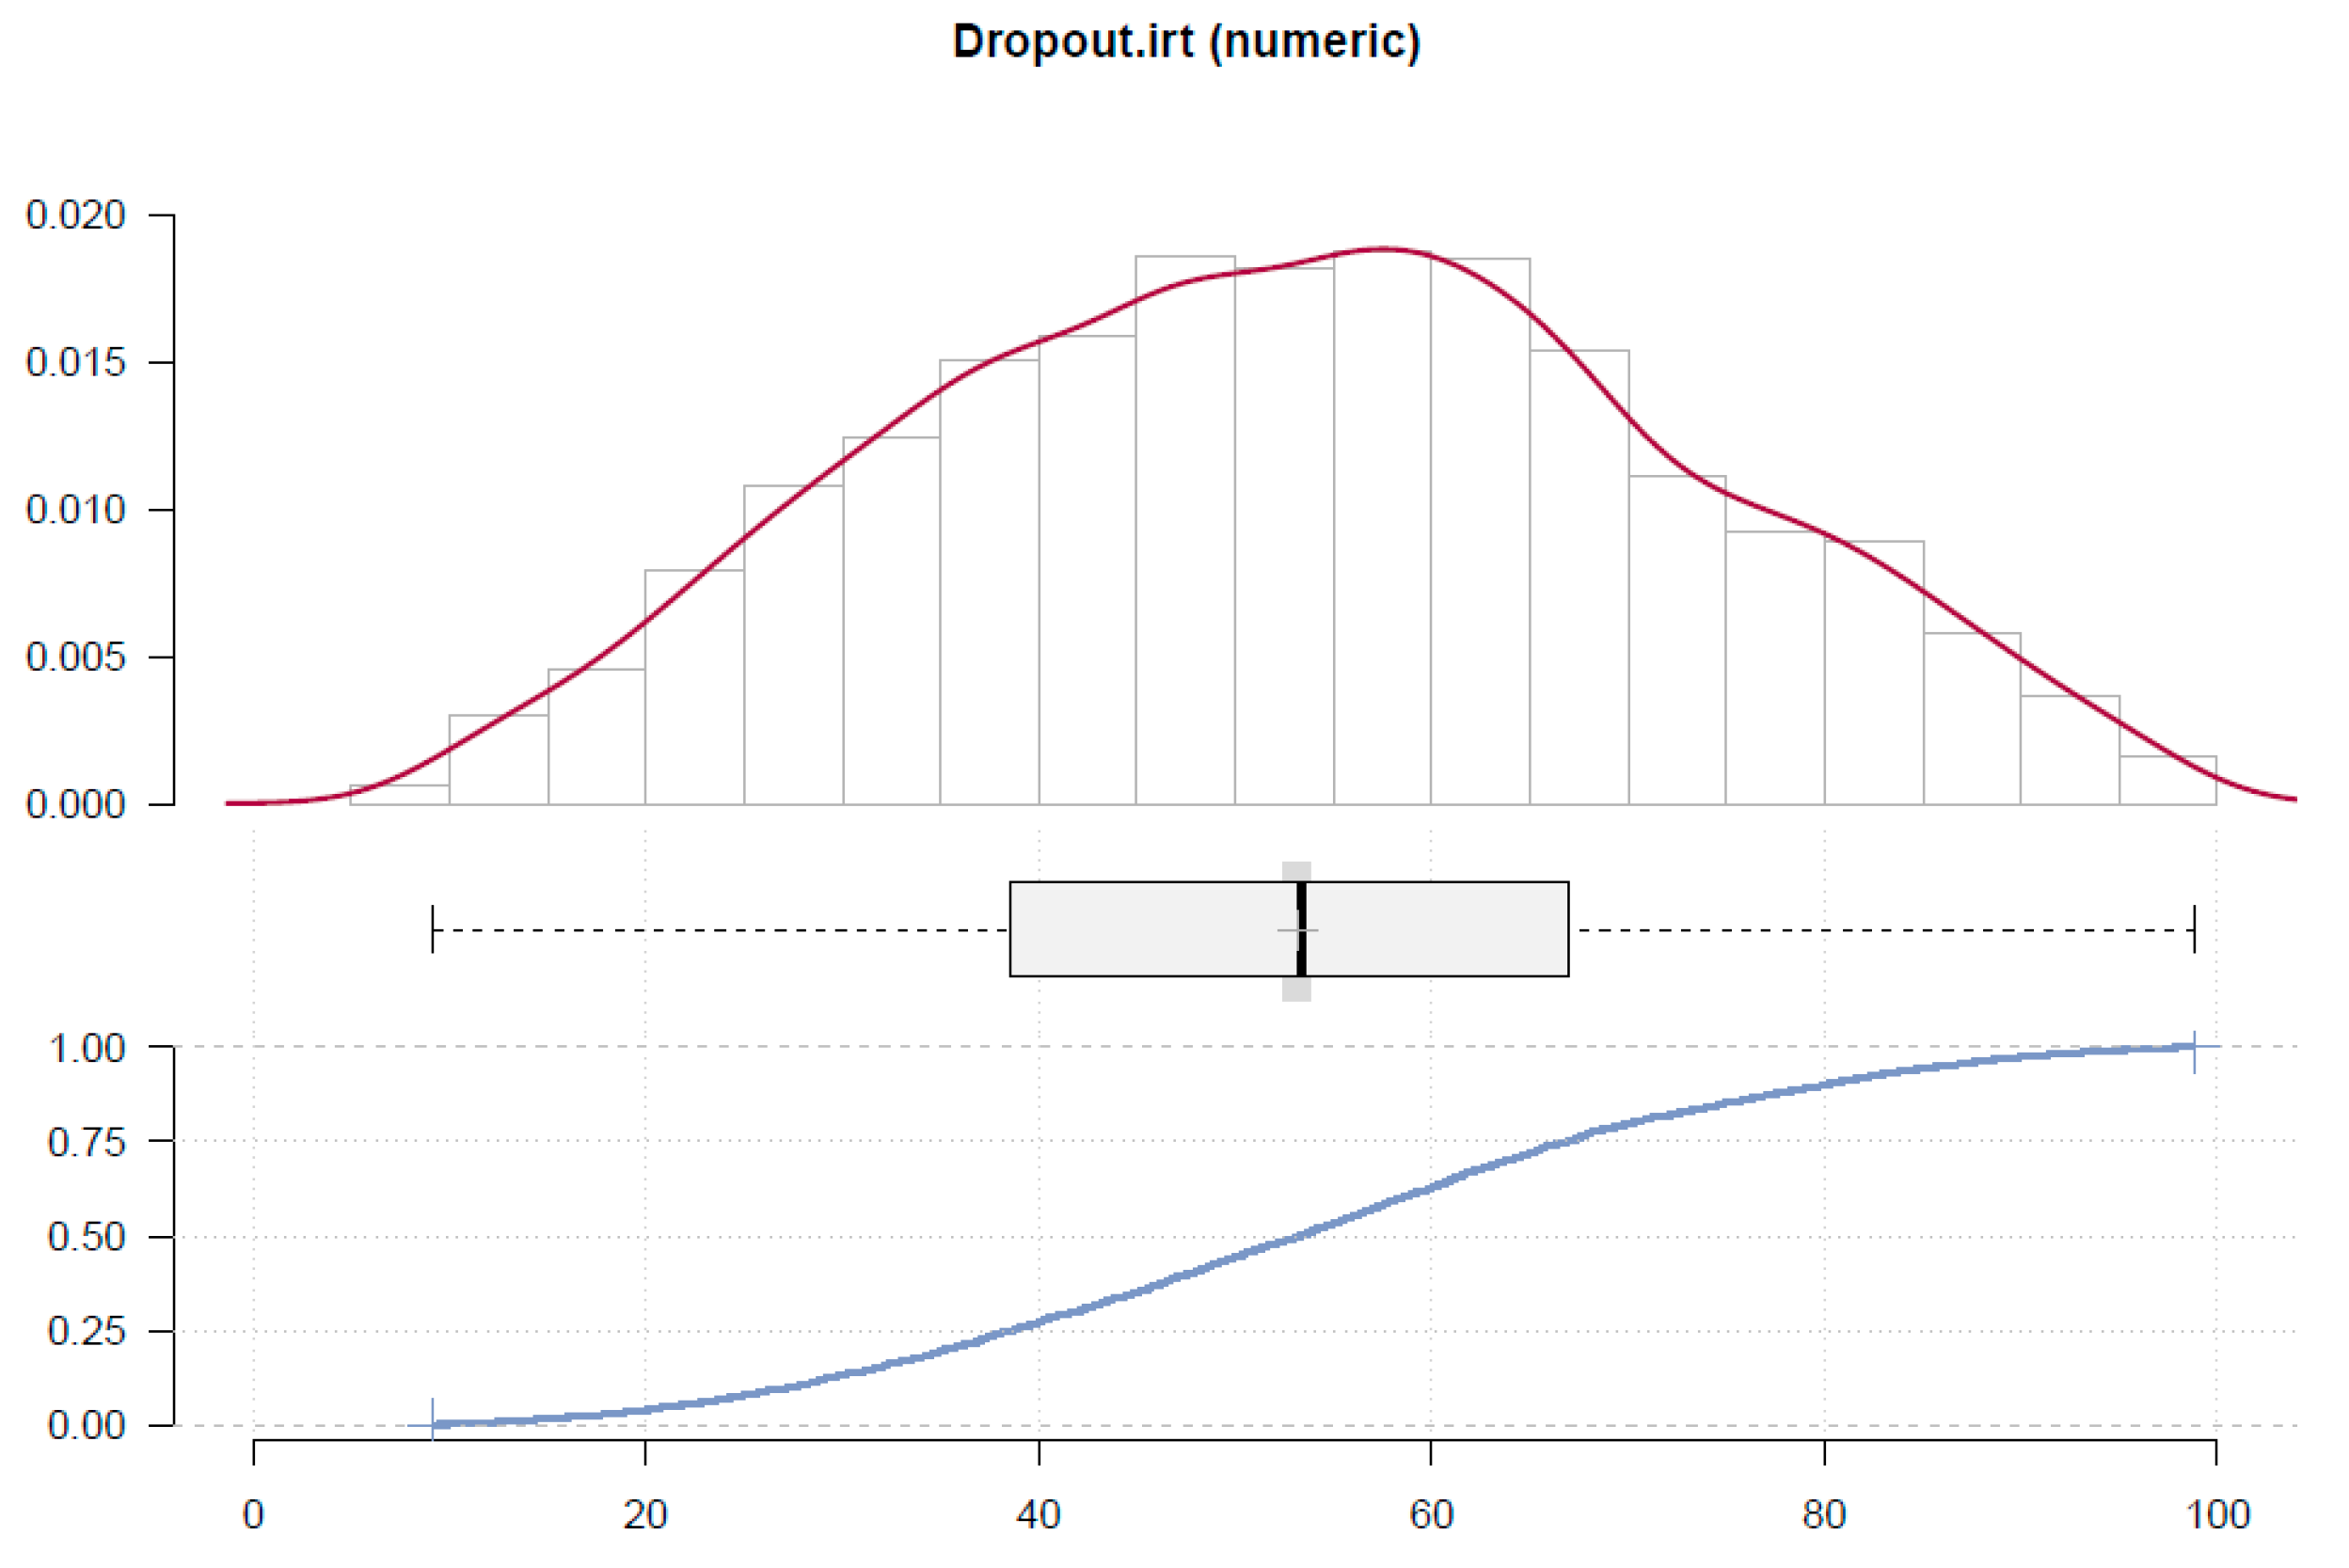
With moderate dispersion and no noticeable floor/ceiling effects (
Figure 5), the IRT-based dropout propensity composite (Dropout.irt) displays a roughly unimodal distribution centered around the mid-range of the 0–100 metric (median in the low-to-mid 50 s). Dropout propensity is well-represented as a continuous individual-difference variable appropriate for correlational and structural modeling with engagement, according to the boxplot’s fairly balanced spread around the median and the ECDF’s smooth rise.
5.5. Pearson Correlations
Pearson product-moment correlations between the IRT-based engagement indices and the IRT-based dropout indices are presented in
Table 6. Overall engagement was strongly and negatively correlated with overall dropout propensity (r = −0.55,
p < 0.001). Dropout.irt was also negatively correlated with all engagement subdimensions, including Absorption.irt (r = −0.48,
p < 0.001), Dedication.irt (r = −0.53,
p < 0.001), and Vigor.irt (r = −0.45,
p < 0.001). This pattern indicates that students with higher dropout propensity tended to report lower engagement across all engagement components.
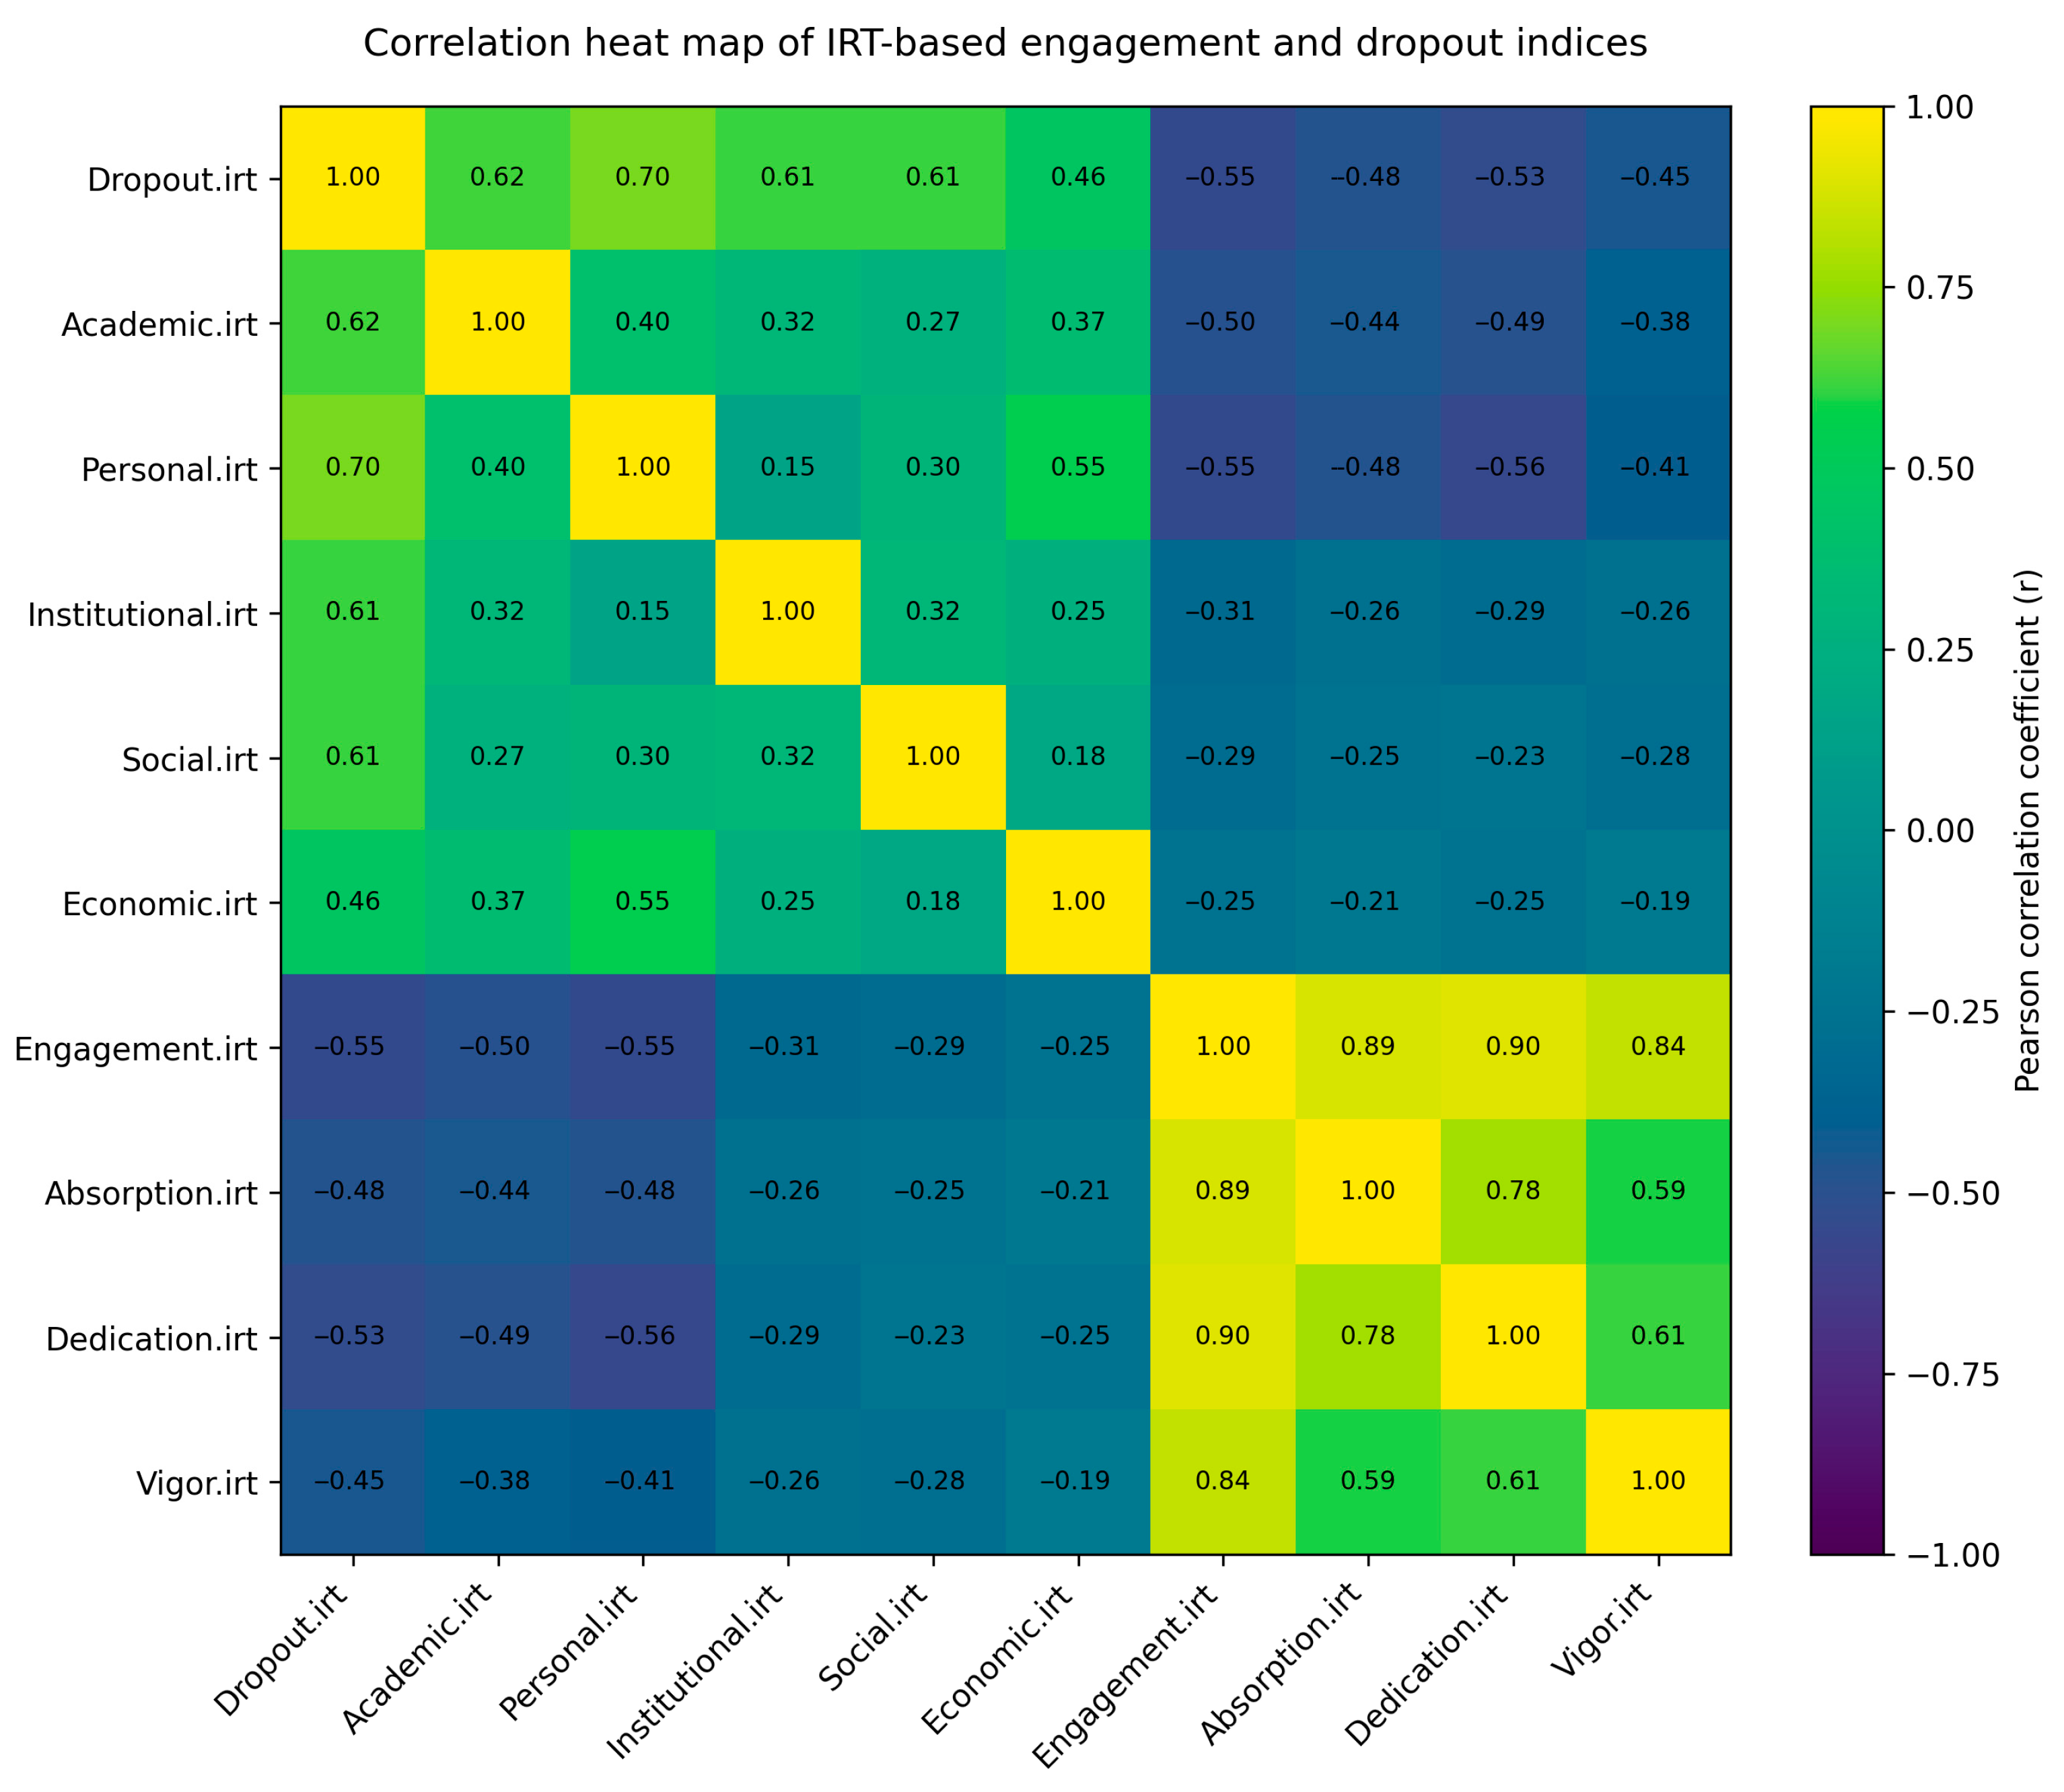
To facilitate interpretation of the correlation structure,
Figure 6 presents the IRT-based correlation matrix from
Table 6 as a heat map.
Table 6 indicates a clear and consistent inverse association between dropout propensity and student engagement. Overall dropout tendency was strongly and negatively related to overall engagement (r = −0.55,
p < 0.001). At the dropout-domain level, overall engagement was most strongly associated with Personal.irt (r = −0.55,
p < 0.001) and Academic.irt (r = −0.50,
p < 0.001), followed by Institutional.irt (r = −0.31,
p < 0.001), Social.irt (r = −0.29,
p < 0.001), and Economic.irt (r = −0.25,
p < 0.001). Thus, the engagement–dropout relationship was strongest when dropout propensity reflected academic and personal strain, whereas institutional, social, and economic dropout domains showed weaker but still consistent negative associations with engagement.
The pattern was also consistent across engagement facets. Dropout.irt was negatively correlated with Dedication.irt (r = −0.53, p < 0.001), Absorption.irt (r = −0.48, p < 0.001), and Vigor.irt (r = −0.45, p < 0.001). Among the engagement facets, dedication showed the strongest inverse association with overall dropout propensity, suggesting that the degree to which students experience their studies as meaningful, inspiring, and a source of pride is especially relevant to lower dropout risk.
5.5.1. Which Engagement Subscale Is Most Strongly Linked to Overall Dropout?
The dedication component of engagement exhibited the strongest inverse relationship with overall dropout propensity in the current sample. Specifically, Dedication.irt showed a strong negative correlation with Dropout.irt (r = −0.53, p < 0.001), which was stronger than the corresponding associations with Absorption.irt (r = −0.48, p < 0.001) and Vigor.irt (r = −0.45, p < 0.001). This pattern suggests that the extent to which students experience their studies as inspiring, meaningful, and a source of pride and enthusiasm is the engagement component most closely linked to lower dropout propensity.
Dedication was most strongly associated with Academic.irt (r = −0.49, p < 0.001) and Personal.irt (r = −0.56, p < 0.001). This pattern is substantively consistent with the content of the dropout instrument, as the Personal domain includes items capturing disappointment and exhaustion-driven thoughts of leaving. In this context, greater personal strain and emotional depletion around studying are closely linked to lower dedication, reflected in reduced inspiration, enthusiasm, and pride in one’s studies.
This empirical profile is consistent with earlier higher education research showing negative associations between dropout intention and the engagement dimensions of vigor, dedication, and absorption. For example,
Truta et al. (
2018) found that dedication was a strong negative predictor of dropout intention among first-year university students and interpreted dedication as reflecting the perceived significance and meaningfulness students attribute to their studies. More broadly, dedication can be understood as a motivational-identity signal of academic commitment: students who experience their studies as meaningful and feel proud or enthusiastic about them appear less likely to contemplate withdrawal.
5.5.2. IRT vs. Standard Composite Scoring Comparison
To assess whether the engagement–dropout relationship depended on the scoring method, the primary IRT-based results were compared with parallel correlations based on standard observed-score composites. Standard engagement composites were calculated as mean scores for the UWES-9 facets and overall engagement. Standard dropout composites were calculated as mean scores for the APrISE-15 domains and overall dropout tendency, following the instrument’s reverse-coding rules so that higher values indicated greater dropout propensity.
Alongside the primary IRT-derived correlation matrix presented in
Table 6,
Table 7 reports the corresponding correlations based on standard composite scoring. This robustness comparison allows readers to verify that the direction and relative strength of the relationships between dropout propensity and engagement were not dependent on the IRT scoring method.
Pearson correlations based on standard composite scores confirmed the IRT-based pattern. Overall Dropout was strongly and negatively correlated with overall Engagement (r = −0.58,
p < 0.001), indicating that students with higher dropout propensity reported lower engagement with their studies. The same inverse pattern appeared across the engagement dimensions: Dropout was negatively correlated with Absorption (r = −0.50,
p < 0.001), Dedication (r = −0.57,
p < 0.001), and Vigor (r = −0.50,
p < 0.001). Among the engagement facets, Dedication showed the strongest negative association with overall dropout tendency and was also strongly associated with the Personal dropout domain (r = −0.59,
p < 0.001), suggesting that the personal and affective component of dropout risk is especially closely linked to lower meaning, enthusiasm, and pride in one’s studies. At the dropout-domain level, the strongest negative associations with overall Engagement were observed for Personal dropout (r = −0.56,
p < 0.001) and Academic dropout (r = −0.50,
p < 0.001), followed by Social (r = −0.36,
p < 0.001), Institutional (r = −0.34,
p < 0.001), and Economic dropout (r = −0.28,
p < 0.001). Overall, the standard-composite results support the same substantive conclusion as the IRT-based analysis: engagement is consistently and inversely associated with dropout propensity, especially when dropout risk reflects personal strain and academic dissatisfaction. The close correspondence between the observed-score correlation (r = −0.58;
Table 7) and the IRT-based correlation (r = −0.55;
Table 6) further indicates that the main Dropout–Engagement association is robust to the scoring method rather than being an artifact of either observed-score averaging or latent-score-based estimation.
6. Discussion
Consistent with classic persistence perspectives (
Astin, 1999;
Metz, 2004;
Samoila & Vrabie, 2023;
Tinto, 2022), our results demonstrate that academic engagement serves as a significant protective factor against dropout rates, while also corroborating modern psychosocial theories that engagement is influenced at the “educational interface,” where institutional conditions intersect with students’ resources, emotions, and sense of belonging (
Fredricks et al., 2004;
E. Kahu et al., 2015;
E. R. Kahu & Nelson, 2018). In a study of 3099 students at the University of Patras, overall engagement was moderately to strongly and negatively correlated with dropout propensity (IRT composites: r = −0.55; observed composites: r = −0.58), consistent with previous findings indicating that diminished engagement correlates with heightened withdrawal intentions (
Álvarez-Pérez et al., 2024;
López-Angulo et al., 2023;
Truta et al., 2018).
Facet-level results sharpen this picture in line with mediation models in which engagement channels expectations, satisfaction, and self-regulated learning into persistence decisions (
Bernardo et al., 2022;
Galve-González et al., 2024;
López-Angulo et al., 2023): dedication showed the strongest association with dropout (Dedication.irt–Dropout.irt r = −0.53) and was most strongly linked to personal dropout (r = −0.56), suggesting that reduced meaning, inspiration, and pride are closely intertwined with exhaustion-driven thoughts of leaving. At the same time, our IRT/GRM diagnostics address a key measurement gap identified in engagement theory by moving beyond uniform-precision composites (
E. Kahu et al., 2015;
E. R. Kahu & Nelson, 2018).
While APrISE-15 domains such as Economic and Personal shifted precision toward higher-risk regions (Economic a = 1.58, b = 1.34; Personal b = 1.54) and test information functions peaked in the right tail (θ > 1), supporting an early-warning screening interpretation, UWES-9 data was concentrated around the average student range (θ ≈ 0). In contrast to the Economic and Social domains, Academic dropout demonstrated lower information and weaker discrimination (a = 0.78), which is consistent with multidomain accounts that suggest structural and integration constraints are more often responsible for attrition than academic difficulty (
Marczuk, 2023;
Pusztai et al., 2022). In line with belonging pathways (
Maluenda-Albornoz et al., 2022) and in conjunction with burnout-engagement evidence (
Marôco et al., 2020), social dropout was targeted earlier on the continuum (b = −0.67). Overall, the findings underscore the need for institutions to prioritize preventive social-integration support in addition to targeted financial aid for students identified in high-risk areas, and to treat engagement as a sensitive indicator of overall student functioning.
6.1. Precision Shift and Complementary Measurement
The IRT results indicate that the two instruments do not serve as “general” indicators of student functioning; rather, they fulfill complementary roles along the latent continuum. In the UWES-9 engagement facets, item information was predominantly focused around the mid-range of the trait (θ ≈ 0), demonstrating high precision in distinguishing students within the typical engagement range. In contrast, key dropout domains—particularly Academic, Personal, and Economic—exhibited a transition in peak measurement precision towards elevated latent levels (θ ≈ +1 to +2). This “precision shift” means that the UWES-9 functions as a stable monitor of students’ general engagement state, while the APrISE-15 dropout domains become most informative for students whose profiles indicate elevated dropout propensity. This is crucial for interpretation as the instruments do not appear to be redundant; instead, they appear to be tailored to different areas of the risk-engagement landscape, with dropout items becoming more informative as risk rises. This pattern is consistent with a purposeful screening architecture: rather than being evenly distributed throughout the whole student continuum, measurement precision is allocated where classification matters most—at elevated risk.
6.2. Economic Pressure as the Most Robust Dropout Domain
The Economic dropout domain had the strongest psychometric strength, with the highest maximum reliability among the dropout subscales (Max reliability ≈ 0.79) and the most information at the higher-risk end of the continuum (θ ≈ +2). This profile suggests that students respond to economic hardship items in a fairly consistent manner with less measurement noise than in other contextual domains. In practical terms, financial strain appears to represent a sharply defined and readily measurable component of dropout propensity in the Greek public university setting. The IRT evidence thus substantiates the interpretation that economic constraints are not merely contextual factors but represent a distinct, consistently identified risk channel that becomes particularly pronounced among students nearing withdrawal. The Economic domain is one of the clearest psychometric indicator channels for administrative triage and targeted support, given its high discrimination and strong information in the upper θ range. It is especially instructive to compare the academic and economic dropout domains: Economic dropout demonstrated significantly greater discrimination (a = 1.58) than academic dropout (a = 0.78), indicating that, in this particular context, structural/economic constraints more clearly index attrition risk than academic difficulty alone.
6.3. Social Integration Signals and Domain Coverage
The Social dropout domain highlights the importance of academic community embeddedness, particularly student–instructor interaction, as a meaningful component of dropout risk in this context. The item information patterns suggest that the three social indicators did not contribute equally across the latent continuum. In particular, Soc_01 appeared to provide the strongest information across a broad part of θ, whereas Soc_02 was more locally informative and Soc_03 appeared more narrowly targeted. This pattern suggests that the Social domain captures multiple aspects of social dropout propensity rather than being dominated by a single uniformly functioning indicator. At the domain level, Social dropout also showed relatively early targeting (b = −0.67), indicating that social integration difficulties may become detectable before more extreme levels of dropout propensity are reached. Substantively, this supports the view that social-integration problems may function as relatively early warning signals in student risk profiles. Accordingly, preventive interventions such as mentoring, community building, and structured opportunities for student–faculty interaction may be particularly valuable before risk becomes more severe. This finding is practically important because it suggests that dropout prevention should not be limited to academic remediation after problems become visible, but should also include earlier relational and belonging-oriented support mechanisms.
7. Practical and Policy Implications: From Measurement Precision to Student Support
The item discrimination patterns offer practical guidance for student support systems beyond theoretical considerations. The existence of high-discrimination indicators—those with the highest discrimination (e.g., VI2 for Vigor, DE2 for Dedication, Eco22 for Economic strain, and Pers08 for Personal strain)—indicates a viable approach to developing a short-form screening indicator for swift early detection. A brief overview of these high-discrimination items could work as an early warning system that is easier to use and still very sensitive to major differences in engagement and a higher risk of dropping out. It is important to think of this short form as a triage tool instead of a diagnostic tool. Its purpose would be to flag students for timely follow-up, thereby connecting risk profiles to specific intervention pathways, such as advising outreach, financial counseling, mental health support, or academic mentoring, especially since several dropout domains become most useful when risk is already high (θ ≈ +1 to +2).
The practical value of these findings is that they show not only whether students differ in dropout propensity, but also which domains provide the clearest signals at different levels of risk. Rather than relying only on a global dropout score, the IRT results support a profile-based approach in which academic, personal, institutional, social, and economic risks are interpreted as distinct but complementary indicators. In practice, elevated economic risk may point to the need for financial counseling or emergency aid; elevated personal risk may require wellbeing-oriented support; elevated social risk may call for mentoring, peer communities, or structured student–faculty interaction; and elevated academic risk may indicate the need for advising or study-skills support. Institutional risk profiles may also guide reviews of student services, infrastructure, communication practices, and administrative support, where perceived institutional constraints contribute to withdrawal vulnerability.
At the institutional and policy level, these findings can inform more precise and resource-sensitive retention strategies. The stronger information profiles of the Economic and Social domains suggest that dropout prevention in Greek public universities should combine financial support with organized social-integration initiatives, rather than treating academic difficulty as the only or dominant explanation for withdrawal risk. More broadly, the results are relevant to international higher education systems seeking evidence-based ways to improve retention and reduce inequities in student progression. Psychometrically informed screening tools can help institutions move from reactive support to earlier, more targeted intervention, provided that scores are used ethically as decision-support indicators rather than as labels or automated decision rules. Future applications could embed such multidimensional assessments into advising systems, semesterly student-support processes, or learning analytics dashboards after further validation against longitudinal and administrative outcomes.
8. Conclusions, Limitations and Future Research
The findings indicate that academic engagement is consistently and inversely associated with dropout propensity, while also showing that measurement precision varies across the latent continuum. By applying Item Response Theory, the study moves beyond simple composite score interpretations and demonstrates the practical value of precision-aware assessment. Overall, the results support the use of psychometrically informed tools to strengthen early identification and targeted support for students at risk of withdrawal. From a practical and policy perspective, the study shows that dropout-risk assessment can be more useful when it identifies the specific domains through which vulnerability is expressed, thereby enabling universities to design more targeted, equitable, and resource-sensitive retention strategies.
This research is not without limitations. First, the data were gathered from a single public institution (the University of Patras), requiring replication across universities, disciplines, and sectors (e.g., public versus private) to assess generalizability and to determine whether the domain-specific precision patterns observed here—across Academic, Personal, Institutional, Social, and Economic dropout dimensions—replicate in other contexts. Second, the measures depend on self-reporting, which could lead to biased responses, especially in sensitive areas like financial issues and personal challenges. This suggests that it would be beneficial to combine survey screening with other indicators (e.g., advising contacts, course attendance/engagement logs, or administrative markers). Third, the cross-sectional design offers a snapshot rather than risk trajectories; longitudinal designs (e.g., semester-by-semester repeated measurement) could illustrate the evolution of engagement and dropout propensity over time, assess whether alterations in UWES-9 facets precede an increase in dropout θ, and confirm predictive validity against objective outcomes (e.g., official dropout–stopout records). Subsequent research could develop and validate a concise early warning version utilizing the highest-discrimination “super-items,” while rigorously assessing classification accuracy (sensitivity/specificity) and determining empirically based thresholds for actionable risk categories. Finally, an identifiable short-form development pathway is rendered possible by the IRT parameter estimates. Future research can create and validate an APrISE-Quick short-form for low-burden routine screening (e.g., semesterly self-checks or advising triage) since discrimination and information identify the most diagnostically powerful indicators (high-a “super-items”). To determine operational cutoffs and assess classification performance (sensitivity/specificity), such a short-form should be validated against objective outcomes (such as stopout/dropout records). A further methodological limitation is that the present study used IRT-derived point estimates and observed-score composites to examine the engagement–dropout association, rather than estimating a full latent structural model. Future research could extend the present work through ordinal SEM, which would allow the measurement model and the structural relations among latent constructs to be estimated simultaneously. Such models could incorporate additional explanatory variables and test mechanisms linking engagement, personal strain, economic pressure, social integration, institutional support, and dropout propensity. In addition, future studies could use IRT plausible values to propagate uncertainty in latent trait estimation, particularly in larger-scale or longitudinal applications where group-level inference and prediction are central aims.