
Unlocking Student Choices: Assessing Student Preferences in Courses in Engineering Education

 ,
,
Abstract
1. Introduction
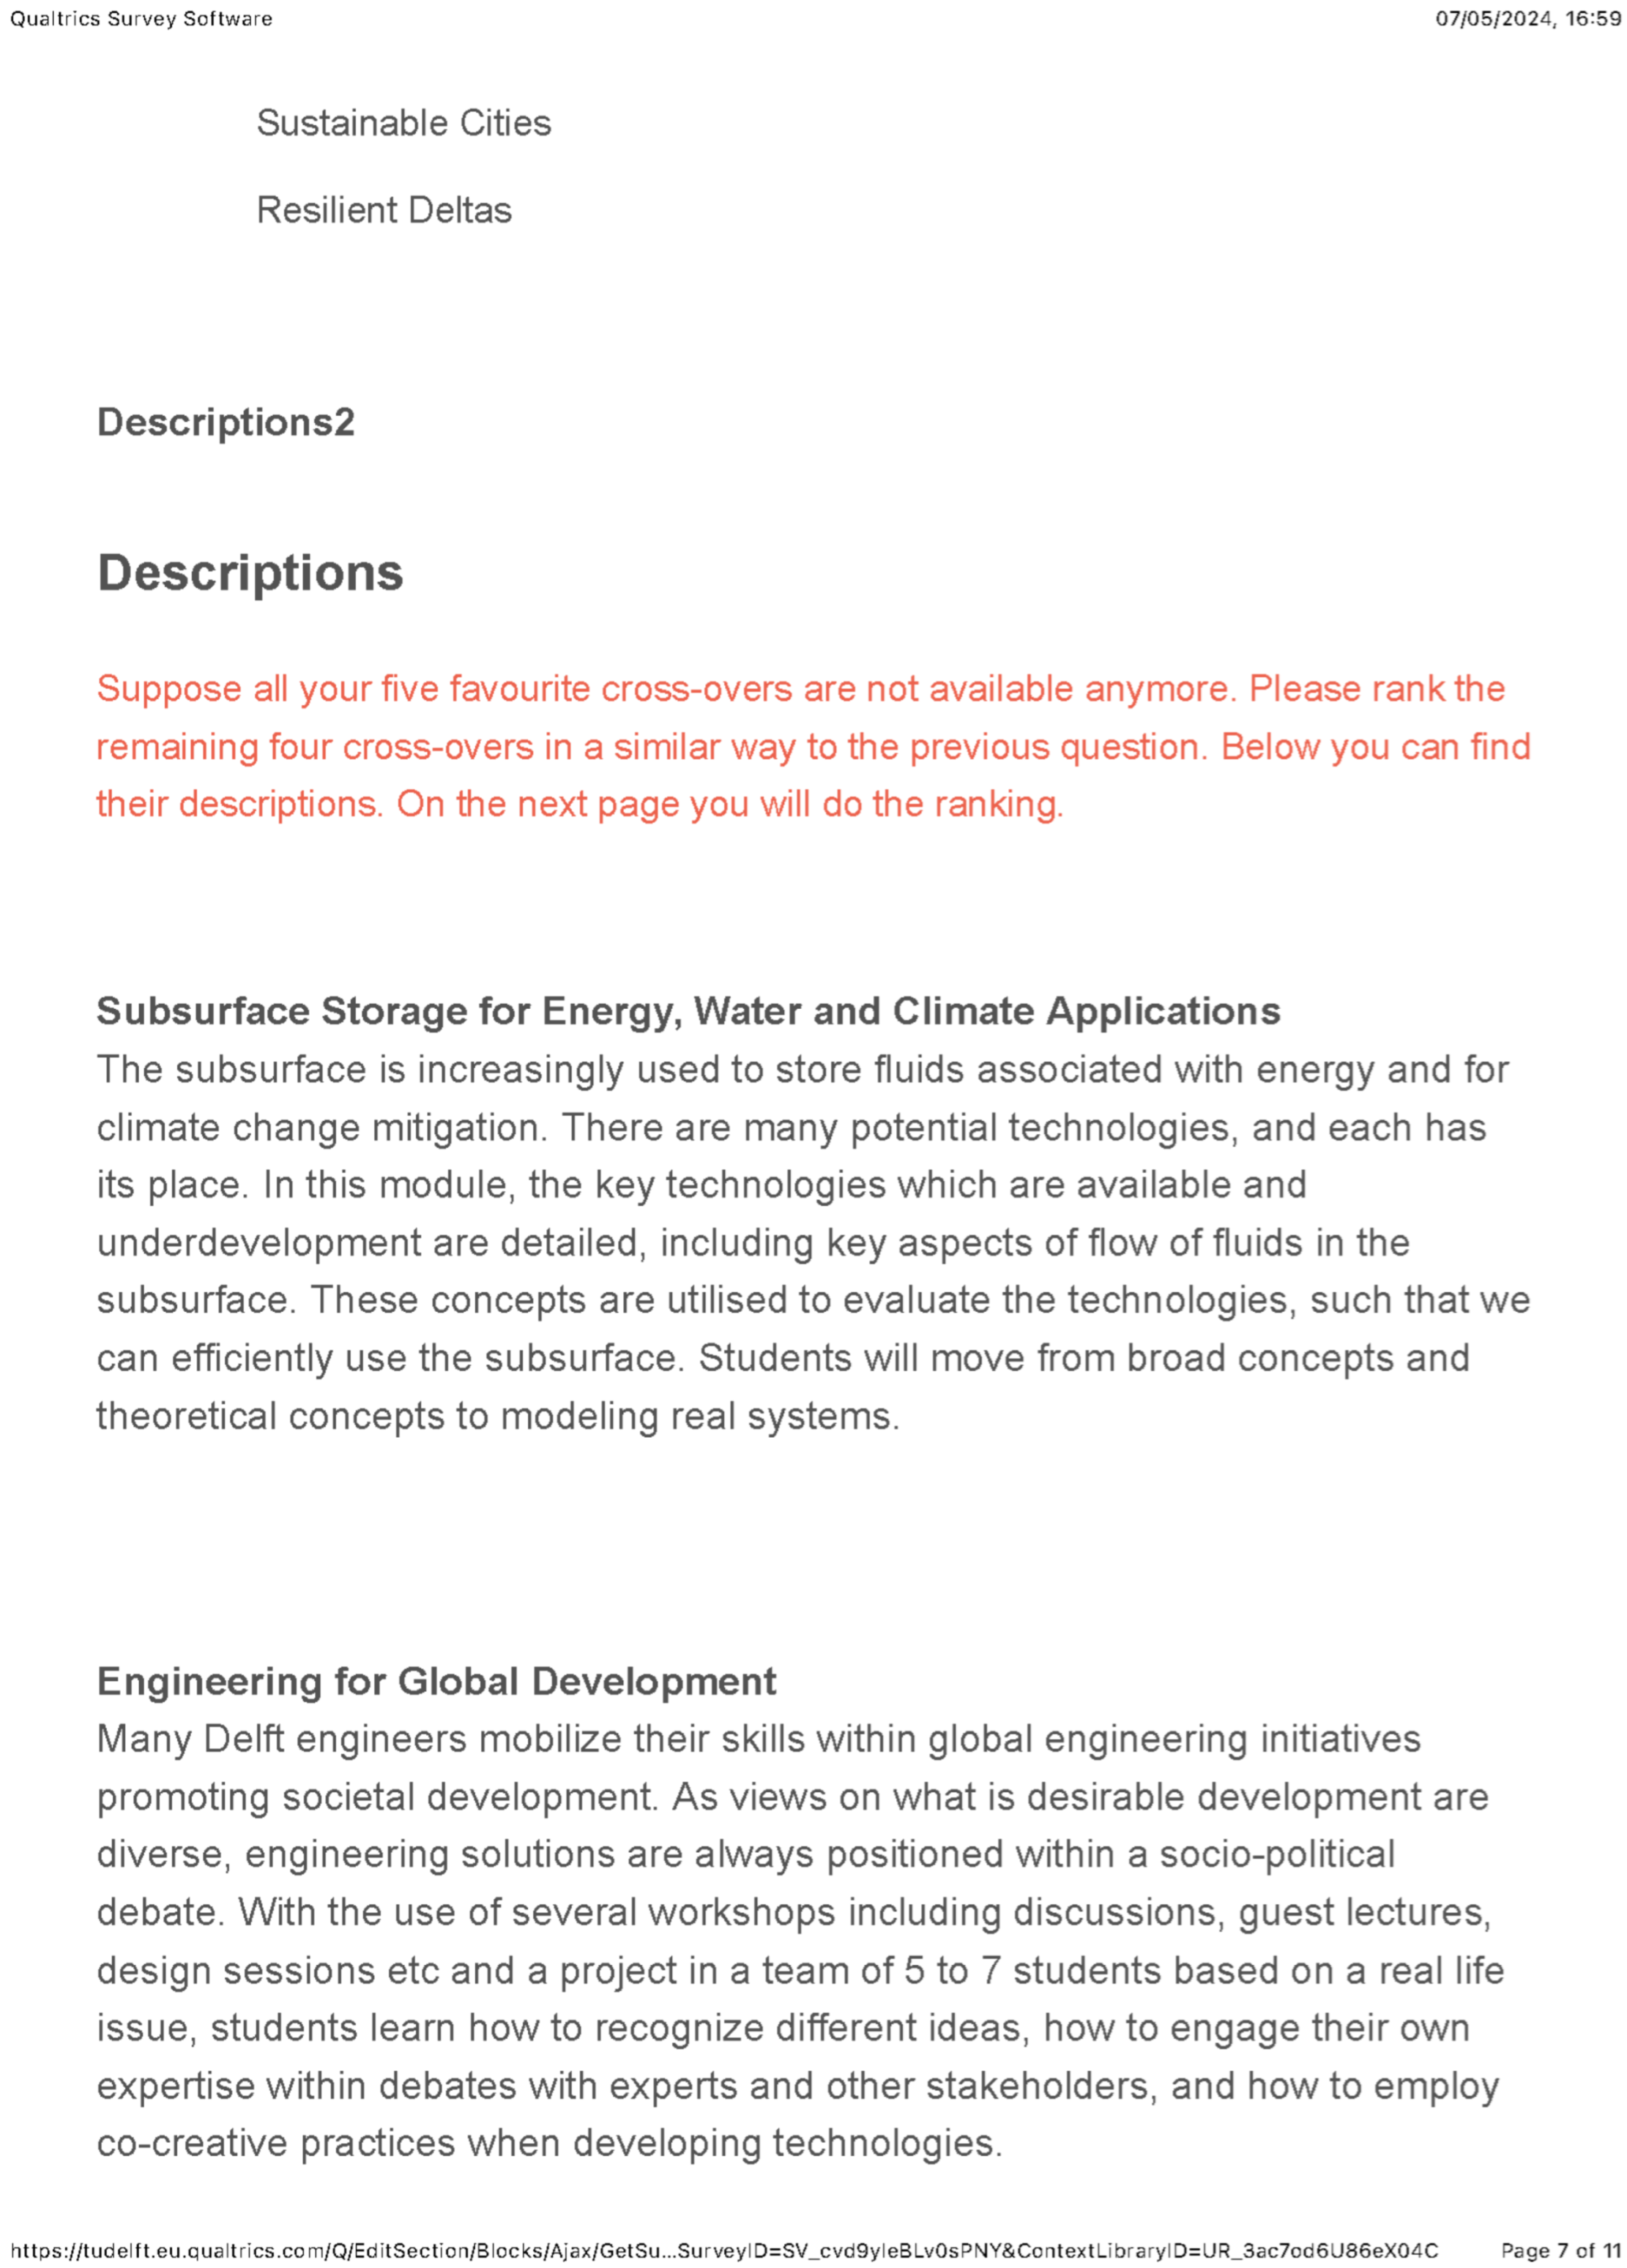
- Engineering for Global development ()
- Surbsurface storage for Energy, Water and Climate Applications ()
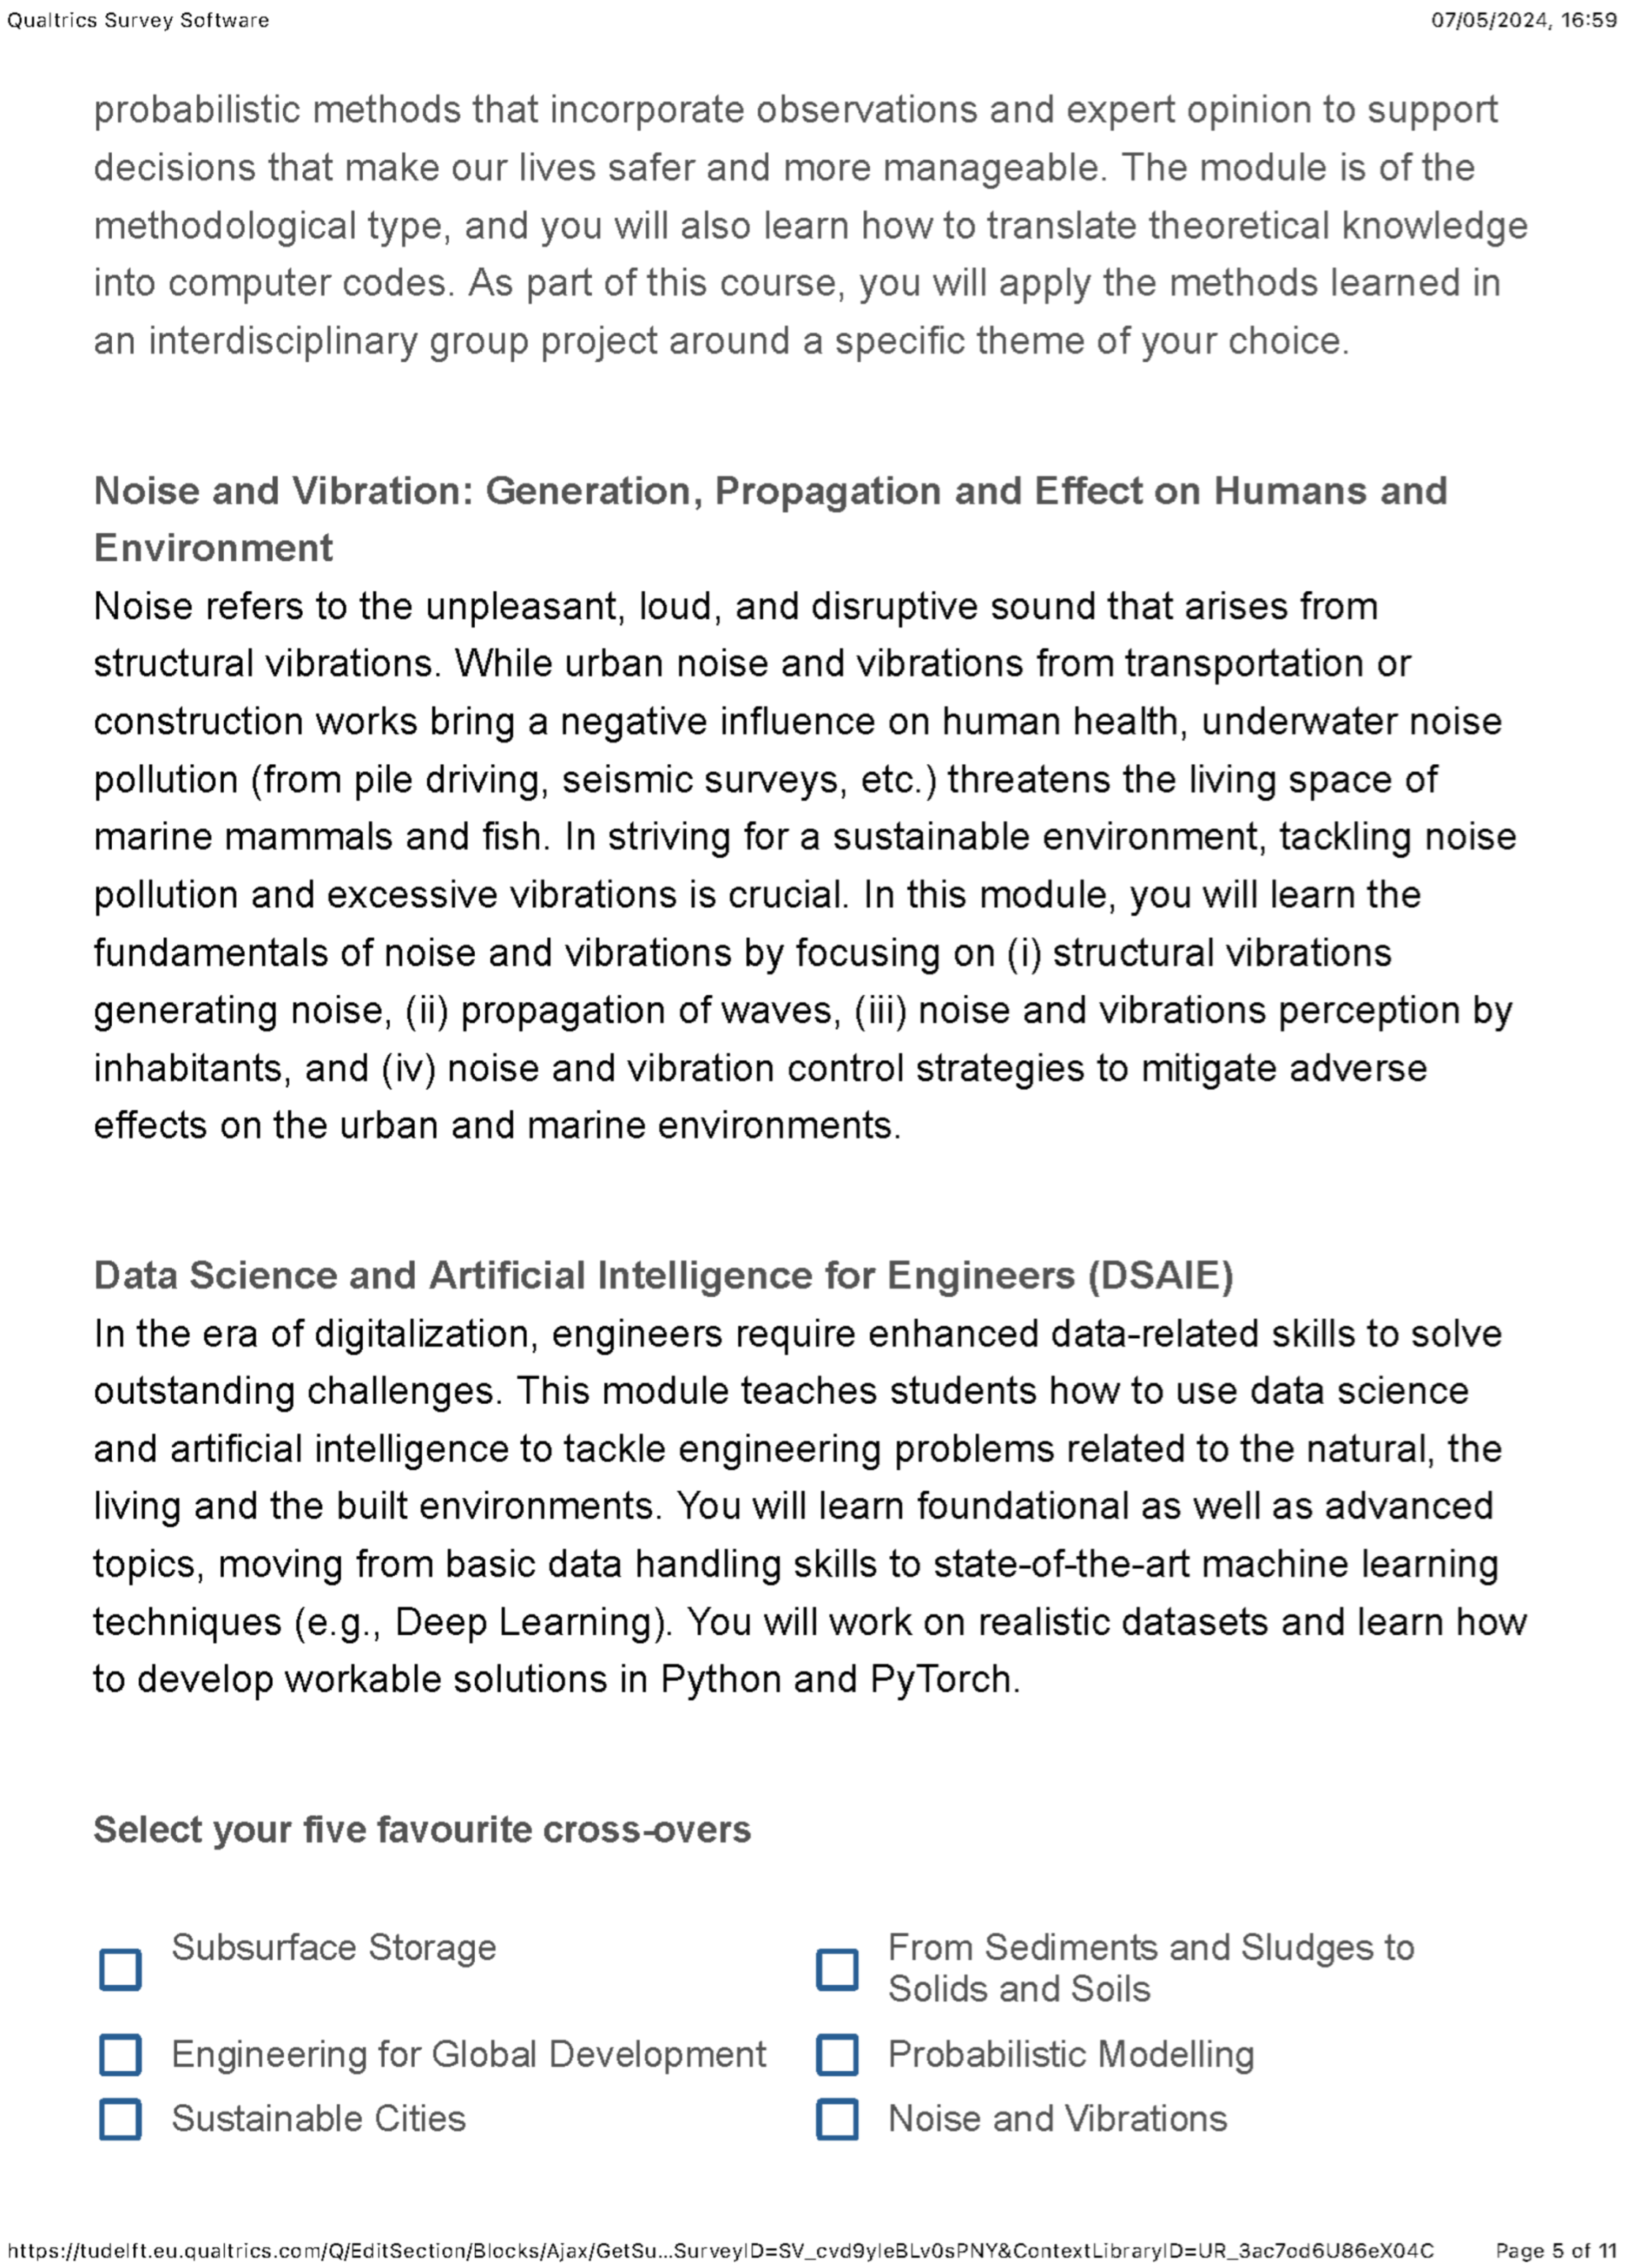
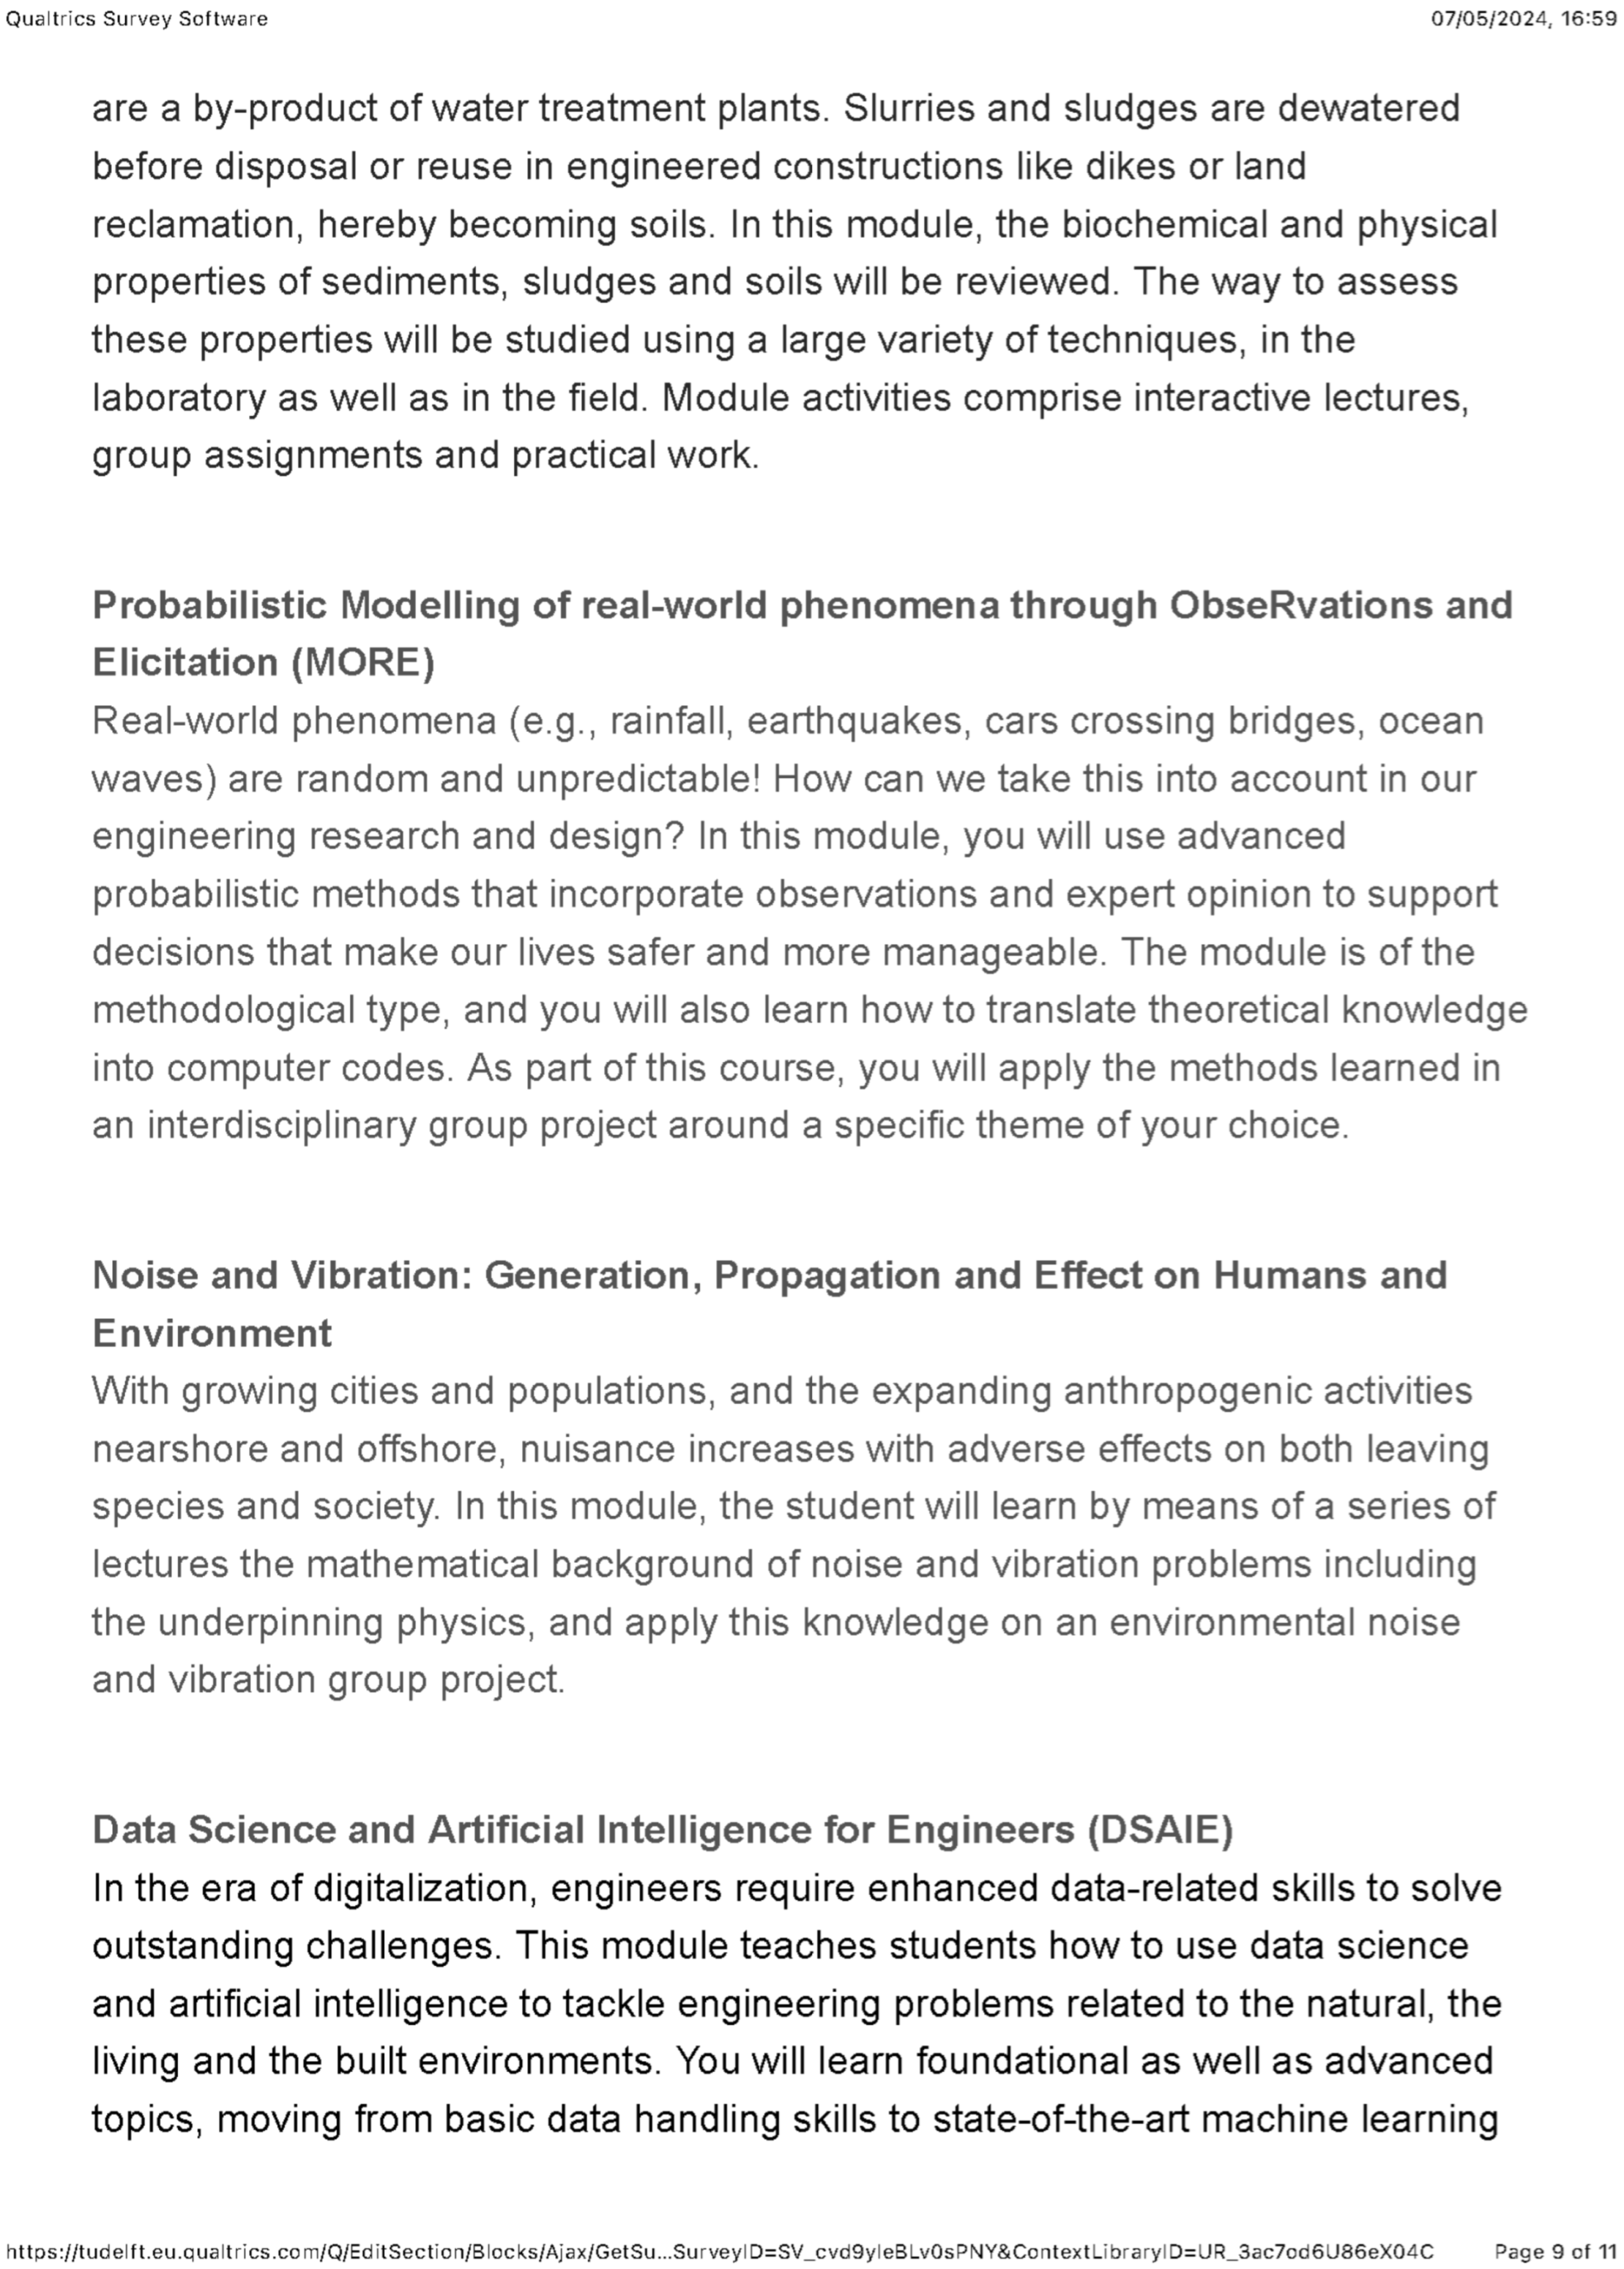
- Data Science and Artificial Intelligence for Engineers ()
- Noise and Vibration: Generation, Propagation, and Effect on Humans and Environment ()
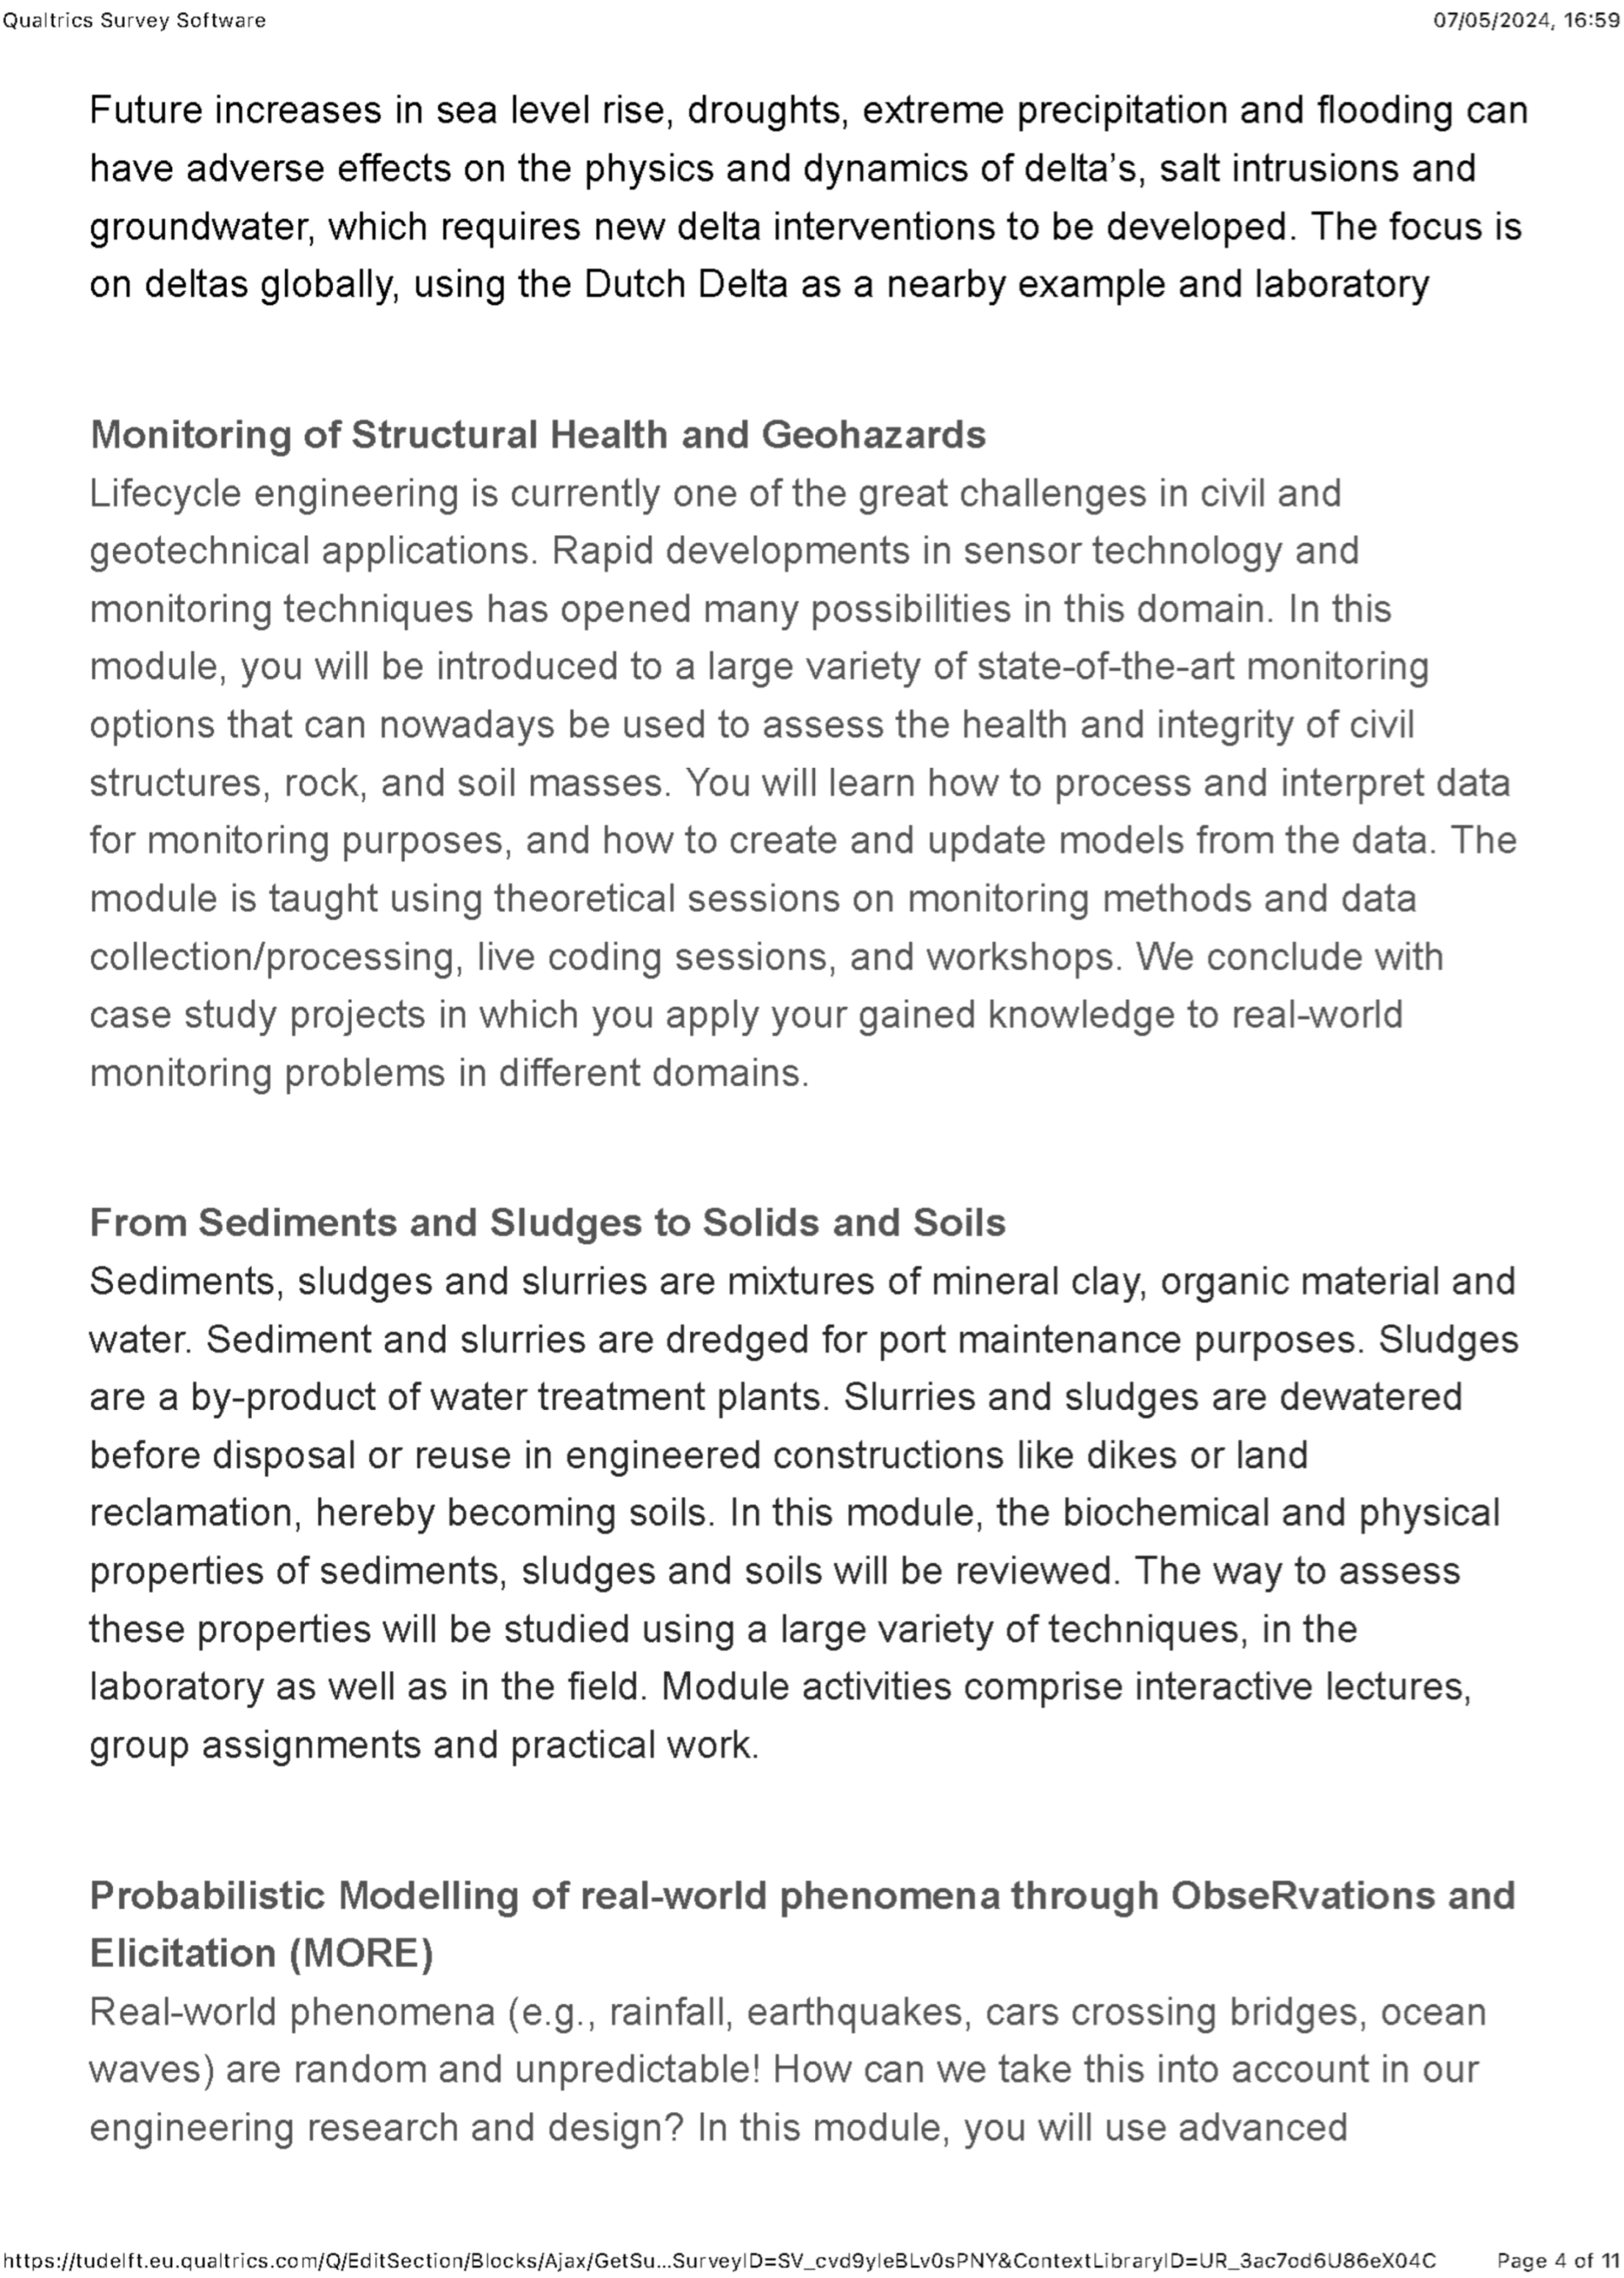
- Probabilistic Modelling of real-world phenomena through Observations and Elicitation ()
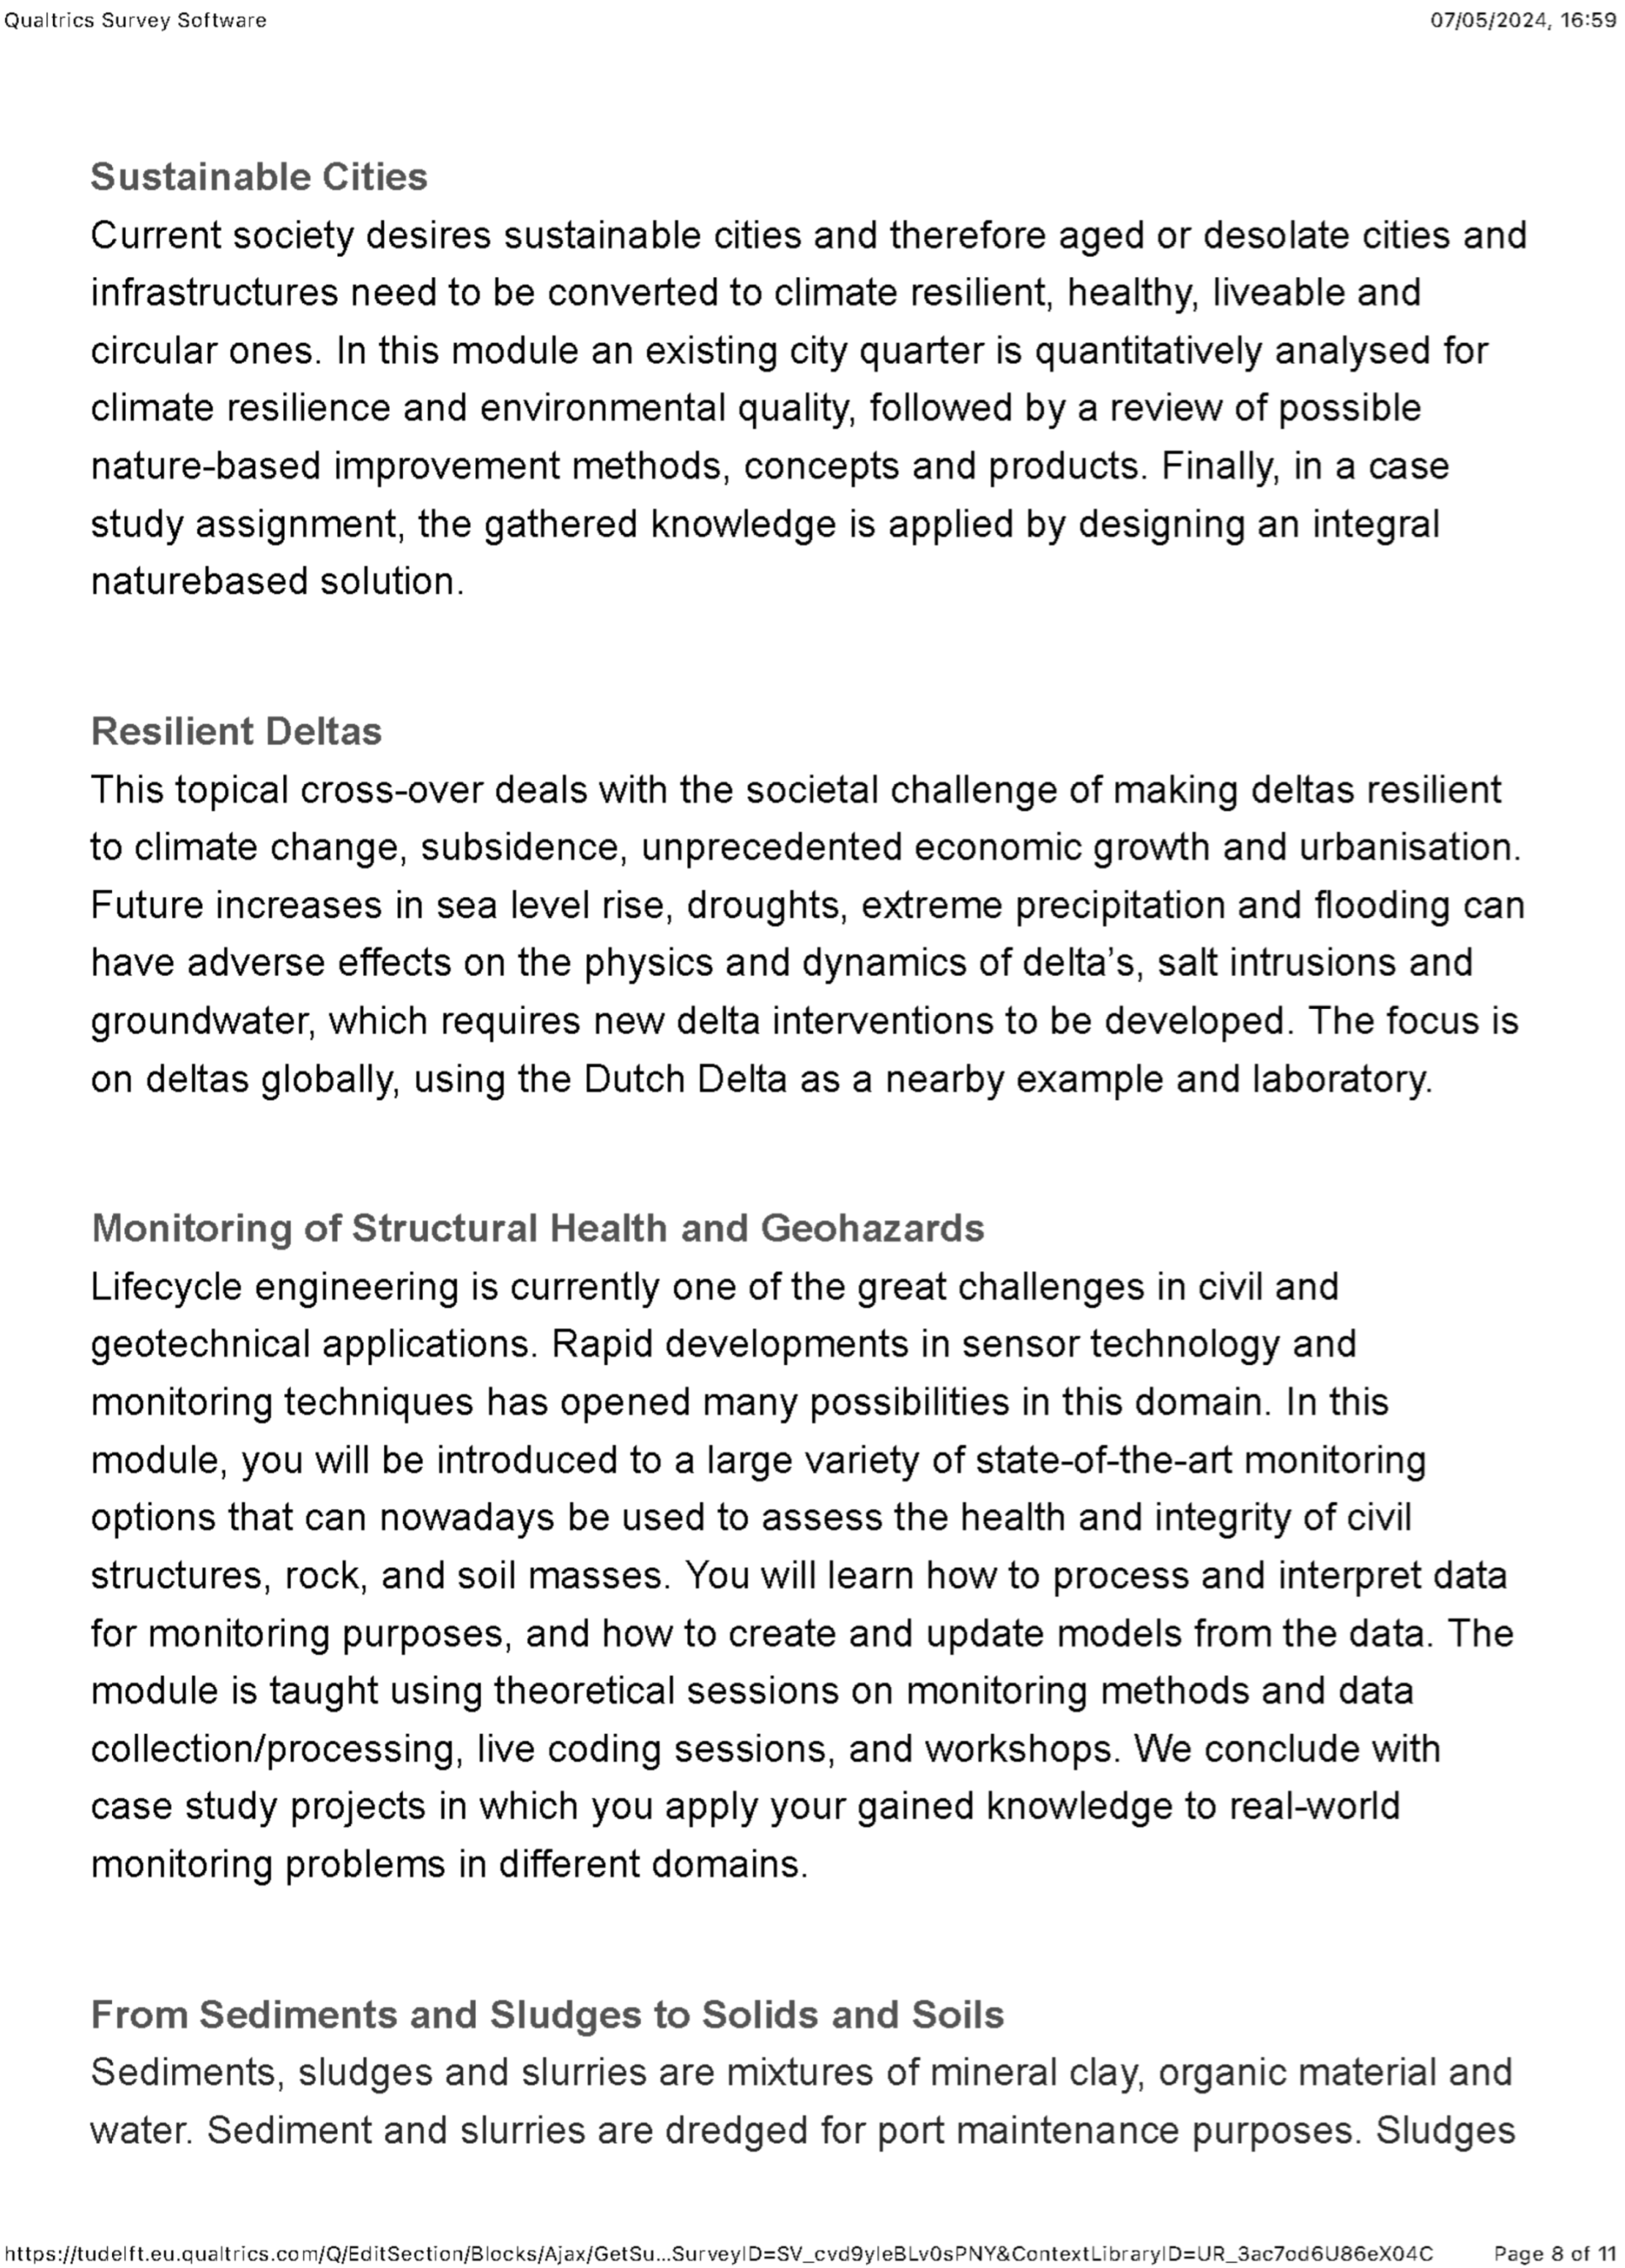
- From Sediments and Sludges to Solids and Soils ()
- Monitoring of Structural Health and Geohazards ()
- Sustainable cities: Ecoengineering Solutions for Climate Resilient and Healthy Cities ()
2. Materials and Methods
2.1. Questionnaire Design
- Welcome message with information such as an approximation of the time that it takes to fill out the survey.
- Questions about the study background, where the student indicates their MSc program and the path within that MSc program. For instance, the MSc in Environmental Engineering has three paths: (1) resource and waste engineering, (2) atmospheric environmental engineering, and (3) water resource engineering. The list of the paths in each MSc program can be found in Appendix B.
- Brief description of each of the Cross-Overs.
- Selection of the preferred five Cross-Overs.
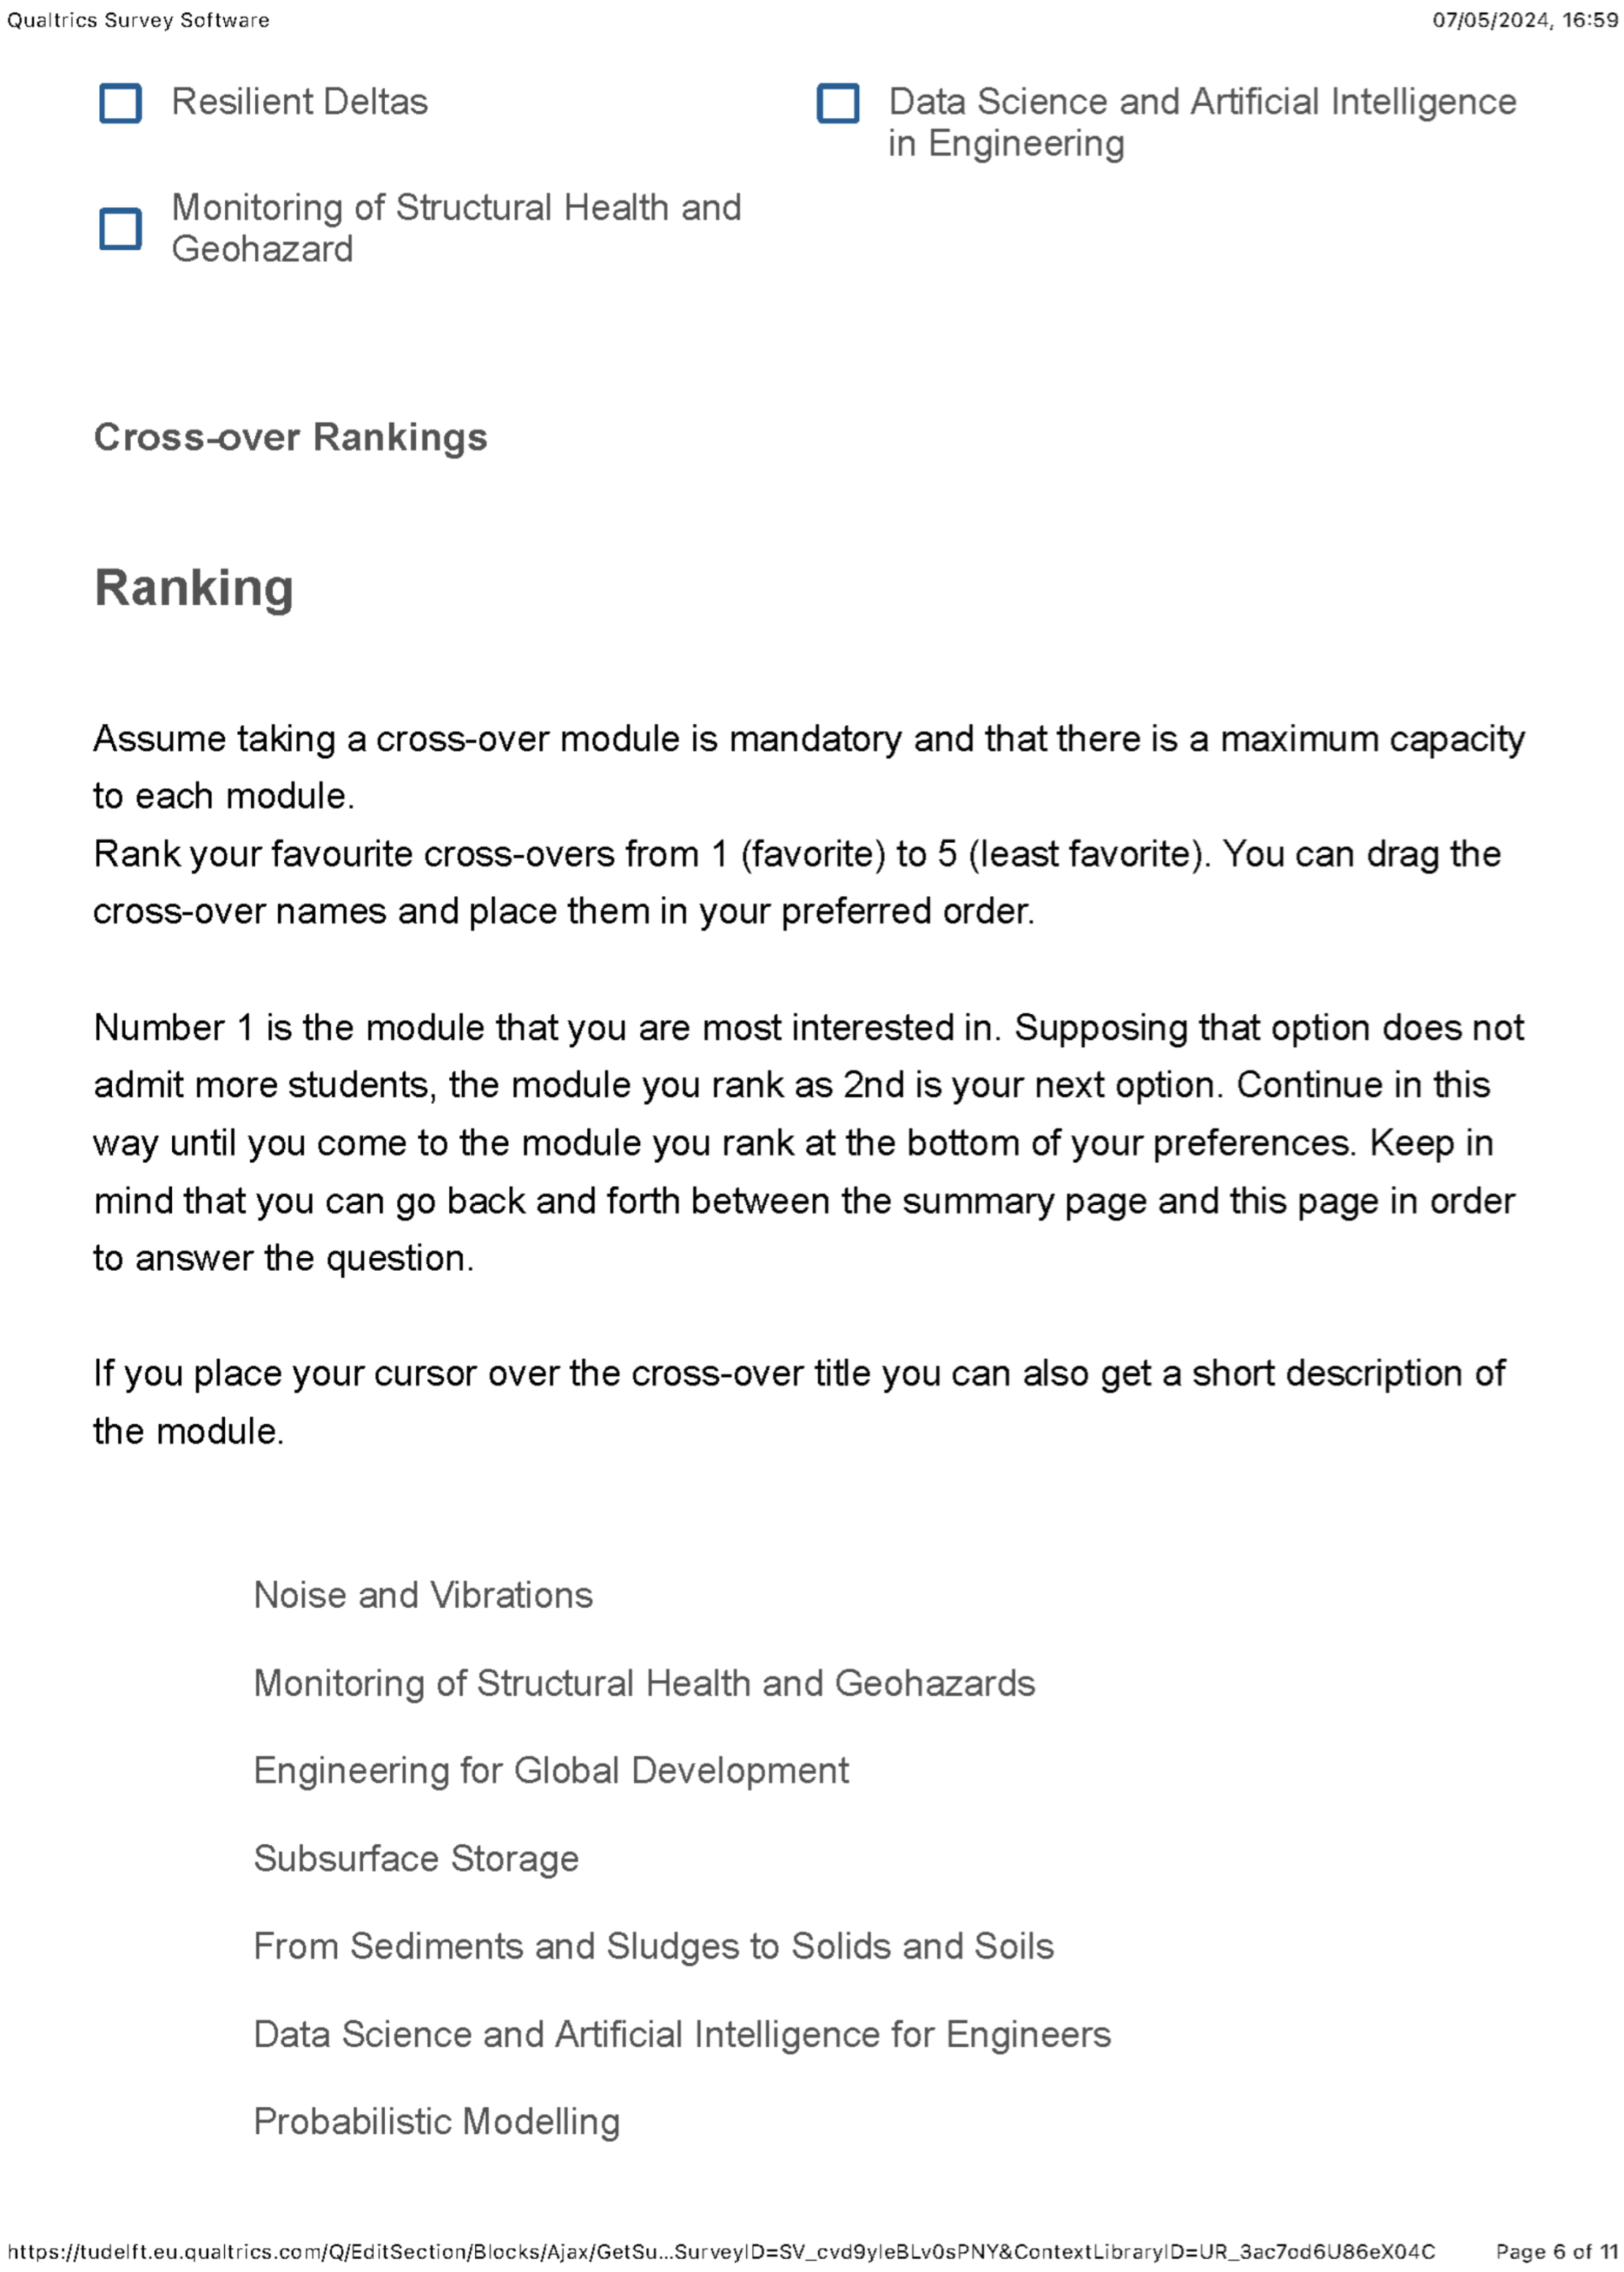
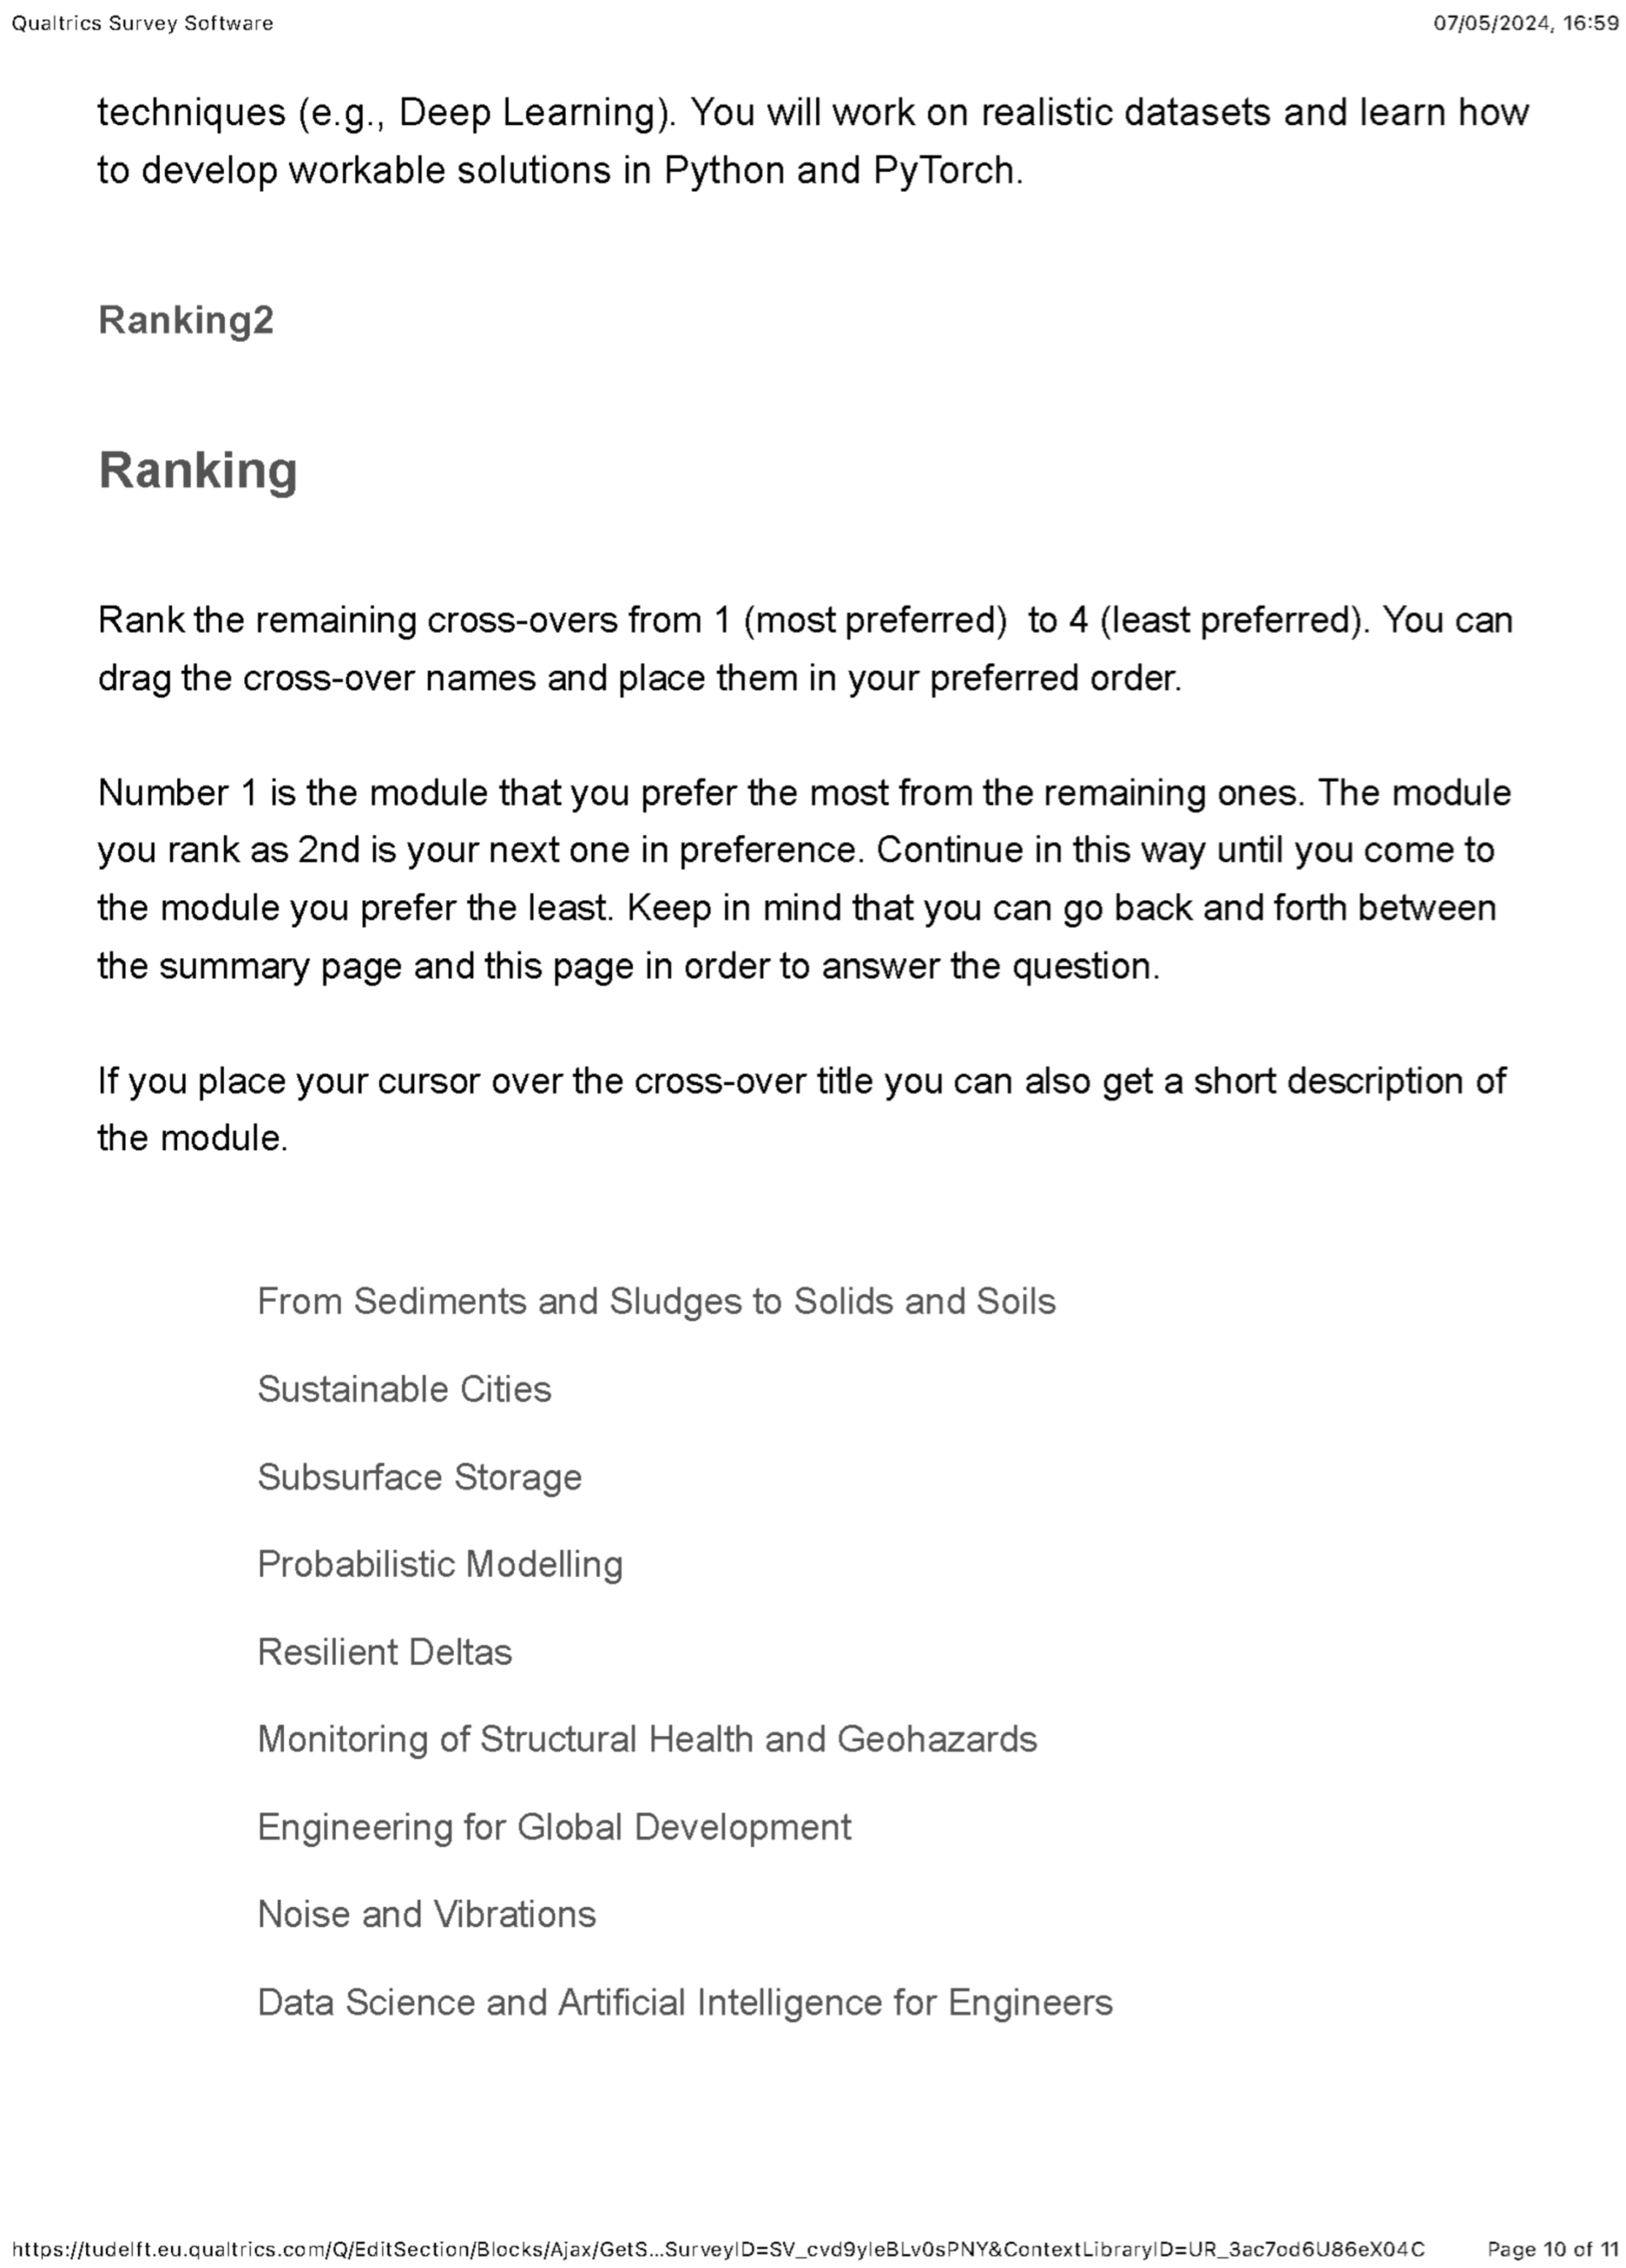
- Ranking of the preferred five Cross-Overs.
- Ranking of the remaining Cross-Overs.
2.2. Probabilistic Analysis
3. Results
3.1. Assessing the Survey as a Tool to Monitor Students’ Preferences
3.1.1. Number of Students per Cross-Over During the Academic Year 2023/2024
3.1.2. Distribution of Students for Each Path per Cross-Over, Academic Year 2023/2024
3.2. Analyzing the Students’ Preferences
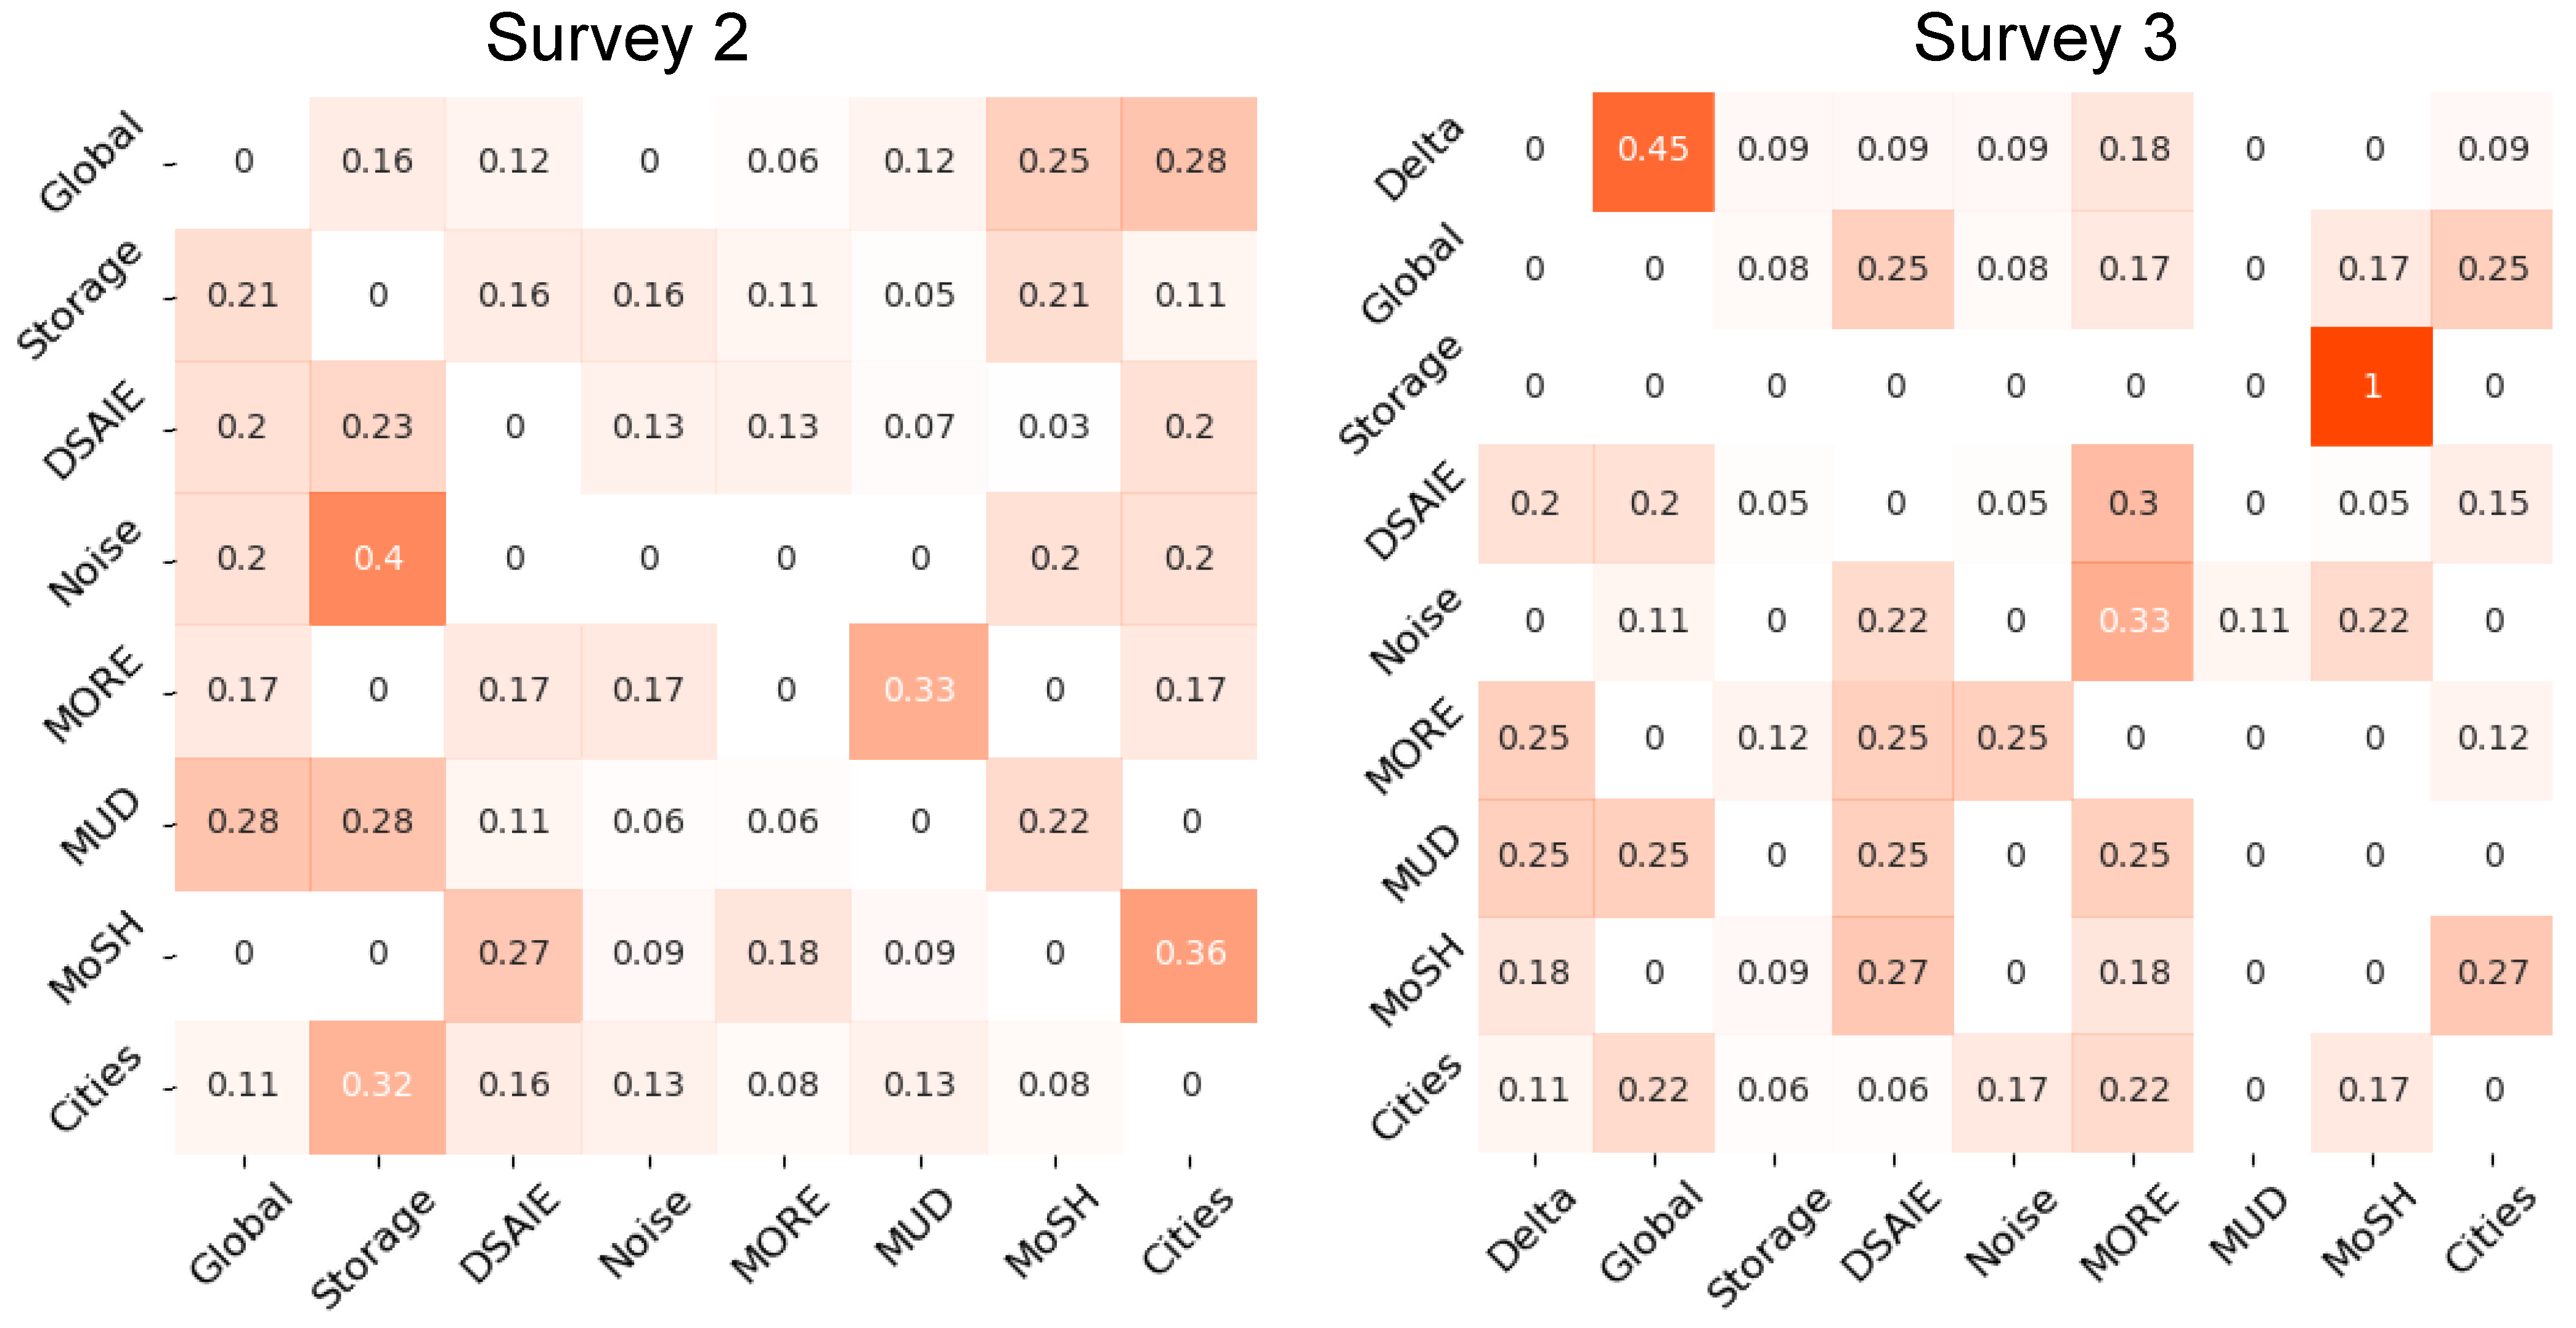
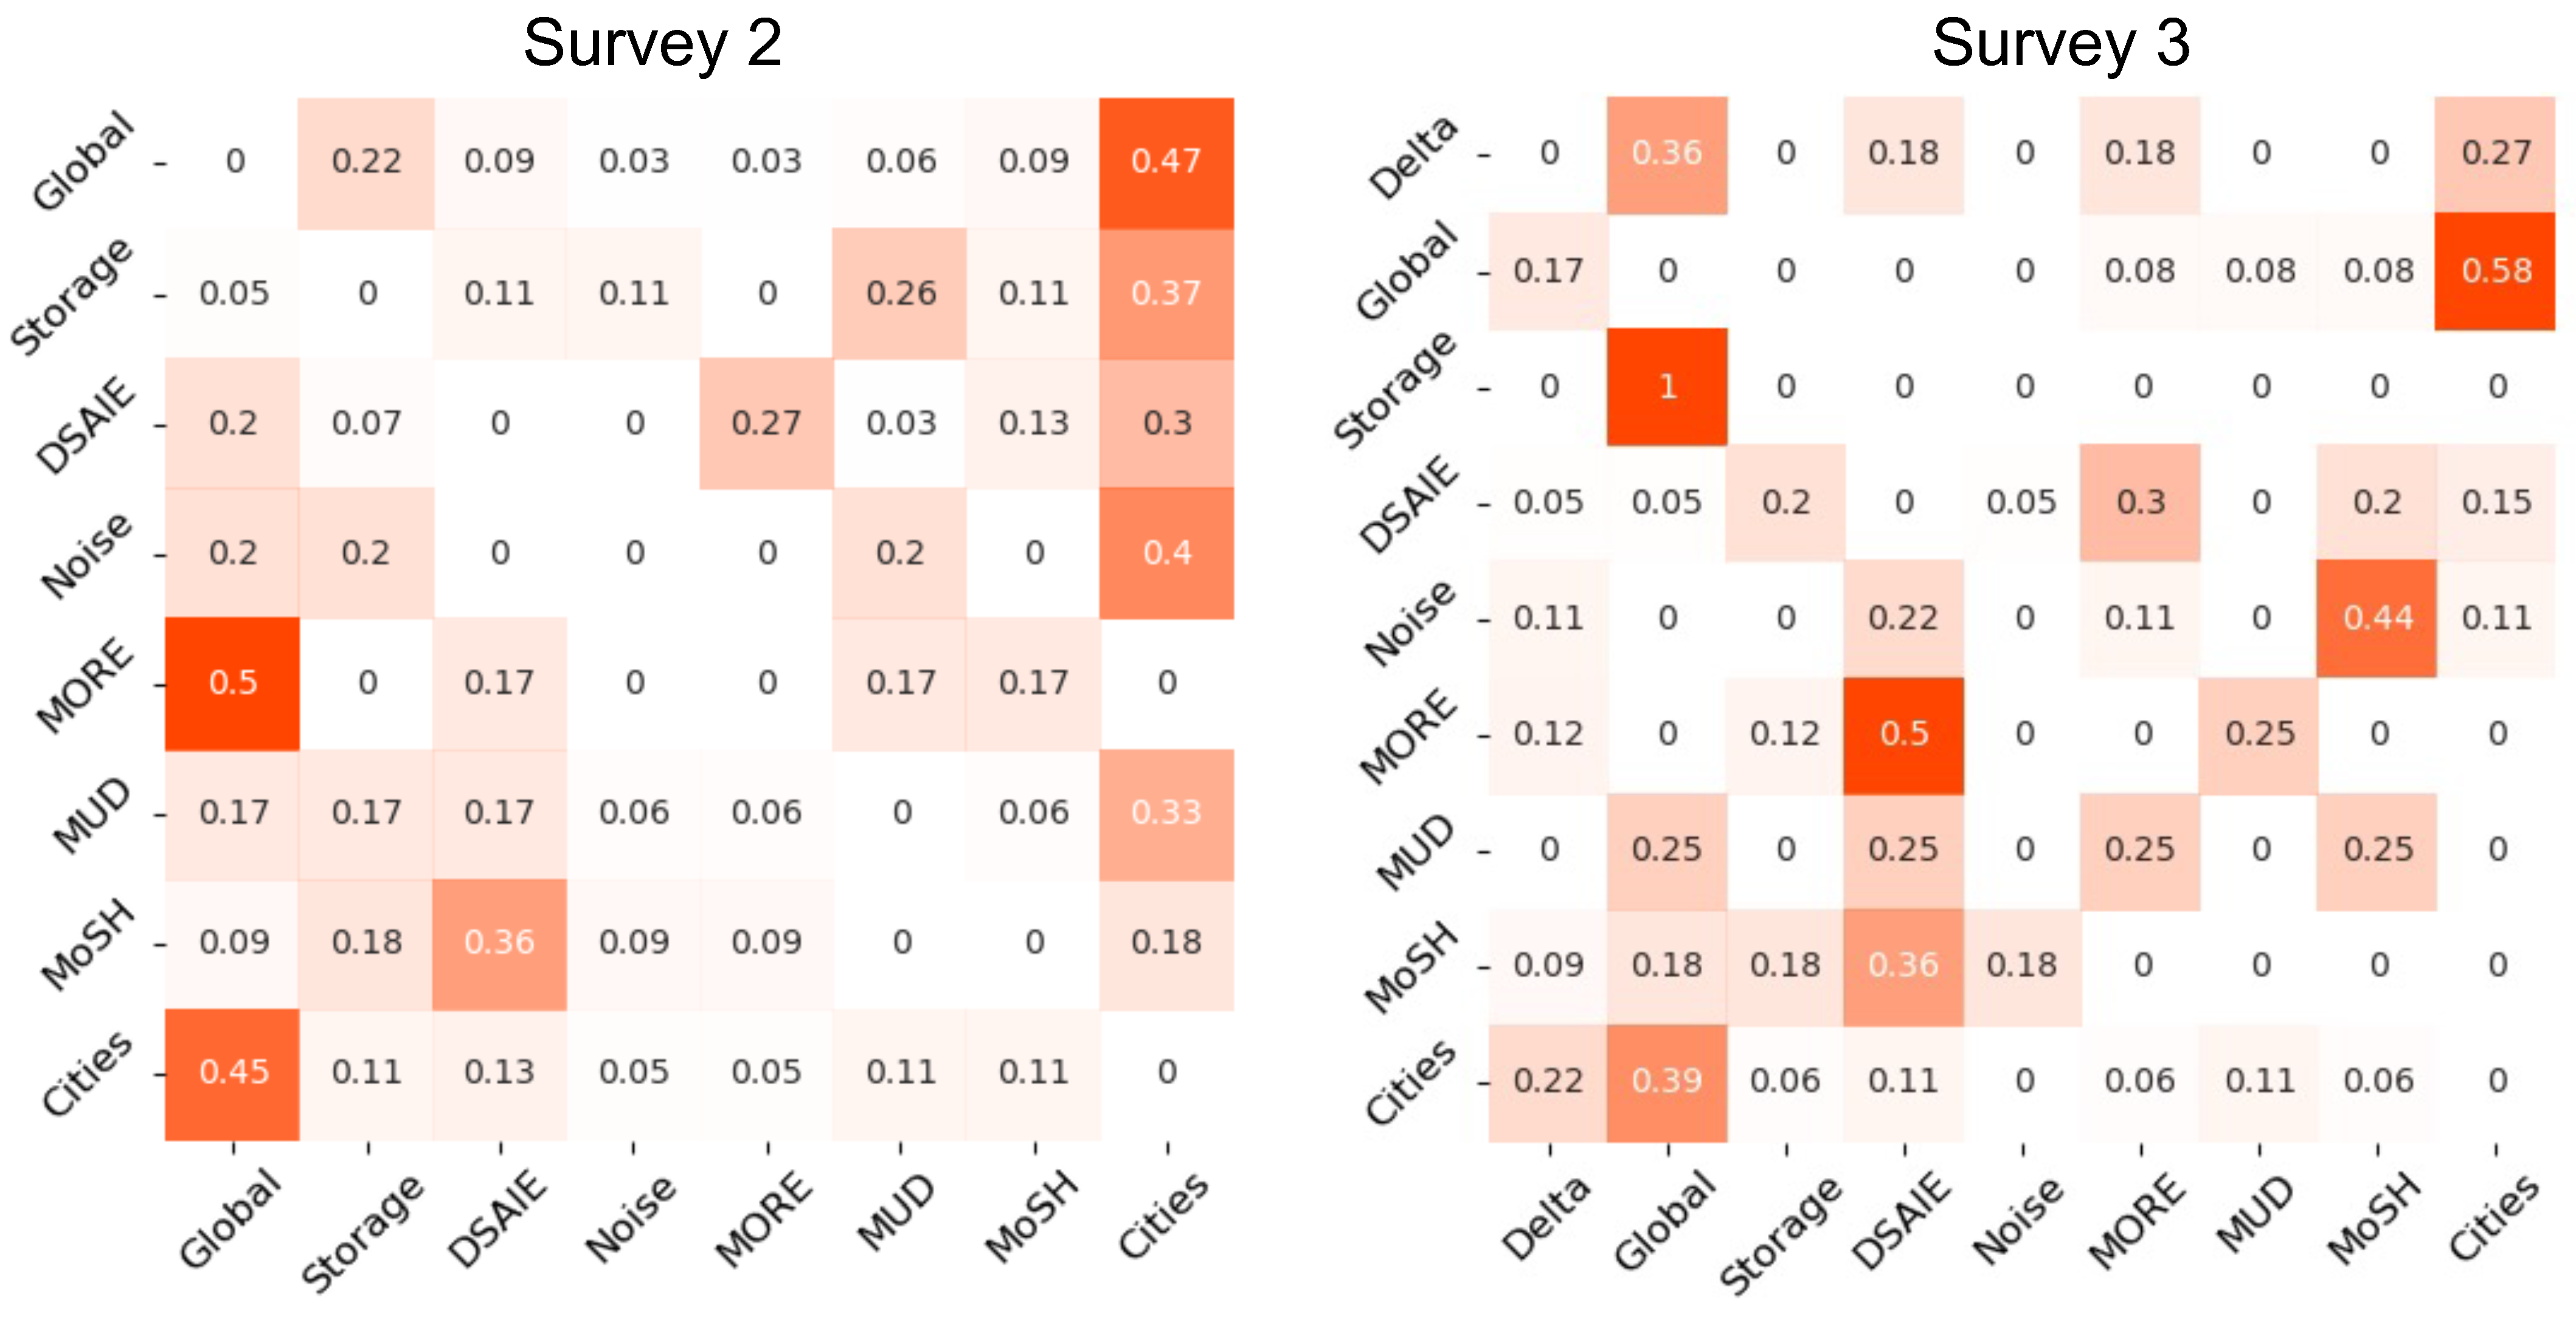
3.2.1. Relationship Between First, Second, and Third Choices
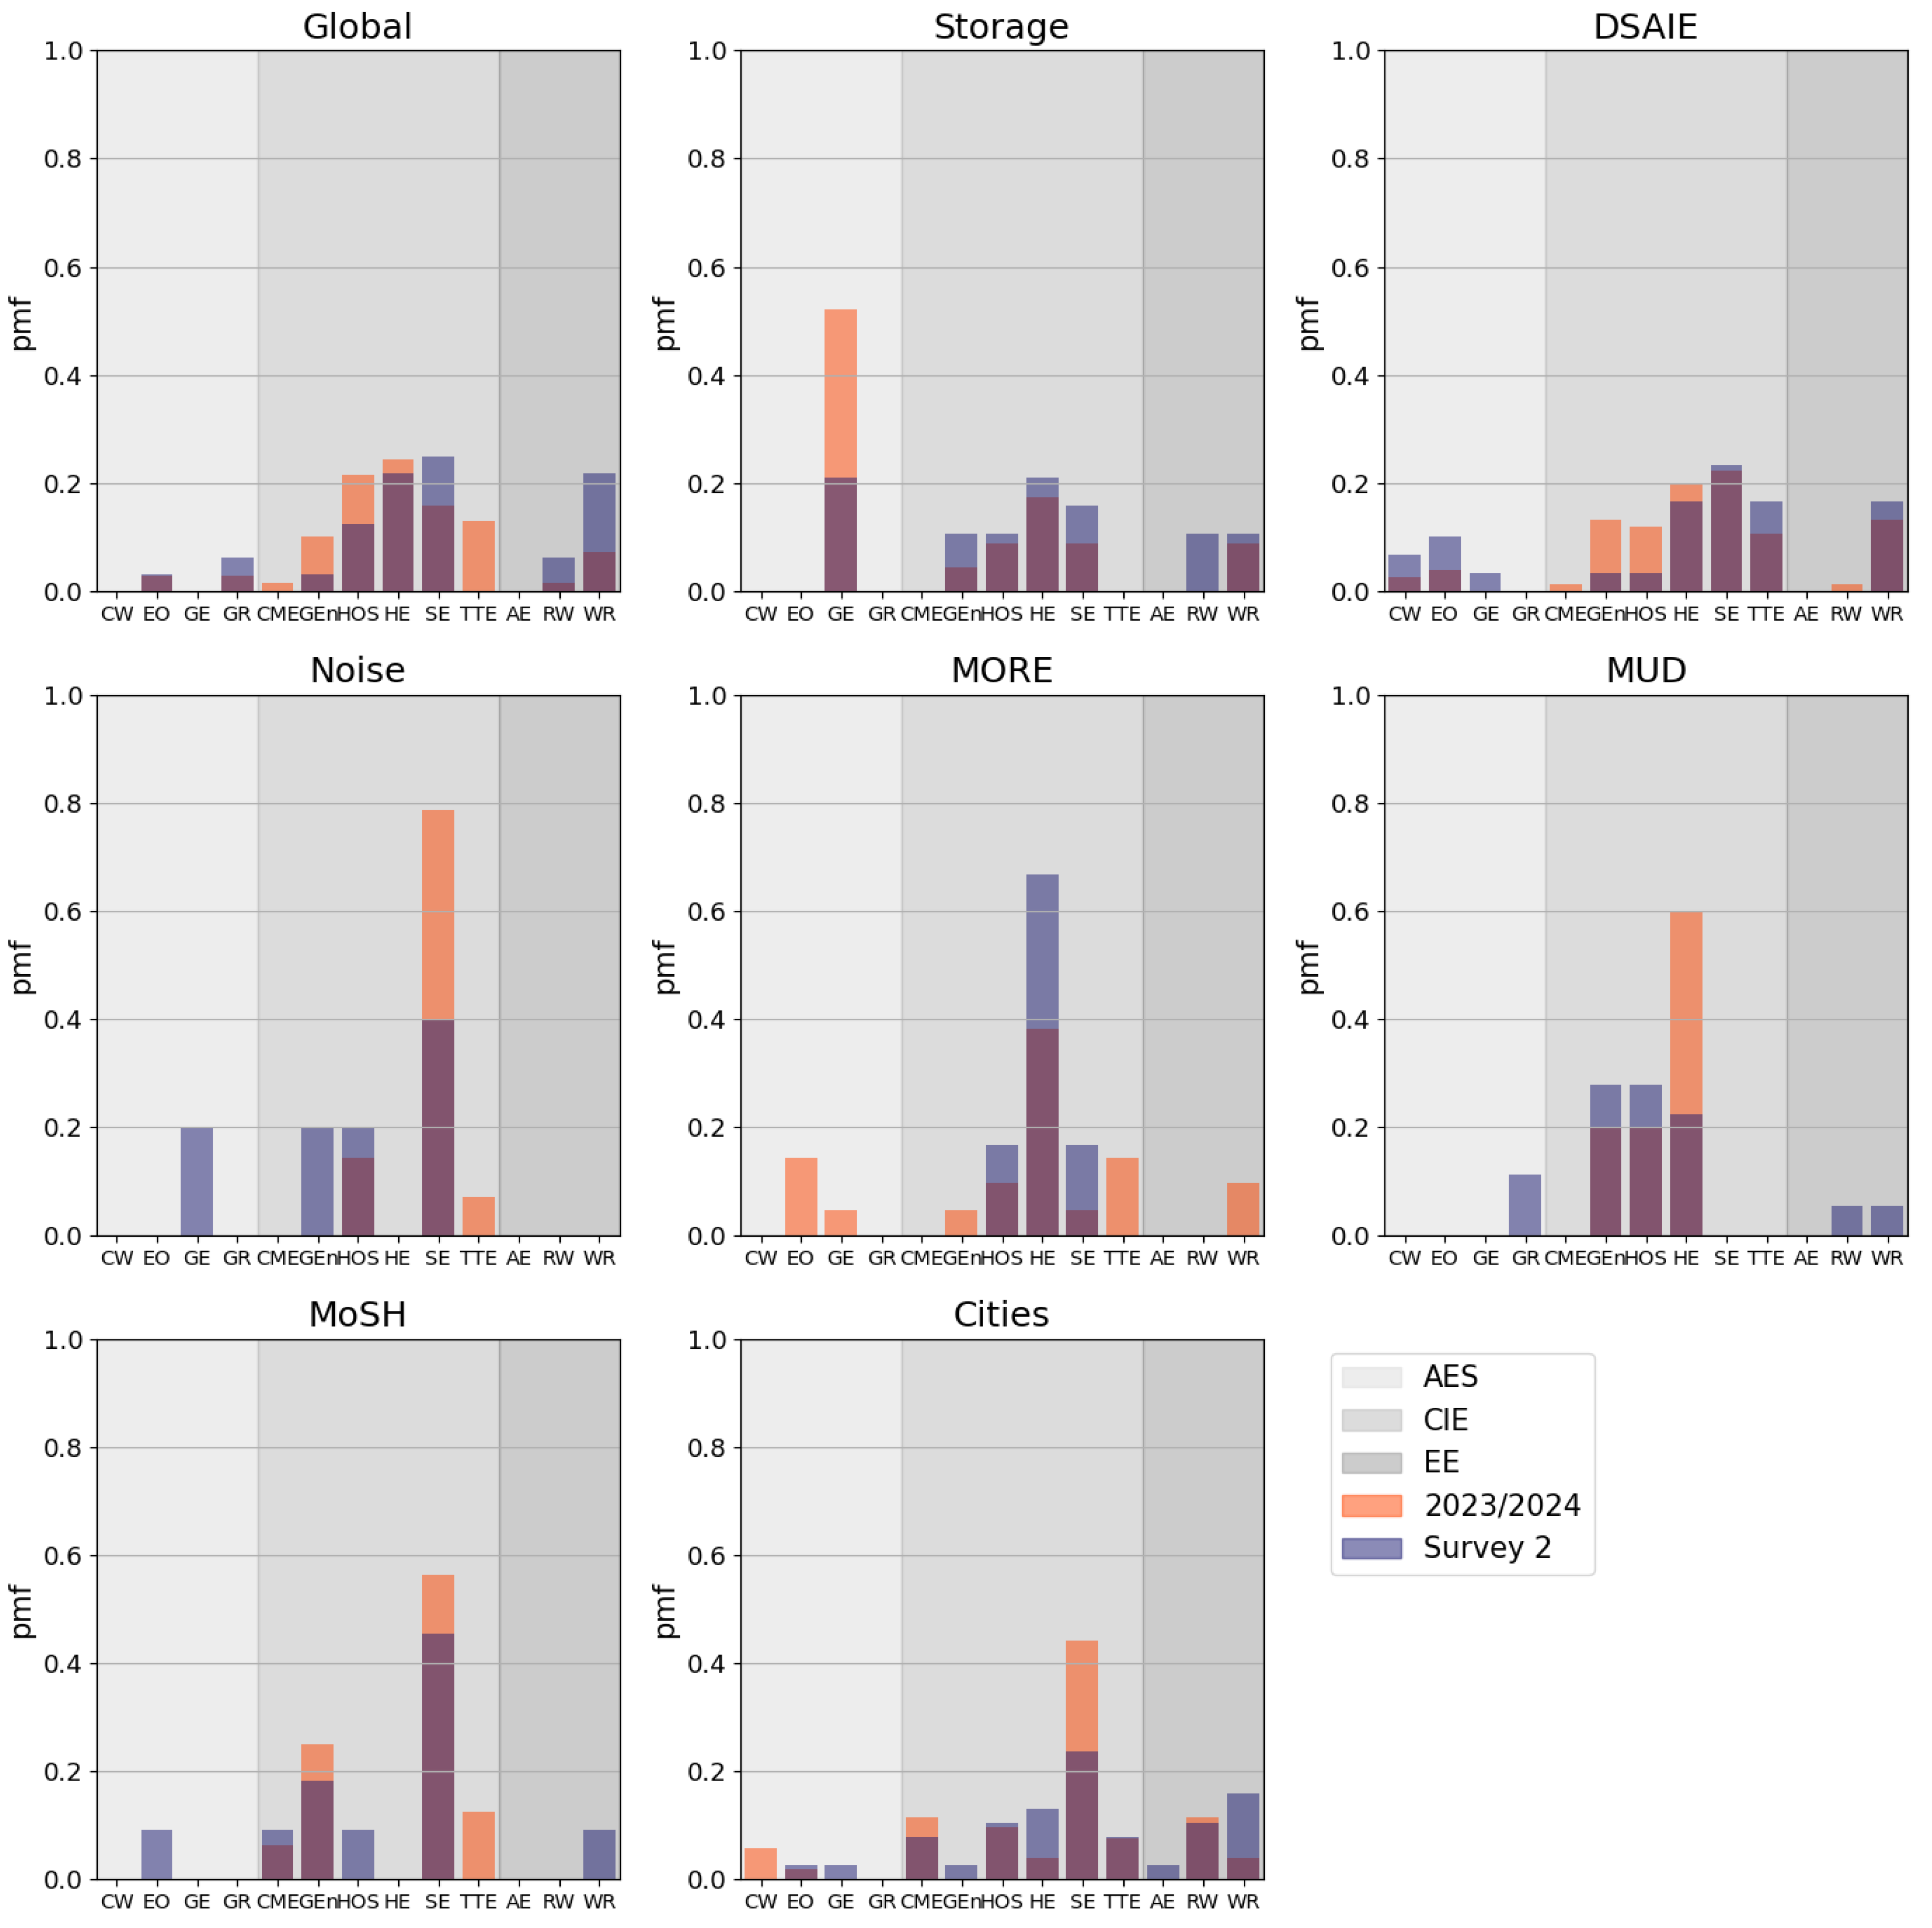
3.2.2. Influence of Students’ Background on Their Preferences
3.3. Estimating Students’ Preferences
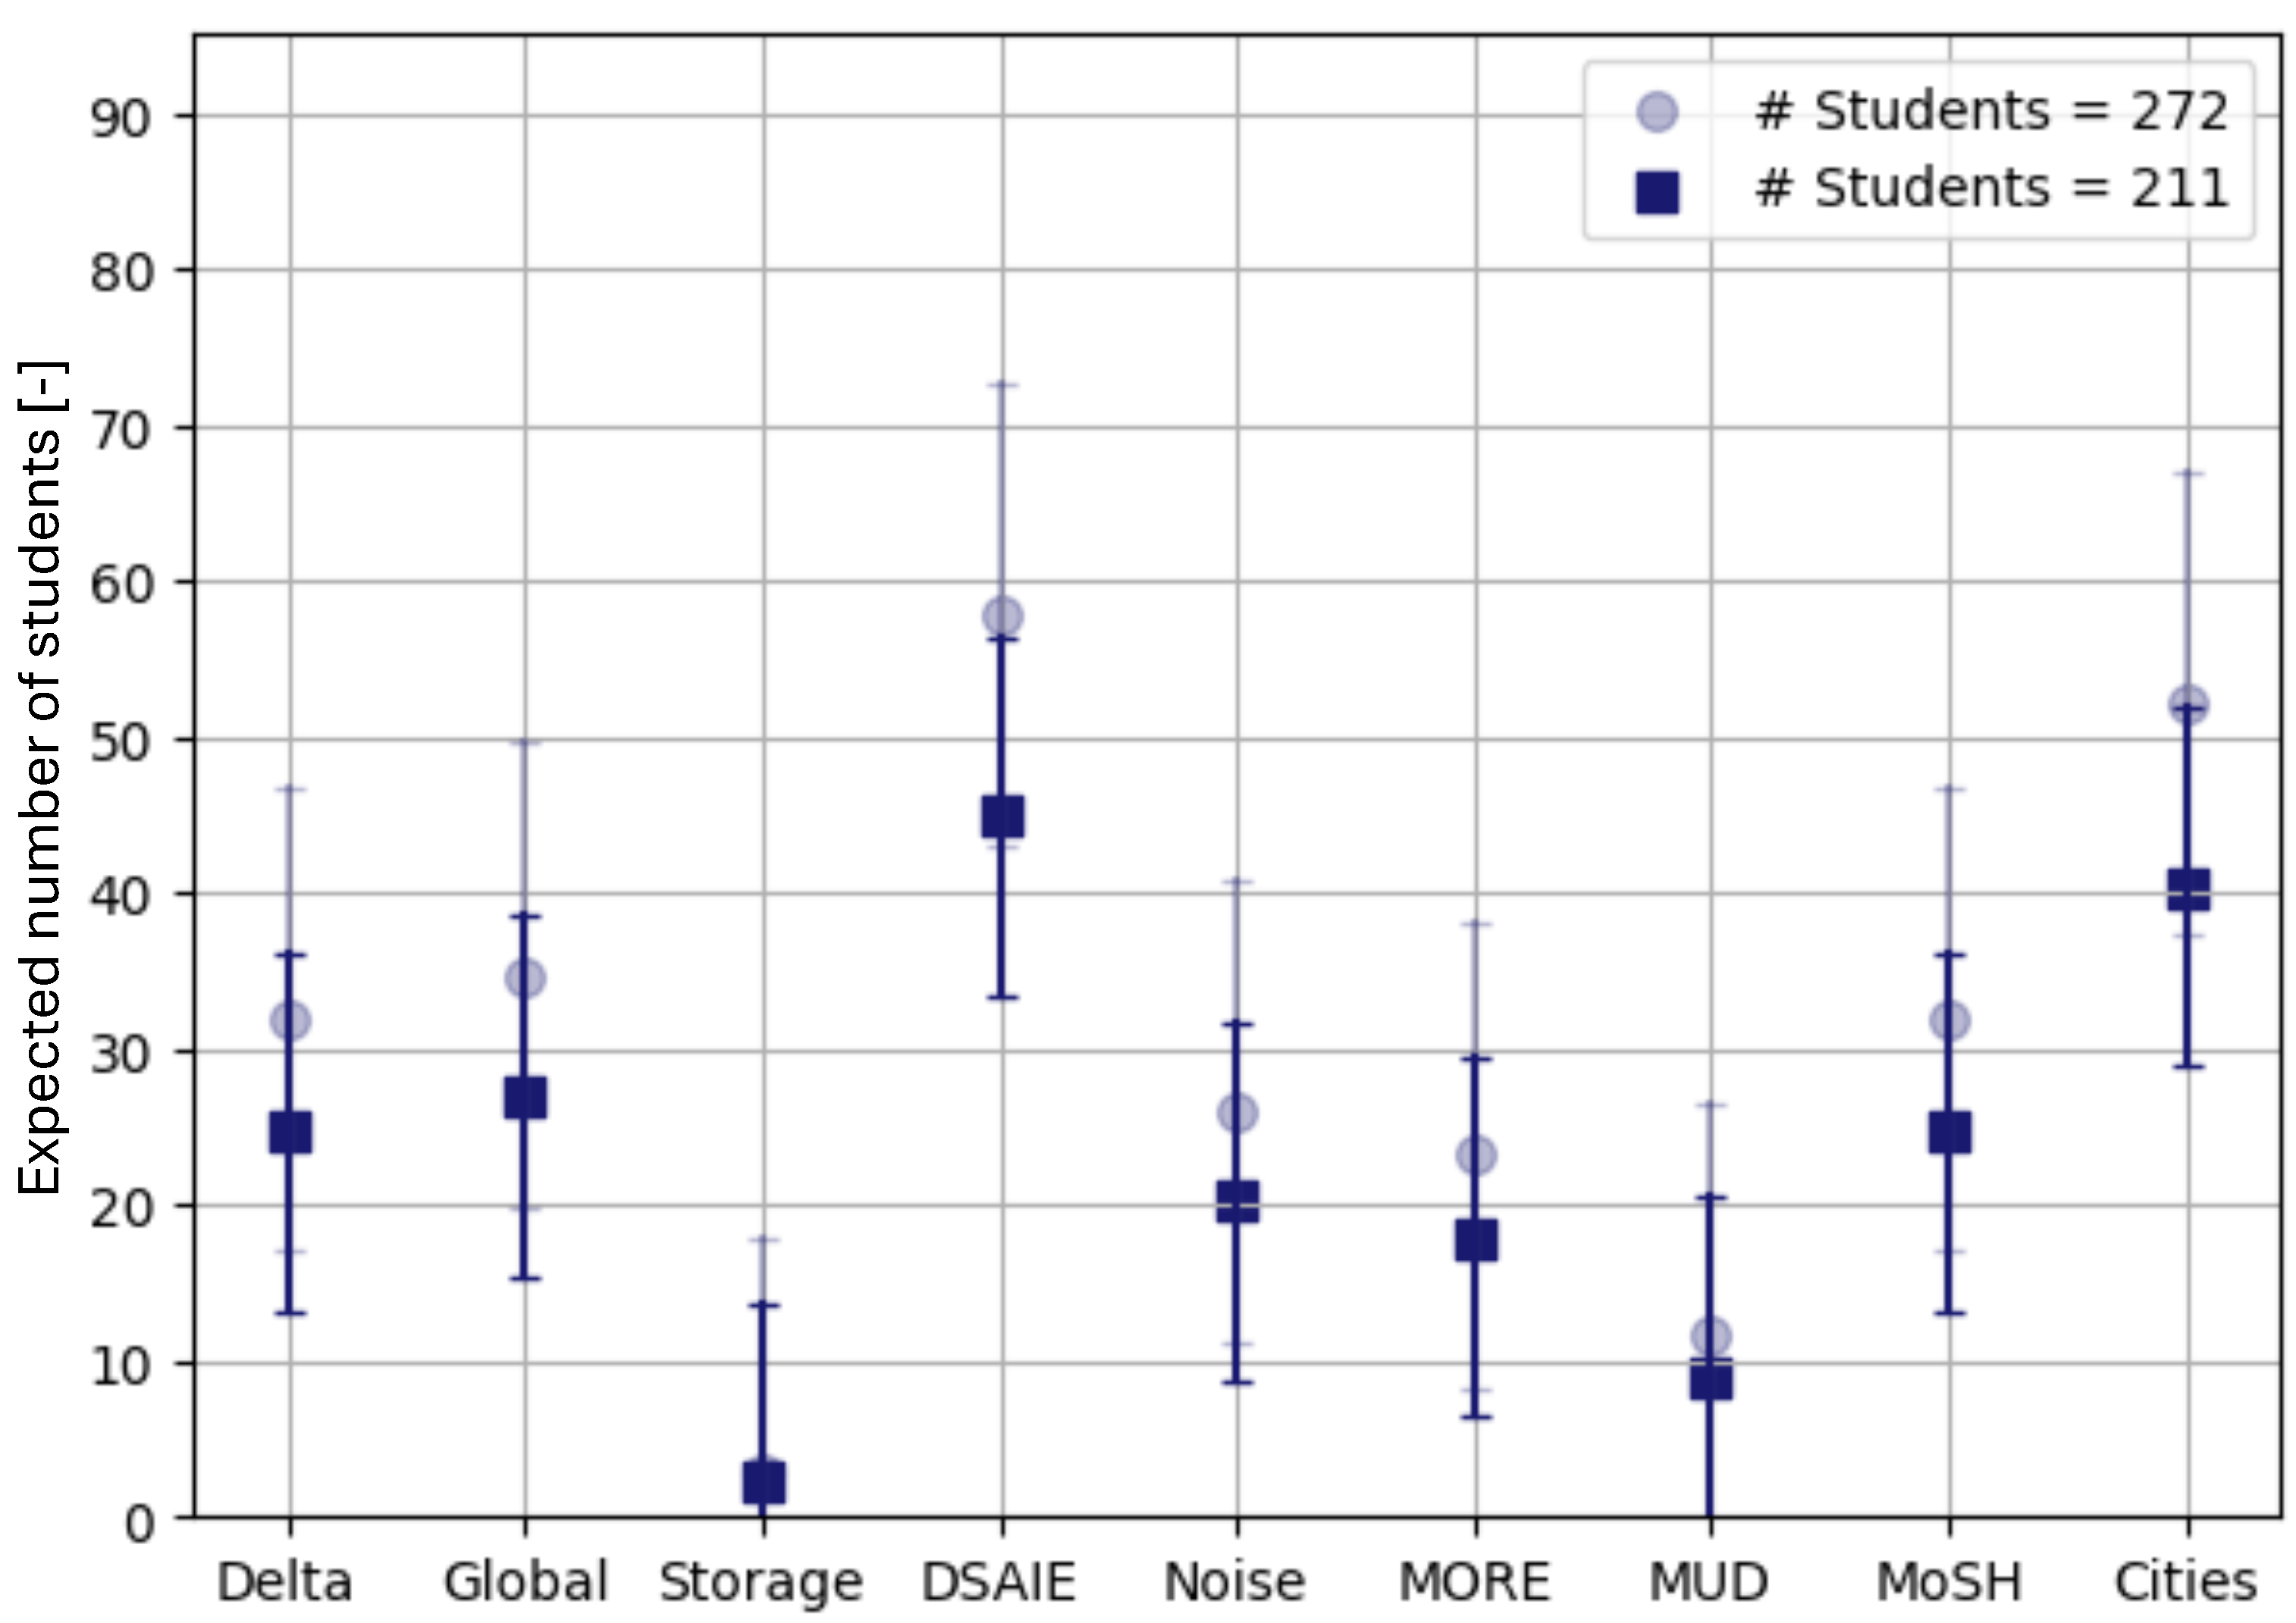
3.3.1. Expected Number of Students per Cross-Over for the Coming Year
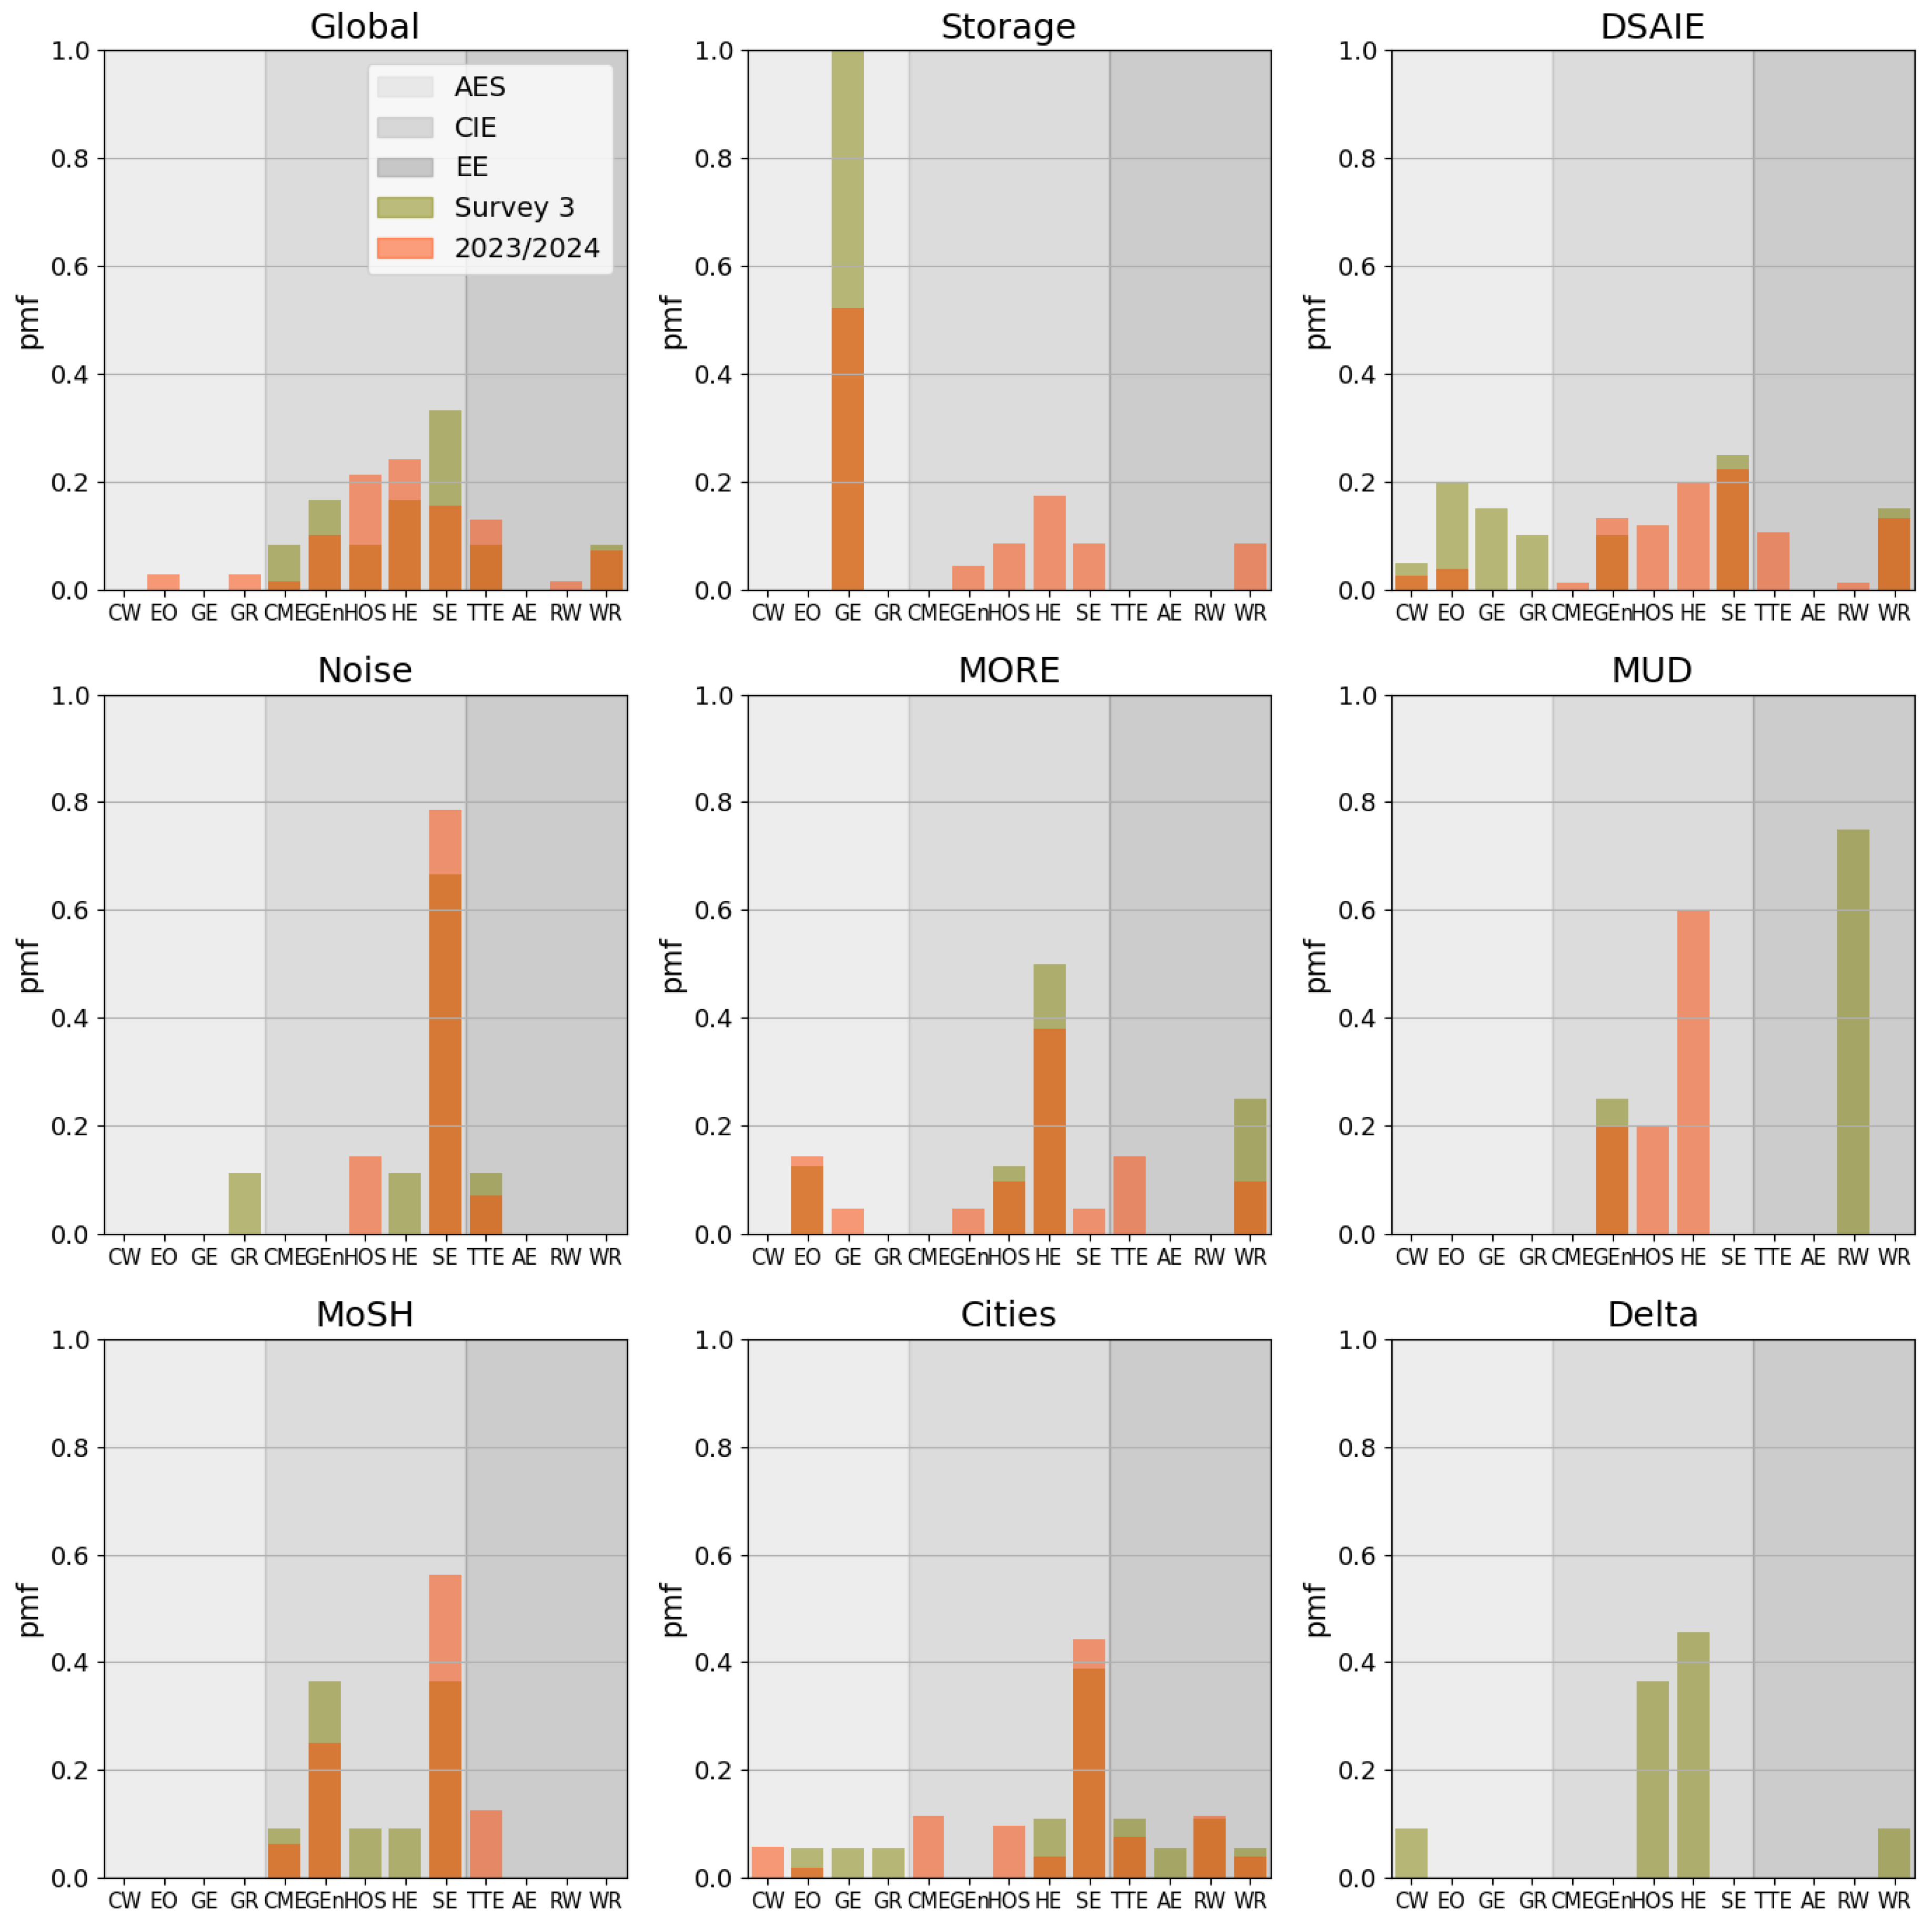
3.3.2. Expected Distribution of Students of Each Path for the Coming Year
3.3.3. Limiting the Number of Students in a Given Cross-Over
4. Discussion
5. Conclusions and Recommendations
Author Contributions
Funding
Institutional Review Board Statement
Data Availability Statement
Conflicts of Interest
Appendix A. Survey


Appendix B. List of Paths per Master’s Program
- Climate & Weather (CW)
- Earth Observation (EO)
- Geo-Energy (GE)
- Geo-Resources (GR)
- Construction Materials Engineering (CME)
- Geotechnical Engineering (GEn)
- Hydraulic & Offshore Structures (HOS)
- Hydraulic Engineering (HE)
- Structural Engineering (SE)
- Traffic & Transport Engineering (TTE)
- Atmospheric Environmental Engineering (AE)
- Resource and Waste Engineering (RW)
- Water Resources Engineering (WR)
Appendix C. Relationship Between First and Third Choices
References
- Ajzen, I. (1991). The theory of planned behavior. Organizational Behavior and Human Decision Processes, 50(2), 179–211. [Google Scholar] [CrossRef]
- Ajzen, I. (2002). Perceived behavioral control, self-efficacy, locus of control, and the theory of planned behavior. Journal of Applied Social Psychology, 32(4), 665–683. [Google Scholar] [CrossRef]
- Alhumaid, K., Anbreen Waheed, S. A., Zahid, E., & Habes, M. (2020). COVID-19 & elearning: Perceptions & attitudes of teachers towards E-learning acceptancein the developing countries. Multicultural Education, 6(2), 100–115. [Google Scholar]
- Anani, G. E., Nyamekye, E., & Bafour-Koduah, D. (2025). Using artificial intelligence for academic writing in higher education: The perspectives of university students in Ghana. Discover Education, 4, 46. [Google Scholar] [CrossRef]
- Aupperle, K. (2024). Texas A&M University will pause undergraduate enrollment growth. Available online: https://www.kbtx.com/2025/01/24/texas-am-university-will-pause-undergraduate-enrollment-growth/ (accessed on 14 May 2025).
- Bissias, G., Cousins, C., Diaz, P. N., & Zick, Y. (2025). Deploying fair and efficient course allocation mechanisms. arXiv, arXiv:2502.10592. [Google Scholar] [CrossRef]
- Breetzke, J., & Bohndick, C. (2024). Expectancy-value interactions and dropout intentions in higher education: Can study values compensate for low expectancies? Motivation and Emotion, 48, 700–713. [Google Scholar] [CrossRef]
- Chan, C. K. Y., & Hu, W. (2023). Students’ voices on generative AI: Perceptions, benefits, and challenges in higher education. International Journal of Educational Technology in Higher Education, 20, 43. [Google Scholar] [CrossRef]
- Chaturapruek, S., Dalberg, T., Thompson, M. E., Giebel, S., Harrison, M. H., Johari, R., Stevens, M. L., & Kizilcec, R. F. (2021). Studying undergraduate course consideration at scale. AERA Open, 7, 2332858421991148. [Google Scholar] [CrossRef]
- Chawla, S., & Saha, S. (2024). Exploring perceptions of psychology students in Delhi-NCR Region towards using mental health apps to promote resilience: A qualitative study. BMC Public Health, 24, 2000. [Google Scholar] [CrossRef]
- Coffey, L. (2024). Majority of grads wish they’d been taught ai in college. Available online: https://www.insidehighered.com/news/tech-innovation/artificial-intelligence/2024/07/23/new-report-finds-recent-grads-want-ai-be (accessed on 14 May 2025).
- Cruz, M. L., Saunders-Smits, G. N., & Groen, P. (2020). Evaluation of competency methods in engineering education: A systematic review. European Journal of Engineering Education, 45(5), 729–757. [Google Scholar] [CrossRef]
- Dahl, W., Alford, K., Rivero-Mendoza, D., Moreno, M., Emmanuel, S., & Gorwitz, G. (2024). Factors influencing undergraduate students toward choosing a new course. NACTA Journal, 68, 35–43. [Google Scholar] [CrossRef]
- Delft University of Technology. (n.d.-a). Msc applied earth sciences programme. Available online: https://www.tudelft.nl/en/education/programmes/masters/ect/msc-earth-climate-and-technology/programme (accessed on 28 October 2024).
- Delft University of Technology. (n.d.-b). Msc civil engineering programme. Introduction to the curriculum. Available online: https://www.tudelft.nl/onderwijs/opleidingen/masters/ce/msc-civil-engineering/programme#:~:text=Faculty%20Wide%20Module%20(MUDE),and%20Environmental%20Engineering%20master%20students (accessed on 28 October 2024).
- Delft University of Technology. (n.d.-c). Msc environmental engineering programme. Introduction to the curriculum. Available online: https://www.tudelft.nl/onderwijs/opleidingen/masters/enve/msc-environmental-engineering/programme (accessed on 28 October 2024).
- Delft University of Technology. (n.d.-d). MSc programmes at CEG. Cross-over modules information booklet. Available online: https://filelist.tudelft.nl/TUDelft/Onderwijs/Opleidingen/Master/MSc_Civil_Engineering/Brochure%20Cross-Overs%20Final%20v2.pdf (accessed on 28 October 2024).
- Eccles, J. S., Adler, T., Futterman, R., Goff, S. B., Kaczala, C. M., & Meece, J. (1983). Expectancies, values and academic behaviours Expectancies, values and academic behaviours. In J. T. Spence (Ed.), Achievement and achievement motivation (pp. 75–146). W. H. Freeman. [Google Scholar]
- Galadima, H., Dumadag, A., & Tonn, C. (2024). Navigating new normals: Student perceptions, experiences, and mental health service utilization in post-pandemic academia. Education Sciences, 14(2), 125. [Google Scholar] [CrossRef]
- Godbole, A. A., Oka, G. A., Ketkar, M. N., Solanki, R. S., Desai, D. T., Bangale, S. V., & Rele, A. S. (2024). Specialty preferences of undergraduate medical students: What do they choose and why? Medical Journal Armed Forces India, 81, 66–71. [Google Scholar] [CrossRef]
- Gu, Q., & Lu, G. (2023). Factors influencing the satisfaction level of college students in China: Literature analysis based on grounded theory. Frontiers in Psychology, 13, 1023420. [Google Scholar] [CrossRef]
- Kahvo, M., Whelan, R., & Vallabhaneni, P. (2023). Why choose paediatrics? A scoping review of factors affecting the choice of paediatrics as a career. European Journal of Pediatrics, 182(1), 9–23. [Google Scholar] [CrossRef]
- Kooptiwoot, S., Kooptiwoot, S., & Javadi, B. (2024). Application of regression decision tree and machine learning algorithms to examine students’ online learning preferences during COVID-19 pandemic. International Journal of Education and Practice, 12(1), 82–94. [Google Scholar] [CrossRef]
- Larson, M., Davies, R., Steadman, A., & Cheng, W. M. (2023). Student’s choice: In-person, online, or on demand? A comparison of instructional modality preference and effectiveness. Education Sciences, 13(9), 877. [Google Scholar] [CrossRef]
- Leutritz, T., Krauthausen, M., Simmenroth, A., & König, S. (2024). Factors associated with medical students’ career choice in different specialties: A multiple cross-sectional questionnaire study at a German medical school. BMC Medical Education, 24, 798. [Google Scholar] [CrossRef] [PubMed]
- Leydens, J. A., Johnson, K. E., & Moskal, B. M. (2021). Engineering student perceptions of social justice in a feedback control systems course. Journal of Engineering Education, 110(3), 718–749. [Google Scholar] [CrossRef]
- Lin, G. S. S., Ng, Y. S., Hashim, H., Foong, C. C., Yahya, N. A., Halil, M. H. M., & Ahmad, M. S. (2024). Shaping tomorrow’s dentists: A multi-institutional survey of undergraduate dental students’ perceptions towards interprofessional education. BMC Oral Health, 24, 762. [Google Scholar] [CrossRef]
- Mares-Nasarre, P., Martínez-Ibáñez, V., & Sanz-Benlloch, A. (2023). Analyzing sustainability awareness and professional ethics of civil engineering Bachelor’s degree students. Sustainability, 15(7), 6263. [Google Scholar] [CrossRef]
- Masegosa, A. R., Cabañas, R., Maldonado, A. D., & Morales, M. (2024). Learning styles impact students’ perceptions on active learning methodologies: A case study on the use of live coding and short programming exercises. Education Sciences, 14(3), 250. [Google Scholar] [CrossRef]
- Potvin, M., Morales, A., West, E., Kalimi, M., & Coviello, J. (2024). Occupational therapy students’ perceptions of their experience in a role-emerging Level II fieldwork within higher education student services. BMC Medical Education, 24, 384. [Google Scholar] [CrossRef]
- Qualtrics. (2005). Qualtrics (Provo, Utah, USA) [Computer software manual]. Available online: https://www.qualtrics.com/ (accessed on 14 May 2025).
- Sim-Sim, M., Zangão, O., Barros, M., Frias, A., Dias, H., Santos, A., & Aaberg, V. (2022). Midwifery now: Narratives about motivations for career choice. Education Sciences, 12(4), 243. [Google Scholar] [CrossRef]
- Stanley, D., & Mitra, S. (2024). The impact of the COVID-19 pandemic on business students’ future preference for online courses. Decision Sciences Journal of Innovative Education, 22(3), 180–196. [Google Scholar] [CrossRef]
- Students Organising for Sustainability United Kingdom. (n.d.). Two thirds of students want to learn more about sustainability. Available online: https://www.sos-uk.org/post/two-thirds-of-students-want-to-learn-more-about-sustainability (accessed on 14 May 2025).
- Xue, G., Offodile, O. F., Razavi, R., Kwak, D.-H., & Benitez, J. (2024). Addressing staffing challenges through improved planning: Demand-driven course schedule planning and instructor assignment in higher education. Decision Support Systems, 187, 114345. [Google Scholar] [CrossRef]
- Yao, Z. M., Vongchalitkul, B., Rungrueng, P., So-in, R., & Chen, W.-K. (2023). The influencing factors of college students’ intention in selecting elective courses. International Journal of Development Administration Research, 6(1), 16–30. [Google Scholar]
- Zhang, Z., & Chen, X. (2024). An analysis of students’ perceptions of teachers’ questioning in secondary biology classrooms. Disciplinary and Interdisciplinary Science Education Research, 6, 5. [Google Scholar] [CrossRef]


| Survey | |||||||||
|---|---|---|---|---|---|---|---|---|---|
| #1 | 57 | 27 | 96 | 14 | 18 | 15 | 31 | 81 | - |
| #2 | 32 | 19 | 30 | 5 | 6 | 18 | 11 | 38 | - |
| #3 | 12 | 1 | 20 | 9 | 8 | 4 | 11 | 18 | 11 |
Disclaimer/Publisher’s Note: The statements, opinions and data contained in all publications are solely those of the individual author(s) and contributor(s) and not of MDPI and/or the editor(s). MDPI and/or the editor(s) disclaim responsibility for any injury to people or property resulting from any ideas, methods, instructions or products referred to in the content. |
© 2025 by the authors. Licensee MDPI, Basel, Switzerland. This article is an open access article distributed under the terms and conditions of the Creative Commons Attribution (CC BY) license (https://creativecommons.org/licenses/by/4.0/).
Share and Cite
Mares-Nasarre, P.; van Boldrik, N.; Bakker, E.; Lanzafame, R.; Morales-Nápoles, O. Unlocking Student Choices: Assessing Student Preferences in Courses in Engineering Education. Educ. Sci. 2025, 15, 859. https://doi.org/10.3390/educsci15070859
Mares-Nasarre P, van Boldrik N, Bakker E, Lanzafame R, Morales-Nápoles O. Unlocking Student Choices: Assessing Student Preferences in Courses in Engineering Education. Education Sciences. 2025; 15(7):859. https://doi.org/10.3390/educsci15070859
Chicago/Turabian StyleMares-Nasarre, Patricia, Niels van Boldrik, Elske Bakker, Robert Lanzafame, and Oswaldo Morales-Nápoles. 2025. "Unlocking Student Choices: Assessing Student Preferences in Courses in Engineering Education" Education Sciences 15, no. 7: 859. https://doi.org/10.3390/educsci15070859
APA StyleMares-Nasarre, P., van Boldrik, N., Bakker, E., Lanzafame, R., & Morales-Nápoles, O. (2025). Unlocking Student Choices: Assessing Student Preferences in Courses in Engineering Education. Education Sciences, 15(7), 859. https://doi.org/10.3390/educsci15070859