Article

Homework, Households, and Hurdles: The Unexpected Drivers of Student Graduation Perceptions

by
Daniel Alhassan
1,
Zahra Fatah
2,†,
Priscilla Mansah Codjoe
2,*,†,
Caroline Bena Kuno
3 and
Dorcas Ofori-Boateng
4
1
Wells Fargo, 11625 N. Community Hse Rd, Charlotte, NC 28277, USA
2
College of Arts and Sciences, Southern Illinois University Edwardsville, Campus Box 1653, Edwardsville, IL 62026, USA
3
College of Natural and Health Sciences, Virginia State University, P.O. Box 9203, Petersburg, VA 23806, USA
4
College of Liberal Arts and Sciences, Portland State University, 1721 SW Broadway, Portland, OR 97201, USA
*
Author to whom correspondence should be addressed.
These authors contributed equally to this work.
Educ. Sci. 2025, 15(6), 670; https://doi.org/10.3390/educsci15060670
Submission received: 8 February 2025 / Revised: 29 April 2025 / Accepted: 17 May 2025 / Published: 29 May 2025

Abstract

:
Students’ perceptions of their likelihood to graduate are important determinants of their academic engagement, yet these perceptions remain understudied. This study, which is based on the 2021 Monitoring the Future survey of 8th- and 10th-grade students in the United States, uses machine learning algorithms to identify the most important factors that influence these perceptions. Among the tested models, random forest provided the best classification performance. Using permutation-based feature importance, we identified frequent participation in schoolwork, maternal education, paternal education, and homework completion as the most important predictors of students’ graduation perceptions. These results highlight the importance of targeted and well-coordinated intervention measures and policy reforms that can boost students’ engagement in learning and parental education support, especially for students from underrepresented populations or low-income families. As such, this study provides evidence-based insights to guide educational strategies aimed at improving academic outcomes and reducing disparities by identifying key contributors to students’ views on graduating.

1. Introduction

Perceptions and beliefs are key drivers of human behavior, especially during adolescence, a time of identity formation and educational choice-making. At this stage, individuals are in the process of learning about themselves and their environment. Students’ perceptions of themselves and the role of education can determine their choices and attendance patterns in school as well as their future achievements (Kenny et al., 2023). For youth, it is crucial to know how these beliefs steer their actions to ensure academic resilience and future success.
A major internal factor that determines student perceptions is self-efficacy, which is a students’ perceived ability to learn or perform academically (Margolis & McCabe, 2003). Recent studies have provided robust evidence that higher self-efficacy not only boosts classroom engagement but also encourages persistence when confronting academic challenges. For example, Olivier et al. (2019) demonstrated that middle school students with positive self-efficacy in mathematics engaged more actively in problem-solving tasks and inquiry-based activities, leading to higher assessment scores. Complementing this, Wu et al. (2024) found that high self-efficacy among high school students significantly reduced math anxiety by bolstering confidence in problem-solving, thereby reducing cognitive avoidance during challenging tasks.
Furthermore, the reciprocal relationship between self-efficacy and academic performance is emphasized across different learning environments. In remote learning settings, Tannert and Gröschner (2021) observed that self-efficacy reinforced by social support from family and schools along with active engagement in digital lessons was a critical predictor of students’ goal attainment and learning persistence. Additional evidence from Q. Wang et al. (2023) and Mensah et al. (2024) supports the view that classroom climate and a strong belief in one’s academic capabilities not only mediate the relationship between teacher leadership and academic motivation but also directly enhance students’ performance. These empirical findings underscore the theoretical premise that fostering self-efficacy is pivotal for driving academic success and providing alternative perspectives that harmonize theoretical models with observed educational outcomes.
In addition to self-efficacy, the student’s perception of subjects, tasks, and environments can determine engagement and motivation. For example, research indicates that students who hold the belief that abilities can be changed in intellectual and social contexts are more resilient, achieve higher grades, and have a higher course completion rate (Yeager & Dweck, 2012). Students’ perceptions of how hard a task is also affect their decision-making around learning, as they may sometimes refrain from using what they perceive to be potentially helpful strategies if they think these will require a lot of effort (Dunlosky et al., 2020). In addition, students who have a positive perception of school and believe that school is a meaningful and supportive place are more likely to be engaged, participate, and attach emotionally to academic activities than those with negative emotional experiences, who may detach, skip class, and drop out (M.-T. Wang et al., 2017). When students think that they cannot succeed, this can create a vicious cycle that negatively affects effort and attendance (Jagacinski & Nicholls, 1990), especially among low-achieving students (Franco, 2020).
Student identities, which include individual values, beliefs, future plans, and social relationships, also have a significant influence on academic persistence (Destin & Williams, 2020). According to the identity motive perspective, students’ imagined future selves and social connections determine their engagement and persistence in school. These identities are never static, and depend on educational and social contexts that can either facilitate or obstruct academic persistence. This article posits that educational contexts which are in harmony with students’ identities promote higher levels of academic persistence and reduce inequalities.
Other factors in the broader school environment also affect students’ perceptions. The findings of this study show that persistence rates can be enhanced by institutions that are perceived as supportive through academic support, positive faculty relationships, and a strong sense of community (Tinto, 2022). For instance, negative school climates characterized by low levels of support and poor student–teacher relationships are associated with negative outcomes such as engaging in risky behaviors and poor academic performance (Lunetti et al., 2022).
Owing to the aforementioned results, more and more countries around the world are paying attention to formal education as a determinant of economic development; therefore, attendance rates in academic programs have become essential. Dropping out of school has far-reaching consequences apart from academic dropout, including unemployment, low wage earning, and poor health (Campbell, 2015; Ressa & Andrews, 2022; Rumberger, 2020). In addition to missing opportunities from further education and good jobs, these students are more likely to end up in the criminal justice system (Gerlinger & Hipp, 2023). These outcomes are costly to society in other ways as well; thus, there is a need to explore the factors that influence students’ perceptions of graduation (Archambault et al., 2022; Rumberger & Lim, 2008).
Most of the available studies have focused on factors related to graduation or dropout rates, without paying much attention to how students themselves view their chances of finishing school. It is important to know how these perceptions are formed in order to prevent educational disparities and dropout rates. In addition, factors such as parental involvement, peer group, school climate, and socioeconomic status can work together with self-efficacy in order to determine the way in which students view graduation.
In light of this, the following research questions are addressed in this study: (1) What are the factors that affect 8th- and 10th-grade students’ perceptions of graduating from middle or high school? and (2) What are the most significant factors in each group, and how do they influence these perceptions? The study applies advanced machine learning techniques to identify such significant factors to understand their effects. Knowing more about these factors may help educators and policymakers to design interventions that can help students to stay in school, thereby improving graduation rates for the benefit of both individuals and society. Another objective is to develop a machine learning model capable of classifying students’ perceptions of their likelihood of graduating, which can assist in identifying those who require intervention. This approach extracts the full potential of all the factors in the model in order to uncover the underlying patterns and relationships of the variables that can enhance or adversely affect educational results.
This article is divided into six sections: Section 2 explains the data sources and machine learning approach; Section 3 presents the results, which are further discussed in Section 4 and Section 5; finally, Section 6 outlines the implications of the results for interventions and policies.

2. Methods

2.1. Data and Sources

This study uses data from Monitoring the Future: A Continuing Study of American Youth (2021) (Miech et al., 2022), collected by the Survey Research Center at the University of Michigan and made available through the Inter-university Consortium for Political and Social Research (ICPSR) at https://www.icpsr.umich.edu/web/ICPSR/studies/38502, accessed on 15 April 2023. The dataset is nationally representative of 8th- and 10th-grade students in the United States. It includes information on drug use, other variables such as demographics, and topics that can help to understand youth behaviors and trends, including attitudes, family relationships, educational objectives, self-esteem, substance abuse, and peer influences. After reviewing ICPSR’s recommendations on using and sharing these data, the initial dataset of 23,238 cases was cleaned to 21,244 by excluding cases for which outcome data were missing. Of these, 70% (14,870 cases) were employed in the training set for the machine learning models and the remaining 30% (6374 cases) were used as an independent test set. In order to balance the subsets with respect to the outcome variable, stratification was used to divide the data into two subsets.

2.2. Variables in the Study

The outcome variable is “student perception to graduate” from the ICPSR dataset. It is divided into four categories: “definitely won’t graduate”, probably won’t graduate”, probably will graduate”, and “definitely will graduate”. These categories are based on the survey responses, with each category reflecting the count of students providing that response. Sociodemographic variables, academic and economic engagement, parental education, and health-related factors were all considered, resulting in the inclusion of 25 predictor variables in the model. Each predictor was chosen for its possible effect on students’ perceptions of their academic achievement. Table 1 presents the counts and percentages for some of the key features in this study. For completeness, the Supplementary Materials include detailed distribution plots for all variables.

2.3. Machine Learning Approach

2.3.1. Overview of Machine Learning Algorithms

The entire analysis was conducted using the tidymodels ecosystem in R version 4.3.2 (R Core Team, 2023). The following machine learning algorithms were explored to quantify and explain the association between academic, social, and psychological factors that affect student outcomes. Logistic regression (Hosmer et al., 2013) develops a baseline model and determines the relative importance of each predictor. The K-Nearest Neighbors (KNN) classifier (Cover & Hart, 1967) finds smaller and less linear relationships between features and classifies objects according to their features. Decision trees (Quinlan, 1986) provide a clear structure and show which features are most important for the outcome variable. Random forest (James et al., 2021) provides improved the predictive accuracy and stability by using an ensemble of decision trees, while AdaBoost (Freund & Schapire, 1997) addresses specific misclassifications, especially for difficult-to-classify instances. XGBoost (Chen & Guestrin, 2016) provides computational efficiency and high predictive accuracy in modeling complex systems. Finally, neural networks (Goodfellow et al., 2016) are useful for extracting the deep structure of the data. All models were built and calibrated through cross-validation to prevent overfitting and guarantee the validity of their predictions of student graduation rates.

2.3.2. Preprocessing

The study initially considered using 32 variables; hence, missing data issues across these variables needed to be investigated and handled. Variables with 50% or more missingness were excluded from further analysis. Specifically, seven variables were removed due to their high proportion of missing values. Of the remaining 25 variables, 20 exhibited less than 10% missingness, while the missingness for the remaining variables ranged from 11% to 38%. For all retained variables, imputation methods were applied according to variable type: mean imputation was used for numerical variables in order to maintain their central tendency, while mode imputation was employed for categorical variables to preserve the most common category. These imputation strategies were selected following an exploratory analysis, and are in line with established best practices for handling missing data.

2.3.3. Hyperparameter Optimization

We performed extensive hyperparameter tuning (Kuhn, 2013) to systematically explore a predefined range of model-specific parameters, maximizing the area under the receiver operating characteristic curve (AUC). For KNN, we tuned the number of neighbors (neighbors). Decision tree required tuning the cost complexity (cost_complexity) and minimum node size (min_n) to balance model complexity and prevent overfitting. In the random forest model, we adjusted the number of trees (trees) and minimum node size (min_n). For XGBoost, we tuned the number of boosting rounds, tree depth (tree_depth), and learning rate (learn_rate). For AdaBoost, we adjusted the number of boosting trees. Finally, for the neural network model we optimized the regularization parameter (penalty) and the number of training epochs (epochs).
The explored hyperparameter grid for each machine learning algorithm is provided in detail in the Supplementary Materials. The parameter ranges were selected empirically based on initial experimental runs designed to capture a broad spectrum of plausible values. When tuning the hyperparameters, a ten-fold cross-validation method was used.

2.3.4. Evaluation on Independent Test Sample

After optimal hyperparameters had been identified, we retrained each model on the full training set, then evaluated its performance on the independent test sample. This final assessment measured each model’s ability to generalize to new data.

2.4. Model Evaluation Metrics

To determine the best predictive model for students’ graduation perceptions, we used the metrics of AUC, precision, recall, F1 score, accuracy, and Brier’s score. The AUC reflects the model’s capacity to distinguish among the four perception groups (Fawcett, 2006). Precision highlights the proportion of correct positive predictions, while recall measures the model’s ability to identify all relevant instances (Powers, 2020). The F1 score is the harmonic mean of precision and recall, indicating balanced performance (Brodersen et al., 2010). Accuracy captures the overall rate of correct predictions, while Brier’s score evaluates the reliability of predicted probabilities (Brier, 1950). Models with higher AUC and F1 scores show stronger discriminative power and balanced performance. Variations in precision and recall reveal how each model handles different prediction errors, and lower Brier’s scores indicate better probabilistic estimates. The selected model had consistently superior performance across these metrics, and ROC curves were used to visualize its discriminative power for each graduation perception category.

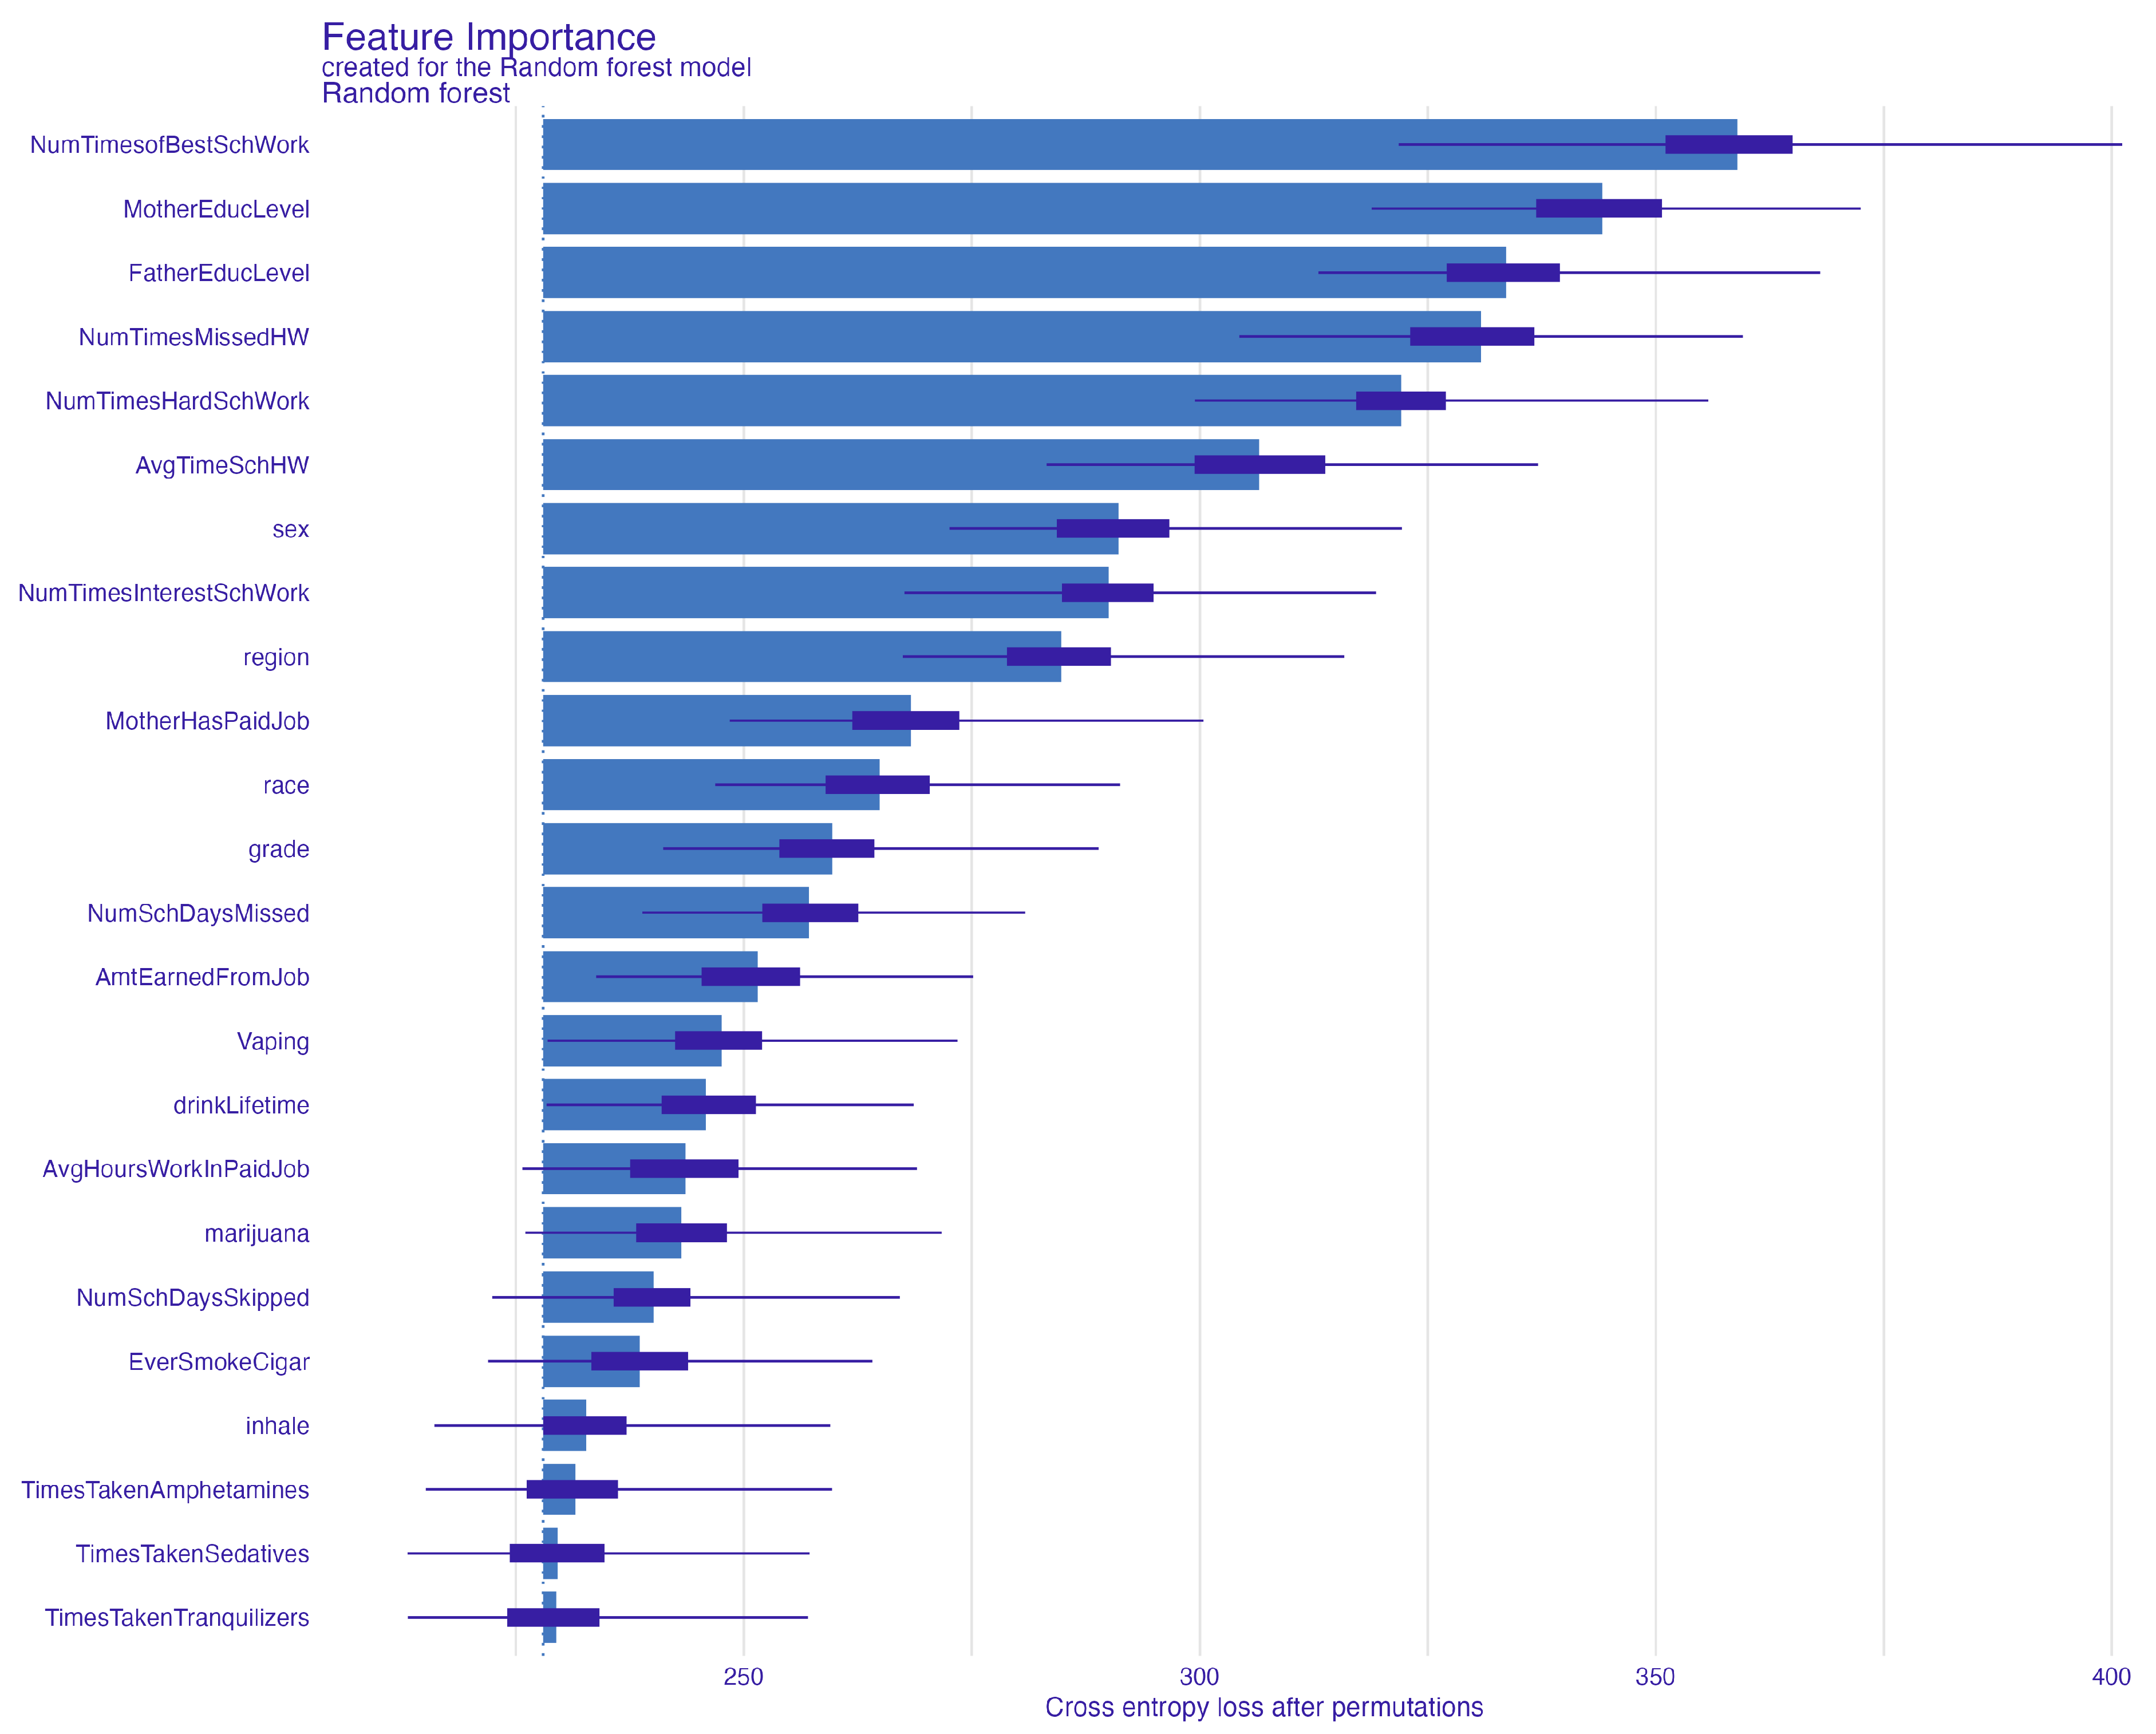
2.5. Feature Importance

We then used a permutation-based method from (Fisher et al., 2019; Molnar, 2022) on 1000 randomly chosen samples from the test set, where we performed permutation 100 times for each variable. This approach is based on how much change in prediction error occurrs when a feature is permuted randomly, with large changes indicating higher importance (Biecek & Burzykowski, 2021). As suggested by previous work (Molnar, 2022), we performed this evaluation on the independent test set in order to minimize the bias–variance tradeoff effects. To make sense of what happens inside of more sophisticated models, we used accumulated local effect (ALE) plots (Apley & Zhu, 2020). ALE plots provide an unbiased view of how features affect predictions, including correlated features. The ALE plots were created using the DALEX and DALEXtra packages (Biecek, 2018; Maksymiuk et al., 2020) to help visualize the feature effects and support the discussion of possible interventions.

3. Results

3.1. Samples

To assess the similarity in distribution between the training and test sets, chi-square tests were employed. There was no significant difference in students’ perceived likelihood of graduation ( χ 2 = 1.02, p = 0.80). Racial composition (African-American, White, Hispanic) was similar ( χ 2 = 0.26, p = 0.88), as were gender distributions (male, female, unspecified; χ 2 = 4.35, p = 0.11) and geographic region (Northeast, Midwest; χ 2 = 3.55, p = 0.31).
None of the parental influence measures differed significantly between the samples. Mother’s educational grade (from grade school to graduate or professional school) was comparable ( χ 2 = 3.93, p = 0.69), as was mother’s employment status (none, part-time, full-time; χ 2 = 4.25, p = 0.12). Father’s educational level was also similar across groups ( χ 2 = 5.77, p = 0.45). Health-related behaviors such as vaping, inhalant use, and tranquilizer or sedative use were also equally distributed across the groups (range of χ 2 = 4.17–13.24, p > 0.05).
Comparisons of academic engagement metrics in terms of interest in schoolwork, perceived difficulty, and quality showed no significant differences ( χ 2 = 1.94–8.25, p = 0.08–0.75). Other attendance indicators were also similar, including days missed or skipped (range of χ 2 = 2.62–11.31, p > 0.05). In addition, economic engagement measures such as hours worked and earnings from a paid job were equally distributed (hours: χ 2 = 7.70, p = 0.36; earnings: χ 2 = 2.24, p = 0.52). The Supplementary Materials present the results of this analysis in more detail.
These results support the similarity in demographics and behavior between the training and test samples, excluding the possibility that the results are contaminated by differences in samples.

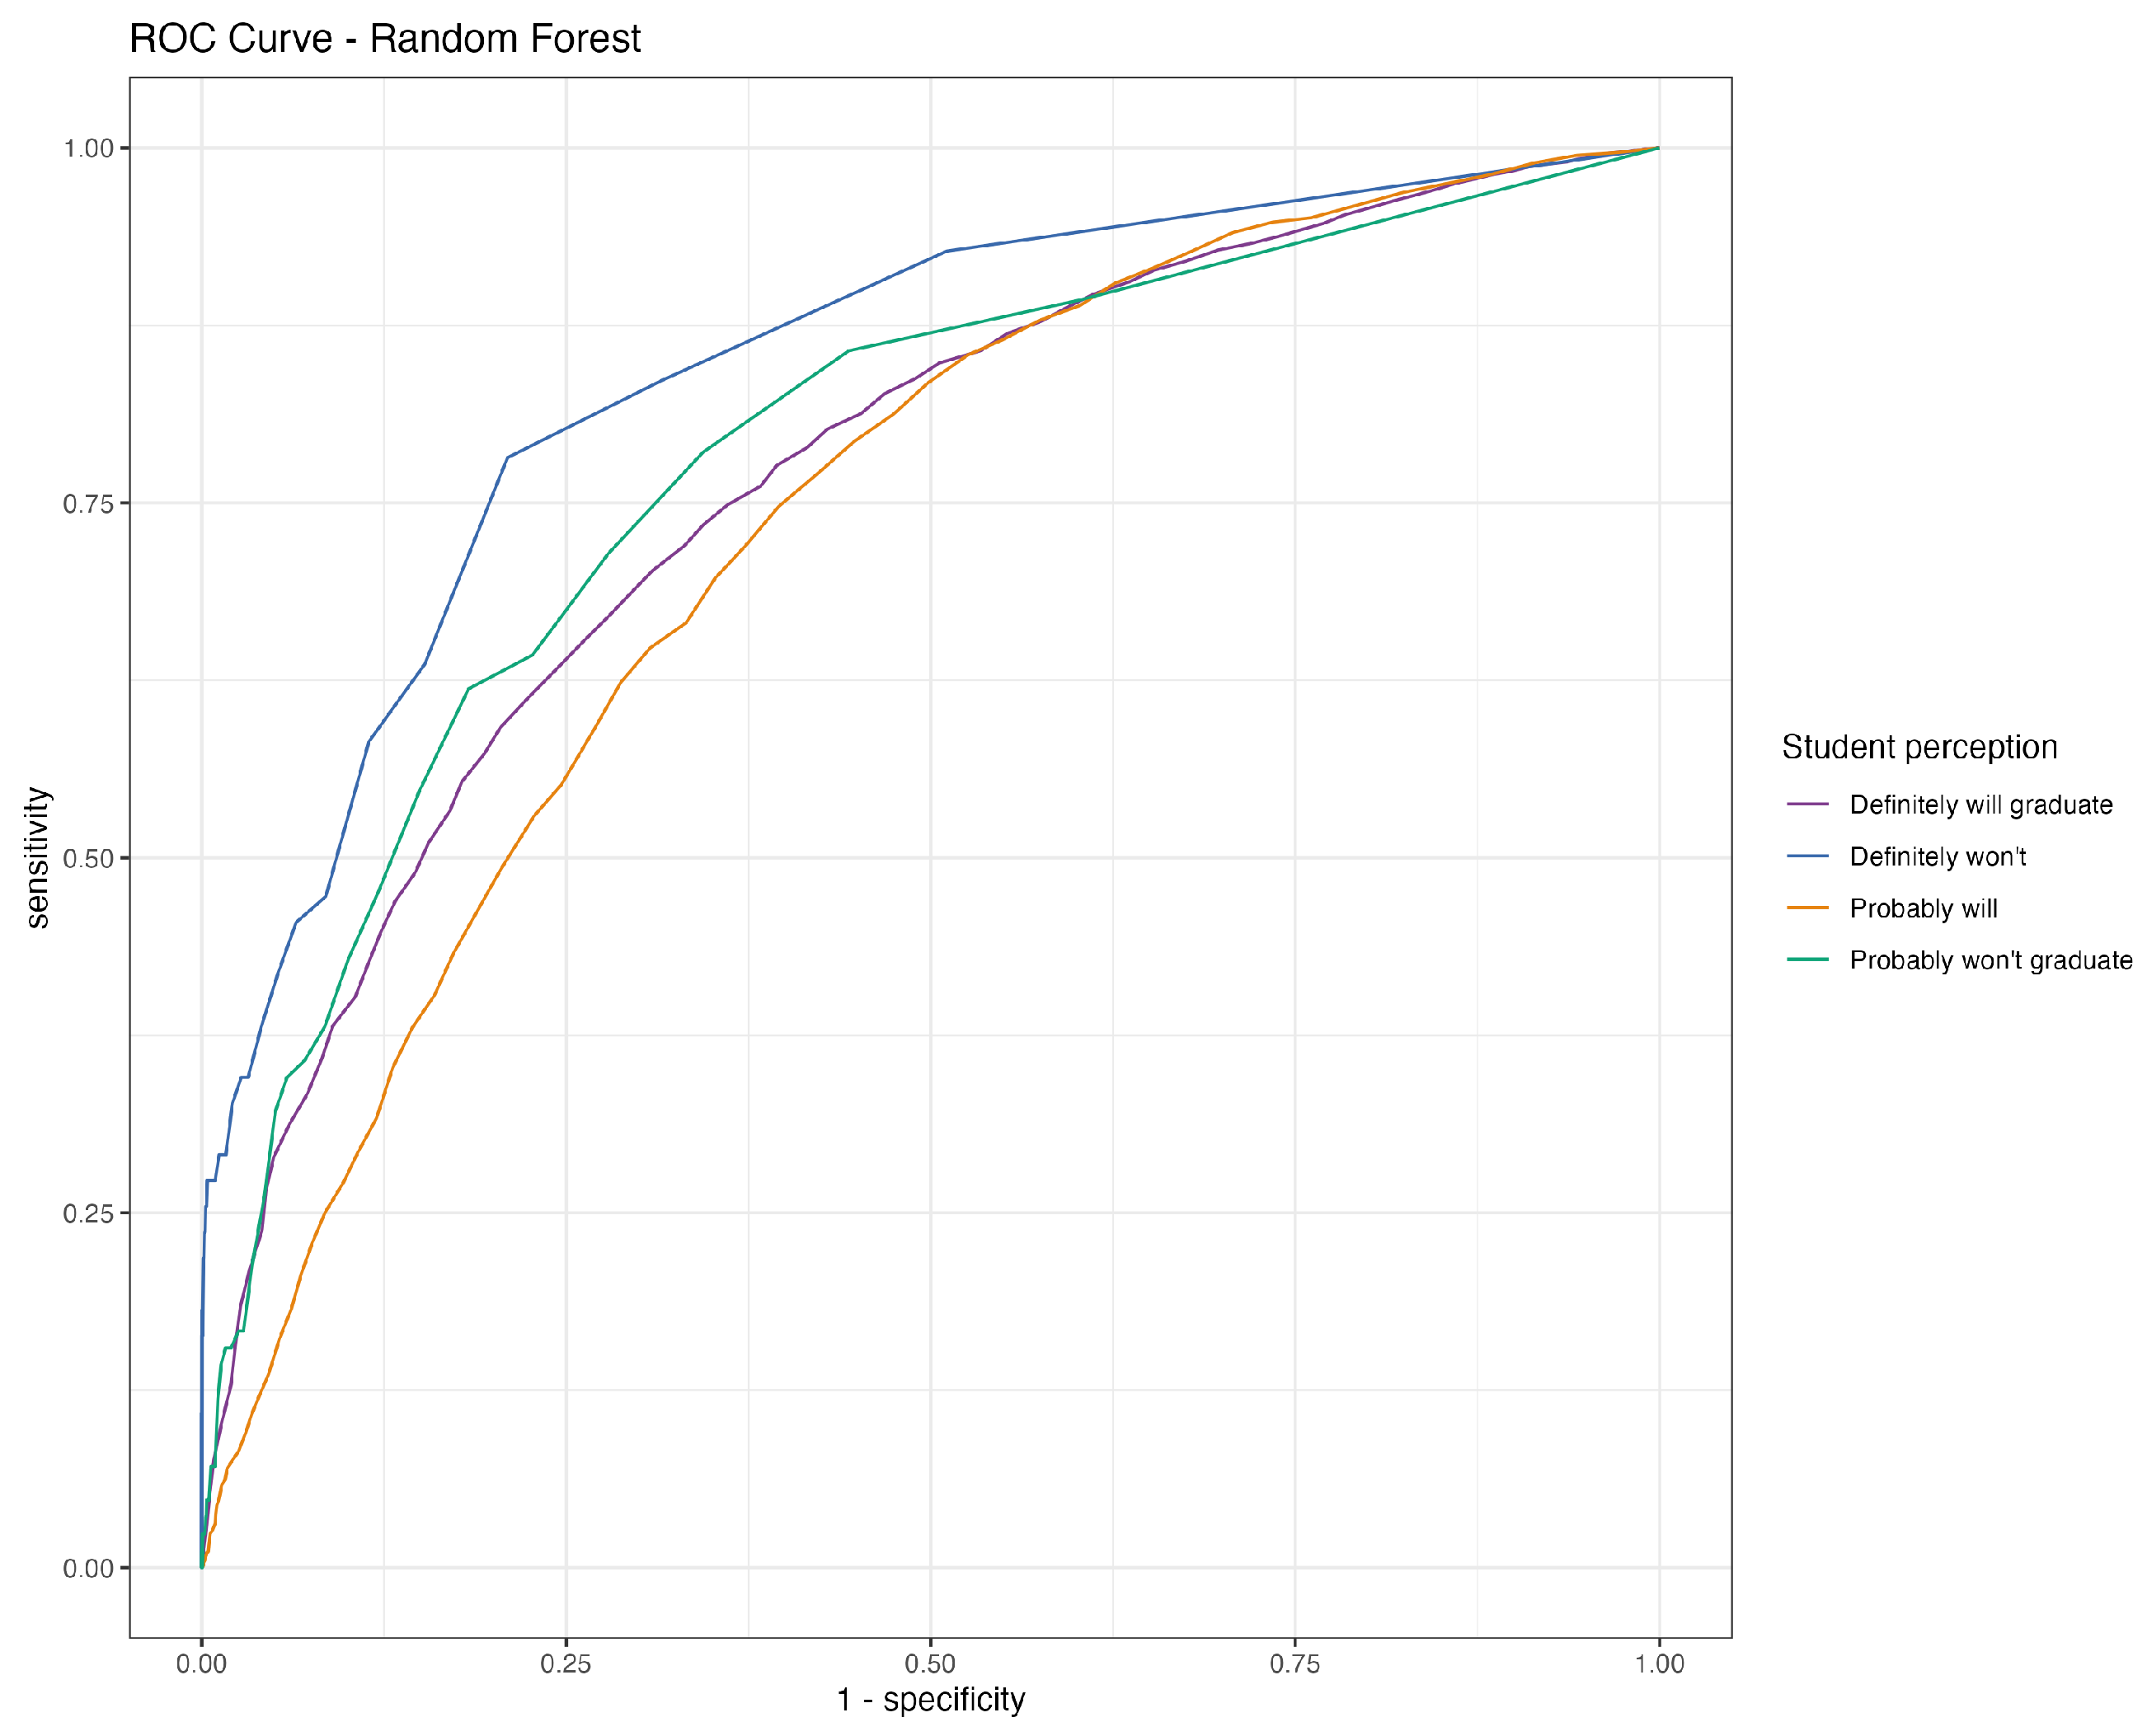
3.2. Selecting the ML Model

In our comparison of seven models using the metrics of AUC, F1 score, recall, precision, accuracy, and Brier score (Table 2), we identified random forest (RF) as the best classifier. With an F1 score of 0.788, RF provided a good balance between precision and recall while having the lowest Brier score (0.145), suggesting better probabilistic predictions. While other models had advantages in certain metrics, none were as robust as RF. For example, while the AUC values of logistic regression and XGBoost were close to that of RF, their higher Brier scores indicated less reliable probability estimates. RF also outperformed KNN and AdaBoost in terms of F1 score. Due to its consistent good results across different metrics, we chose RF as the most suitable method for both classification and probability estimation in this analysis.

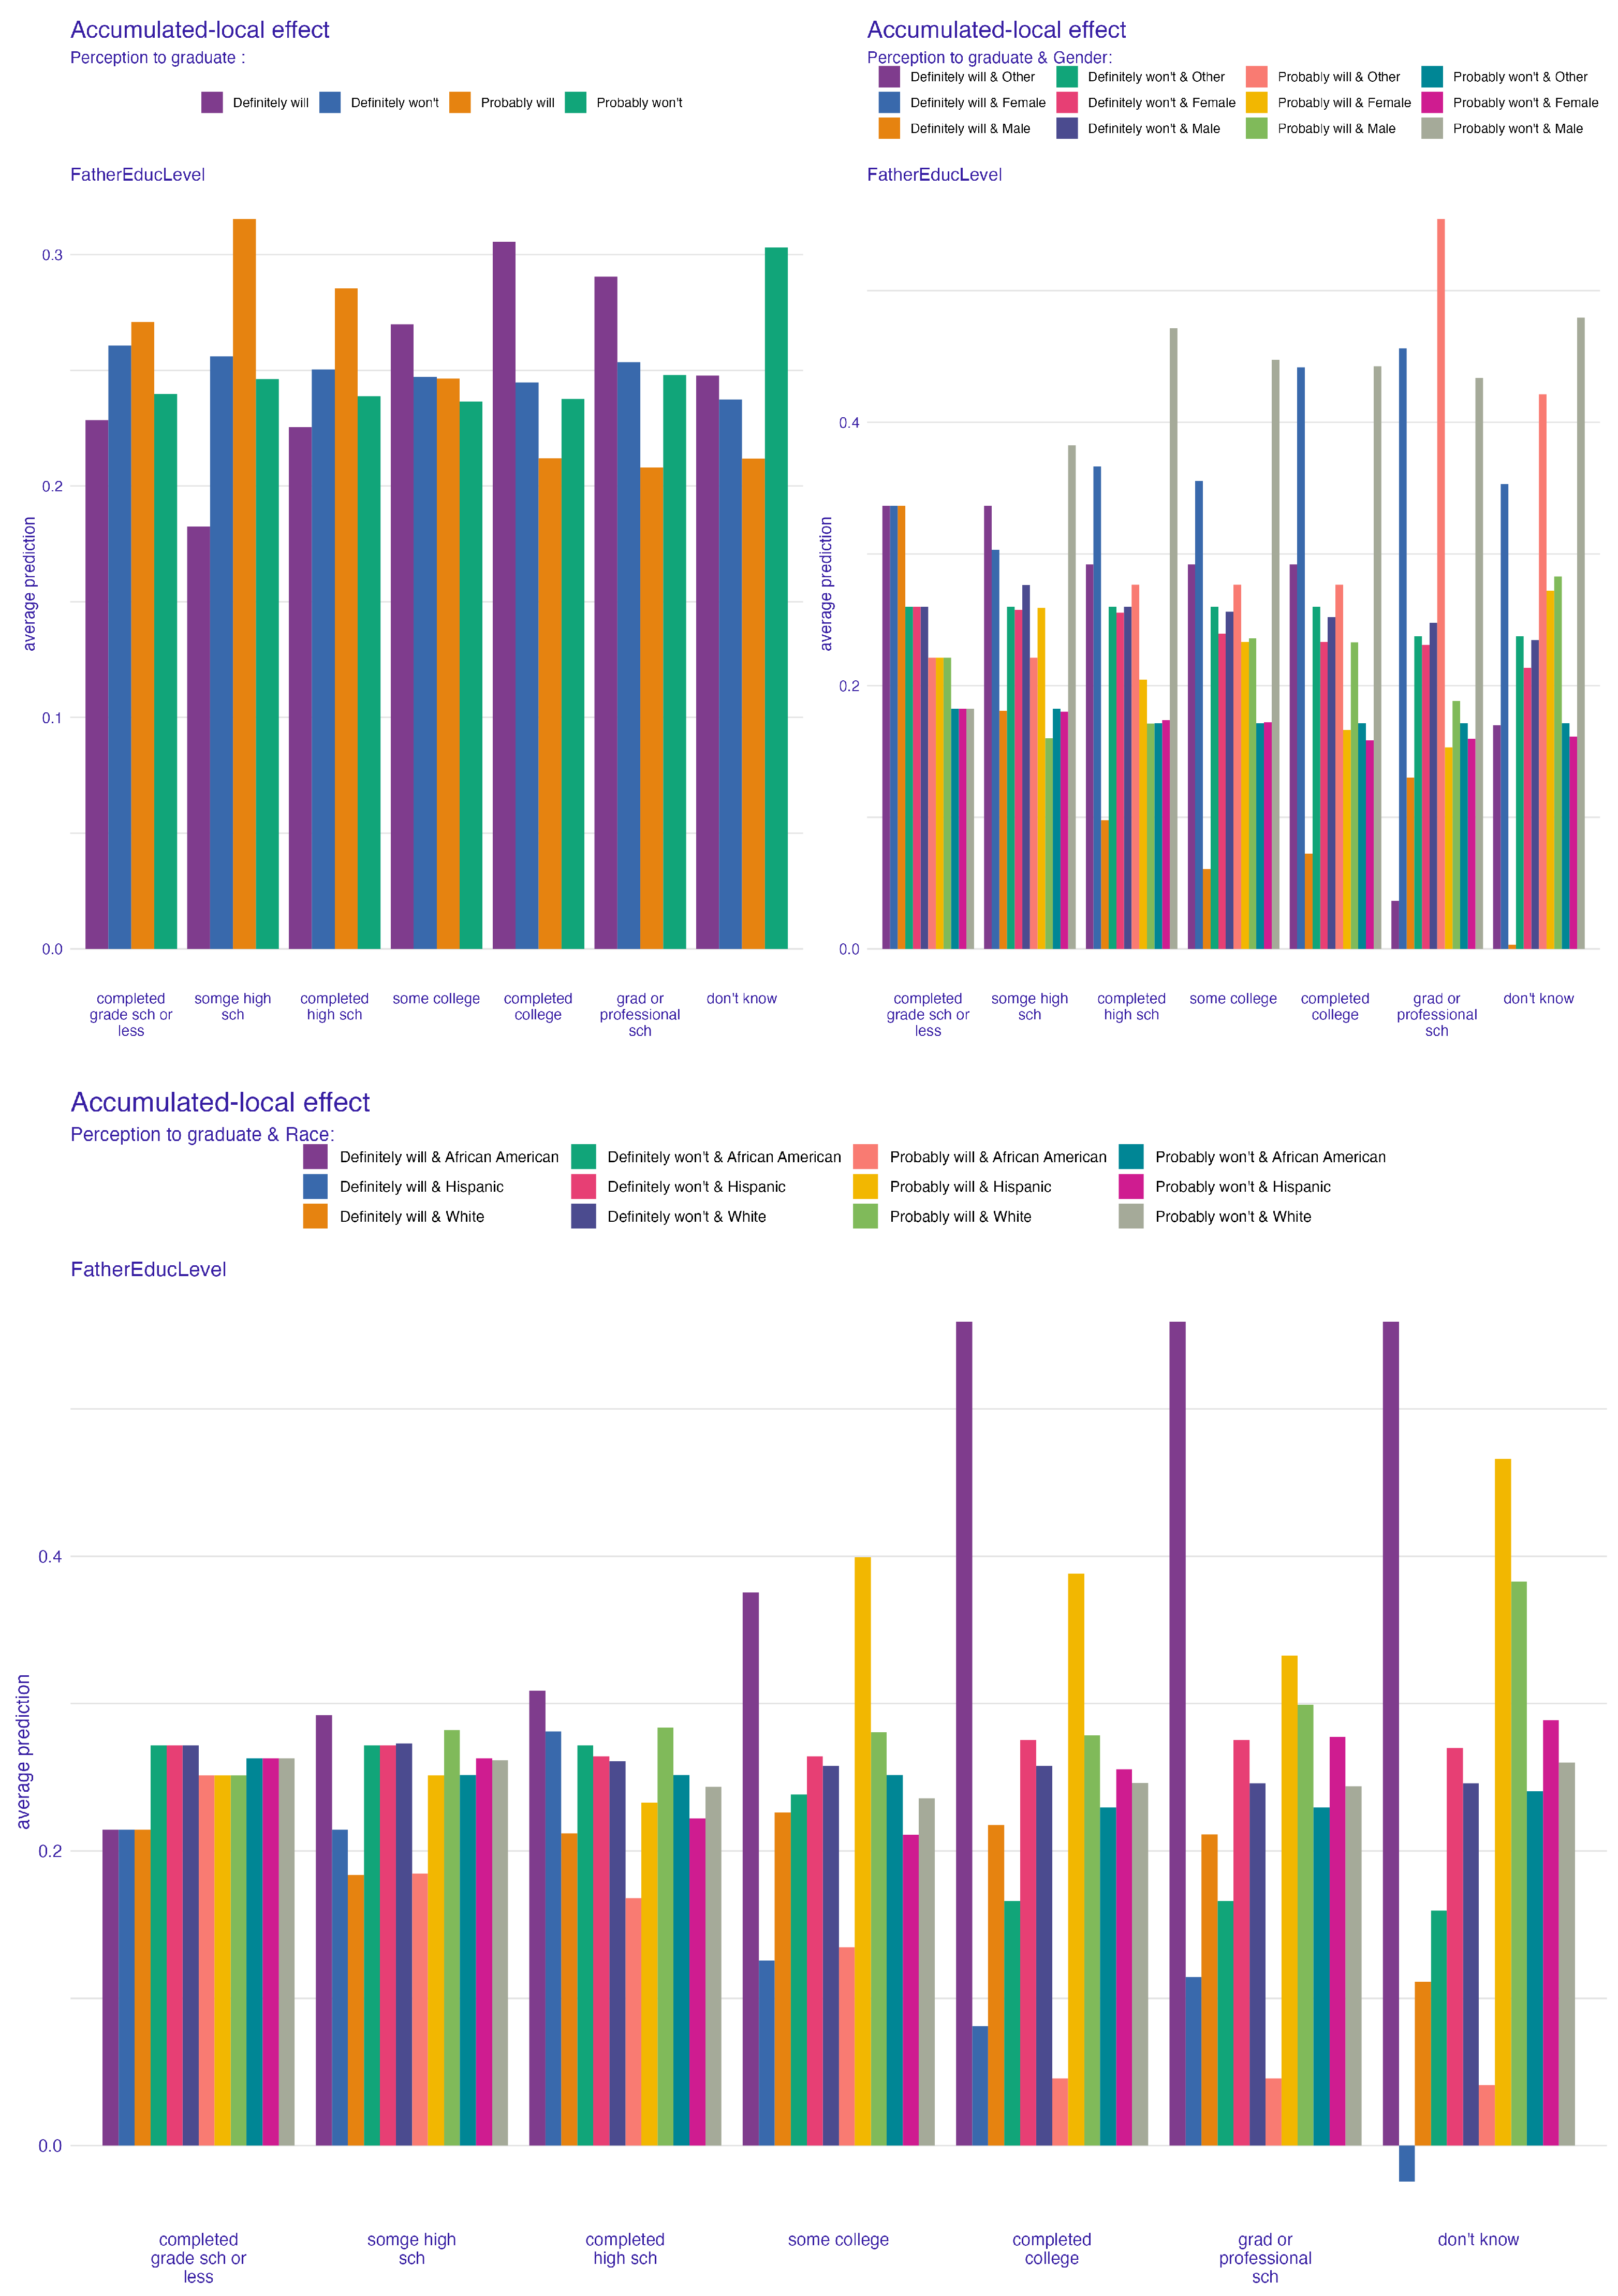
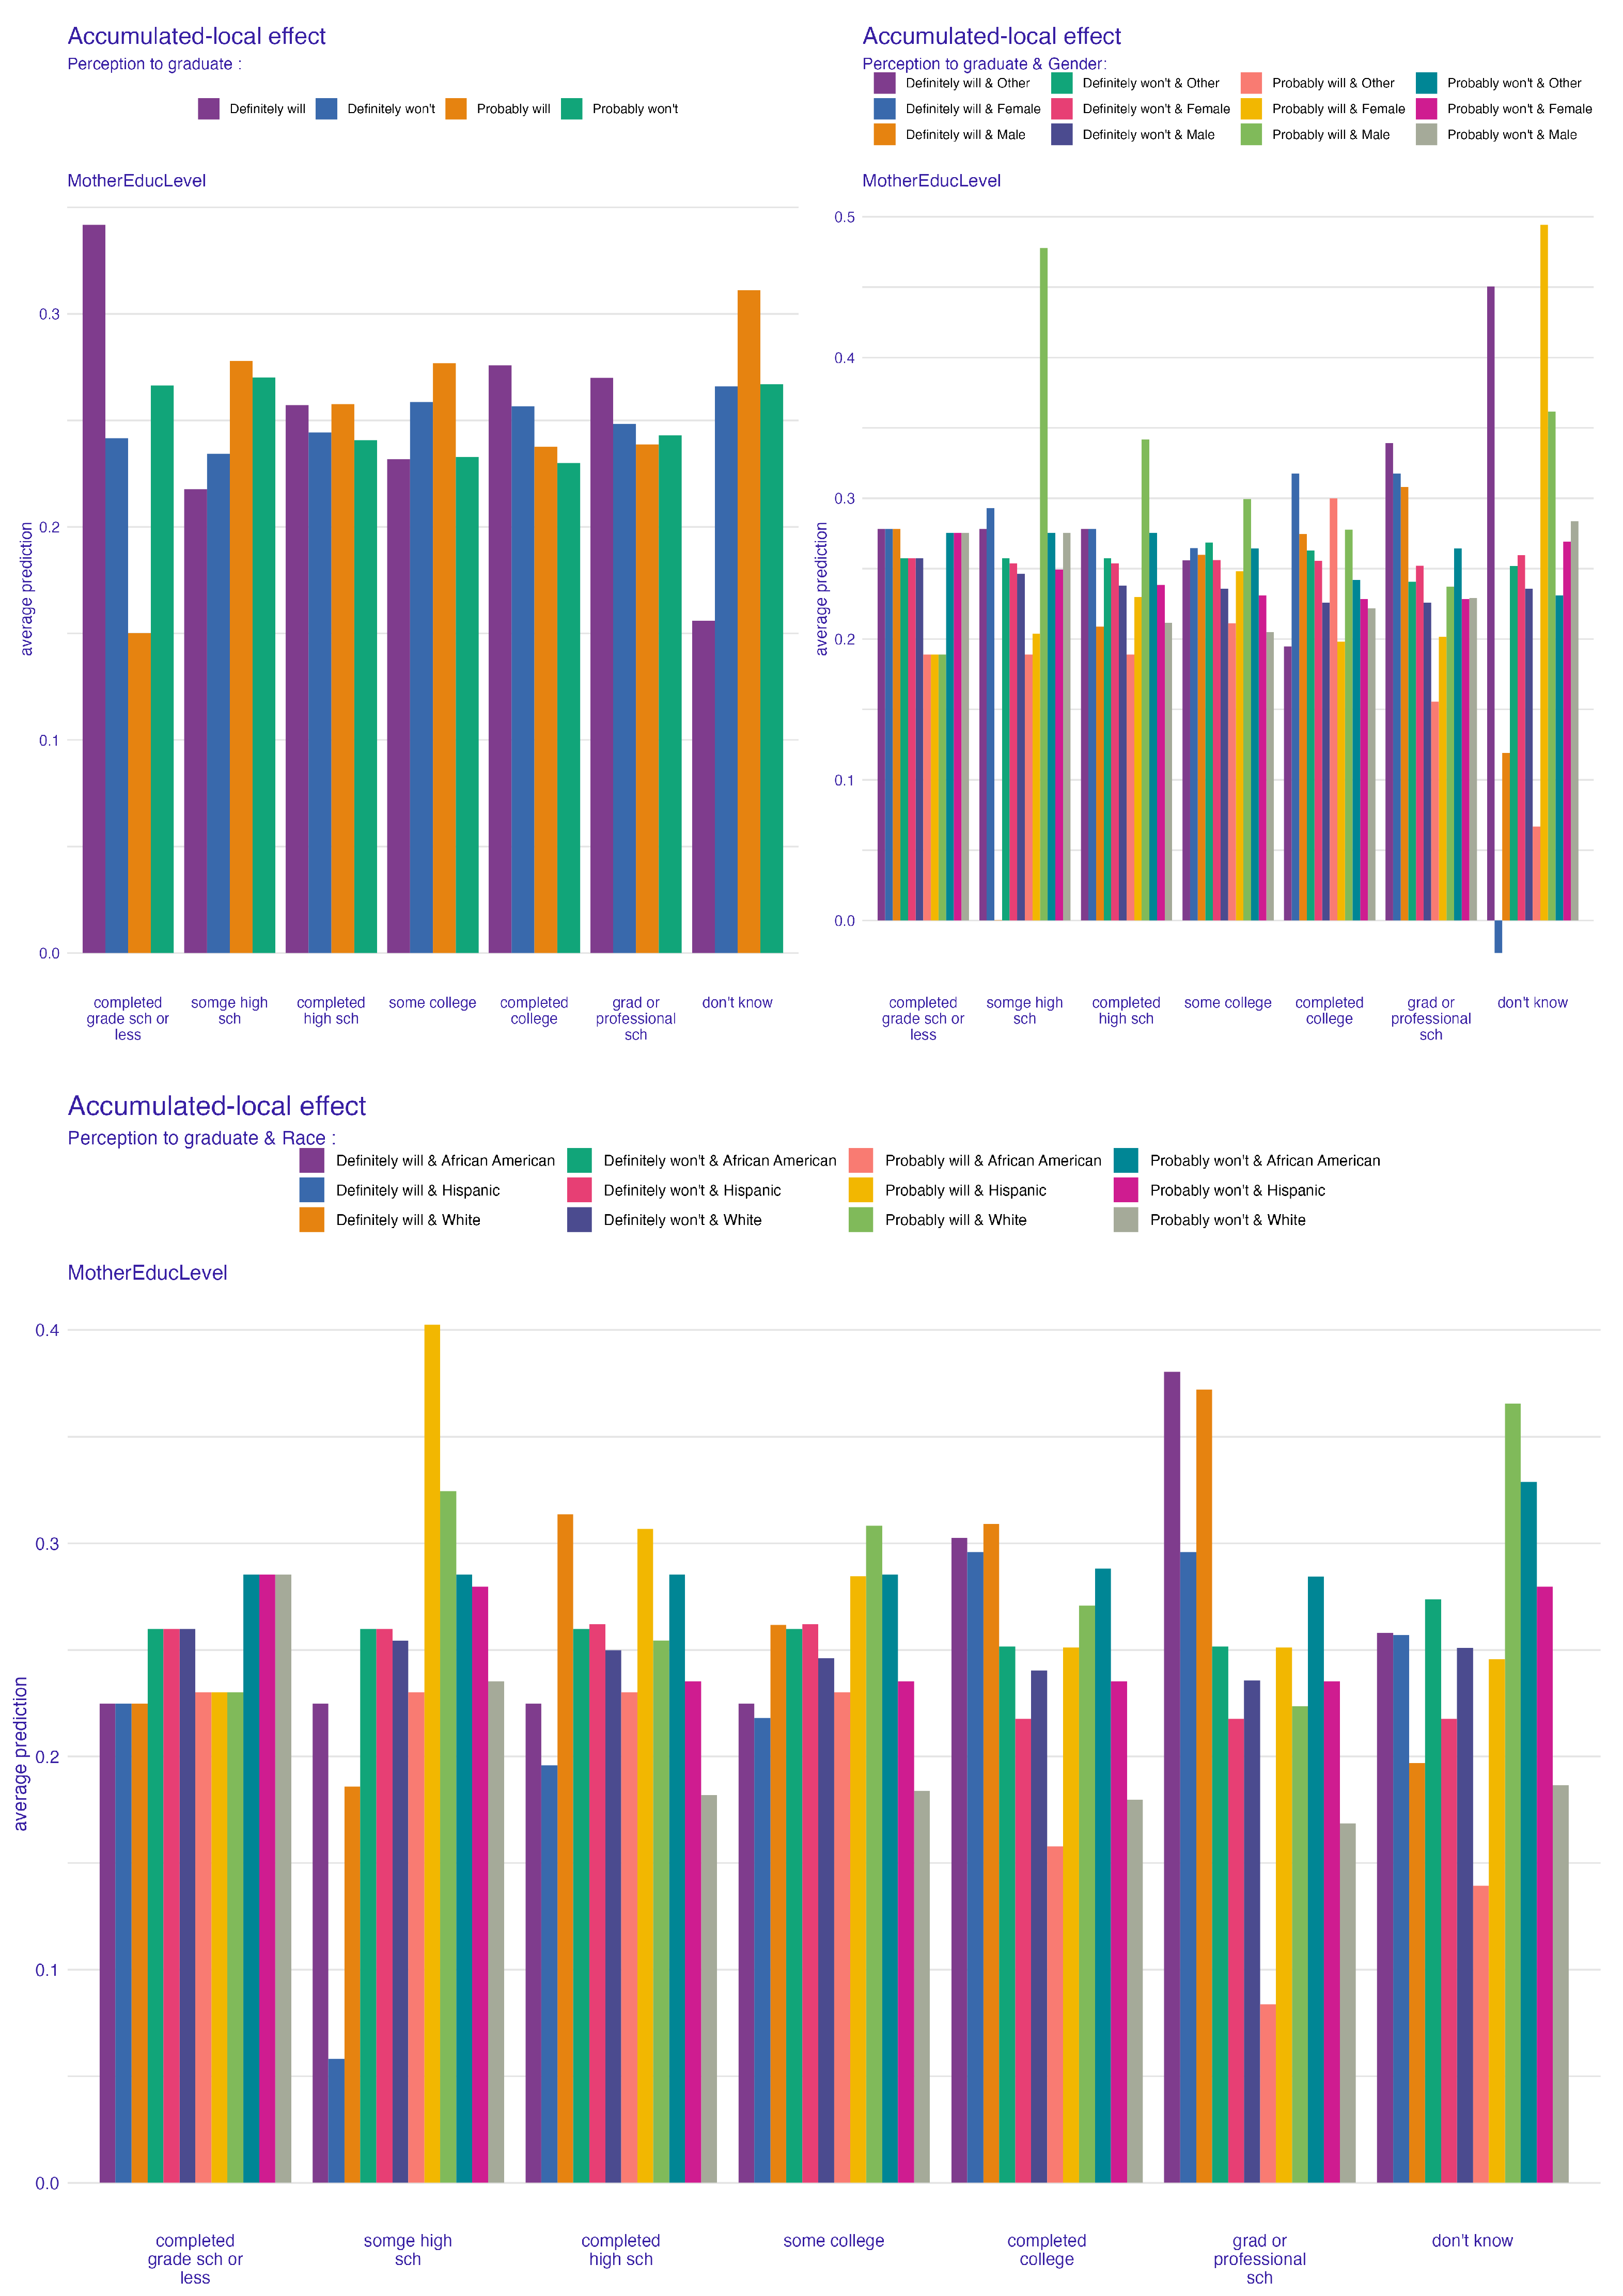
3.3. Predicting Students’ Perceptions of Graduation

Figure 1 shows the ROC curve for the RF model, demonstrating the efficiency of this model for performing classification according to students’ perceptions of graduation. The curve of the “definitely won’t graduate” category has the highest true positive rate, which shows that the model is very efficient at identifying those students who are very sure that they will not graduate. The steep rise of the curve shows high sensitivity and specificity for this group. Building upon this, as shown by the green curve, the RF model effectively distinguishes students who believe they “probably won’t graduate” from the rest of the groups, with slightly lower true positive rates than the previous category. The violet curve represents the “definitely will graduate” class, and shows a somewhat lower true positive rate; the model is still accurate, but is somewhat less effective at classifying students who are very confident of graduating. The lowest value of the true positive rate among the four classes is observed for the “probably will graduate” class, which indicates that the model is least effective in identifying those students who are moderately optimistic about their graduation. One possible explanation for this lower performance is the internal data distribution within this class, which leads to significant conditional overlap with other categories.
The permutation-based feature importance is presented in Figure 2, showing that the frequency of students’ engagement in their best schoolwork is the most important feature in the RF model. Students doing their best school work is understood as the student’s self-assessment of the degree to which they exert maximal effort, focus, and thoroughness on assignments, exams, and other school-related activities. Maternal educational level is ranked second, and its role in determining students’ graduation expectations is critical, while paternal educational level is ranked third. The fourth most important factor is the number of times a student missed homework, which means that regular attendance in classes and completing homework is a good predictor of students’ expectation to graduate. Following these, another important predictor is how often students participated in their most difficult school work, which supports the previous findings on the relationship between study habits and students’ attitudes towards education. Accordingly, the major characteristics of interest are those related to academic engagement and parental educational background, which, as theory would predict, have a greater influence on students’ perceived chances of graduating.

4. Discussion

4.1. Parental Influence on Students’ Educational Perceptions

The ALE plots provide further important insights into the role of parental education in shaping students’ perceptions of their likelihood to graduate. In these bar-style ALE plots, the y-axis labeled “average prediction” represents the mean model-predicted probability of the target graduation perception category across all observations within each feature bin, illustrating how shifts in parental education impact predicted perceptions. For instance, higher levels of maternal and paternal education are positively associated with stronger perceptions of graduating, as seen in the top left of Figure 3 and Figure 4. Students with at least one parent who attended college or received a graduate or professional school education are likely to have higher predicted perceptions of graduation than students whose parents have less education (for example, grade school or some high school). For instance, Figure 4 shows that students whose mothers have a professional education have a clear increase in average predicted perception scores. Figure 3 shows similar patterns for paternal education; that is, graduate-level paternal education is associated with an increased perception of graduating.
The effect of parental education is not equivalent and differs by race and gender, as shown by the right and bottom plots in Figure 3 and Figure 4. For example, Figure 3 shows that there are some racial groups (African-American and Hispanic) in which the perception increases more when the father’s education is high, while in other cases there is little change or even a decrease with similar levels of paternal education. This trend involves not only the educational background of the parents but also sociocultural and systemic factors associated with race which can influence these perceptions. The situation is further complicated by the existence of gender-based differences, which show that in some categories of maternal education one gender may have a greater advantage than the other. As can be seen from Figure 4, students with highly educated mothers (that is, mothers who have completed college or higher) have greater advantages for the female group, whereas others are less affected. These results are in consonance with those of Pinquart and Ebeling (2020), who established a clear relationship between parental education and students’ academic self-efficacy, which is in turn a general socioeconomic determinant of educational outcomes.

4.2. Academic Engagement and Students’ Perceptions of Graduation

Figure 5 provides important information about the relationship between academic engagement, which is operationalized in this study to include the frequency of completing one’s best schoolwork, and race and gender in relation to students’ perceptions of graduation. In all the plots, students who say they are engaged in their best schoolwork at school often or almost every time have higher predicted perceptions of graduation than those who are less engaged (those who say that they are engaged seldom or never). This tendency is displayed in consistently higher average predictions for students reporting higher levels of academic engagement. The strength of this positive association differs by race and gender. The bottom plots of Figure 5 show that there is a steep rise in perception with frequent engagement in best schoolwork among certain racial groups (Hispanic and African-American) which indicates that engagement could be having a bootstrapping effect for these groups. Other racial groups show smaller increases even at high levels of engagement, which suggests that other factors may also play a role in their academic attitudes. The right plots of Figure 5 highlight the gender differences; male students who say that they do their best schoolwork “almost always” have higher average predictions for graduation than female students in some categories, showing how gender also plays a part in these perceptions. On the other hand, those students who say they have low levels of completion of their best work (“never” or “seldom”) have lower predicted perceptions of graduation in all groups, as shown in Figure 5 (left). This supports the idea that academic engagement is a critical predictor of more favorable educational expectations.

5. Limitations of This Study

A possible limitation of this study is that we used static datasets for 8th- and 10th-grade students, which may not capture shifts in perceptions over time. While the tested machine learning methods provided useful insights into the complex relationships in the data, relying on survey responses can lead to reporting bias and limited contextual depth. Future research could also benefit from collecting longitudinal data to understand shifting perceptions over time, as well as from using qualitative methods that can enrich quantitative findings.

6. Conclusions

In conclusion, our findings reveal that unexpected drivers of student graduation perceptions extend beyond traditional academic predictors. Specifically, academic engagement measures such as the frequency of doing one’s best school work and the average time spent on schoolwork significantly influence graduation outlooks, as do parental education levels. Notably, these effects are moderated by race and gender; graduation perceptions are particularly elevated among African-American and Hispanic students when the father’s education level is high, while female students with mothers who have completed college or higher levels of education also report more positive expectations. Moreover, males who consistently report high levels of academic engagement have stronger graduation perceptions compared to their female counterparts. The results for African-American and Hispanic students who reported strong schoolwork effort further reinforce these trends.
Our results show the importance of focused initiatives to improve students’ views of graduation, especially for minority and underrepresented students. This paper recommends mentoring and guidance programs that can help to overcome systemic barriers and improve academic motivation. For example, culturally responsive mentorship programs can help students to work with mentors who are similar in culture or gender, thereby breaking barriers to engagement. Parental engagement initiatives, including workshops and educational programs, can assist parents with low levels of education to support their children’s aspirations. Counseling and supportive services for students who are not sure about the education of their parents can help them to overcome their doubts and have a positive perception of their parents regardless of their background. In addition tackling these issues, interventions should focus on maintaining a uniform level of academic engagement on the part of students. Programs such as time management workshops, peer tutoring, and self-regulated learning can strengthen the foundational academic skills of those with low levels of engagement. These efforts should be equally and appropriately applied to all schools and students, and should include culturally responsive teaching, especially in underserved communities. These strategies can be prioritized by educators and policymakers in order to close the perception gap and make sure that every student has the resources needed to succeed to the best of their ability. These measures not only benefit students individually, but also create a more equitable and inclusive learning environment.

Supplementary Materials

The following supporting information can be downloaded at: https://www.mdpi.com/article/10.3390/educsci15060670/s1, Table S1: Hyperparameters and ranges explored for each model, Figure S1: These plots show the distributions of the first eight features in the training and testing samples, with chi-square statistics for categorical features, t statistics for numeric features, and the respective p-values, Figure S2: These plots show the distributions of features 9–16 in the training and testing samples with chi-square statistics and the respective p-values, Figure S3: These plots show the distributions of features 17–24 in the training and testing samples with chi-square statistics and the respective p-values, Figure S4: These plots show the distributions of the last feature in the training and testing samples with chi-square statistics and the respective p-values.

Author Contributions

Conceptualization, P.M.C., C.B.K. and D.O.-B.; methodology, P.M.C. and D.A.; software, D.A.; validation, P.M.C. and D.A.; formal analysis, D.A. and D.O.-B.; investigation, D.A.; resources, P.M.C.; data curation, P.M.C., C.B.K. and D.O.-B.; writing—original draft preparation, Z.F., P.M.C. and D.A.; writing—review and editing, Z.F., P.M.C., C.B.K., D.A. and D.O.-B.; visualization, D.A.; supervision, P.M.C.; project administration, D.A. and P.M.C.; funding acquisition, P.M.C. All authors have read and agreed to the published version of the manuscript.

Funding

This research received no external funding.

Data Availability Statement

The data used in the study are available on the ICPSR website at https://www.icpsr.umich.edu/web/pages/, accessed on 23 March 2024, under the 2021 Monitoring the Future survey of 8th- and 10th-grade students.

Conflicts of Interest

Author Daniel Alhassan was employed by the company Wells Fargo. The remaining authors declare that the research was conducted in the absence of any commercial or financial relationships that could be construed as a potential conflict of interest.

References

  1. Apley, D. W., & Zhu, J. (2020). Visualizing the effects of predictor variables in black box supervised learning models. Journal of the Royal Statistical Society Series B: Statistical Methodology, 82(4), 1059–1086. [Google Scholar] [CrossRef]
  2. Archambault, I., Janosz, M., Olivier, E., & Dupéré, V. (2022). Student engagement and school dropout: Theories, evidence, and future directions. In Handbook of research on student engagement (pp. 331–355). Springer. [Google Scholar]
  3. Biecek, P. (2018). DALEX: Explainers for complex predictive models in R. Journal of Machine Learning Research, 19(84), 1–5. [Google Scholar]
  4. Biecek, P., & Burzykowski, T. (2021). Explanatory model analysis. Chapman and Hall/CRC. Available online: https://pbiecek.github.io/ema/ (accessed on 23 March 2024).
  5. Brier, G. W. (1950). Verification of forecasts expressed in terms of probability. Monthly Weather Review, 78(1), 1–3. [Google Scholar] [CrossRef]
  6. Brodersen, K. H., Ong, C. S., Stephan, K. E., & Buhmann, J. M. (2010, August 23–26). The balanced accuracy and its posterior distribution. 2010 20th International Conference on Pattern Recognition (pp. 3121–3124), Istanbul, Turkey. [Google Scholar]
  7. Campbell, C. (2015). High school dropouts after they exit school: Challenges and directions for sociological research. Sociology Compass, 9(7), 619–629. [Google Scholar] [CrossRef]
  8. Chen, T., & Guestrin, C. (2016, August 13–17). XGBoost: A scalable tree boosting system. 22nd ACM Sigkdd International Conference on Knowledge Discovery and Data Mining (pp. 785–794), San Francisco, CA, USA. [Google Scholar]
  9. Cover, T. M., & Hart, P. E. (1967). Nearest neighbor pattern classification (Vol. 13, No. 1). IEEE. [Google Scholar]
  10. Destin, M., & Williams, J. L. (2020). The connection between student identities and outcomes related to academic persistence. Annual Review of Developmental Psychology, 2(1), 437–460. [Google Scholar] [CrossRef]
  11. Dunlosky, J., Badali, S., Rivers, M. L., & Rawson, K. A. (2020). The role of effort in understanding educational achievement: Objective effort as an explanatory construct versus effort as a student perception. Educational Psychology Review, 32, 1163–1175. [Google Scholar] [CrossRef]
  12. Fawcett, T. (2006). An introduction to ROC analysis. Pattern Recognition Letters, 27(8), 861–874. [Google Scholar] [CrossRef]
  13. Fisher, A., Rudin, C., & Dominici, F. (2019). All models are wrong, but many are useful: Learning a Variable’s importance by studying an entire class of prediction models simultaneously. Journal of Machine Learning Research, 20(177), 1–81. [Google Scholar]
  14. Franco, C. (2020). How does relative performance feedback affect beliefs and academic decisions? AEA Randomized Controlled Trials. Available online: https://api.semanticscholar.org/CorpusID:201609652 (accessed on 18 August 2024).
  15. Freund, Y., & Schapire, R. E. (1997). A decision-theoretic generalization of on-line learning and an application to boosting. Journal of Computer and System Sciences, 55(1), 119–139. [Google Scholar] [CrossRef]
  16. Gerlinger, J., & Hipp, J. R. (2023). Schools and neighborhood crime: The effects of dropouts and high-performing schools on juvenile crime. The Social Science Journal, 60(3), 415–431. [Google Scholar] [CrossRef]
  17. Goodfellow, I., Bengio, Y., & Courville, A. (2016). Deep learning. MIT Press. [Google Scholar]
  18. Hosmer, J. D. W., Lemeshow, S., & Sturdivant, R. X. (2013). Applied logistic regression (Vol. 398). John Wiley & Sons. [Google Scholar]
  19. Jagacinski, C. M., & Nicholls, J. G. (1990). Reducing effort to protect perceived ability: They’d do it but I wouldn’t. Journal of Educational Psychology, 82, 15–21. Available online: https://api.semanticscholar.org/CorpusID:144578828 (accessed on 2 February 2025). [CrossRef]
  20. James, G., Witten, D., Hastie, T., & Tibshirani, R. (2021). Tree-Based Methods. In An introduction to statistical learning with applications in r (2nd ed., pp. 305–344). Springer. [Google Scholar]
  21. Kenny, M. E., Cinamon, R. G., Medvide, M. B., Ran, G., Davila, A., Dobkin, R., & Erby, W. (2023). Youth perceptions of their futures, society, and the work landscape: A psychology of working perspective. Journal of Career Development, 50(4), 803–823. [Google Scholar] [CrossRef]
  22. Kuhn, M. (2013). Applied predictive modeling. Springer. [Google Scholar]
  23. Lunetti, C., Di Giunta, L., Basili, E., Arbel, R., & Fiasconaro, I. (2022). Perception of school climate, academic performance and risk behaviors in adolescence. Ricerche di Psicologia, 1, 1–15. [Google Scholar] [CrossRef]
  24. Maksymiuk, S., Gosiewska, A., & Biecek, P. (2020). Landscape of R packages for eXplainable artificial intelligence. arXiv, arXiv:2009.13248. [Google Scholar]
  25. Margolis, H., & McCabe, P. P. (2003). Self-efficacy: A key to improving the motivation of struggling learners. Preventing School Failure: Alternative Education for Children and Youth, 47(4), 162–169. [Google Scholar] [CrossRef]
  26. Mensah, E., Kwarteng, S., & Jehu-Appiah, J. (2024). Investigating final-year senior high school students’ academic performance dynamics across demographics: The case of students in Cape Coast, Ghana. Science Mundi, 4(2), 243–258. [Google Scholar] [CrossRef]
  27. Miech, R. A., Bachman, J. G., Johnston, L. D., O’Malley, P. M., Patrick, M. E., & Schulenberg, J. E. (2022). Monitoring the future: A continuing study of American youth (12th-grade survey). Available online: https://www.icpsr.umich.edu/web/ICPSR/studies/38502 (accessed on 15 April 2023).
  28. Molnar, C. (2022). Interpretable machine learning (2nd ed.). Available online: https://christophm.github.io/interpretable-ml-book (accessed on 23 March 2024).
  29. Olivier, E., Archambault, I., De Clercq, M., & Galand, B. (2019). Student self-efficacy, classroom engagement, and academic achievement: Comparing three theoretical frameworks. Journal of Youth and Adolescence, 48, 326–340. [Google Scholar] [CrossRef]
  30. Pinquart, M., & Ebeling, M. (2020). Parental educational expectations and academic achievement in children and adolescents—A meta-analysis. Educational Psychology Review, 32(2), 463–480. [Google Scholar] [CrossRef]
  31. Powers, D. M. (2020). Evaluation: From precision, recall and F-measure to ROC, informedness, markedness and correlation. arXiv, arXiv:2010.16061. [Google Scholar]
  32. Quinlan, J. R. (1986). Induction of Decision Trees. Machine Learning, 1, 81–106. [Google Scholar] [CrossRef]
  33. R Core Team. (2023). R: A language and environment for statistical computing [Computer software manual]. R Core Team. Available online: https://www.R-project.org/ (accessed on 15 April 2023).
  34. Ressa, T., & Andrews, A. (2022). High school dropout dilemma in America and the importance of reformation of education systems to empower all students. International Journal of Modern Education Studies, 6(2), 423–447. [Google Scholar] [CrossRef]
  35. Rumberger, R. W. (2020). The economics of high school dropouts. The Economics of Education, 2020, 149–158. [Google Scholar]
  36. Rumberger, R. W., & Lim, S. A. (2008). Why students drop out of school: A review of 25 years of research. University of California, Santa Barbara, California Dropout research project report #15. Available online: https://www.issuelab.org/resources/11658/11658.pdf (accessed on 2 February 2025).
  37. Tannert, S., & Gröschner, A. (2021). Joy of distance learning? How student self-efficacy and emotions relate to social support and school environment. European Educational Research Journal, 20(4), 498–519. [Google Scholar] [CrossRef]
  38. Tinto, V. (2022). Exploring the character of student persistence in higher education: The impact of perception, motivation, and engagement. In Handbook of research on student engagement (pp. 357–379). Springer. [Google Scholar]
  39. Wang, M.-T., Fredricks, J., Ye, F., Hofkens, T., & Linn, J. S. (2017). Conceptualization and assessment of adolescents’ engagement and disengagement in school. European Journal of Psychological Assessment, 35(4), 592–606. [Google Scholar] [CrossRef]
  40. Wang, Q., Lee, K. C. S., & Hoque, K. E. (2023). The mediating role of classroom climate and student self-efficacy in the relationship between teacher leadership style and student academic motivation: Evidence from China. The Asia-Pacific Education Researcher, 32(4), 561–571. [Google Scholar] [CrossRef]
  41. Wu, X., Zhang, W., Li, Y., Zheng, L., Liu, J., Jiang, Y., & Peng, Y. (2024). The influence of big five personality traits on anxiety: The chain mediating effect of general self-efficacy and academic burnout. PLoS ONE, 19(1), e0295118. [Google Scholar] [CrossRef]
  42. Yeager, D. S., & Dweck, C. S. (2012). Mindsets that promote resilience: When students believe that personal characteristics can be developed. Educational Psychologist, 47(4), 302–314. [Google Scholar] [CrossRef]
Figure 1. ROC curve for the random forest model.
Education 15 00670 g001
Figure 2. Permutation-based feature importance for the random forest model.
Education 15 00670 g002
Figure 3. ALE of father’s education level on students’ perception of graduation likelihood (left), across gender categories (right), and across different racial groups (bottom). The plots illustrate variable impacts across racial groups, with particularly strong effects noted in African-American and Hispanic communities.
Education 15 00670 g003
Figure 4. ALE of mother’s education level on students’ perception of graduation likelihood (left), across gender categories (right), and across different racial groups (bottom). Plots illustrate variable impacts across racial groups, with particularly strong effects noted in African-American and Hispanic communities.
Education 15 00670 g004
Figure 5. ALE plots of the frequency of students’ best school work on the perception to graduation likelihood (left), the same grouped by gender (right), and the same grouped by race (bottom).
Education 15 00670 g005aEducation 15 00670 g005b
Table 1. Distribution of key features used in our analysis.
LevelCounts (%)
n 21,244
Gender (%)Male10,427 (49.1)
Female9791 (46.1)
Other1026 ( 4.8)
Race (%)African American2174 (10.2)
White15,892 (74.8)
Hispanic3178 (15.0)
Times of Best School Work (%)Never237 ( 1.1)
Seldom960 ( 4.5)
Sometimes3841 (18.1)
Often7490 (35.3)
Almost always8716 (41.0)
Mother’s Education Level (%)Completed grade sch. or less468 ( 2.2)
Some high sch.1200 ( 5.6)
Completed high sch.3005 (14.1)
Some college2741 (12.9)
Completed college6620 (31.2)
Grad. or professional sch.4281 (20.2)
Don’t know2929 (13.8)
Father’s Education Level (%)Completed grade sch. or less596 ( 2.8)
Some high sch.1650 ( 7.8)
Completed high sch.4091 (19.3)
Some college2367 (11.1)
Completed college5173 (24.4)
Grad. or professional sch.3135 (14.8)
Don’t know4232 (19.9)
Table 2. Comparison of performance metrics across the seven models.
ModelAUCF1RecallPrecisionAccuracyBrier Score
Logistic Regression0.7730.7510.7140.8030.6730.202
KNN0.6700.7360.7150.7590.5790.207
Decision Tree0.500---0.5000.274
Random Forest0.7580.7880.8060.7800.5770.145
AdaBoost0.7400.7780.7990.7640.5630.150
XGBoost0.7710.7520.7200.8010.6610.202
Neural Network0.7470.7280.6910.7900.6490.293
Disclaimer/Publisher’s Note: The statements, opinions and data contained in all publications are solely those of the individual author(s) and contributor(s) and not of MDPI and/or the editor(s). MDPI and/or the editor(s) disclaim responsibility for any injury to people or property resulting from any ideas, methods, instructions or products referred to in the content.

