Abstract
The growing prominence of e-learning in education has led to the need for a comprehensive understanding of the factors influencing learning outcomes. This study aims to investigate the combined effects of e-learning orientation, Moodle usage, and learning planning on learning outcomes in the context of on-demand lectures. A sample of participants from the Department of Information Science and Engineering in the Faculty of Engineering completed questionnaires related to e-learning orientation, while Moodle usage data and learning planning information were collected. Correlation, principal component, cluster, and multiple regression analysis were conducted to examine the relationships between variables and their impact on learning outcomes. The results suggest that e-learning orientation did not exert a significant influence on learning outcomes. However, Moodle usage and learning planning emerged as crucial factors. Increased engagement with Moodle, as indicated by higher clicks and utilization of its learning functionalities, was associated with improved learning outcomes. Additionally, effective learning planning, characterized by adherence to schedules and timely submissions, positively influenced learning outcomes. The results emphasize the importance of considering multiple factors, not just a single factor, for successful online learning. These findings provide valuable insights for optimizing learning outcomes in on-demand lectures.
1. Introduction
The proliferation of the novel coronavirus during the spring of 2020 compelled numerous academic institutions to swiftly transition towards virtual instructional formats [1,2,3]. Online pedagogical methods, commonly referred to as “e-learning”, have been extensively employed and examined since the early 2000s. E-learning represents a comprehensive concept encompassing various approaches to education that harness the potential of information and communication technologies (ICT) [4]. In the Japanese context, e-learning has been primarily utilized in on-demand instructional settings, predominantly within corporate training initiatives, university correspondence courses, and tutoring establishments. Although many universities had previously incorporated elements of e-learning into select lectures before the advent of the COVID-19 crisis, it is challenging to assert that a significant proportion of students and faculty members were thoroughly acquainted with this educational paradigm. Furthermore, previous studies have focused primarily on the general e-learning environment, but there is still a lack of detailed research on the characteristics and impact of on-demand lecture-based learning environments in the COVID-19 crisis. In addition, not only how the three factors of e-learning orientation, Moodle usage, and learning planning affect on-demand classroom performance but also the interrelationships among these factors have not been fully investigated. Against this background, this study is positioned as an attempt to fill the aforementioned research gap. On-demand lectures are typically facilitated through a university’s Learning Management System (LMS) [5,6]. Online classes have garnered favorable opinions owing to their efficacy in curbing the spread of infectious diseases within academic environments, including universities [7]. Furthermore, their advantages, such as the ability to engage in self-paced studying, conduct coursework from the comfort of one’s home, and avail oneself of extensive review opportunities, have been widely acknowledged. Conversely, critical feedback has highlighted issues such as educational inequities stemming from disparities in access to electronic equipment and internet connectivity, potential lifestyle deterioration, feelings of social isolation, an overwhelming number of assignments, challenges in comprehending instructions, and difficulties in acclimating to the learning pace [8].
Numerous scholarly publications investigating the pedagogical impacts associated with e-learning have been disseminated across various academic domains. It has been reported that online learning is almost as effective for learning as face-to-face classes [9]. It is worth noting that not all learners perceive e-learning as efficacious. Previous studies have suggested that there are differences among learners in their orientation toward e-learning [10,11,12,13]. Learners’ suitability/unsuitability toward e-learning is referred to as e-learning orientation [10,11,12,13]. In a study [10], the authors examined the relationship between learning style, and learning effectiveness was explored by comparing the outcomes of e-learning and traditional face-to-face instruction among university students. The results of their analysis suggested that there were differences in learning effectiveness depending on the learning style. Learners exhibit heterogeneity in their suitability for engaging with e-learning methodologies. Furthermore, the results demonstrated that the high e-learning orientation group achieved significantly higher test scores when compared to the low e-learning orientation group [11]. The authors of this research [12] devised a condensed version of the e-Learning Orientation Questionnaire, encompassing five dimensions: preference, dedication, flexibility, monotony, and solitude. Positive impressions of e-learning encompass preference, dedication, and flexibility, while negative impressions revolve around monotony and loneliness. It was further ascertained that e-learning orientation engenders differential effects on the efficacy of the learning experience, including the inclination to persist with learning and the evaluation of the course [13].
Digital pedagogy, characterized by its unbounded accessibility and autonomic flexibility, is spearheading innovative approaches in terms of educational dissemination. It accords learners the salient benefit of self-paced study unimpeded by conventional temporal or geographical restrictions. Yet, this mode of instruction brings with it inherent challenges, particularly the risk of alienating students from the process of intellectual acquisition. Specifically, the spontaneous structure of tutelage necessitates that students assume primary responsibility for their intellectual advancement, often in an academic milieu devoid of extrinsic motivation from educators or peers. Though this circumstance may offer a liberating and inventive academic sphere for certain students, it might simultaneously induce disorientation and apprehension in others. Additionally, this autonomous learning milieu may foster intellectual disengagement in students deficient in requisite self-regulatory competencies [14]. An evaluative approach to measuring the effectiveness of this pedagogical method could involve gauging engagement within a LMS. Empirical findings have demonstrated an association between reduced LMS engagement and suboptimal scholastic performance [15], thereby bolstering the proposition that proactive student involvement enhances educational outcomes. Increased student activity was noted on course pages due to changes in learning design in online learning that were made during the pandemic [16]. However, this finding does not necessarily denote a cause–effect relationship, necessitating further exploration to decipher the connection between individual learning proclivities, adaptive capabilities, and contextual variables. In this paper, the frequency of involvement with Moodle is referred to as Moodle usage.
Self-regulated learning encapsulates an array of processes wherein learners initiate and maintain autonomously derived cognitive, emotional, and behavioral actions to accomplish their objectives [17]. This paradigm unfolds in three phases: the preparatory phase, entailing goal delineation and strategizing, the operational phase, encapsulating task execution, and the introspective phase, involving reflection on the outcomes and cultivating associations with the forthcoming learning phase [18]. Self-regulated learning tactics are contemplated in the framework of motivation and pedagogical strategies, encompassing cognitive approaches associated with comprehending and retaining academic content, metacognitive tactics linked to regulating academic progression, and resource management strategies aligned with orchestrating a conducive learning environment [19]. In recent epochs, the scholastic environment has undergone substantial transformations with the advent of multifarious digital technologies, rendering e-learning a prevalent mode of education. Amid this backdrop, the efficacy with which learners employ self-regulated learning methodologies is particularly underscored [20,21]. The capacity to devise precise academic plans, encompassing attendance at virtual and in-person classes, participating in on-demand courses, and designating time for assignment completion, is integral to e-learning results. Concerning time management, learners necessitate proficiency in allocating, organizing, and administering their time through monthly and weekly tasks and schedules [22]. Moreover, learners’ adaptability to e-learning and on-demand approaches can significantly influence the outcomes of their academic endeavors [23]. Specifically, academic procrastination is identified as a potential deterrent to learning motivation, thereby adversely impacting academic results [24,25,26]. Conversely, an earlier study scrutinizing the correlation between academic procrastination and course accomplishment [27] ascertained that class absences and tardy assignment submissions were negatively significant predictors of course achievement. These findings underscore the premise that proficiency in self-regulated learning skills significantly influences e-learning success. In this paper, scheduled lectures and assignments are referred to as learning planning.
A group of information science students from the College of Engineering took an online class during the COVID-19 crisis. The lecture was on data science. Before the COVID-19 crisis, the class was usually held in person. During the COVID-19 crisis, the class was conducted online. While previous studies have focused primarily on the general e-learning environment, this paper focuses on the learning environment of on-demand lectures. On-demand lectures are a flexible format that allows participants to learn at their own pace, and learning approaches may differ depending on their characteristics. In this study, we examine whether performance in on-demand classes is influenced by e-learning orientation, Moodle usage, and learning planning. Several studies have been conducted on the relationship between multiple factors and learning outcomes [28,29]. The results of those studies reported that learning planning has the greatest impact on learning outcomes. The relationship between e-learning orientation and learning outcomes, the relationship between Moodle usage and learning outcomes, and the relationship between learning planning and learning outcomes has not been confirmed among factors. Because the relationships among these factors are influenced by many factors, it is sometimes difficult to draw general conclusions. In particular, the relationship between e-learning orientation and learning outcomes with several other factors has not yet been confirmed. Learners’ characteristics, the learning environment, and course content may have a combined effect on learning outcomes. This study will simultaneously assess the impact of multiple factors on learning outcomes, such as e-learning orientation, Moodle usage, and learning planning, rather than a single factor. By assessing them simultaneously, we will be able to determine which individual learner characteristics influence learning outcomes. This will provide a comprehensive understanding of the factors that shape learning outcomes in the context of on-demand lectures. This study will test four predictions.
- To determine whether e-learning orientation affects on-demand lecture grades in this study. There is a paper [11] that reports that it does affect it. If it does, it is thought to be due to loneliness and unfamiliarity with IT in the COVID-19 crisis. We predict that e-learning orientation will affect grades.
- To determine whether Moodle usage affects on-demand lecture grades in this study, it has been reported that students with higher access to materials provided in Moodle have higher exam scores, and students with lower access have lower exam scores [15]; we predict that Moodle usage will have an impact on grades.
- To determine whether learning planning affects on-demand lecture grades in this study. In previous studies, it has been reported that those who plan better have better learning outcomes. We predict that students who can plan their online classes within the lecture time on their timetable will perform better.
- To determine whether e-learning orientation, Moodle usage, and learning planning are related to each other. Previous studies have not found a relationship between multiple factors of e-learning orientation, Moodle usage, and learning planning. This study will investigate not only how the three factors of e-learning orientation, Moodle usage, and learning planning affect the performance of on-demand classes but also the interrelationships among these factors. This will reveal how these factors interact with each other and what complex effects they have on learning outcomes.
These are the four objectives of this study. Analyzing student learning patterns in an on-demand lecture-based learning environment, which became widespread as a result of the COVID-19 crisis, in terms of e-learning orientation, Moodle usage, and learning planning, will contribute to improving student learning experiences in future university environments.
2. Materials and Methods
2.1. Survey Sample
The data for this paper were derived from a lecture on Data Science Technology delivered to students in the Department of Information Science and Engineering, Faculty of Engineering, Yamaguchi University, who were in their second year or above. This lecture is about data science, especially statistics, visualization, and artificial intelligence. In this lecture, in addition to learning about the concepts of data science, students will learn through actual hands-on activities such as data analysis using Python. This lecture is accredited by the Ministry of Education, Culture, Sports, Science and Technology (MEXT) as an “Applied Basic Level of Accreditation System for Mathematics, Data Science and AI Smart Higher Education Program (MDASH-Advanced Literacy)” [30]. This lecture was required. Out of the 113 students in attendance, 82 students participated in the questionnaire, and their responses were used for analysis. Of these participants, 71 were male and 11 were female. The survey was conducted from April to June 2022, within the initial quota period. The collected data included scores from the final exam, the total number of interactions with the Moodle course, the total number of lecture videos viewed, the total number of quiz attempts, submission times for assignments, and responses to the questionnaire.
2.2. Online Course Content
This lecture was conducted twice a week. In the timetable, it was on Wednesday and Thursday. Each lecture was accessible at the start of the timetable. In each lecture, students watched a video, took a knowledge test, summarized what they had learned, and submitted a Python programming assignment (Jupyter Notebook). In each session, students did these things by the deadline. The Moodle course included lecture videos, quizzes, submission boxes, questionnaire forms, and teaching materials. The textbook [31] with the video material was the course material, and the students had it in real life. The lecture videos and quizzes could be accessed at any time and as often as needed, from the date and time of that lecture until the exam was completed. Students could ask questions at any time via email or questionnaire form.
2.2.1. Lecture Videos
An audiovisual resource of videos (in Kaltura format) of lectures on data science technology designed by the educator has been uploaded. It was accessible at the beginning of each class session. After each class, the videos could be viewed as many times as needed at any time.
2.2.2. Quizzes
Quizzes consisting of different types of questions (multiple choice, correct/incorrect, matching, fill-in-the-blanks, calculations) were designed and uploaded by the educator to test student understanding of the content being taught. They were accessible at the start of each class session. The quiz could be taken as often as needed at any time after each class session. The quiz setup also allowed students to receive the correct answers, scoring, and feedback on their answers immediately after they were given.
2.2.3. Submission Box
Python programming assignments on s statistics, visualization, and artificial intelligence were assigned in each lecture. Students programmed and submitted a Jupyter Notebook. Explanations of the assignments were provided in the lecture videos.
2.2.4. Questionnaire Form
Students responded to a questionnaire form for each lecture, indicating their understanding of the lecture and their questions or requests to the educator.
2.2.5. Teaching Materials
There was a textbook [31] detailing the content of this lecture. Additional materials have been uploaded, including materials on how to install Jupyter Notebook and an explanation of Python programming.
2.3. Data Collection and Research Instrument
The collected data included scores from the final exam, the total number of interactions with the Moodle course, the total number of lecture videos viewed, the total number of quiz attempts, submission times for assignments, and responses to the questionnaire. In this study, the learning outcome was the score on the final exam. The final exam consisted of questions that confirmed the students’ knowledge of data science, statistics, visualization, and artificial intelligence studied in this course. Data on individual student enrollment and activity logs throughout the semester were generated via Moodle. These data were downloaded and analyzed offline using Exploratory v6.12.4 (Exploratory, Inc., Mill Valley, CA, USA, https://exploratory.io (accessed on 20 May 2023)). Student online activity was calculated based on the number of interactions in Moodle. The “number of interactions” is the total number of times a student clicked to access a class.
Moodle usage was evaluated based on the total number of Moodle interactions, the total number of lecture videos viewed, and the total number of quiz attempts. The total number of lecture videos viewed was obtained from Moodle records of the number of times a video placed in a Moodle course was viewed. The total number of times the video was viewed in each session was used as the total number of lecture videos viewed. The total number of quiz attempts was obtained from Moodle records of the number of times the quiz function was attempted in Moodle. The total number of attempts made in each session was taken as the total number of quiz attempts.
Learning planning was evaluated based on the remaining time until the deadline for each session. The time of submission was the time of submission to the submission box in Moodle and was obtained from the Moodle records. The remaining time until the deadline was obtained from the Moodle records. Data were adjusted to zero if deadlines were missed or assignments were not submitted. Data on the remaining time until the deadline for the 15th lecture were excluded because, unlike the other lectures, the submission deadline was short. So, the submission time data handled in this experiment was from the first to the fourteenth lecture. The remaining time until the deadline for each of the first through fourteenth sessions was obtained. The average of the remaining time until the deadline between the first and fourteenth sessions was determined, and this value was used as the average remaining time until the deadline.
2.4. Questionnaire
The study determined values for e-learning orientation and Moodle usage and learning planning in each student. For e-learning orientation, five items (preference, dedication, flexibility, monotony, and solitude; 10-item method) were used based on the existing “e-Learning Orientation Questionnaire Short Version” [8]. However, since this was an on-demand lecture, the term “e-learning” was replaced by “on-demand lecture. The questionnaire was written in Japanese. All items used a 10-point Likert scale ranging from 1 (not at all agree) to 10 (completely agree). The questionnaire had five components: preference, dedication, flexibility, monotony, and solitude. The preference questions asked students to indicate that on-demand lectures suited them and that they liked learning this way. The dedication questions were the question that on-demand lectures are good in that they allow one to study carefully and alone in a planned manner. The flexibility question asked about the flexibility of the on-demand lectures is that they are not restricted by time or place, so they can study according to their convenience. The monotony questions were those that say that on-demand lectures are not enough because they feel monotonous. The solitude questions asked about the sense of loneliness because it is difficult to make friends in on-demand lectures because one takes the class alone. Preference, dedication, and flexibility are positive impressions of on-demand lectures, while monotony and solitude were negative impressions. In particular, the scoring for monotony and loneliness was reversed in the data analysis.
2.5. Data Analytics
Pearson correlation analysis was performed to examine the relationship between final exam scores and variables and between variables. The variables included the total number of lecture videos viewed, the total number of quiz attempts, the total number of Moodle interactions, the average remaining time until the deadline, and the e-learning orientation dimensions (preference, dedication, flexibility, monotony, and solitude). Values were standardized in principal component and cluster analysis and multiple regression analysis to ensure comparability. Principal component analysis was used specifically for the five e-learning orientation items. In addition, a non-hierarchical cluster analysis with K-means was used for the e-learning orientation, and a non-hierarchical cluster analysis with K-means was used to evaluate Moodle usage. Similarly, a non-hierarchical cluster analysis with K-means was used to evaluate learning planning. A one-way analysis of variance (ANOVA) was selected to determine if there were differences among the clusters in final exam scores, the total number of lecture videos viewed, the total number of quiz attempts, the total number of Moodle interactions, and the remaining time until the deadline, respectively. In this study, a difference was considered statistically significant when p < 0.05.
Multiple regression analysis was performed to examine the magnitude of the contribution of the variables. The objective variable was the final exam score. The predictor variables were the total number of lecture videos viewed, the total number of quiz attempts, the total number of Moodle interactions, the average remaining time until the deadline, and dimensions of e-learning orientation (preference, dedication, flexibility, monotony, and solitude). R2 refers to the precision of the overall regression equation and takes values between 0 and 1. In multiple regression analysis, the absolute value of t-ratio represents the magnitude of the influence of each explanatory variable on the objective variable, with larger absolute values indicating a stronger influence.
We checked whether the clusters of e-learning orientation, Moodle usage, and learning planning were consistent with each other. To evaluate the clustering results, precision, recall, and F-measure were calculated over the duo of participant data (e-learning orientation and Moodle usage, e-learning orientation and learning planning, and Moodle usage and learning planning) [32]. For every duo of data points that mutually inhabit at least one cluster within the overlapping cluster outcomes, these metrics endeavor to ascertain the accuracy of their group categorization in relation to the inherent truth of the data’s categorizations. Precision is gauged as the proportion of duos correctly assigned to an identical cluster, while recall denotes the fraction of genuine pairs that were accurately identified. Meanwhile, the F-measure serves as the harmonic mean of both precision and recall. F-measure is used as a degree of coincidence between clusterings; F-measure can range from 0.0 to 1.0, with values closer to 1.0 meaning more coincidence.
3. Results
3.1. Relationship between Final Exam Scores and Each Variable
The relationship between final exam scores and various factors was examined through Pearson correlation analysis. Specifically, the correlations investigated were as follows: final exam scores and the total number of lecture videos viewed, final exam scores and the total number of quiz attempts, final exam scores and the total number of Moodle interactions, final exam scores and the average remaining time until the deadline, final exam scores and e-learning orientation preference, final exam scores and e-learning orientation dedication, final exam scores and e-learning orientation flexibility, final exam scores and e-learning orientation monotony, and final exam scores and e-learning orientation solitude. The results indicated a significant positive correlation between final exam scores and the total number of lecture videos viewed (r = 0.38, p < 0.01), final exam scores and the total number of quiz attempts (r = 0.63, p < 0.01), final exam scores and the total number of Moodle interactions (r = 0.63, p < 0.01), and final exam scores and the average remaining time until the deadline (r = 0.50, p < 0.01). However, there was no significant correlation between final exam scores and the e-learning orientation preference (r = −0.07, p = 0.51), final exam scores and the e-learning orientation dedication (r = 0.06, p = 0.60), final exam scores and the e-learning orientation monotony (r = 0.05, p = 0.68), final exam scores and the e-learning orientation flexibility (r = 0.03, p = 0.77), or final exam scores and the e-learning orientation solitude (r = −0.11, p = 0.34).
3.2. Analysis of E-Learning Orientation
A principal component analysis was performed on the five items of e-learning orientation, consolidating them into a reduced number of dimensions. It was determined that the first and second principal components, with eigenvalues greater than 1, would be utilized. At this stage, the cumulative contribution ratio reached 65.21%. Table 1 displays the factor loadings associated with each principal component. Based on the factor loadings, the first principal component can be interpreted as a positive factor, indicating the ability to schedule on-demand lectures according to one’s convenience. Conversely, the second principal component represents a negative factor, reflecting the perception of monotony and limited opportunities for social interactions in on-demand lectures.

Table 1.
The factor loadings associated with each principal component.
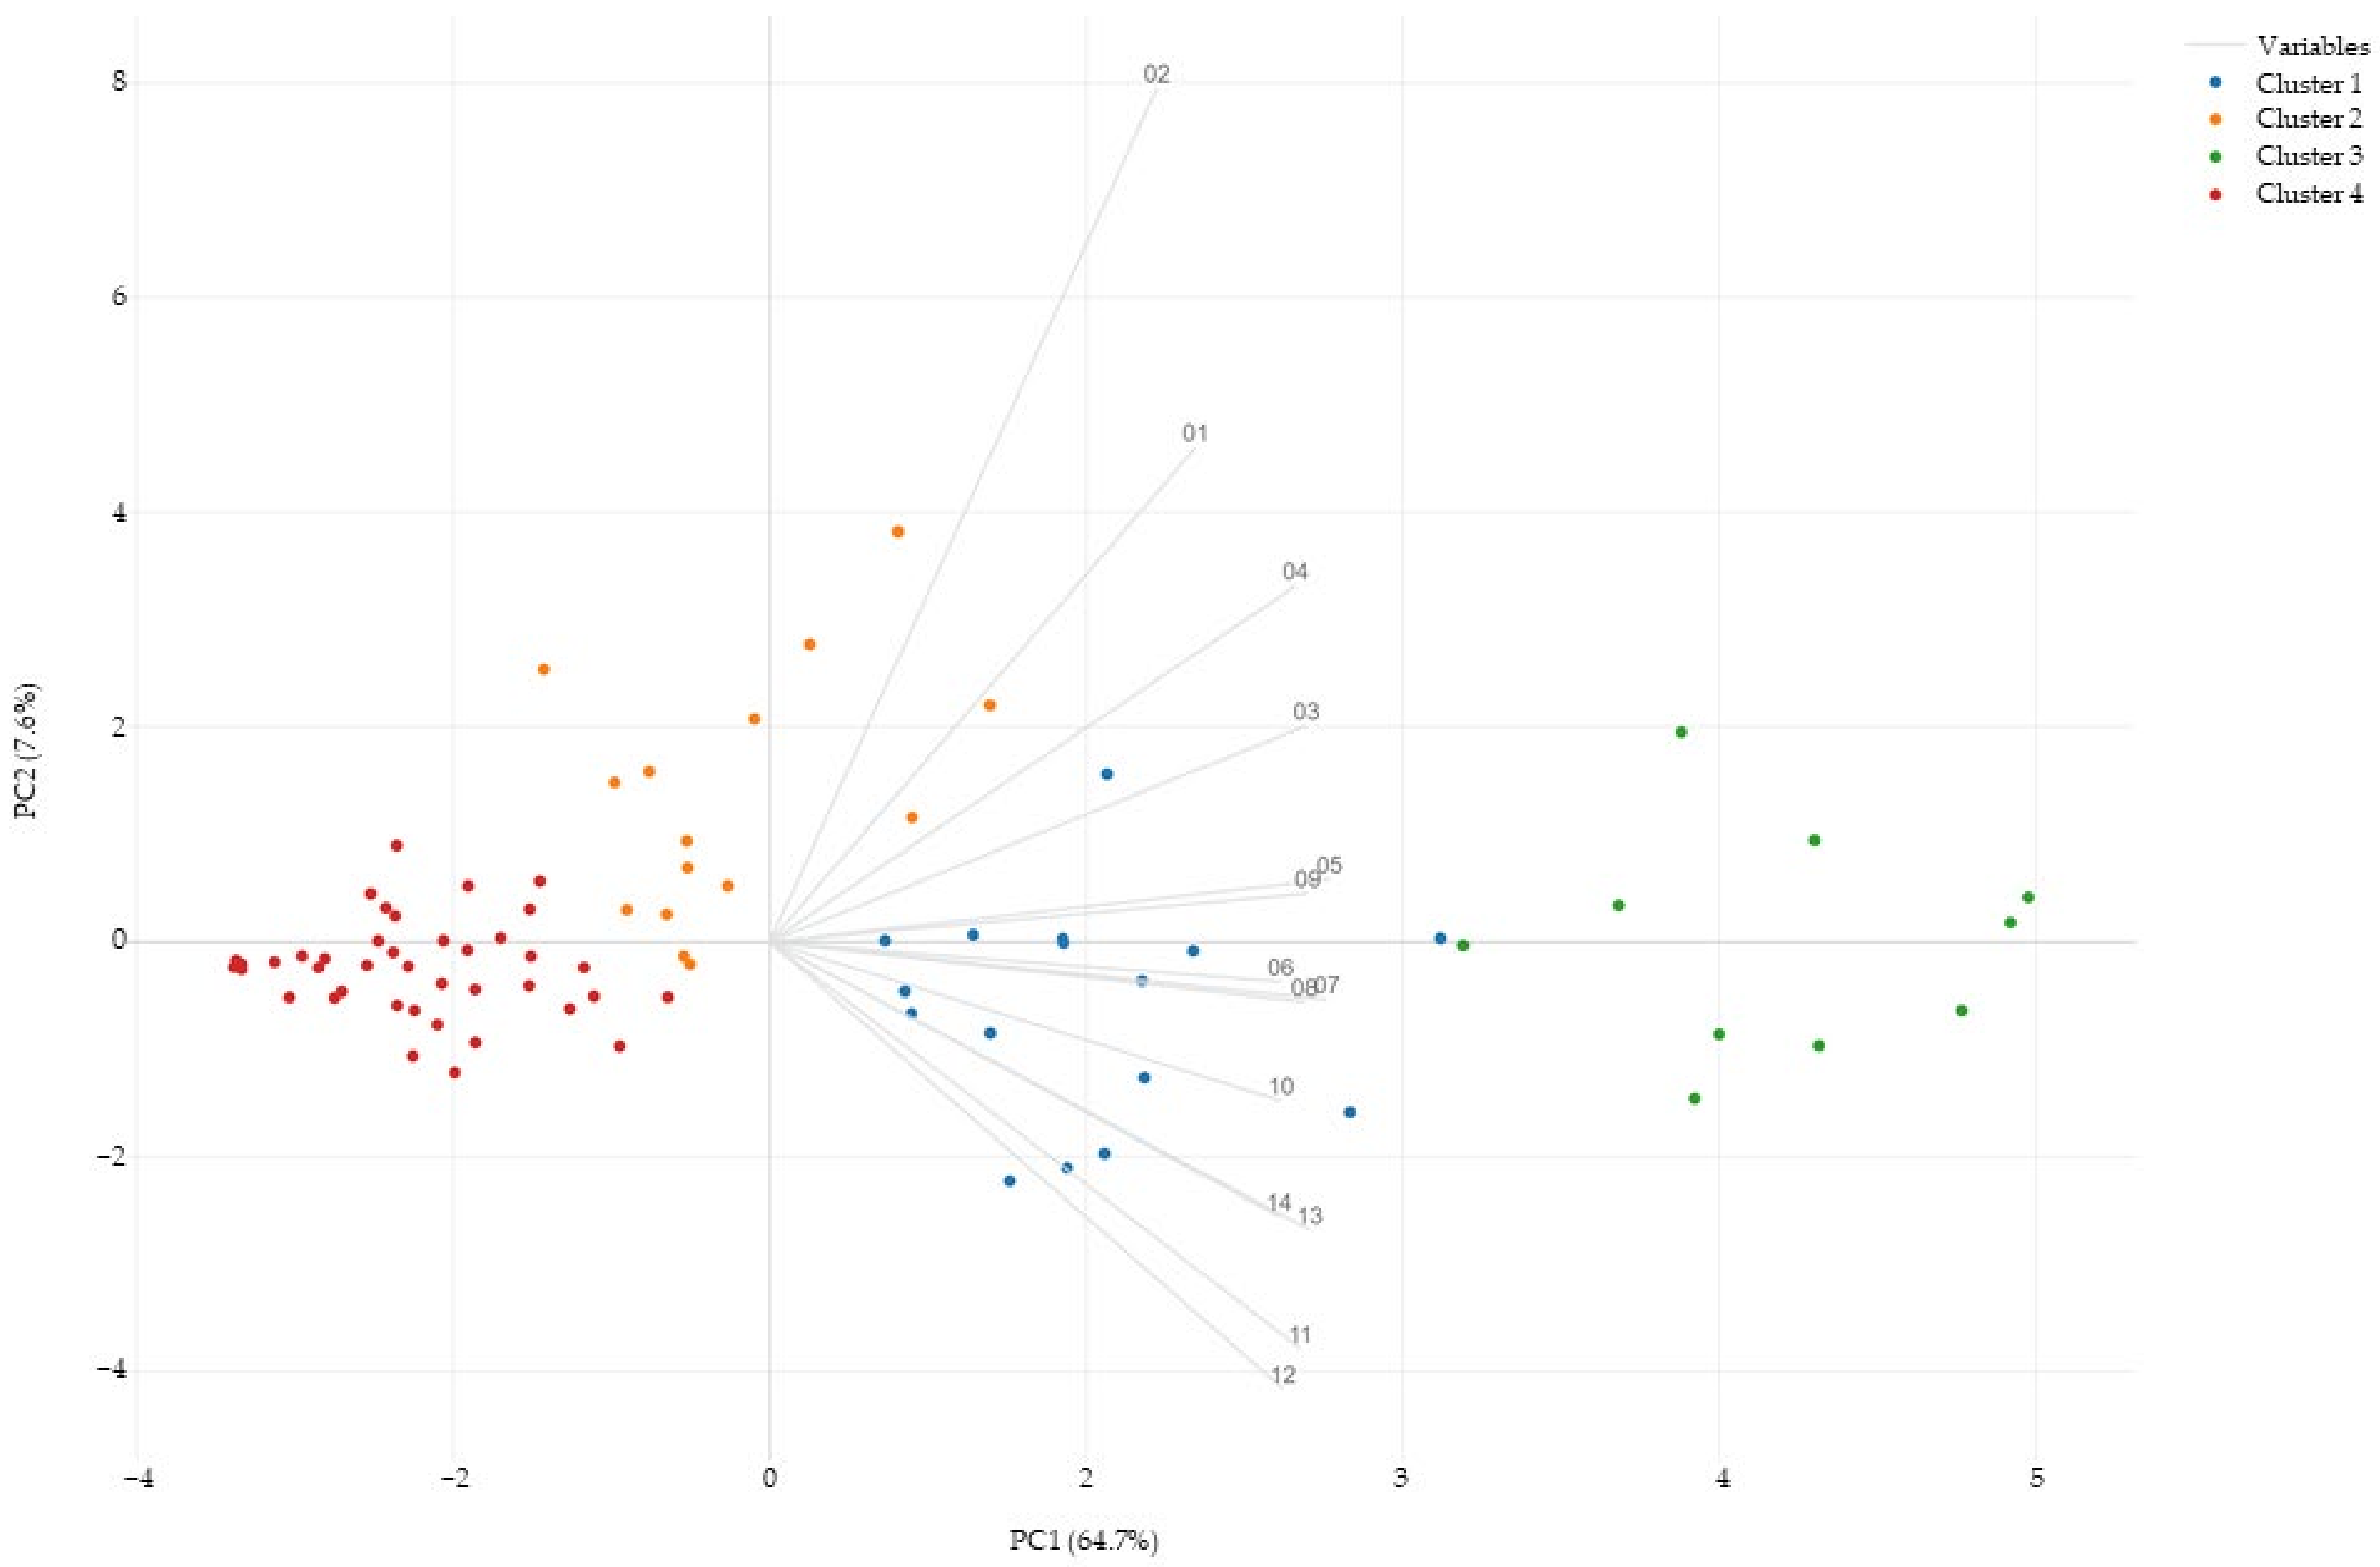
Based on the aforementioned principal components (PC1 and PC2), a non-hierarchical cluster analysis was conducted on the e-learning orientation. The K-means algorithm was employed, and the number of clusters was determined to be four using the Elbow method. The Hartigan–Wong algorithm was utilized with a maximum of 40 iterations and 20 trials. The results of the clustering are presented in Table 2, revealing that Cluster 1 consisted of 32 participants, Cluster 2 had 6 participants, Cluster 3 had 25 participants, and Cluster 4 comprised 19 participants. Figure 1 depicts the results of the analysis in a biplot. In Figure 1, the horizontal axis represents PC1 and the vertical axis represents PC2. In Figure 1, blue dots represent Cluster 1, orange dots represent Cluster 2, green dots represent Cluster 3, and red dots represent Cluster 4.
Table 2.
The results of the clustering in Analysis of e-Learning Orientation.
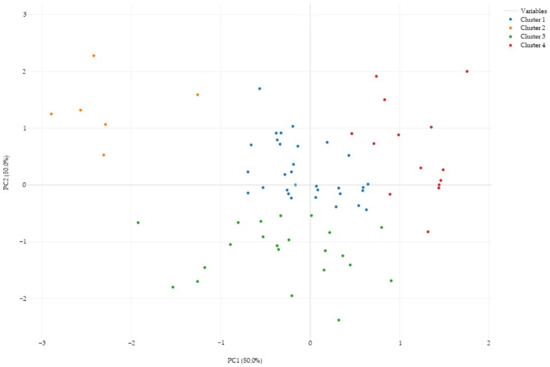
Figure 1.
The results of the cluster analysis in a biplot in Analysis of e-Learning Orientation.
For Cluster 1, the mean final exam score was 60.98 (SD 13.96), the mean number of lecture videos viewed was 184.13 (SD 61.36), the mean number of quiz attempts was 25.72 (SD 11.61), the mean number of Moodle interactions was 1506.84 (SD 418.88), and the mean remaining time until the deadline was 34.91 (SD 27.68). For Cluster 2, the mean final exam score was 61.99 (SD 14.78), the mean number of lecture videos viewed was 181.33 (SD 68.16), the mean number of quiz attempts was 33.17 (SD 20.52), the mean number of Moodle interactions was 1733.67 (SD 680.19), and the mean remaining time until the deadline was 29.71 (SD 29.52). For Cluster 3, the mean final exam score was 59.39 (SD 12.97), the mean number of lecture videos viewed was 165.52 (SD 79.23), the mean number of quiz attempts was 23.84 (SD 10.68), the mean number of Moodle interactions was 1355.20 (SD 451.99), and the mean remaining time until the deadline 34.93 (SD 25.58). For Cluster 4, the mean final exam score was 60.33 (SD 9.13), the mean number of lecture videos viewed was 168.68 (SD 66.10), the mean number of quiz attempts was 24.95 (SD 9.69), the mean number of Moodle interactions was 1403.68 (SD 307.53), and the mean remaining time until the deadline was 26.82 (SD 27.84).
To assess potential differences among clusters in terms of the final exam scores, the total number of lecture videos viewed, the total number of quiz attempts, the total number of Moodle interactions, and the average remaining time until the deadline, a one-way analysis of variance (ANOVA) was conducted. The results indicated that there were no significant differences observed for the final exam scores (F(3, 78) = 0.11, p = 0.96), the total number of lecture videos viewed (F(3, 78) = 0.41, p = 0.74), the total number of quiz attempts (F(3, 78) = 1.04, p = 0.38), the total number of Moodle interactions (F(3, 78) = 1.54, p = 0.21), and the average remaining time until the deadline (F(3, 78) = 0.45, p = 0.72).
For Cluster 1, PC1 and PC2 were the average group. Cluster 2 was the group with high PC1 and PC2. Cluster 2 was a group where PC1 was average and PC2 was low. Cluster 2 was a group with low PC1 and high PC2.
3.3. Analysis of Moodle Usage
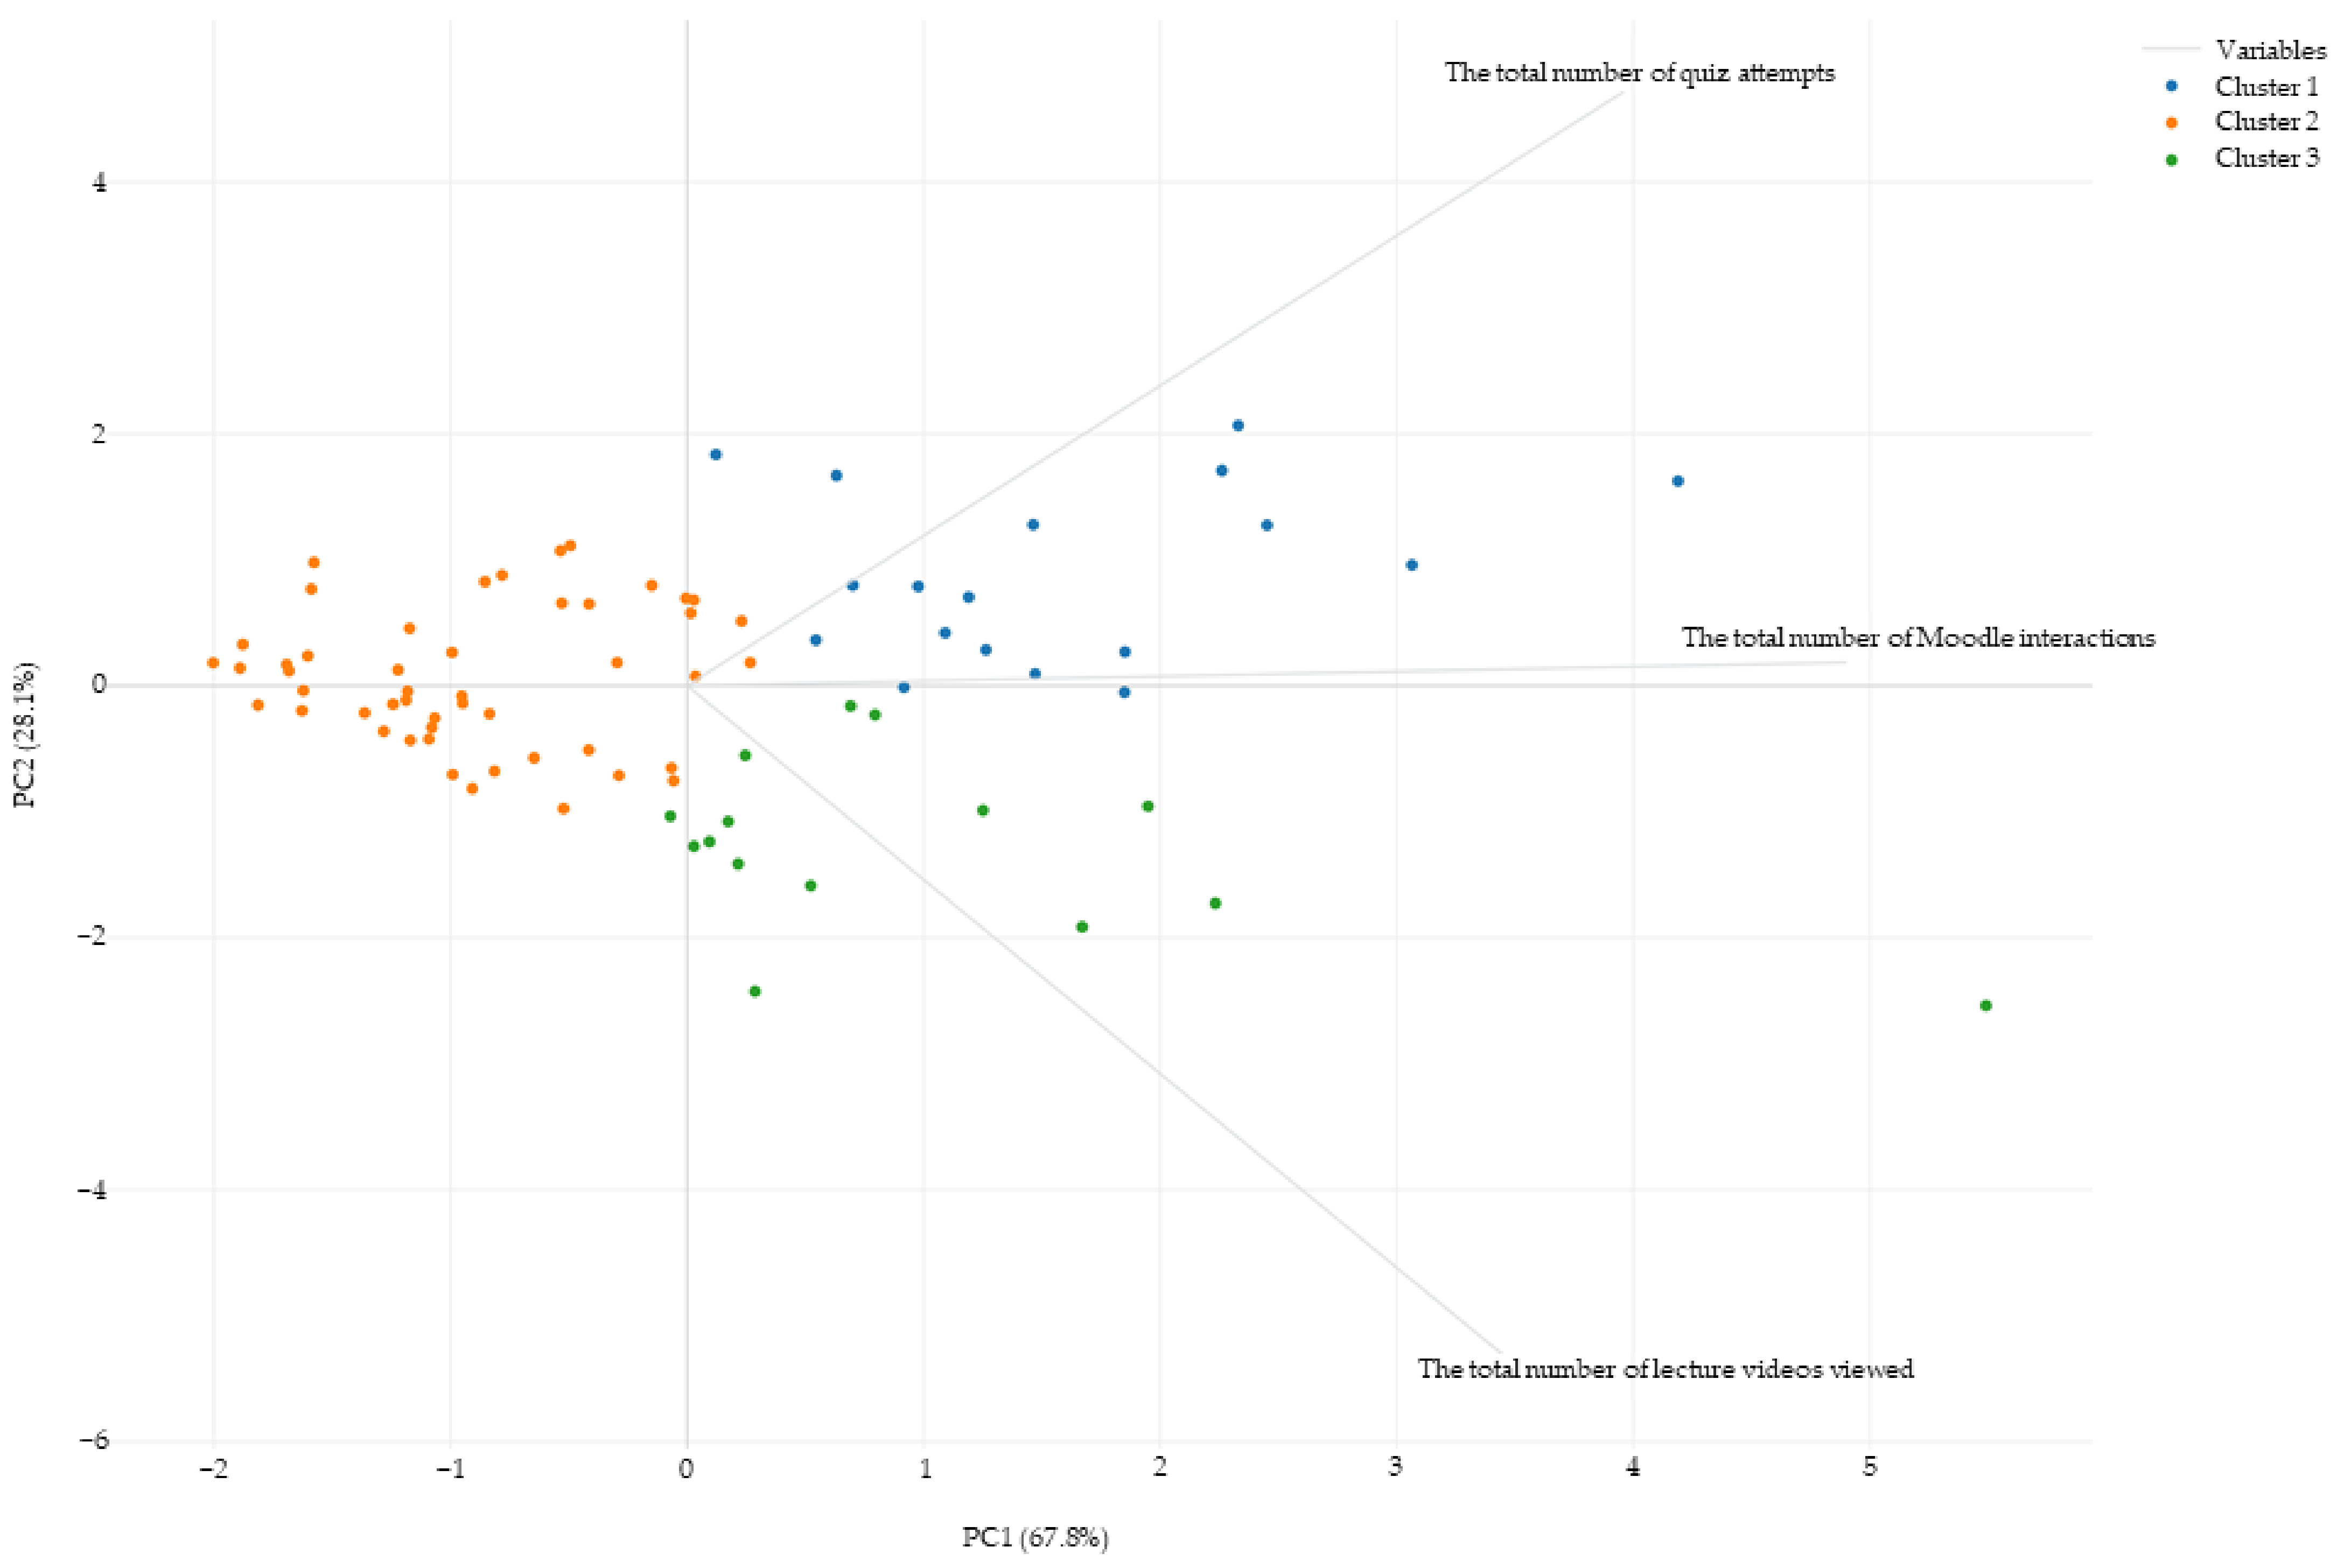
A cluster analysis was performed to analyze Moodle usage, specifically utilizing a non-hierarchical cluster analysis with the K-means algorithm. The Elbow method determined that three clusters were appropriate. The maximum number of iterations was set to 40, with 20 trials conducted using the Hartigan–Wong algorithm. The clustering results can be observed in Table 3, with Cluster 1 consisting of 18 participants, Cluster 2 comprising 49 participants, and Cluster 3 including 15 participants. Figure 2 depicts the results of the analysis in a biplot. In Figure 2, the horizontal axis represents PC1 and the vertical axis represents PC2. In Figure 2, blue dots represent Cluster 1, orange dots represent Cluster 2, and green dots represent Cluster 3.
Table 3.
The results of the clustering in Analysis of Moodle Usage.
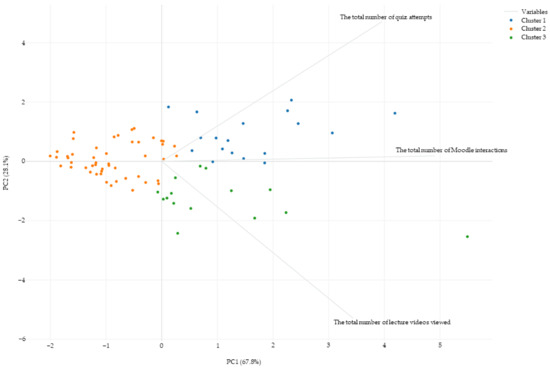
Figure 2.
The results of the cluster analysis in a biplot in Analysis of Moodle Usage.
Cluster analysis showed that there were 18 respondents in Cluster 1, 49 respondents in Cluster 2, and 15 respondents in Cluster 3. For Cluster 1, the mean final exam score was 72.39 (SD 11.59), the mean number of lecture videos viewed was 182.00 (SD 40.41), the mean number of quiz attempts was 42.56 (SD 9.11), the mean number of Moodle interactions was 1919.44 (SD 337.12), and the mean remaining time until the deadline was 47.17 (SD 33.67). For Cluster 2, the mean final exam score was 55.18 (SD 10.42), the mean number of lecture videos viewed was 140.14 (SD 31.79), the mean number of quiz attempts was 19.98 (SD 6.34), the mean number of Moodle interactions was 1204.22 (SD 217.03), and the mean remaining time until the deadline was 28.06 (SD 23.48). For Cluster 3, the mean final exam score was 63.18 (SD 9.23), the mean number of lecture videos viewed was 278.67 (SD 74.30), the mean number of quiz attempts was 23.13 (SD 8.39), the mean number of Moodle interactions was 1707.60 (SD 470.14), and the mean remaining time until the deadline was 30.29 (SD 24.06).
A one-way analysis of variance (ANOVA) was conducted to evaluate potential differences between clusters for the final exam scores, the final report scores, and the average remaining time until the deadline. The results indicated significant differences between clusters in the final exam scores (F(2, 79) = 57.01, p < 0.01) and the average remaining time until the deadline (F(2, 79) = 3.60, p < 0.05). Multiple comparisons of the main effects revealed differences in final exam scores between Cluster 1 and Cluster 2, Cluster 1 and Cluster 3, and Cluster 2 and Cluster 3 (p < 0.05). A significant difference was found between Cluster 1 and Cluster 2 for the average remaining time until the deadline (p < 0.05).
Cluster 1 was the group with the highest access to Moodle and the highest number of quiz attempts. Cluster 2 was the group that accessed Moodle and watched more videos. Cluster 3 was the group with the lowest number of access to Moodle, video views, and quiz attempts.
3.4. Analysis of Learning Planning
Utilizing the remaining time until the submission deadline for each session as a basis, a cluster analysis was conducted to investigate learning planning. A non-hierarchical cluster analysis was employed using the K-means algorithm. The Elbow method determined that four clusters were optimal for the analysis. The maximum number of iterations was set to 40, with 20 trials performed using the Hartigan–Wong algorithm. The outcomes of the clustering analysis are presented in Table 4, while a biplot illustrating the results can be found in Figure 3. In Figure 3, the horizontal axis represents PC1, and the vertical axis represents PC2. In Figure 3, blue dots represent Cluster 1, orange dots represent Cluster 2, green dots represent Cluster 3, and red dots represent Cluster 4.
Table 4.
The results of the clustering in Analysis of Learning Planning.
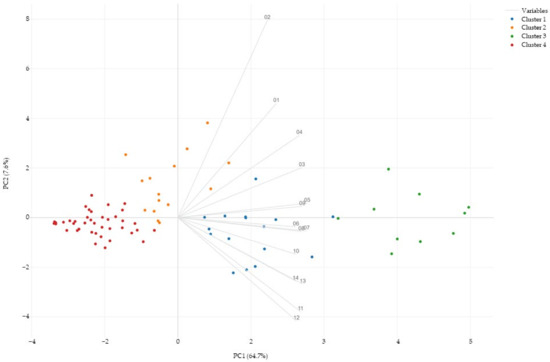
Figure 3.
The results of the cluster analysis in a biplot in Analysis of Learning Planning.
The cluster analysis yielded 10 participants for Cluster 1, 15 for Cluster 2, 16 for Cluster 3, and 41 for Cluster 4. For Cluster 1, the mean final exam score was 71.74 (SD 11.28), the mean number of lecture videos viewed was 185.80 (SD 22.60), the mean number of quiz attempts was 34.70 (SD 13.52), the mean number of Moodle interactions was 1869.10 (SD 403.65), and the mean remaining time until the deadline was 88.61 (SD 9.01). For Cluster 2, the mean final exam score was 61.77 (SD 11.16), the mean number of lecture videos viewed was 160.00 (SD 68.43), the mean number of quiz attempts was 25.33 (SD 12.78), the mean number of Moodle interactions was 1345.47 (SD 423.13), and the mean remaining time until the deadline was 31.77 (SD 8.56). For Cluster 3, the mean final exam score was 65.91 (SD 12.46), the mean number of lecture videos viewed was 195.56 (SD 96.66), the mean number of quiz attempts was 27.00 (SD 12.57), the mean number of Moodle interactions was 1557.94 (SD 608.21), and the mean remaining time until the deadline was 51.03 (SD 9.25). For Cluster 4, the mean final exam score was 55.03 (SD 10.64), the mean number of lecture videos viewed was 169.17 (SD 61.68), the mean number of quiz attempts was 22.76 (SD 9.55), the mean number of Moodle interactions was 1350.51 (SD 281.75), and the mean remaining time until the deadline was 12.18 (SD 6.70).
To explore potential differences among the clusters in terms of the final exam scores, the total number of lecture videos viewed, the total number of quiz attempts, and the total number of Moodle interactions, a one-way analysis of variance (ANOVA) was conducted. The results indicated significant differences between clusters in the final exam scores (F(3, 78) = 7.96, p < 0.01), the total number of quiz attempts (F(3, 78) = 3.11, p < 0.05), and the total number of Moodle interactions (F(3, 78) = 5.14, p < 0.01). Multiple comparisons of the main effects revealed differences in the final exam scores between Cluster 1 and Cluster 4, Cluster 1 and Cluster 2, Cluster 3 and Cluster 4, as well as Cluster 2 and Cluster 4 (p < 0.05). Regarding the total number of quiz attempts, significant differences were observed between Cluster 1 and Cluster 4, as well as Cluster 1 and Cluster 2 (p < 0.05). For the total number of Moodle interactions, significant differences were found between Cluster 1 and Cluster 2, as well as Cluster 1 and Cluster 4 (p < 0.05). No significant difference was detected between clusters in terms of the total number of lecture videos viewed (F(3, 78) = 0.91, p = 0.44).
Cluster 1 was the group that submitted the immediately after the end of the lecture time on the timetable in all 14 sessions. Cluster 2 was the group that submitted the documents one or two days before the deadline for the first through the third sessions and close to the deadline for the fourth and subsequent sessions. Cluster 3 was the group that submitted a few days before the deadline on all 14 occasions. Cluster 4 was the group that submitted close to the deadline on all 14 occasions.
3.5. Analysis of the Relationship between E-Learning Orientation, Moodle Usage, and Learning Planning
To examine the relationships among the variables, a Pearson correlation analysis was conducted. Specifically, we examined correlations between the total number of lecture videos viewed, the total number of quiz attempts, the total number of Moodle interactions, the average remaining time until the deadline, the e-learning orientation preference, the e-learning orientation dedication, the e-learning orientation flexibility, the e-learning orientation monotony, and the e-learning orientation solitude. The results showed that there was a significant correlation between the total number of Moodle interactions and the total number of lecture videos viewed (r = 0.62, p < 0.01), the total number of Moodle interactions and the total number of quiz attempts (r = 0.72, p < 0.01), the total number of Moodle interactions and the average remaining time until the deadline (r = 0.38, p < 0.01), the total number of quiz attempts and the average remaining time until the deadline (r = 0.32, p < 0.01), There were significant correlations between the e-learning orientation dedication and the e-learning orientation preference (r = 0.64, p < 0.01), the e-learning orientation dedication and the e-learning orientation flexibility (r = 0.52, p < 0.01), and the e-learning orientation preference and the e-learning orientation flexibility (r = 0.50, p < 0.01). However, there was no significant correlation between the total number of Moodle interactions and the e-learning orientation dedication (r = −0.07, p = 0.52), the total number of Moodle interactions and the e-learning orientation preference (r = −0.10, p = 0.36), the total number of Moodle interactions and the e-learning orientation flexibility (r = −0.12, p = 0.30), the total number of Moodle interactions and the e-learning orientation monotony (r = 0.11, p = 0.33), the total number of Moodle interactions and the e-learning orientation solitude (r = −0.03, p = 0.76), the total number of quiz attempts and the e-learning orientation dedication (r = −0.07, p = 0.51), the total number of quiz attempts and the e-learning orientation preference (r = −0.17, p = 0.12), the total number of quiz attempts and the e-learning orientation flexibility (r = −0.17, p = 0.14), the total number of quiz attempts and the e-learning orientation monotony (r = 0.07, p = 0.54), the total number of quiz attempts and the e-learning orientation solitude (r = −0.07, p = 0.52), the average remaining time until the deadline and the e-learning orientation dedication (r = 0.02, p = 0.89), the average remaining time until the deadline and the e-learning orientation preference (r = −0.13, p = 0.24), the average remaining time until the deadline and the e-learning orientation flexibility (r = 0.06, p = 0.59), the average remaining time until the deadline and the e-learning orientation monotony (r = −0.04, p = 0.73), the average remaining time until the deadline and the e-learning orientation solitude (r = −0. 17, p = 0.14), the e-learning orientation dedication and the e-learning orientation monotony (r = 0.13, p = 0.26), the e-learning orientation dedication and the e-learning orientation solitude (r = 0.09, p = 0.43), the e-learning orientation preference and the e-learning orientation monotony (r = 0.21, p = 0.06), the e-learning orientation preference and the e-learning orientation solitude (r = 0.11, p = 0.34), the e-learning orientation flexibility and the e-learning orientation monotony (r = −0.05, p = 0.66), the e-learning orientation flexibility and the e-learning orientation solitude (r = 0.03, p = 0.79), and the e-learning orientation monotony and the e-learning orientation solitude (r= 0.10, p = 0.35).
Next, multiple regression analysis was conducted to examine the magnitude of the variables’ contributions. First, we standardized the values of final exam scores, the total number of Moodle interactions, the total number of lecture videos viewed, the total number of quiz attempts, the average remaining time until the deadline, e-learning orientation preference, e-learning orientation dedication, e-learning orientation flexibility, e-learning orientation monotony, and e-learning orientation solitude. The objective variable was the final exam score. Predictor variables were the total number of Moodle interactions, the total number of lecture videos viewed, the total number of quiz attempts, the average remaining time until the deadline, the e-learning orientation preference, the e-learning orientation dedication, the e-learning orientation flexibility, the e-learning orientation monotony, and the e-learning orientation solitude. Multiple regression analysis was performed with predictor and objective variables. Multicollinearity was checked to ensure that none of the VIFs exceeded 10. The results of the multiple regression analysis are shown in Table 5. The R2 was 0.57, which means that the overall regression equation is accurate, and this R2 value implies that the accuracy is generally high. Next, we checked whether the estimated coefficients were statistically meaningful. The total number of lecture videos viewed, the total number of quiz attempts, and the average remaining time until the deadline had p-values less than 0.05, indicating that the explanatory variables were related to the objective variable. The p-values were less than 0.05, indicating that the explanatory variables had a relationship with the objective variable. Next, we checked the absolute value of t-ratio to determine the degree of influence of the explanatory variables. The absolute value of t-ratio showed that the total number of quiz attempts was 3.65, the average remaining time until the deadline was 3.24, the total number of lecture videos viewed was 2.09, the e-learning orientation dedication was 0.79, the e-learning orientation flexibility was 0.78, the e-learning orientation solitude was 0.68, the e-learning orientation preference was 0.54, the e-learning orientation monotony was 0.25, and total number of Moodle interactions was 0.15. The order in which the total number of quiz attempts, the total number of quiz attempts, and the total number of Moodle interactions affect the final exam score is shown in Table 5. In particular, the total number of quiz attempts, the average remaining time until the deadline, and the total number of lecture videos viewed were found to be highly influential.
Table 5.
The results of the multiple regression analysis.
To evaluate the clustering results, precision, recall, and F-measure were computed for pairs of participant data (e-learning orientation and Moodle usage, e-learning orientation and learning planning, and Moodle usage and learning planning). E-learning orientation and Moodle usage had an F-measure of 0.38; e-learning orientation and learning planning had an F-measure of 0.26; Moodle usage and learning planning had an F-measure of 0.28; e-learning orientation and learning planning had an F-measure of 0.27. Because these values are small, the clusters are not similar to each other.
4. Discussion
The results of correlation analysis, principal component analysis, cluster analysis, and multiple regression analysis showed that e-learning orientation has no significant effect on learning outcomes. Correlation analysis, cluster analysis, and multiple regression analysis established that Moodle usage and learning planning have a significant impact on learning outcomes. In other words, higher engagement with Moodle and planned learning, as evidenced by the use of learning features such as videos and quizzes and the remaining time until the deadline, corresponded to higher learning outcomes. We checked whether the clusters of e-learning orientation and Moodle usage and learning plans matched each other, but they did not.
Results of correlation analysis, principal component analysis, cluster analysis, and multiple regression analysis showed no clear relationship between e-learning orientation and learning outcomes. Additionally, there was no clear relationship between e-learning orientation and Moodle usage or between e-learning orientation and learning planning. Although specific statistics and p-values are shown in the results, these analyses did not reveal a clear relationship. This result was not consistent with the initial prediction. The results are also consistent with the results of the post-lecture questionnaire. In this study, 47.6% of the respondents preferred on-demand lectures to face-to-face lectures. There was no difference in learning outcomes between students who preferred face-to-face lectures and those who preferred on-demand lectures. The result was not consistent with the prediction. Given that the questionnaires were administered in 2022, it can be assumed that the participants were relatively acquainted with online lectures. Additionally, the previous studies were likely conducted with individuals unfamiliar with computer-based activities. The fact that the study participants belonged to the Department of Information Science and Engineering within the Faculty of Engineering suggests their familiarity with ICT technology, indicating their ability to adapt to e-learning, regardless of personal preferences. This result suggests that not only e-learning orientation but also learner background and characteristics should be considered. This can be considered from studies that have examined continuous use intentions and learner characteristics in e-learning [33,34]. By exploring the broader factors of Moodle usage and learning planning, this study expands upon the existing knowledge and reveals their significance in shaping learning outcomes. This broader perspective contributes to a more nuanced understanding of the variables influencing e-learning effectiveness.
The results of our study indicate that while e-learning orientation may not directly impact learning outcomes, Moodle usage and learning planning play crucial roles in determining educational success. These results were consistent with the prediction. Cluster analysis on Moodle usage and learning outcomes showed that, as predicted, the group with the highest number of accesses performed better. Furthermore, the results showed that taking the quiz had a more direct impact on learning outcomes than watching the video, possibly because the quiz served as a confirmation of knowledge from session to session. A detailed analysis of student behavior on Moodle showed that the number of clicks and the degree of utilization of learning features were directly related to learning outcomes. Specifically, the frequency of access to Moodle and the enthusiasm for activities within it were strong predictors of improved learning outcomes. A closer look at the results of the post-lecture questionnaire reveals that 67.1% of the respondents liked being able to watch the videos over and over again, 32.9% liked being able to review them over and over, and 19.5% liked being able to do so during gaps in time. These numbers indicate that the flexibility of on-demand learning resources is a big draw for students. It is noteworthy that there were students who watched videos and took quizzes only once. Further research is needed to determine what factors influence the learning styles and backgrounds of these students. Many students actively accessed the videos and quizzes repeatedly. In particular, it was confirmed that some students tried to maximize their use of Moodle and enhance their learning by repeatedly watching the videos and taking the quizzes many times. A cluster analysis was conducted to delve deeper into the relationship between study plans and learning outcomes. The results confirmed that the group of students who submitted assignments close to the deadline had significantly lower grades than the other groups. This suggests that students who use their time to study and submit assignments at the last minute may not have sufficient time to review or may have a poor understanding of what they have learned. Students who submitted assignments during the timetabled lecture time or completed them in their own time well before the deadline were significantly higher in performance than the other groups who submitted them close to the deadline or during lecture time. This strongly suggests that a thorough understanding of the content of the study and a systematic approach to learning are factors that improve learning effectiveness. Furthermore, a comparison was made with the results of the post-lecture questionnaire. As a result, 51.2% of students felt that “I can manage my own schedule” was one of the major advantages of on-demand lectures, and 72.0% of students answered, “I can study at my own pace”. This confirms that the freedom and flexibility of on-demand lectures are beneficial to students. However, it was also confirmed that a certain percentage of students (24.4%) responded that they forgot the due date and time of assignments. This suggests that the flexibility of on-demand lectures may be a barrier for some students to plan and ensure adequate study time. Using multiple regression analysis to examine variables that predict final exam scores, we found that the total number of lecture videos viewed, the total number of quizzes attempted, and the average time remaining before the deadline had a high impact on learning outcomes. Furthermore, it is conceivable that not only these variables but also their interactions may influence learning outcomes, confirming that looking at a single variable alone does not provide a complete picture. The results of the multiple regression analysis were consistent with the considerations in the cluster analysis, revealing a combination of multiple factors to maximize learning outcomes. These results underscore the need to foster a supportive learning environment that promotes positive engagement with online learning platforms and encourages effective learning planning strategies. Interestingly, however, the clusters of Moodle usage and learning planning did not perfectly match. A closer look reveals that some students experienced a spike in access to Moodle just before exams. This indicates that some students tend to study just before deadlines, and further research on the study behaviors and motivations of these students is needed. While a previous study [29] reported that Moodle usage, as addressed in this study, was not important when dealing with multiple factors, the number of times students accessed Moodle, watched video commissions, and took quizzes were also important factors in this study Moodle access, video committee viewings, and quiz attempts were also important factors in this study.
To elevate the caliber of education and its ramifications, it is deemed pivotal for educators to allocate ample time for the formulation of meticulous pedagogical plans, such as class management, lecture content planning, and lecture planning, which will improve grading items and student satisfaction [35]. Adaptive teaching, in which instruction is tailored to the student, has also received attention in recent years. Educators adaptively plan student-centered and educator-centered phases, considering learning goals and student needs and interests [36]. Vygotsky postulated an idiosyncratic theory of cognitive development and learning mechanisms. He contended that students are bestowed the potentiality to foster autonomy through the mechanism of ‘zones of proximal development’ or ‘scaffolding,’ thereby acquiring knowledge via collaborative interplay with educators and peers [37]. Expounding upon this viewpoint, he emphasized the necessity for learners to cultivate their intellectual prowess and knowledge through social discourse with others [38]. Vygotsky’s theoretical framework has extensively shaped contemporary educational methodologies, particularly the notion of ‘learner-centric educational environments’ [39], which is operationalized in a pragmatic learning technique: computer-supported intentional learning environments (CSILEs) [40]. CSILEs fashion a networked, interconnected learning milieu, furnishing a platform for learners to engage proactively with educators and fellow learners to facilitate independent learning. In this study, we provided on-demand lectures as part of such an educational environment and observed their effectiveness. It became clear that learners were not necessarily learning alone. Specifically, in a post-examination survey, 28.0% of students highlighted the benefits of collaborative learning. Additionally, students communicated queries to their educators through survey forms and electronic correspondence during the lecture period. This evidence implies that learners engaged in active dialogue with peers and educators during the on-demand lectures, thereby facilitating autonomous learning.
This study contributes novel insights by examining the combined influence of e-learning orientation, Moodle usage and learning planning on learning outcomes. Reference is made to the retention rate of student learning in the data treated in this study. The regression equation for the number of clicks from week 1 to week 8 for all the data handled in this study had a slope of 3.61 and an intercept of 165.40. This suggests that the subjects in this study, as a whole, continued to attend the lecture from week 1 to week 8 without dropping out in the middle of the course. The purpose of this lecture is to acquire knowledge. This lecture was followed by an exercise course that required more applied skills. There was a high correlation between the grades of this lecture and the grades of the later exercise course. This suggests that the knowledge and experience of this lecture were utilized and that the knowledge was retained. In previous studies, it has been analyzed as a single factor. In this study, multiple factors were analyzed. The findings highlight the importance of considering multiple factors in the realm of online learning and their collective impact on educational outcomes. By encompassing these variables, this study provides a more comprehensive understanding of the factors influencing learning outcomes in the context of on-demand lectures.
This study has certain limitations that should be acknowledged. Firstly, the focus was limited to on-demand lectures, and thus, the findings may not fully capture the intricacies of other forms of e-learning. Additionally, the study sample consisted of participants from a specific academic department, which might limit the generalizability of the results. Future studies should consider a broader range of e-learning formats and diverse participant populations to further validate and expand upon these findings.
In conclusion, our study demonstrates that while e-learning orientation alone may not have a direct impact on learning outcomes, Moodle usage, and learning planning significantly influence educational success in the context of on-demand lectures. These findings hold important implications for educators and educational institutions. Educators should promote active engagement with online learning platforms like Moodle, provide necessary training and support, and emphasize the importance of effective learning planning strategies. By incorporating these factors, educational institutions can enhance the quality of e-learning experiences and optimize learning outcomes for students.
5. Conclusions
In this study, we examined how e-learning orientation, Moodle usage, and learning plans affect learning outcomes in on-demand lectures. The data from Moodle log data and questionnaires were analyzed via correlation analysis, principal component analysis, cluster analysis, and multiple regression analysis. The results showed that Moodle usage and learning plans had a significant impact on learning outcomes. The results of the multiple regression analysis revealed that access to learning features such as videos and quizzes, the importance of time management in terms of average time remaining before deadlines, and individual student characteristics emerged as strong contributors to learning outcomes. This indicates that for students attending on-demand lectures, the key to improved learning outcomes is not simply viewing the content but active engagement, planning, and an approach to learning that includes appropriate time management and understanding of their own characteristics. This is also an important suggestion for educators to focus on these factors in the design of online educational content and learning environments.
The results of this study have identified several important implications. First, it became clear that active Moodle usage is closely related to learning outcomes. In particular, the intensity of activity and frequency of Moodle usage emerged as a powerful predictor of learning outcomes. This indicates that effective use of educational tools improves the quality of learning and underscores the importance for educators and learning platform developers to provide features and support that encourage active learner use. Second, the importance of learning planning was emphasized. Learning planning and appropriate responses to deadlines emerged as essential elements for improved learning outcomes. This suggests the need to develop learners’ own autonomous learning skills and to support them in planning their learning. In addition, we gained insight into the flexibility of on-demand lectures and their dual nature. It became clear that while flexibility is attractive to students, it can also be a barrier to learning for some students. This calls for a review of how on-demand lectures are delivered and supported. We also gained a new appreciation for the value of social interaction among learners. Learners do not learn in isolation but rather through interaction and cooperation with others, which enhances learning effectiveness. This demonstrates the importance of providing opportunities for communication and cooperative learning among learners, even in an online education environment. Finally, the need for a reassessment of e-learning orientation emerges. It became clear that learning outcomes are heavily influenced not only by learner attitudes and preferences but also by actual learning behaviors and approaches.
With the increase in e-learning in education and the need to effectively deploy on-demand lectures, the results of this study are of great value. Educators and curriculum designers can use the findings as a valuable reference when considering new policies and strategies to maximize student learning outcomes.
Funding
This research received no external funding.
Institutional Review Board Statement
The study was conducted in accordance with the Declaration of Helsinki and approved by the Yamaguchi University Review Committee (2022-003-01). Approval date is 16 May 2022.
Informed Consent Statement
Informed consent was obtained from all subjects involved in the study.
Data Availability Statement
Not applicable.
Conflicts of Interest
The author declares no conflict of interest.
References
- Maatuk, A.M.; Elberkawi, E.K.; Aljawarneh, S.; Rashaideh, H.; Alharbi, H. The COVID-19 pandemic and E-learning: Challenges and opportunities from the perspective of students and instructors. J. Comput. High. Educ. 2022, 34, 21–38. [Google Scholar] [CrossRef]
- Silva, S.; Fernandes, J.; Peres, P.; Lima, V.; Silva, C. Teachers’ Perceptions of Remote Learning during the Pandemic: A Case Study. Educ. Sci. 2022, 12, 698. [Google Scholar] [CrossRef]
- Aristovnik, A.; Karampelas, K.; Umek, L.; Ravšelj, D. Impact of the COVID-19 pandemic on online learning in higher education: A bibliometric analysis. Front. Educ. 2023, 8, 225834. [Google Scholar] [CrossRef]
- Aboagye, E.; Yawson, J.A.; Appiah, K.N. COVID-19 and E-learning: The Challenges of Students in Tertiary Institutions. Soc. Educ. Res. 2020, 2, 1–8. [Google Scholar] [CrossRef]
- Aljawarneh, S.A. Reviewing and exploring innovative ubiquitous learning tools in higher education. J. Comput. High. Educ. 2020, 32, 57–73. [Google Scholar] [CrossRef]
- Lara, J.A.; Aljawarneh, S.; Pamplona, S. Special issue on the current trends in E-learning Assessment. J. Comput. High. Educ. 2020, 32, 1–8. [Google Scholar] [CrossRef]
- Ministry of Education, Culture, Sports, Science and Technology (MEXT). Survey on Student Life of Students and Others Affected by the System Related to Online Classes and New Coronavirus Infections. Available online: https://www.mext.go.jp/kaigisiryo/content/000125290.pdf (accessed on 20 May 2023).
- Zitha, I.; Mokganya, M.G.; Manyage, T. Integration of Blended Learning in the Advent of COVID-19: Online Learning Experiences of the Science Foundation Students. Educ. Sci. 2023, 13, 704. [Google Scholar] [CrossRef]
- De Santos-Berbel, C.; Hernando García, J.I.; De Santos Berbel, L. Undergraduate student performance in a structural analysis course: Continuous assessment before and after the COVID-19 outbreak. Educ. Sci. 2022, 12, 561. [Google Scholar] [CrossRef]
- Manochehr, N.N. The influence of learning styles on learners in e-learning environments: An empirical study. Comput. High. Educ. Econ. Rev. 2006, 18, 10–14. [Google Scholar]
- Sugiura, M.; Kogo, C. Effectiveness of the Training Which is Combined e-Learning and Realistic Simulation toward Sudden Changes of Patients. Res. Rep. JSET Conf. 2013, 13, 81–88. [Google Scholar]
- Watanabe, F.; Kogo, C. Causal Relationship among Questionnaire Variables Investigating Learners’ e-Learning Orientation in Massive Online Courses. Jpn. J. Educ. Technol. 2017, 41, 77–87. [Google Scholar] [CrossRef]
- Watanabe, F.; Kogo, C. The Effects of Learners’ e-Learning and Peer Assessment Characteristics on Motivation for Continuous Learning and Course Evaluation in Japan Massive Open Online Courses. Jpn. J. Educ. Technol. 2017, 41, 41–51. [Google Scholar] [CrossRef]
- Broadbent, J.; Poon, W.L. Self-Regulated Learning Strategies & Academic Achievement in Online Higher Education Learning Environments: A Systematic Review. Internet High. Educ. 2015, 27, 1–13. [Google Scholar] [CrossRef]
- Zhang, Y.; Ghandour, A.; Shestak, V. Using Learning Analytics to Predict Students Performance in Moodle LMS. Int. J. Emerg. Technol. Learn. 2020, 15, 102–115. [Google Scholar] [CrossRef]
- Misiejuk, K.; Ness, I.J.; Gray, R.; Wasson, B. Changes in online course designs: Before, during, and after the pandemic. Front. Educ. 2023, 7, 996006. [Google Scholar] [CrossRef]
- Zimmerman, B.J.; Schunk, D.H. (Eds.) Self-regulated learning and performance: An introduction and an overview. In Handbook of Self-Regulation of Learning and Performance, 1st ed.; Routledge: New York, NY, USA, 2011; pp. 1–12. [Google Scholar]
- Zimmerman, B.J. Attaining self-regulation: A social cognitive perspective. In Handbook of Self-Regulation, 1st ed.; Boekaerts, M., Pintrich, P.R., Zeidner, M., Eds.; Academic Press: San Diego, CA, USA, 2000; pp. 13–39. [Google Scholar]
- Pintrich, P.R.; Smith, D.A.; Garcia, T.; McKeachie, W.J. Reliability and predictive validity of the Motivated Strategies for Learning Questionnaire (MSLQ). Educ. Psychol. Meas. 1993, 53, 801–813. [Google Scholar] [CrossRef]
- Cobb, R., Jr. The Relationship between Self-Regulated Learning Behaviors and Academic Performance in Web-Based Courses. Ph.D. Thesis, Virginia Polytechnic Institute and State University, Blacksburg, VA, USA, 19 March 2003. [Google Scholar]
- Alserhan, S.; Alqahtani, T.M.; Yahaya, N.; Al-Rahmi, W.M.; Abuhassna, H. Personal learning environments: Modeling students’ self-regulation enhancement through a learning management system platform. IEEE Access 2023, 11, 5464–5482. [Google Scholar] [CrossRef]
- Seli, H.; Dembo, M.H. Motivation and Learning Strategies for College Success: A Focus on Self-Regulated Learning, 6th ed.; Routledge: New York, NY, USA, 2020. [Google Scholar]
- Steif, P.; Sdollár, A. Study of usage patterns and learning gains in a web-based interactive static course. J. Eng. Educ. 2009, 98, 321–333. [Google Scholar] [CrossRef]
- Ocak, G.; Boyraz, S. Examination of the Relation between Academic Procrastination and Time Management Skills of Undergraduate Students in Terms of Some Variables. J. Educ. Train. Stud. 2016, 4, 76–84. [Google Scholar] [CrossRef]
- Deemer, E.D.; Yough, M.; Morel, S.A. Performance-approach goals, science task preference, and academic procrastination: Exploring the moderating role of competence perceptions. Motiv. Emot. 2018, 42, 200–213. [Google Scholar] [CrossRef]
- Tan, T.K.; Samavedham, L. The learning process matter: A sequence analysis perspective of examining procrastination using learning management system. Comput. Educ. Open 2022, 3, 100112. [Google Scholar] [CrossRef]
- You, J.W. Examining the effect of academic procrastination on achievement using LMS data in e-learning. J. Educ. Technol. Soc. 2015, 18, 64–74. [Google Scholar]
- You, J.W. Identifying significant indicators using LMS data to predict course achievement in online learning. Internet High. Educ. 2016, 29, 23–30. [Google Scholar] [CrossRef]
- Ting, T.T.; Teh, S.L.; Wee, M.C. Ascertaining the Online Learning Behaviors and Formative Assessments Affecting Students’ Academic Performance during the COVID-19 Pandemic: A Case Study of a Computer Science Course. Educ. Sci. 2022, 12, 935. [Google Scholar] [CrossRef]
- Cabinet Office, Government of Japan. The Creation of an “Applied Basic Level of Accreditation System for Mathematics, Data Science and AI Smart Higher Education Program (MDASH-Advanced Literacy)”. Available online: https://www8.cao.go.jp/cstp/ai/suuri/ouyoukiso.pdf (accessed on 20 May 2023).
- Aida, S. Data Science Technology, 3rd ed.; Gakujutsu Tosho Shuppan-Sha Co., Ltd.: Tokyo, Japan, 2023; pp. 1–209. [Google Scholar]
- Banerjee, A.; Krumpelman, C.; Ghosh, J.; Basu, S.; Mooney, R.J. Model-based overlapping clustering. In Proceedings of the Eleventh ACM SIGKDD International Conference on Knowledge Discovery in Data Mining, Chicago, IL, USA, 21–24 August 2005; pp. 532–537. [Google Scholar] [CrossRef]
- Al Abdullatif, H.A.; Velazquez-Iturbide, J.A. Who will continue using MOOCs in the future? Personality traits perspective. IEEE Access 2020, 8, 52841–52851. [Google Scholar] [CrossRef]
- Chen, G.; Davis, D.; Hauff, C.; Houben, G.J. On the impact of personality in massive open online learning. In Proceedings of the 2016 Conference on User Modeling Adaptation and Personalization, Halifax, NS, Canada, 13–17 July 2016; pp. 121–130. [Google Scholar] [CrossRef]
- Merritt, E.G. Time for teacher learning, planning critical for school reform. Phi Delta Kappan 2016, 98, 31–36. [Google Scholar] [CrossRef]
- Vogt, F.; Rogalla, M. Developing adaptive teaching competency through coaching. Teach. Teach. Educ. 2009, 25, 1051–1060. [Google Scholar] [CrossRef]
- Rohrkemper, M.M. Self-regulated learning and academic achievement: A Vygotskian view. In Self-Regulated Learning and Academic Achievement, 1st ed.; Zimmerman, J.B., Schunk, H.D., Eds.; Springer: Berlin, Germany, 1989; pp. 143–167. [Google Scholar] [CrossRef]
- Schunk, D.H. Social Cognitive Theory; American Psychological Association: Washington, DC, USA, 2012. [Google Scholar]
- Jonassen, D.H.; Land, S.M. (Eds.) Theoretical Foundations of Learning Environments; Lawrence Erlbaum Associates Publishers: Mahwah, NJ, USA, 2000. [Google Scholar]
- Bereiter, C.; Scardamalia, M. Intentional learning as a goal of instruction. In Knowing, Learning, and Instruction: Essays in Honor of Robert Glaser, 1st ed.; Resnick, B.L., Ed.; Lawrence Erlbaum Associates Publishers: Mahwah, NJ, USA, 1989; pp. 361–392. [Google Scholar]

Disclaimer/Publisher’s Note: The statements, opinions and data contained in all publications are solely those of the individual author(s) and contributor(s) and not of MDPI and/or the editor(s). MDPI and/or the editor(s) disclaim responsibility for any injury to people or property resulting from any ideas, methods, instructions or products referred to in the content. |
© 2023 by the author. Licensee MDPI, Basel, Switzerland. This article is an open access article distributed under the terms and conditions of the Creative Commons Attribution (CC BY) license (https://creativecommons.org/licenses/by/4.0/).