Article

Identifying Factors of Students’ Failure in Blended Courses by Analyzing Students’ Engagement Data

by
Ioannis Georgakopoulos
,
Miltiadis Chalikias
*,
Vassilis Zakopoulos
and
Evangelia Kossieri
Department of Accounting and Finance, University of West Attica, 12243 Egaleo, Greece
*
Author to whom correspondence should be addressed.
Educ. Sci. 2020, 10(9), 242; https://doi.org/10.3390/educsci10090242
Submission received: 29 July 2020 / Revised: 2 September 2020 / Accepted: 8 September 2020 / Published: 10 September 2020

Abstract

:
Our modern era has brought about radical changes in the way courses are delivered and various teaching methods are being introduced to answer the purpose of meeting the modern learning challenges. On that account, the conventional way of teaching is giving place to a teaching method which combines conventional instructional strategies with contemporary learning trends. Thereby, a new course type has emerged, the blended course in the context of which online teaching and conventional instruction are efficiently mixed. This paper demonstrates a way to identify factors affecting students’ critical performance in blended courses through a binary logistics regression analysis on students’ engagement data. The binary logistics regression analysis has led to a risk model which identifies and prioritizes these factors in proportion to their contribution to the risk occurrence. The risk model is demonstrated in the context of two specific blended courses sharing the same learning design. Additionally, the outcome of the study has proved that factors related to the e-learning part have critically affected the students’ performance in the respective blended courses.

1. Introduction

Blended learning (BL), also known and as hybrid learning, is a way of teaching that combines traditional face to face classroom methods (with technology mediated) and on-line educational material. This allows students to have access to teaching material, even after the lesson is finished and provides them with a more personalized learning environment. Blended learning differs from other on-line methods in the aspect of counting on “face to face” teaching methods as well [1]. It also provides a shift from traditional teaching to a more interactive one, where teachers act more as guides and supervisors, establishing a more personal relation with their students, than simply act as the ones who deliver knowledge to a large audience. Learning on the other side becomes more interactive than passive, as students become more interactive together and with their teacher [1]. Blended learning classes can statistically produce better results than their face-to-face, non-hybrid equivalents. This is probably happening since teachers shift their role to managers and facilitators and because students’ learning experiences can be expanded [1].
It could be argued that there are many blended learning models available which can be adopted by schools and institutions. This can depend on, content, scale, technology, learning spaces, students’ age, etc. The most commonly types of blended learning suggested by some researchers and educational think-tanks which for the most part, are not mutually exclusive include [1,2]:
(1) Face-to-Face Driver Model
Face-to-face driver allows either students who are struggling or working above the average educational level to progress at their own pace using technology in the classroom. It is the closest model to a typical school structure.
(2) Rotation Model
This model is more common in primary schools, where students switch between different stations on a fixed schedule–either spending face-to-face time with their instructor or working online.
(3) Flex Model
In the Flex model, students learn and practice autonomously in a digital environment. Teachers are available in the classroom to provide on-site support and help if it is needed.
(4) Online Lab Model
With this approach, students learn exclusively online, but they can complete their coursework to a computer lab, where adults, who are not trained teachers can act as supervisors. This works well with differentiated learning and allows schools to offer courses for which they have no teacher or not enough teachers.
(5) Self-Blend Model
The self-blend model is more popular in high schools and allows mostly those students who are highly self-motivated to take classes beyond what is already offered at their traditional school environment and supplement their learning through online courses offered remotely.
(6) Online Driver Model
This approach of BL is becoming increasingly popular, by about 15% each year, indicating the number of students participating in online driver programs, which provides them more flexibility and independence in their daily schedules. This means that even though students can interact with their teachers online if it is needed, they mainly work remotely on material which is primarily delivered via an online learning platform.
Comes to no surprise that education has been transformed the recent decades by the rapid spread of technology. Higher institutions, as the leading force in delivering educational innovations, are trying to adopt to modern society’s educational needs. Therefore, Blended Learning can be used in a wide range of academic disciplines through a variety of pedagogical approaches and models.

1.1. Literature Review

In terms of the students’ attitude towards blended courses, one study [3] has indicated that in general, students show positive attitude towards blended courses and that factors affiliated with learning climate; perceived enjoyment; perceived usefulness; system functionality; social interaction; content feature and performance expectation are also significantly related to students’ satisfaction in blended courses. Another study [4] has proved that a lot of students who attend blended courses not only show positive attitude towards these courses but they also achieve better results in the context of their performance in comparison to students enrolled in conventional courses. That finding is also in line with the studies [5,6,7,8,9,10] which have pointed out that blended learning has positive impact on students’ performance.
In the context of students’ performance in blended courses, one study [11] has considered the following four main categories as especially important and significant factors that have great effect on students’ academic performance (SAP):
  • the use of technology
  • the interaction process
  • the characteristics of the students
  • the characteristics of the class
The interaction processes refer to the interaction and communication between students and their instructors through the use of Internet. Such interaction aims at improving the quality of learning by providing students with access to resources and services. However, the objective of that interaction is not encircled on replacing the traditional classroom setting. A great extent of interaction is achieved by discussion fora and the message delivery system. Through fora, students can move on interchanging valuable information on syllabus, asking questions and take advantage of all the benefits of the peer-to peer learning. Thereby, students can gain knowledge on syllabus in terms of a collaborative learning practice. The message delivery system which is mainly a part of a Learning Management System (LMS), allows students to send messages to educators in order to ask them questions and to ask them for help. Thus, educators have the golden opportunity to provide students with extra feedback.
The characteristics of the students refer to the social and psychological characteristics that could have a positive or negative effect on students’ performance. These features could vary between intrinsic students’ characteristics and characteristics which have affinity with students’ background. The intrinsic students’ characteristics is a set of features which includes students’ educational background, students’ social status, demographic characteristics, students’ level of internal self-motivation, students attitude towards a course and students’ learning preferences. Nevertheless, other characteristics are related to the effect of students’ external environment on their performance. The students’ encouragement by their family and the way students are urged by educators are factors which could affect students’ final achievement.
It is important to stress on the fact that students participating in a course, constitute a specific class. The class is bristled with all the students’ characteristics which have previously been referred. On the ground that the class is bristled with students’ features which have negative effect on their performance (negative features), the class will encounter learning difficulties and will face significant learning challenges. In that way, the students’ negative intrinsic or external features are translated into negative class features. On the other hand, when a class is bristled with students’ characteristics which have positive effect on their performance (positive features), the class will thrive. Thereby, it is crucial for an educator to meet the learning challenges in his/her class. The educators could more easily meet the learning challenges in their classes in blended courses in contradiction to the fully online courses. That holds true on the ground that face-to face approach which is mainly deployed in blended courses offers educators a great opportunity to work on students’ negative features and come up with the necessary remedial action. In terms of a fully online course (not face-to face approach), educators could only work on students’ negative features through e-mails and scheduled live video lectures (video-conferences) That is a main reason why a majority of Institutions prefer the blended courses to the fully online courses.
Another study [12] has attempted to shed more light on the relationships concerning motivations; emotions, cognitive; meta-cognitive and learning strategies and their impact on learning performance in blended courses. Their results suggested that negative emotions play a meaningful role between expectancy (a component of motivation) and learning strategies and that the expectancy component of motivation positively influences meta-cognitive strategies. That work is in line with the findings referred in the study [11], insinuating that students’ self motivation which is included in the set of students’ intrinsic characteristics has significant positive effect on students’ final achievement in blended courses. Though, it is important to set out in the difficulty of measuring factors in regard to students’ psychological characteristics. In other words, the students’ emotional engagement could not easily be measured. On that account, a lot of studies stress on students’ behavioral engagement which can be measured through the students’ interaction with the learning process reflected on students’ interaction with resources and learning activities. The effect of students’ behavioral engagement on the students’ final achievement will be explained in the next sections.
The issue of students’ performance in blended courses has also been addressed in another work [13]. This study has clarified that students’ performance in blended courses is affected by the success of two systems, the technical system, and the social system. In a more elaborate detail, the technical system is reflected on the role of e-learning and the social system is reflected on the motivation and learning climate. Thereby, that study has shown that the e-learning part could play a significant role in the generic success of blended courses and that a well-designed technical system contributes to a better learning outcome.
In parallel manner, another research [14] proved that high achievers in a blended course were students who had fully participated into online activities. Therefore, students’ engagement explained by their participation in the online activities could be deemed to be a significant factor which contributes to high achievement in blended courses. Another work [15] focuses on the Moodle usage practices and their impact on students’ performance in the context of a specific blended course proving that the Moodle system usage has accounted for the 20.2% of variance in the students’ final grade insinuating that students’ engagement reflecting on the e-learning environment system usage, is an important factor which significantly affects the students’ performance in blended courses. It is also important to refer to another study [16] which has indicated that students’ achievement in blended courses bears on their self-efficacy and e-learning motivation highlighting the important role of e-learning part. This study is also in line with the studies [5,7,8,9,10] which have also proved that the students’ achievement in blended courses is dependent on students’ attitude towards e-learning system usage.
It is also vital to refer to a study [17] which made use of a binary logistics regression analysis to predict students’ performance in two blended business courses. The binary logistics’ regression outcome on a data set including social; individual and academic factors indicated that students’ self-regulation; skills and learning presence in the community are strong predictors of students’ final achievement. Needless to say, that the academic factors were reflected by students’ engagement data including attendance; credit assignments; first quiz grades and semester grades.
In the area of students at risk, the research interest is directed into developing a warning system for students at risk. A lot of studies [18,19,20,21,22,23,24,25] have pointed out that engagement data could be analyzed in order to identify students at risk. Some of these studies [18,19] have analyzed Moodle LMS engagement data with a view to developing an early warning system for students at risk. These studies have stressed on students’ behavioral engagement data as strong predictors of students’ performance and they have proved that warning systems could be developed on the base of a proper prediction model. However, the prediction models and the imperative warning systems are heavily dependent on the instructional design and thereby the prediction models should constantly be verified in terms of their accuracy and sensitivity on the ground that a change in the instructional design or even an emerged risk factor could affect a prediction model’s accuracy. That holds true given that prediction models are based on risk factors and risk factors vary among courses and therefore the probability of an emerged risk factor could not be ruled out in the context of the course’s delivery process in a next cohort. Hence, it is not easy to develop a prediction model for students at risk which is suitable for all cohorts. It is easier to develop a risk model to identify the risk factors of students’ failure in terms of a specific course rather than developing a risk model and an imperative prediction model for all cohorts. Nevertheless, given that instructional design is mot modified through cohorts, the probability of similar risk factors among cohorts will be significant. Although similar risk factors are identified, the risk models should also be verified before being viewed as a pillar on which a prediction model could be generated.
It is also essential to stress on the fact that the prediction models referred in the studies [18,19,20,21,22,23,24,25], have not been tested in terms of a blended course. Thereby, there are not significant findings in regard to the students’ critical performance prediction in blended courses which are reported in literature. Nevertheless, some studies [18,19] have proved that Moodle LMS data assume an important role into the students’ critical performance and that finding should be considered when attempting to develop a risk model for students at risk in blended courses.

1.2. Our Research Objective

We have already clarified that there is not a set of factors which critically affect students’ performance in blended courses which is reported in literature. Therefore, there is much space for research and scientific output in that field. Our research interest is encircled on identifying the factors which contribute to the risk of students’ failure in blended courses through a proper analysis of students’ behavioral engagement data. However, the students’ engagement data set consists of data elicited from activities related to both conventional learning and asynchronous e-learning. Some studies which have previously been referred highlight the contribution of the e-learning part in the course delivery process in blended courses. Thereby, our objective is to identify whether factors related to the e-learning part have contribution to the risk of students’ failure in blended courses.
Thereby, our research is being directed into examining whether the students’ behavioral engagement data related to the e-learning part, as it has been reported in the studies referred in Section 1, have significant correlation to students’ failure.

2. Methods

2.1. Research Framework

The risk factors ‘identification process is part of a risk analysis process [26] where appropriate data are analyzed in order to come up with a risk model which identifies the risk factors and prioritizes them in proportion to their contribution to the reduction of the probability of the risk occurrence.
In the spirit of the work referred in the study [27], we developed a framework to identify risk factors of students’ failure in blended courses. The framework includes the below phases:
  • Data Collection
  • Risk Model Development
  • Risk Model Verification

2.2. Data Collection

The data collection process is encircled on gathering all students’ behavioral engagement data in regard to the conventional and e-learning part in the course delivery process. Regarding the e-learning part, a lot of statistically meaningful data are stored into Moodle LMS such as:
  • Students Logins into the System;
  • Time Students spent on System;
  • Time Students spent on specific activities;
  • Activities completed by Students;
  • Activities started by Students;
  • Students Forum Usage;
  • Messages sent by Students through LMS;
  • Students clicks on a resource;
  • Number of times a resource has been accessed by students;
  • Students grades/scores on graded activities.
However, there are not so many meaningful data which are interrelated to the conventional part which could be easily measured. One cardinal data item which has affinity with the conventional part, and it could be measured is students’ participation, reflecting on students’ attendance which can be derived by students’ absences. Other data, such as students’ time allotted to study, students’ study frequency, students’ time allotted to exercises, times students have tried to do an exercise, times students have studies the material pertaining to syllabus and time allotted to students’ assignments cannot be easily measured in a conventional course delivery process.

2.3. Risk Model Development

The collected data are being deployed in terms of a proper statistical or machine learning technique like those referred in the studies [18,19,27] in order to come up with the risk model which will decide which of the candidate risk factors (derived by the data collected) are real risk factors, having significant contribution to the risk occurrence. In our case, we made use of a binary logistics regression analysis.
According to that statistical method, the collected data are candidate coefficients of the regression model. Nevertheless, the only coefficients which are finally entered into the model are those which are statistically significant. The binary logistics regression outcome is a classification table through cases are classified into appropriate groups. In our case, through a binary logistics regression analysis, students could be classified into students at risk and into students not at risk [18,27]. The classification process is executed on the numeric threshold that has been defined for students at risk (cut value). In our case, the cut value was the numeric value 5 on the ground that students are typically deemed to fail a course on the case that they get a final grade below the numeric threshold of 5.

2.4. Risk Model Verification

Afterwards, the risk model is tested in the context of a plethora of courses sharing the shame learning design. On the case that the risk model achieves a high classification percentage the risk model will lead to a prediction model. In any other case, the whole process is reviewed, and new data are collected in order to come up with another risk model. After the other model has also been developed, it should also be verified in terms of a plethora of courses.
This paper stresses on the risk model development. The risk model verification is not presented in the context of this paper given that the risk model verification process for our model is in progress and given that the paper takes up the issue of risk factors’ identification and doesn’t take up the issue of prediction model generation.

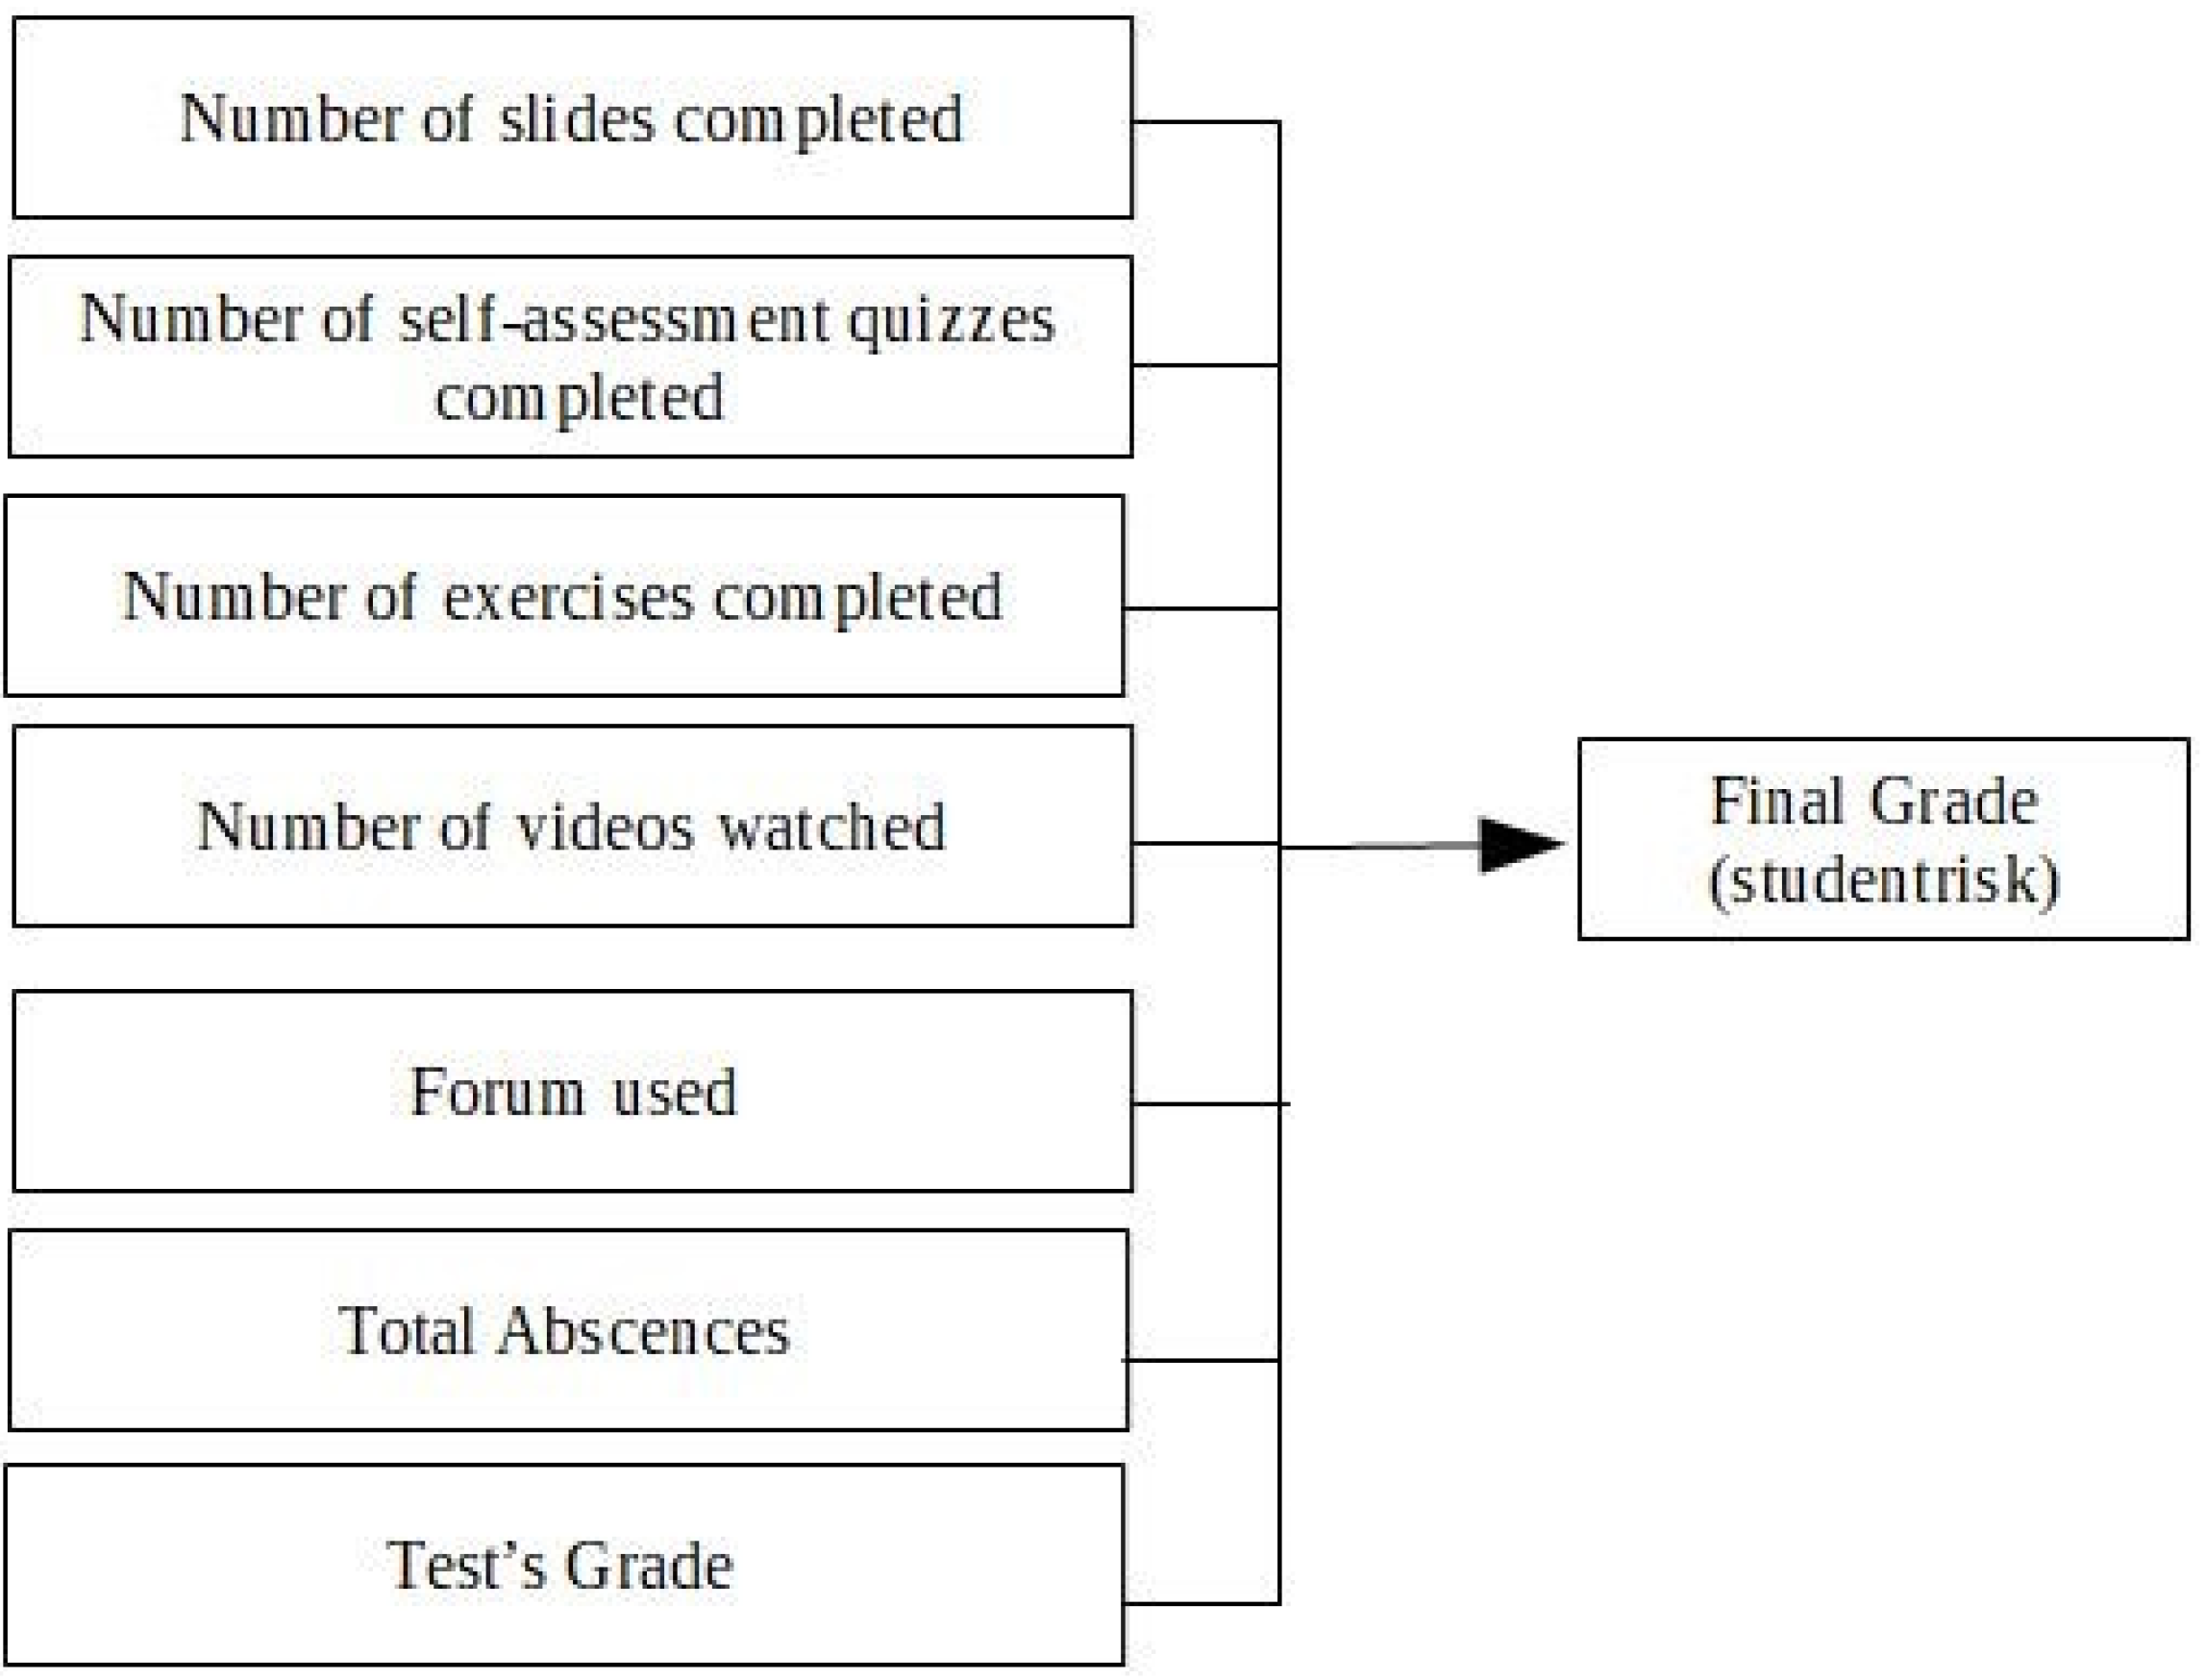
2.5. Applying Our Methodology

The risk model development process is demonstrated for two courses having the same instructional design. These courses were “Business Informatics” and “Introduction to Statistics”. The courses were delivered at the faculty of “Accounting, Finance and Social Sciences” at the University of West Attica. The main objective of the first course was to familiarize students with the science of Informatics, aiming at helping students to get perspective on the way Informatics’ principles could be used to come up with a solution to a plethora of enterprise problems. The cardinal objective of the second course was to help students to gain knowledge on the fundamentals of Statistics. Stressing on the courses’ design, it would be beneficial to explain that both courses were divided into two parts: The theoretical part and the practical part. The theoretical part included slides (in form of a SCORM item) which help students gain knowledge on theory, self-assessment quizzes which enable students to test themselves on the comprehension of the theory and video lectures (mounted on Youtube) which add to the students’ comprehension of theory. The practical part included exercises done by students to make practice in the form of assignment. A forum activity was also designed to allow students to ask questions and get feedback. The instructional design was exported to Moodle LMS. In parallel manner, lectures were delivered in class and the students had the opportunity to be aware of the theoretical syllabus and make practice. The number of students who participated in the first course was 144; whereas the corresponding number in terms of the second course was 150. All students who had been enrolled in these courses were selected to constitute the participants in these case studies.
It is also essential to highlight that Moodle LMS provides valuable information about SCORM-based activities. This information includes activities which were launched (tried by students) and activities which were completed. Thereby, slides which were mounted on Moodle as a SCORM item, were bristled with the completion status information in the report mode. In terms of the slides, a student would be deemed to get a slide item completed on the case that he/she had come to the end of the slides, completed all the slides constituting a specific slide item. Slides were created with the “Articulate” package. It is also important to stress on the fact that self-assessment exercises were in form of a quiz and they were graded. Three attempts were allowed on the self-assessment quizzes. Each attempt was graded, and the grade was given in the form of a numeric percentage. The maximum grade, out of all attempts, was calculated and defined the students’ final grade on self-assessment quizzes. A numeric threshold of 5 (50% transformed into a percentage) was determined to indicate students who could be deemed to get a self-assessment quiz completed.
The exercises for practice were given to students as assignment and they were graded. A student was deemed to have an exercise completed if he/she had achieved a grade greater or equal to 5. The videos were mounted on YouTube Channel devoted for our courses and the completion of videos was derived by the YouTube time statistics. A student would be deemed to have a video completed on the case that he/she had watched all parts of video (derived by time statistics). Additionally, a student would be deemed to get forum used on the case that he/she had made at least one post on forum. Finally, a students’ absences record was held, and the total number of absences were calculated for each student.
It is important to highlight that students should participate in an online test before the final exams and participate in the final exams’ test. The final grade for each student was calculated as the average grade of all graded activities. Students were deemed to pass the course if they achieved a final grade greater or equal to 5. Students’ at risk were identified below the numeric threshold of 5 in terms of their final grade.
We modeled a binomial variable student risk describing students who were about to face the risk of failing the course as it is suggested in the studies [18,19]. The state “0” was modeled to indicate students who were not about to face the risk of failing the course, whereas the state “1” was modeled to indicate students at risk. In parallel manner a set of variables was modeled describing the students’ interaction with the respective activities based on the relevant literature [27,28,29,30,31]. These variables are listed below:
  • Number of Slides completed (“0”: not completed, “1”: completed);
  • Number of Self-assessment quizzes completed (“0”: not completed, “1”: completed);
  • Number of Exercises done/completed;
  • Number of videos watched/completed;
  • Forum used (“0”: not used, “1”: used);
  • Total absences (skipping class);
  • Test grade (before the final exams).
After the final exams, the below variables along with the student risk variable were deployed in terms of a binary logistics regression analysis (as referred in studies [17,18] in order to come up with a risk model pointing out which of the respective candidate factors contribute to the risk of students’ failure. It is also important to denote that the engagements’ data described by the respective variables were measured two weeks before the final exams on the ground that the measurement of quizzes, exercises and slides was based on the completion status and that students usually speed up the pace of their study a few weeks before the final exams. Our regression model is depicted into Figure 1.
Figure 1 illustrates the dependent and the independent variables which have been used in the binary logistics regression analysis. The variable “student risk” is the dependent variable and the other variables appeared on the left part of the respective figure are the independent variables which constitute the candidate coefficients of the regression model.
It is important to denote that the test’s grade is not referred to the final test, but it is referred to a test aiming at examining the comprehension of students on syllabus before the final test.

3. Results

3.1. Binary Logistics Analysis Outcome (Course 1)

The binary logistics analysis, in terms of the first course has led to a risk model (see Table 1) which accounts for 79.9% (Nagelkerke R Square) of the risk factors denoting that only a 21.1% of the liable risk factors is not identified. Thereby, our model could be deemed to be a good model. It is important to clarify that a Nagelkerke R square value close to 1 denotes a very good model [32,33,34,35,36,37]. Cox & Shell R Square represents the reduction in geometric mean squared error and provides the overall model fit compared to null model. Cox & Shell R Square value close to 1 insinuates a very good model. In our case, the Cox & Shell R Square value is 0.566 which indicates that our model could be viewed as a good model. However, Nagelkerke square is the correction of Cox & Shell R Square and thereby both values (Nagelkerke R Square value and Cox & Shell R Square value) should be considered when assessing the fitness of a regression model. On the ground that Nagelkerke R Square is the correction of Cox & Shell R Square, the Nagelkerke R Square value is used to account for the amount of factors identified [32,33,34,35,36,37].
Another metric for a good model fitness is the Hosmer & Lemeshow Test, which is the calculation of the Chi [32,33,34,35,36,37]. The hypothesis that the model fits well to the results will be proved on the case that the Sig. value of the Hosmer & Lemeshow test is greater than 0.05. In our case, the respective Sig. Value is 0.398, greater than 0.05, denoting that the model fits well to the results.
The classification potential of our model is indicated into Table 2.
The first model achieved a 92.4% correct classification percentage in terms of the first course (see Table 2) denoting that only the 7.6% of the cases are not correctly classified, meaning that a small portion of students who are not at risk are classified into the groups of students at risk. The high classification percentage enhances the argument that our model could be regarded as a good model.
The Table 3 points out the significant risk factors in terms of the first course according to the Sig. Value. The column B. on Table 3 shows the coefficients that are entered into the regression model.
The significant risk factors, which have significant contribution to the reduction of the risk probability are those factors, the significance value of which is equal or less than 0.05. Thereby, according to the Sig. column on Table 3, these factors are the Test Grade and the Total Absences. In other words, the increase in absences causes an increase in the probability of risk occurrence whereas an increase in the test grade leads to a decrease in the probability of risk occurrence.
In a more elaborate detail, a unit increase in the Total Absences, according to column B on Table 3, leads to a slight increase (0.463 units) in the probability of risk occurrence; whereas a unit increase in the test grade, leads to a 0.654 units decrease in the probability of risk occurrence.

3.2. Binary Logistics Analysis Outcome (Course 2)

The binary logistics analysis, in terms of the first course has led to a risk model (see Table 4) which accounts for 74.3% (Nagelkerke R Square) of the risk factors denoting that only a 25.7% of the liable risk factors is not identified. Thereby, our model could be deemed to be a good model. It is important to stress on the fact that a Nagelkerke R square value, close to 1, denotes a very good model [32,33,34,35,36,37]. In parallel manner, the Sig. value of the Hosmer & Lemeshow Test is 0.199, greater than 0.05, denoting that the model fits well to the results.
The classification potential of our model is indicated into Table 5.
The second model achieved an 89.3% correct classification percentage in terms of the first course (see Table 5) denoting that only the 10.7% of the cases are not correctly classified, meaning that a small portion of students who are not at risk are classified into the groups of students at risk. The high classification percentage enhances the argument that our model could be regarded as a good model.
The Table 6 points out the significant risk factors in terms of the first course according to the Sig. Value. The second column of Table 6 shows the coefficients that are entered into the regression model.
The significant risk factors, which have significant contribution to the reduction of the risk probability are those factors, the significance value of which is equal or less than 0.05. Thereby, according to the Sig. column on Table 6, that factor is the Number of Slides completed. In other words, the increase in Slides completed, causes a decrease in the probability of risk occurrence.
In a more elaborate detail, a unit increase in the Number of Slides completed, according to column B on Table 6, leads to a decrease (4.666 units) in the probability of risk occurrence. Thereby, the most significant factor in terms of the second course is the Number of Slides completed on the ground that an increase in the Number of Slides completed leads to a significant reduction in the probability of risk occurrence.

4. Discussion

Both models fit well to the results, proved by all fitness metrics (see Table 1; Table 3) and they account for a sufficient amount of risk factors. The first model accounts for the 79.9% of risk factors whereas the second model accounts for the 74.3% of the risk factors (see Nagelkerke R Square Value on Table 1; Table 3). Thereby, a small amount of risk factors is not identified. The same holds true in studies related to risk models which we meet in literature [18,19,22,26]. Both models achieve a high classification percentage (92.4; 89.3 correspondingly, see Table 2; Table 5), insinuating that there is a small number of cases which are not well classified, denoting that students not at risk might be classified into students at risk. The same finding is referred in studies [18,19,22,26]. Shedding more light on the cases, we can deduct that factors related to a conventional way of course delivery (lectures attended), reflected by total absences and factors which are affiliated with a modern way of course delivery (slides completed, mounted on Moodle LMS and online test grade) appear to be significant in the reduction of the probability of the risk occurrence. However, these factors are not the same for both courses, a finding which is in accordance with some studies in literature [18,19,22,26]. It is also important to highlight that the e-learning part appears to play a significant role in the students’ final achievement in the context of both courses. That finding is in line with the findings of another study [15] referred in the context of which Moodle LMS usage appeared to account for students’ final achievement, In parallel manner, (test grade and slides completed) which constitute to be factors in regard to students’ effort and study have proved to be significant factors which critically affect students’ performance in these courses. That finding is also referred in some studies [18,19,22,26].
It is also important to highlight that self-assessment quizzes; forum usage; exercises completed and video lectures watched (which are essential metrics of students’ involvement in online activities) as referred in studies [18,19,27,28,29,30,31] didn’t appear to contribute to the reduction of the probability of the risk occurrence. Additionally, it is important to stress on the fact that our research question is proved on the ground that slides completed and test’s grade (a test before the final exams, examining students’ comprehension on a specific syllabus part) which are related to the e-learning part appear to be significant.
In a pedagogical aspect, the findings of this research have stressed out in the significance of the study material (slides completed) as a factor which critically affects the students’ performance [38,39,40]. That finding insinuates that the material which is completely studied and not just being downloaded appears to play a significant role in the students’ performance. The same finding is referred in some studies [19,22,26]. However, that has not been proved in terms of the self-assessment quizzes and videos, denoting that the previous argument is not proved for any material item but only for slides. Though, in one study [19], the self-assessment exercises appear to play a significant role in the students’ critical performance. Hence, there is not a specific material item that appears to assume a significant role in students’ critical performance in all courses.
Another finding is related to the students’ attended lectures, reflecting on total absences, which appear to be significant in the students’ critical performance. That is of great importance, from an educational point of view, given that students’ attendance implies their concern in regard to the course and it is a part of their engagement [21]. On the ground that syllabus was explained during lectures, it is reasonable that students’ attendance could affect their performance. Nevertheless, that factor has proved to be significant only in terms of one course.
Additionally, the test’s grade has appeared to be a significant risk factor in terms of one course. That is also stands to reason, from an educational perspective on the ground that the test before the final exams prepared students for the final exams, examining students’ comprehension on a specific syllabus part. In parallel manner, students were urged to study the respective syllabus in order to take the test and thereby the study for the test reflected the students’ engagement. However, the students’ score on the test before the final exams and the students’ attended lectures have not appeared to be significant risk factors in both courses. That could be explained, given that risk factors are course oriented, as it is proved in some studies [18,19,22,26].

5. Conclusions

The paper demonstrates a way to identify risk factors of students’ failure in blended courses through a binary logistics regression on students’ engagement data. The risk factors are identified through the coefficients of the regression models. The research has proved that the risk factors vary among courses. Thereby, it is not easy to come up with a risk model suitable for many courses. The research has shown that the e-learning part appears to play a significant role in the students’ performance in the blended courses. From an educational point of view, factors related to students’ engagement such as study material completed, test’s grade and attended lectures appear to critically affect students’ performance in blended courses.
Though, it’s not easy to state that the findings of the research hold for any blended course on the ground that the risk factors are dependent on course structure. Thereby, the research could be expanded in more courses to examine the probability of emerging risk factors. Additionally, the research outcome could be used to generate a prediction model of students’ performance in blended courses, aiming at developing an early warning system for students at risk in blended courses.

Author Contributions

Conceptualization, E.K.; Formal analysis, I.G.; Investigation, V.Z.; Methodology, I.G. and M.C.; Resources, V.Z.; Supervision, M.C. All authors have read and agreed to the published version of the manuscript.

Funding

This research received no external funding.

Conflicts of Interest

The authors declare no conflict of interest.

References

  1. Friesen, N. Report: Defining Blended Learning. Available online: https://www.normfriesen.info/papers/Defining_Blended_Learning_NF.pdf (accessed on 10 July 2020).
  2. Philadelphia Education Research Consortium (PERC). BLENDED LEARNING Defining Models and Examining Conditions to Support Implementation. Available online: http://8rri53pm0cs22jk3vvqna1ub-wpengine.netdna-ssl.com/wp-content/uploads/2015/11/Blended-Learning-PERC-Research-Brief-September-2014.pdf (accessed on 10 November 2015).
  3. Wu, J.; Liu, W. An Empirical Investigation of the Critical Factors Affecting Students’ Satisfaction in EFL Blended Learning. J. Lang. Teach. Res. 2013, 4, 176–185. [Google Scholar] [CrossRef]
  4. Wang, Y.S. Effects of Using a Blended Learning Method on Students’ Achievement and Motivation to Learn English in Jordan: A Pilot Case Study. Educ. Res. Int. 2018, 2018, 7425924. [Google Scholar]
  5. Akbarov, A.; Gonen, K.; Aydogan, H. Students’ attitudes toward blended learning in EFL context. Acta Didact. Napoc. 2018, 11, 61–68. [Google Scholar] [CrossRef]
  6. Bakeer, A.M. Students’ Attitudes towards Implementing Blended Learning in Teaching English in Higher Education Institutions: A Case of Al-Quds Open University. Int. J. Humanit. Soc. Sci. 2018, 8, 6. [Google Scholar] [CrossRef] [Green Version]
  7. Maccoun, H. The effect of using blended learning on the achievement of students and information retention of fifth graders in the biology course. J. Fac. Educ. 2016, 22, 209–240. [Google Scholar]
  8. Vernadakis, N.; Giannousi, M.; Derri, V.; Michalopoulos, M.; Kioumourtzoglou, E. The impact of blended and traditional instruction in students’ performance. Procedia Technol. 2012, 1, 439–443. [Google Scholar] [CrossRef] [Green Version]
  9. Alsalhi, N.R.; Eltahir, M.E.; Al-Qatawneh, S.S. The effect of blended learning on the achievement of ninth grade students in science and their attitudes towards its use. Heliyon 2019, 5, e02424. [Google Scholar] [CrossRef] [Green Version]
  10. Saritepeci, M.; Cakir, H. The Effect of Blended Learning Environments on Student Motivation and Student Engagement: A Study on Social Studies Course. Educ. Sci. 2015, 40, 203–216. [Google Scholar] [CrossRef] [Green Version]
  11. Ismail, A.O.; Mahmood, A.K.; Abdelmaboud, A. Factors Influencing Academic Performance of Students in Blended and Traditional Domains. Int. J. Emerg. Technol. Learn. 2018, 13, 170–187. [Google Scholar] [CrossRef]
  12. Ramirez-Arellano, A.; Acosta-Gonzaga, E.; Bory-Reyes, J.; Hernández-Simón, L.M. Factors affecting student learning performance: A causal model in higher blended education. J. Comput. Assist. Learn. 2018, 34, 807–815. [Google Scholar] [CrossRef]
  13. Wu, W.; Hwang, L.Y. The effectiveness of e-learning for blended courses in colleges: A multi-level empirical study. Int. J. Electron. Bus. Manag. 2010, 8, 312–322. [Google Scholar]
  14. Owson, R.; York, D.; Murtha, S. Student perceptions and achievement in a university blended learning strategic initiative. Int. High. Educ. 2013, 18, 38–46. [Google Scholar] [CrossRef]
  15. Filippidi, A.; Tselios, N.; Komis, V. Impact of Moodle usage practices on students’ performance in the context of a blended learning environment. In Proceedings of the Social Applications for Lifelong Learning, Patra, Greece, 4–5 November 2010. [Google Scholar]
  16. Keskin, S.; Yurdugul, H. Factors Affecting Students’ Preferences for Online and Blended Learning: Motivational Vs. Cognitive. Eur. J. Open Distance E-Learn. 2019, 22, 72–86. [Google Scholar] [CrossRef] [Green Version]
  17. Volchok, E. Toward a Predictive Model of Community College Student Success in Blended Classes. Community Coll. J. Res. Practice. 2018, 42, 274–288. [Google Scholar] [CrossRef]
  18. Macfadyen, L.; Dawson, S. Mining LMS data to develop an ‘‘early warning system” for educators: A proof of concept. Comput. Educ. 2010, 54, 588–599. [Google Scholar] [CrossRef]
  19. Anagnostopoulos, T.; Kytagias, C.; Xanthopoulos, T.; Georgakopoulos, I.; Psaromiligkos, I.; Salmon, I. Intelligent Predictive Analytics for Identifying Students at Risk of Failure in Moodle Courses. Available online: https://link.springer.com/chapter/10.1007/978-3-030-49663-0_19#citeas (accessed on 3 June 2020).
  20. Marks, H.M. Student engagement in instructional activity: Patterns in the elementary, middle, and high school years. Am. Educ. Res. J. 2000, 37, 153–184. [Google Scholar] [CrossRef]
  21. Newmann, F.M.; Wehlage, G.G.; Lamborn, S.D. The significance and sources of student engagement. In Student Engagement and Achievement in American Secondary Schools; Newmann, F.M., Ed.; Teachers College Press: New York, NY, USA, 1992. [Google Scholar]
  22. Willms, J.D. Student Engagement at School: A Sense of Belonging and Participation; Organisation for Economic Co-Operation and Development: Paris, France, 2003. [Google Scholar]
  23. Fredericks, J.A.; Blumenfeld, P.C.; Paris, A.H. School engagement: Potential of the concept, state of the evidence. Rev. Educ. Res. 2004, 74, 59–109. [Google Scholar] [CrossRef] [Green Version]
  24. Zhang, G.; Anderson, T.J.; Ohland, M.W.; Thorndyke, B.R. Identifying factors inuencing engineering student graduation: A longitudinal and cross-institutional study. J. Eng. Educ. 2004, 93, 313–320. [Google Scholar] [CrossRef]
  25. Appleton, J.J.; Christenson, S.L.; Furlong, M.J. Furlong. Student Engagement with School: Critical Conceptual and Methodological Issues of the Construct. Psychol. Sch. 2008, 45, 369–386. [Google Scholar] [CrossRef]
  26. Vose, D. Risk Analysis: A Quantitative Guide, 3rd ed.; Wiley: Hoboken, NJ, USA, 2008. [Google Scholar]
  27. Georgakopoulos, I.; Kytagias, C.; Psaromiligkos, Y.; Voudouri, A. Identifying risks factors of students’ failure in e-learning systems: Towards a warning system. Int. J. Decis. Support Syst. 2018, 3, 190–206. [Google Scholar] [CrossRef]
  28. Zinn, C.; Scheuer, O. Getting to Know Your Student in Distance Learning Contexts. In Innovative Approaches for Learning and Knowledge Sharing; Nejdl, W., Tochtermann, K., Eds.; Springer: Berlin, Germany, 2006. [Google Scholar]
  29. Petropoulou, O.; Lazakidou, G.; Retalis, S.; Vrasidas, C. Analysing interaction behaviour in network supported collaborative learning environments: A holistic approach. Int. J. Knowl. Learn. 2007, 3, 450–464. [Google Scholar] [CrossRef]
  30. Morris, L.V.; Finnegan, C.; Wu, S. Tracking student behavior, persistence, and achievement in online courses. Internet High. Educ. 2005, 8, 221–231. [Google Scholar] [CrossRef]
  31. Kytagias, C.; Liomas, Y.; Livanis, T.; Psaromiligkos, Y.; Dimakos, G. Mining the Log Files of Moodle: Towards Moodle Analytics. In Proceedings of the International Scientific Conference eRA–10, Egaelo, Greece, 23–25 September 2015. [Google Scholar]
  32. Allison, P.D. Measures of fit for logistic regression. In Proceedings of the SAS Global Forum 2014 Conference, Washington, DC, USA, 23–26 March 2014. [Google Scholar]
  33. Menard, S. Coefficients of determination for multiple logistic regression analysis. Am. Stat. 2000, 54, 17–24. [Google Scholar]
  34. Smith, T.J.; McKenna, C.M. A comparison of the logistic regression pseudo Rsquared indices. Mult. Linear Regres. Viewp. 2013, 39, 17–26. [Google Scholar]
  35. Hair, J.F.; Black, W.C.; Babin, B.J.; Anderson, R.E.; Tatham, R.L. Multivar. Data Analysis, 6th ed.; Pearson Prentice Hall: Upper Saddle River, NJ, USA, 2006. [Google Scholar]
  36. Hosmer, D.W.; Lemeshow, S. Applied Logistic Regression, 2nd ed.; John Wiley & Sons Inc.: New York, NY, USA, 2000. [Google Scholar]
  37. Dobson, A. An Introduction to Generalized Linear Models, 2nd ed.; Chapman and Hall: London, UK, 2001. [Google Scholar]
  38. Ntanos, S.; Asonitou, S.; Kyriakopoulos, G.; Skordoulis, M.; Chalikias, M.; Arabatzis, G. Environmental Sensitivity of Business School Students and Their Attitudes towards Social and Environmental Accounting. In Strategic Innovative Marketing and Tourism; Kavoura, A., Kefallonitis, E., Theodoridis, P., Eds.; Springer: Berlin, Germany, 2020. [Google Scholar]
  39. Papasotiriou, E.; Sidiropoulos, G.; Ntanos, S.; Chalikias, M.; Skordoulis, M. The relationship between professional burnout and satisfaction: A case study for physical education teachers in a Greek urban area. Serb. J. Manag. 2018, 13, 353–363. [Google Scholar] [CrossRef]
  40. Skordoulis, M.; Sparangis, P.; Stampolis, O.; Mougkolia, I.; Papageorgiou, A.; Chondreli, C. A framework for quality in education: Applying quality function deployment to a higher education institute. In Proceedings of the International Scientific Conference eRA–10, Egaelo, Greece, 23–25 September 2015. [Google Scholar]
Figure 1. The regression model (It depicts the dependent and the independent variables used in the regression model).
Education 10 00242 g001
Table 1. The Regression Model Fitness’ Metrics (Course 1).
Cox & Snell R Square0.566
Nagelkerke R Square0.799
Hosmer & Lemeshow Test (Sig. value)0.398
Indicates the fitness of the model.
Table 2. Classification Table (Regression Model- Course 1).
Classification Table a
ObservedPredicted
SriskPercentage Correct
Not at Riskat Risk
Step 1srisknot at risk95595.0
at risk63886.4
Overall Percentage 92.4
a The cut value is 5.00.
Table 3. Coefficients (Regression Model-Course 1).
CoefficientsB (Coefficient Value)Sig
Test Grade−0.6540.000
Total Absences0.4630.002
Table 4. The Regression Model Fitness’ Metrics (Course 2).
Cox & Snell R Square0.542
Nagelkerke R Square0.743
Hosmer & Lemeshow Test (Sig. value)0.199
Table 5. Classification Table (Regression Model-Course 2).
Classification Table a
ObservedPredicted
StudriskPercentage Correct
Not at Riskat Risk
Step 1studentrisknot at risk1371391.3
at risk127285.7
Overall Percentage 89.3
a The cut value is 5.00.
Table 6. Coefficients (Regression Model-Course 1).
CoefficientsB (Coefficient Value)Sig
Number of Slides Completed−4.6660.000

