Abstract
Small private colleges provide an important service to society while operating in a dynamic and competitive environment. The inability to operate in a manner that delivers desirable levels of satisfaction to students can prove fatal, more so given the relatively small size of their student populations. So, for these colleges, student retention is a critical condiment of business success and so the pursuit of service quality becomes amplified. In acknowledgement of the subjective nature of service quality that makes service quality studies very context specific, this empirical study takes a quantitative research approach to investigate the extent of association, if any, between service quality dimensions, student satisfaction and student retention in the specific context of small private colleges in South Africa. Study findings indicate the existence of statistically-significant positive (though moderate) associations between dimensions of service quality and student satisfaction as well as between student satisfaction and student retention. Though results ought not to be generalized, the study’s findings nonetheless, bode useful lessons for small private colleges, if the quest for improved business performance, based on student retention, is to be realized.
1. Introduction
The service industry, specifically the education sector, is increasingly recognising the importance of service quality which is leading to heightened efforts to meet the expectations of their students [1,2]. After all, quality is a critical element of success for any organisation [3]. This would possibly be more telling for small private colleges as rendering a quality service in the competitive environment in which they operate could be a vital element for success. The situation with educational institutions, especially those that are privately-owned, is interesting because there are strict regulatory standards that such institutions are supposed to meet and the upholding of these standards may not necessarily be in synchrony with the expectations of some students, thereby creating service tensions. In addition, the fact that such small private colleges, already plagued by liabilities of size, are not only competing with larger and better established educational institutions in the private sector but also with public colleges that are highly subsidized by the government, makes continued survival arduous.
It is perhaps to enhance the chances of continued survival of small private colleges, that it becomes imperative to explore avenues that may provide a competitive edge to the institution. Generally, in the broader service sector, service quality has been associated with profitability and a competitive advantage [4]. Though service quality is an abstract concept [5], Eresia-Eke, Stephanou and Swanepoel [6] aver that in modern day businesses, the quality of a service offering and its consistent delivery could be what distinguishes a struggling business from a thriving one. This is understandable because studies generally tend to suggest that good service quality typically correlates with higher levels of customer satisfaction [7] and with respect to educational institutions, student loyalty [8]. However, service quality is a multi-dimensional phenomenon that is influenced by a kaleidoscope of factors. Within educational institutions, factors that could affect the service quality perceptions of students may include teaching ability, location and facilities of the institution, administration issues, classroom aesthetics and practicability, relationships between lecturers and students [9], among others.
In a study conducted at the Czestochowa University of Technology, Ulewicz [10] found that the scores linked to all service quality dimensions had negative values, meaning that the students’ expectations were higher than their perceptions of the service actually being received. On another note, Saliba and Zoran’s [11] research on higher education institutions revealed that students’ perceptions of the institutions performance on the dimension of reliability was high compared to the dimensions of responsiveness and empathy. In a study conducted within the retail banking environment, Tsoukatos and Mastrojianni [12] noted that assurance and empathy were the most critical service quality dimensions and so organisations should focus on them. These studies make it evident that different results and different conclusions can be reached by studies focused on the same construct, as the nature of the service quality construct is that it is subjective and contextual. Ltifi [13] observed that there is a lack of consensus among researchers with respect to matters related to quality even though a number of studies have been conducted on service quality. Further, Izogo [14] affirms that service quality is contextual to the environment in which it is determined. The lack of consensus arguably stemming from the subjectivity and context-specificity of the quality construct perforates the generalisability potential of service quality studies. In effect, the risk of drawing inaccurate conclusions is real, if findings from previous studies conducted in different contexts are relied upon to infer what the precise situation may be within small private colleges in South Africa.
Nevertheless, according to Mihanović, Batinić and Pavičić [15], academic institutions are beginning to realise the significance of student satisfaction. Student satisfaction is defined as an emotional state arising from experiencing service excellence such that students’ expectations are duly fulfilled [16]. It is possible that the extent to which students are satisfied with the service offering in a college will influence their decision to continue with their studies at the institution. Indeed, levels of student satisfaction may also influence current students’ propensity to recommend the institution to other potential students. Conversely, student dissatisfaction leads to a negative word of mouth that would tarnish the reputation of the institution [17]. In essence, students’ action, or lack thereof, in this regard could affect student retention which is considered by Santhi and Ganesh [4] as a very important element, especially in private institutions, if they are to remain profitable, given that without students, the colleges cannot operate.
From a research perspective, many studies on service quality have been conducted in the context of large institutions of higher learning such as universities, public colleges and other large private colleges, to the detriment of small private colleges [18]. This has a left a gap in the literature which this study seeks to fill by investigating service quality, student satisfaction and student retention in the context of small private colleges in South Africa. These small private colleges form part of the cohort of small businesses that play a pivotal role in any economy. In South Africa, privately-owned colleges contribute significantly to the economy and educational sector to be specific [19]. Further impetus for the current study is derived from the observation of Stander and Herman [20], that the issue of quality in the private higher education sector in South Africa is a prime concern for stakeholders. It is against this background that the study elects to investigate student perceptions of service quality in South African small private colleges, based on the five dimensions of service quality and how they are connected with student satisfaction which in turn could engender retention.
The contribution of this study is two-fold. From an academic perspective, the study adds to the existing body of literature on service quality by exploring the extent to which specific service quality dimensions contribute to student satisfaction and student retention within small private colleges, in a developing country like South Africa. From a practical industry perspective, the study presents small private colleges in South Africa with invaluable insight derived from the first-hand views of students of the participating colleges, though extreme caution in generalising the findings must be exercised due to the contextual nature of the service quality construct and the non-random nature of the sample that the study utilised. This could help the quest to continuously improve services, in order to raise satisfaction levels of students and reap any collateral benefits that would crystallise therefrom.
2. Literature Review
Private colleges that participated in the study fall within the small business sector. The Department of Trade and Industries (DTI) [21] defines a small business as a separate and distinct business entity, including cooperative enterprises and non-governmental organisations, directly managed by one owner or more. In South Africa, the National Small Business Act 102 of 1996 [21] organises these small businesses into four categories namely micro enterprises, very small enterprises, small enterprises and medium enterprises (SMMEs). Irrespective of the categorisations, small businesses play a vital role in an economy given that they are the key drivers of job creation, innovation and economic growth [22]. In the South African case, small businesses are recognised as contributors to inclusive economic growth and development [23]. In the light of the volatile environment that small businesses operate in that is replete with challenges such as lack of finances, intense competition and size-related liabilities [24], investment in service quality becomes attractive as it might enable the small business to distinguish itself from others on an intangible and possibly inimitable aspect of the business.
Service Quality, Student Satisfaction and Retention
Higher education institutions operate in the service industry, where there is increased recognition of the importance of providing quality service [25]. This is unsurprising as Pathmini, Wijewardana, Gamage and Gamini [26] observed that the rendering of a high-quality service catalyses the success of service companies. In the main, service quality is about meeting and exceeding the expectations of customers [27]. Tegambwage [28] opines that service quality is based on a comparison of the customers’ expectation before using the service with their experience after using the service. Based on this, it is easy to decipher that service quality depends on the perceptions of customers, as one customer can perceive a service as high quality and another customer can perceive the same service as low quality. Therefore, the determination of the expectations of a specific customer group, is non-negotiable for organisations that are committed to achieving high levels of service quality. In the specific case of small private colleges, the perceptions of enrolled students with respect to issues related to service quality could prove invaluable [29]. Importantly, the construct of service quality is conceived by Parasuraman, Berry and Zeithani [30] as one that comprises five dimensions, namely tangibles, reliability, responsiveness, assurance and empathy.
The tangibles dimension mainly focuses on the location, physical facilities and equipment [11] of an organisation. In the context of colleges, this may include the classroom environment, furniture, and buildings, printed material, the appearance of the institution and teaching equipment [31]. These tangible factors are considered by customers when evaluating the service quality of an organisation [32]. According to Alhkami and Alarussi [33], well-maintained physical facilities, teaching materials that are visually appealing and modern equipment may lead to a high score in the tangibles dimension for an educational institution. The dimension of reliability encompasses the ability to deliver or perform the promised service consistently, accurately and dependably [34]. This essentially means providing the service as promised and carrying out the service correctly, the first time [35]. In many cases, reliability has proven to be a critical service dimension because whenever the main service is not delivered reliably, customers may switch to another service provider [36].
The responsiveness dimension refers to the readiness or willingness of staff members to be of assistance in the course of rendering the service [37]. Alhkami and Alarussi [33] opine that this dimension of service quality is very important because customers feel more valued if they sense that the organisation is taking actions that respond to their expectations. The assurance dimension is linked to the depth of knowledge of employees and the extent to which they utilise their knowledge to instil confidence and gain the trust of the customers [38]. The empathy dimension relates to actions that signal a caring and understanding disposition towards the feelings, motives and situations of customers [17]. This entails making an effort to provide customers with individualised attention, as a testimony of the fact that employees understand and strive to meet the sometimes peculiar needs of customers [39].
According to Wael [40], service quality and student satisfaction are key concepts that educational institutions must understand in order to survive, grow and remain competitive. Student satisfaction is an emotional reaction to service experience and a state felt by an individual who has experienced an outcome that satisfies his/her needs and expectations [41,42]. On the other hand, customer retention is about ensuring that customers keep on returning to patronise the organisation; it is related to the continuity of the business relationship between the service provider and the customer [43]. Retaining students is important for institutions to carry out their mission [44]. However, student retention has been a major challenge to the academic community [45] as incidents that involve students leaving without completing their programmes pose a threat to the institution’s reputation [46], business performance and continued survival. This makes it necessary for colleges to strive towards increasing student retention [47] possibly by responding to Al-Sheeb, Hamouda and Abdella’s [48] call for higher education institutions to identify and act on factors that lead to the overall satisfaction of students.
In the higher education sector in Thailand, Yousapronpaiboon [35] studied service quality and realized low scores in all the five dimensions of service quality, which is indicative of the fact that the responding students had a poor perception of the service quality efforts of the education institutions that participated in the study. However, of all the five dimensions, the tangibles dimension was accorded the lowest scores. Conversely, in their study, Bharwana, Bashir and Mohsin [49] found that tangibles had a greater score than other dimensions of service quality while empathy had the lowest score. On a slightly different note, Kwok, Jusoh and Khalifah [50] investigated the influence of service quality, as a consolidated construct, on customer satisfaction using Malaysian companies and found that a correlation exists between the two constructs. In another study to investigate the relationship between service quality and students’ satisfaction in public universities in Kenya, Kara, Tanui and Kalai [51] concluded that service quality dimensions had a significant effect on student satisfaction. These results demonstrate some inconsistencies as it pertains to perceptions of the dimension of tangibles in the service quality equation and how service quality might relate to satisfaction. Duly cognisant of these positions, this study elects to hypothesise that within the specific context of small private colleges in South Africa:
Hypothesis 1 (H1).
Students’ perceptions of tangibles are positively related to student satisfaction.
Al-Azzam’s [39] study to determine the impact of the reliability dimension on customer satisfaction in Arab banks revealed that a high correlation existed between the two constructs. Within the education sector, Ali and Mohamed [52] studied service quality of higher education institutions in Somalia and its impact on student satisfaction and observed that though all the five service quality dimensions were positively related to student satisfaction, the reliability dimension appeared to demonstrate the strongest association with student satisfaction. Slightly different, the results of a study by Kajenthiran and Karunanithy [53] in higher education institutions in Sri Lanka revealed only a moderate positive correlation between reliability and student satisfaction. Influenced by the results of these studies in different industries that found the existence of a relationship between reliability and satisfaction, though to different extents, this study hypothesizes that within the specific context of South Africa-based small private colleges:
Hypothesis 2 (H2).
Students’ perceptions of reliability are positively related to student satisfaction.
El Saghier [54] studied service quality in the hotel industry in Egypt and concluded that responsiveness was the strongest dimension related to customer satisfaction as compared to other dimensions. Turay, Shahzad, Altaf, Hussain and Habiba’s [55] study which was conducted among educational institutions in Malaysia drew a different conclusion to the effect that the responsiveness dimension only displayed a medium-strength correlation with satisfaction. In harmony with these findings, Douglas, Douglas, McClelland and Davies [56] who investigated student satisfaction in the context of higher education in the United Kingdom, concluded that responsiveness is arguably the most critical dimension of quality from a student viewpoint. These positions expose the fact that related results in extant literature are not sufficiently congruent to allow for previous findings to be relied upon to accurately determine what the exact nature of the relationship might be in the specific case of South African private colleges. On this subject, the study elects to hypothesize that in small private colleges in South Africa:
Hypothesis 3 (H3).
Students’ perceptions of responsiveness are positively related to student satisfaction.
Manik and Sidharta [57] studied service quality among academic institutions in Indonesia and noted that student perceptions of the assurance provided by institutions was low relative to the other service quality dimensions. Conversely, a study focused on investigating student satisfaction with the service quality of libraries in private universities which was conducted in Nigeria, revealed that perceptual scores linked to assurance were higher than those of the other service quality dimensions [58]. Relying on responses obtained from students in business schools in Jordan, Al-Haddad, Taleb and Badran [59] found that assurance has a statistically significant association with student satisfaction. Though student perceptions of the degree of assurance provided in their institutions are expectedly different, this study, influenced by the results of the study by Al-Haddad et al. [59] opts to project that in small private colleges in South Africa:
Hypothesis 4 (H4).
Students’ perceptions of assurance are positively related to student satisfaction.
In their study to determine the impact of service quality on customer satisfaction in private colleges in Pakistan, Bharwana et al. [49] noted, albeit interestingly, that empathy was negatively related to student satisfaction even though the other four service quality dimensions were positively associated with student satisfaction. This notwithstanding, Nell and Cant [60] in their study to determine the student perception on service quality and overall satisfaction, noted that a very weak positive correlation existed between empathy and student satisfaction at a selected South African University. Similarly, a study in the Pakistani banking industry by Ahmed, Vveinhardt, Štreimikienė, Ashraf and Channar [61], revealed that the empathy dimension of service quality had a significant positive relationship with satisfaction. While it cannot be assumed that the situation in small private colleges in South Africa will mirror the findings of other studies conducted in different industries and countries, the study derives some motivation from previous findings to hypothesize that:
Hypothesis 5 (H5).
Students’ perceptions of empathy are positively related to student satisfaction.
Kitana [62] studied service quality and student retention in the United Arab Emirates and noted that student satisfaction with service quality tends to lead to student retention. On a similar note, Azam [63] focussing on the relationship between student satisfaction and retention in Saudi Arabia, noted that student satisfaction is positively correlated to retention. An informed projection based on these findings, would suggest that in small private colleges in South Africa, student satisfaction would also be linked to student retention. Consequently, it is hypothesised that within small private colleges in South Africa:
Hypothesis 6 (H6).
Students’ satisfaction is positively related to student retention.
The study has relied on a review of extant literature and followed a deductive approach to formulate its hypotheses. These hypotheses suggest that a relationship exists between the independent variables of tangibles, reliability, responsiveness, assurance and empathy that make up the service quality construct and the dependent variable of student satisfaction. Furthermore, it is projected that student satisfaction will be associated with student retention in small private colleges in South Africa. These hypotheses, taken together, constitute the study’s conceptual framework, as illustrated in Figure 1.
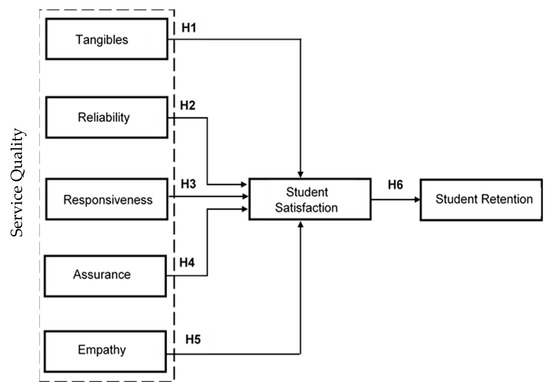
Figure 1.
Conceptual Framework of the Study.
3. Methodology
From a philosophical standpoint, this study was executed with a positivist orientation given the researchers’ bias for empiricism and objectivity in the course of designing the study. The study adopted a quantitative research approach and a survey strategy was followed. The target population for this study consisted of all the students studying at identified small private colleges in the City of Tshwane, South Africa. Students were the recipients of the service of the private colleges; therefore, they were the most suitable to provide responses that could be relied upon to gauge service quality, student satisfaction and indeed student retention—the three constructs of interest in the study.
In the light of the fact that it was not deemed feasible to reach every member of the student population in small private colleges, a sample of the students had to be drawn. The participating small private colleges were reluctant to share their student registers due to information privacy concerns and owing to this, a comprehensive and reliable sampling frame could not be developed. As a result, non-proportional quota sampling, a non-probability sampling method was used to select study participants. This was the most appropriate method since it does not require any sampling frame [64,65]. However, it is not without its disadvantages, one of which is that according to Sekaran and Bougie, [66], results of studies that utilise non-probability samples cannot be generalised.
The quota sample for the study was created largely based on gender considerations. The study therefore planned to achieve a minimum sample of 200 respondents, consisting of 100 (50%) male and 100 (50%) female respondents. A total of 230 self-administered questionnaires were distributed using the central location intercept technique and willing respondents were expected to complete the questionnaires, on-the-spot. After screening the returned questionnaires and eliminating some, for different reasons, the study was left with 212 usable questionnaires. The study’s findings are therefore based on the analysis of data obtained from 212 respondents distributed across the small private colleges that partook in the study (Table A1).
In compliance with ethical requirements, all respondents were required to read and sign an informed consent form before completing the questionnaire. The consent form explained the purpose of the study, emphasised that participation was voluntary and that respondents were free to stop participating in this study at any time. The form also provided assurance of anonymity and confidentiality. The respondents’ identifying information was not requested and was also not included in the data set. So, all results were calculated and reported at an aggregate level.
Table 1 below provides a demographic profile of the respondents who participated in this study. Though the intention of the study was to balance the numbers of participating male and female students, the elimination of some returned questionnaires, skewed the gender composition of the respondent population, slightly in favour of the males. The study’s effective respondent population comprised 101 males (47.6%) and 96 females (45.3%). In the respondent population, 15 students (7.1%) preferred not indicate their gender. In terms of age, 92.9% of the respondents fell within the 18–25 years’ age bracket, while the proportion of those aged 26–30 years and more than 30 years of age were 5.7% and 1.4%, respectively. The predominance of the students in the 18–25 years’ bracket is expected as it is reflective of the population of individuals that are characteristically enrolled in colleges.

Table 1.
A demographic profile of respondents.
The distributed questionnaire included an adapted SERVQUAL scale for the measurement of service quality. Abdelkrim and Salim [67], declare that in extant literature, the SERVQUAL instrument is arguably the most popular tool for measuring service quality in different economic sectors or organizations, globally. The SERVQUAL scale utilized was made up of 22 items, while a single item and a 4-item scale developed by the researchers were utilised for the measurement of student satisfaction and student retention, respectively. All statements for the measurement of the constructs of service quality, student satisfaction and student retention were accompanied by five-point Likert-scale options ranging from ‘strongly disagree’ with a point allocation of 1 to ‘strongly agree’ with a point allocation of 5. Table 2 indicates the internal reliability results for the scales used for measuring key variables in the study. It was necessary to undertake an analysis of the scales contained in the research instrument so as to determine if they were reliable based on realised Cronbach’s alpha indices. A composite score was determined by averaging the answers of the respondents across the items that make-up the entire construct or a sub-dimension. The Cronbach’s alpha values for all study variables exceeded the threshold of 0.7, which indicates, according to Heale and Twycross [68], that the scales are reliable.
Table 2.
Results of the reliability analysis of measurement scales.
Strikingly, the Cronbach’s alpha value for the overall SERVQUAL scale is comparable to other studies with values of 0.98 [69] and 0.92 [28]. The Cronbach’s alpha values for the dimensions of the SERVQUAL instrument are also comparable with those obtained in other studies, such as that of Datta and Vardhan [70] which had Cronbach’s alpha values of 0.779, 0.865, 0.849, 0.827 and 0.833 for the tangibles, reliability, responsiveness, assurance, and empathy dimensions, respectively.
Descriptive statistical analysis was utilised to determine the aggregate mean and standard deviation values associated with responses to items measuring the study’s independent and dependent variables. Pearson’s correlation analysis was utilised to test the relationships that were hypothesised (H1 to H6) in the study. Furthermore, canonical correlation analysis was also used to examine the interrelationships between the study’s independent and dependent variables. All the statistical analyses were undertaken with the use of the IBM SPSS version 26 software program.
4. Results
The research was focused on the composite scale scores derived from multiple item measures, therefore only the descriptive statistics of composite scores are presented. Table 3 provides the means and standard deviations linked to the individual service quality dimensions, student satisfaction as well as student retention. The standard deviations for all of the variables measured, fall in the 1.11 to 1.31 range. These figures are indicative of very little deviations in student opinions as it concerns the variables being measured. In other words, there appears to be some harmony in the perceptions of the responding students with respect to the variables that are of interest to the study. All the means obtained, are above the mid-point of the five-point scale used to measure the variables. With specific reference to the service quality dimensions, the highest score of 3.63 is related to the assurance dimension while the lowest score of 3.45 is linked with the reliability and empathy dimensions. Regardless of the slight differences, the mean scores associated with the dimensions of service quality are all reflective of a favourable perception of the students as it pertains to the performance of their institutions with respect to the five service quality dimensions. This position is validated by the mean score for student satisfaction which is 3.39. The mean composite score for student retention which is 3.40 suggests that, on average, the responding students will continue studying at their institutions.
Table 3.
Descriptive statistics of study variables (n = 211).
Pearson’s correlation analysis was utilised to test the relationships that were hypothesised in the study. Table 4 presents the results of the correlation analysis primarily testing the hypotheses that suggested that students’ perceptions of the performance of small private colleges in terms of the five service quality dimensions are positively related to student satisfaction.
Table 4.
Results of correlation analysis for service quality dimensions, student satisfaction and student retention (n = 211).
As shown in Table 4, the five service quality dimensions have statistically significant relationships with student retention, as p < 0.05 in all cases. However, the strongest and weakest relationships, as it pertains to service quality and student retention, are evident in the assurance (rs = 0.596) and tangibles (rs = 0.508) dimensions, respectively. The results contained in Table 4, also show that there are statistically significant positive relationships between student perceptions of the five service quality dimensions and student satisfaction since p < 0.05 in all cases. The correlation coefficients obtained for the relationship of each service quality dimension and student satisfaction are 0.609, 0.643, 0.626, 0.632 and 0.629, respectively, for tangibles, reliability, responsiveness, assurance and empathy. These results provide statistical support for hypotheses H1, H2, H3, H4 and H5. Notably, however, the correlation coefficients (rs) resulting from the tests indicate that all the service quality dimensions have a moderate positive relationship with the dependent variable of student satisfaction. This deduction is in keeping with Taylor’s [71] observation that correlation coefficients below 0.35 are weak, correlation coefficients from 0.36 to 0.67 are moderate, correlation coefficients from 0.68 to 0.9 are strong and correlation coefficients above 0.9 should be interpreted as very strong. The highest strength of association was obtained for the relationship between reliability and student satisfaction (0.643) while the lowest strength of association was obtained for the hypothesised relationship between tangibles and student satisfaction (0.609). Consideration of the related coefficients of determination (rs2) reveals that common variances shared by student satisfaction and tangibles, reliability, responsiveness, assurance and empathy are 37%, 41%, 39%, 40% and 40%, respectively.
In this study, student satisfaction was hypothesised to have a relationship with student retention. Table 5 presents the results of the test of the hypothesis (H6) which was undertaken with the Pearson’s correlation analysis.
Table 5.
Result of correlation analysis for student satisfaction and student retention (n = 211).
The test values obtained are rs (n = 211) = 0.675, p < 0.05. These results show that there is statistical support for the hypothesised relationship between student satisfaction and student retention. The relationship between the two variables is linear and given the correlation coefficient of 0.675, the relationship can be considered as strong as rs is above 0.67. Nonetheless, the coefficient of determination (rs2) shows that these two variables share 46% common variance.
Subsequently, canonical correlation analysis which enables the examination of interrelationships between multiple independent and dependent variables was undertaken. Results from the multivariate test of significance which formed part of the canonical correlation analysis returned an F-value of 21.66 and p < 0.05 for the Wilks lambda test which indicates acceptable model fitness. Results related to the canonical functions and significance with two canonical functions derived, are presented in Table 6 and Table 7.
Table 6.
Eigenvalues and Canonical correlations.
Table 7.
Dimension Reduction Analysis.
The results show that the first canonical function is statistically significant (p < 0.05) and it has an associated squared canonical correlation of 0.57. Consequently, the second canonical function is disregarded since it is not statistically significant. Structure coefficients between the covariates and canonical function as well as between the dependent variables and the canonical function are presented in Table 8.
Table 8.
Canonical correlation coefficients.
Generally, the canonical loading coefficients are relied upon for the interpretation of the reliability of a pair of canonical variables. According to Thompson [72], variables with loadings above 0.63 provide a very good measure of the factor. In essence, the correlation coefficients between covariates and canonical variables, based on the dimensions of tangibles, reliability, responsiveness, assurance and empathy which are 0.829, 0.887, 0.868, 0.894 and 0.862, respectively, show that these variables have a substantial and positive relationship with student satisfaction and student retention. In theory, these coefficients indicate the degree of contribution that each of the variables makes to the explanatory power of the set of variables. They therefore provide statistical support for the hypothesised relationships between students’ perceptions of the service quality dimensions and student satisfaction.
In addition, the canonical variate adequacy coefficients that show the level of performance adequacy embodied by a set of canonical variate scores, as they pertain to representing all the variance of the original unweighted variables in the set, were calculated. The results obtained signal that the first canonical function represents 81.95% of the variance in the dependent variables and 75.40% of the variance in the independent variables. Furthermore, the redundancy coefficient analysis showed that for the first canonical function which was shown to be significant, on the average, 46.45% of the variance in the dependent variables is reproducible by the independent variables. Collaterally, for the independent variables, an average of 42.73% of their variance is reproducible by the first function. According to Chacko [73], the pooled redundancy coefficients for a given set of variables equals the average multiple correlation for the variables in the set when they are predicted by all the variables in the other set. For this study, the pooled redundancy coefficients are 46.45% and 42.73% for the dependent and independent variables, respectively.
5. Discussion and Recommendation
This study was conducted in the context of small private colleges in South Africa. The aim was to investigate the relationship between service quality dimensions, student satisfaction and student retention. Studies in different contexts tend to focus largely on service quality and how it relates to customer satisfaction [53,74]. The results of the descriptive analysis linked to the five service quality dimensions suggest that students are generally satisfied with the quality of services provided to them by their colleges and this was validated by the result obtained when the overall satisfaction level of the students was measured.
Furthermore, study results signal that there is a moderate-strength significant and positive relationship between all service quality dimensions and student satisfaction. The findings further show a strong, significant and positive relationship between student satisfaction and student retention. The import of this, in the studied small private colleges, is that students’ retention tends to coincide with student satisfaction and so the latter is worthy of attention by management of private colleges. The pursuit of student satisfaction may in turn, be aided by service quality improvements, especially along the dimensions of reliability and assurance. This position resonates with the argument of Santhi and Ganesh [4] that students’ positive perception of service quality is a critical component for the survival of educational establishments.
Broadly, this study’s results are consistent with the findings of a similar study by Ali and Mohamed [52] among higher education institutions in Somalia which revealed a positive relationship between service quality dimensions and student satisfaction. Of the five service quality dimensions, correlation analysis results in this current study show that the reliability dimension has the strongest association with student satisfaction which contradicts the assertion of Douglas et al. [56] that responsiveness is the most critical dimension. This study’s findings, however, harmonise with the assertion of Mmutle and Shonhe [36], that reliability tends to be the most important element in students’ judgement of service quality as compared to all other dimensions. The lesson crystallising from this is that small private colleges may need to invest efforts in ensuring that, at a minimum, promised services in the college are rendered consistently, so as to keep students satisfied. This is particularly important against the backdrop of the study’s finding that student satisfaction correlates positively with student retention which itself has favourable ramifications for business profitability and sustainability.
Although the results suggest that the respondents that participated in the study are generally satisfied with the performance of the studied private colleges in all service quality dimensions, continuous improvement in all aspects, remains necessary. For instance, to increase levels of satisfaction based on the tangibles dimension, it is vital that the colleges update and improve the state of college equipment and facilities. Improvements along the assurance dimension may require the institutions to provide human capacity development interventions that would engender higher levels of knowledge and professionalism among employees that will equip them to instil confidence in students that they are adequately competent to discharge their responsibilities. With respect to the responsiveness dimension, it is advisable for the management of the college to drive a supportive culture that places the student at the epicentre of all actions and decisions. Focusing on the empathy dimension, colleges should amplify the need for employees to treat students with care and provide them with individualised attention, in recognition of the fact that everyone is different.
6. Conclusions, Limitations and Future Research
The present study was undertaken to examine the relationships between student perceptions of service quality dimensions and student satisfaction as well as the association between student satisfaction and student retention. In the light of this intention, the aim of the study was realised as data analyses revealed that the hypothesised relationships are statistically supported. These results could prove beneficial to small private colleges since they reinforce the importance of all dimensions of service quality given their statistically significant association with student satisfaction. Further, the empirical evidence that the study provides, which links student satisfaction to student retention is noteworthy. This is because, going by the results of this study, student satisfaction and student retention tend to occur collaterally with favourable perceptions of the service quality performance of small private colleges. Consequently, owners and managers of small private college should direct their service quality improvement efforts towards the dimensions of reliability, tangibles, responsiveness, assurance and empathy. Being small businesses, it is imperative for owners and managers of private colleges to deploy the competencies of entrepreneurial creativity and innovativeness to improve the service quality at their institutions as this appears to be a necessary precursor to better business performance that sprouts from higher levels of student satisfaction and student retention.
It is important to note that a critical limitation of this study is that its results are not generalizable, as the study’s pool of respondents was created with the use of a non-probability sampling technique. In addition, for unknown reasons, the principals of some of the private colleges approached for the study declined the request to allow the researchers, access to their students. This, inevitably diminished the pool of colleges/respondents that the study was based on.
Regardless of these limitations, it is recommended that future research focused on dimensions of service quality, student satisfaction and student retention, should be based on a larger sample of respondents, created through the use of a probability sampling technique. This would make the results of such a study generalizable to a larger population. In addition, the body of knowledge may be enriched by a study that seeks to compare student perceptions of the dimensions of service quality in private colleges and public colleges. Given the sequential nature of the relationship between service quality dimensions and student satisfaction as well as between student satisfaction and student retention, the veracity of findings of a study would be enhanced if a longitudinal design is utilized rather than the cross-sectional data collection approach adopted in the current study.
Author Contributions
Conceptualization, C.E.-E.; Formal analysis, C.E.-E. and T.N.; Methodology, C.E.-E. and N.N.; Data collection, N.N and T.N.; Supervision, C.E.-E.; Validation, T.N. and N.N.; Writing—original draft, C.E.-E., T.N. and N.N.; Writing—review & editing, C.E.-E. All authors have read and agreed to the published version of the manuscript.
Funding
This research received no external funding.
Conflicts of Interest
The authors declare no conflict of interest.
Appendix A
Table A1.
Survey Instrument.
Table A1.
Survey Instrument.
| Items | Questions | Scale | Source |
|---|---|---|---|
| 1.1 | The equipment at my college are up-to-date. | TANGIBLES dimension of the SERVQUAL scale | Items 1.1 to 5.5 are adapted from: Parasuraman, A., Berry, L. and Zeithaml, V., [30]. |
| 1.2 | The facilities (e.g., buildings and furniture) of my college are visually appealing. | ||
| 1.3 | Employees (lecturers and other staff members) at my college are well- dressed and neat in appearance at all times. | ||
| 1.4 | College materials (pamphlets and study material) are visually appealing. | ||
| 2.1 | When the lecturers and staff members promise to do something by a certain time, they do so. | RELIABILITY dimension of the SERVQUAL scale | |
| 2.2 | When I have problems, the lecturers and other staff members are sympathetic and reassuring. | ||
| 2.3 | The college is dependable and provides the service correctly, the first time. | ||
| 2.4 | The college provides services at the time it promises to do so. | ||
| 2.5 | The college keeps its records accurately (e.g., accounts). | ||
| 3.1 | The college tells me when services will be rendered. | RESPONSIVENESS dimension of the SERVQUAL scale | |
| 3.2 | I usually receive fast (prompt) service delivery from the college staff members. | ||
| 3.3 | Lecturers and other staff members are willing to assist me. | ||
| 3.4 | College staff members are not too busy to respond to my requests promptly. | ||
| 4.1 | I am able to trust the staff members. | ASSURANCE dimension of the SERVQUAL scale | |
| 4.2 | I feel safe when dealing with college employees. | ||
| 4.3 | Employees of the college are polite. | ||
| 4.4 | Employees receive adequate support from the college management to perform jobs or improve the performance of the services. | ||
| 5.1 | Employees of the college give me individualised attention. | EMPATHY dimension of the SERVQUAL scale | |
| 5.2 | Employees of the college understand my needs. | ||
| 5.3 | The college has my best interests at heart. | ||
| 5.4 | The college makes me feel special as I have easy access to staff members | ||
| 5.5 | The college has operating hours that are convenient to all their students. | ||
| 6.1 | Overall, I am satisfied with the quality of service provided by this college | Student Satisfaction | Researchers’ own development |
| 7.1 | I intend to continue my studies at this college. | Student Retention | Researchers’ own development |
| 7.2 | I am confident that this is the right college for me. | ||
| 7.3 | I have never considered stopping my studies with this college and transferring to another college. | ||
| 7.4 | If I had a choice to start again, I would still study at this college | ||
| Q8. Please indicate your age: | |||
| 18–25 | |||
| 26–30 | |||
| Over 30 | |||
| Q9. Please indicate your gender: | |||
| Male | |||
| Female | |||
References
- Goh, J.H.; Goh, Y.N.; Ramayah, T. Student satisfaction and loyalty in Malaysia private higher education institutions. Glob. Bus. Manag. Res. 2017, 9, 315–327. [Google Scholar]
- Weerasinghe, S.; Lalitha, R.; Fernando, S. Students’ satisfaction in higher education literature review. Am. J. Educ. Res. 2017, 5, 533–539. [Google Scholar]
- Hossain, M.A.; Hossain, M.M.; Chowdhury, T.H. Understanding the success of private universities: An empirical investigation from graduates’ perspective. Int. J. Qual. Reliab. Manag. 2018, 35, 145–162. [Google Scholar] [CrossRef]
- Santhi, R.; Ganesh, R. Addressing service quality to increase students’ satisfaction and retention in Malaysian private higher education institutions. Am. J. Econ. 2015, 5, 243–250. [Google Scholar]
- Zietsman, M.; Mostert, P.; Svensson, G. Perceived price and service quality as mediators between price-fairness and perceived value in business banking relationships. Int. J. Bank Mark. 2019, 37, 2–19. [Google Scholar] [CrossRef]
- Eresia-Eke, C.E.; Stephanou, M.A.; Swanepoel, R. Service quality perceptions of campus-based food outlets. Acta Commer. 2018, 18, 1–10. [Google Scholar] [CrossRef][Green Version]
- Yusoff, M.; McLeay, F.; Woodruffe-Burton, H. Dimensions driving business student satisfaction in higher education. Qual. Assur. Educ. 2015, 23, 86–104. [Google Scholar] [CrossRef]
- Meštrović, D.; Zugic, N.J. Students’ perceptions of service quality, satisfaction, and word- of-mouth: Scale adaptation and validation on a sample of ICT and STEM students. Mark. Tržište 2018, 30, 195–211. [Google Scholar]
- Mason, R.B.; Mbambo, S.N.; Pillay, M.A. Service quality at technical and vocational education and training colleges: Perception according to demographic factors. J. Tech. Educ. Train. 2018, 10, 15–29. [Google Scholar]
- Ulewicz, R. Application of servqual method for evaluation of quality of educational services at the university of higher education. Pol. J. Manag. Stud. 2014, 9, 254–264. [Google Scholar]
- Saliba, K.; Zoran, A.G. Measuring higher education services using the SERVQUAL model. J. Univ. Excell. 2018, 4, 160–179. [Google Scholar]
- Tsoukatos, E.; Mastrojianni, E. Key determinants of service quality in retail banking. EuroMed J. Bus. 2010, 5, 85–100. [Google Scholar] [CrossRef]
- Ltifi, M. Antecedents and effects of commitment on the impulse by internet. J. Internet Bank. Commer. 2013, 18, 2–22. [Google Scholar]
- Izogo, E.E. Customer loyalty in telecom service sector: The role of service quality and customer commitment. TQM J. 2017, 29, 19–36. [Google Scholar] [CrossRef]
- Mihanović, Z.; Batinić, A.B.; Pavičić, J. The link between students’ satisfaction with faculty, overall students’ satisfaction with student life and student performances. Rev. Innov. Compet. A J. Econ. Soc. Res. 2016, 2, 37–60. [Google Scholar] [CrossRef]
- Sokoli, D.; Koren, A.; Gutierrez, C. Student’s Perception of Academic Quality: A Review of the Literature. 2018. Available online: http://www.toknowpress.net/ISBN/978-961-6914-23-9/papers/ML2018-220.pdf (accessed on 14 February 2019).
- Mansori, S.; Vaz, A.F.; Ismail, Z. Service quality, satisfaction and student loyalty in Malaysian private education. Asian Soc. Sci. 2014, 10, 57–66. [Google Scholar] [CrossRef]
- Onditi, E.O.; Wechuli, T.W. Service quality and student satisfaction in higher education institutions: A review of literature. Int. J. Sci. Res. Publ. 2017, 7, 328–335. [Google Scholar]
- BER. The Small, Medium and Micro Enterprise Sector of South Africa; Bureau for Economic Research: Pretoria, South Africa, 2016; pp. 1–32. [Google Scholar]
- Stander, E.; Herman, C. Barriers and challenges private higher education institutions face in the management of quality assurance in South Africa. S. Afr. J. High. Educ. 2017, 31, 206–224. [Google Scholar] [CrossRef][Green Version]
- DTI 1996. National Small Business Act. No. 102 (Notice No. 1901). Available online: https://www.thedti.gov.za/sme_development/docs/act.pdf (accessed on 20 April 2019).
- Ayandibu, A.O.; Houghton, J. The role of Small and Medium Scale Enterprise in local economic development (LED). J. Bus. Retail Manag. Res. 2017, 11, 1–7. [Google Scholar]
- Bhorat, H.; Asmal, Z.; Lilenstein, K.; Van der Zee, K. SMMEs in South Africa: Understanding the Constraints on Growth and Performance. 2018. Available online: https://www.africaportal.org/publications/smmes-south-africa-understanding-constraints-growth-and-performance/ (accessed on 27 April 2019).
- Sahran, S.; Zeinalnezhad, M.; Mukhtar, M. Quality management in small and medium enterprises: Experiences from a developing country. Int. Rev. Bus. Res. Pap. 2010, 6, 164–173. [Google Scholar]
- Adinegara, G.N.J.; Putra, P.S.E. Assessment of service quality in higher education: Case study in private university. Int. J. Bus. Manag. Invent. 2016, 5, 82–88. [Google Scholar]
- Pathmini, M.; Wijewardana, W.; Gamage, C.; Gamini, L. Impact of Service Quality on Student’s Satisfaction in Newly Established Public Sector Universities in Sri Lanka: Study Based on the Faculty of Management Studies. 2014. Available online: https://www.researchgate.net (accessed on 19 April 2019).
- Van Truong, H.; Pham, C.H.; Vo, N.H. Service quality and students level of satisfaction in private colleges in Vietnam. Int. J. Financ. Res. 2016, 7, 121–128. [Google Scholar] [CrossRef][Green Version]
- Tegambwage, A.G. The relative importance of service quality dimensions: An empirical study in the Tanzanian higher education industry. Int. Res. J. Interdiscip. Multidiscip. Stud. (IRJIMS) 2017, 3, 76–86. [Google Scholar]
- Neupane, R.; Devkota, M. Evaluation of the impacts of service quality dimensions on patient/customer satisfaction: A study of private hospitals in Nepal. Int. J. Soc. Sci. Manag. 2017, 4, 165–176. [Google Scholar] [CrossRef]
- Parasuraman, A.; Berry, L.; Zeithaml, V. Refinement and reassessment of the SERVQUAL scale. J. Retail. 1991, 67, 420–450. [Google Scholar]
- Mwiya, B.; Bwalya, J.; Siachinji, B.; Sikombe, S.; Chanda, H.; Chawala, M. Higher education quality and student satisfaction nexus: Evidence from Zambia. Creat. Educ. 2017, 8, 1044–1068. [Google Scholar] [CrossRef]
- Esmaeilpour, M.; Mohamadi, Z.; Rajabi, A. Effect of dimensions of service quality on the brand equity in the fast food industry. Stud. Bus. Econ. 2016, 11, 30–46. [Google Scholar] [CrossRef]
- Alhkami, A.A.; Alarussi, A.S. Service quality dimensions and customer satisfaction in telecommunication companies. Asian J. Bus. Manag. 2016, 4, 117–126. [Google Scholar]
- Chui, T.B.; Ahmad, M.S.; Bassim, F.A.; Zaimi, N.A. Evaluation of service quality of private higher education using service improvement matrix. Procedia Soc. Behav. Sci. 2016, 224, 132–140. [Google Scholar] [CrossRef]
- Yousapronpaiboon, K. Servqual: Measuring higher education service quality in Thailand. Procedia Soc. Behav. Sci. 2014, 116, 1088–1095. [Google Scholar] [CrossRef]
- Mmutle, T.; Shonhe, L. Customers’ perception of service quality and its impact on reputation in the hospitality industry. Afr. J. Hosp. Tour. Leis. 2017, 6, 1–25. [Google Scholar]
- Yarimoglu, E.K. A review on dimensions of service quality models. J. Mark. Manag. 2014, 2, 79–93. [Google Scholar]
- Negricea, C.I.; Edu, T.; Avram, E.M. Establishing influence of specific academic quality on student satisfaction. Procedia Soc. Behav. Sci. 2014, 116, 4430–4435. [Google Scholar] [CrossRef]
- Al-Azzam, A.F.M. The impact of service quality dimensions on customer satisfaction: A field study of Arab bank in Irbid city, Jordan. Eur. J. Bus. Manag. 2015, 7, 45–53. [Google Scholar]
- Wael, T. Using servqual model to assess service quality and students’ satisfaction in Pavia University–Italy. Int. J. Res. 2015, 24, 24–31. [Google Scholar]
- Annamdevula, S. Relationship between service quality, satisfaction, motivation and loyalty: A multi-dimensional perspective. Qual. Assur. Educ. 2017, 25, 171–188. [Google Scholar]
- Lien, P.T. Training service quality and its effects on student satisfaction: Case of a Vietnam university. Int. J. Acad. Res. Bus. Soc. Sci. 2017, 7, 99–110. [Google Scholar] [CrossRef]
- Zangmo, M.; Liampreecha, W.; Chemsripong, S. The impact of service quality on customer retention in airline industry in Bhutan. Int. Bus. Manag. 2015, 9, 1281–1284. [Google Scholar]
- Cruz, R.A.O.D. Persistence and retention towards degree completion of BS agriculture students in selected state universities in region IV-A, Philippines. Afr. J. Agric. Res. 2015, 10, 1543–1556. [Google Scholar]
- Kerby, M.B. Toward a new predictive model of student retention in higher education: An application of classical sociological theory. J. Coll. Stud. Retent. Res. Theory Pract. 2015, 17, 138–161. [Google Scholar] [CrossRef]
- Kelmendi, N.; Nawar, Y.S. Assessing the impact of motivation on student retention: The case of university of West London. Bus. Manag. Rev. 2016, 7, 67–78. [Google Scholar]
- Twaissi, N.M.; Al-Kilani, M.H. The impact of perceived service quality on students’ intentions in higher education in a Jordanian governmental university. Int. Bus. Res. 2015, 8, 81–92. [Google Scholar] [CrossRef][Green Version]
- Al-Sheeb, B.; Hamouda, A.M.; Abdella, G.M. Investigating determinants of student satisfaction in the first year of college in a public university in the state of Qatar. Educ. Res. Int. 2018, 2018, 1–14. [Google Scholar] [CrossRef]
- Bharwana, T.K.; Bashir, M.; Mohsin, M. Impact of service quality on customers’ satisfaction: A study from service sector especially private colleges of Faisalabad, Punjab, Pakistan. Int. J. Sci. Res. Publ. 2013, 3, 1–7. [Google Scholar]
- Kwok, S.Y.; Jusoh, A.; Khalifah, Z. The influence of service quality on satisfaction: Does gender really matter? Intang. Cap. 2016, 12, 444–461. [Google Scholar] [CrossRef]
- Kara, A.M.; Tanui, E.; Kalai, J.M. Educational service quality and students’ satisfaction in public universities in Kenya. Int. J. Educ. Soc. Sci. 2016, 10, 37–48. [Google Scholar]
- Ali, A.Y.S.; Mohamed, A.I. Service quality provided by higher education institutions in Somalia and its impact on student satisfaction. Eur. J. Bus. Manag. 2014, 6, 143–148. [Google Scholar]
- Kajenthiran, K.; Karunanithy, M. Service quality and student satisfaction: A case study of private external higher education institutions in Jaffna, Sri Lanka. J. Bus. Stud. 2015, 1, 46–64. [Google Scholar]
- El Saghier, N.M. Managing service quality: Dimensions of service quality: A study in Egypt. Manag. Serv. Qual. 2015, 9, 56–63. [Google Scholar]
- Turay, T.; Shahzad, A.; Altaf, M.; Hussain, H.; Habiba, U. The impact of perceived service quality of ‘CIAC’ visa service process technology on students’ satisfaction. J. Qual. Technol. Manag. 2017, 13, 61–83. [Google Scholar]
- Douglas, J.A.; Douglas, A.; McClelland, R.J.; Davies, J. Understanding student satisfaction and dissatisfaction: An interpretive study in the UK higher education context. Stud. High. Educ. 2015, 40, 329–349. [Google Scholar] [CrossRef]
- Manik, E.; Sidharta, I. The Impact of Academic Service Quality on Student Satisfaction. 2017. Available online: https://mpra.ub.uni-muenchen.de/80878/ (accessed on 25 April 2019).
- Oluwunmi, A.O.; Durodola, O.; Ajayi, C. Students’ Perceived Quality of Library Facilities and Services in Nigerian Private Universities. J. Educ. Train. Stud. 2016, 4, 41–50. [Google Scholar]
- Al-Haddad, S.; Taleb, R.A.; Badran, S. The impact of the education services quality on students’ satisfaction: An empirical study at the business schools in Jordan. Int. J. Bus. Excell. 2018, 14, 393–413. [Google Scholar] [CrossRef]
- Nell, C.E.; Cant, M.C. Determining student perceptions regarding the most important service features and overall satisfaction with the service quality of a higher education institution. Manag. J. Contemp. Manag. Issues 2014, 19, 63–87. [Google Scholar]
- Ahmed, R.R.; Vveinhardt, J.; Štreimikienė, D.; Ashraf, M.; Channar, Z.A. Modified SERVQUAL model and effects of customer attitude and technology on customer satisfaction in banking industry: Mediation, moderation and conditional process analysis. J. Bus. Econ. Manag. 2017, 8, 974–1004. [Google Scholar] [CrossRef]
- Kitana, A. The relationship between the level of service quality in the academic institutions and student’s retention: A case study on city university college of Ajman, (CUCA) introduction. Int. Refereed Res. J. 2016, 7, 52–60. [Google Scholar]
- Azam, A. Service quality dimensions and students’ satisfaction: A study of Saudi Arabian private higher education institutions. Eur. Online J. Nat. Soc. Sci. 2018, 7, 275–284. [Google Scholar]
- Cooper, D.R.; Schindler, P.S. Business Research Methods, 11th ed.; McGraw-Hill: New York, NY, USA, 2011. [Google Scholar]
- Saunders, M.; Lewis, P.; Thornhill, A. Research Methods for Business Students, 6th ed.; Pearson: Harlow, UK, 2012. [Google Scholar]
- Sekaran, U.; Bougie, R. Research Methods for Business: A Skill-Building Approach, 6th ed.; John Wiley: New York, NY, USA, 2013. [Google Scholar]
- Abdelkrim, Y.-B.; Salim, B.A. Assessment of the service quality in the preparatory school of economics through servperf model. Rom. Econ. Bus. Rev. 2015, 10, 127–136. [Google Scholar]
- Heale, R.; Twycross, A. Validity and reliability in quantitative studies. Evid. Based Nurs. 2015, 18, 66–67. [Google Scholar] [CrossRef]
- Husin, N.K.M.; Romle, A.R.; Udin, M.M.; Shahuri, N.S.S.; Yusoff, M.S.M. An examination of service quality in Malaysian public university. World Appl. Sci. J. 2016, 34, 423–430. [Google Scholar]
- Datta, K.S.; Vardhan, J. A SERVQUAL-based framework for assessing quality of international branch campuses in UAE: A management students’ perspective. SAGE Open 2017, 7, 2158244016676294. [Google Scholar] [CrossRef]
- Taylor, R. Interpretation of the correlation coefficient: A basic review. J. Diagn. Med. Sonogr. 1990, 6, 35–39. [Google Scholar] [CrossRef]
- Thompson, B. Canonical Correlation Analysis: Uses and Interpretation; Sage: Beverly Hills, CA, USA; London, UK, 1984. [Google Scholar]
- Chacko, H.E. An Example of the Use of Canonical Correlation Analysis. In Proceedings of the Annual Meeting of the Mid-South Educational Research Association, Memphis, TN, USA, 19–21 November 1986. [Google Scholar]
- Al-Alak, B.A.; Alnaser, A.S.M. Assessing the relationship between higher education service quality dimensions and student satisfaction. Aust. J. Basic Appl. Sci. 2012, 6, 156–164. [Google Scholar]
© 2020 by the authors. Licensee MDPI, Basel, Switzerland. This article is an open access article distributed under the terms and conditions of the Creative Commons Attribution (CC BY) license (http://creativecommons.org/licenses/by/4.0/).