Abstract
Students’ approaches to learning can vary between students of different ages, genders, years, degrees, or cultural contexts. The aim of this study was to assess the approaches to learning of different students of life science degrees. The Revised Two-Factor Study Process Questionnaire (R-SPQ-2F) has been used to assess the approaches to learning of 505 students of thirteen different subjects of four different degrees at Universitat Politècnica de València in order to study the factors that influence their approaches. Results show a higher deep approach of the students. Differences were observed between subjects and gender, not related to level (bachelor or master) or year. The item reliability analysis showed a high consistency for the main scales, but not for the secondary scales of the R-SPQ-2F questionnaire. High correlation between the deep and surface scales were observed. These data can provide more information to the teachers, which may help them to develop strategies focused on promoting a deeper approach to learning for the students, more adapted to their subject, level, and year.
1. Introduction
Engagement of students has been linked to positive learning outcomes [1,2]. Several factors influence students’ engagement, such as emotional engagement, behavior, cognitive, or agentic elements [2,3,4,5]. One of the elements that can influence students’ engagement is the level of studies and voluntarism. As opposed to early education stages, including primary and secondary education, higher university education is not compulsory in most countries. Students voluntarily chose to go to university, while they have other options such as the job market, professional training, or specialized studies. In this sense, while there may be personal, family, or social influences to start university studies, the main motivation is often intrinsic. A recent survey of more than 60,000 European students showed that only less than 25% of students chose to pursue higher education for other reasons than their own motivations [6]. Besides, the choice of a specific university degree has external limitations, such as the minimum admission mark, location, or economic restrictions, e.g., the cost of tuition at private universities or the lack of public aids. Within a particular degree, the type of subject also conditions motivation. Some of them are mandatory, but in higher courses elective subjects are usually found. Therefore, the motivation and involvement in each subject may vary depending on intrinsic and extrinsic factors of the student. Both global and specific motivation effects can affect student learning [7,8].
The factors that affect the type of student learning in each subject are multiple; some of them depend on the teacher and how he/she approaches the subject teaching [7]. Therefore, it is key to maximize students’ learning to locate those modifiable factors upon which we can act.
The student approaches to learning theory was initially developed by Marton and Säljö [8,9] and led to the development of the theory of constructivism. This theory assumes that knowledge must be built within the personal cognitive structure of each individual. This is fundamentally personal, but depends on the experiences of the learning environment and social interactions [10]. The most successful students are those who participate metacognitively, with motivation and active behavior in their learning process [11]. Although the process by which students approach learning is complex, it depends on contextual and personal factors [7,12,13]. In fact, it can change across disciplines [14,15] and cultural backgrounds [16,17,18]. In addition, teaching context can influence the learning approach of the students [19,20] and even determine their learning performance [20,21,22,23].
The approach to student learning can be classified in several ways, but a classification commonly used distinguishes surface learning and deep learning [9,24]. Surface learning is characterized by a lack of personal connection, the use of memory, and lack of reflection, and the student attempts to satisfy the subjects’ necessities with a minimum effort and an extrinsic responsibility [25,26,27]. On the other side, deep learning involves personal connections, reflection on meaning and comprehension, the student assumes his/her learning, it has an intrinsic responsibility [25,26,27,28], and it may entail a greater satisfaction [29,30]. Students who take a superficial approach in a subject tend to be more concerned about grading and use memorization, while those who use a deep approach pursue learning and understanding [28,31,32]. A deep approach has also been positively correlated with assessment results [23,33,34], while surface approach has been negatively correlated [23].
The present study aimed to assess the student approach to learning of life science students in several degrees and subjects of different years. The different factors that can influence the student approach to learning were analyzed and their influence assessed. The results can be used to enhance a reflective approach to learning and to align the teaching methodology with the learning approach of the students in order to encourage them to follow a deeper and more reflective approach to their studies.
2. Literature Review
Qualitative [35] or quantitative [28,36] approximations to measure the approach to learning have been developed. They all maintain the superficial–deep dichotomy [31,37], although other strategic or motivational approaches have been identified [7,31,38]. Some of the factors that have been analyzed as related to the approach used by the student for learning are gender differences [39], effectiveness of interventions [40], relationship to learning objectives [41], and learning over time [42]. For example, a deep approach is often associated with better learning quality [2,23,43,44]. A relationship between the taxonomy structure of the observed learning outcome (SOLO) and deep learning [45,46,47] has also been studied. This relationship can be used to improve learning and achievement of academic objectives by modifying, for example, the workload or evaluation procedures [43].
There are many tools available to assess students’ approach to learning, such as Study Attitudes and Methods Revised Short Form (SAMS Short Form) [48], Revised Approaches to Studying Inventory (RASI) [49] modified in Approaches and Study Skills Inventory for Students (ASSIST) [50,51], Inventory of Learning Process–Revised (ILP-R) [13], Approaches to Learning and Studying Inventory (ALSI) [52], Learning and Study Inventory Strategies (LASSI) [53], or Inventory of Learning Styles (ILS) [54]. However, one of the most widely used is the Study Process Questionnaire (SPQ) [28], which was subsequently revised to create the Revised Two-Factor Study Process Questionnaire (R-SPQ-2F) [7]. The validity of this tool has been proven by different studies [26,55,56].
The SPQ questionnaire proposed by Biggs [7] has been used to establish the relationship between approach to learning and personality, knowledge acquisition, academic performance, learning style preference, self-efficiency, goal orientation, or self-regulation strategies [57,58,59,60]. The original SPQ questionnaire had 42 questions and three approaches to learning: surface, deep, and achieving learning [28]. The revised R-SPQ-2F version reduced the number of approaches to two, as achieving learning overlapped with the other two. The number of items was also reduced, making it easier to use [7]. The questionnaire consists of 20 questions, with a 5-point Likert scale. Students’ responses take into account the approach to learning and individual characteristics of the student [56]. This questionnaire is not intended to classify students as surface or deep learners, but seeks to estimate the behavior of the student in the specific learning context where the questionnaire is taken [7], in which the student opts for an approach to learning based on intrinsic and extrinsic factors [7]. These factors interact with each other and adapt to each learning context. Deep and superficial approaches can be subdivided in two subscales: strategy and motive. Strategies involve the activities, methods, or processes that the students use during their learning, while the motivations involve the reasons and the goals that lead to embrace a proposed strategy [26,61]. However, these associations are not seen in other studies [26,55,56].
Several factors influence student approach to learning and they can be classified as contextual, perceived, or student factors [28,62]. Personality is obviously one of the factors that influences the learning approach of the students [63]. Other student factors include sociodemographic characteristics and academic abilities. These would be the case of gender, age, and cultural differences [23,31]. In general, there are no differences between genders [34,43] or the results have been inconsistent or influenced by cultural factors [64,65]. Older students usually have a higher trend toward a deep approach to learning [31,66,67,68] possibly because they have more intrinsic motivation [69], which may explain also their greater success [43]. Differences in student approaches to learning have also been found between countries or cultural contexts [7,23,26,55,61,70].
Still, the same students may change their learning approaches depending on the specific learning situation and the goals they may face [65,71]. Thus, contextual factors also affect the approach to learning. This would be the case of the type of studies, the subject matter, the classroom activities, the assessment system, the institutional setting, or the course in which the subject is framed [15,43]. For example, deep learning can be lower in higher courses than in initial courses [28,43]. This may indicate that the teaching–learning environment does not require deep learning or that the student does not perceive it that way [43], so that a surface approach may be sufficient to achieve the course’s objectives. Again, these relationships can vary depending on the context, as the opposite has also been detected [63]. Also, teaching techniques can influence student approach to learning, which can vary from the beginning to the end of classes, for example using a flipped classroom methodology [2]. Indeed, some of these factors within the teacher’s domain of control can be used to influence student approach to learning [15]. Workload can also condition the approach, and in higher levels is normally associated with a surface approach [66,72,73].
The teacher has to provide the appropriate learning activities for the student to achieve the objectives set, emphasizing what the student does [74]. Students who usually opt for surface learning are still eligible for deep learning if the context encourages this approach and vice versa [7]. In fact, students can create their learning environments in order to optimize their performance, but they often need help in choosing the strategies to use. Without guidance and instruction, their learning will be far from optimal [56]. Accordingly, the primary purpose of a good teacher would be to encourage students to adopt deep learning and discourage surface learning [75]. In this sense, measuring the student’s approach to learning would indirectly provide an index of the quality of teaching [7]. For example, the usefulness of a learning outcome can foster deep learning, while workload can encourage surface learning [76]. In this context, the R-SPQ-2F questionnaire can be a useful tool to analyze the effectiveness of teaching methodologies to promote deep learning [7].
There are different studies where the Biggs questionnaire has been used to evaluate students’ approaches to learning and its effectiveness has been evaluated in different sociocultural contexts. In fact, the R-SPQ-2F questionnaire has been adapted to several languages [27,32,61,77,78,79,80,81] and it has been tested in a varied range of contexts. For example, in medical studies, students showed mostly an approach to deep learning in Ghana [32] or Saudi Arabia [82] and similar results were obtained in Malaysia in business, computer, and engineering programs [83]. In Saudi Arabia, deep learning was linked to a higher number of hours of study and better grades. On the other hand, law students in the Netherlands [31] showed a higher score in the deep approach than the superficial approach, although many scored low on both approaches to learning. In the same study, no correlations were obtained between assessment and problem solving, but they were found between the age and gender of the students [31]. Another study conducted in Australia with chemistry students using the original Biggs’ questionnaire found that deep learning was related to the assessment of learning objectives and that age has the biggest influence on the approach to learning and performance, with better results for older students [43]. On the other hand, studies conducted in Hong Kong with Biggs’ unrevised questionnaire and interviews showed that deep learning was positively linked to age and negatively to the academic year [66]. Studies in Japan [27] validated Biggs’ questionnaire in relation to deep and superficial approaches, but not with the subscales of the questionnaire, and showed different relationships that did not appear in other studies and could be due to cultural reasons. Studies carried out in China [70] showed that students used more intermediate approaches to learning with memorization as a tool to achieve comprehension. This questionnaire has even been used to assess the evolution of the students in a subject and the influence of the flipped classroom approach [2]. Positive correlations have been found between deep approach and students’ learning achievements [2,43,84,85,86].
Other studies have also been conducted comparing different models of choice of questions that determine deep or surface learning from the Biggs questionnaire [56]. These studies compared the results of Biggs’s work [7] in Hong Kong with studies evaluating the questionnaire in different contexts (Spain [26], Japan [27], United States [55,56] the Netherlands [61], or Norway [78]). These studies also indicated that there may be cultural differences that explain different results and showed controversy regarding the grouping of test questions [26,55,56,78]. Moreover, a study comparing the results of students in Hong Kong and Sydney showed differences that could be attributed to cultural causes [70].
These studies have analyzed the approach to learning in many contexts, however there is no detailed study that includes the sociocultural conditions of Spain in a life science learning environment. In the present study the student approach to learning in life science degrees was analyzed in several subjects of different degrees and levels, and the factors that influence their response was assessed. These results obtained would allow the organization of teaching methodologies and promote the development of the general and specific competences of each degree and reinforce a deeper approach by the students. Although the number of subjects is limited, the results can be representative of the students of these degrees and can be used with a higher sample in other subjects, degrees of this context, or other similar contexts.
3. Materials and Methods
3.1. Research Design and Materials
A Spanish translation of the R-SPQ-2F questionnaire [79] was used for the students in classes with Spanish as a medium of instruction, while the original questionnaire developed by Biggs et al. [7] was used for students with English as medium of instruction. The questionnaire was given to the students at the beginning of each of the subjects.
The questionnaire includes 20 items (Table 1) that are divided into two scales. The deep approach (DA) scale includes deep motive (DM) and deep surface (DS) subscales; the surface approach (SA) scale includes surface motive (SM) and surface strategy (SS) subscales. Each subscale consists of five items with a 5-point Likert-type scale ranging from 1 (‘rarely true of me’) to 5 (‘always true of me’). To obtain main scales scores for DA, the results of questions 1, 2, 5, 6, 9, 10, 13, 14, 17, and 18 were added, for SA questions 3, 4, 7, 8, 11, 12, 15, 16, 19, and 20 were used. For the subscales, the following questions were used: 1, 5, 9, 13, and 17 for DM; 2, 6, 10, 14, and 18 for DS; 3, 7, 11, 15, and 19 for SM; and 4, 8, 12, 16, and 20 for SS.

Table 1.
Questions of the Biggs revised two factor study process questionnaire [7].
3.2. Sample and Data Collection Procedure
The sample comprised 505 students (182 males and 323 females) out of 900 possible respondents on life sciences degrees belonging to thirteen different subjects and four different degrees (Table 2) of Universitat Politècnica de València (Valencia, Spain). The participation of the students was voluntary and not related to the qualifications of the subject. The number of participants was considered as sample size for calculations. This distribution was related with the unequal ratio of enrolment in the degrees surveyed. The data were collected using an online questionnaire through an online learning platform (PoliformaT) based on Sakai system. To check if the size of the sample (n) was representative the following formula was used:
where,
and Zα/2 is the critical value of the normal distribution at α/2 (e.g., for a confidence level of 99%, α is 0.05 and the critical value is 2.58), MOE is the margin of error, p is the sample proportion, and N is the population size [87].
n = N × X/(X + N − 1)
X = Zα/22 × p × (1 − p)/MOE2
Table 2.
Samples included in the research.
3.3. Data Analysis
Values of the different factors (DA, SA, DM, DS, SM, and SS) were calculated following the indications of Biggs’ R-SPQ-2F questionnaire [7]. Student’s t-test was used to compare the difference of deep and surface approaches and a Tukey’s HSD multiple range test was used to compare the mean values between different factors. Internal consistency of R-SPQ-2F was assessed using Cronbach’s alpha. Statistical analysis was performed using Microsoft © Excel and Statgraphics © Centurion XVI software.
4. Results
The average participation of the students in the study was high (56.1%, ranging from 26.1% to 86.7%) considering that the students had to be volunteers. Thus, the results seem to be representative, as considering the level of participation the samples were not exclusively represented by overmotivated students and the size of the sample was enough with a confidence level higher than 99% [87]. Nonetheless, in six of the nineteen samples evaluated the percentage of participation was considerably lower than 50%, although above 20% (Table 3). No differences in percentage of participation were observed according to the level of the studies or language of instruction, but differences were observed depending on the gender, with a higher participation rate in female students; subject; or year of study. All the mean DA values were significantly higher than SA values in all the subjects evaluated, with the exception of three of them (Geobotany and Natural Resources, Plant Breeding for Vegetal Production and Species, Habitats and Forest Biodiversity Management). These three cases belonged to the fourth year of the corresponding bachelor’s degree and they were characterized by a very low ratio of participation. DA values were also higher than SA when the samples were analyzed considering language, gender, level, and year of studies (Table 3). Nevertheless, there were variations in the differences between DA and SA values, which were also dependent on these factors.
Table 3.
Number of students who answered the questionnaire by subject, language as medium of instruction, gender, level of the students, and year. Values (average and standard error) of the Revised Two-Factor Study Process Questionnaire (R-SPQ-2F) questionnaire scales in the deep approach (DA), surface approach (SA), difference between DA and SA, and null hypothesis DA-SA.
Regarding the gender, there were no differences in the DA values, but SA values were lower in the case of females, leading to higher differences between DA and SA in this gender. In the case of level of instruction, DA and SA values showed no differences between Bachelor (BSc) and master levels. Nevertheless, p-values in both cases were below 0.1 and the difference between DA and SA was higher in master’s degrees (Figure 1 and Figure 2).
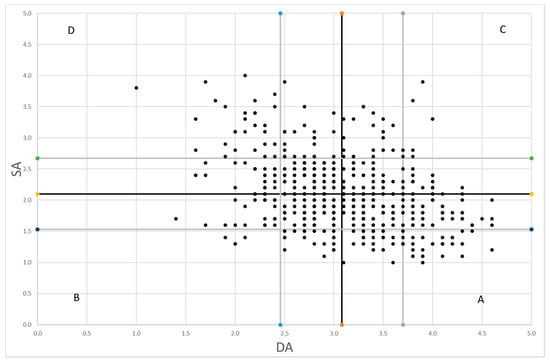
Figure 1.
Deep approach (DA) and surface approach (SA) distribution of scores for each student. The black lines depict mean values for DA and SA and the grey lines, the mean plus or minus the standard deviation.
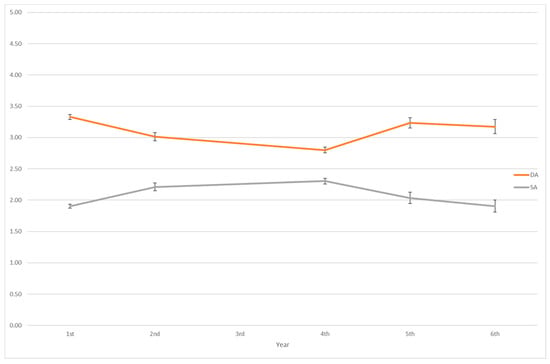
Figure 2.
Mean deep approach (DA) and surface approach (SA) distribution in regards to year of study. Years 1 to 4 are bachelor level and years 5 and 6 are master level scores for each student. The bars represent the standard error.
The evolution of DA and SA values was further analyzed. Within the year of study, DA values were higher than SA. This result was confirmed when the specific mean DA and SA values were compared on a per student basis (Figure 1), and only a low proportion of SA mean values were higher than DA. Specifically, it was the case of only 65 students out of 505 (62 of bachelor level and 3 of master level) indicating in these cases a clear higher surface approach to learning. Nevertheless, different DA and SA values were found depending on the year of study (1st, 2nd, and 4th in BSc and 5th and 6th in master). Higher DA mean values were obtained in the first year of BSc and in both years of master level. Accordingly, mean SA values for these years were lower than those obtained for 2nd and 4th years of BSc (Table 3). The differences between mean DA and SA values also varied during the years. The highest values were obtained in the first year of BSc studies, then they dropped in the 2nd and especially in the 4th year and started to raise again in the 5th year. This trend was determined by the evolution of mean DA and SA values. DA was higher in the first year, dropped during the rest of years of BSc studies and raised again at the master years, while SA followed the opposite trend (Figure 2). Also, differences were observed between compulsory or elective subjects (DA: 3.19 ± 0.03 vs. 2.76 ± 0.05 and SA: 2.01 ± 0.03 vs. 2.35 ± 0.06), but as all the elective subjects were in fourth year when comparison was made between subjects of the same year, no differences between compulsory and elective subjects were detected.
In six subjects, the questionnaire was distributed in two different years and, with few exceptions, no significant differences were observed. No significant differences were observed in most cases, confirming the consistency of the results, as different students had answered in each year. Only in one year, significantly higher values were observed for SA in General Genetics and Experimentation in Biotechnology and for DA in Plant Genetic Resources (Table 4).
Table 4.
Number of students who answered the questionnaire for subjects that were tested in different years or with different language of instruction. Values (average and standard error) of the R-SPQ-2F questionnaire scales in the deep approach (DA), surface approach (SA), difference between DA and SA.
Results were also studied for the secondary factors of the R-SPQ-2F questionnaire [7] (Table 5 and Table 6). In general, values of DM and DS were higher than values of SM and SS. Significant differences were observed between subjects, language used as medium of instruction, or gender but not regarding year, with the exception of SM values for years in the General Genetics and Metabolic Engineering and Synthetic Biology subjects or DS in the Plant Genetic Resources subject (Table 6).
Table 5.
Values (average and standard error) of the R-SPQ-2F questionnaire scales in the deep motivation (DM), deep strategy (DS), surface motivation (SM), and surface strategy (SS).
Table 6.
Values (average and standard error) of the R-SPQ-2F questionnaire scales in the deep motivation (DM), deep strategy (DS), surface motivation (SM), and surface strategy (SS) for subjects tested in different years or with different language of instruction.
Regarding the subdivision of DA and SA in motivations and strategies, significant correlations were detected between several factors of the R-SPQ-2F questionnaire (Table 7). High and positive correlations were observed between DA and DM and DS, and also between SA and SM and SS. As expected, significant negative correlations were detected between DA and SA and the corresponding strategies and motivations. Nonetheless, the correlation values obtained were relatively low. The correlation between motivations and strategies in both cases were lower than between each component and the corresponding approach.
Table 7.
Correlations between different factors of the R-SPQ-2F questionnaire scales. Deep approach (DA), surface approach (SA), deep motivation (DM), deep strategy (DS), surface motivation (SM), and surface strategy (SS).
The internal consistency of the questionnaire was evaluated using the Cronbach’s alpha formula (Table 8). The values obtained were close to or higher than 0.7 for the main factors (DA and SA), considering the global sample and the different factors studied (gender, language, year, and level of studies). Regarding secondary factors involving motivations and strategies, Cronbach’s alpha values were similar or slightly lower in most cases, except for master’s studies, with low values influenced by those obtained in the fifth year (Table 8).
Table 8.
Cronbach alpha coefficient values (95% lower confidence band) among the different R-SPQ-2F questionnaire scales of the 505 questionnaires evaluated. Deep approach (DA), surface approach (SA), deep motivation (DM), deep strategy (DS), surface motivation (SM), and surface strategy (SS).
5. Discussion
The number of answers of the questionnaire was moderate to high (505 answers out of 900 total number of students) and considered appropriated to carry out the statistical analysis according to computer simulations [88]. The values obtained by the students for DA were higher than SA values (Table 3 and Table 4), which generally assumed that is a desirable study behavior [68]. DA values were higher than in other studies [82] or similar [2,32,70,89], and their distributions were also similar [2]. This result can indicate an approach to learning more focused on understanding the subject than getting a mark. But there were differences between subjects, like previously reported [2], with higher values for General Genetics and lower values for Experimentation in Biotechnology, for example. One of the possible explanations for this difference is the discipline, as it has been seen in other cases [14,15]. In this case, the first subject is in first year of biotechnology degree with a very high admission mark and the latter is an elective subject in the last year of this degree, indicating that approach to learning is related with the subject and even with the age of the student. Although age of the students was not assessed, students of the fourth year are, in general, older than students of the first year of the degree. Age can be one of the factors that can influence difference in the student approach to learning [2,43,65,68,90,91], with higher values of DA and lower values of SA for elder students. These differences normally are not related to gender, subject, or level of study [68]. Only in some studies were age and gender related [2,65], in which cases the range of age was very big (between 18 and 70). The most common explanation about this approach related to age is that older student are more likely studying out of intrinsic interest or for their personal development [68]. In our case no statistical differences were recorded between bachelor or master level regarding to DA and SA scores (Table 3), so age cannot be the only factor that explains the differences between subjects, and the type of subject could explain these differences. Students of the fourth year of the degree may become more strategic in their approach to learning, which could explain the lower DA scores and could be related to workload [63,66,72,73], as these students in most cases are doing the final degree thesis at the same time as the fourth year subjects. Study time has also been detected as one of the factors that can affect student approach to learning [92]. The fact that biotechnology degree has a very high admission mark [93,94] should also be taken into account, so students are very committed to their degree and can have an intrinsic interest similar to the students in a master level degree. For example, in accounting students, a decline in the deep approach has been reported when they enroll in higher years [19] and students adapt their learning approach depending on the learning environment [12,15,43]. Similar results were observed in China between first and third year students with a decline in the deep approach, indicating an influence of the learning context, but also of the cultural context [63] or in distant education [95]. Also, differences were observed between different subjects of the same students, depending on the subject [15]. The R-SPQ-2F questionnaire is a relational inventory and assesses specific responses to particular situations [7], which can explain different responses of students in different subjects. No differences were detected between bachelor and master level in our case. The high admission mark of the biotechnology degree [94,96] may explain this result, so differences are more probable due to subject and teaching environment rather than to age or level of the students. A hypothesis is that many university learning environments are not conductive to the deep approach [43,97]. In our case, higher values for DA were recorded in the first year of the degree and in master level, and lower levels in fourth year of the degree, which is in accordance with that hypothesis in the bachelor level (Figure 2). Differences between compulsory and elective subjects seemed more related to year than to the type of subject, as comparisons in the same year gave no differences between subjects regarding type of subject.
Regarding gender, the sample of students used in this study showed a majority of female students (66.6%), which is in accordance with the gender proportion for health degrees in Spain [98]. No differences were recorded for gender in the student approach (except for SA) to learning, as reported in other studies [68,99], although in some specific contexts some differences can arise, like in the case of distance education [65,95] or other factors [2,20,63]. As a consequence, the relation of gender with student approach to learning is not clear [68]. The gender differences might emerge in particular academic or cultural contexts [100]. The DA student approach in our study was similar, functioning independently of the gender of the student and no interactions were detected with level or language of the subjects in this study.
Most of the students showed a higher DA than SA, with only a 12.9% of the students with a higher SA value, and most of them in the bachelor level (62 out 65 students). Usually students of master level are very motivated for their degree so their approach to learning DA is higher. Differences have been detected related to the level of the students [92], but they were more related to the kind of assessment used for different level students, as in other studies [101] where multiple choice questions were used more in first years and essay assignment in later years. In our case, the kind of assessments were different between subjects (mainly due to the number of students per subject that is higher in the first years), but that different kind of assessment system seemed to not influence the student approach to learning. However, more detailed studies should be done to get insight over this factor.
Language as a medium of instruction has been another factor that can influence the student approach to learning. In our case, two of the subjects had groups of students with different languages as a medium of instruction (Spanish and English). The contents, activities, and assessment system were the same for both groups, but the number of students per classroom was much lower in the English group. Most of the students were Spanish natives in both groups. The DA was statistically higher for the English group, but whether this difference is due to the language or to the size or admission mark for this specific group remains unclear. Language competency has been one of the factors than can influence the student learning approach [92,102]. Also, students that use another language than English showed higher scores in the deep approach [2], which supports that language, direct or indirectly, is one of the factors that affects students’ approaches to learning.
Correlations (Table 7) were high between main factors (DA and SA) and the secondary factors (DM, DS, SM, and SS), while negative correlations appeared between deep and superficial scales. Similar results were obtained in other studies [55,56,70], as was already predicted by Biggs et al. [7]. This result can indicate the presence of two dominant factors (deep and surface factors), however a more detailed analysis of the factors underlined is needed.
Item reliability analysis showed values higher than 0.7 for DA and SA factors, but not for the secondary factors, which confirms the reliability of the questionnaire for the two main scales [103,104]. Similar results were observed in other studies [2,23,55,56,82,83,105,106,107], indicating that the questionnaire is valid for the main factors, but not for the secondary factors. Different associations between questions and factors have been detected [7,26,55,56,78] and cultural differences have been observed [18,70,77,80]. Confirmatory factor analyses have been carried out in different cultural contexts [7,26,55,56,78,108] and the analyses confirm the validity of the questionnaire, although some adjustments can be done depending on the cultural context. This kind of analysis remains as a future task for this study and more data and more years are needed to assess the validity of the results. Also, influence of the teaching in the learning approach of the student remains as a future field of study by assessing the student approach to learning at the beginning and the end of the subject and related to the academic performance. These data can give more information to the teachers that would help them to develop strategies more focused on promoting a deeper approach to learning of the students adapted to their subject, level, and year, as teaching and learning systems should be constructively aligned to encourage a deep approach to learning [7]. Changes in the learning environment can promote a more deep approach to learning [19], as it is related with a better academic performance and satisfaction of the students.
6. Conclusions
Meaningful learning is considered a key point for successful teaching [78], and to assess the approach adopted by the student can help in developing teaching strategies and designing activities that promote a deep approach by the student in the subject or even in their degree. Although age, gender, level, degree, or cultural differences exist in the students that enroll in a subject, common dynamics can be developed to assess the learning approach of the student in a subject. Several instruments have been developed to assess student approaches to learning [13,48,49,53,54], but one of the most used is the R-SPQ-2F questionnaire developed by Biggs et al. [7]. This questionnaire has been used in this study to assess the student approach to learning. Data confirmed the validity of the questionnaire in the life science degrees analyzed and the higher deep approach of the students. Mean values were influenced by the subject or gender, but not by the level or year of the students. Different strategies can be developed to take advantage of this approach as learning environment influences and is related to the quality of learning achieved by the student [52]. Conclusions of the study could be reinforced in future research by including more subjects from the degrees under study and from related subjects and even from another Spanish universities with life science degrees. Future studies can confirm the number of factors and the associations of questions with the different scales of the R-SPQ-2F questionnaire and study the influence of the teaching dynamics in the students’ approaches to learning in each subject. Also, influence of teaching strategies over student approach to learning can be assessed to improve the learning of the students.
Author Contributions
Conceptualization, M.L.-B.; methodology, M.L.-B. and J.C.-C.; validation, M.L.-B., J.C.-C., R.P., and A.P.-d.-C.; formal analysis, M.L.-B., J.C.-C., R.P., and A.P.-d.-C.; investigation, M.L.-B., J.C.-C., R.P., N.A.-C., C.E., M.F., H.M., M.J.D., and A.P.-d.-C.; data curation, M.L.-B., J.C.-C., R.P., N.A.-C., C.E., M.F., H.M., M.J.D., and A.P.-d.-C.; writing—original draft preparation, M.L.-B., J.C.-C., R.P., and A.P.-d.-C.; writing—review and editing, M.L.-B., J.C.-C., R.P., N.A.-C., C.E., M.F., H.M., M.J.D., and A.P.-d.-C.; visualization, M.L.-B., J.C.-C., R.P., N.A.-C., C.E., M.F., H.M., M.J.D., and A.P.-d.-C.; supervision, M.L.-B.; project administration, M.L.-B.; funding acquisition, M.L.-B., J.C.-C., R.P., N.A.-C., C.E., M.F., H.M., M.J.D., and A.P.-d.-C. All authors have read and agreed to the published version of the manuscript.
Funding
This research was partially funded by innovation educative projects (PIME/2017/A/016/A and PIME/19-20/168) by Vice-Rectorate for Studies, Quality and Accreditation of Universitat Politècnica de València (UPV, Valencia, Spain).
Acknowledgments
The authors acknowledge the support of the Instituto de Ciencias de la Educación (ICE) of Universitat Politècnica de València (UPV, Valencia, Spain) and all the students that participated in the study.
Conflicts of Interest
The authors declare no conflict of interest.
References
- Sinatra, G.M.; Heddy, B.C.; Lombardi, D. The Challenges of Defining and Measuring Student Engagement in Science. Educ. Psychol. 2015, 50, 1–13. [Google Scholar] [CrossRef]
- Jeong, J.S.; González-gómez, D.; Conde-núñez, M.C.; Gallego-picó, A. Examination of Students’ Engagement with R-SPQ- 2F of Learning Approach in Flipped Sustainable Science Course. J. Baltic Sci. Educ. 2019, 18, 880–891. [Google Scholar] [CrossRef]
- Fredricks, J.A.; Blumenfeld, P.C.; Paris, A.H. School Engagement: Potential of the Concept, State of the Evidence. Rev. Educ. Res. 2004, 74, 59–109. [Google Scholar] [CrossRef]
- Reeve, J. How students create motivationally supportive learning environments for themselves: The concept of agentic engagement. J. Educ. Psychol. 2013, 105, 579–595. [Google Scholar] [CrossRef]
- Montenegro, A. Understanding the Concept of Agentic Engagement. Colomb. Appl. Linguist. J. 2017, 19, 117. [Google Scholar] [CrossRef]
- QS Enrolment Solutions. International Student Survey 2017. Available online: https://www.internationalstudentsurvey.com/international-student-survey-2017/ (accessed on 4 May 2018).
- Biggs, J.; Kember, D.; Leung, D.Y.P. The revised two-factor Study Process Questionnaire: R-SPQ-2F. Br. J. Educ. Psychol. 2001, 71, 133–149. [Google Scholar] [CrossRef]
- Marton, F.; Säljö, R. On qualitative differences in learning: I-Outcome and process. Br. J. Educ. Psychol. 1976, 46, 4–11. [Google Scholar] [CrossRef]
- Marton, F.; Säljö, R. On qualitative differences in learning-II outcome as a function of the learners’s conception of the task. Br. J. Educ. Psychol. 1976, 46, 115–127. [Google Scholar] [CrossRef]
- Grabinger, R.S.; Dunlap, J.C. Rich environments for active learning: A definition. Res. Learn. Technol. 1995, 3, 5–34. [Google Scholar] [CrossRef]
- Zimmerman, B.J. Becoming a self-regulated learner: Which are the key subprocesses? Contemp. Educ. Psychol. 1986, 11, 307–313. [Google Scholar] [CrossRef]
- Biggs, J.B. Individual and group differences in study processes. Br. J. Educ. Psychol. 1978, 48, 266–279. [Google Scholar] [CrossRef]
- Schmeck, R.R.; Ribich, F.; Ramanaiah, N. Development of a Self-Report Inventory for Assessing Individual Differences in Learning Processes. Appl. Psychol. Meas. 1977, 1, 413–431. [Google Scholar] [CrossRef]
- Booth, P.; Luckett, P.; Mladenovic, R. The quality of learning in accounting education: The impact of approaches to learning on academic performance. Account. Educ. 1999, 8, 277–300. [Google Scholar] [CrossRef]
- Eley, M.G. Differential adoption of study approaches within individual students. High Educ. 1992, 23, 231–254. [Google Scholar] [CrossRef]
- Abhayawansa, S.; Fonseca, L. Conceptions of learning and approaches to learning-a Phenomenographic study of a group of overseas accounting students from Sri Lanka. Account. Educ. 2010, 19, 527–550. [Google Scholar] [CrossRef]
- Zhang, L.F. University students’ learning approaches in three cultures: An investigation of biggs’s 3p model. J. Psychol. Interdiscip. Appl. 2000, 134, 37–55. [Google Scholar] [CrossRef]
- Richardson, J.T.E. Cultural specificity of approaches to studying in higher education: A literature survey. High Educ. 1994, 27, 449–468. [Google Scholar] [CrossRef]
- Hall, M.; Ramsay, A.; Raven, J. Changing the learning environment to promote deep learning approaches in first-year accounting students. Account. Educ. 2004, 13, 489–505. [Google Scholar] [CrossRef]
- Everaert, P.; Opdecam, E.; Maussen, S. The relationship between motivation, learning approaches, academic performance and time spent. Account. Educ. 2017, 26, 78–107. [Google Scholar] [CrossRef]
- Duff, A. Understanding academic performance and progression of first-year accounting and business economics undergraduates: The role of approaches to learning and prior academic achievement. Account. Educ. 2004, 13, 409–430. [Google Scholar] [CrossRef]
- Davidson, R.A. Relationship of study approach and exam performance. J. Account. Educ. 2002, 20, 29–44. [Google Scholar] [CrossRef]
- Salamonson, Y.; Weaver, R.; Chang, S.; Koch, J.; Bhathal, R.; Khoo, C.; Wilson, I.G. Learning approaches as predictors of academic performance in first year health and science students. Nurse Educ. Today 2013, 33, 729–733. [Google Scholar] [CrossRef] [PubMed]
- Entwistle, N.; Entwistle, D. Preparing for examinations: The interplay of memorising and understanding, and the development of knowledge objects. High Educ. Res. Dev. 2003, 22, 19–41. [Google Scholar] [CrossRef]
- Frăsineanu, E.S. Approach to Learning Process: Superficial Learning and Deep Learning at Students. Procedia Soc. Behav. Sci. 2013, 76, 346–350. [Google Scholar] [CrossRef]
- Justicia, F.; Pichardo, M.C.; Cano, F.; Berbén, A.B.G.; De la Fuente, J. The Revised Two-Factor Study Process Questionnaire (R-SPQ-2F): Exploratory and confirmatory factor analyses at item level. Eur. J. Psychol. Educ. 2008, 23, 355–372. [Google Scholar] [CrossRef]
- Fryer, L.K.; Ginns, P.; Walker, R.A.; Nakao, K. The adaptation and validation of the CEQ and the R-SPQ-2F to the Japanese tertiary environment. Eur. J. Psychol. Educ. 2012, 82, 549–563. [Google Scholar] [CrossRef]
- Biggs, J. Student Approaches to Learning and Studying. Research Monograph. In Australian Education Research and Development; Australian Council Educational Research (ACER), 1987. Available online: https://eric.ed.gov/?id=ED308201 (accessed on 4 May 2018).
- Gurpinar, E.; Kulac, E.; Tetik, C.; Akdogan, I.; Mamakli, S. Do learning approaches of medical students affect their satisfaction with problem-based learning? Adv. Physiol. Educ. 2013, 37, 85–88. [Google Scholar] [CrossRef]
- Parpala, A.; Lindblom-Ylänne, S.; Komulainen, E.; Litmanen, T.; Hirsto, L. Students’ approaches to learning and their experiences of the teaching-learning environment in different disciplines. Br. J. Educ. Psychol. 2010, 80, 269–282. [Google Scholar] [CrossRef]
- Gijbels, D.; Van de Watering, G.; Dochy, F.; Van den Bossche, P. The relationship between students’ approaches to learning and the assessment of learning outcomes. Eur. J. Psychol. Educ. 2005, 20, 327–341. [Google Scholar] [CrossRef]
- Mogre, V.; Amalba, A. Assessing the reliability and validity of the Revised Two Factor Study Process Questionnaire (RSPQ2F) in Ghanaian medical students. J. Educ. Eval. Health Prof. 2014, 11, 19. [Google Scholar] [CrossRef]
- Mok, C.K.F.; Dodd, B.; Whitehill, T.L. Speech-language pathology students’ approaches to learning in a problem-based learning curriculum. Int. J. Speech Lang Pathol. 2009, 11, 472–481. [Google Scholar] [CrossRef] [PubMed]
- May, W.; Chung, E.K.; Elliott, D.; Fisher, D. The relationship between medical students’ learning approaches and performance on a summative high-stakes clinical performance examination. Med. Teach. 2012, 34, e236–e241. [Google Scholar] [CrossRef] [PubMed]
- Marton, F. Phenomenography? Describing conceptions of the world around us. Instr. Sci. 1981, 10, 177–200. [Google Scholar] [CrossRef]
- Graham, N.C.; Entwistle, N.; Ramsden, P. Understanding Student Learning. Br. J. Educ. Stud. 1984, 32, 284. [Google Scholar] [CrossRef]
- Prosser, M.; Trigwell, K. Understanding learning and leaching. In The Experience in Higher Education; Open University Press: Buckingham, UK, 1999. [Google Scholar]
- Entwistle, N.J. Approaches to learning and perceptions of the learning environment. High Educ. 1991, 22, 201–204. [Google Scholar] [CrossRef]
- Wilson, K.L.; Smart, R.M.; Watson, R.J. Gender differences in approaches to learning in first year psychology students. Br. J. Educ. Psychol. 1996, 66, 59–71. [Google Scholar] [CrossRef]
- Gordon, C.; Debus, R. Developing deep learning approaches and personal teaching efficacy within a preservice teacher education context. Br. J. Educ. Psychol. 2002, 72, 483–511. [Google Scholar] [CrossRef] [PubMed]
- Boyle, E.A.; Duffy, T.; Dunleavy, K. Learning styles and academic outcome: The validity and utility of Vermunt’s Inventory of Learning Styles in a British higher education setting. Br. J. Educ. Psychol. 2003, 73, 267–290. [Google Scholar] [CrossRef]
- Fox, R.A.; McManus, I.C.; Winder, B.C. The shortened Study Process Questionnaire: An investigation of its structure and longitudinal stability using confirmatory factor analysis. Br. J. Educ. Psychol. 2001, 71, 511–530. [Google Scholar] [CrossRef]
- Zeegers, P. Approaches to learning in science: A longitudinal study. Br. J. Educ. Psychol. 2001, 71, 115–132. [Google Scholar] [CrossRef]
- Snelgrove, S.; Slater, J. Approaches to learning: Psychometric testing of a study process questionnaire. J. Adv. Nurs. 2003, 43, 496–505. [Google Scholar] [CrossRef] [PubMed]
- Rossum, E.J.; Schenk, S.M. The relationship between learning conceptions, study strategy and learning outcome. Br. J. Educ. Psychol. 1984, 54, 73–83. [Google Scholar] [CrossRef]
- Trigwell, K.; Prosser, M.; Waterhouse, F. Relations between teachers’ approaches to teaching and students’ approaches to learning. High Educ. 1999, 37, 57–70. [Google Scholar] [CrossRef]
- Crawford, K.; Gordon, S.; Nicholas, J.; Prosser, M. Qualitatively different experiences of learning mathematics at university. Learn Instr. 1998, 8, 455–468. [Google Scholar] [CrossRef]
- Michael, W.B.; Michael, J.J.; Zimmerman, W.S. Study Attitudes and Methods Survey (SAMS); Educational and Industrial Testing Service: San Diego, CA, USA, 1985. [Google Scholar]
- Entwistle, N.J.; Tait, H. The Revised Approaches to Studying Inventory; Centre for Research on Learning and Instruction: Edinburgh, Scotland, UK, 1995. [Google Scholar]
- Tait, H.; Entwistle, N.J.; McCune, V. ASSIST: A reconceptualisation of the Approaches to Studying Inventory. In Improving Students as Learners; Rust, C., Ed.; Oxford Brookes University, The Oxford Centre for Staff and Learning Development: Oxford, UK, 1998; pp. 262–271. [Google Scholar]
- Entwistle, N.; Hilary, T. Approaches and Study Skills Inventory for Students (ASSIST) (Incorporating the Revised Approaches to Studying Inventory—RASI). 2013. Available online: https://www.researchgate.net/publication/260291730_Approaches_and_Study_Skills_Inventory_for_Students_ASSIST_incorporating_the_Revised_Approaches_to_Studying_Inventory_-_RASI (accessed on 4 May 2018).
- Entwistle, N.; McCune, V.; Hounsell, J. Approaches to Studying and Perceptions of University Teaching-Learning Environments: Concepts, Measures and Preliminary Findings; Report number: Occasional Report No 1 from ETL Project; University of Edinburgh: Edinburgh, UK, 2002. [Google Scholar]
- Weinstein, C.E. Learning and Study Strategies Inventory; H & H Publishing: Clearwater, FL, USA, 1987. [Google Scholar]
- Vermunt, J.D. Inventory of Learning Styles in Higher Education: Scoring Key; Tilburg University, Department of Educational Psychology: Tilburg, The Netherlands, 1994. [Google Scholar]
- Immekus, J.C.; Imbrie, P.K. A Test and Cross-Validation of the Revised Two-Factor Study Process Questionnaire Factor Structure Among Western University Students. Educ. Psychol. Meas. 2010, 70, 495–510. [Google Scholar] [CrossRef]
- Socha, A.; Sigler, E.A. Exploring and “reconciling” the factor structure for the Revised Two-factor Study Process Questionnaire. Learn. Individ. Differ. 2014, 31, 43–50. [Google Scholar] [CrossRef]
- Chamorro-Premuzic, T.; Furnham, A.; Lewis, M. Personality and approaches to learning predict preference for different teaching methods. Learn. Individ. Differ. 2007, 17, 241–250. [Google Scholar] [CrossRef]
- Furnham, A.; Monsen, J.; Ahmetoglu, G. Typical intellectual engagement, Big Five personality traits, approaches to learning and cognitive ability predictors of academic performance. Br. J. Educ. Psychol. 2009, 79, 769–782. [Google Scholar] [CrossRef]
- Phan, H.P. Multiple regression analysis of epistemological beliefs, learning approaches and self-regulated learning. Electron. J. Res. Educ. Psychol. 2008, 6, 157–184. [Google Scholar] [CrossRef][Green Version]
- Skogsberg, K.; Clump, M. Do psychology and biology majors differ in their study processes and learning styles? Coll. Stud. J. 2003, 37, 27–33. [Google Scholar]
- Stes, A.; de Maeyer, S.; Van Petegem, P. Examining the Cross-Cultural Sensitivity of the Revised Two-Factor Study Process Questionnaire (R-SPQ-2F) and Validation of a Dutch Version. PLoS ONE 2013, 8, e54099. [Google Scholar] [CrossRef] [PubMed]
- Baeten, M.; Kyndt, E.; Struyven, K.; Dochy, F. Using student-centred learning environments to stimulate deep approaches to learning: Factors encouraging or discouraging their effectiveness. Educ. Res. Rev. 2010, 5, 243–260. [Google Scholar] [CrossRef]
- Xie, Q.; Zhang, L.F. Demographic Factors, Personality, and Ability as Predictors of Learning Approaches. Asia-Pac. Educ. Res. 2015, 24, 569–577. [Google Scholar] [CrossRef]
- Severiens, S.; Dam, G. A multilevel meta-analysis of gender differences in learning orientations. Br. J. Educ. Psychol. 1998, 68, 595–608. [Google Scholar] [CrossRef]
- Rubin, M.; Scevak, J.; Southgate, E.; MacQueen, S.; Williams, P.; Douglas, H. Older Women, Deeper Learning, and Greater Satisfaction at University: Age and Gender Predict University Students’ Learning Approach and Degree Satisfaction. J. Divers. High Educ. 2018, 11, 82–96. [Google Scholar] [CrossRef]
- Gow, L.; Kember, D. Does higher education promote independent learning? High Educ. 1990, 19, 307–322. [Google Scholar] [CrossRef]
- Richardson, J.T.E.; King, E. Adult Students in Higher Education: Burden or Boon? J. Higher Educ. 1998, 69, 65. [Google Scholar] [CrossRef]
- Richardson, J.T.E. Approaches to studying across the adult life span: Evidence from distance education. Learn. Individ. Differ. 2013, 26, 74–80. [Google Scholar] [CrossRef]
- Harper, G.; Kember, D. Approaches to Study of Distance Education Students. Br. J. Educ. Technol. 1986, 17, 212–222. [Google Scholar] [CrossRef]
- Leung, D.Y.P.; Ginns, P.; Kember, D. Examining the Cultural Specificity of Approaches To Learning in Universities in Hong Kong and Sydney. J. Cross Cult. Psychol. 2008, 39, 251–266. [Google Scholar] [CrossRef]
- Biggs, J.B.; Tang, C. Teaching for Quality Learning at University; Open University Press/McGraw-Hill Education: Berkshire, UK, 2007. [Google Scholar]
- Entwistle, N.J.; Tait, H. Approaches to learning, evalutions of teaching, and perferences for contrasting academic environments. High Educ. 1990, 19, 291–299. [Google Scholar] [CrossRef]
- Leung, S.F.; Mok, E.; Wong, D. The impact of assessment methods on the learning of nursing students. Nurse Educ. Today 2008, 28, 711–719. [Google Scholar] [CrossRef] [PubMed]
- Shuell, T.J. Cognitive Conceptions of Learning. Rev. Educ. Res. 1986, 56, 411–436. [Google Scholar] [CrossRef]
- Biggs, J. What the Student Does: Teaching for enhanced learning. High Educ. Res. Dev. 1999, 18, 57–75. [Google Scholar] [CrossRef]
- Berger, J.L.; Karabenick, S.A. Motivation and students’ use of learning strategies: Evidence of unidirectional effects in mathematics classrooms. Learn Instr. 2011, 21, 416–428. [Google Scholar] [CrossRef]
- Onder, I.; Besoluk, S. Adaptation of Revised Two Factor Study Process Questionnaire (R-SPQ-2F) to Turkish. Egit. Bilim Sci. 2010, 35, 55–67. [Google Scholar]
- Zakariya, Y.F. Study approaches in higher education mathematics: Investigating the statistical behaviour of an instrument translated into norwegian. Educ. Sci. 2019, 9, 191. [Google Scholar] [CrossRef]
- Muñoz San Roque, I.; Prieto Navarro, L.; Torre Puente, J.C. Enfoques de aprendizaje, autorregulación, autoeficacia, competencias y evaluación. Un estudio descriptivo de estudiantes de educación infantil y primaria. In Educación y Nuevas Sociedades; Torre Puente, J.C., Ed.; Universidad Pontificia Comillas: Madrid, Spain, 2012; pp. 237–266. [Google Scholar]
- Xie, Q. Validating the Revised Two-Factor Study Process Questionnaire among Chinese University Students. Int. J. Educ. Psychol. 2014, 16, 4–19. [Google Scholar]
- Munshi, F.; Al-Rukban, M.; Al-Hoqail, I. Reliability and validity of an Arabic version of the revised two-factor study process questionnaire R-SPQ-2F. J. Fam. Community Med. 2012, 19, 33. [Google Scholar] [CrossRef]
- Shaik, S.A.; Almarzuqi, A.; Almogheer, R.; Alharbi, O.; Jalal, A.; Alorainy, M. Assessing Saudi medical students learning approach using the revised two-factor study process questionnaire. Int. J. Med. Educ. 2017, 8, 292–296. [Google Scholar] [CrossRef]
- Swee Choo Goh, P. Assessing the Approaches to Learning of Twinning Programme Students in Malaysia. Malays. J. Learn Instr. 2006, 3, 93–115. [Google Scholar]
- Watkins, D. Correlates of approaches to learning: A cross-cultural meta-analysis. In Perspective on Thinking, Learning, and Cognitive Styles; Sternberg, R.J., Zhang, L.F., Eds.; Lawrence Erlbaum Associates: Mahwah, NJ, USA, 2001; pp. 165–195. [Google Scholar]
- Watkins, D. The Approaches to Learning of Australian Tertiary Students: A Replication. High Educ. Res. Dev. 1986, 5, 185–190. [Google Scholar] [CrossRef]
- Jeong, J.S.; González-Gómez, D.; Cañada-Cañada, F. How does a flipped classroom course affect the affective domain toward science course? Interact. Learn. Environ. 2019, 1–13. [Google Scholar] [CrossRef]
- Daniel, W.W. Biostatistics: A Foundation for Analysis in the Health Sciences, 5th ed.; John Wiley & Sons Inc.: New York, NY, USA, 1991; Volume 47, p. 1206. [Google Scholar]
- Wolf, E.J.; Harrington, K.M.; Clark, S.L.; Miller, M.W. Sample Size Requirements for Structural Equation Models. Educ. Psychol. Meas. 2013, 73, 913–934. [Google Scholar] [CrossRef]
- Emilia, O.; Bloomfield, L.; Rotem, A. Measuring students’ approaches to learning in different clinical rotations. BMC Med. Educ. 2012, 12, 114. [Google Scholar] [CrossRef] [PubMed]
- Moulaye M’Hamed Taher, A.; Chen, J.; Yao, W. Key predictors of creative MBA students’ performance. J. Technol. Manag. China 2011, 6, 43–68. [Google Scholar] [CrossRef]
- Tiwari, A.; Chan, S.S.C.; Wong, E.M.Y.; Wong, D.; Chui, C.; Wong, A.; Patil, N.G. The effect of problem-based learning on students’ approaches to learning in the context of clinical nursing education. Nurse Educ. Today 2006, 26, 430–438. [Google Scholar] [CrossRef]
- Dong, N.; Bai, M.; Zhang, H.; Zhang, J. Approaches to learning IFRS by Chinese accounting students. J. Account. Educ. 2019, 48, 1–11. [Google Scholar] [CrossRef]
- Selectividad 2018: Estas Son las Carreras Con las Notas de Corte Más Altas. Available online: https://www.abc.es/sociedad/abci-selectividad-2018-estas-diez-carreras-notas-corte-mas-altas-201806041503_noticia.html (accessed on 4 May 2018).
- Universitat Politècnica de València. Notas de Corte Curso 2018-19. 2018. Available online: http://www.upv.es/pls/oalu/sic_futuroalumno.notascorte?p_idioma=c (accessed on 24 September 2018).
- Richardson, J.T.E. Perceptions of academic quality and approaches to studying among technology students in distance education. Eur. J. Eng. Educ. 2006, 31, 421–433. [Google Scholar] [CrossRef]
- Notas de Corte 2018. El País. 2018. Available online: https://elpais.com/especiales/universidades/titulacion/notas/biotecnologia/36 (accessed on 24 September 2018).
- Fryer, L.K.; Vermunt, J.D. Regulating approaches to learning: Testing learning strategy convergences across a year at university. Br. J. Educ. Psychol. 2018, 88, 21–41. [Google Scholar] [CrossRef]
- Instituto Nacional de Estadística. Mujeres Matriculadas y Egresadas en Enseñanza de Grado y de Primer y segundo Ciclo por Rama de Enseñanza. 2020. Available online: https://www.ine.es/jaxiT3/Datos.htm?t=12722 (accessed on 27 January 2018).
- Vermunt, J.D. Relations between student learning patterns and personal and contextual factors and academic performance. High Educ. 2005, 49, 205–234. [Google Scholar] [CrossRef]
- Chan, Y.K.; Kan, A.C.N. The Interplay between Gender, Learning Approaches and Academic Performance in Chinese Sub-Degree and Degree Students. Glob. J. Educ.Stud. 2017, 3, 10. [Google Scholar] [CrossRef][Green Version]
- Scouller, K. The influence of assessment method on students’ learning approaches: Multiple choice question examination versus assignment essay. High Educ. 1998, 35, 453–472. [Google Scholar] [CrossRef]
- Bobe, B.J.; Cooper, B.J. The effect of language proficiency on approaches to learning and satisfaction of undergraduate accounting students. Account. Educ. 2017, 28, 149–171. [Google Scholar] [CrossRef]
- Hundleby, J.D.; Nunnally, J. Psychometric Theory. Am. Educ. Res. J. 2006, 5, 431. [Google Scholar] [CrossRef]
- Vergara-Hernández, C.; Simancas-Pallares, M.; Carbonell-Muñoz, Z. Psychometric properties of the revised two-factor study process questionnaire r-spq-2f—Spanish version. Duazary 2019, 16, 205–218. [Google Scholar] [CrossRef]
- Vaughan, B. A Rasch analysis of the Revised Study Process Questionnaire in an Australian osteopathy student cohort. Stud. Educ. Eval. 2018, 56, 144–153. [Google Scholar] [CrossRef]
- Martyn, J.; Terwijn, R.; Kek, M.Y.C.A.; Huijser, H. Exploring the relationships between teaching, approaches to learning and critical thinking in a problem-based learning foundation nursing course. Nurse Educ. Today 2014, 34, 829–835. [Google Scholar] [CrossRef]
- López-Aguado, M.; Gutiérrez-Provecho, L. Checking the underlying structure of R-SPQ-2F using covariance structure analysis. Cult. Educ. 2018, 30, 105–141. [Google Scholar] [CrossRef]
- Merino Soto, C.; Kumar Pradhan, R. Validación estructural del R-SPQ-2F: Un análisis factorial confirmatorio. Rev. Digit. Investig. Docencia Univ. 2013, 7, 111–127. [Google Scholar] [CrossRef]
© 2020 by the authors. Licensee MDPI, Basel, Switzerland. This article is an open access article distributed under the terms and conditions of the Creative Commons Attribution (CC BY) license (http://creativecommons.org/licenses/by/4.0/).