Article

Multi-Stage Probabilistic Transmission Expansion Planning Under Generation Uncertainty and N-1 Security Using the Pack-Based Grey Wolf Optimizer

by
Edimar José de Oliveira
1,*,
Lucas Santiago Nepomuceno
1,
Arthur Neves de Paula
2,
Raphael Paulo Braga Poubel
3 and
Leonardo Willer de Oliveira
1
1
Electrical Engineering Department, Federal University of Juiz de Fora, Juiz de Fora 36036-900, MG, Brazil
2
Institute of Technological Sciences, Federal University of Itajubá, Itabira 35903-087, MG, Brazil
3
Department of Electrical Engineering, Federal Center for Technological Education of Minas Gerais (CEFET-MG), Belo Horizonte 30421-169, MG, Brazil
*
Author to whom correspondence should be addressed.
Technologies 2026, 14(6), 329; https://doi.org/10.3390/technologies14060329
Submission received: 29 April 2026 / Revised: 22 May 2026 / Accepted: 25 May 2026 / Published: 28 May 2026
(This article belongs to the Special Issue Innovative Power System Technologies—Second Edition)

Abstract

Multi-Stage Transmission Network Expansion Planning (MS-TNEP) is critical for adapting power grids to long-term renewable integration. However, the simultaneous incorporation of N-1 security, active power losses, and uncertainties regarding the spatial and temporal growth of power generation capacity imposes prohibitive computational complexity. This paper proposes a probabilistic MS-TNEP model evaluated over a 20-year horizon. To overcome this computational intractability, a hybrid decomposition framework is employed. The investment subproblem determines the discrete decisions for network investment via a metaheuristic, while the probabilistic operation subproblem utilizes linear programming to assess the operational feasibility of these decisions under multiple spatial and temporal growth of power generation capacity scenarios, active power losses, and N-1 contingencies. Furthermore, a novel Pack-Based Grey Wolf Optimizer (PBGWO) is introduced. The approach is validated on the Garver and the Southern Brazilian equivalent systems under multiple scenarios for the growth of both wind and conventional power generation capacity. Comparative analysis against the Genetic Algorithm, the standard Grey Wolf Optimizer, and the Whale Optimization Algorithm reveals that PBGWO is a highly competitive approach for MS-TNEP problems, consistently identifying the most cost-effective expansion plan.

1. Introduction

Transmission Network Expansion Planning (TNEP) is the process that determines where and when new equipment should be inserted into the power grid. The central objective is to efficiently connect the generation to the load centers at the lowest investment cost [1]. The definition of this cost and the expansion strategies depend directly on the structure of the power sector. In centralized environments, TNEP seeks to meet demand growth in coordination with generation, minimizing global operation and investment costs. In decentralized markets, the focus is on providing an infrastructure that supports competitive transactions and guaranties the secure power dispatch of multiple agents [2]. Regardless of the market environment, investment decisions vary according to the adopted time frame. Static planning designs the network for a single future scenario, consolidating all interventions in a single step [3]. Multi-stage planning overcomes this simplification by establishing the optimal timing for each project on a subdivided horizon [1].
The modeling of the network defines the mathematical basis of TNEP. Even in DC formulation, planning is already configured as a non-convex Mixed-Integer Non-Linear Programming (MINLP) problem [4]. This intrinsic characteristic arises from the product between discrete investment variables and continuous variables associated with the power flow. Adopting the AC model substantially amplifies this complexity due to the non-linear nature of equations, particularly when evaluating the impacts of active power dissipation in lossy network representations [5,6]. Similarly, the transition to the multi-stage formulation multiplies the problem dimensionality by coupling decisions across multiple stages. To enable the resolution of large-scale systems, the literature frequently employs mathematical linearization and reformulation techniques on AC and DC models [7]. Alternatively, decomposition techniques are used to decouple investment decisions from the operation issue, guaranteeing numerical tractability in network evaluation [8].
The reliability of planning directly impacts the size of mathematical problems. Operational security is commonly ensured by the deterministic N-1 criterion. This technical constraint guaranties uninterrupted demand supply even after isolated failure of any system equipment [9]. Incorporating this premise requires the formulation of multiple post-contingency scenarios. As a result, the number of operational constraints multiplies, and the complexity of the model grows exponentially [10].
The combinatorial explosion driven by security guidelines and temporal multi-stages makes the choice of the solution method a critical step. Exact mathematical optimization approaches often encounter practical convergence limits when evaluating large-scale systems. Given this limitation, the literature is extensively based on metaheuristic techniques [11]. These algorithms perform a robust and efficient exploration of the non-convex search space. They mitigate the risk of premature convergence to local optima and provide high-quality solutions at a tractable computational cost [12].

1.1. Literature Review

The presented literature review is structured based on studies focused on solving the multi-stage TNEP. Articles are classified according to six main criteria. The first criterion is the regulatory framework, which defines the adopted market perspective. In a centralized environment, planning and operational decisions are made by an independent operator. The main objective of this model is to reduce total investment and operation costs systemically, as well as to maintain secure grid operation. In contrast, the deregulated or competitive environment is characterized by an unbundled power sector. In this scenario, generators and transmission investors seek to maximize their individual profits in a competitive market, and the planner must deal with the uncertainties of the decisions of these agents to ensure social welfare. The second criterion evaluates the network model and the horizon, referring to the power flow model used (such as DC, linearized AC, or full AC) and the way the planning time horizon is discretized.
The third criterion addresses how the N-1 security criterion is considered, being divided into three categories. The first category is not considered when planning does not provide security against equipment failures. The second is to check, when a list of circuits undergoing contingency is used, applying the failure to each of these circuits to then evaluate if the system can operate securely. The third is explicit constraint, when the contingency model is treated through a linear formulation and solved directly using commercial solvers. The fourth criterion classifies the work by the treatment of uncertainties, being deterministic when uncertainty is not considered in the optimization process, probabilistic, stochastic, or robust.
The fifth criterion evaluates the topological evolution of the system. The evolution is classified as static when the geographical topology of the loads and generators remains unchanged over the planning horizon, with only the increment of their values from the initial year over the years. On the other hand, the evolution is classified as structurally dynamic when new generators and loads are added, distinguishing the final topology from the initial geometric topology.
Finally, the sixth criterion categorizes the solution method. This is classified as a decomposition when the multi-stage TNEP problem is divided into an investment subproblem and an operation subproblem. This strategy is widely used in the literature, where metaheuristic techniques are traditionally responsible for defining investment plans in the investment subproblem, while classical optimization methods are applied to solve the operation subproblem. The Mixed-Integer Linear Programming (MILP) category covers works where linearizations and reformulations of the original MINLP formulation are used, converting them into linear formulations tractable by classical optimization commercial solvers. In addition, there are methods based purely on the global use of metaheuristics or hybrid methods.
Table 1 summarizes the classification of the reviewed works according to established methodological criteria.
To contextualize the methodological advances proposed in this work, a critical analysis of Table 1 is required. This analysis reveals three recurring limitations and a consistent methodological gap that this paper addresses.
The first limitation concerns the trade-off between economic efficiency and operational security. A significant portion of centralized planning models prioritizes minimizing investment and operating costs but omits the N-1 security criterion to maintain tractability [15,17,18,21,24,25,26]. In contrast, works that do incorporate N-1 contingencies often do so under deterministic assumptions, failing to account for long-term uncertainties [16,22]. For example, [13,16] include N-1 as an explicit constraint, but their analyses are deterministic. The deregulated environment models, while capturing strategic behavior, also tend to treat N-1 in a simplified checking/penalizing manner without coupling it with multi-stage uncertainty [14,27]. This reveals a first gap: few models simultaneously enforce N-1 security criterion while also considering probabilistic long-term uncertainties for both load growth and generation capacity expansion.
The second limitation is the increasing incorporation of uncertainties, but with significant restrictions. Early works used deterministic forecasts [13,15]. More recent studies have moved toward stochastic or robust optimization to handle variability in demand, wind, and solar power [14,17,20,27]. However, in these approaches, the uncertainty is typically treated at the operational level (e.g., hourly or daily variability in renewable output) rather than at the strategic level of generation capacity expansion. The macro-trajectories of where and when new conventional or renewable plants will be built are often assumed as fixed inputs or are not varied across scenarios. This constitutes a second gap: the spatial and temporal uncertainty of the expansion of the generation capacity itself is rarely treated as a set of probabilistic scenarios within the MS-TNEP framework, especially under N-1 contingencies.
The third limitation concerns the evolution of solution methods to handle the inherent complexity. Exact MILP formulations are powerful, but often face scalability issues for large multi-stage problems [16,17]. Consequently, decomposition techniques, where a metaheuristic guides investments and a classical optimizer handles operations, have become dominant [15,19,23,26]. Within this class, the Genetic Algorithm (GA) remains a common benchmark. However, more recent work has explored other algorithms such as PSO [20], Harmony Search [18], and Coati Optimization [26] to improve convergence. Notably, the Grey Wolf Optimizer (GWO) and the Whale Optimization Algorithm (WOA), although they require few parameters and are successful in other power system problems, have seen limited application in MS-TNEP. This defines a third gap: a lack of specialized, high-performance metaheuristics adapted to the discrete, multi-constraint nature of MS-TNEP, leaving room for novel variants like the Pack-Based GWO proposed here.
Together, these recurring limitations point to a consistent finding: no existing MS-TNEP framework simultaneously integrates multi-stage planning, N-1 contingency evaluation, active power losses, and probabilistic generation expansion scenarios. The combinatorial explosion arising from this integration explains its absence in the literature. Addressing this integration gap is the central objective of this article.

1.2. Contributions

To address the methodological gap identified in the literature review regarding Multi-Stage Transmission Network Expansion Planning (MS-TNEP), this work proposes a framework designed to overcome the associated computational barriers, and the specific contributions of this article are as follows:
1.
The formulation of a multi-stage probabilistic TNEP model that simultaneously integrates the iterative calculation of active power losses in the DC network via the fictitious nodal demand method, rigorous N-1 security constraints, and multiple spatial and temporal scenarios for the growth of both wind and conventional power generation capacity.
2.
Applying a hybrid decomposition technique ensures that the computational effort of the proposed model remains feasible. In this method, expansion plans are proposed through a metaheuristic in the investment subproblem, while operational feasibility, power losses, and N-1 criterion checks under multiple scenarios are solved using linear programming in the probabilistic operation subproblem.
3.
The proposal of a novel variant of the Grey Wolf Optimizer, named Pack-Based Grey Wolf Optimizer (PBGWO), aimed at improving the performance, robustness and convergence capacity of the traditional GWO when solving the highly complex MS-TNEP problem.
4.
The adaptation of three originally continuous metaheuristics to the discrete domain to handle the integer variables associated with transmission line investments. These algorithms include the Grey Wolf Optimizer (GWO) [28], and the Whale Optimization Algorithm (WOA) [29].

2. Mathematical Formulation

The mathematical formulation of the problem is presented in Equations (1)–(13). This formulation represents a mixed-integer nonlinear programming (MINLP) problem considering the expansion scenarios of the generation capacity throughout the multi-stage planning horizon.
min t T 1 ( 1 + r ) t ( i , j ) Ω C I C i j · v i j t + t T c K σ c i N C i G · g i t c + C i L S · r i t c
subject to:
t T v i j t 1 ( i , j ) Ω C
y i j t = τ = 1 t v i j τ ( i , j ) Ω C , t T
j Ω i f i j t c + g i t c + r i t c + ( W i t w i t c c u t ) = d i t + 1 2 j Ω i p i j t c l o s s i N , t T , c K
f i j t c = u i j c · B i j ( θ i t c θ j t c ) ( i , j ) Ω E , t T , c K
f i j t c = y i j t · u i j c · B i j ( θ i t c θ j t c ) ( i , j ) Ω C , t T , c K
p i j t c l o s s = R i j ( f i j t c ) 2 ( i , j ) Ω E Ω C , t T , c K
u i j c · F i j max f i j t c u i j c · F i j max ( i , j ) Ω E , t T , c K
y i j t · u i j c F i j max f i j t c y i j t · u i j c · F i j max ( i , j ) Ω C , t T , c K
0 g i t c G i max i N , t T , c K
0 r i t c d i t i N , t T , c K
0 w i t c c u t W i t i N , t T , c K
θ r e f , t c = 0 t T , c K
The objective function defined in (1) minimizes the total expected planning cost, composed of the present value of investments in new lines and the expected operating cost. This includes conventional generation and penalties for load shedding and contingency scenarios.
The constraint (2) establishes the investment limit in candidate lines. The constraint (3) defines the operating state of the candidate line, which couplings the investment decisions temporally.
The constraint (4) represents the system active power nodal balance, incorporating transmission losses and net renewable injection. Constraints (5) and (6) represent the Second Kirchhoff Law for the DC power flow in existing and candidate lines, respectively. The constraint (7) calculates the active ohmic losses in the transmission lines.
Constraints (6) and (7) introduce the products between the binary state variable y i j t and the continuous variable θ i t c , and the strictly quadratic equalities, respectively. This formulation characterizes the full problem as a highly non-convex MINLP (Mixed-Integer Non-Linear Programming) problem intractable by conventional exact methods for large-scale systems, underpinning the need for decomposition methods and metaheuristics.
The constraints (8) and (9) impose the thermal flow limits of existing and candidate lines, respectively. In these equations, the N-1 security criterion is intrinsically modeled by the binary availability parameter u i j c , isolating the failed equipment. Constraints (10)–(12) determine the maximum operational limits for conventional generation dispatch, load shedding, and wind power curtailment. Finally, the constraint (13) establishes the voltage angle in the reference bus of the system.

3. Solution Methodology

To solve the MS-TNEP problem under uncertainties in the spatial and temporal capacity growth of both wind and conventional generation, this work adopts a strategy based on model decomposition. The original problem is partitioned into an investment subproblem guided by metaheuristics and a probabilistic operation subproblem solved by linear programming techniques. This decomposition isolates the combinatorial complexity of construction decisions and bypasses the intrinsic non-linearity of the full model. It is important to note that the integrated mathematical formulation is novel. Specifically, long-term uncertainties in the spatial and temporal capacity growth of both wind and conventional generation are explicitly treated through a discrete set of probabilistic scenarios, which are dynamically coupled with short-term operational constraints. Because the resulting search space and boundary conditions fundamentally differ from existing works, a direct numerical comparison with methodologies from previous papers is unfeasible.
The solution methodology proposed in this work is highly flexible and can be integrated with various metaheuristics, provided that they are properly adapted to handle discrete integer investment variables. Therefore, to conduct a rigorous and fair evaluation, the proposed algorithm is compared with well-consolidated metaheuristics implemented within this exact same decomposition framework. The Genetic Algorithm was selected because it represents the standard benchmark in power system expansion planning. Furthermore, the standard Grey Wolf Optimizer and the Whale Optimization Algorithm were chosen due to their requirement for very few control parameters. This characteristic significantly minimizes tuning bias and ensures a highly replicable comparative analysis.
The objective of this methodology is strictly focused on the multi-stage transmission network routing problem, utilizing established benchmark systems. Instead, the proposed framework is designed to receive generation expansion scenarios as exogenous inputs. In real-world long-term planning, capacity expansion pathways naturally reduce to a discrete set of highly probable macro-trajectories dictated by structural, environmental, and regulatory constraints. Unlike short-term operational studies that require massive random sampling to capture stochastic variability, representing the envelope of extreme investment trajectories through a compact set of expert-driven scenarios is the standard practice for evaluating and validating long-term MS-TNEP models.

3.1. Investment Subproblem

The investment subproblem acts as the master level of optimization. The metaheuristic proposes matrix expansion plans, which uniquely define the line construction schedule. The algorithm aims to navigate the search space by minimizing the solution fitness function, which consolidates the present value of the infrastructure construction cost and the expected operation and penalty cost evaluated in subproblems.

3.1.1. Solution Encoding

The structure of each individual (candidate solution) is defined using the matrix format formulated in (14). Each column of the matrix indicates a stage of the planning horizon (t) and each row represents an expansion candidate corridor (k). The integer variable v k , t defines the number of lines added to the candidate corridor k at stage t. N T is the total number of horizon stages and N C is the total number of candidate corridors.
I n d = v 1 , 1 v 1 , 2 v 1 , N T v 2 , 1 v 2 , 2 v 2 , N T v N C , 1 v N C , 2 v N C , N T

3.1.2. Adaptation for the Discrete Domain

The GWO and WOA metaheuristics were initially proposed to operate inherently in continuous search spaces. Applying these algorithms in the discrete domain of MS-TNEP requires mapping and repairing the decision variables. For this purpose, a strategy is proposed to adapt them to the MS-TNEP. In this strategy, the population of these metaheuristics evolves mathematically in the continuous domain with respect to the structures of their mathematical operators. Immediately before evaluating the fitness objective function, the continuous matrix of each individual is subjected to the procedure consisting of the following two steps.
1.
Discretization: Continuous matrix values are rounded to the nearest integer, applying a lower bound of zero to prevent negative investment decisions.
2.
Physical Constraint Repair: The method verifies the feasibility of expansion per corridor. If the sum of lines built in a corridor over the time horizon exceeds the maximum limit of parallel circuits allowed for that branch, the algorithm iteratively subtracts one unit from a randomly drawn stage among those with active constructions. The process is repeated until the maximum corridor limit is respected.
This repaired individual matrix constitutes the feasible expansion plan evaluated by the probabilistic operation subproblem. To ensure the fluidity and coherence of the metaheuristic spatial search, the continuous value matrix of the individual is carried over across generations, while the repaired discrete matrix is used exclusively for fitness evaluation and leader selection. Although the GA possesses a structure that naturally accommodates discrete search spaces, the physical constraint repair step is still applied to it.

3.2. Probabilistic Operation Subproblem

The probabilistic operation subproblem receives the investment matrix from the master level and updates the network topology for each stage t. Under this topology, a multi-scenario DC Optimal Power Flow (OPF) problem is formulated. The set of evaluated scenarios simultaneously incorporates spatial trajectories for the growth of both wind and conventional power generation capacity, alongside the N-1 security criterion.
Specifically, this methodology considers multiple probabilistic scenarios of generation expansion over a 20-year horizon, discretized into multiple time stages. These prospective generation expansion plans can be obtained a priori through dedicated generation expansion planning studies. The final planning solution must be feasible for all scenarios of growth power generation capacity and N-1 contingencies.
To integrate electrical transmission losses into the linear model, the fictitious nodal injections method is adopted through an iterative DC-OPF executed for each scenario c.
1.
Initialization: The DC-OPF is solved in the first iteration, disregarding the active network losses.
2.
Loss Calculation: With the nodal voltage angles ( θ ) obtained in the current iteration, the active loss in each circuit is calculated by P l o s s e s , i j = g i j ( θ i θ j ) 2 , where g i j is the line conductance.
3.
Nodal Balance Update: The active loss of each circuit is divided equally and inserted as an additional fictitious load on the sending bus i and the receiving bus j.
4.
Convergence: The DC-OPF is executed again with the updated demand vector. The iterative process ends when the variation in total system losses between consecutive iterations is less than a predefined tolerance.
The mathematical feasibility of the nodal balance against congestion and severe scenarios is guaranteed by inserting slack variables into the model. Load shedding is represented by fictitious generators located in load buses, while renewable generation curtailment is modeled by fictitious demands at buses with installed renewable capacity.
The N-1 contingency is evaluated by zeroing the transmission capacity limit and the susceptance of the respective failed line in the analyzed scenario. If flow reconfiguration requires the dispatch of slack variables, its occurrence and volume of penalties are recorded.
Fitness is calculated by the sum of the investment cost of the proposed grid with the total expected operating cost, which includes conventional dispatch and load shedding weighted by the probability of occurrence of all scenarios c K .

3.3. Pack-Based Grey Wolf Optimizer (PBGWO)

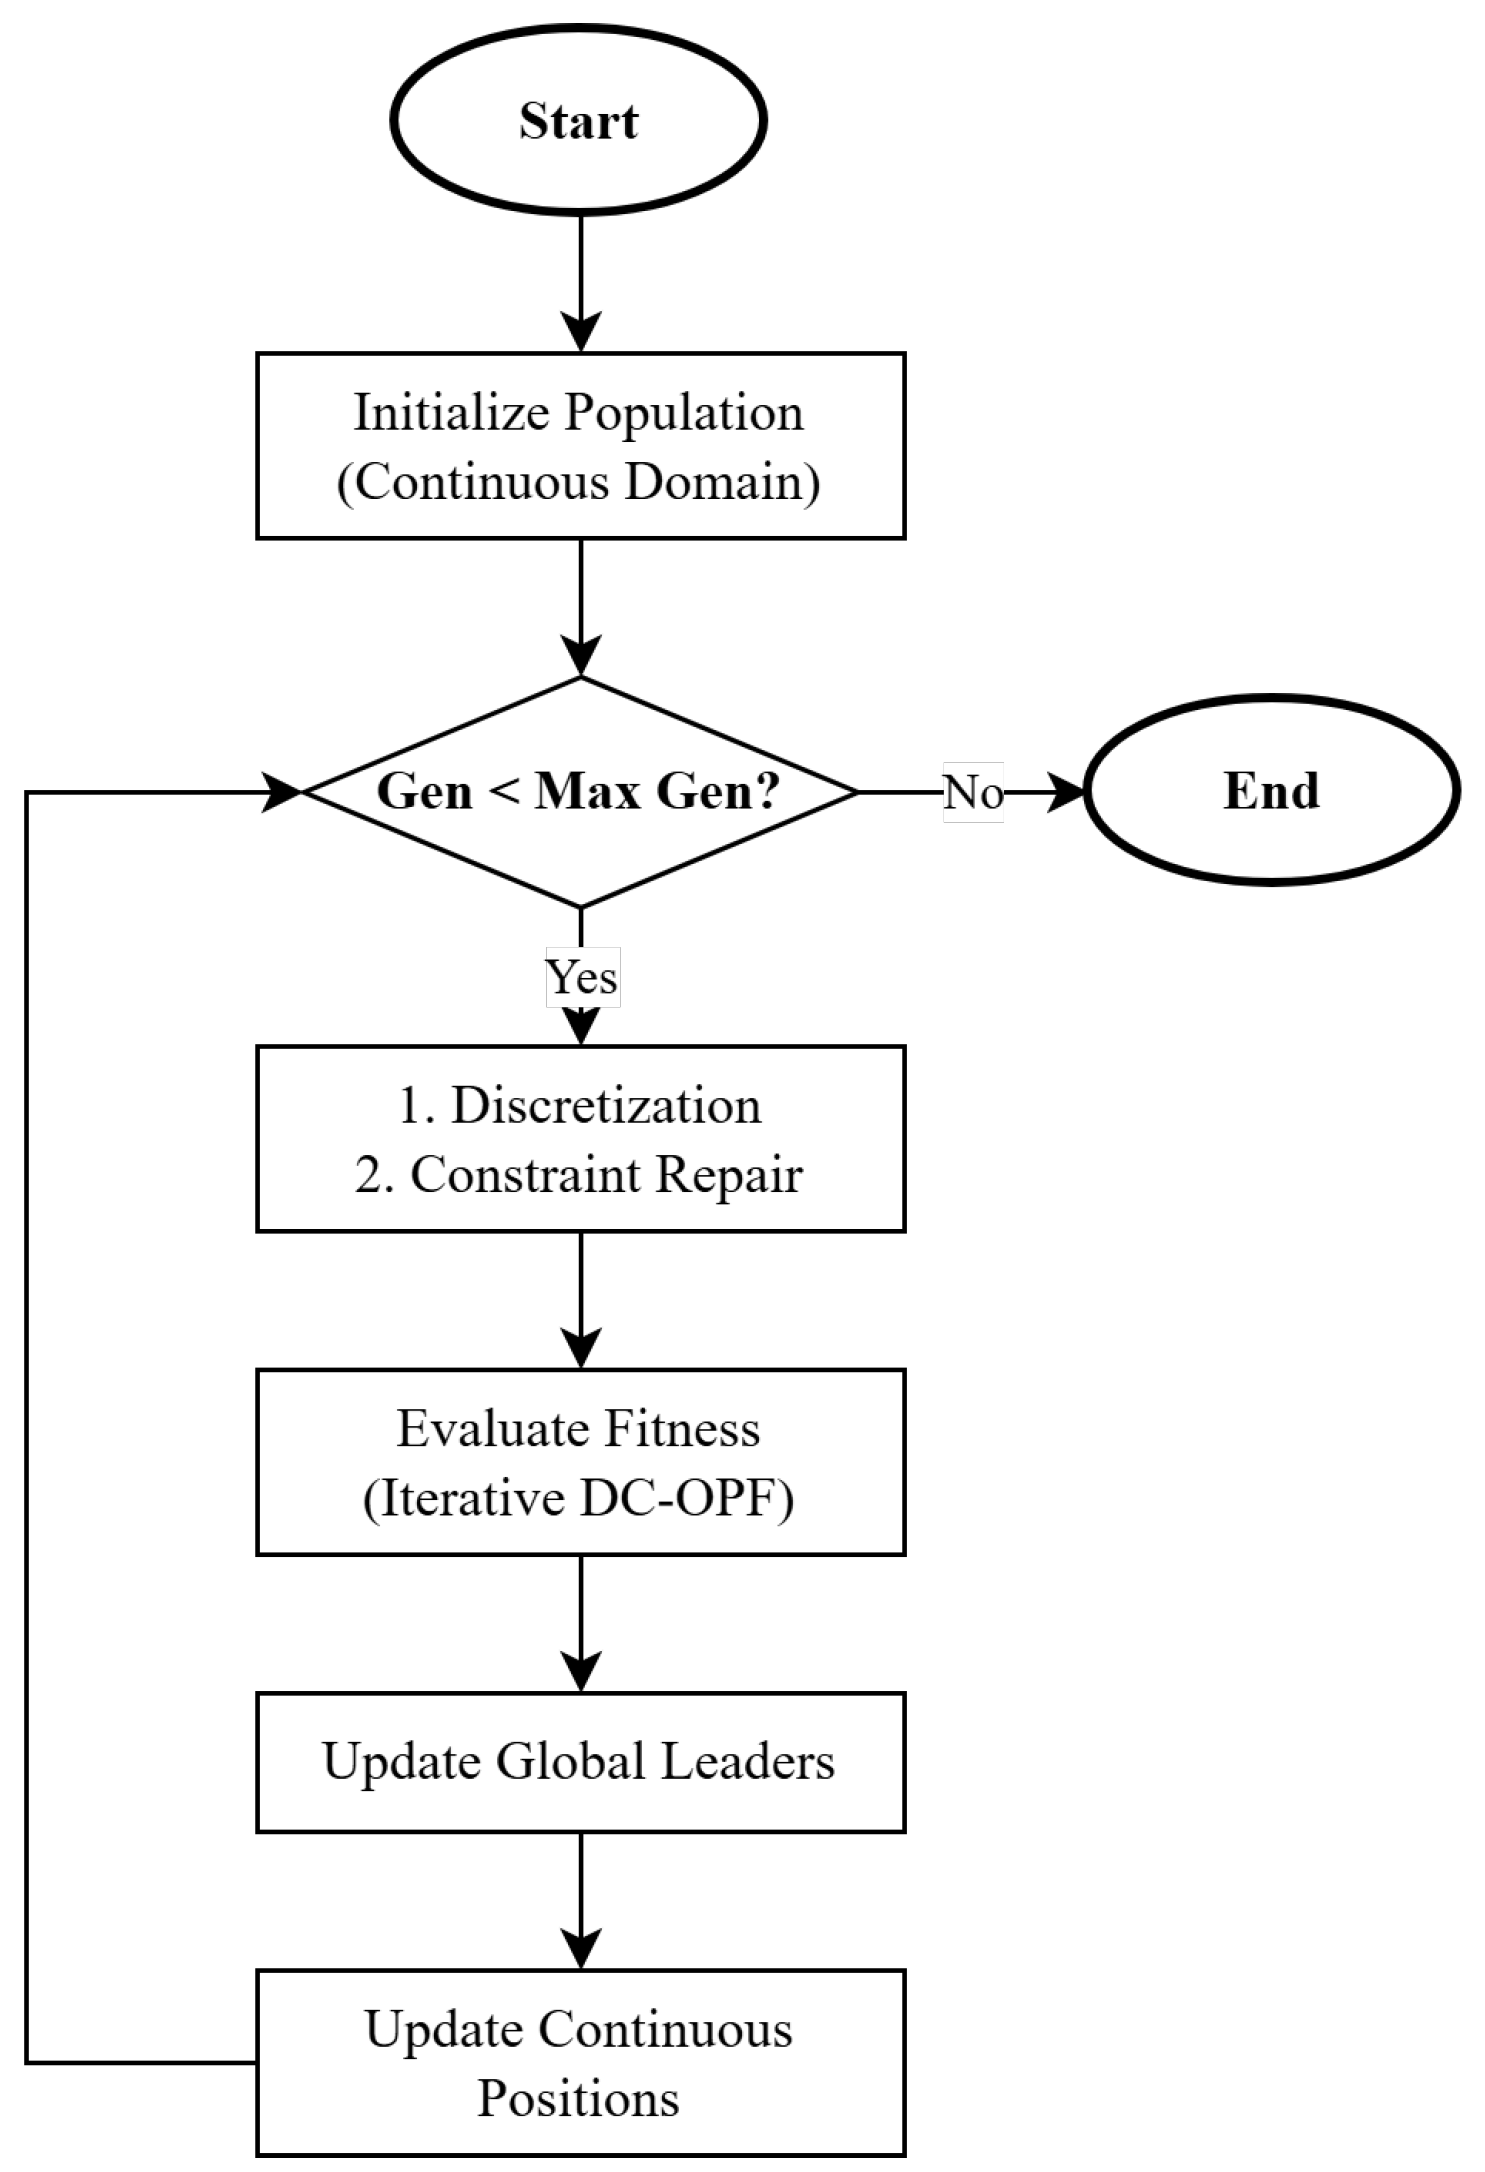
The standard Grey Wolf Optimizer establishes a single social hierarchy in which the entire population follows a set of global leaders, as illustrated in Figure 1. This centralized mathematical approach can lead to premature convergence when evaluating highly non-convex and multimodal search spaces such as the multi-stage TNEP. To overcome this limitation and enhance the global search capability, this work proposes a modification named Pack-Based Grey Wolf Optimizer.
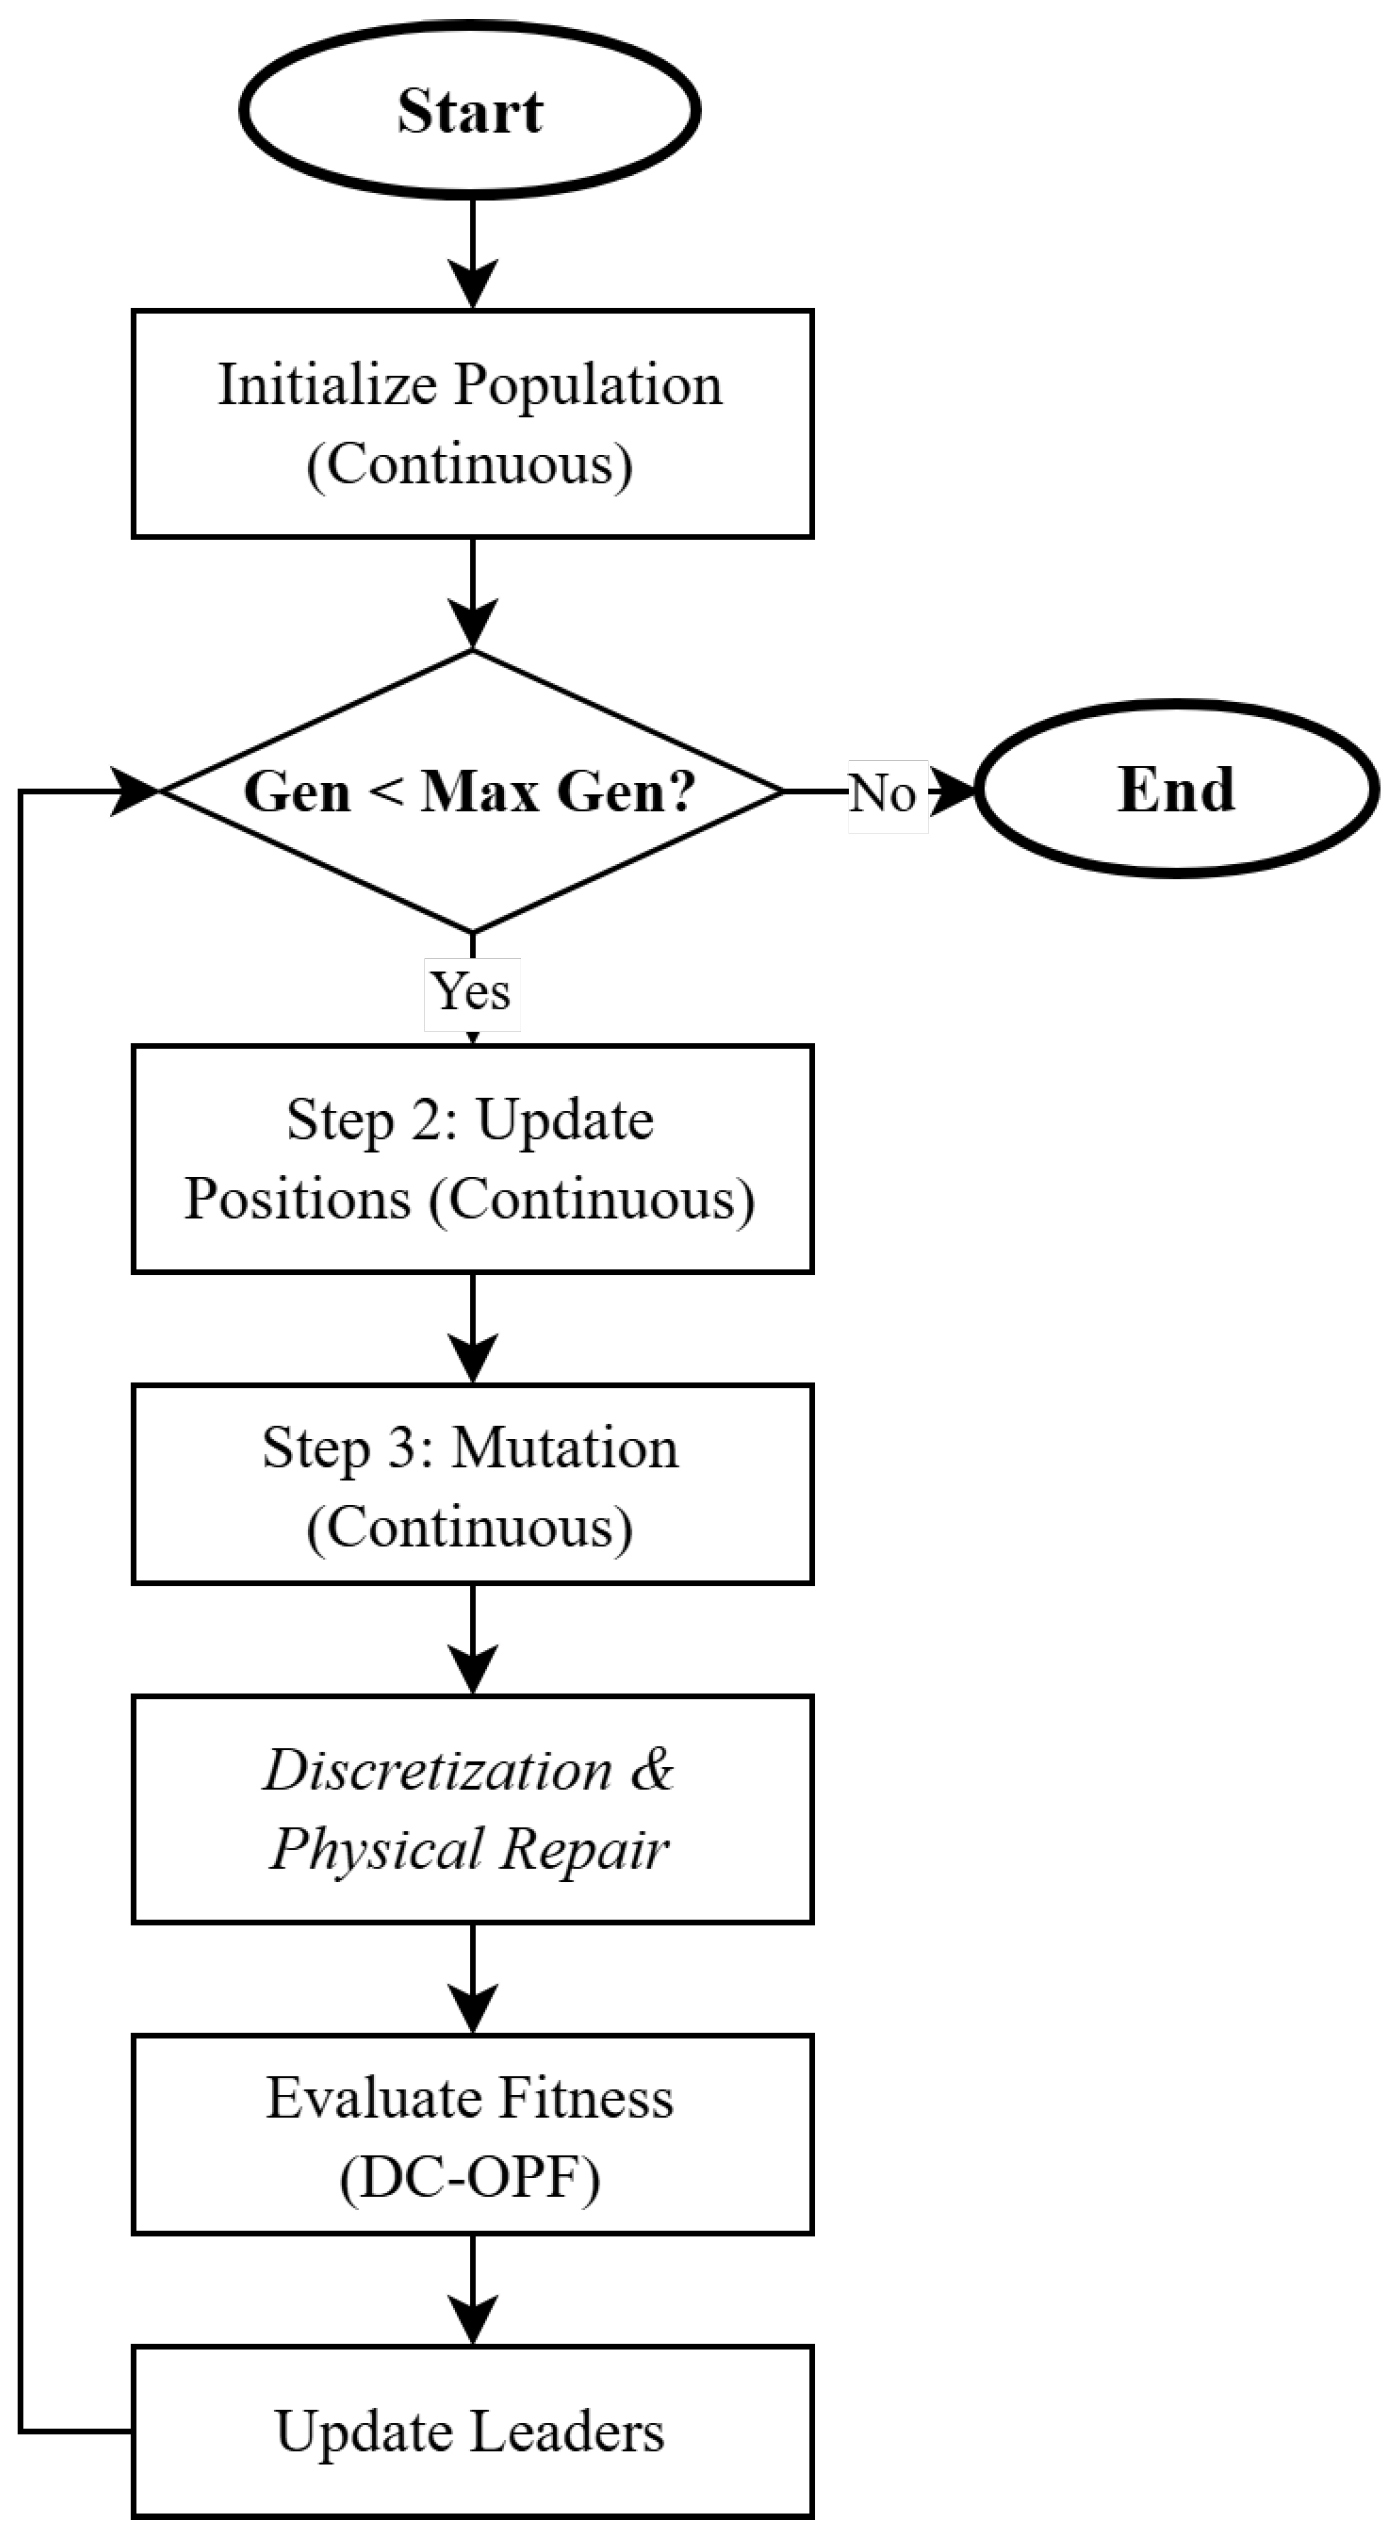
The PBGWO introduces a parallel exploration mechanism by dividing the population into multiple independent packs. This structural change allows the algorithm to explore different regions of the discrete search space simultaneously. The methodology incorporates three main operational stages into the standard evolutionary cycle.
1.
Multi-Stage Population Clustering: At the beginning of each generation, the continuous population is partitioned into distinct packs using the K-means clustering algorithm. The number of packs is defined proportionally to the population size. If spatial diversity is insufficient for the convergence of K-means, the algorithm automatically applies a uniform random distribution as a safety fallback to maintain the structures of the packet.
2.
Local Leadership and Movement: Fitness of all individuals is evaluated to identify the Alpha, Beta, and Delta leaders exclusively within each specific pack. The position update of each wolf is then calculated based only on the leaders of its respective pack rather than the global leaders. This creates multiple parallel search fronts. If a pack temporarily lacks a local leader, the best global solution guides its members to ensure continuous evolution.
3.
Mutation Operator: To preserve genetic diversity and prevent stagnation within isolated packs, a mutation mechanism is applied. A predefined percentage of the population is randomly selected in each generation. For these individuals, a fraction of their matrix decision variables undergoes random perturbation while strictly respecting the maximum upper bounds of the candidate corridors.
After the movement and mutation stages, the new continuous positions generated by the PBGWO undergo the same formatting procedure detailed in Section 3.1.2. Continuous values are discretized, and the physical constraints of the corridors are fixed. This ensures that all expansion plans evaluated remain physically feasible before being submitted to the operational subproblem. The complete flowchart of the proposed PBGWO is presented in Figure 2.

4. Case Studies and Results

In this section, the proposed optimization methodology is evaluated using two widely established benchmarks in the TNEP literature to ensure the replicability of this study: the Garver system and the Southern-Brazilian equivalent system. While the Garver system serves as a consolidated environment for algorithmic proof-of-concept, the Southern-Brazilian equivalent system provides a highly complex topology to effectively test the scalability and robustness of the model. The simulations for each network are divided into two progressive case studies. Specifically, Case I evaluates the system under normal operation, whereas Case II incorporates the rigorous N-1 security criterion. The complete data for the test systems utilized in this study is available in [30].
All computational simulations were conducted on a computer with an Intel Core i7 processor (2.7 GHz), and the algorithms were implemented in the MATLAB R2016a® software. Due to the difference in topological dimensionality and combinatorial complexity of the problems, the search parameters were adjusted according to the system. The algorithmic parameters were configured with a population of 100 individuals for both cases, adopting a stopping criterion of 200 generations for the Garver system and 500 generations for the Southern-Brazilian equivalent system. To attest to robustness and allow statistical analysis, 10 independent simulations were performed for each metaheuristic.
Regarding GA operating as a methodological reference in this work, the population evolution is based on the traditional operators of selection, crossover, mutation, and elitism. Specifically, the algorithm was parameterized with an 80% crossover rate, a fixed 1% mutation rate in genes (matrix decision variables), and 10% elitism. The selective pressure operated via the tournament method.

4.1. Garver System

The Garver system, proposed in [31], consists of 6 buses, 6 existing circuits in the base topology, and 15 candidate expansion corridors, allowing a maximum installation of five parallel circuits per branch. The Garver system is adapted in this article to evaluate multi-stage planning under uncertainty of expansion of the generation capacity. The time horizon is extended to 20 years, discretized into 10-year intervals. The model incorporates the expansion of wind farms mapped into four equiprobable prospective scenarios ( σ c = 0.25 ). Additionally, the demand is scaled over time, starting from 760 MW in year 0 and reaching 1520 MW in year 20. Table 2 details the expansion schedule in cumulative megawatts for each probabilistic scenario.
Table 3 and Table 4 detail the step-wise construction schedules representing the best cost-benefit investment plans obtained by each metaheuristic for Case I and Case II, respectively. In Case I, both PBGWO and GWO successfully converged to the identical optimal route, achieving an investment cost of US$ 211.63 million. Similarly, in Case II, the PBGWO and GWO converged to the same optimal solution, with an investment cost of US$ 234.88 million. The impact of the N-1 contingency analysis is clearly noticeable, driving a proportional increase in the expansion requirements to ensure systemic reliability under failure states.
Table 5 presents the comprehensive statistical performance of the metaheuristics in solving the Garver system. To ensure the reliability of the comparative analysis, the Wilcoxon rank-sum test was employed. The Wilcoxon test is a non-parametric statistical hypothesis test used to determine whether two independent samples originate from the same distribution. In this study, the test assesses whether the performance difference between the proposed PBGWO and the other algorithms is statistically significant. A p-value lower than the significance level ( α = 0.05 ) indicates that the superiority of the proposed algorithm is not due to stochastic chance but represents a consistent improvement in navigating the search space. Furthermore, the non-parametric Cliff’s Delta ( δ ) is calculated to quantify the magnitude of this performance difference. While the p-value confirms statistical significance, the Cliff’s Delta measures the degree of overlap between the two sets of results, bounded between −1 and 1. A magnitude closer to 1 indicates absolute stochastic dominance, meaning the proposed algorithm consistently outperforms the comparative method without performance overlap, whereas a value near zero indicates indistinguishable distributions. The effect size is classified as large when | δ | 0.474 .
The results in Case I (N-0) show that the proposed PBGWO exhibited significantly higher robustness, with a standard deviation of 6.68 compared to 36.41 for the standard GWO. This consistency is statistically confirmed by the Wilcoxon test ( p = 1.08 × 10 2 ) and a “Large” effect size (Cliff’s δ = 0.67 ). For Case II (N-1), the inclusion of contingency constraints increased the system costs and the problem complexity. Under these conditions, PBGWO maintained its superior stability, achieving the lowest average cost (237.25 MM US$) and lowest standard deviation. Regarding the other metaheuristics, GA and WOA presented elevated standard deviations, particularly in Case II, where the WOA identified the highest-cost expansion plan (1292.70 MM US$) across its 10 independent runs. The perfect stochastic dominance of PBGWO over GA and WOA is verified by the maximum Cliff’s δ of 1.00 and p-values in the order of 10 4 .
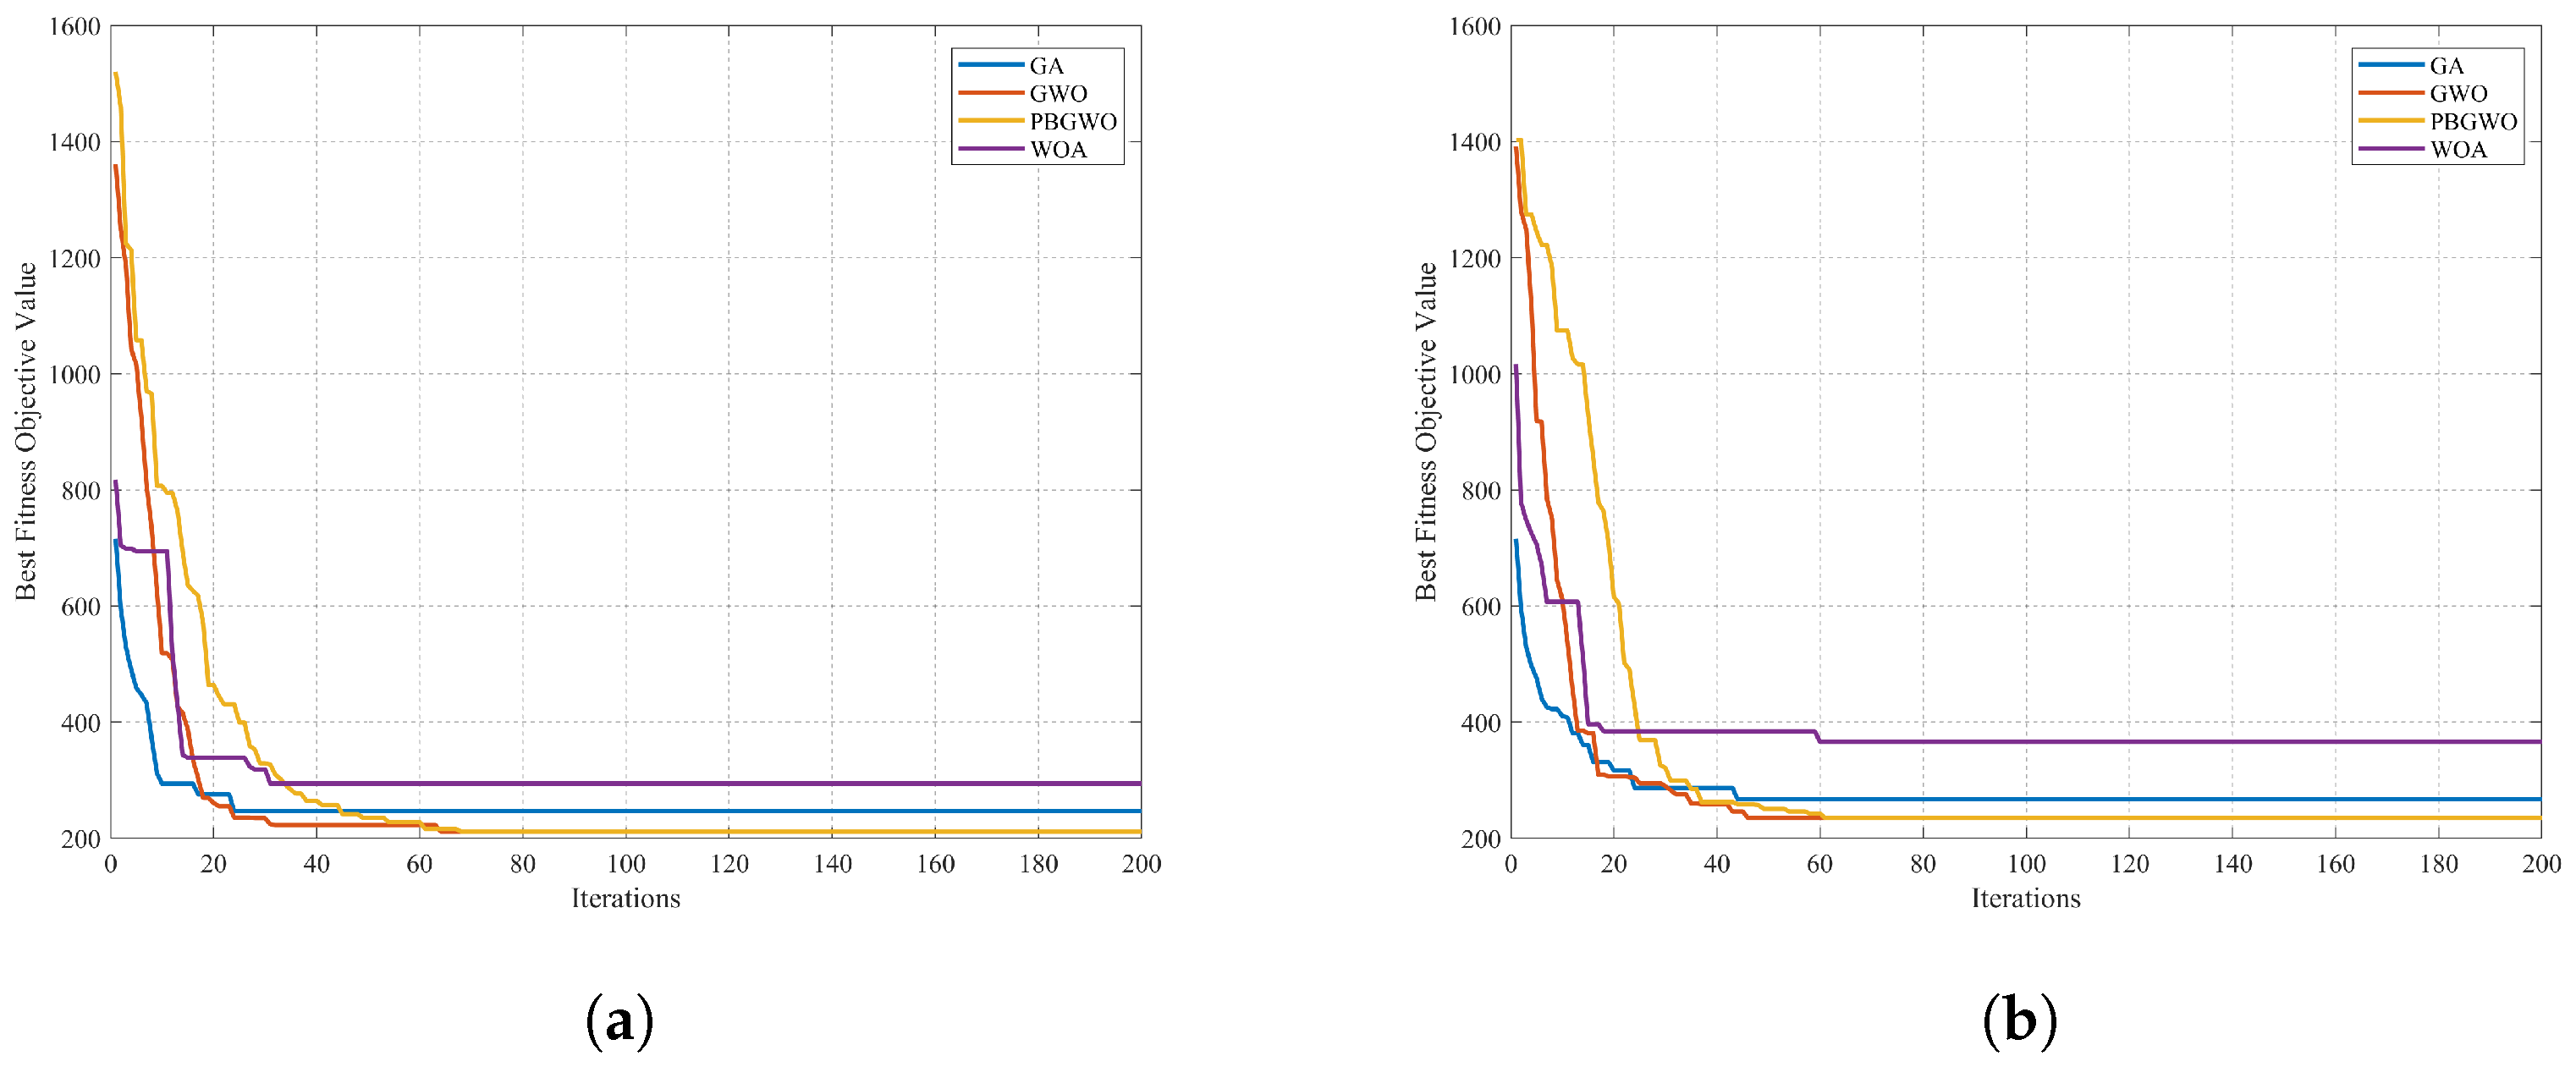
The convergence performance of the evaluated metaheuristics for the Garver system is illustrated in Figure 3. Specifically, Figure 3 presents the convergence profile for the base case without contingencies, whereas Figure 3 illustrates the scenario incorporating the N-1 security criterion. In both cases, the algorithms converged to their best solutions around the 70th iteration.

4.2. Southern-Brazilian Equivalent System

The second test system represents an equivalent of the National Interconnected System (SIN) of the southern region of Brazil. This topology comprises 46 buses, 62 circuits in the base network, and 79 candidate corridors, allowing the installation of up to two parallel circuits per branch. The inherent complexity of this network makes it a suitable benchmark to evaluate the effectiveness and computational scalability of the proposed methodologies.
Similarly to the previous test system, the Southern-Brazilian equivalent system was adapted to assess multi-stage planning under uncertainty over generation capacity expansion. The time horizon spans 20 years, discretized into 10-year intervals. The model incorporates a massive expansion of wind farms mapped into four equiprobable prospective scenarios ( σ c = 0.25 ). Additionally, total demand continuously increases over the planning horizon, starting from a base load of 2059.47 MW at the initial stage (year 0), scaling to 4118.94 MW in year 10 and culminating at 6864.90 MW in year 20. The detailed step-wise increase in the generation capacity for both conventional and wind sources across the different scenarios is presented through dedicated tables in the results section.
Case II (N-1 Security) introduces the most complex formulation in this study, forcing the algorithm to propose an expansion schedule capable of overcoming severe failures in the critical set of lines {19-21, 32-43, 19-32, 46-19 and 46-16}, following a methodology similar to [19]. Table 6 details the cumulative expansion schedule of the megawatt generation capacity for each probabilistic scenario formulated.
Table 7 and Table 8 detail the step-wise construction schedules proposed by the metaheuristics for Case I and Case II, respectively. Given the vast search space of the Southern-Brazilian equivalent system, each algorithm converged to unique spatial configurations, highlighting the multi-modal nature of the MS-TNEP.
Table 9 summarizes the statistical performance of the metaheuristics in both evaluated cases. In Case I, the proposed PBGWO identified the expansion plan with the lowest investment cost, at US$ 19.66 million, significantly outperforming the GWO, which achieved US$ 22.43 million, and the GA, at US$ 23.03 million. Furthermore, PBGWO exhibited the highest consistency, obtaining the lowest standard deviation of US$ 2.08 million among all competing algorithms.
In Case II, the GA identified the expansion plan with the lowest investment cost (US$ 61.73 million), while the PBGWO reached a best solution of US$ 65.84 million. However, an analysis of average performance reveals that PBGWO maintained strong statistical consistency, with an average cost of US$ 71.89 million and a low standard deviation of US$ 4.96 million. In contrast, GA exhibited high variance (a standard deviation of US$ 19.06 million) and a significantly worse average cost (US$ 94.23 million). This indicates that while the GA occasionally found a marginally lower minimum due to its high search variance, the PBGWO reliably converged to high-quality solutions across independent runs. Finally, the WOA struggled significantly with the high dimensionality of the problem, presenting the worst overall performance.
To statistically validate these observations, the non-parametric Wilcoxon rank-sum test and Cliff’s Delta effect size were applied to results obtained for the Southern-Brazilian equivalent system. For Case I, the PBGWO demonstrated statistically significant superiority over all comparative algorithms ( p < 0.05 ), presenting a “Large” effect size in all pairwise comparisons, including absolute stochastic dominance ( δ = 1.00 ) against the WOA. In Case II, despite the GA finding a lower absolute minimum in a single execution, the Wilcoxon test mathematically confirms the overall dominance of the proposed PBGWO. The performance distribution of PBGWO was significantly superior to both GA ( p = 3.61 × 10 3 , δ = 0.78 ) and GWO ( p = 3.76 × 10 2 , δ = 0.56 ).
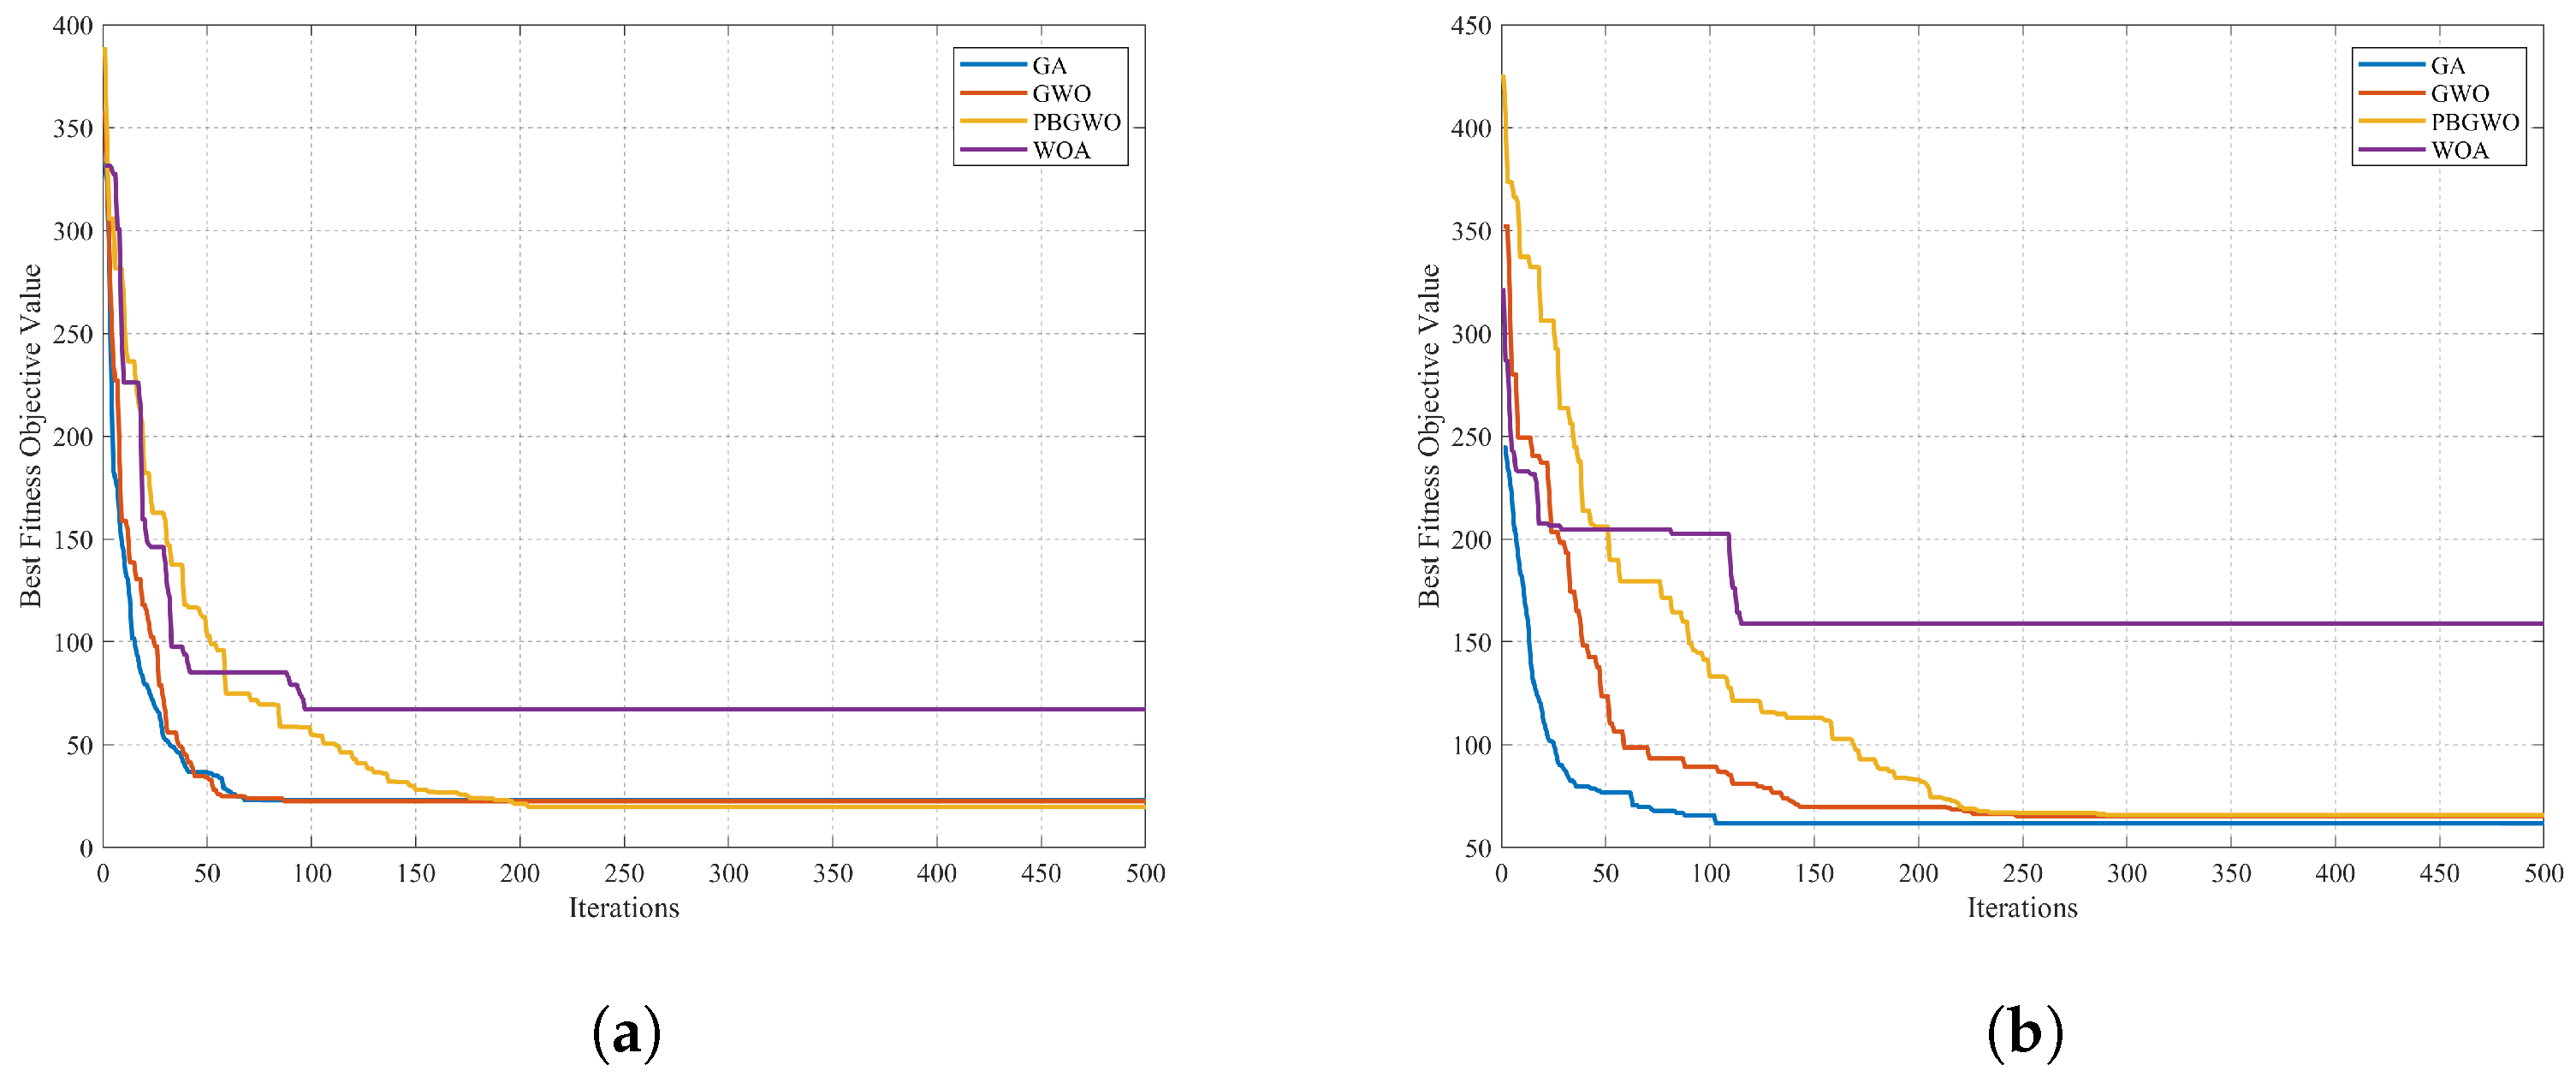
The convergence performance of the evaluated meta-heuristics for the Southern-Brazilian equivalent system is illustrated in Figure 4. Figure 4a presents the convergence profile for the base case without contingencies, while Figure 4b illustrates the scenario incorporating the N-1 security criterion. In both cases, the algorithms converged to their best solutions around the 70th iteration.

5. Conclusions

This paper presented a framework for Multi-Stage Transmission Expansion Planning (MS-TNEP). The proposed model coordinates long-term transmission investments over a 20-year horizon, incorporating uncertainties under spatial and temporal growth of power generation capacity scenarios, active power losses, and N-1 security constraints. To manage the computational complexity of this mixed-integer non-linear formulation, a hybrid decomposition strategy was employed, separating the combinatorial investment decisions from the linear operational feasibility checks.
To solve the investment subproblem, a Pack-Based Grey Wolf Optimizer (PBGWO) was introduced. Its performance was evaluated against standard metaheuristics (GWO, GA and WOA) using the Garver and Southern-Brazilian equivalent systems. Given that metaheuristics cannot guarantee global optimality, the evaluation focused on the quality of the best-found solutions and the statistical consistency of the algorithms over multiple independent runs.
The computational results confirm that the PBGWO is a competitive algorithm for complex MS-TNEP problems. In the Garver system, the PBGWO consistently achieved the minimum costs and the lowest average costs in both N-0 and N-1 scenarios. In the Southern-Brazilian equivalent system, the PBGWO maintained statistical superiority ( p < 0.05 in all Wilcoxon tests). Although the GA identified a slightly lower minimum cost in the strictly constrained N-1 scenario for the Southern-Brazilian equivalent system, at US$ 61.73 million versus the US$ 65.84 million achieved by the PBGWO, the PBGWO proved more reliable across independent runs. Specifically, the PBGWO delivered the lowest average execution cost (US$ 71.89 million) and minimized the standard deviation to US$ 4.96 million, outperforming the GWO (US$ 15.90 million), GA (US$ 19.06 million), and WOA (US$ 48.86 million). These metrics indicate that the PBGWO effectively navigates the combinatorial search space, ensuring consistent convergence to feasible solutions under severe security constraints.
The practical implications of the proposed MS-TNEP framework are directly related to overcoming the computational limitations of traditional planning tools. Technologically, by integrating multi-stage planning, active power losses, and N-1 contingency evaluations into a single tractable model, the framework provides system operators with expansion schedules that guarantee operational security without oversimplifying network physical constraints. Economically, the hybrid decomposition strategy efficiently solves the inherent combinatorial explosion, providing cost-effective long-term investment pathways. Furthermore, the ability to process stochastic scenarios for the spatial expansion of wind and conventional generation ensures that the planned transmission network can safely accommodate new capacity, mitigating the risk of operational bottlenecks.

Future Works

In summary, the integration of the hybrid decomposition method with PBGWO provides a scalable approach to multi-stage grid planning, accommodating generation uncertainties and security constraints. Future research will focus on integrating Energy Storage Systems (ESS) to defer transmission investments and employing full AC power flow models to assess reactive power support and voltage stability within the multi-Stage planning horizon.

Author Contributions

Conceptualization L.S.N. and E.J.d.O.; methodology, L.S.N., A.N.d.P., E.J.d.O. and R.P.B.P.; software, L.S.N.; validation, L.S.N., A.N.d.P., E.J.d.O., L.W.d.O. and R.P.B.P.; formal analysis, L.S.N. and E.J.d.O.; investigation, L.S.N. and E.J.d.O.; data curation, L.S.N., A.N.d.P., E.J.d.O., L.W.d.O. and R.P.B.P.; writing—original draft preparation, L.S.N.; writing—review and editing, L.S.N., A.N.d.P., E.J.d.O., L.W.d.O. and R.P.B.P.; visualization, L.S.N., A.N.d.P., E.J.d.O., L.W.d.O. and R.P.B.P.; supervision, E.J.d.O.; project administration, E.J.d.O. All authors have read and agreed to the published version of the manuscript.

Funding

This research received no external funding.

Institutional Review Board Statement

Not applicable.

Informed Consent Statement

Not applicable.

Data Availability Statement

The original contributions presented in this study are included in the article. Further inquiries can be directed to the corresponding author.

Acknowledgments

The authors gratefully acknowledge the Coordination for the Improvement of Higher Education Personnel (CAPES), the National Council for Scientific and Technological Development (CNPq) and the Minas Gerais State Agency for Research and Development (FAPEMIG). The authors used Deepseek and Gemini for the purposes of English polishing. The authors have reviewed and edited the output and take full responsibility for the content of this publication.

Conflicts of Interest

The authors declare no conflicts of interest.

Nomenclature

Indices
tStage of the planning horizon (year).
i , j Buses of the power system.
r e f Reference bus of the power system.
cOperating or contingency scenario.
Variables
v i j t Binary investment decision variable for the candidate line i j in stage t.
y i j t Binary state variable indicating the availability of the candidate line i j in stage t.
g i t c Active power dispatched by the conventional generator at bus i, in stage t and scenario c (MW).
r i t c Active power load shedding at bus i, in stage t and scenario c (MW).
w i t c c u t Active power renewable generation curtailment at bus i, in stage t and scenario c (MW).
f i j t c Active power flow through line i j , in stage t and scenario c (MW).
p i j t c l o s s Active power losses in line i j , in stage t and scenario c (MW).
θ i t c Voltage phase angle at bus i, in stage t and scenario c (radians).
Parameters
I C i j Investment cost of the candidate line in corridor i j ($).
rAnnual discount rate (%).
C i G Conventional power generation cost at bus i ($/MW).
C i L S Penalty cost for load shedding at bus i ($/MW).
σ c Probability of occurrence of scenario.
d i t Load demand at bus i in stage t (MW).
W i t Renewable generation capacity (wind) available at bus i in stage t (MW).
B i j Susceptance of the transmission line between buses i and j (pu).
R i j Resistance of the transmission line between buses i and j (pu).
F i j max Thermal capacity limit of the line in corridor i j (MW).
G i max Maximum conventional generation capacity available at bus i (MW).
u i j c Binary parameter indicating the operational availability of line i j in scenario c (1 if available, 0 if in failure).
Sets
T Set of stages of the planning horizon.
N Set of buses of the power system.
K Set of operating or contingency scenarios.
Ω E Set of corridors with existing transmission lines.
Ω C Set of corridors with candidate transmission lines.
Ω i Set of buses adjacent to bus i.

References

  1. Cao, S.; Bukhsh, W. A review of evolving challenges in transmission expansion planning problems. IEEE Access 2025, 13, 39964–39981. [Google Scholar] [CrossRef] [Scilit]
  2. Gomes, P.V.; Saraiva, J.T. State-of-the-art of transmission expansion planning: A survey from restructuring to renewable and distributed electricity markets. Int. J. Electr. Power Energy Syst. 2019, 111, 411–424. [Google Scholar] [CrossRef] [Scilit]
  3. Hong, L.; Wang, G.; Bai, R. A particle swarm optimization-based ensemble metaheuristic for long-term transmission network expansion planning. Appl. Soft Comput. 2025, 179, 113282. [Google Scholar] [CrossRef] [Scilit]
  4. Wu, K.; Tanneau, M.; Van Hentenryck, P. Strong mixed-integer formulations for transmission expansion planning with FACTS devices. Electr. Power Syst. Res. 2024, 235, 110695. [Google Scholar] [CrossRef] [Scilit]
  5. Emdadi, K.; Pirouzi, S. Benders Decomposition-Based Power Network Expansion Planning According to Eco-Sizing of High-Voltage Direct-Current System, Power Transmission Cables and Renewable/Non-Renewable Generation Units. IET Renew. Power Gener. 2025, 19, e70025. [Google Scholar] [CrossRef] [Scilit]
  6. García-Mercado, J.I.; Gutierrez-Alcaraz, G.; Gonzalez-Cabrera, N.; Hinojosa, V.H. AC security-constrained transmission network expansion planning problem using an improved binary particle swarm optimization. Electr. Power Syst. Res. 2025, 241, 111297. [Google Scholar] [CrossRef] [Scilit]
  7. Boruni, M.; Torabi, M.; Latify, M.A.; Yousefi, G.R.; Aghaei, J. Critical contingencies-aware conic AC transmission network expansion and reactive power co-planning. Sustain. Energy Grids Netw. 2025, 44, 101960. [Google Scholar] [CrossRef] [Scilit]
  8. Morquecho, E.G.; Torres, S.P.; Astudillo-Salinas, F.; Ergun, H.; Van Hertem, D.; Castro, C.A.; Blum, C. Comparison of an Improved Metaheuristic and Mathematical Optimization Based Methods to Solve the Static AC TNEP Problem. IEEE Trans. Power Syst. 2023, 39, 3240–3256. [Google Scholar] [CrossRef] [Scilit]
  9. Huanca, D.H.; Falcão, D.M.; Bento, M.E. Transmission Expansion Planning Considering Storage, Flexible AC Transmission System, Losses, and Contingencies to Integrate Wind Power. Energies 2024, 17, 1777. [Google Scholar] [CrossRef] [Scilit]
  10. Shahzad, U. A review of challenges for security-constrained transmission expansion planning. J. Electr. Eng. Electron. Control Comput. Sci. 2020, 7, 21–30. [Google Scholar]
  11. Ndlela, N.W.; Moloi, K.; Kabeya, M. Comprehensive analysis of approaches for transmission network expansion planning. IEEE Access 2024, 12, 195778–195815. [Google Scholar] [CrossRef] [Scilit]
  12. Vilaca, P.; Oliveira, L.; Saraiva, J. A congestion-based local search for transmission expansion planning problems. Swarm Evol. Comput. 2023, 83, 101422. [Google Scholar] [CrossRef] [Scilit]
  13. Fan, H.; Cheng, H.Z. Multistage transmission network expansion planning in competitive electricity market based on bi-level programming method. Eur. Trans. Electr. Power 2011, 21, 1719–1730. [Google Scholar] [CrossRef] [Scilit]
  14. Maghouli, P.; Hosseini, S.H.; Buygi, M.O.; Shahidehpour, M. A scenario-based multi-objective model for multi-stage transmission expansion planning. IEEE Trans. Power Syst. 2010, 26, 470–478. [Google Scholar] [CrossRef] [Scilit]
  15. Gallego, L.A.; Rider, M.J.; Lavorato, M.; Paldilha-Feltrin, A. An enhanced genetic algorithm to solve the static and multistage transmission network expansion planning. J. Electr. Comput. Eng. 2012, 2012, 781041. [Google Scholar] [CrossRef] [Scilit]
  16. Macedo, L.H.; Montes, C.V.; Franco, J.F.; Rider, M.J.; Romero, R. MILP branch flow model for concurrent AC multistage transmission expansion and reactive power planning with security constraints. IET Gener. Transm. Distrib. 2016, 10, 3023–3032. [Google Scholar] [CrossRef] [Scilit]
  17. Qiu, T.; Xu, B.; Wang, Y.; Dvorkin, Y.; Kirschen, D.S. Stochastic multistage coplanning of transmission expansion and energy storage. IEEE Trans. Power Syst. 2016, 32, 643–651. [Google Scholar] [CrossRef] [Scilit]
  18. de Oliveira, L.E.; Freitas, F.D.; da Silva, I.C., Jr.; Gomes, P.V. Dynamic and static transmission network expansion planning via harmony search and branch & bound on a hybrid algorithm. In Proceedings of the EPIA Conference on Artificial Intelligence; Springer: Berlin/Heidelberg, Germany, 2017; pp. 271–282. [Google Scholar]
  19. Poubel, R.; De Oliveira, E.; Manso, L.; Honório, L.; Oliveira, L. Tree searching heuristic algorithm for multi-stage transmission planning considering security constraints via genetic algorithm. Electr. Power Syst. Res. 2017, 142, 290–297. [Google Scholar] [CrossRef] [Scilit]
  20. Zhang, L.; Zhou, Q.; Gao, Q.; Cheng, H.; Zhang, S. Multistage fuzzy-robust transmission network expansion planning under uncertainties. Int. Trans. Electr. Energy Syst. 2019, 29, e12054. [Google Scholar] [CrossRef] [Scilit]
  21. Khardenvis, M.D.; Pande, V.N. Optimal static and dynamic transmission network expansion planning. Evol. Syst. 2020, 11, 1–14. [Google Scholar] [CrossRef] [Scilit]
  22. Das, S.; Verma, A.; Bijwe, P. Efficient multi-year security constrained AC transmission network expansion planning. Electr. Power Syst. Res. 2020, 187, 106507. [Google Scholar] [CrossRef] [Scilit]
  23. Refaat, M.M.; Aleem, S.H.A.; Atia, Y.; Ali, Z.M.; Sayed, M.M. Multi-stage dynamic transmission network expansion planning using lshade-spacma. Appl. Sci. 2021, 11, 2155. [Google Scholar] [CrossRef] [Scilit]
  24. Vilaça, P.; Street, A.; Colmenar, J.M. A MILP-based heuristic algorithm for transmission expansion planning problems. Electr. Power Syst. Res. 2022, 208, 107882. [Google Scholar] [CrossRef] [Scilit]
  25. Mouwafi, M.T.; Abou El-Ela, A.A.; El-Sehiemy, R.A.; Al-Zahar, W.K. Techno-economic based static and dynamic transmission network expansion planning using improved binary bat algorithm. Alex. Eng. J. 2022, 61, 1383–1401. [Google Scholar] [CrossRef] [Scilit]
  26. Demirbas, M.; Dosoglu, M.K.; Duman, S. Enhanced coati optimization algorithm for static and dynamic transmission network expansion planning problems. IEEE Access 2025, 13, 35068–35100. [Google Scholar] [CrossRef] [Scilit]
  27. Davtalab, S.; Tousi, B.; Allahvirdizadeh, Y. A Multi-Stage Security Constrained Coordinated Expansion Planning of Transmission System and Energy Hubs. IET Gener. Transm. Distrib. 2025, 19, e70029. [Google Scholar] [CrossRef] [Scilit]
  28. Mirjalili, S.; Mirjalili, S.M.; Lewis, A. Grey wolf optimizer. Adv. Eng. Softw. 2014, 69, 46–61. [Google Scholar] [CrossRef] [Scilit]
  29. Mirjalili, S.; Lewis, A. The whale optimization algorithm. Adv. Eng. Softw. 2016, 95, 51–67. [Google Scholar] [CrossRef] [Scilit]
  30. Oliveira, E.J.D.; Nepomuceno, L.S.; de Paula, A.N.; Poubel, R.P.B.; Oliveira, L.W.D. Data for Paper Multi-Stage Stochastic Transmission Expansion Planning Under Generation Uncertainty and N-1 Security Using the Pack-Based Grey Wolf Optimizer. 2026. Available online: https://drive.google.com/drive/folders/1ejib21K4oMzGXx_R635mVhLdna41135W?usp=sharing (accessed on 24 May 2026).
  31. Garver, L.L. Transmission network estimation using linear programming. IEEE Trans. Power Appar. Syst. 2007, 7, 1688–1697. [Google Scholar] [CrossRef] [Scilit]
Figure 1. Flowchart of the standard continuous metaheuristics adapted for the discrete MS-TNEP.
Technologies 14 00329 g001
Figure 2. Flowchart of the proposed Pack-Based Grey Wolf Optimizer (PBGWO).
Technologies 14 00329 g002
Figure 3. Convergence curves of the best solution for each meta-heuristic in the Garver test system. (a) Garver system without contingencies. (b) Garver system considering N-1 criteria.
Technologies 14 00329 g003
Figure 4. Convergence curves of the best solution for each meta-heuristic in the Southern-Brazilian equivalent system. (a) Southern-Brazilian equivalent system without contingencies. (b) Southern-Brazilian equivalent system considering N-1 criteria.
Technologies 14 00329 g004
Table 1. Comparison of the literature on Multi-Stage Transmission Network Expansion Planning.
ReferenceMarket EnvironmentNetwork ModelN-1 CriterionUncertainty TreatmentHorizon/DivisionTopological EvolutionSolution Method
[13]DeregulatedDCExplicit ConstraintDeterministic20 years/4 st.StaticDecomposition (GA)
[14]DeregulatedDCChecking/Penal.Stochastic15 years/3 st.Structurally DynamicDecomposition (NSGA II)
[15]CentralizedDCNot consideredDeterministic3 stagesStaticDecomposition (EGA)
[16]CentralizedLinearized ACExplicit ConstraintDeterministic15 years/3 st.StaticMILP
[17]CentralizedDCNot consideredStochastic25 years/25 st.StaticMILP
[18]CentralizedDCNot consideredDeterministic10 years/10 st.StaticDecomposition (HS)
[19]CentralizedDCChecking/Penal.Deterministic10 years/10 st.StaticDecomposition (TSHA)
[20]CentralizedDCChecking/Penal.Fuzzy-Robust8 to 12 years/4 st.Structurally DynamicDecomposition (PSO)
[21]CentralizedDCNot consideredDeterministic5-year blocksStaticDecomposition (ASSO)
[22]CentralizedFull ACChecking/Penal.Deterministic3 years/3 st.StaticDecomposition (MABC)
[23]CentralizedDCChecking/Penal.Deterministic25 years/5 st.Structurally DynamicDecomposition (LSHADE)
[24]CentralizedAC and DCNot consideredDeterministic10 years/10 st.StaticDecomposition (EPSO)
[25]CentralizedACNot consideredDeterministic21 years/3 st.StaticDecomposition (IBBA)
[26]CentralizedDCNot consideredDeterministic3 stagesStaticDecomposition (FDBCOA)
[27]DeregulatedDCChecking/Penal.Stochastic9 years/3 st.Structurally DynamicDecomposition (Tri-Level)
ProposalCentralizedDCChecking/Penal.Probabilistic20 year/3 st.Structurally DynamicDecomposition (PBGWO)
Table 2. Garver System Generation Capacity Additions per Scenario in MW.
ScenarioBusTechnologyYear 10 AdditionYear 20 Addition
12Wind100100
3Conventional0250
5Wind100100
23Conventional0250
4Wind100300
31Conventional500
2Wind5050
3Conventional50250
4Wind5050
5Wind5050
41Conventional100100
3Conventional100350
Table 3. Garver System Best Construction Schedule per Metaheuristic for Case I.
AlgorithmInv. (NPV/Base) MM US$Detailed Expansion Plan [Corridor (Circuits)]
PBGWO & GWO211.63/290.00Year 0: L2-6 (1), L3-5 (2), L4-6 (2).
Year 10: L2-6 (3).
Year 20: L3-5 (2), L4-6 (1).
GA247.23/353.00Year 0: L2-3 (1), L2-6 (1), L3-5 (1), L4-6 (2).
Year 10: L2-6 (3), L3-5 (1), L4-6 (1).
Year 20: L3-5 (1), L4-5 (1).
WOA298.92/380.00Year 0: L2-3 (3), L3-5 (1), L4-6 (3).
Year 10: L2-6 (4), L3-5 (3), L4-6 (1).
Table 4. Garver System Best Construction Schedule per Metaheuristic for Case II Security N-1.
AlgorithmInv. (NPV/Base) MM US$Detailed Expansion Plan [Corridor (Circuits)]
PBGWO & GWO234.88/310.00Year 0: L2-6 (2), L3-5 (1), L4-6 (2).
Year 10: L2-6 (2), L3-5 (2), L4-6 (1).
Year 20: L2-3 (1), L3-5 (1).
GA267.23/373.00Year 0: L1-5 (1), L2-3 (1), L2-6 (1), L3-5 (1), L4-6 (2).
Year 10: L2-6 (3), L3-5 (1), L4-6 (1).
Year 20: L3-5 (1), L4-5 (1).
WOA365.78/443.00Year 0: L2-6 (3), L4-5 (1), L4-6 (3).
Year 10: L2-3 (1), L3-4 (1), L3-5 (3), L5-6 (1).
Table 5. Comprehensive Statistical Performance and Computational Time for the Garver System.
AlgorithmDescriptive Statistics (MM US$)Wilcoxon Test (vs. PBGWO)
BestWorstAverageStd. Dev.Time (s)p-ValueCliff’s δEffect Size
Case I: Multiscenario without Contingencies (N-0)
PBGWO211.63228.84216.476.68232.32
GWO211.63317.41243.1536.41233.16 1.08 × 10 2 0.67Large
GA247.23569.31356.05122.11236.85 1.49 × 10 4 1.00Large
WOA294.18753.06480.97158.17196.26 1.49 × 10 4 1.00Large
Case II: Multiscenario considering Security Criterion (N-1)
PBGWO234.88255.95237.256.58446.66
GWO234.88322.59256.3827.13434.47 1.87 × 10 2 0.61Large
GA267.23505.91366.4987.50428.98 1.46 × 10 4 1.00Large
WOA365.781292.70705.78289.02436.52 1.46 × 10 4 1.00Large
Table 6. Southern-Brazilian Equivalent System Generation Capacity Additions per Scenario in MW.
ScenarioBusTechnologyYear 10 AdditionYear 20 Addition
112Wind200200
24Wind200200
43Wind200600
22Wind100100
12Wind200200
20Wind100100
24Wind200200
33Wind100100
42Wind200200
43Wind300300
312Wind200200
24Wind200200
41Wind400400
43Wind500700
45Wind200200
46Wind300300
11Wind200200
12Wind200200
24Wind200200
25Wind200200
43Wind300300
Table 7. Southern-Brazilian Equivalent System Best Construction Schedule per Metaheuristic for Case I.
AlgorithmInv. (NPV/Base) MM US$Detailed Expansion Plan [Corridor (Circuits)]
PBGWO19.66/80.71Year 10: L5-6 (1), L20-21 (1), L46-6 (1).
Year 20: L5-6 (1), L5-8 (1), L13-20 (1), L14-22 (1), L18-20 (1), L22-26 (1), L42-43 (1).
GWO22.43/86.31Year 10: L5-6 (2), L20-21 (1), L46-6 (1).
Year 20: L5-8 (1), L14-26 (1), L18-20 (1), L36-37 (1), L42-43 (1).
GA23.03/96.12Year 10: L5-6 (1), L18-20 (1), L46-6 (1).
Year 20: L2-3 (1), L14-26 (1), L20-21 (1), L42-43 (1), L46-3 (1).
WOA73.95/204.82Year 0: L20-21 (1), L42-44 (1), L46-3 (1).
Year 10: L2-3 (1), L4-9 (1), L14-15 (1), L26-29 (1), L41-43 (1).
Year 20: L2-3 (1), L5-8 (1), L14-22 (1), L14-26 (1), L18-20 (1), L28-43 (1), L35-38 (1), L40-45 (1), L42-43 (1).
Table 8. Southern-Brazilian Equivalent System Best Construction Schedule per Metaheuristic for Case II Security N-1.
AlgorithmInv. (NPV/Base) MM US$Detailed Expansion Plan [Corridor (Circuits)]
GA61.73/241.01Year 0: L24-34 (1).
Year 10: L5-6 (1), L19-21 (1), L20-21 (1), L40-42 (1), L46-6 (1).
Year 20: L5-6 (1), L5-8 (1), L13-18 (1), L18-19 (1), L18-20 (1), L28-31 (1), L31-41 (1), L32-43 (1), L37-39 (1), L40-41 (1), L42-43 (1), L46-6 (1).
PBGWO61.75/239.86Year 0: L24-34 (1).
Year 10: L5-6 (1), L19-21 (1), L20-21 (1), L31-32 (1), L46-6 (1).
Year 20: L2-3 (1), L13-18 (1), L13-20 (1), L18-19 (1), L18-20 (1), L28-41 (1), L32-43 (1), L40-41 (1), L42-43 (1), L46-3 (1).
GWO76.08/217.28Year 0: L18-20 (1), L24-34 (1).
Year 10: L5-6 (1), L19-21 (1), L20-21 (1), L32-43 (1), L46-6 (1).
Year 20: L2-3 (1), L13-18 (1), L31-41 (1), L40-41 (1), L42-43 (1), L46-3 (1).
WOA158.93/662.73Year 0: L13-20 (1), L14-15 (1), L19-21 (1).
Year 10: L5-6 (1), L17-19 (1), L18-19 (1), L20-21 (1), L26-29 (1), L28-41 (1), L29-30 (1), L31-32 (1), L41-43 (1), L46-6 (1).
Year 20: L2-3 (1), L4-9 (1), L4-11 (1), L5-9 (1), L8-13 (1), L13-18 (1), L14-22 (1), L14-26 (1), L16-17 (1), L16-28 (1), L18-20 (1), L19-25 (1), L21-25 (1), L24-25 (1), L24-34 (1), L27-29 (1), L27-36 (1), L28-30 (1), L28-31 (1), L28-43 (1), L31-32 (1), L31-41 (1), L36-37 (1), L37-42 (1), L40-41 (1), L40-42 (1), L41-43 (1), L42-43 (1), L42-44 (1), L44-45 (1), L46-3 (1), L46-11 (1).
Table 9. Comprehensive Statistical Performance and Computational Time for the Southern-Brazilian Equivalent System.
AlgorithmDescriptive Statistics (MM US$)Wilcoxon Test (vs. PBGWO)
BestWorstAverageStd. Dev.Time (s)p-ValueCliff’s δEffect Size
Case I: Multiscenario without Contingencies (N-0)
PBGWO19.6625.7122.772.08518.04
GWO22.4332.5126.403.16529.42 2.11 × 10 2 0.62Large
GA23.0340.3128.995.80505.68 2.83 × 10 3 0.80Large
WOA67.20235.81134.3552.87530.73 1.83 × 10 4 1.00Large
Case II: Multiscenario considering Security Criterion (N-1)
PBGWO65.8480.1171.894.961705.05
GWO65.24109.8587.7015.901665.47 3.76 × 10 2 0.56Large
GA61.73118.0994.2319.061658.13 3.61 × 10 3 0.78Large
WOA158.93317.68232.5348.861726.31 1.83 × 10 4 1.00Large
Disclaimer/Publisher’s Note: The statements, opinions and data contained in all publications are solely those of the individual author(s) and contributor(s) and not of MDPI and/or the editor(s). MDPI and/or the editor(s) disclaim responsibility for any injury to people or property resulting from any ideas, methods, instructions or products referred to in the content.