Perceptual Discrimination of Phonemic Contrasts in Quebec French: Exposure to Quebec French Does Not Improve Perception in Hexagonal French Native Speakers Living in Quebec
Abstract
1. Introduction
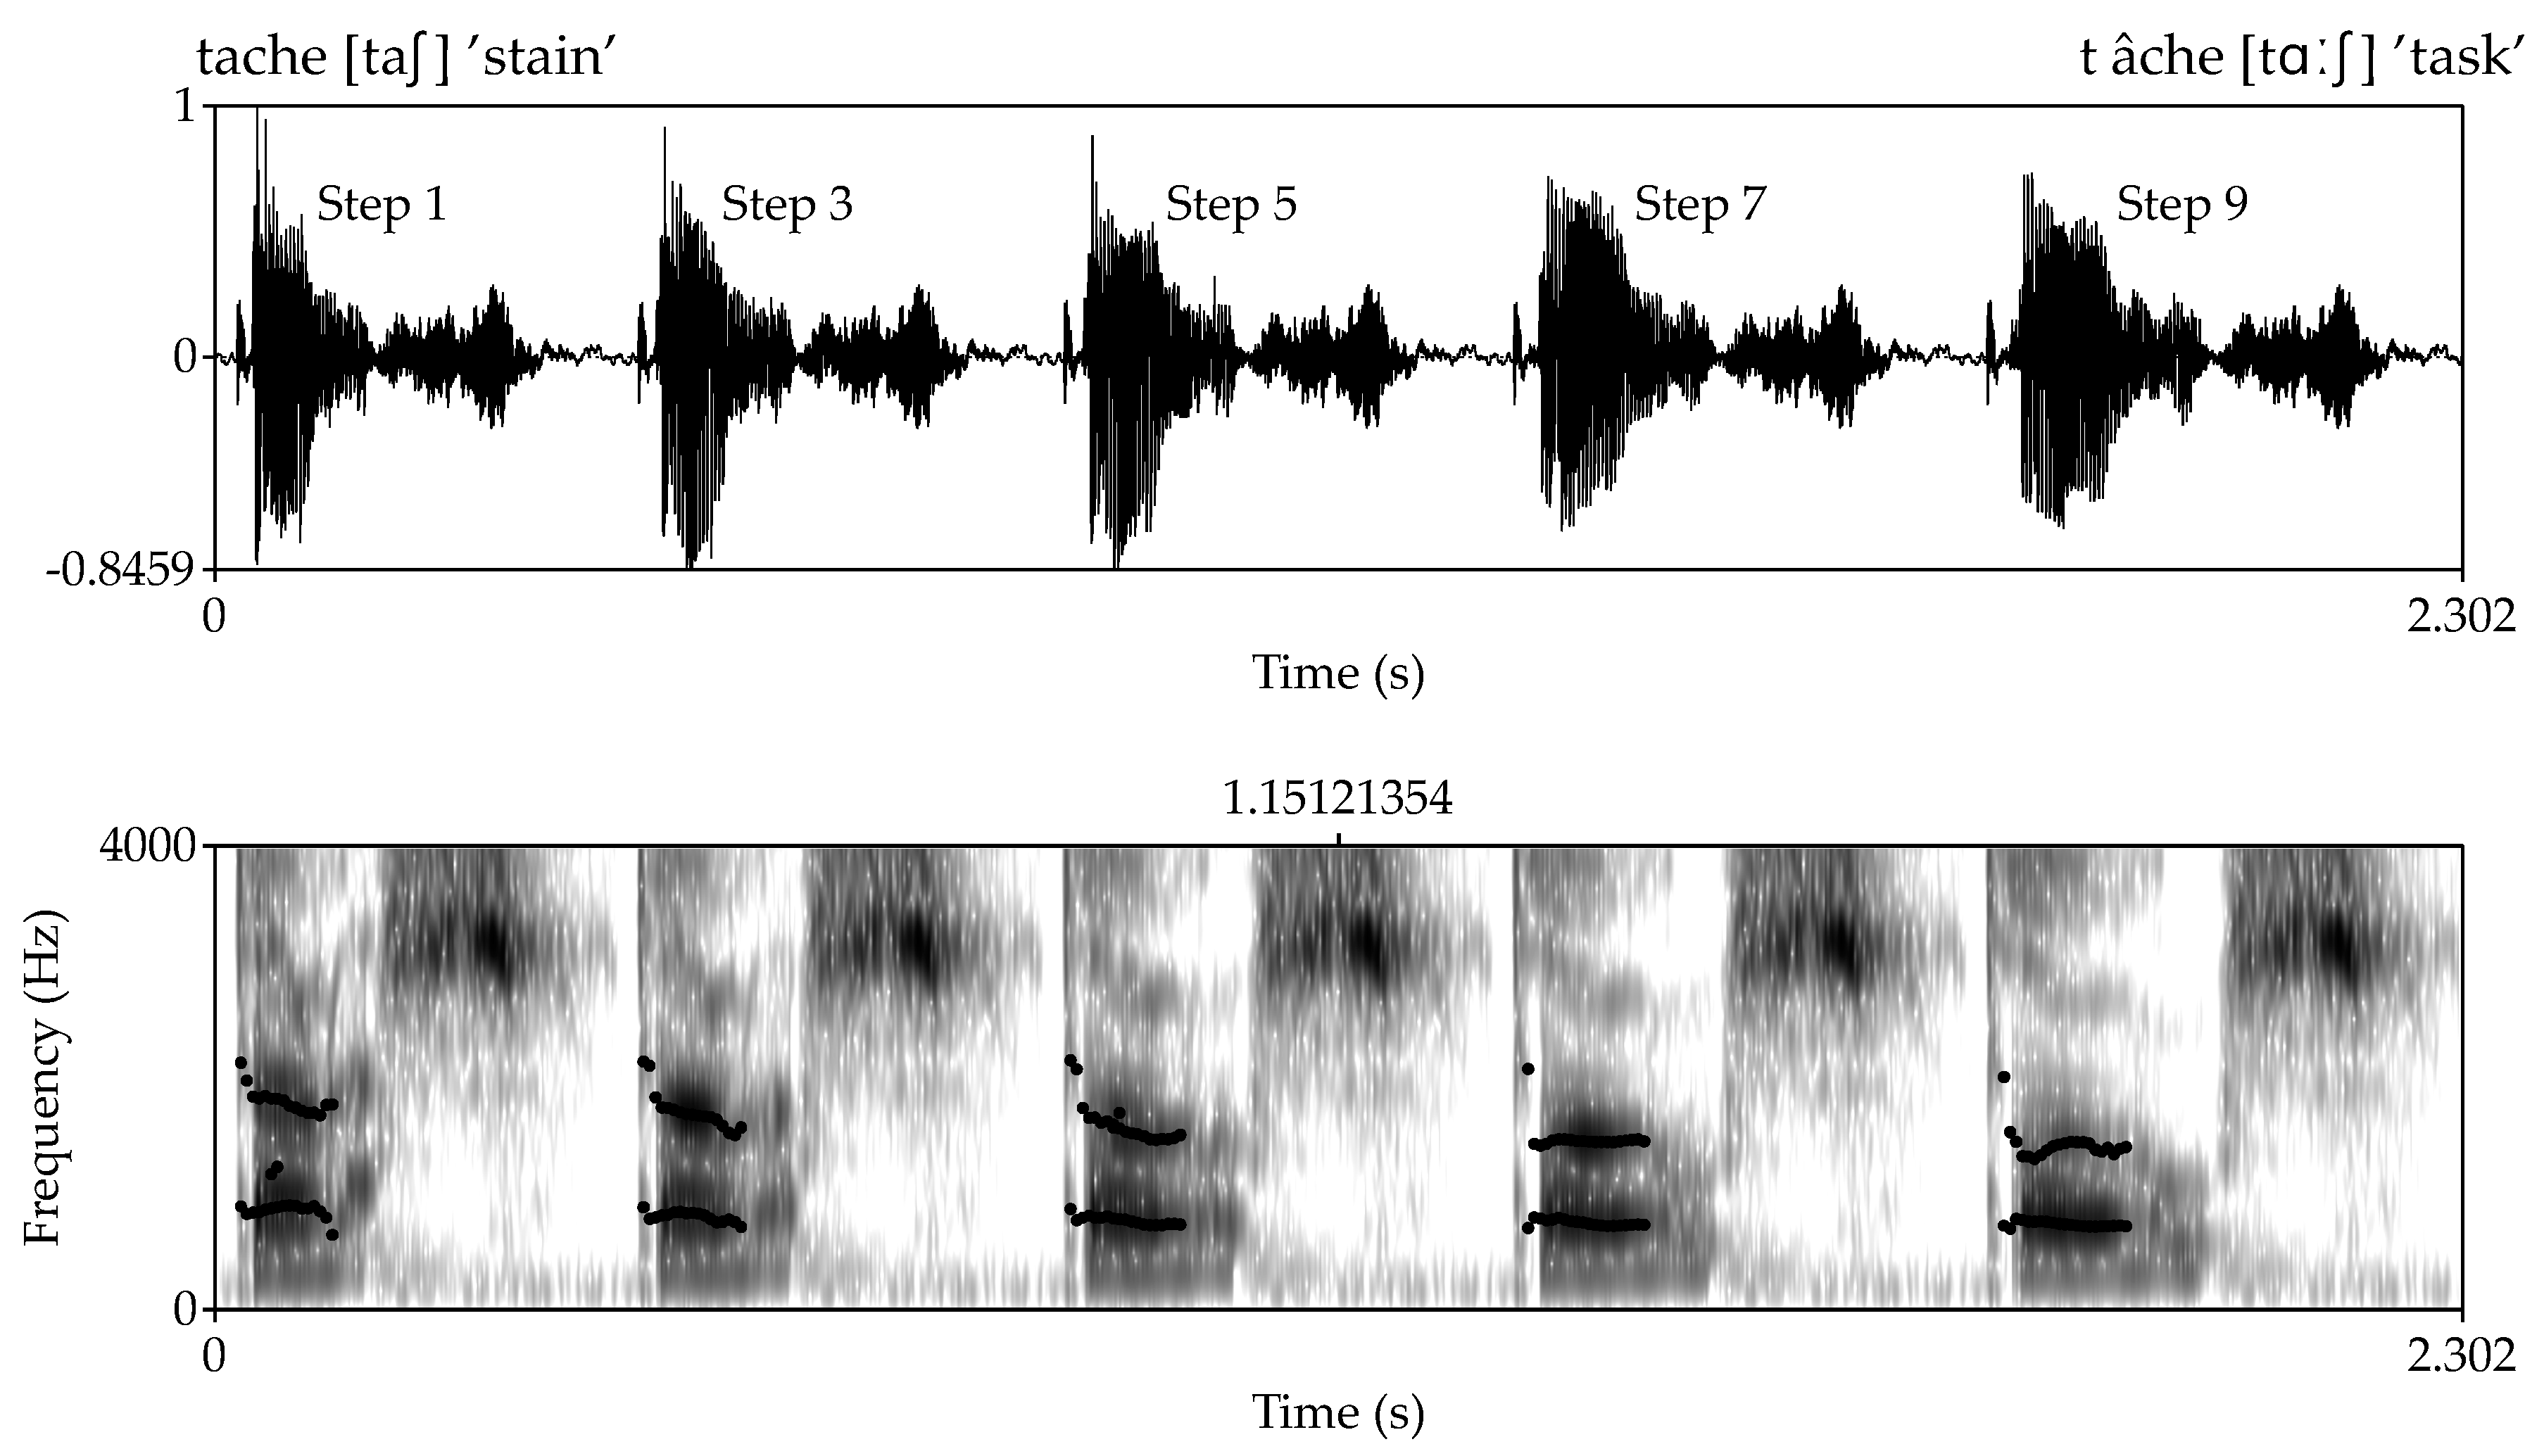
- tache [taʃ] ‘stain’ vs. tâche [tɑʃ] ‘task, chore’
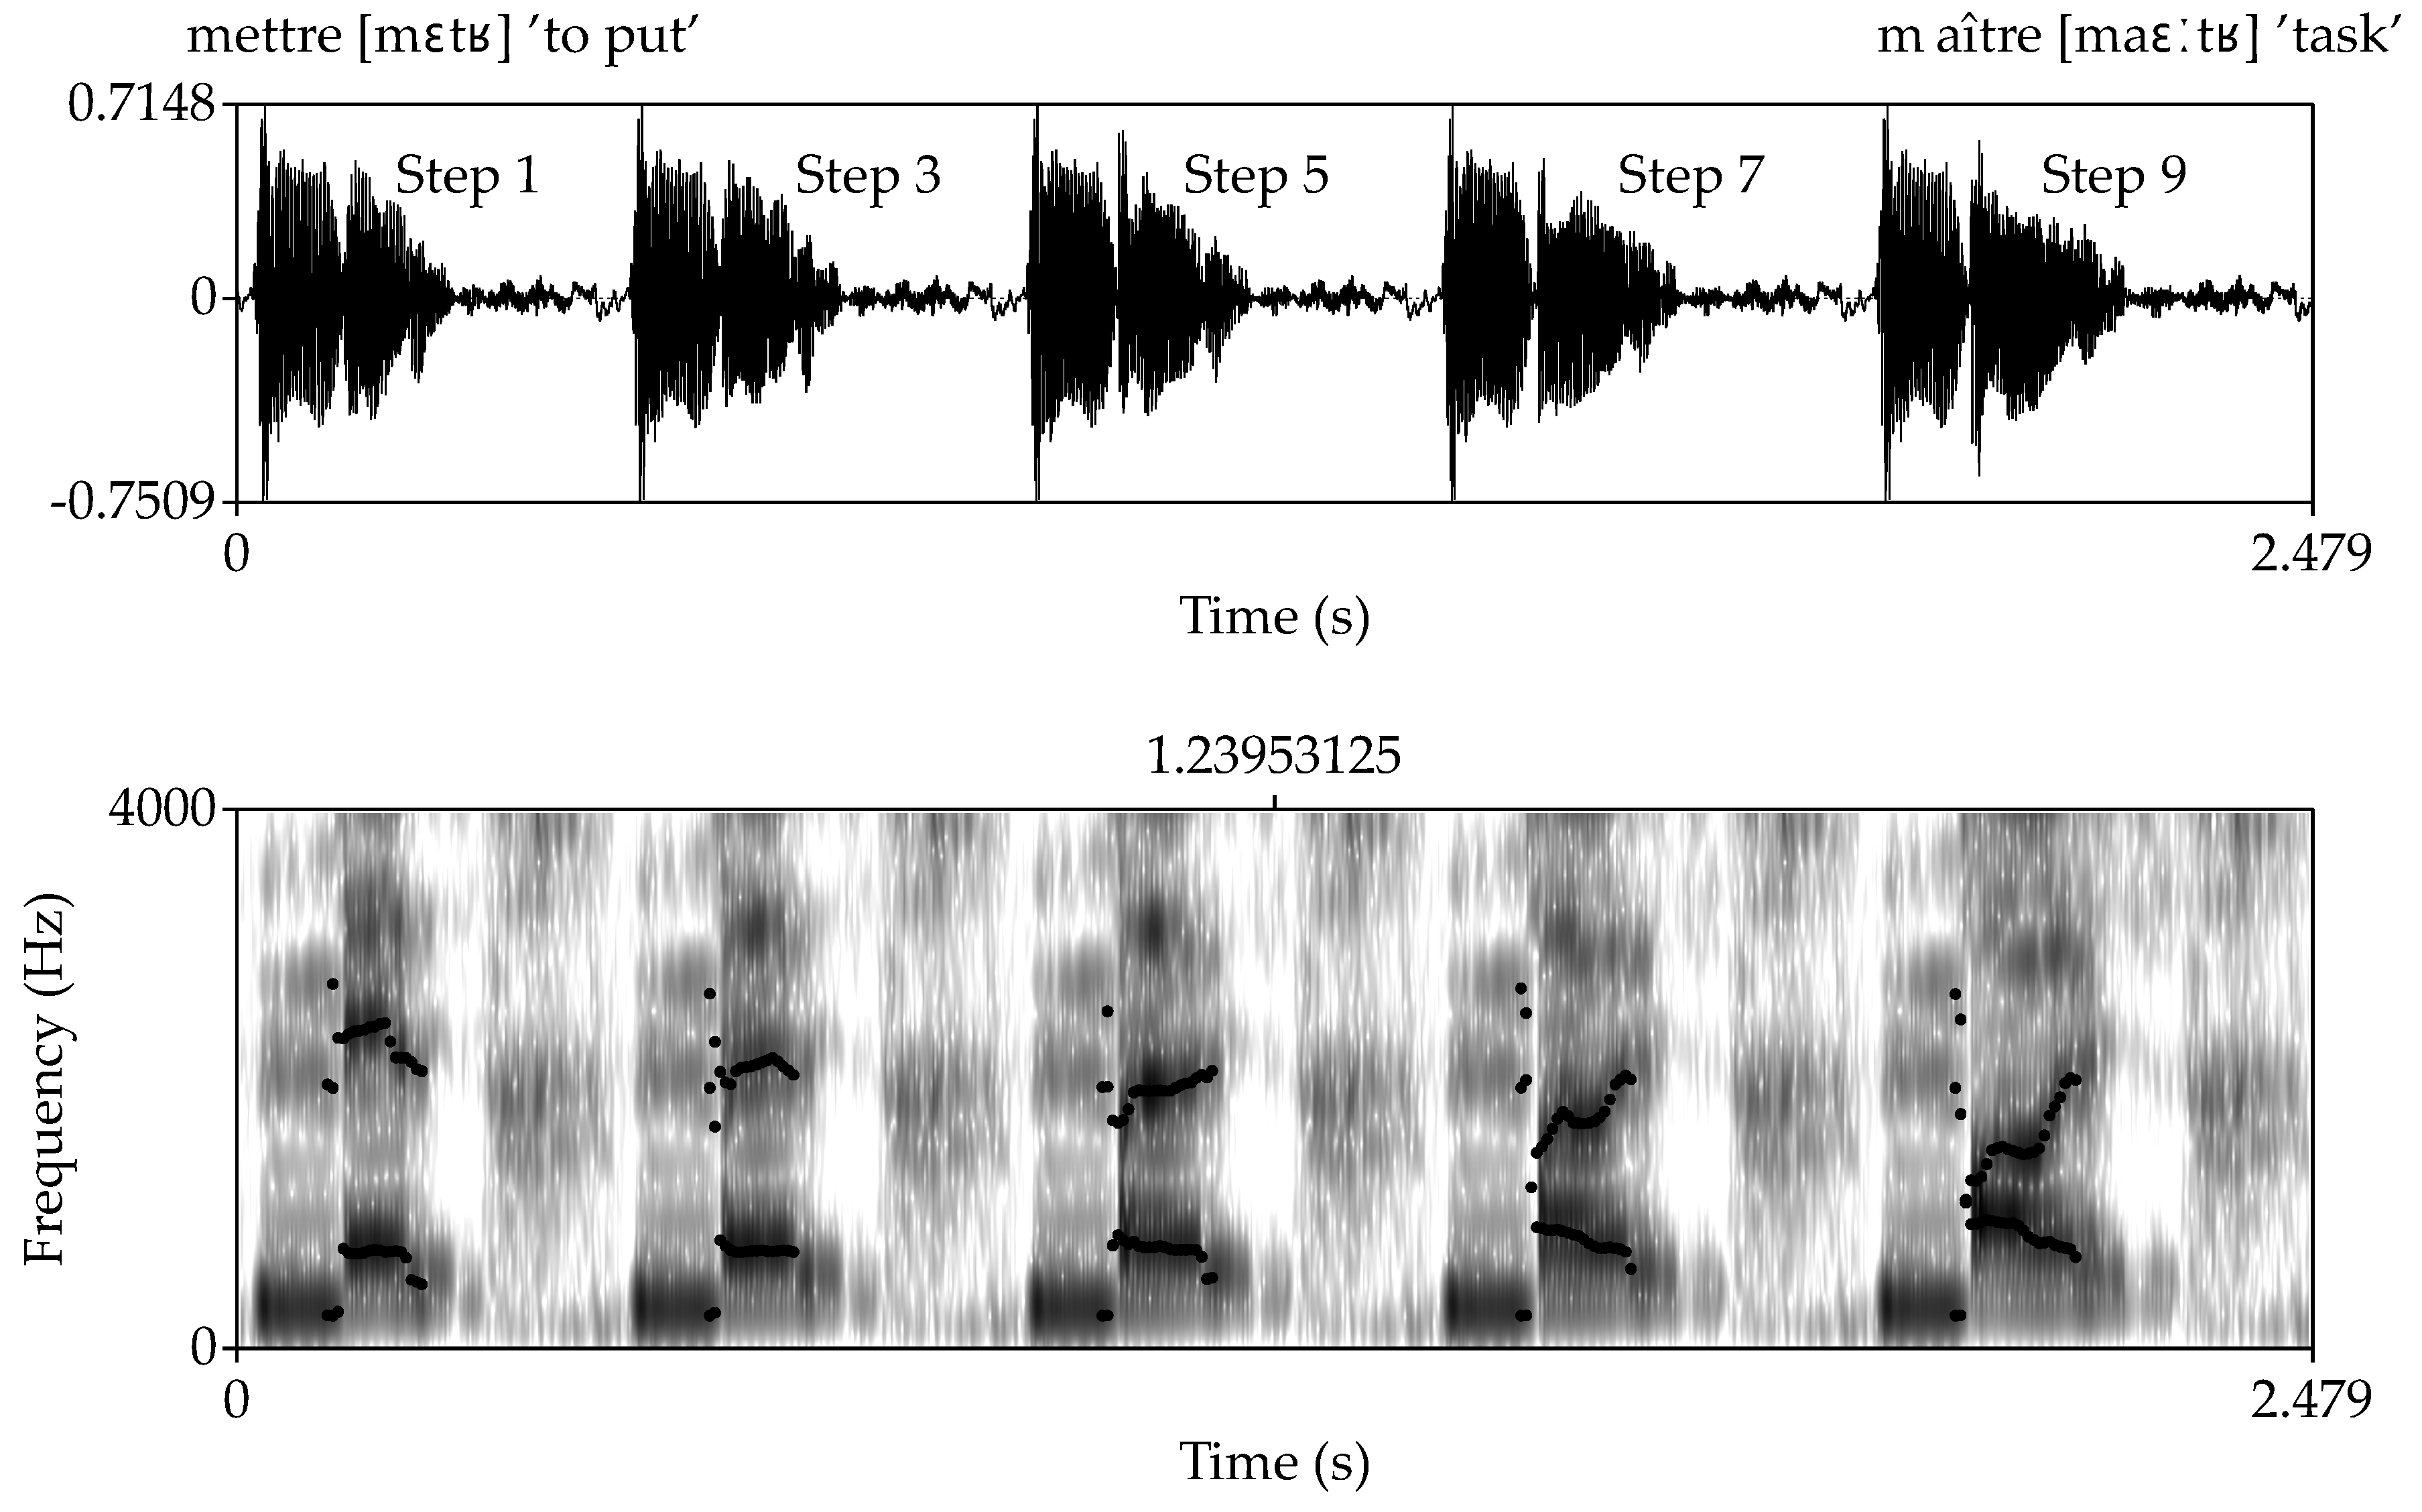
- mettre [mεtʁ] ‘to put’ vs. maître [maεtʁ] ‘owner, teacher’
2. Background
2.1. Cross-Dialectal Perception of Mergers
2.2. Perceptual Adaptation in the Acquisition of a New Language Variety
2.3. Variables of Interest
2.4. Research Question and Hypotheses
- What effect does extended exposure to QF as a D2 have on HF>QF’s ability to discriminate between these contrasts?
3. Materials and Methods
3.1. Stimuli Design
3.1.1. Resynthesis
3.1.2. Naturalness Rating Experiment
3.2. Participants
- HF group: Non-mobile HF speakers born, raised, and living in France (n = 13).
- HF>QF group: Mobile HF speakers born in France but living in Quebec after moving there in adulthood (n = 12).
- QF group: Non-mobile QF speakers born, raised, and living in Quebec (n = 10).
3.3. Procedure
- Steps 1 and 9
- Steps 2 and 8
- Steps 3 and 7
- Steps 4 and 6
3.4. Statistical Analysis
4. Results
4.1. Configuration 1–9
4.2. Configuration 2–8
4.3. Configuration 3–7
4.4. Configuration 4–6
4.5. Summary of Results
5. Discussion
6. Conclusions
Author Contributions
Funding
Institutional Review Board Statement
Informed Consent Statement
Data Availability Statement
Acknowledgments
Conflicts of Interest
Appendix A
| Word Containing /a/ or /ε/ | Freq (per million) | Word Containing /ɑ/ or /aε/ | Freq (per million) |
|---|---|---|---|
| patte | 6.6 | pâte | 7.1 |
| tache | 13.7 | tâche | 26.4 |
| l’aide * | 294.4 | laide | 6.4 |
| mettre | 275.5 | maître | 121.8 |
| boule | 19.8 | bulle | 3.3 |
| épais | 6.25 | épée | 29.6 |
| bouche | 92.4 | bûche | 2.2 |
| saute | 36.7 | sotte | 4.75 |
Appendix B
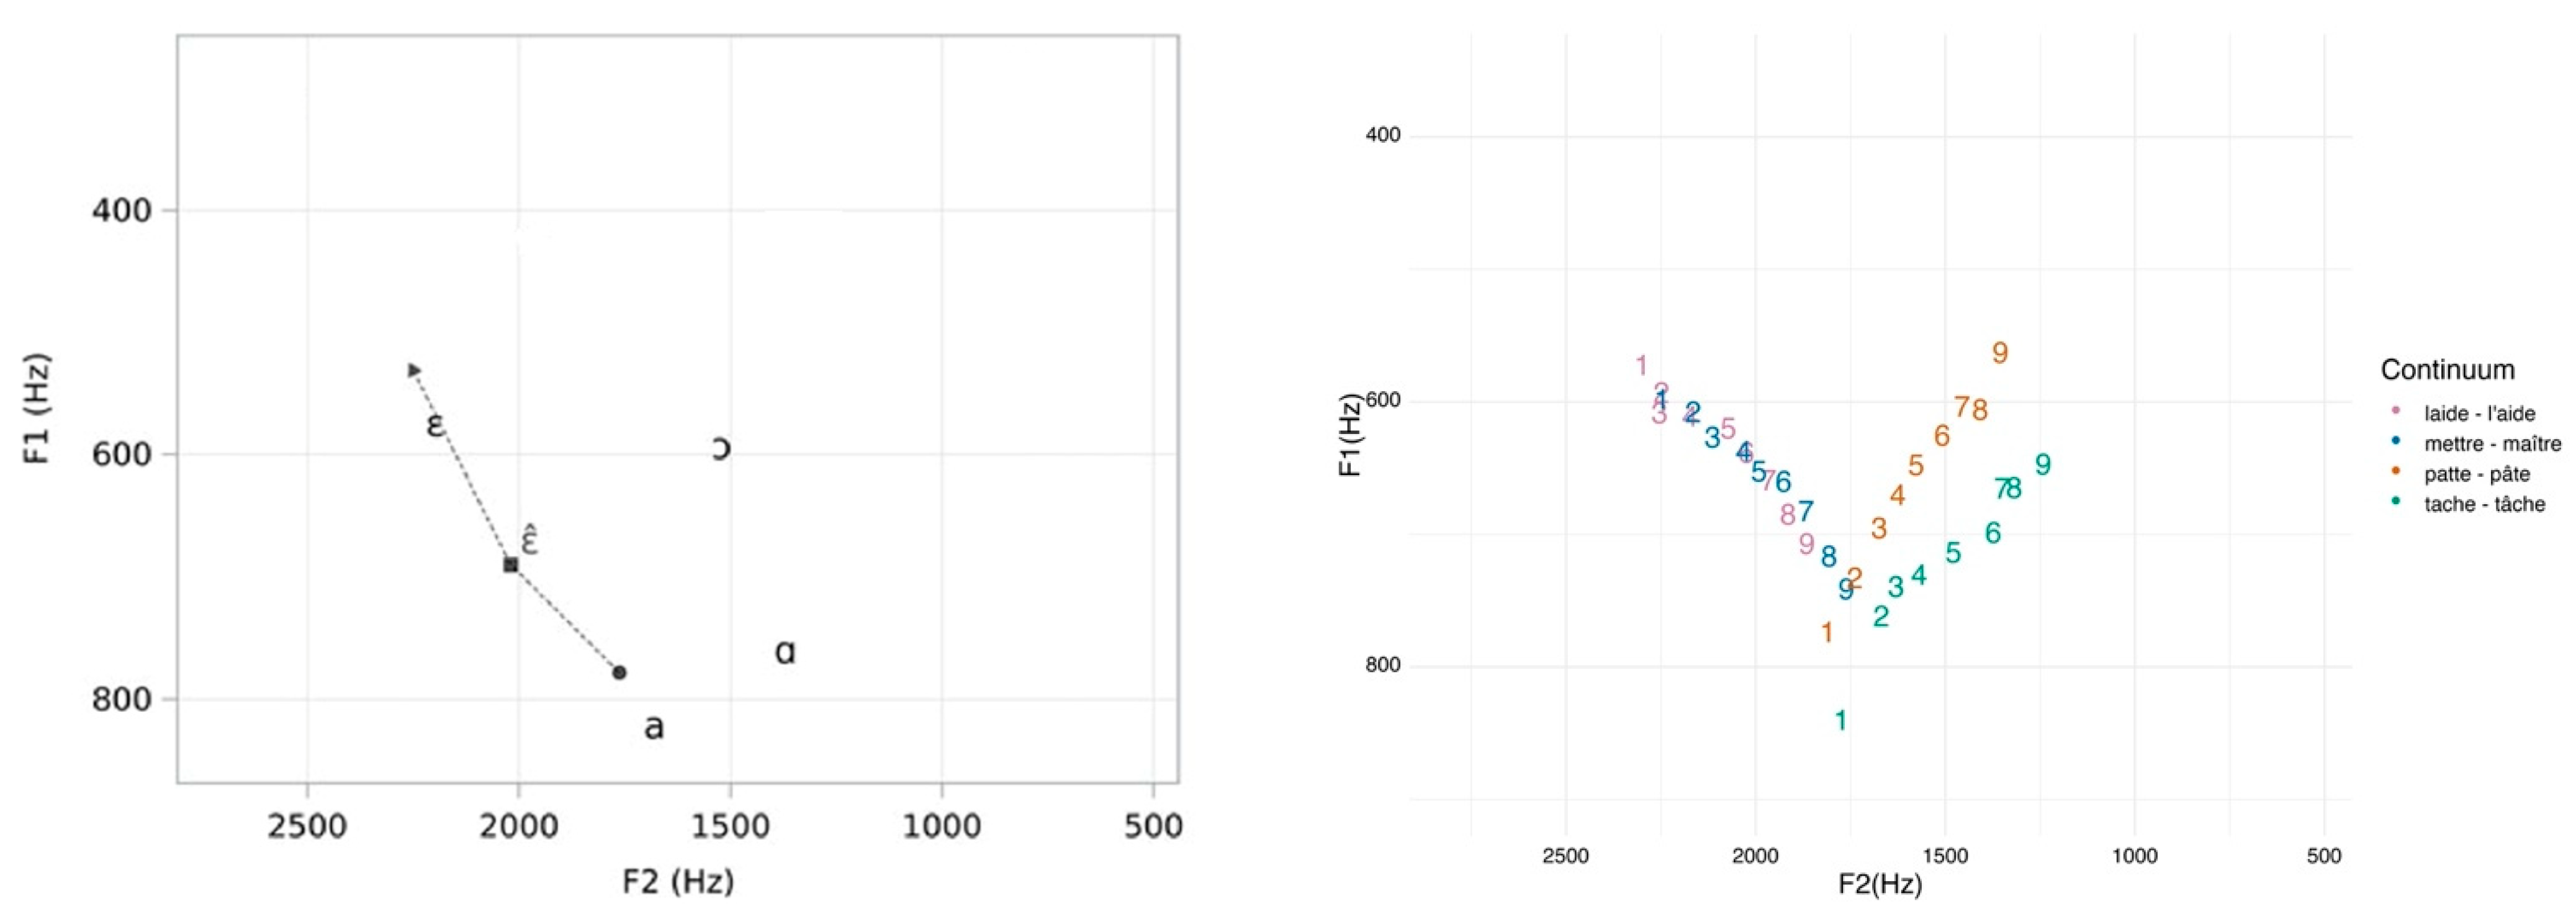
| Word | Step | Duration (s) | F1.25 | F1.50 | F1.75 | F2.25 | F2.50 | F2.75 |
|---|---|---|---|---|---|---|---|---|
| patte-pâte | 1 (patte) | 0.09558 | 1039.63 | 957.78 | 805.79 | 1845.46 | 1837.30 | 1771.33 |
| 2 | 0.10246 | 1024.26 | 916.64 | 794.02 | 1826.20 | 1811.22 | 1708.24 | |
| 3 | 0.10245 | 968.70 | 883.64 | 789.80 | 1724.64 | 1672.78 | 1660.58 | |
| 4 | 0.11298 | 881.42 | 846.96 | 777.47 | 1616.57 | 1592.05 | 1545.00 | |
| 5 | 0.12308 | 850.95 | 851.60 | 759.80 | 1585.20 | 1582.62 | 1428.85 | |
| 6 | 0.13253 | 829.74 | 818.42 | 730.04 | 1576.10 | 1555.93 | 1402.02 | |
| 7 | 0.13655 | 821.45 | 825.70 | 730.79 | 1571.37 | 1452.24 | 1332.57 | |
| 8 | 0.14373 | 809.61 | 827.60 | 732.46 | 1525.39 | 1378.55 | 1176.40 | |
| 9 (pâte) | 0.13397 | 789.86 | 819.63 | 705.61 | 1406.95 | 1337.12 | 1176.50 | |
| tache-tâche | 1 (tache) | 0.12551 | 880.52 | 895.70 | 780.15 | 1768.29 | 1695.66 | 1784.16 |
| 2 | 0.13561 | 851.57 | 780.48 | 788.88 | 1694.10 | 1665.03 | 1691.33 | |
| 3 | 0.14623 | 822.93 | 730.28 | 778.66 | 1681.07 | 1462.57 | 1595.39 | |
| 4 | 0.15685 | 803.09 | 755.16 | 754.73 | 1635.42 | 1480.52 | 1494.33 | |
| 5 | 0.16502 | 768.18 | 741.37 | 727.58 | 1539.66 | 1466.01 | 1343.34 | |
| 6 | 0.17564 | 750.63 | 735.27 | 712.80 | 1466.85 | 1457.68 | 1284.72 | |
| 7 | 0.18544 | 742.25 | 729.05 | 677.04 | 1449.90 | 1451.57 | 1191.65 | |
| 8 | 0.19443 | 742.32 | 722.82 | 667.02 | 1444.62 | 1423.69 | 1094.64 | |
| 9 (tâche) | 0.20999 | 730.71 | 719.24 | 529.25 | 1430.76 | 1342.75 | 1030.46 | |
| mettre-maître | 1 (mettre) | 0.07892 | 692.07 | 695.19 | 715.33 | 2332.98 | 2300.49 | 2194.68 |
| 2 | 0.08332 | 707.07 | 707.25 | 718.82 | 2172.12 | 2149.95 | 2174.60 | |
| 3 | 0.09313 | 709.11 | 713.09 | 720.45 | 2057.60 | 2053.99 | 2082.72 | |
| 4 | 0.09634 | 718.18 | 718.77 | 717.53 | 1926.15 | 1940.09 | 1943.03 | |
| 5 | 0.10048 | 760.27 | 735.90 | 721.59 | 1883.08 | 1884.67 | 1917.19 | |
| 6 | 0.10293 | 762.13 | 748.06 | 727.65 | 1779.54 | 1788.87 | 1889.37 | |
| 7 | 0.10702 | 737.17 | 781.24 | 740.51 | 1733.20 | 1670.64 | 1783.27 | |
| 8 | 0.11355 | 749.57 | 831.36 | 762.64 | 1524.72 | 1560.47 | 1693.45 | |
| 9 (maître) | 0.15358 | 769.08 | 803.97 | 741.97 | 1490.80 | 1452.07 | 1515.82 | |
| l’aide-laide | 1 (laide) | 0.15685 | 591.50 | 640.45 | 616.60 | 2380.82 | 2389.46 | 2343.92 |
| 2 | 0.15685 | 658.25 | 671.14 | 632.43 | 2288.29 | 2294.31 | 2348.23 | |
| 3 | 0.16175 | 668.67 | 648.99 | 633.21 | 2258.70 | 2287.15 | 2276.90 | |
| 4 | 0.17155 | 674.74 | 664.48 | 636.97 | 2055.65 | 2182.91 | 2199.62 | |
| 5 | 0.17646 | 684.27 | 673.70 | 636.33 | 1865.51 | 2077.01 | 2089.26 | |
| 6 | 0.17482 | 744.58 | 719.75 | 636.10 | 1827.69 | 2021.39 | 2076.57 | |
| 7 | 0.1813 | 824.45 | 749.10 | 633.55 | 1801.30 | 1866.24 | 1959.17 | |
| 8 | 0.20750 | 859.87 | 718.60 | 631.62 | 1639.37 | 1847.95 | 1861.16 | |
| 9 (l’aide) | 0.21322 | 895.28 | 747.94 | 634.45 | 1620.58 | 1840.29 | 1840.90 |
Appendix C
| Participant | Configuration | Contrast | % Correct |
|---|---|---|---|
| 3 | 19 | /a ~ ɑ/ | 75% |
| 3 | 28 | /a ~ ɑ/ | 75% |
| 3 | 37 | /a ~ ɑ/ | 25% |
| 3 | 46 | /a ~ ɑ/ | 25% |
| 4 | 19 | /a ~ ɑ/ | 100% |
| 4 | 28 | /a ~ ɑ/ | 100% |
| 4 | 37 | /a ~ ɑ/ | 25% |
| 4 | 46 | /a ~ ɑ/ | 50% |
| 7 | 19 | /a ~ ɑ/ | 100% |
| 7 | 28 | /a ~ ɑ/ | 100% |
| 7 | 37 | /a ~ ɑ/ | 100% |
| 7 | 46 | /a ~ ɑ/ | 25% |
| 8 | 19 | /a ~ ɑ/ | 100% |
| 8 | 28 | /a ~ ɑ/ | 75% |
| 8 | 37 | /a ~ ɑ/ | 25% |
| 9 | 19 | /a ~ ɑ/ | 100% |
| 9 | 28 | /a ~ ɑ/ | 100% |
| 10 | 19 | /a ~ ɑ/ | 100% |
| 10 | 28 | /a ~ ɑ/ | 100% |
| 10 | 37 | /a ~ ɑ/ | 100% |
| 15 | 19 | /a ~ ɑ/ | 100% |
| 15 | 28 | /a ~ ɑ/ | 75% |
| 15 | 37 | /a ~ ɑ/ | 75% |
| 15 | 46 | /a ~ ɑ/ | 50% |
| 16 | 19 | /a ~ ɑ/ | 100% |
| 16 | 28 | /a ~ ɑ/ | 100% |
| 16 | 37 | /a ~ ɑ/ | 100% |
| 16 | 46 | /a ~ ɑ/ | 25% |
| 17 | 19 | /a ~ ɑ/ | 100% |
| 17 | 28 | /a ~ ɑ/ | 75% |
| 17 | 37 | /a ~ ɑ/ | 75% |
| 17 | 46 | /a ~ ɑ/ | 25% |
| 18 | 19 | /a ~ ɑ/ | 100% |
| 18 | 28 | /a ~ ɑ/ | 100% |
| 18 | 37 | /a ~ ɑ/ | 75% |
| 23 | 19 | /a ~ ɑ/ | 75% |
| 23 | 28 | /a ~ ɑ/ | 75% |
| 23 | 46 | /a ~ ɑ/ | 25% |
| 24 | 19 | /a ~ ɑ/ | 100% |
| 24 | 28 | /a ~ ɑ/ | 100% |
| 24 | 37 | /a ~ ɑ/ | 75% |
| 24 | 46 | /a ~ ɑ/ | 33% |
| Participant | Configuration | Contrast | % Correct |
|---|---|---|---|
| 3 | 19 | /ε ~ aε/ | 25% |
| 3 | 28 | /ε ~ aε/ | 100% |
| 3 | 37 | /ε ~ aε/ | 100% |
| 3 | 46 | /ε ~ aε/ | 50% |
| 4 | 19 | /ε ~ aε/ | 75% |
| 4 | 28 | /ε ~ aε/ | 75% |
| 4 | 37 | /ε ~ aε/ | 50% |
| 7 | 19 | /ε ~ aε/ | 75% |
| 7 | 28 | /ε ~ aε/ | 100% |
| 7 | 37 | /ε ~ aε/ | 75% |
| 8 | 19 | /ε ~ aε/ | 33% |
| 8 | 28 | /ε ~ aε/ | 50% |
| 9 | 19 | /ε ~ aε/ | 50% |
| 9 | 28 | /ε ~ aε/ | 50% |
| 9 | 46 | /ε ~ aε/ | 25% |
| 10 | 19 | /ε ~ aε/ | 100% |
| 10 | 28 | /ε ~ aε/ | 50% |
| 10 | 37 | /ε ~ aε/ | 25% |
| 15 | 19 | /ε ~ aε/ | 25% |
| 15 | 28 | /ε ~ aε/ | 75% |
| 15 | 37 | /ε ~ aε/ | 33% |
| 15 | 46 | /ε ~ aε/ | 25% |
| 16 | 19 | /ε ~ aε/ | 75% |
| 16 | 28 | /ε ~ aε/ | 100% |
| 16 | 37 | /ε ~ aε/ | 75% |
| 17 | 19 | /ε ~ aε/ | 100% |
| 17 | 28 | /ε ~ aε/ | 100% |
| 17 | 37 | /ε ~ aε/ | 100% |
| 17 | 46 | /ε ~ aε/ | 50% |
| 18 | 19 | /ε ~ aε/ | 75% |
| 18 | 28 | /ε ~ aε/ | 100% |
| 18 | 37 | /ε ~ aε/ | 75% |
| 18 | 46 | /ε ~ aε/ | 50% |
| 1 | A distinction between short-vowel [ε] and long-vowel [εː] (as in the words [bεl] belle ‘beauty’ and [bεːl] bêle ‘bleat’) was at one time ubiquitous in HF but has since been largely neutralized to the short variant. This merger of [ε] and [εː] is similar to that between /a/ and /ɑ/ in the sense that it is nearing completion in most dialects of HF; however, it is different in that it is much further along in its neutralization compared to the /a ~ ɑ/ contrast. Gess (2008) argues that the vowel length distinction between [ε] and [εː] was lost in HF by the sixteenth century. Nonetheless, vestiges of a length distinction between [ε] and [εː] have been reported in HF, again mostly along the mid and upper eastern border of France (Avanzi 2017). |
| 2 | The production tasks involved a word- and sentence-reading task involving the same five contrasts (two target and three distractor contrasts) discussed in this paper. All participants completed the production task first followed by the perception experiments in an attempt to hold constant any effects of the production task on the later perception experiments. |
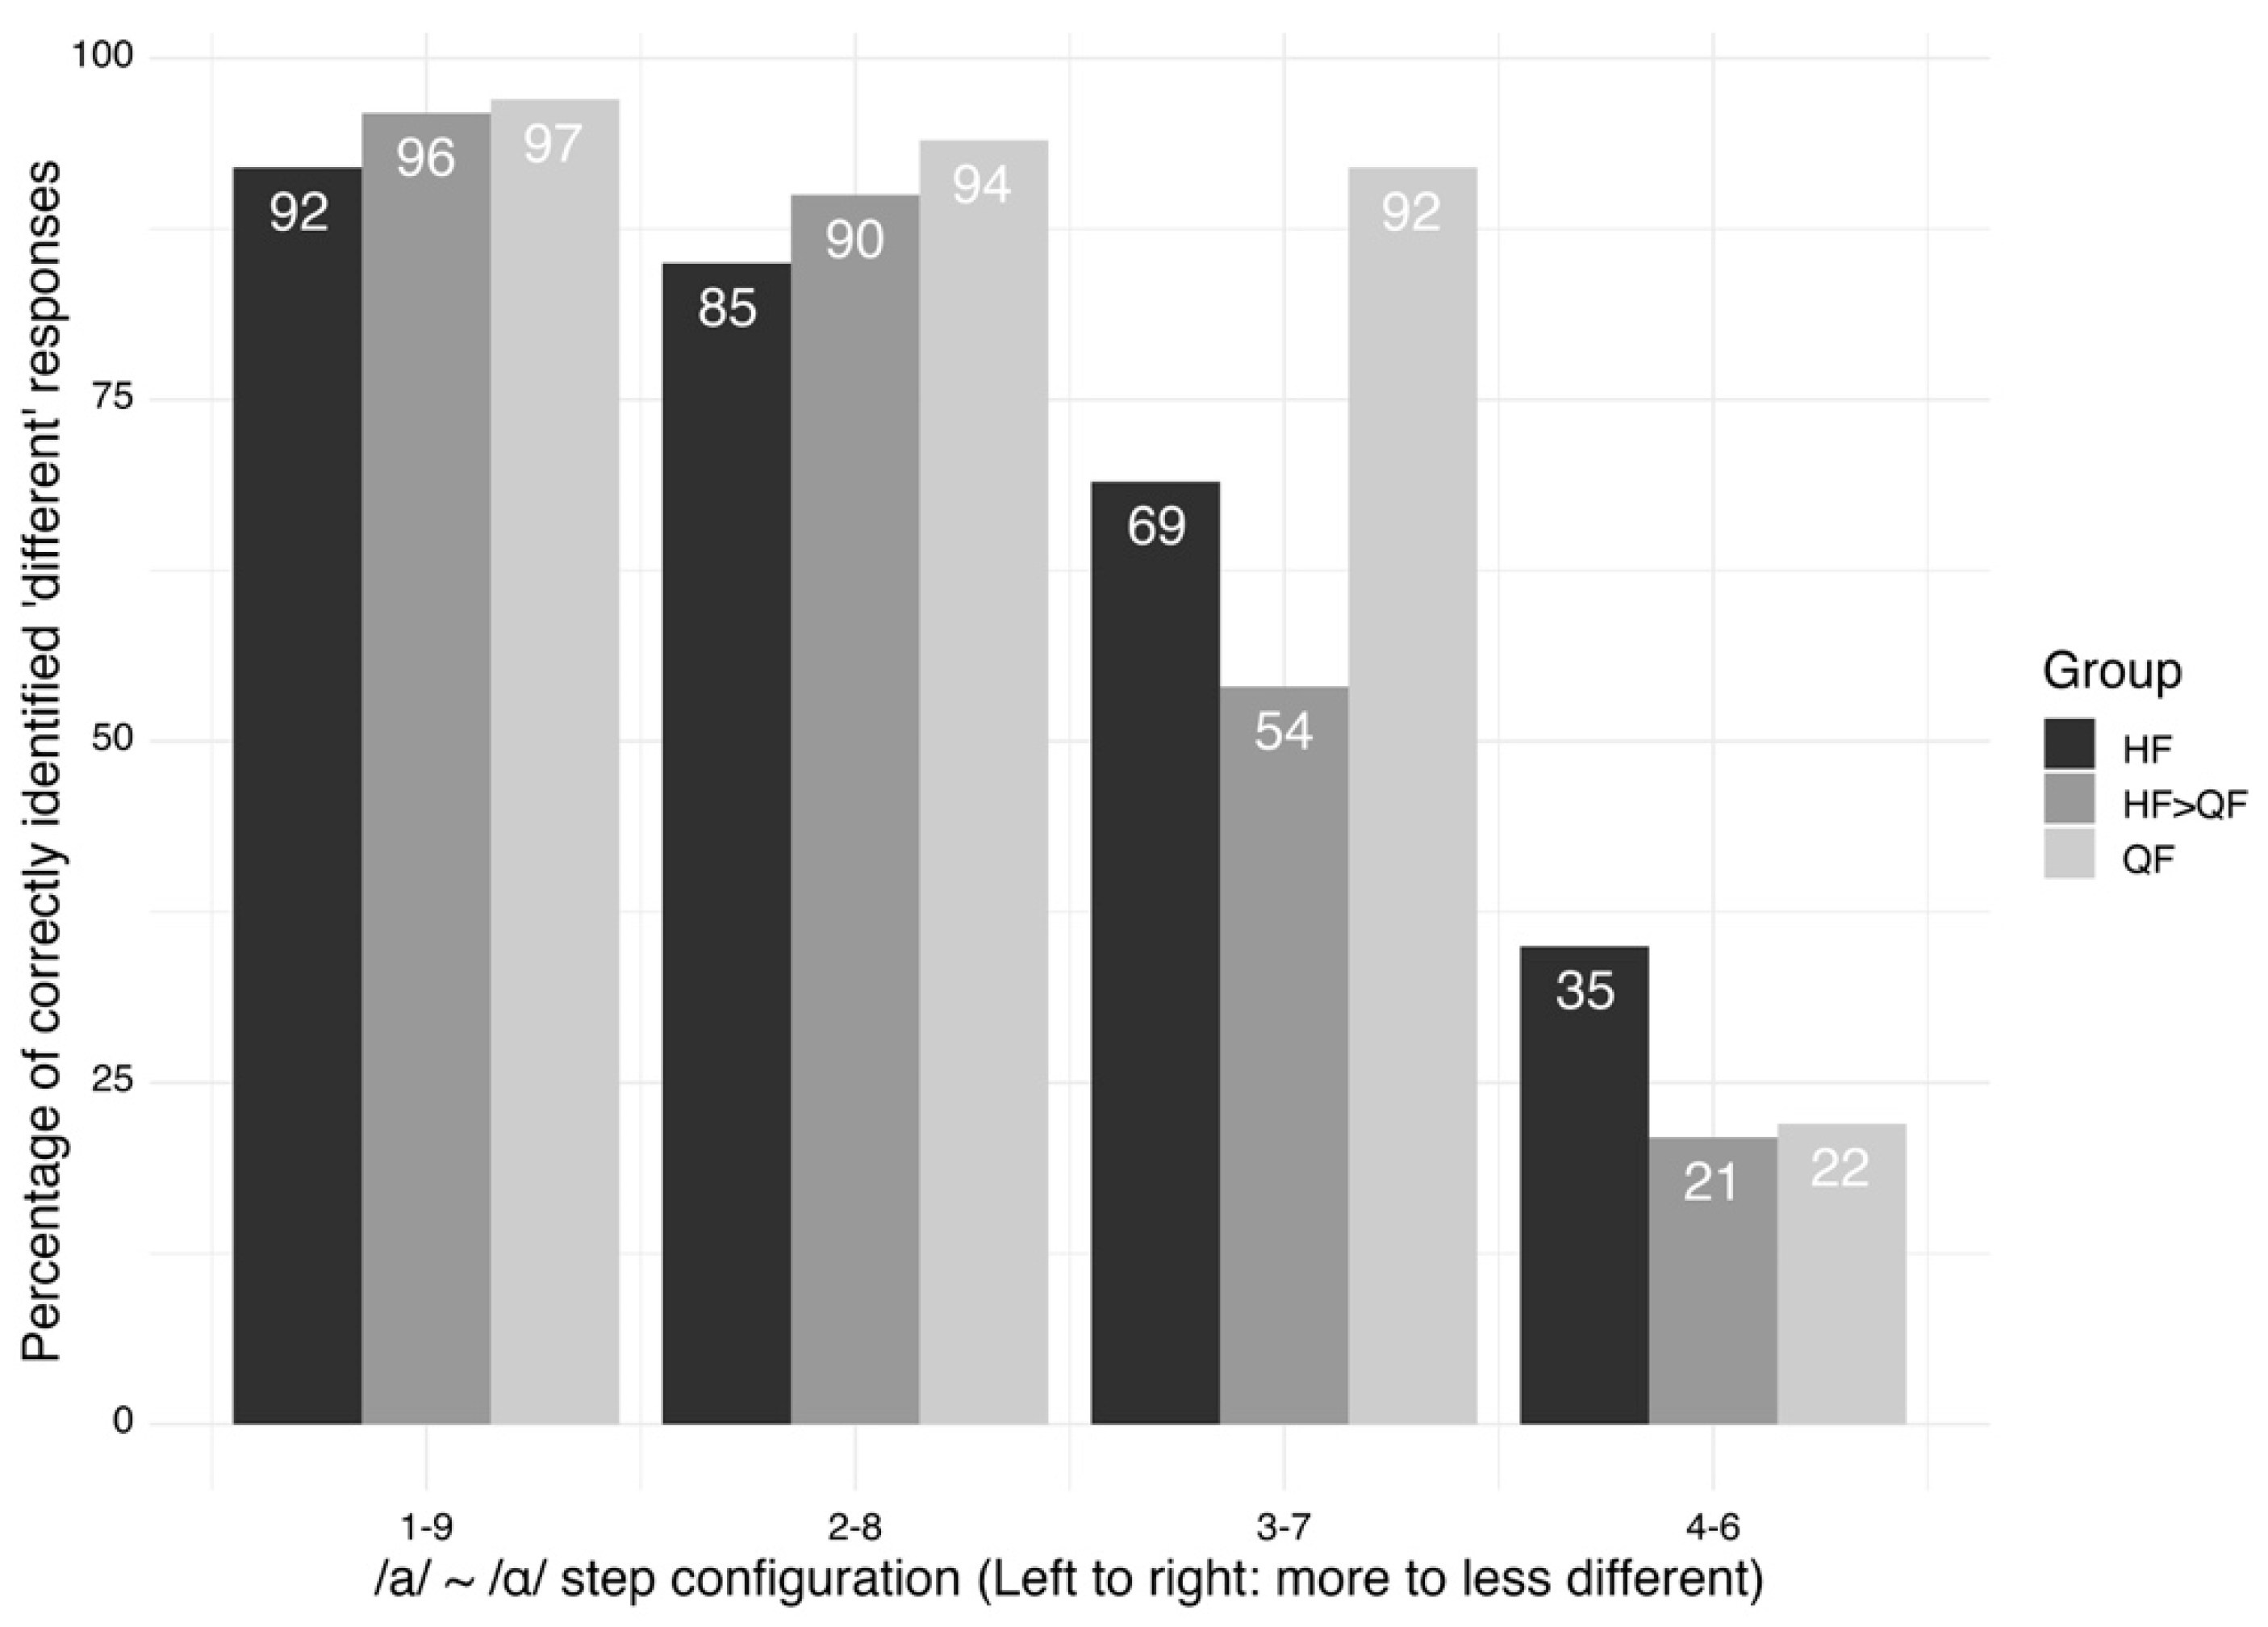
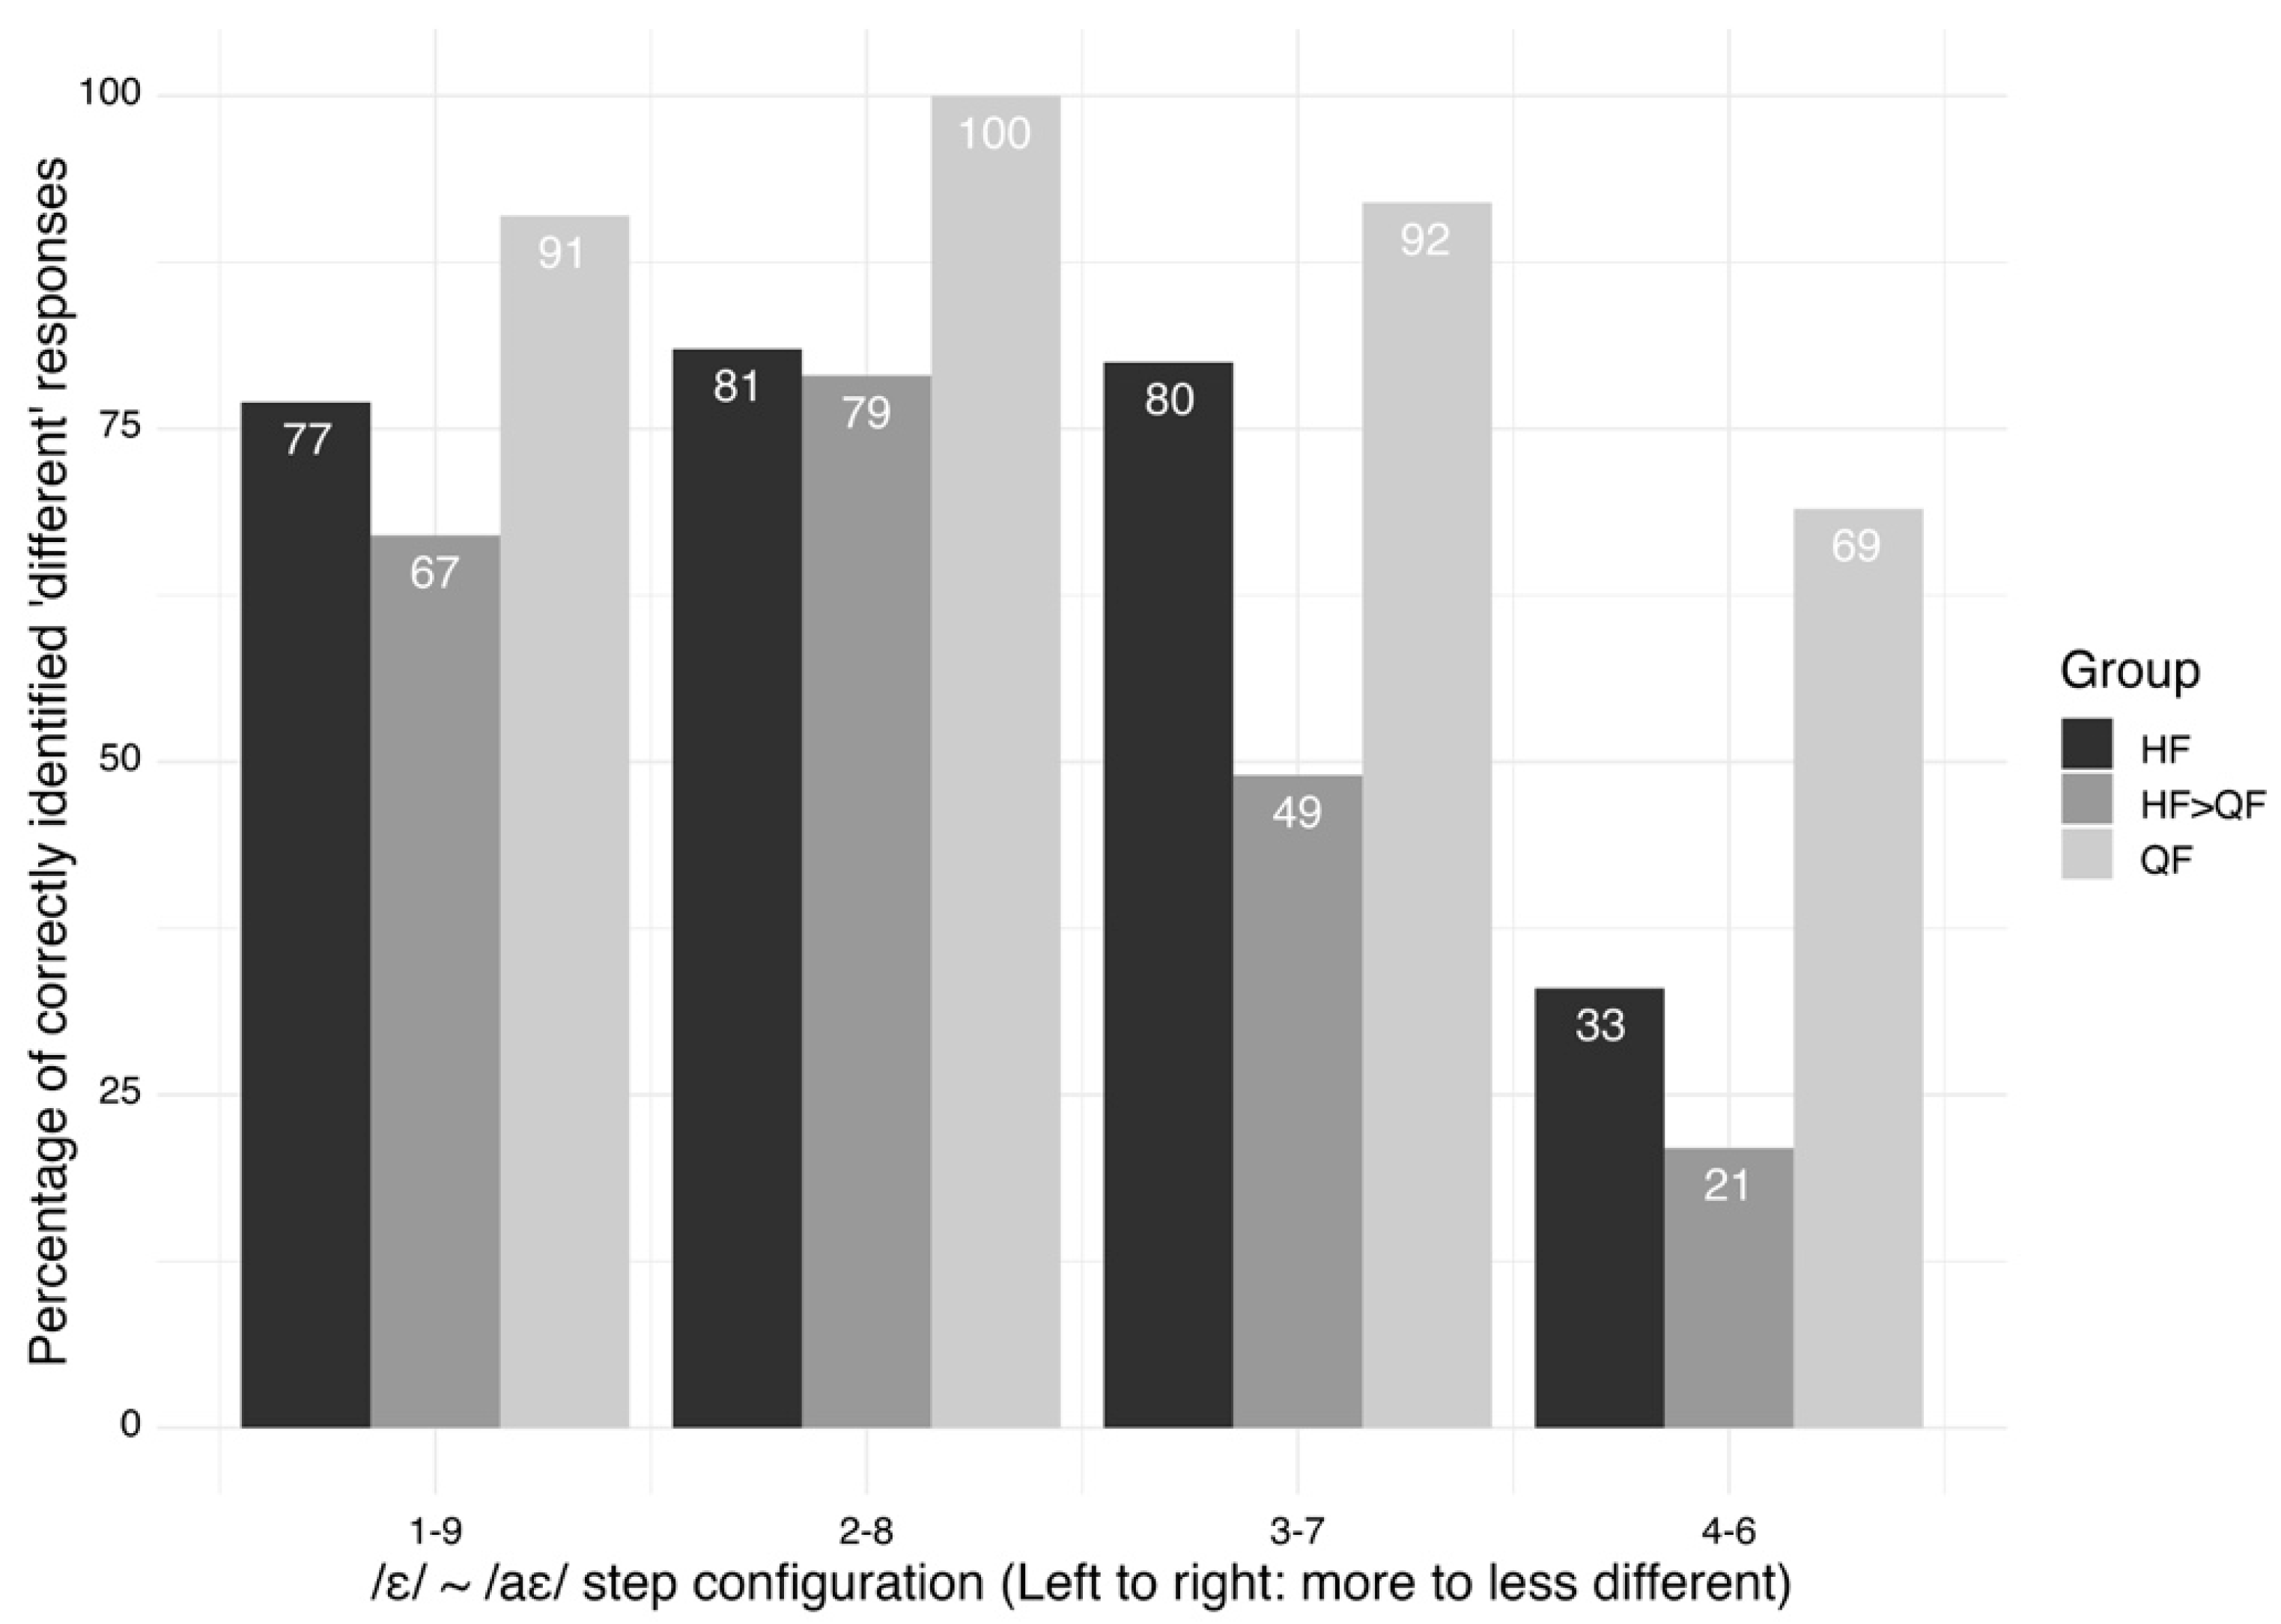
| 3 | Pairing the tokens in increasingly similar steps towards the center step in the vowel continua (e.g., steps 2–8, steps 3–7, 4–6) may not necessarily be the best way to test perceptual discrimination of these contrasts; in future development of this study, it would be worth testing whether pairing tokens of increasing similarity towards the merged category (e.g., steps 1–9, steps 1–7, steps 1–5, etc.) makes a difference in participants’ discrimination of vowel continua steps. |
| 4 | D’ score measures indicate individuals’ sensitivity to differences between stimuli and are designed to mitigate the influence of response biases (Macmillan and Creelman 2021), with a higher d’ score indicating more sensitivity to a difference and a lower d’ score indicating less sensitivity. |
References
- Adank, Patti, Bronwen G. Evans, Jane Stuart-Smith, and Sophie K. Scott. 2009. Comprehension of familiar and unfamiliar native accents under adverse listening conditions. Journal of Experimental Psychology: Human Perception and Performance 35: 520. [Google Scholar] [CrossRef]
- Alderton, Roy. 2020. Speaker gender and salience in sociolinguistic speech perception: GOOSE-fronting in Standard Southern British English. Journal of English Linguistics 48: 72–96. [Google Scholar] [CrossRef]
- Alku, Paavo, Hannu Tiitinen, and Risto Näätänen. 1999. A method for generating natural-sounding speech stimuli for cognitive brain research. Clinical Neurophysiology 110: 1329–33. [Google Scholar] [CrossRef] [PubMed]
- Amengual, Mark, and Pilar Chamorro. 2015. The effects of language dominance in the perception and production of the Galician mid vowel contrasts. Phonetica 72: 207–36. [Google Scholar] [CrossRef]
- Anwyl-Irvine, Alexander L., Jessica Massonnié, Adam Flitton, Natasha Kirkham, and Jo K. Evershed. 2020. Gorilla in our midst: An online behavioural experiment builder. Behavior Research Methods 52: 388–407. [Google Scholar] [CrossRef] [PubMed]
- Auer, Peter, Birgit Barden, and Beate Grosskopf. 1998. Subjective and objective parameters determining ‘salience’ in long-term dialect accommodation. Journal of Sociolinguistics 2: 163–87. [Google Scholar] [CrossRef]
- Austen, Martha. 2020. Production and perception of the Pin-Pen merger. Journal of Linguistic Geography 8: 115–26. [Google Scholar] [CrossRef]
- Avanzi, Mathieu. 2017. Atlas du Français de nos Régions. Paris: Armand Colin. [Google Scholar]
- Barnard, Marc. 2021. Age, Gender and Autistic-like Traits in Sociophonetic Perception. Master’s thesis, Queen Mary University of London, London, UK. [Google Scholar]
- Bates, Douglas, Martin Mächler, Ben Bolker, and Steve Walker. 2015. Fitting linear mixed-effects models using lme4. Journal of Statistical Software 67: 1–48. [Google Scholar] [CrossRef]
- Berns, Janine. 2015. Merging low vowels in metropolitan French. Journal of French Language Studies 25: 317–38. [Google Scholar] [CrossRef]
- Berns, Janine. 2019. Low vowel variation in three French-speaking countries. Canadian Journal of Linguistics/Revue Canadienne de Linguistique 64: 1–31. [Google Scholar] [CrossRef]
- Bigot, Davy, and Robert A. Papen. 2013. Sur la «norme» du français oral au Québec (et au Canada en général). Langage et Société 146: 115–32. [Google Scholar] [CrossRef]
- Boersma, Paul, and David Weenink. 2021. Praat: Doing Phonetics by Computer [Computer Program]. Version 6.2.04. Available online: http://www.praat.org/ (accessed on 1 December 2021).
- Bowie, David Franklin. 2000. The Effect of Geographic Mobility on the Retention of a Local Dialect. Doctoral dissertation, University of Pennsylvania, Philadelphia, PA, USA. [Google Scholar]
- Brasseur, Annie. 2009. Les Marqueurs Phonétiques de la Perception de L’accent Québécois. Master’s thesis, Université Laval, Québec, QC, Canada. [Google Scholar]
- Bukmaier, Véronique, Jonathan Harrington, and Felicitas Kleber. 2014. An analysis of post-vocalic /s-ʃ/ neutralization in Augsburg German: Evidence for a gradient sound change. Frontiers in Psychology 5: 828. [Google Scholar] [CrossRef] [PubMed]
- Cabrelli, Jennifer, Alicia Luque, and Irene Finestrat-Martínez. 2019. Influence of L2 English phonotactics in L1 Brazilian Portuguese illusory vowel perception. Journal of Phonetics 73: 55–69. [Google Scholar] [CrossRef]
- Celata, Chiara, and Jessica Cancila. 2010. Phonological attrition and the perception of geminate consonants in the Lucchese community of San Francisco (CA). International Journal of Bilingualism 14: 185–209. [Google Scholar] [CrossRef]
- Chalier, Marc. 2021. Les normes de prononciation du français: Une étude perceptive panfrancophone. Berlin: Walter de Gruyter. [Google Scholar] [CrossRef]
- Chambers, Jack K. 1992. Dialect acquisition. Language 68: 673–705. [Google Scholar] [CrossRef]
- Clopper, Cynthia G., and Ann R. Bradlow. 2008. Perception of dialect variation in noise: Intelligibility and classification. Language and Speech 51: 175–98. [Google Scholar] [CrossRef]
- Conrey, Brianna, Geoffrey F. Potts, and Nancy A. Niedzielski. 2005. Effects of dialect on merger perception: ERP and behavioral correlates. Brain and Language 95: 435–49. [Google Scholar] [CrossRef]
- Côté, Marie-Hélène, and Mélanie Lancien. 2019. The/ε/-/ɜ/contrast in Quebec French. Paper presented at the 19th International Congress of Phonetic Sciences, Melbourne, Australia, August 5–9; pp. 1530–34. [Google Scholar]
- de Leeuw, Esther, Enkeleida Kapia, and Scott Lewis. 2023. Sound change in Albanian monolinguals and Albanian–English sequential bilingual returnees in Tirana, Albania. Languages 8: 80. [Google Scholar] [CrossRef]
- de Leeuw, Esther, Linnaea Stockall, Dimitra Lazaridou-Chatzigoga, and Celia Gorba Masip. 2021. Illusory vowels in Spanish–English sequential bilinguals: Evidence that accurate L2 perception is neither necessary nor sufficient for accurate L2 production. Second Language Research 37: 587–618. [Google Scholar] [CrossRef]
- Dufour, Sophie, Noël Nguyen, and Ulrich Hans Frauenfelder. 2007. The perception of phonemic contrasts in a non-native dialect. The Journal of the Acoustical Society of America 121: EL131–EL136. [Google Scholar] [CrossRef]
- Evans, Bronwen G., and Paul Iverson. 2004. Vowel normalization for accent: An investigation of best exemplar locations in northern and southern British English sentences. The Journal of the Acoustical Society of America 115: 352–61. [Google Scholar] [CrossRef] [PubMed]
- Evans, Bronwen G., and Paul Iverson. 2007. Plasticity in vowel perception and production: A study of accent change in young adults. The Journal of the Acoustical Society of America 121: 3814–26. [Google Scholar] [CrossRef] [PubMed]
- Floccia, Caroline, Jeremy Goslin, Frédérique Girard, and Gabrielle Konopczynski. 2006. Does a regional accent perturb speech processing? Journal of Experimental Psychology: Human Perception and Performance 32: 1276. [Google Scholar] [CrossRef] [PubMed]
- Francis, Alexander L., and Valter Ciocca. 2003. Stimulus presentation order and the perception of lexical tones in Cantonese. The Journal of the Acoustical Society of America 114: 1611–21. [Google Scholar] [CrossRef]
- Fridland, Valerie, and Tyler Kendall. 2012. Exploring the relationship between production and perception in the mid front vowels of US English. Lingua 122: 779–93. [Google Scholar] [CrossRef]
- Gess, Randall. 2008. More on (distinctive!) vowel length in historical French. Journal of French Language Studies 18: 175–87. [Google Scholar] [CrossRef]
- Hansen, Anita Berit, and Caroline Juillard. 2011. La phonologie parisienne à trente ans d’intervalle–Les voyelles à double timbre. Journal of French Language Studies 21: 313–59. [Google Scholar] [CrossRef]
- Impe, Leen, Dirk Geeraerts, and Dirk Speelman. 2008. Mutual intelligibility of standard and regional Dutch language varieties. International Journal of Humanities and Arts Computing 2: 101–17. [Google Scholar] [CrossRef]
- Janson, Tore, and Richard Schulman. 1983. Non-distinctive features and their use. Journal of Linguistics 19: 321–36. [Google Scholar] [CrossRef]
- Johnson, Daniel Ezra. 2007. Stability and Change along a Dialect Boundary: The Low Vowels of Southeastern New England. Doctoral dissertation, University of Pennsylvania, Philadelphia, PA, USA. [Google Scholar]
- Kuznetsova, Alexandra, Per B. Brockhoff, and Rune H. B. Christensen. 2017. lmerTest Package: Tests in Linear Mixed Effects Models. Journal of Statistical Software 82: 1–26. [Google Scholar] [CrossRef]
- Labov, William, Mark Karen, and Corey Miller. 1991. Near-mergers and the suspension of phonemic contrast. Language Variation and Change 3: 33–74. [Google Scholar] [CrossRef]
- Lawrence, Daniel. 2018. Sound change and social meaning: The perception and production of phonetic change in York, Northern England. Doctoral dissertation, The University of Edinburgh, Edinburgh, Scotland, UK. [Google Scholar]
- Leblanc, Guillaume. 2012. Une Etude Acoustique des Voyelles Orales Susceptibles D’être Diphtonguées en Français Québécois. Master’s thesis, Université Laval, Québec, QC, Canada. [Google Scholar]
- Lenth, Russell. 2023. Emmeans: Estimated Marginal Means, Aka Least-Squares Means. Available online: https://cran.r-project.org/web/packages/emmeans/index.html (accessed on 25 May 2023).
- Macmillan, Neil A., and C. Douglas Creelman. 2021. Detection Theory: A User’s Guide. London: Routledge. [Google Scholar]
- Marian, Viorica, James Bartolotti, Sarah Chabal, and Anthony Shook. 2012. CLEARPOND: Cross-linguistic easy-access resource for phonological and orthographic neighborhood densities. PLoS ONE 7: e43230. [Google Scholar] [CrossRef] [PubMed]
- Miller, Joanne L., Michèle Mondini, François Grosjean, and Jean-Yves Dommergues. 2011. Dialect effects in speech perception: The role of vowel duration in Parisian French and Swiss French. Language and Speech 54: 467–85. [Google Scholar] [CrossRef]
- New, Boris, Christophe Pallier, Marc Brysbaert, and Ludovic Ferrand. 2004. Lexique 2: A new French lexical database. Behavior Research Methods, Instruments, & Computers 36: 516–24. [Google Scholar]
- Nycz, Jennifer. 2013. New contrast acquisition: Methodological issues and theoretical implications. English Language & Linguistics 17: 325–57. [Google Scholar]
- Nycz, Jennifer. 2015. Second dialect acquisition: A sociophonetic perspective. Language and Linguistics Compass 9: 469–82. [Google Scholar] [CrossRef]
- Pallier, Christophe, Laura Bosch, and Núria Sebastián-Gallés. 1997. A limit on behavioral plasticity in speech perception. Cognition 64: B9–B17. [Google Scholar] [CrossRef] [PubMed]
- Passoni, Elisa, Esther de Leeuw, and Erez Levon. 2022. Bilinguals Produce Pitch Range Differently in Their Two Languages to Convey Social Meaning. Language and Speech 65: 1071–95. [Google Scholar] [CrossRef]
- R Core Team. 2023. R: A Language and Environment for Statistical Computing. Version 4.3.0. Vienna: R Foundation for Statistical Computing. [Google Scholar]
- Reinke, Kristin, and Luc Ostiguy. 2016. Le français québécois d’aujourd’hui. In Le français québécois d’aujourd’hui. Berlin: de Gruyter. [Google Scholar]
- Riverin-Coutlée, Josiane, and Johanna-Pascale Roy. 2020. A descriptive account of the Quebec French diphthong FÊTE. Journal of the International Phonetic Association 52: 228–245. [Google Scholar] [CrossRef]
- Riverin-Coutlée, Josiane, and Vincent Arnaud. 2015. Regional backgrounds and discrimination patterns: A preliminary perceptual study in Quebec French. Paper presented at the International Conference of Phonetic Sciences, Glasglow, UK, August 10–14. [Google Scholar]
- Scott, Donia R., and Anne Cutler. 1984. Segmental phonology and the perception of syntactic structure. Journal of Verbal Learning and Verbal Behavior 23: 450–66. [Google Scholar] [CrossRef]
- Tagliamonte, Sali A. 2013. Comparative sociolinguistics. In The Handbook of Language Variation and Change. Edited by Jack K. Chambers, Peter Trudgill and Natalie Schilling-Estes. Oxford: Wiley-Blackwell, pp. 128–56. [Google Scholar] [CrossRef]
- Thomas, Brynmor, and Jennifer Hay. 2005. A pleasant malady: The ellen/allan merger in New Zealand English. Te Reo 48: 69. [Google Scholar]
- Tobin, Stephen J., Hosung Nam, and Carol A. Fowler. 2017. Phonetic drift in Spanish-English bilinguals: Experiment and a self-organizing model. Journal of Phonetics 65: 45–59. [Google Scholar] [CrossRef] [PubMed]
- Trudgill, Peter. 1986. Dialects in Contact. Oxford: Blackwell. [Google Scholar]
- Voeten, Cesko C. 2021. Individual differences in the adoption of sound change. Language and Speech 64: 705–41. [Google Scholar] [CrossRef] [PubMed]
- Wade, Lacey. 2017. The role of duration in the perception of vowel merger. Laboratory Phonology 8: 1–34. [Google Scholar] [CrossRef][Green Version]
- Walker, Abby. 2018. The effect of long-term second dialect exposure on sentence transcription in noise. Journal of Phonetics 71: 162–76. [Google Scholar] [CrossRef]
- Walker, Abby. 2019. The role of dialect experience in topic-based shifts in speech production. Language Variation and Change 31: 135–63. [Google Scholar] [CrossRef]
- Wickham, Hadley, Winston Chang, and Maintainer Hadley Wickham. 2016. Package ‘ggplot2’. Create Elegant Data Visualisations Using the Grammar of Graphics. Version 2: 1–189. [Google Scholar]
- Winter, Bodo, and Sven Grawunder. 2012. The phonetic profile of Korean formal and informal speech registers. Journal of Phonetics 40: 808–15. [Google Scholar] [CrossRef]
- Ziliak, Zoe Lynn. 2012. The Relationship between Perception and Production in Adult Acquisition of a New Dialect’s Phonetic System. Doctoral dissertation, University of Florida, Gainesville, FL, USA. [Google Scholar]
| Phonemic Contrast | Minimal Pairs | Pronunciation in HF | Pronunciation in QF |
|---|---|---|---|
| /a ~ ɑ/ | patte ‘paw’ ~ pâte ‘dough’ | [pat] ~ [pat] | [pat] ~ [pɑt] |
| tache ‘stain’ ~ tâche ‘task’ | [taʃ] ~ [taʃ] | [taʃ] ~ [tɑʃ] | |
| /ε ~ aε/ | laide ‘ugly’ ~ l’aide ‘the help’ | [lεd] ~ [lεd] | [lεd] ~ [laεd] |
| mettre ‘to put’ ~ maître ‘master’ | [mεtʁ] ~ [mεtʁ] | [mεtʁ] ~ [maεtʁ] | |
| /u ~ y/ | boule ‘ball’ ~ bulle ‘bubble’ | [bul] ~ [byl] | [bʊl] ~ [bʏl] |
| bouche ‘mouth’ ~ bûche ‘log’ | [buʃ] ~ byʃ] | [bʊʃ] ~ [bʏʃ] | |
| /o ~ ɔ/ | saute ‘jump’ ~ sotte ‘dumb’ | [sot] ~ [sɔt] | [sot] ~ [sɔt] |
| /e ~ ε/ | épée ‘sword’ ~ épais ‘thick’ | [epe] ~ [epε] | [epe] ~ [epε] |
| Continuum | Mean (SD) | 1 | 2 | 3 | 4 | 5 | 6 | 7 | 8 | 9 |
|---|---|---|---|---|---|---|---|---|---|---|
| patte-pâte | 5.25 (2.5) | 5.3 | 4.2 | 4.5 | 4.9 | 5 | 5.7 | 6 | 5.7 | 6 |
| tache-tâche | 4.96 (2.6) | 2.5 | 3.7 | 4.2 | 4.2 | 6.2 | 5.1 | 6.7 | 6.6 | 5.5 |
| l’aide-laide | 6.03 (2.7) | 4.9 | 4.1 | 5.3 | 4.4 | 5.6 | 8 | 6.3 | 7.5 | 8.2 |
| mettre-maître | 5.17 (2.9) | 2 | 3.7 | 3.6 | 2.6 | 5.2 | 6.9 | 7.1 | 7.7 | 7.8 |
| Participant Group | Gender Ratio (F:M) | Age (Mean (SD)) | Mean Age of Migration to Quebec | Mean Length of Residence in Quebec |
|---|---|---|---|---|
| HF group (n = 13) | 5:8 | 42.8 (8) | n/a | n/a |
| QF group (n = 10) | 4:6 | 34.4 (10) | n/a | n/a |
| HF-QF group (n = 12) | 9:3 | 45.7 (7.5) | 22 | 7 |
| Gender | Age | Age of Migration (in Years) | LoR in Quebec (in Years) | Residence in Quebec | Birthplace in France |
|---|---|---|---|---|---|
| F | 30 | 27 | 3 | Gatineau | Firminy |
| F | 33 | 28 | 5 | Quebec City | Nogent-sur-Marne (Paris) |
| F | 29 | 22 | 7 | Gatineau | Cambrai |
| F | 35 | 27 | 8 | Trois-Rivières | Rennes |
| M | 47 | 37 | 10 | Quebec City | Villerupt |
| F | 49 | 38 | 11 | Portneuf | Marseille |
| F | 63 | 50 | 13 | Quebec City | Saint-Étienne |
| M | 50 | 33 | 17 | Quebec City | Toulon |
| M | 41 | 23 | 18 | Mont-Saint-Hilaire | Sarcelles (Paris) |
| F | 53 | 35 | 18 | Gatineau | Annonay |
| F | 51 | 29 | 22 | Quebec City | Conflans Ste Honorine (Paris) |
| F | 67 | 25 | 42 | Gatineau | Paris |
| HF Group | HF>QF Group | QF Group | ||||
|---|---|---|---|---|---|---|
| Score | Rate (%) | Score | Rate (%) | Score | Rate (%) | |
| ‘Same’ | 339/363 | 93.4 | 316/332 | 95.2 | 233/252 | 92.5 |
| ‘Different’ | 287/415 | 68.9% | 225/377 | 59.7% | 234/285 | 82.1% |
| d’ | 1.82 | 2.05 | 2.00 | |||
| Estimate | Std. Error | z-Value | p-Value | |
|---|---|---|---|---|
| (Intercept = group = HF, contrast = low) | −2.59 | 0.56 | −4.62 | <0.0001 |
| group = HF>QF | −0.64 | 0.91 | −0.71 | 0.479 |
| group = QF | −1.08 | 1.16 | −0.93 | 0.35 |
| contrast = mid | 1.31 | 0.62 | 2.11 | 0.034 |
| group = HF>QF, contrast = mid | 1.15 | 1.01 | 1.14 | 0.252 |
| group = QF, contrast = mid | −0.11 | 1.33 | −0.08 | 0.929 |
| Estimate | Std. Error | z-Value | p-Value | |
|---|---|---|---|---|
| (Intercept = group = HF) | −1.7 | 0.38 | −4.43 | <0.0001 |
| group = HF>QF | −0.44 | 0.60 | −0.73 | 0.463 |
| group = QF | −1.09 | 0.82 | −1.33 | 0.182 |
| Estimate | Std. Error | z-Value | p-Value | |
|---|---|---|---|---|
| (Intercept = group = HF) | −1.44 | 0.35 | −4.08 | <0.0001 |
| group = HF>QF | 0.10 | 0.50 | 0.20 | 0.841 |
| group = QF | −18.13 | 1792.34 | −0.01 | 0.992 |
| Estimate | Std. Error | z-Value | p-Value | |
|---|---|---|---|---|
| (Intercept = group = HF, contrast = low) | −0.94 | 0.42 | −2.22 | 0.027 |
| group = HF>QF | 0.74 | 0.61 | 1.22 | 0.222 |
| group = QF | −1.83 | 0.84 | −2.17 | 0.030 |
| contrast = mid | −0.69 | 0.49 | −1.40 | 0.163 |
| group = HF>QF, contrast = mid | 0.96 | 0.68 | 1.41 | 0.160 |
| group = QF, contrast = mid | 0.69 | 1.01 | 0.68 | 0.497 |
| Estimate | Std. Error | z-Value | p-Value | |
|---|---|---|---|---|
| (Intercept = group = QF, contrast = low) | −2.77 | 0.73 | −3.74 | 0.0001 |
| group = HF | 1.83 | 0.84 | 2.17 | 0.030 |
| group = HF>QF | 2.57 | 0.86 | 2.99 | 0.002 |
| contrast = mid | 0.79 | 0.82 | 0.00 | 0.999 |
| group = HF contrast = mid | −0.68 | 1 | −0.67 | 0.497 |
| group = HF>QF, contrast = mid | 2.72 | 1 | 0.27 | 0.785 |
| Estimate | Std. Error | z-Value | p-Value | |
|---|---|---|---|---|
| (Intercept = group = HF, contrast = low) | 0.70 | 0.35 | 1.99 | 0.047 |
| group = HF>QF | 0.70 | 0.53 | 1.30 | 0.192 |
| group = QF | 0.63 | 0.58 | 1.10 | 0.272 |
| contrast = mid | 0.09 | 0.43 | 0.22 | 0.827 |
| group = HF>QF, contrast = mid | −0.06 | 0.67 | −0.10 | 0.924 |
| group = QF, contrast = mid | −2.26 | 0.71 | −3.17 | 0.002 |
| Contrast | Odds Ratio | SE | df | Null | z-Ratio | p-Value |
|---|---|---|---|---|---|---|
| HF low/HF>QF low | 0.50 | 0.27 | Inf | 1 | −1.30 | 0.783 |
| HF low/QF low | 0.53 | 0.31 | Inf | 1 | −1.10 | 0.882 |
| HF low/HF mid | 0.91 | 0.40 | Inf | 1 | −0.22 | 1.000 |
| HF low/HF>QF mid | 0.48 | 0.26 | Inf | 1 | −1.36 | 0.749 |
| HF low/QF mid | 4.64 | 2.58 | Inf | 1 | 2.76 | 0.064 |
| HF>QF low/QF low | 1.07 | 0.65 | Inf | 1 | 0.10 | 1.000 |
| HF>QF low/HF mid | 1.83 | 0.98 | Inf | 1 | 1.12 | 0.873 |
| HF>QF low/HF>QF mid | 0.97 | 0.50 | Inf | 1 | −0.06 | 1.000 |
| HF>QF low/QF mid | 9.31 | 5.53 | Inf | 1 | 3.76 | 0.002 |
| QF low/HF mid | 1.71 | 0.99 | Inf | 1 | 0.93 | 0.939 |
| QF low/HF>QF mid | 0.91 | 0.56 | Inf | 1 | −0.15 | 1.000 |
| QF low/QF mid | 8.74 | 4.94 | Inf | 1 | 3.84 | 0.002 |
| HF mid/MF mid | 0.53 | 0.29 | Inf | 1 | −1.18 | 0.846 |
| HF mid/QF mid | 5.10 | 2.85 | Inf | 1 | 2.91 | 0.042 |
| HF>QF mid/QF mid | 9.60 | 5.70 | Inf | 1 | 3.81 | 0.002 |
Disclaimer/Publisher’s Note: The statements, opinions and data contained in all publications are solely those of the individual author(s) and contributor(s) and not of MDPI and/or the editor(s). MDPI and/or the editor(s) disclaim responsibility for any injury to people or property resulting from any ideas, methods, instructions or products referred to in the content. |
© 2023 by the authors. Licensee MDPI, Basel, Switzerland. This article is an open access article distributed under the terms and conditions of the Creative Commons Attribution (CC BY) license (https://creativecommons.org/licenses/by/4.0/).
Share and Cite
Kunkel, S.; Passoni, E.; de Leeuw, E. Perceptual Discrimination of Phonemic Contrasts in Quebec French: Exposure to Quebec French Does Not Improve Perception in Hexagonal French Native Speakers Living in Quebec. Languages 2023, 8, 193. https://doi.org/10.3390/languages8030193
Kunkel S, Passoni E, de Leeuw E. Perceptual Discrimination of Phonemic Contrasts in Quebec French: Exposure to Quebec French Does Not Improve Perception in Hexagonal French Native Speakers Living in Quebec. Languages. 2023; 8(3):193. https://doi.org/10.3390/languages8030193
Chicago/Turabian StyleKunkel, Scott, Elisa Passoni, and Esther de Leeuw. 2023. "Perceptual Discrimination of Phonemic Contrasts in Quebec French: Exposure to Quebec French Does Not Improve Perception in Hexagonal French Native Speakers Living in Quebec" Languages 8, no. 3: 193. https://doi.org/10.3390/languages8030193
APA StyleKunkel, S., Passoni, E., & de Leeuw, E. (2023). Perceptual Discrimination of Phonemic Contrasts in Quebec French: Exposure to Quebec French Does Not Improve Perception in Hexagonal French Native Speakers Living in Quebec. Languages, 8(3), 193. https://doi.org/10.3390/languages8030193


