
Skip to Content
LanguagesLanguages
  • Article
  • Open Access

7 May 2026

/t/ Production in Mainstream and Aboriginal Australian Englishes in Warrnambool and Mildura: A Sociophonetic Acoustic Study

,
and
1
School of Languages and Linguistics, The University of Melbourne, Parkville, VIC 3010, Australia
2
Department of Theoretical and Applied Linguistics, University of Cambridge, Cambridge CB3 9DA, UK
*
Author to whom correspondence should be addressed.
This article belongs to the Special Issue Advances in Australian English

Abstract

A sociophonetic study of coda /t/ in Australian Englishes spoken in Warrnambool and Mildura, Victoria, Australia, is described. A total of 2112 coda /t/ tokens produced by 61 adult L1 speakers was analyzed using auditory and acoustic profiling, focusing on four social factors (location, dialect, age and gender). The corpus included 33 Aboriginal English and 28 Mainstream Australian English speakers (24 male, 37 female) who fell into roughly equal age groups of <40 and >40 years. Overall, the “canonical” (aspirated) variant [th] was most frequently observed, followed by affricate [ts] and pre-glottalized [ˀt]; these variants accounted for 79% of all tokens. As for sociophonetic patterning, the best-fitting model included all four predictors (location, dialect, age and gender), with random intercepts for speaker and word. Dialect (Aboriginal or Mainstream Australian English) and age showed the strongest sociophonetic patterning, followed by limited effects for location. Variants were subsequently grouped into three superordinate categories—“breathy”, “canonical” (aspirated) and “glottal”—and a model was created including all four predictors and all two-way interactions between them, with random intercepts for speaker and word. This model showed that linking variants with broad voice qualities highlights even stronger sociophonetic patterning in some cases and is a promising direction for future research. The study contributes findings to three under-explored areas: consonant variability in Australian Englishes, fine-grained phonetic variation in Australian Aboriginal English, and analysis of speech from non-urban locations.

1. Introduction

Until recently, research on the phonetic characteristics of Australian English has mostly concerned the “mainstream” variety (Mainstream Australian English, MAE) spoken by the majority of non-Indigenous people born in Australia.1 Australian Aboriginal English(es) (AAE) is a separate variety which has developed among Australian Indigenous communities and can be spoken as a first or second language. It exhibits differences from MAE in its grammar, lexicon and pragmatic systems (Dickson, 2020; Butcher, 2008; Malcolm, 2008; Rodríguez Louro & Collard, 2024). AAE has also been reported to differ from MAE in its sound system, with respect to vowels (Butcher & Anderson, 2008; Loakes & Gregory, 2024), prosody (Jespersen, 2016), and voice quality (Loakes & Gregory, 2022), and in the way that disfluencies are used in interaction (McDougall et al., 2024; Blackwell & McDougall, 2024).
English is used widely among Indigenous people in Australia, reportedly spoken by 84.1% of Aboriginal people at home, either as a first or second language, and alongside other traditional languages or as a sole language (Australian Bureau of Statistics, 2021). In the 2021 Australian census, of the 76,978 Aboriginal and Torres Strait Islander people who reported speaking an Indigenous language, 1371 specifically identified as speaking “Aboriginal English” (Australian Bureau of Statistics, 2021). This number is relatively low, but it only reflects the number of people who overtly categorize their accent variety as AAE. The difficulty in categorizing Aboriginal English is a known issue and one recognized by Butcher (2008, p. 627), who stated that “…it is nearly impossible to estimate the total of speakers of AAE. The majority of AAE speakers will speak a relatively acrolectal variety of Aboriginal English as their first and only language. These speakers will not be differentiated from habitual [MAE] speakers in censuses and surveys”.
The present work describes a sociophonetic study of MAE and AAE spoken in Warrnambool and Mildura, Victoria, investigating coda /t/.2

1.1. /t/ Variation in Mainstream Australian English

While earlier work on the sociophonetics of MAE was mostly concerned with vowel variation, variation in consonant production has increasingly become a focus of research. Prior to outlining some of the key findings regarding /t/ realization in MAE, some notes on terminology are needed. A term that requires clear definition (and justification) is canonical, which is used here to mean “unmarked”. This term is explicitly used to describe /t/ in the literature on Australian English (e.g., Penney et al., 2018; Docherty et al., 2018) and is effectively the category used for broad transcription in this variety (i.e., Cox & Fletcher, 2017). Using canonical for the aspirated term is also common in other phonetic literature on /t/, for example, in American English. Fritche et al. (2021, p. 2) describe aspirated /t/ as “canonical” and as the phonemic category, while other variants, such as glottalized and unreleased realizations, are considered allophones. Further, for consistency, the term tap is used in the present review of the literature to describe the type of consonantal sound involving a single, short articulatory movement in which the tongue tip makes contact with the alveolar ridge, in line with the term used in the current phonetic literature relating to Australian English (see, e.g., the description in Powell-Davies & Billington, 2024, p. 212). This is in contrast with Horvath (1985) and Ingram (1989), who use flap to describe such an allophone of /t/, and Tollfree (1996), who use voiced. In Australian English, the tapped variant is often observed in intervocalic position (which is not the focus of the present study).
Variation in the production of /t/ in MAE has been studied across a range of locations in Australia at different time points, from a variety of perspectives. The earliest work used auditory analysis and started with speakers from Sydney, New South Wales (Horvath, 1985; Haslerud, 1995) and Brisbane, Queensland (Ingram, 1989) and included Tollfree’s (1996) primarily phonological study that used a combined sample from several major cities. These were followed by auditory-acoustic studies based in Melbourne, Victoria (Tollfree, 2001, [Melbourne and surrounding rural areas]; Jones & McDougall, 2009; Loakes & McDougall, 2010) and Yarrawonga, Victoria (Tait & Tabain, 2016; Ford, 2018), then Perth, Western Australia (Docherty et al., 2018) and Hobart, Tasmania (Powell-Davies & Billington, 2024). More recent auditory-acoustic work has been conducted in Sydney (Penney et al., 2018, 2020, 2021; White et al., 2025; Diskin-Holdaway et al., 2024), while further Sydney-based research by Ratko et al. (2023) and Penney et al. (2025) includes articulatory investigation.
There are some complex observations on the realization of /t/ in MAE across the literature depending on regional location, gender, socioeconomic status, phonetic and prosodic context, speaking style, potential change in allophonic use over time, and even analysis style (auditory versus acoustic). Certain variants of /t/, specifically canonical, tapped and fricated, are consistently identified in the MAE literature, while other variants, such as affricated, glottalized, unreleased and preaspirated, also feature in a number of studies, particularly in recent years.
Some sociolinguistic usage patterns are evident for MAE /t/, such as glottal(ized) variants appearing to be associated more with male and younger speakers (Penney et al., 2018, 2020). Taps have tended to be favoured by younger speakers historically (Horvath, 1985; Tollfree, 1996), lower socioeconomic groups (Haslerud, 1995; Tollfree, 2001) and males (Horvath, 1985; Loakes & McDougall, 2010; Powell-Davies & Billington, 2024). Socioeconomic status seems to play some role in whether speakers use aspirated or fricated variants, with higher socioeconomic status appearing to equate with greater use of these tokens (Horvath, 1985; Haslerud, 1995; Tollfree, 2001; Jones & McDougall, 2009; Docherty et al., 2018; Powell-Davies & Billington, 2024).
The fricated variant was first noted by Haslerud (1995) in speakers from Sydney and by Tollfree (1996) within a mixed group of speakers from Sydney, Melbourne, Adelaide and Canberra. The lack of mention of this variant in the studies from the 1980s (Horvath, 1985; Ingram, 1989) has prompted speculation over the extent to which it is an innovation, whether perhaps it has been below the awareness of local Australian phoneticians (cf. Tollfree, 1996, p. 201), or whether it is regionally based and simply not present in the Sydney and Brisbane data of the 1980s studies. Fricated variants do exist in Mitchell & Delbridge’s 1959–1960 Australian English corpus (Mitchell & Delbridge, 1965), at least for speakers from Hobart (cf. Powell-Davies & Billington, 2024) and Melbourne (cf. Jones & McDougall, 2009; Loakes & McDougall, 2010). As well as being associated with speakers with higher socioeconomic status, there is some evidence that fricated /t/ is favoured by older speakers (Tollfree, 1996, 2001; Penney et al., 2021) and female speakers (Haslerud, 1995; Jones & McDougall, 2009; Penney et al., 2021), although some studies have not observed gender differences (Ford, 2018; White et al., 2025). There is also some evidence for /t/ frication being linked to education, as shown by the perceptual investigation carried out by Shea et al. (2023). Overall, the sociophonetic picture for fricated /t/ in MAE is not clear due to each study focusing on different locations and demographic groups and on different speech styles and linguistic contexts.
A study of Sydney-based speakers by White et al. (2025) has explored the impact of community diversity on /t/ production, i.e., whether speakers lived in a “superdiverse”, “diverse”, or non-diverse area, with respect to speakers’ multilingual backgrounds. Speakers in the (super)diverse areas had the most exposure to ethnic and linguistic diversity, while speakers in non-diverse areas had the least. While tapped /t/ was the most common variant across the corpus, speakers from monolingual and monocultural (non-diverse) backgrounds were significantly less likely to use it, producing more allophonic variants, such as fricatives and glottalized variants, than speakers from more diverse areas.
In sum, sex, socioeconomic status and educational background have all been shown to play a part in the patterns of variation in /t/ exhibited in MAE, tempered by phonetic context and speaking style. Regional differences in /t/, meanwhile, remain an open question, and variation in /t/ between MAE and AAE has received limited research attention, as is outlined in Section 1.2.

1.2. /t/ Variation in Australian Aboriginal Englishes

Research on the phonetic characteristics of AAE is much less extensive than for MAE, both generally and regarding /t/ variation in particular. Starting first with some broad overviews of AAE phonology which are based on impressionistic descriptions, Butcher (2008) and Malcolm (2008, 2018) give an overview of AAE phonetic patterns specifically. These studies appear to be focused on L2 varieties (cf. Dickson, 2020), and important aspects of stop production noted by both authors are a lack of voiced/voiceless distinction for stops, while Butcher (2008) elaborates that initial stops in AAE are typically voiced and unaspirated but also exhibit considerable intra-speaker variability. Harkins’ (2000) description of linguistic features of AAE includes a small discussion of the nature of stop production. Harkins indicates that some earlier studies oversimplify the reasons for AAE variability, sometimes referring to differences as errors, mispronunciations, or interference from L1 Aboriginal languages. Harkins (2000, pp. 62–23) instead makes the point that this inter-speaker variability is the result of “phonological and social influences in a complex and systematic interaction that is too often oversimplified and hence misunderstood by speakers of other English varieties.”
Some more recent studies have begun to address this potential systematicity to understand more comprehensively what AAE speakers do. Mailhammer et al. (2020) analyzed stops acoustically in three varieties of AAE compared with MAE. The varieties of AAE were spoken on Croker Island, Northern Australia, and termed Iwaidja English, Kunwinjku English and (L1) Aboriginal English based on the language backgrounds of the speakers. The MAE data were provided by speakers based in Sydney. Voice onset time (VOT), voice termination time (VTT)3 and closure duration (CD) were measured in read speech elicitations of /p t k b d g/. Based on these measures, the three AAE varieties exhibited a voicing distinction. There were no significant differences between the AAE varieties and MAE in VOT or CD across voicing categories, but VTT presented differences between AAE and MAE, with voiceless categories (including in L1 AAE) showing passive phonetic voicing. The authors thus conjectured that this difference in the realization of voice categories may contribute to AAE being perceived as sounding different from MAE. Mailhammer et al. (2020) also observed extensive intra- and inter-speaker variability in the realization of stops for each of the three measures in both L1 and L2 AAE varieties, larger than that seen in MAE.
In his work on English on Croker Island, Mailhammer (2021) makes some additional points about stops in the three Aboriginal English varieties. He points out that all of the variants observed in AAE also occur in MAE but with differing distributional patterns, something it was predicted would occur in the present research given the authors’ earlier (but less comprehensive) work on this topic (Loakes et al., 2022, discussed below).
Another study using acoustic analysis is by Wang et al. (2024), who focused on stop voicing in /p t k b d g/, this time for Central Australian Aboriginal English (CAAE) spoken in Alice Springs. Participants were adult females and children aged 2–11 years. Adult participants undertook conversational interviews; children participated in a linguistic “game” designed to elicit target words via visual prompts. These datasets were used to establish patterns of stop voicing contrasts for word-initial and word-final stops. The authors found that adult speakers used longer VOT for voiceless compared with voiced stops. Word-medial tokens showed this pattern, as well as longer constriction durations for voiced stops. Children’s productions were consistent with the adult data. Allophonic variation in the data is not discussed, with the authors specifically pointing out they were interested in phonemic variation rather than “how … stops were articulatorily implemented or realized” (Wang et al., 2024, p. 91).
While these studies begin to give a picture of the kind of detail used by AAE speakers, many do not examine allophonic or fine-grained phonetic variation or its social patterning. Variation in phonetic detail is a major focus of the present study, especially given that AAE has been shown to have more variability than MAE, both within and between speakers (Harkins, 2000; Butcher, 2008; Mailhammer et al., 2020), and given Harkins’ point that variable pronunciations in AAE are “regular allophonic processes and stable features of the dialect” (Harkins, 2000, p. 63).
Some of the earlier work of the present authors has begun to address the lack of fine-grained phonetic studies on AAE, with a study on /t/ production in both L1 AAE and MAE varieties spoken in Warrnambool, Victoria (Loakes et al., 2018) and with a comparative sample from Mildura (Loakes et al., 2022). The current paper builds on these studies, with more data and a more statistically comprehensive analysis. To review briefly the research reported in Loakes et al. (2018), this study undertook acoustic profiling of /t/ in /hVt/ and /hVtV/ in read speech, finding sociophonetic variation according to dialect (MAE compared with AAE), gender, and age (an older and younger speaker group), as well as within-group variability. Loakes et al. (2022) added a different regional location (Mildura) and found region was also significant, but not for all variants. Greater detail about this work is not provided in the present section because the current paper is a more detailed and comprehensive investigation of the same corpus.
In Loakes et al. (2018) it was speculated as to whether the sociophonetic patterning observed could relate to a link between voice quality and glottal timing (cf. Keating & Esposito, 2007, p. 85). In Loakes et al. (2022), this idea was explored by grouping tokens into different superordinate classes based on whether they were “breathy” or “glottal”, an approach which is also taken in the current paper. This was a promising line of enquiry, showing that broadly classifying /t/ tokens according to both their specific variant and a broader voice quality category was useful for understanding sociophonetic patterns in the data. This aligns with recent acoustic work on word-final stops (Penney et al., 2021), which also suggests a possible voice quality alignment with vowels and consonants, as well as articulatory work (Penney et al., 2025), which links the quality of preceding vowels to the overall quality of /t/.

1.3. The Present Study

In their description of Australian English consonants, Cox and Fletcher (2017, p. 54) highlight the need for a better understanding of social and stylistic patterning of consonants, stating that “[i]t is clear that there are some unresolved questions about the incidence of the various forms of /t/ in the community and further research will be required to tease out the social and stylistic significance of the variants”. Given the variation in /t/ observed in the literature described in Section 1.1 and Section 1.2 above, further work is clearly needed to develop a more comprehensive picture of sociophonetic variation in /t/ in Australia, especially in non-urban locations. In particular, a domain remaining largely unexplored is that of /t/ realization in AAE and the extent to which it varies from mainstream varieties. The present study thus aims to investigate the sociophonetic variation in coda /t/ spoken in two rural locations in Victoria, Australia. The four factors under analysis are location, variety or “dialect” (whether AAE or MAE), age and gender. The study predicts that AAE will have more variability within the variety based on previous work on /t/ in these locations (Loakes et al., 2022) and based on other research that has highlighted greater variability within AAE compared to MAE more generally (e.g., Butcher, 2008).

2. Materials and Methods

2.1. Participants

Two groups of adult L1 speakers of Australian English from Warrnambool and Mildura were recorded. Approximately 250 km from Melbourne, Warrnambool is a coastal city in south-west Victoria. Mildura is located on the NSW border of north-west Victoria, approximately 550 km from the Victorian capital Melbourne and approximately 400 km from another state capital, Adelaide. Warrnambool and Mildura are 534 km apart by road. Warrnambool has a population of approximately 35,000 and Mildura has a population of approximately 57,000 (Australian Bureau of Statistics, 2022a, 2022b). Approximately 1.9% (Warrnambool) and 4.6% (Mildura) of the regions’ residents identify as Indigenous. This compares with 1% of Victoria’s population as a whole identifying as Indigenous, so within Victoria, these two locations have a relatively high proportion of Indigenous people.
The speech of 61 speakers was analyzed: 33 AAE speakers and 28 MAE speakers. In the Warrnambool region, the Aboriginal participants included both Gunditjmara (from the city of Warrnambool and the nearby town of Framlingham) and Gunditj Miring people (from Heywood, about 90 km from the city of Warrnambool). Framlingham is an Aboriginal-owned reserve where all residents are Aboriginal. In Mildura, most of the Aboriginal participants were Barkindji people; some participants were Latji Latji people.
The speakers were all adults (18–72 years) and identified either as male or female. They fell into two roughly equal age groups of <40 (18–39 years) and >40 (40–72 years). AAE speakers identified themselves as “Koori” or “Aboriginal”. The breakdown of speakers by variety, location and gender is given in Table 1.
Table 1. Demographic characteristics of the corpus, including dialect (AAE/MAE), location (Warrnambool/Mildura) and gender (M/F) are shown, and the number of speakers per age group (<40 years/>40 years) is also listed in parentheses to the right of the value in each cell.
A table providing more detailed information about the participants and the /t/ data they provided is given in the Appendix A in Table A1. This includes the speakers’ gender, age, dialect, and location (region) and the total number of /t/ observations analyzed per speaker.

2.2. Data Collection

The data analyzed are from the COEDL Aboriginal and Mainstream Australian English (COEDL-AMAE) corpus, with MAE data collected in 2012–2015 and AAE data in 2015–2016.4 The data were collected by the first author as part of a larger elicitation process which included word-list read speech, sociolinguistic interviews, a perception task and a language background questionnaire. In the present study, the focus is on the read speech.
Recordings were made on a Zoom H4N Handy Recorder at a sampling rate of 44,000 Hz. Recordings of Warrnambool AAE speakers were made in public spaces in the Aboriginal cooperatives in Warrnambool and Heywood and in the health centre at Framlingham. Warrnambool MAE speakers were mostly recorded in their own homes. In Mildura, most recordings of AAE participants were made at a health service, while recordings of MAE speakers were made in a public library space.

2.3. Speech Data

Read speech tokens of word final /t/ in /hVt/ contexts were analyzed. Using Wells’ (1982) lexical sets, the vowel contexts were all of the short vowels: KIT, DRESS, TRAP, LOT, STRUT, FOOT. In Australian English, the corresponding phonetic quality of these vowels is [ɪ e æ ɐ ɔ ʊ] (e.g., Cox & Fletcher, 2017, also see Cox et al., 2024). In total, 2112 tokens were analyzed (1226 AAE, 890 MAE), with an average of 35 tokens per speaker.

2.4. Phonetic Analysis

MAUS (Schiel et al., 2011) was used to segment the phonemes automatically, then segment boundaries were hand-corrected. /t/ tokens were hand-labelled in Praat (Boersma & Weenink, 2025) using auditory and acoustic profiling (see e.g., Foulkes et al., 2010) and implementing the taxonomy of variants established in Loakes et al. (2022).
/t/ tokens were segmented on a “phonetic” tier in Praat using a combination of auditory analysis and visual information from the waveform and spectrogram, which helped to determine both the onset and offset of each /t/. A “/t/-category” tier was used to record classification decisions, that is, the type of variant observed. Names of the /t/-categories and details of the characteristics exhibited by each category are given in Table 2.5
Table 2. /t/-categories and their characteristics.
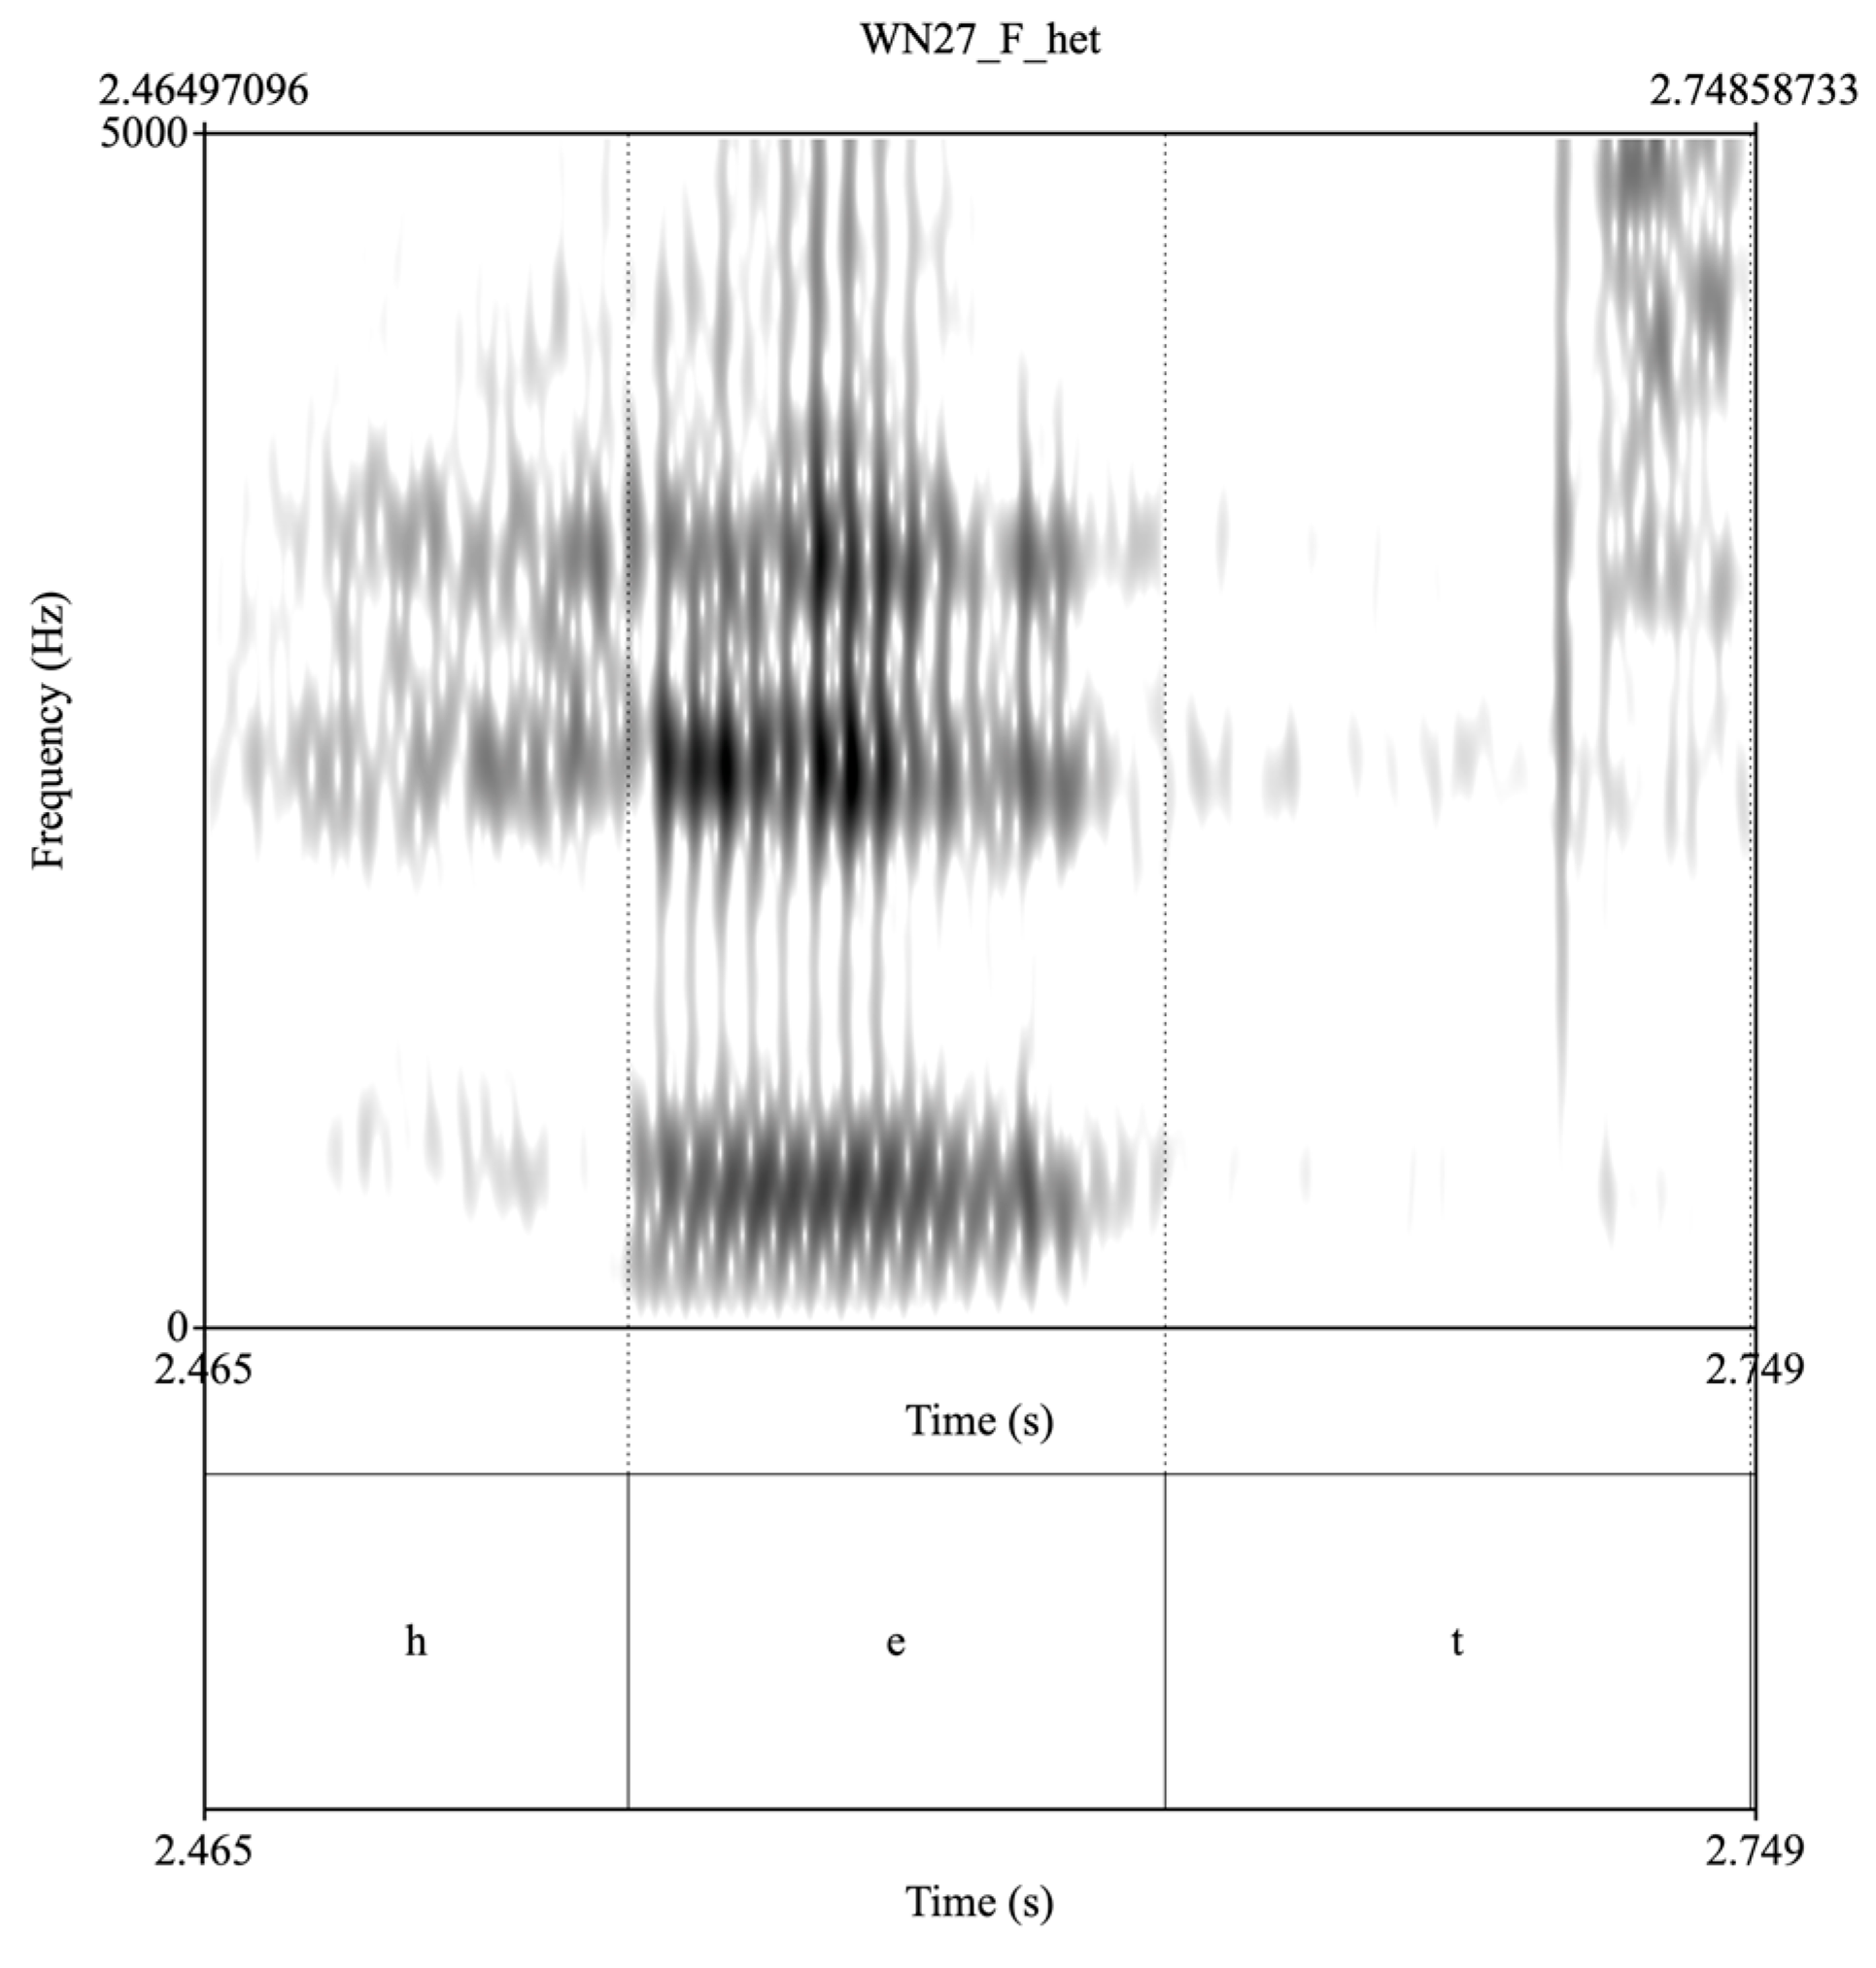
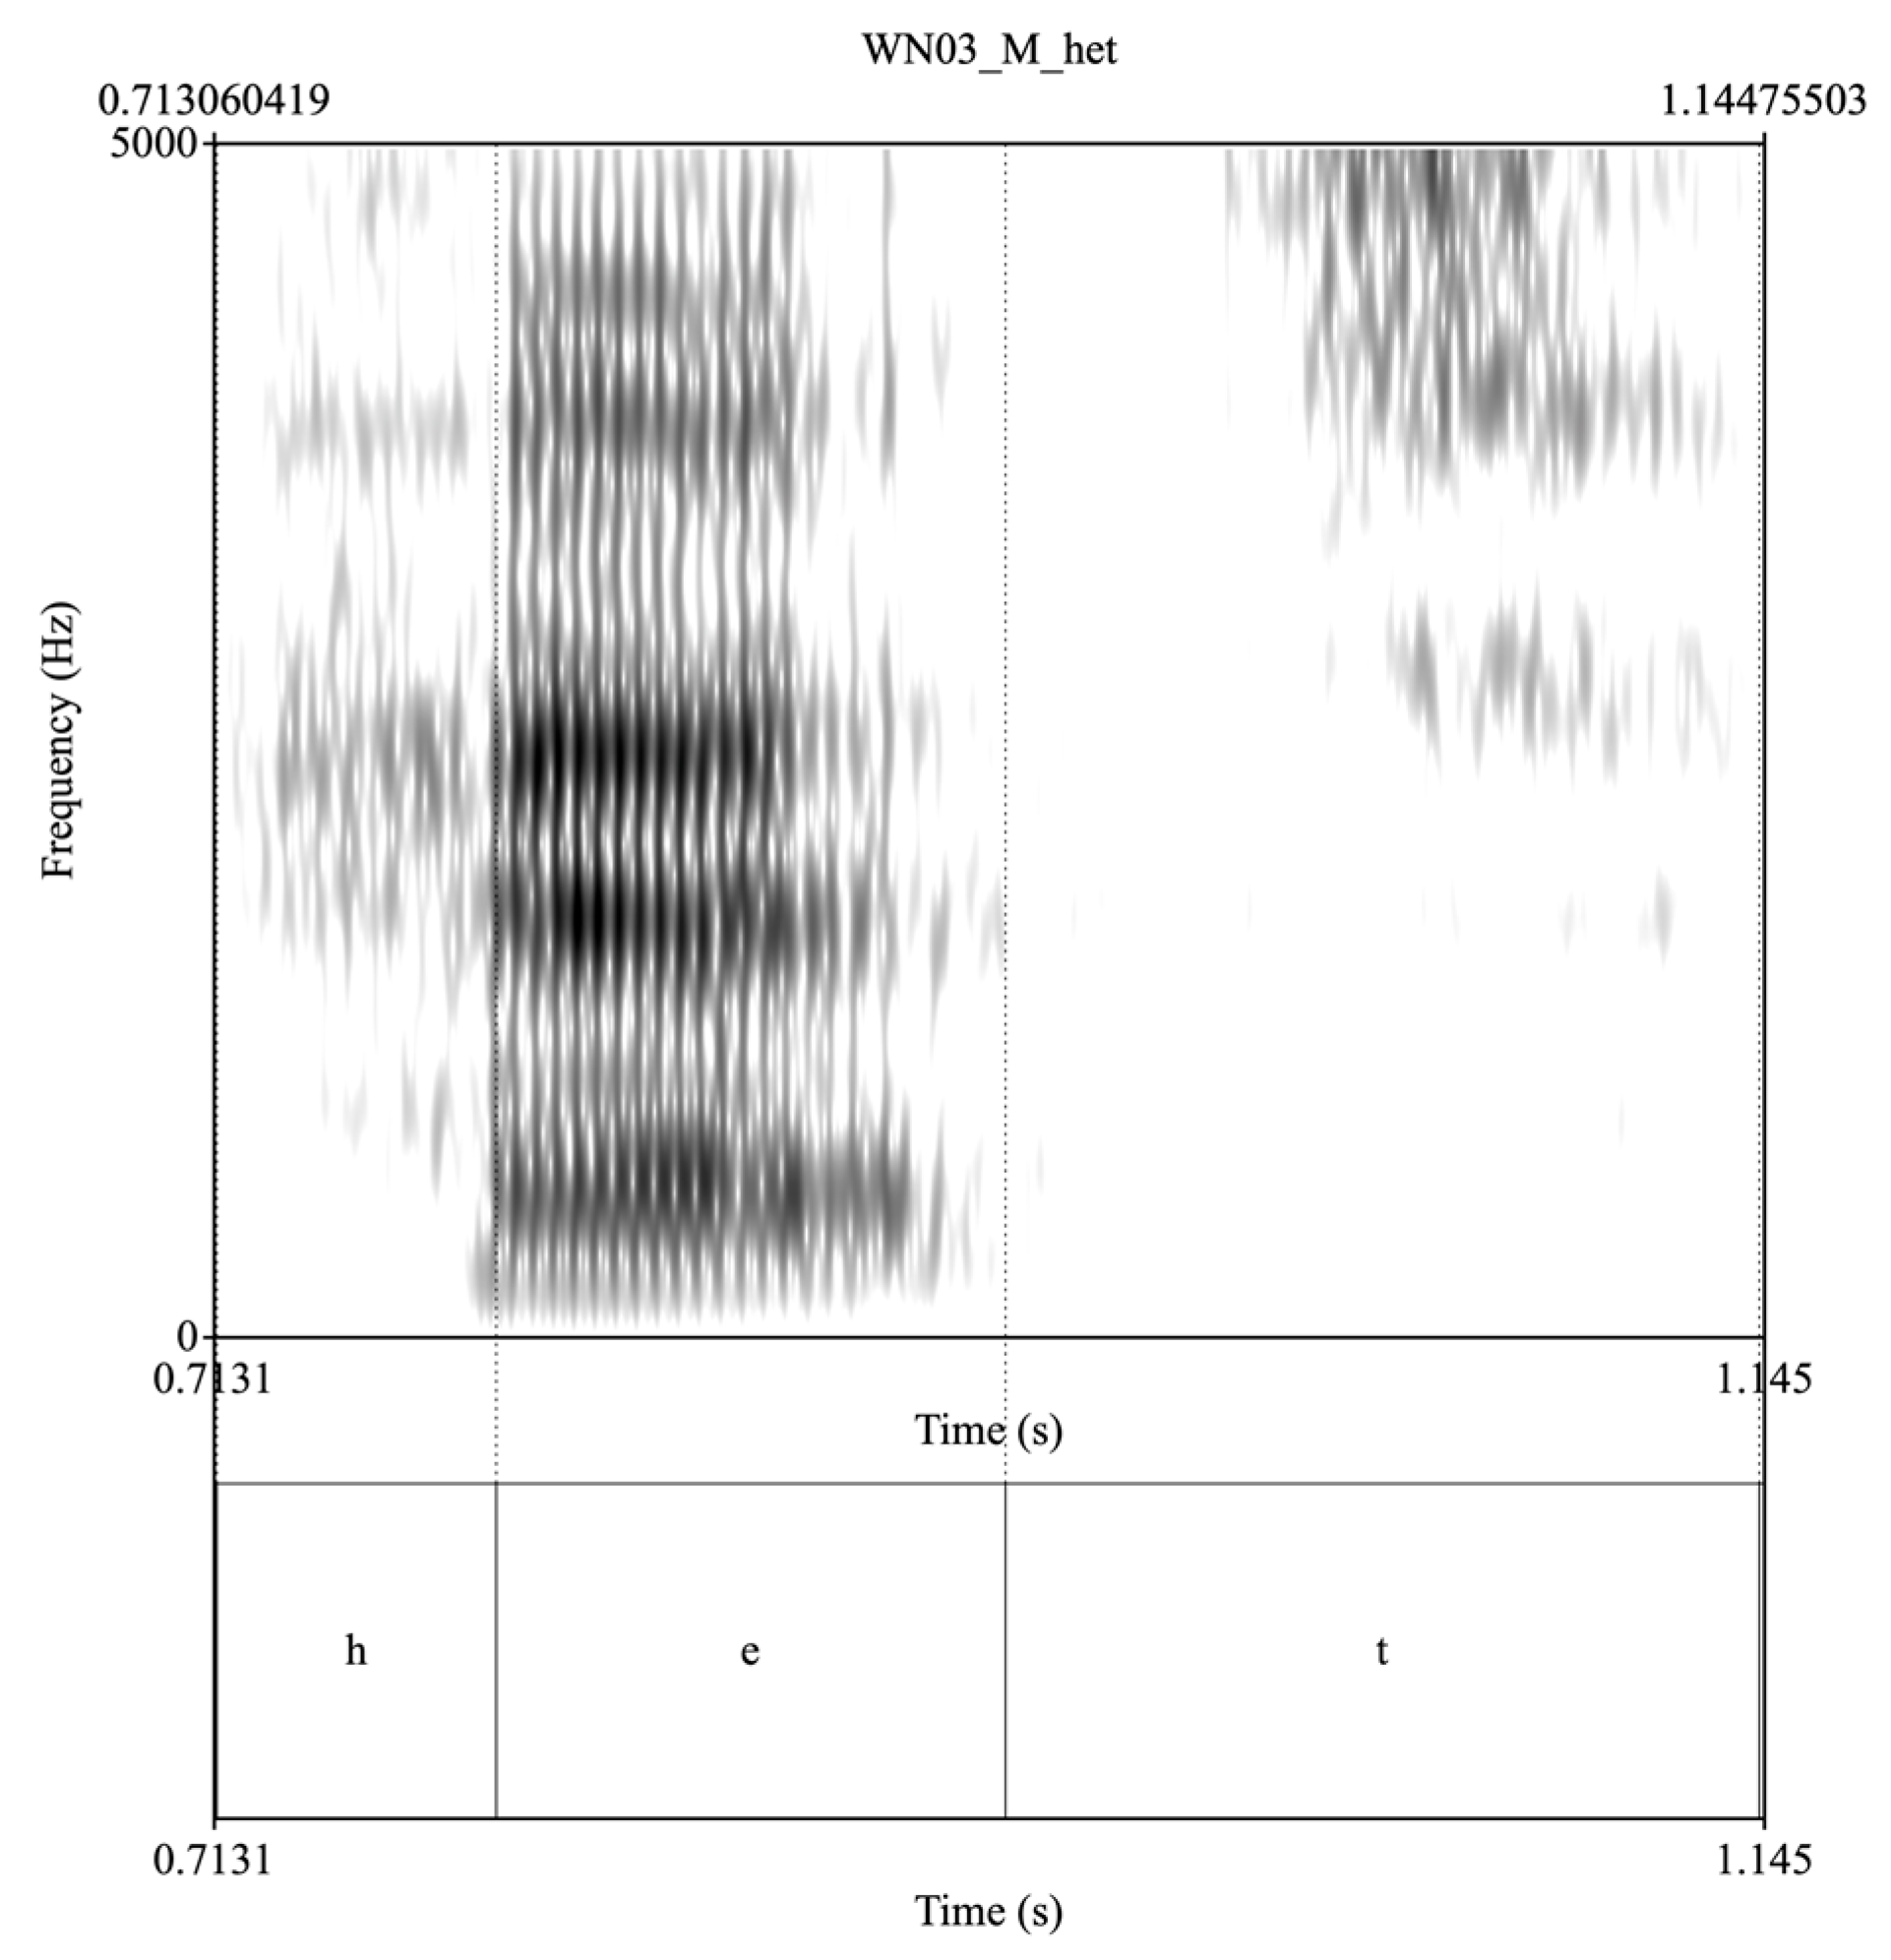
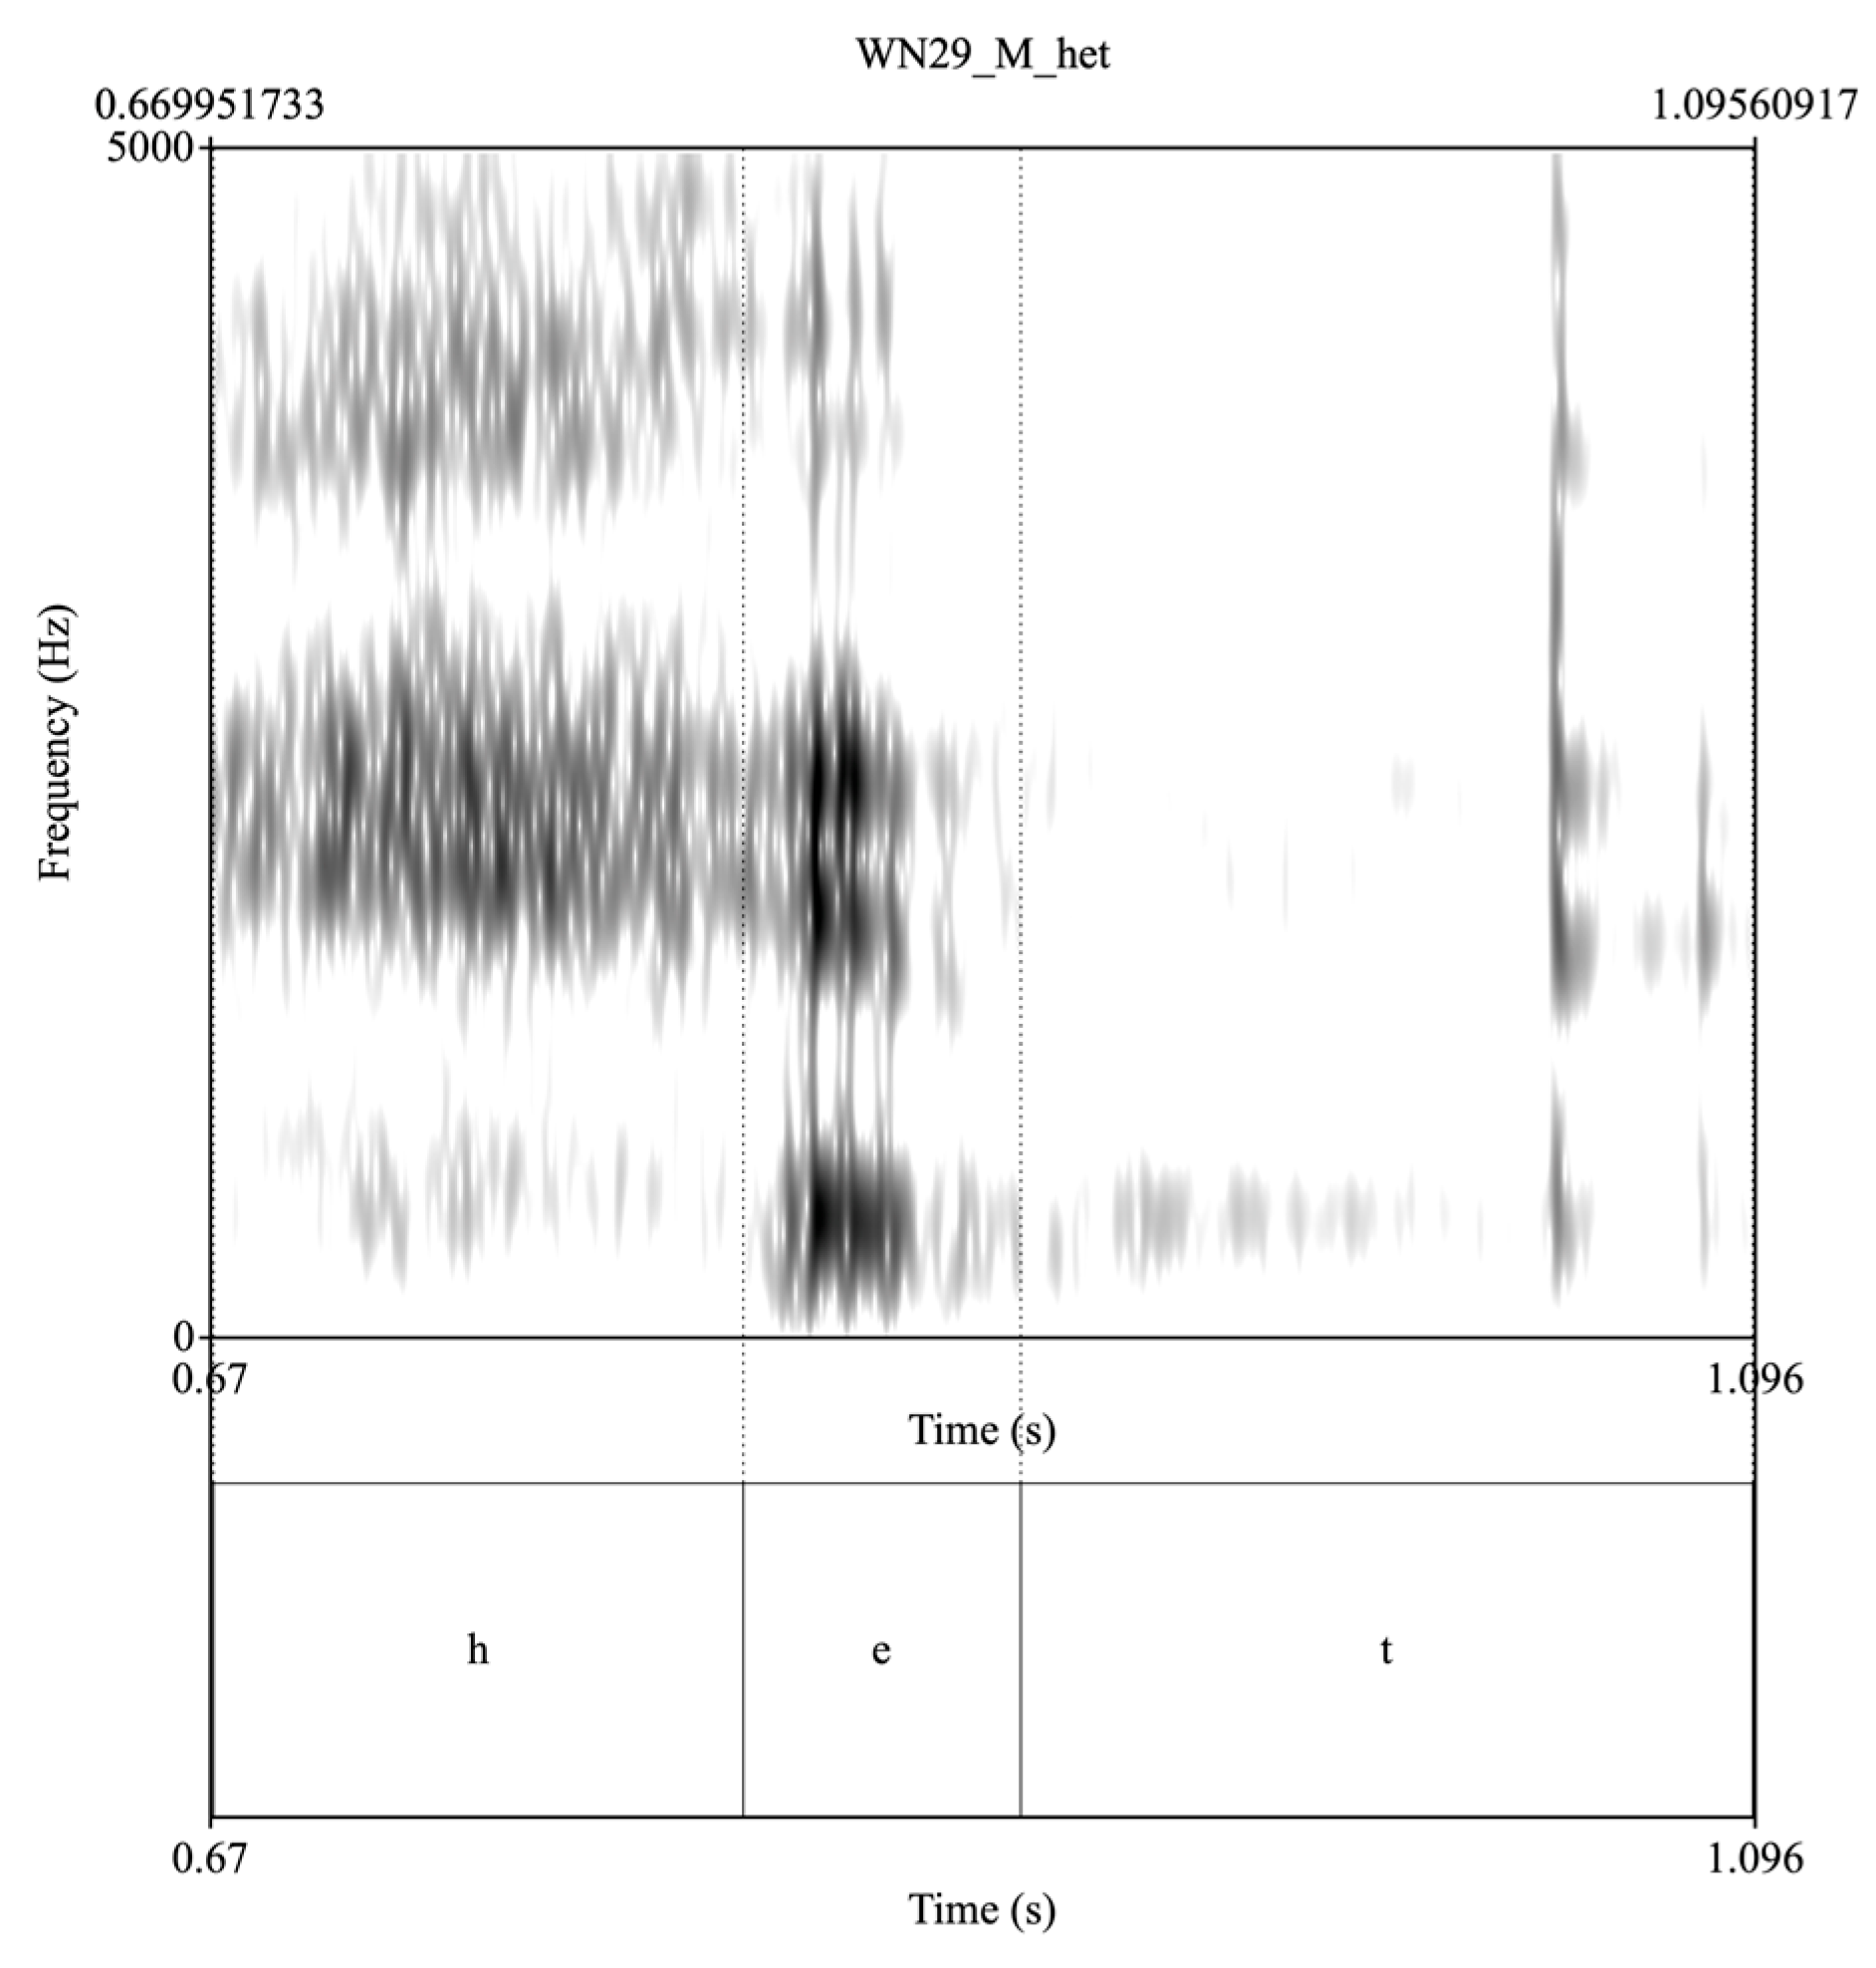
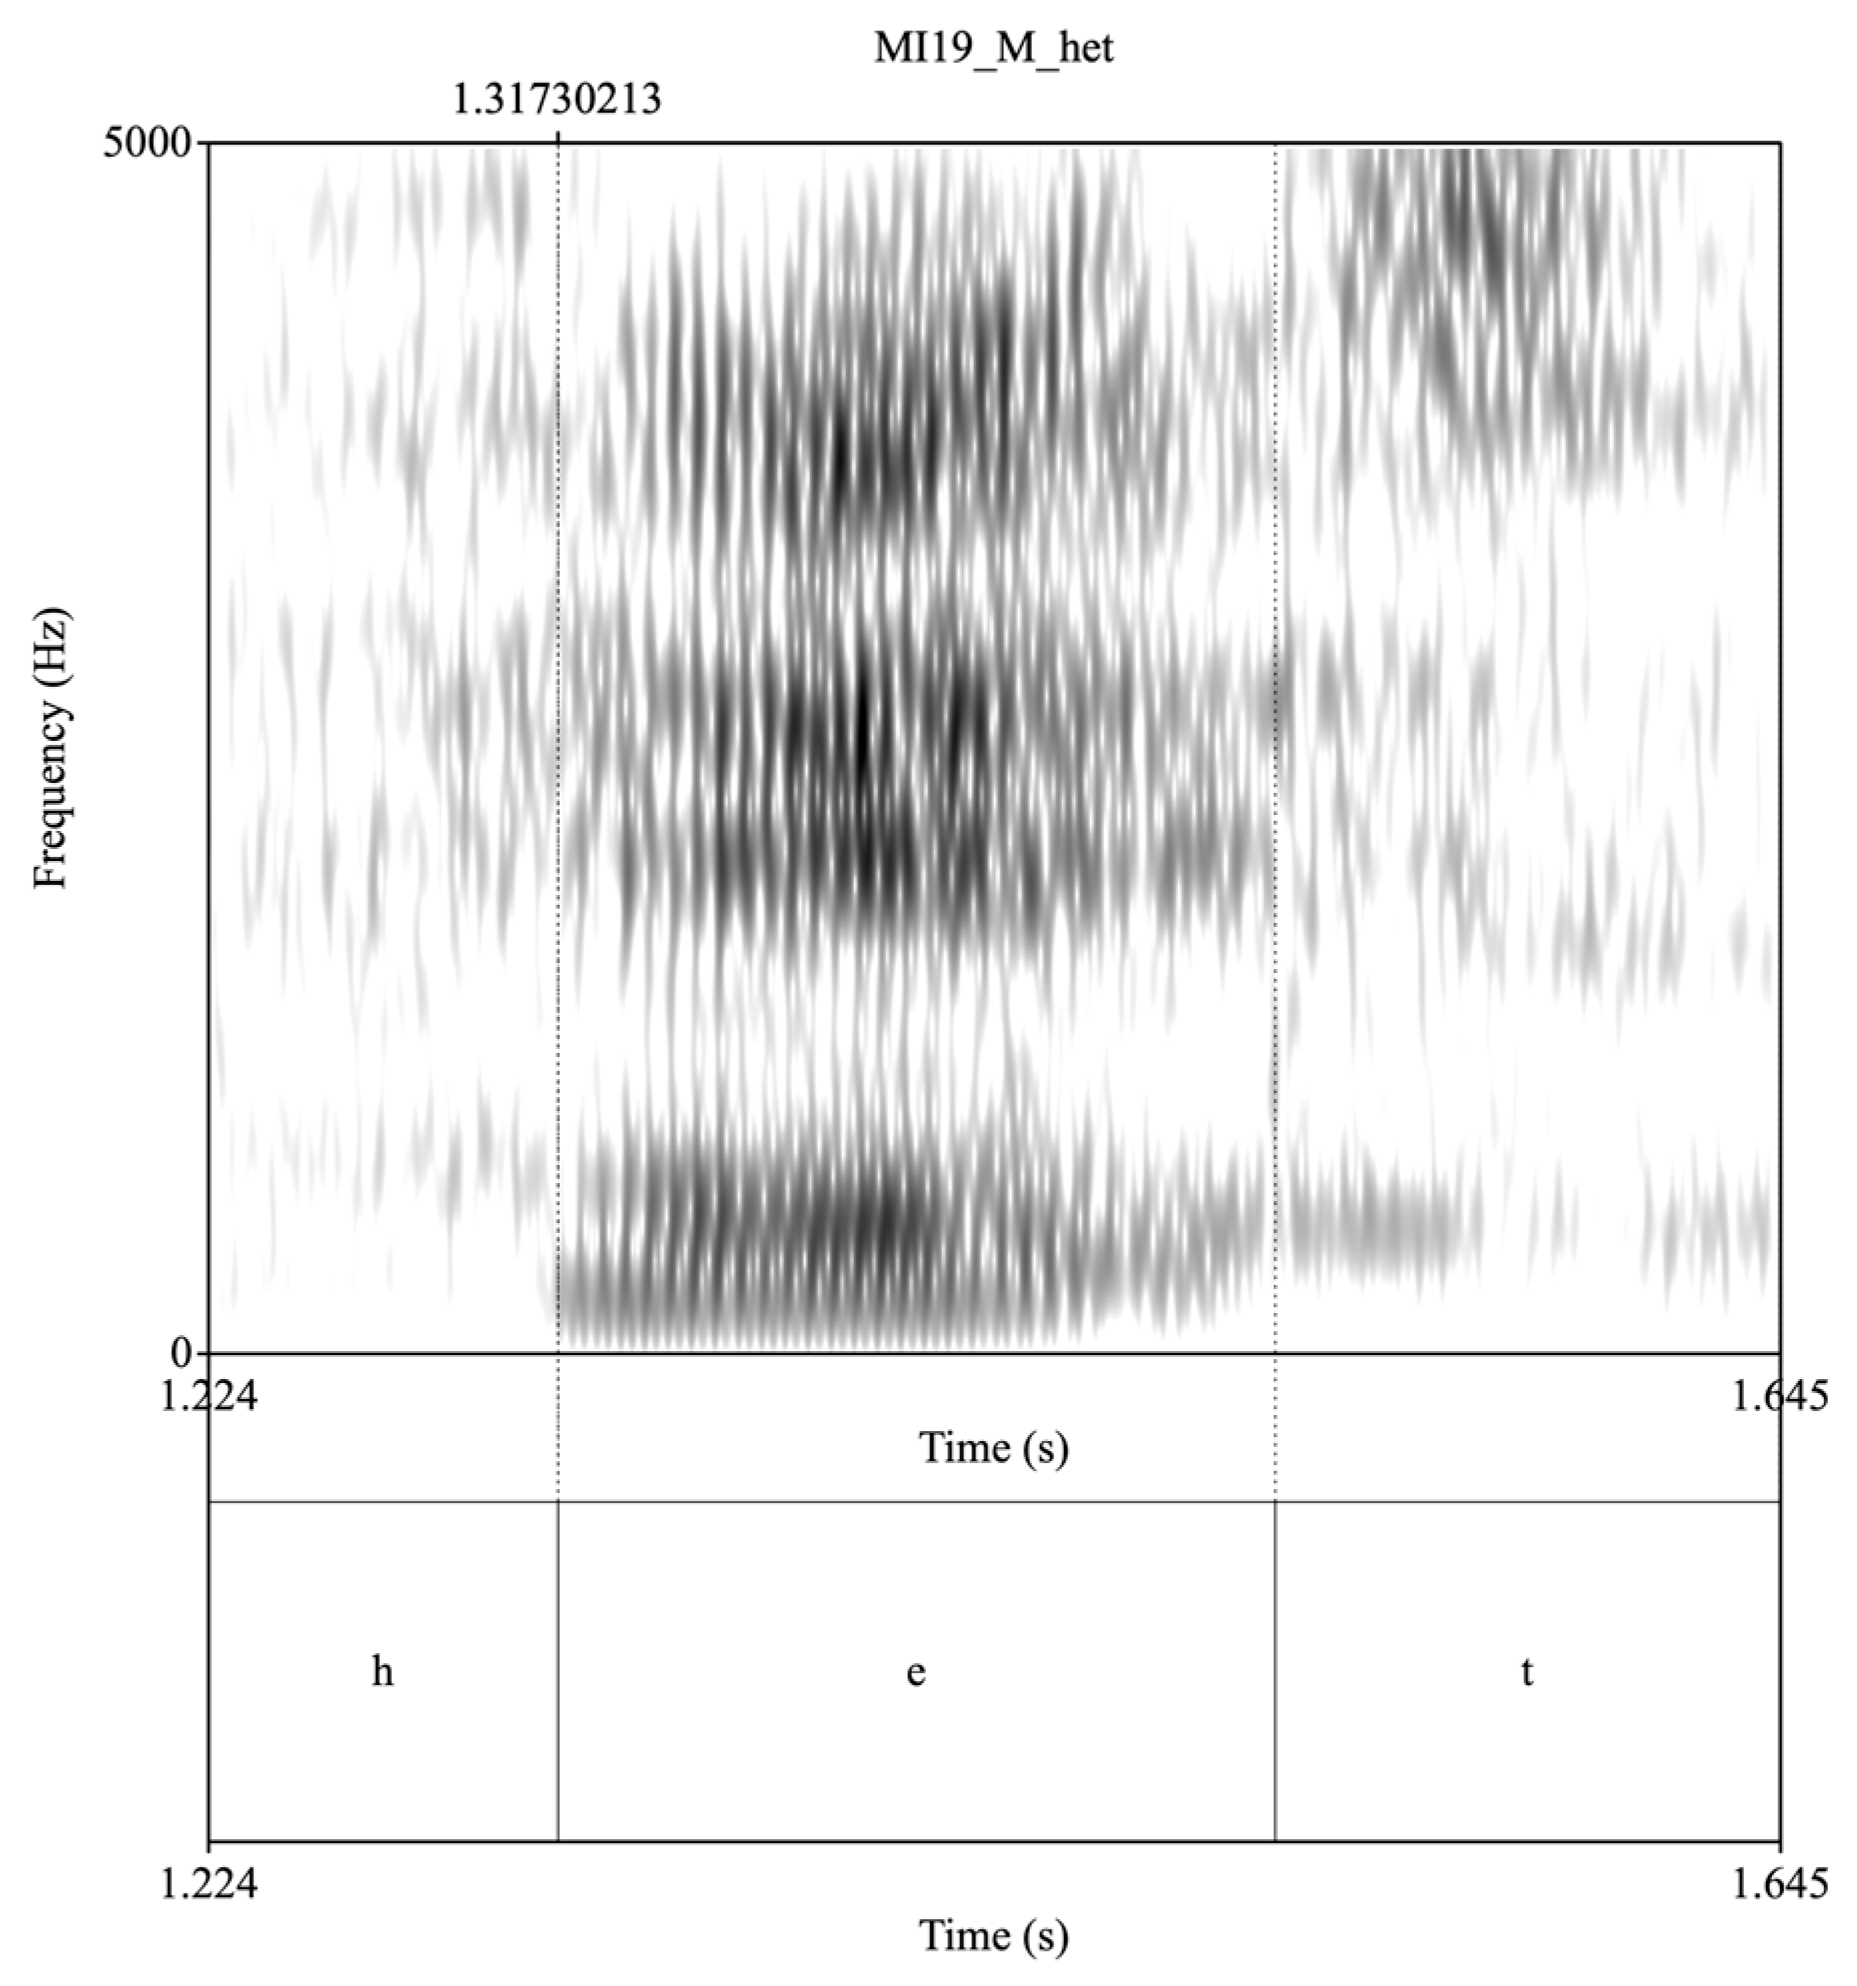
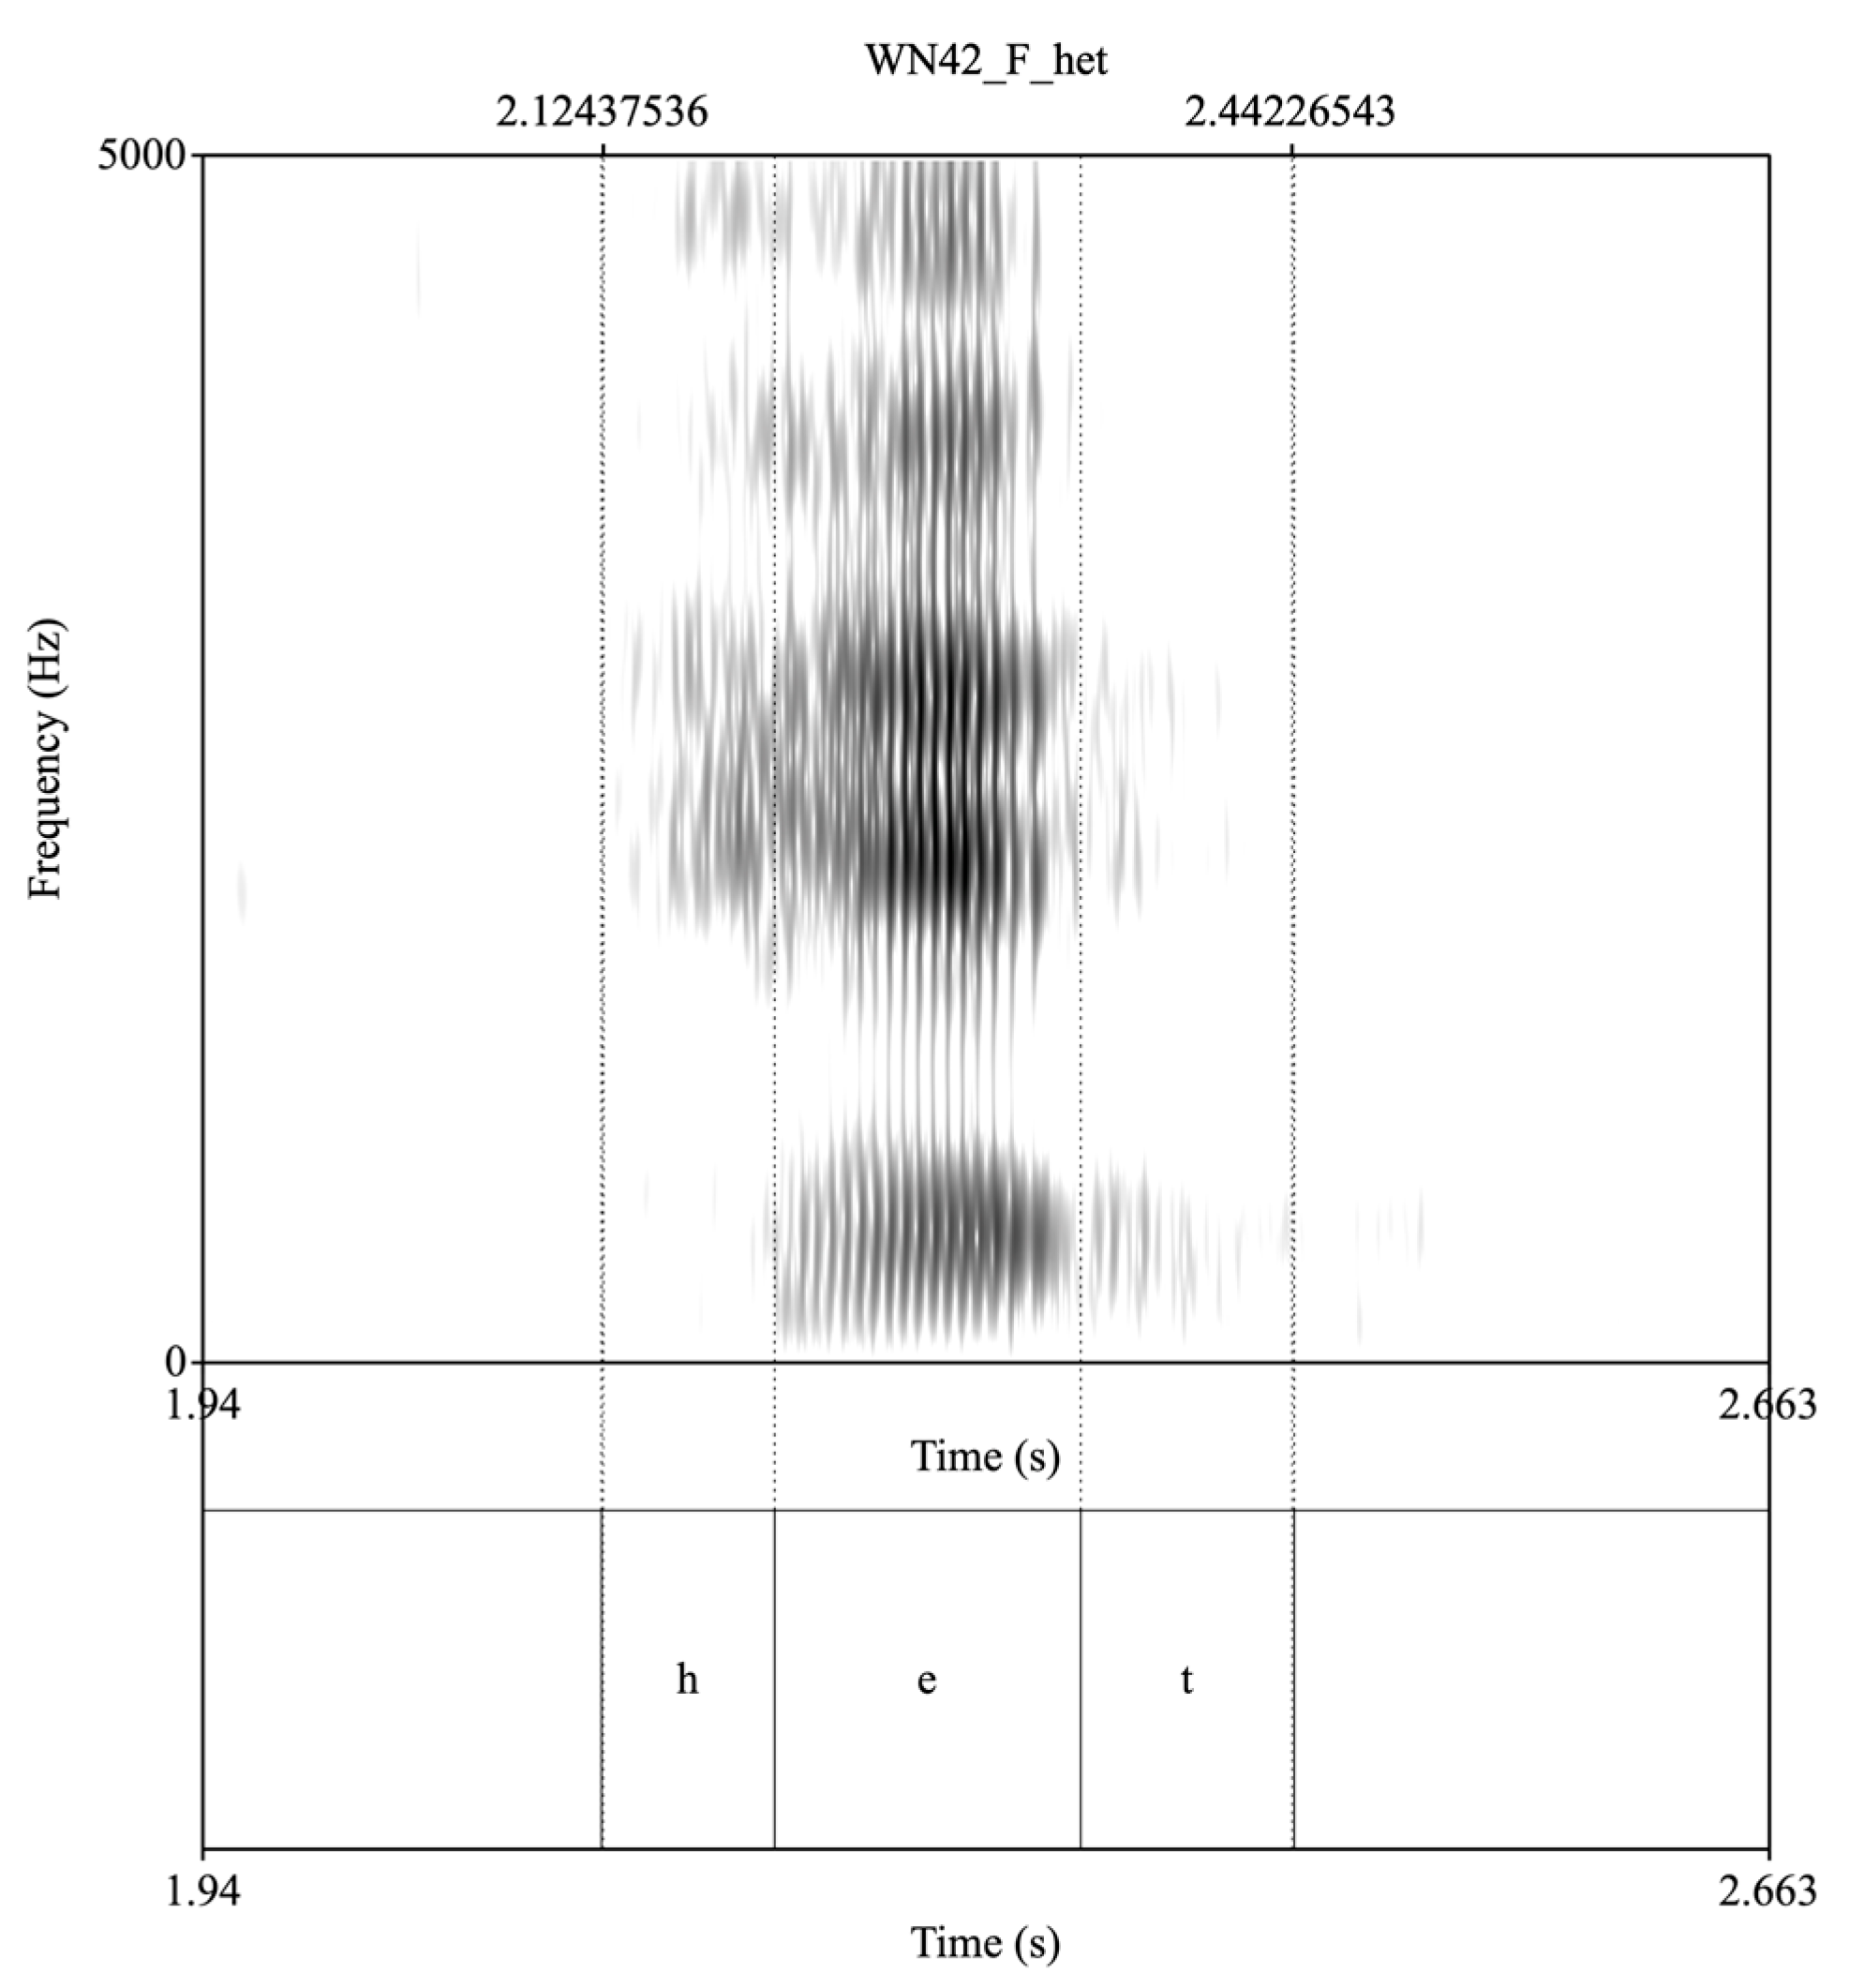
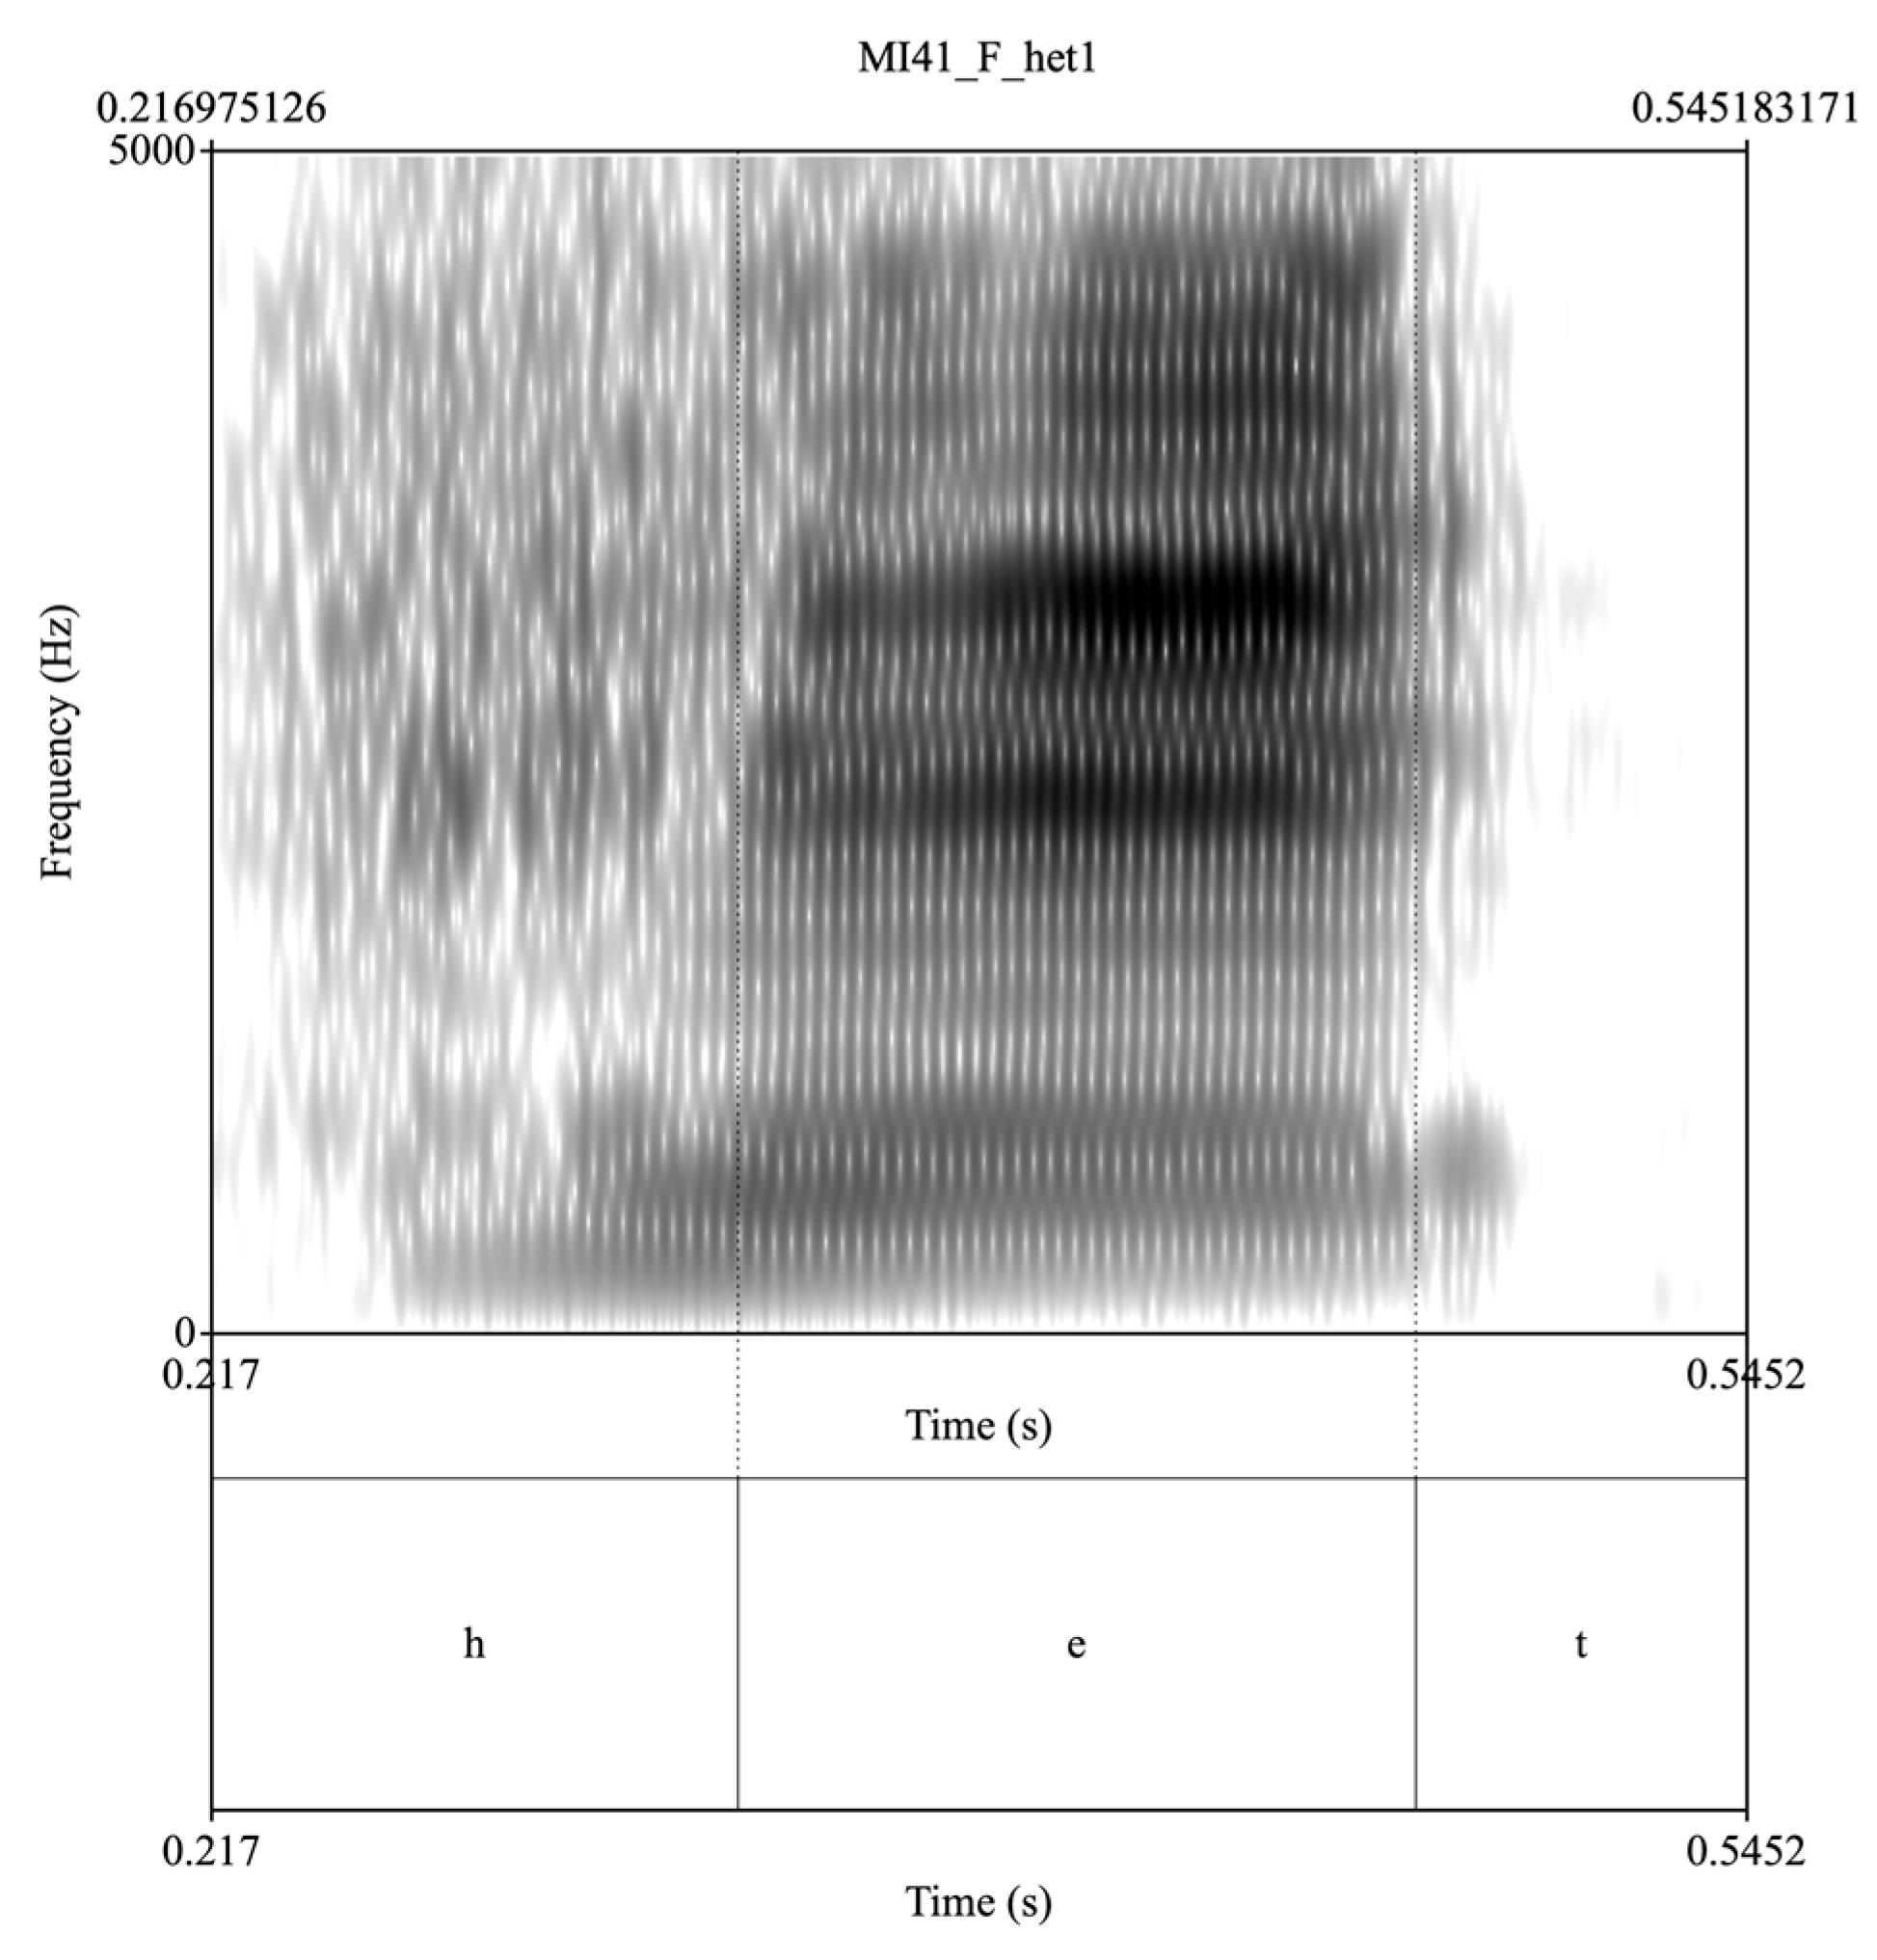
Spectrographic examples of all /t/-categories except “intermediate” are provided in Appendix A (Figure A1, Figure A2, Figure A3, Figure A4, Figure A5 and Figure A6). “Intermediate” is not included in the Appendix A because the spectral characteristics of these examples are by default unclear, and as mentioned, the category is cautionary only so that pure fricatives are not mis-categorized. The spectrographic examples given are all drawn from the word het across different varieties (MAE and AAE) and are also drawn from different speaker ages and genders. Note that recordings were made under fieldwork conditions, so background noise/echo is evident in some examples. Comments are also made in the figure captions on any voice quality characteristics.
Labelling of the /t/ tokens was conducted manually by the first and second authors, who worked through the data of several of the speakers together to establish the categories and the process for making decisions where borderline or difficult cases arose. Following this, analysis proceeded with the two analysts labelling approximately half of the data each but flagging any tokens for which the labelling decision was not immediately straightforward (whereupon this was discussed and labels were subsequently agreed upon).
In addition to carrying out statistical analysis on each /t/-category (discussed in Section 2.5), tokens were grouped into superordinate categories as shown in Table 3. The superordinate categories were used because they effectively correspond with (a) the “phonemic” canonical (aspirated) category, and (b) allophonic variants, which are divided into categories connected to voice quality (breathy, glottal). Using three broad categories is also a more efficient way of understanding the general patterns of sociophonetic behaviour amongst participants.
Table 3. Broader superordinate categories used in sociophonetic description.

2.5. Statistical Analysis

Data were analyzed using both descriptive and inferential statistics. Statistical analysis was carried out by the third author using R and the rstatix package. A mixed-effect multinomial logistic regression was fitted; this included the factors dialect, location, gender, and age (social factors). Person (speaker) was included as a random effect, as was word (i.e., hat vs. hit vs. het and so on), to account for the fact that some items are inherently more/less likely to produce certain outcomes (induced by vowel type). A number of different models were created, and diagnostics were run in order to identify the most appropriate model.
For the superordinate variants (breathy, canonical, glottal), the model that was the most appropriate was:
variants   ~   dialect * location + dialect * gender + dialect * age + location * age   + location * gender + gender * age + ( 1 | person ) + ( 1 | word )
This model captures key two-way interactions while avoiding overfitting. For the finer-grained analysis of /t/-categories, the final model was:
tcat ~ dialect + location + gender + age + (1|word) + (1|person)
Note that tcat is the dependent variable, referring to the specific linguistic variants observed (i.e., glottal stop, fricative, canonical and so on). Unlike the superordinate analysis, interaction terms could not be included due to insufficient data in several cells (see Table 1).
Model convergence and sampling quality were evaluated using standard Bayesian diagnostics. All parameters had R^ ≤ 1.1, indicating adequate convergence across chains, and effective sample sizes (ESS) ≥ 100, suggesting sufficient posterior exploration. No divergent transitions or maximum treedepth warnings were observed, indicating stable Hamiltonian Monte Carlo sampling. Model summaries are listed in Table A2 and Table A3.
Posterior pairwise comparisons of fixed effects were conducted using predicted category probabilities derived from the fitted Bayesian categorical models (posterior_epred; Bürkner, 2017). This approach estimates the probability that one group exceeds another for a given outcome, while incorporating uncertainty from both fixed and random effects. By relying on the full posterior distribution, it avoids dependence on asymptotic p-values and provides a more intuitive interpretation of group differences, while appropriately accounting for hierarchical structure (Gelman et al., 2014; McElreath, 2020).
Differences in predicted probabilities across dialect, location, gender, and age were summarised using median posterior differences, 95% credible intervals, and posterior probabilities of direction. Full pairwise comparison results are presented in Table A4 and Table A5, with significant findings discussed in the results and summarised in the discussion.

3. Results

3.1. Overall Corpus

Before analyzing sociophonetic variation, this section describes the distribution of the /t/-categories observed across the corpus as a whole. Figure 1 below shows the proportion of /t/-categories observed for all speakers, in both locations.
Figure 1. Proportion of /t/-categories across the entire corpus (all speakers, both locations).
Figure 1 shows that the canonical (aspirated) [th] was the most prevalent category, with over a third of all tokens (751 instances) produced in this way. The affricate [ts] was the second most common /t/ realization, amounting to 28% of observations (596 tokens). The pre-glottalized variant occurred in 15% (n = 322) of cases. These three variants made up 79% of all observations, while the other /t/-categories occurred far less frequently. The glottal stop, fricative and ejective tokens each amounted to between 5 and 10% of tokens (158, 116 and 136 tokens, respectively). The intermediate category, /t/ tokens that sounded fricated but had burst-like characteristics in the spectrum (Jones & McDougall, 2009), made up only a very small percentage of the data, 34 tokens in total (2%), with 32 of these being produced by speakers from Warrnambool.
While this breakdown is important for showing how tokens were distributed across the whole dataset, the remaining sections of the results are dedicated to the analysis of sociophonetic variability to determine which factors are associated with the realization of /t/ by different groups. In both models used (i.e., Section 2.5) there was substantial between-speaker variability, while between-word variability was smaller across categories or variants. It is important to note that this between-speaker variabilty means that apparently large differences in figures do not always translate to significant differences, and similarly, differences in the subordinate modelling do not always translate to the superordinate model, as will be observed throughout the following sections.

3.2. Location-Based Variation

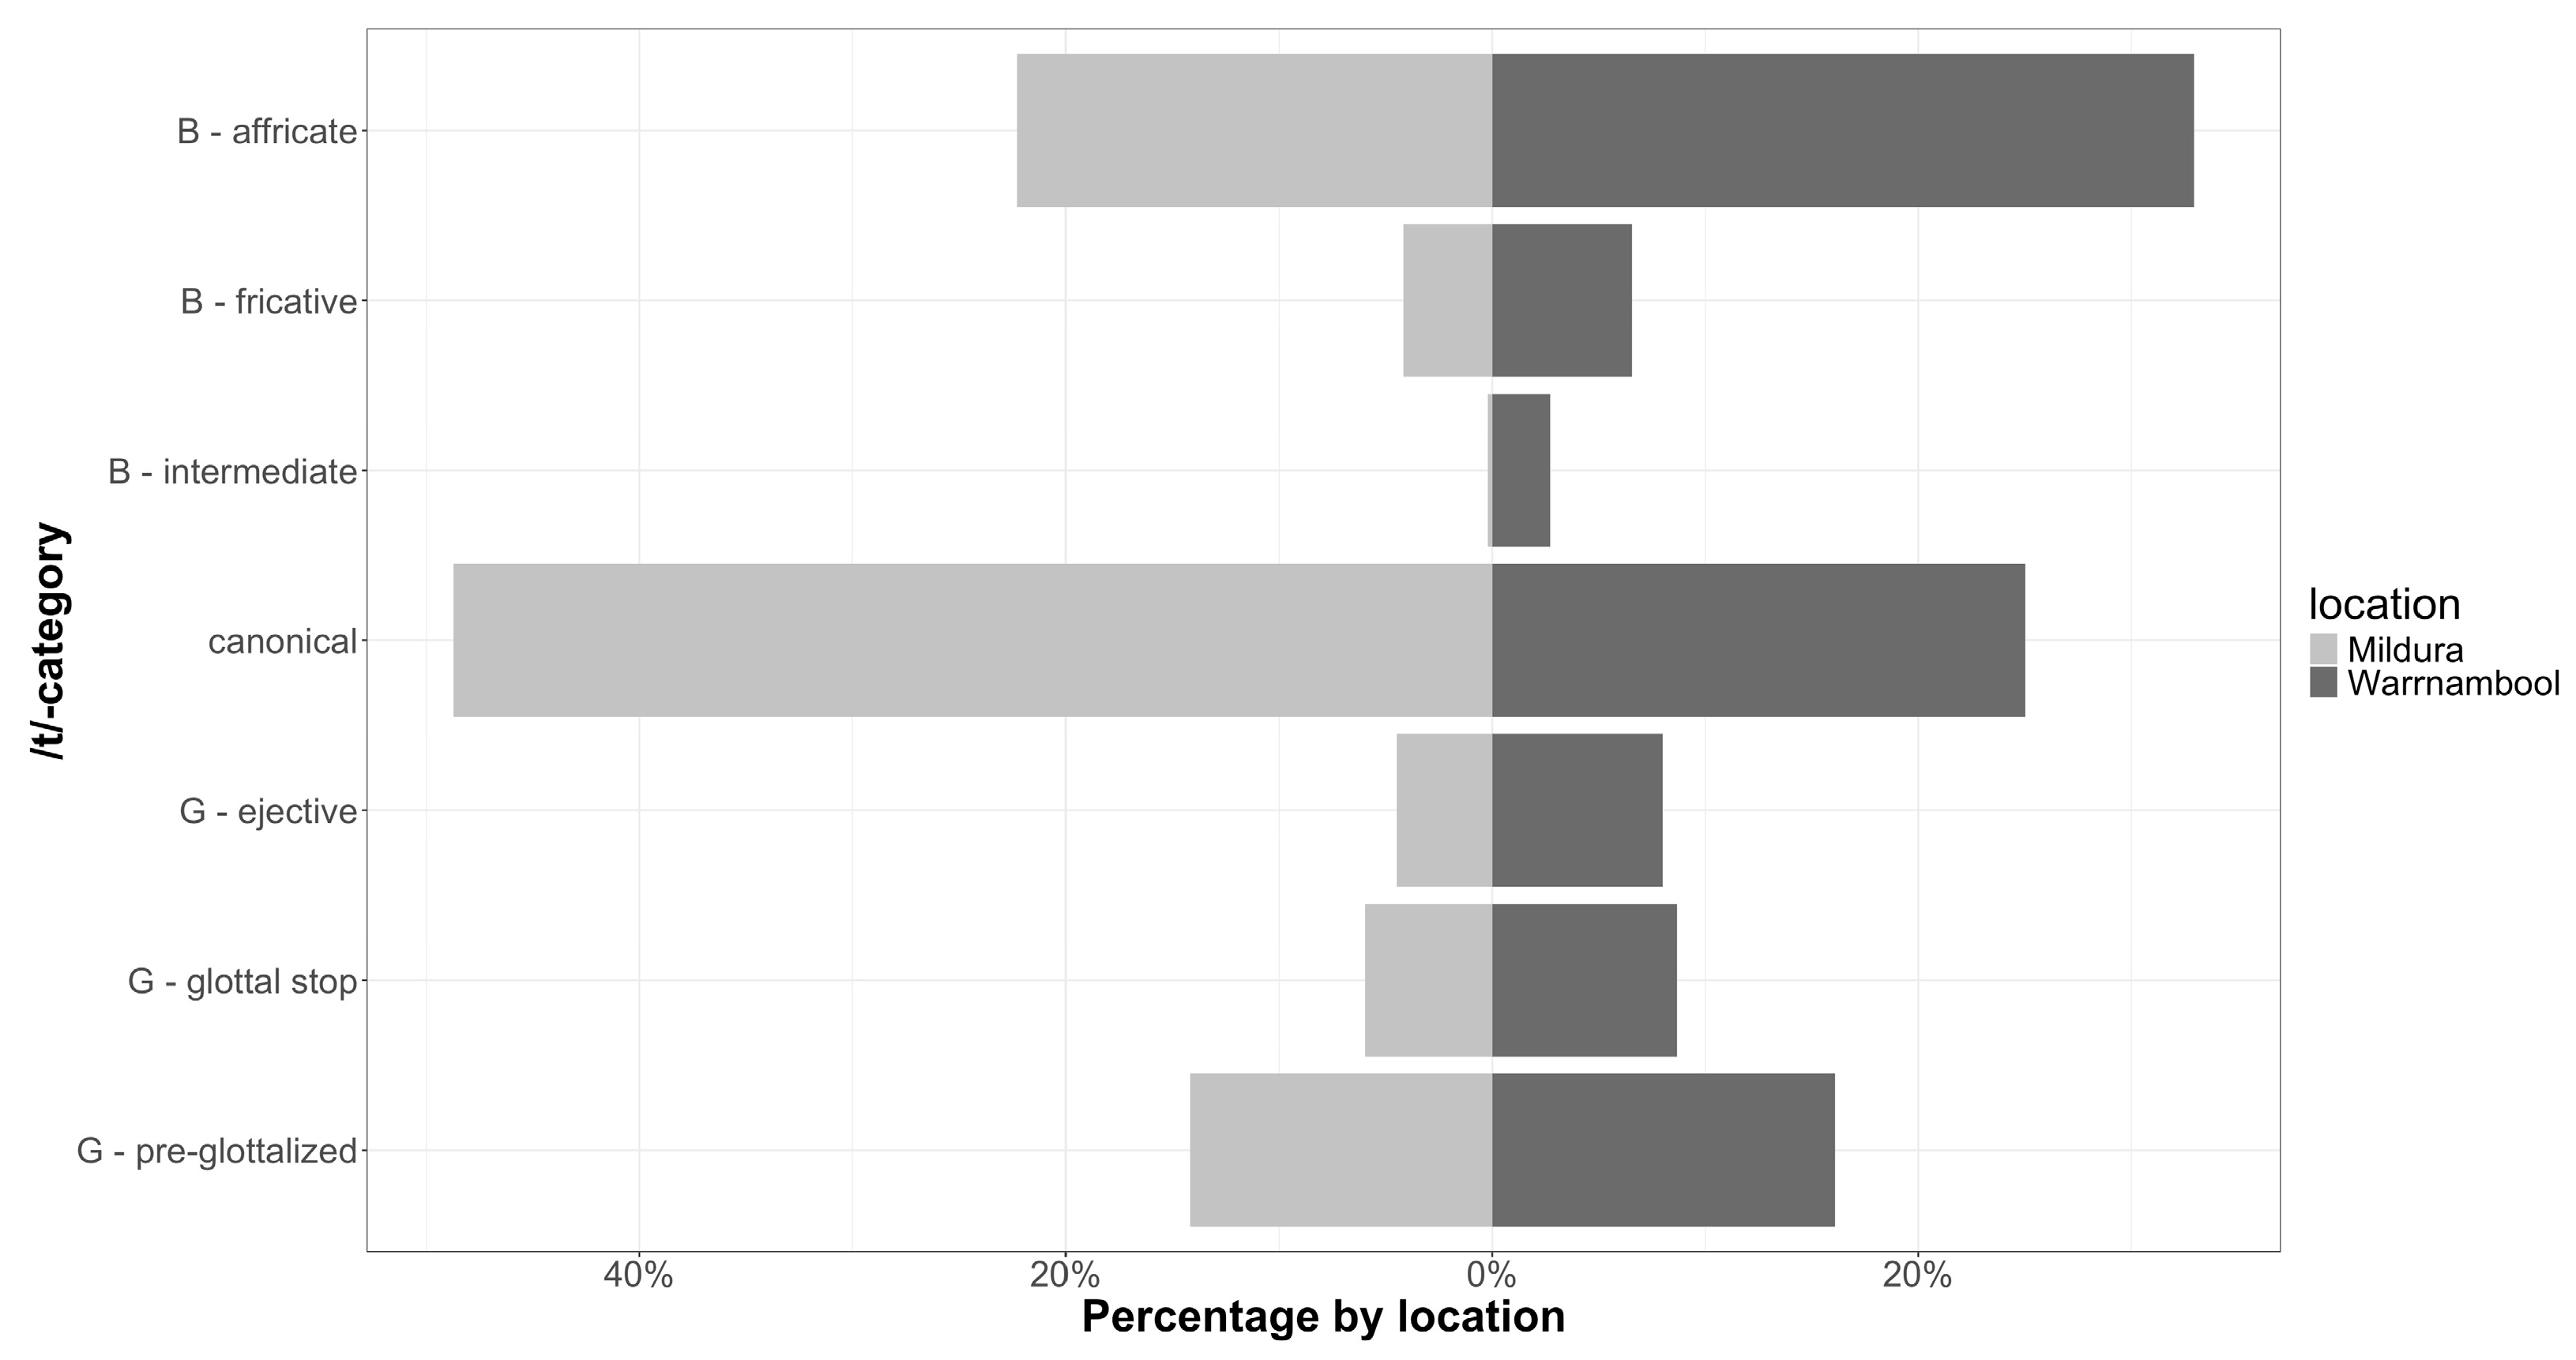
This section examines how /t/ variants were distributed across the two regional communities. Figure 2 displays the percentage of /t/-categories observed within the realizations produced by speakers from Mildura and Warrnambool.
Figure 2. Back-to-back plot showing proportions of /t/-categories in Mildura and Warrnambool. Superordinate categories also shown for transparency, B = breathy, G = glottal.
As can be seen in Figure 2, there are some differences in the distributions of /t/-categories between Mildura and Warrnambool. In Mildura, almost half of the /t/ tokens (49%) were canonical realizations, with the remainder of the observations being mostly affricate (23%) and pre-glottalized tokens (14%), with smaller numbers of glottal stops (6%), ejectives (4%) and fricatives (4%). In Warrnambool, the greatest number of observations were the affricates (over 30%), followed by canonical /t/ (almost a quarter of the data), while the remaining observations were pre-glottalized (16%), glottal stop (9%), ejective (8%), and fricative (7%). Even though canonical tokens comprised half of the coda /t/ observations for Mildura and a quarter of observations in Warrnambool, the statistical analysis confirmed that differences in all categories aside from affricates were either small or uncertain. Specifically, the only significant finding to come out of the location analysis was that Mildura speakers were less likely than Warrnambool speakers to produce /t/ as an affricate (median difference = −0.115, 95% CI = [−0.325, −0.012], p_gt0 = 0.0087). Still focusing on location, the /t/ variants grouped into superordinate categories are shown in back-to-back plots in Figure 3.
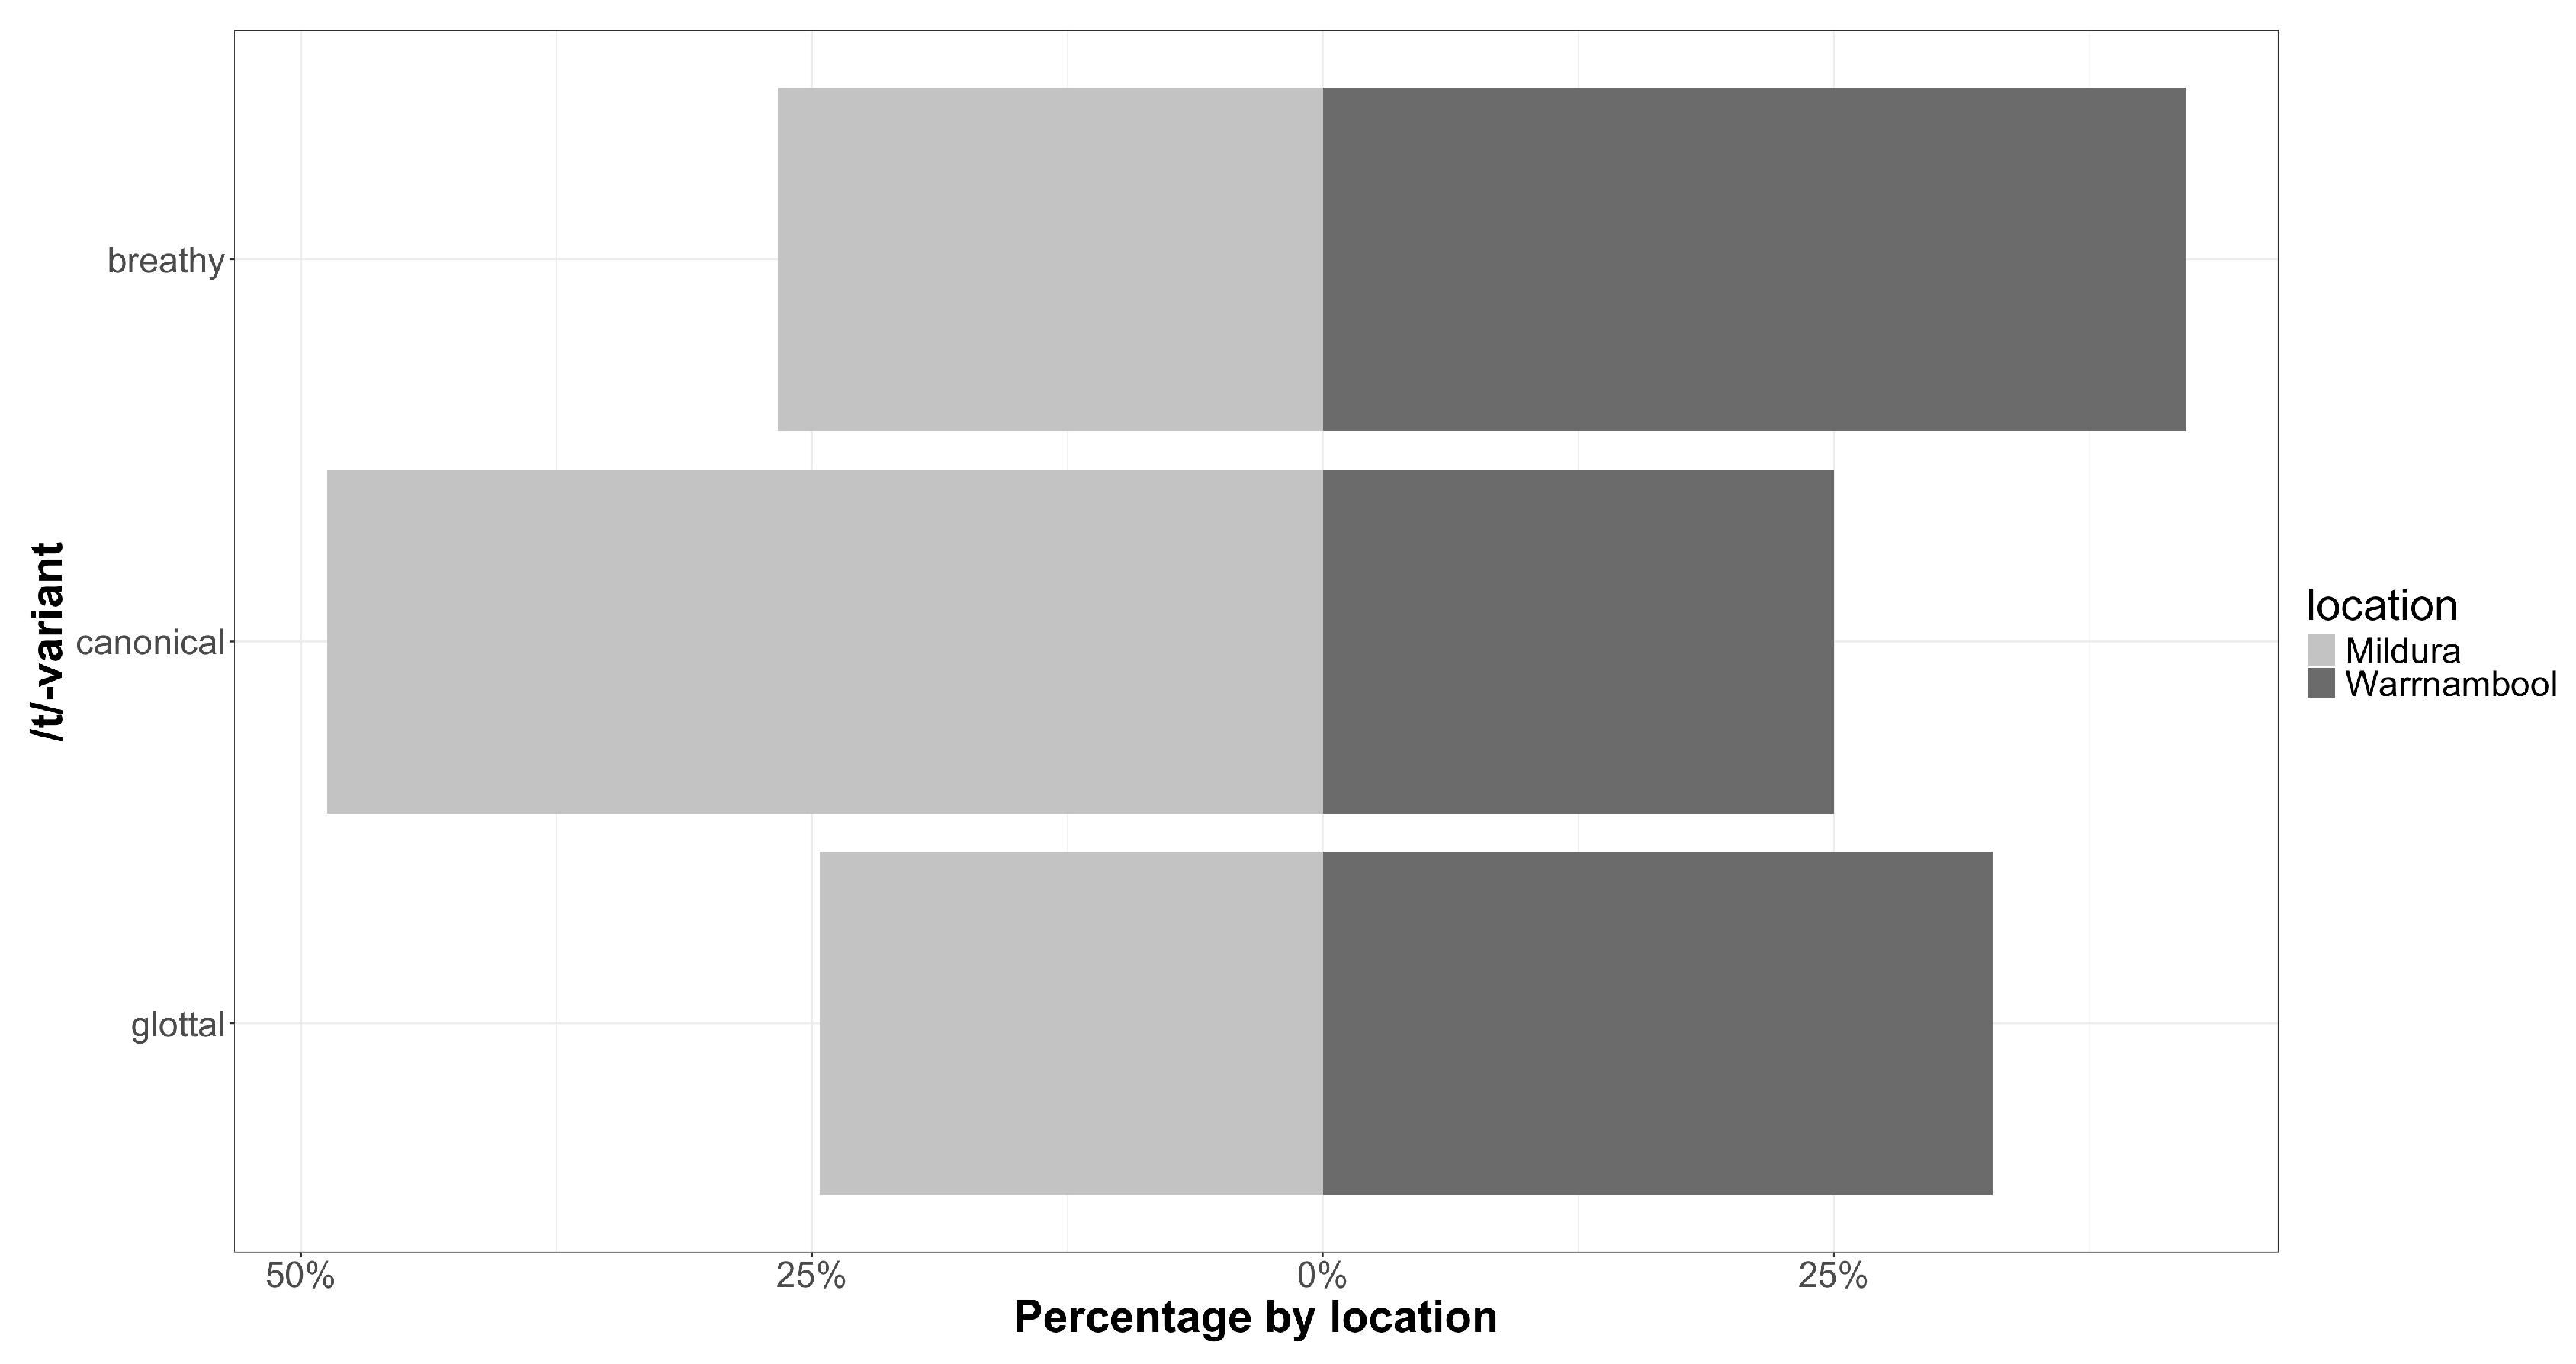
Figure 3. Back-to-back plot showing proportions of /t/-categories in Mildura and Warrnambool grouped into superordinate categories.
When considering Figure 3, some patterns are evident, with the breathy category being especially dominant for speakers from Warrnambool (42%), compared with a far smaller proportion of tokens in Mildura (27%). Warrnambool speakers also had slightly more glottal tokens (33%) than Mildura speakers (25%). However, pairwise posterior contrasts of predicted probabilities indicated limited evidence for location. No contrasts reached conventional credibility thresholds. Although Mildura speakers showed a numerically higher probability of the canonical variant relative to Warrnambool (median = 0.316), the 95% CrI overlapped zero, and the posterior probability (p_gt0 = 0.777) did not indicate strong evidence of a difference.

3.3. Dialect Variation

In Figure 4, the percentage of /t/-categories observed for each dialect background is presented, showing some relatively clear sociophonetic patterning.
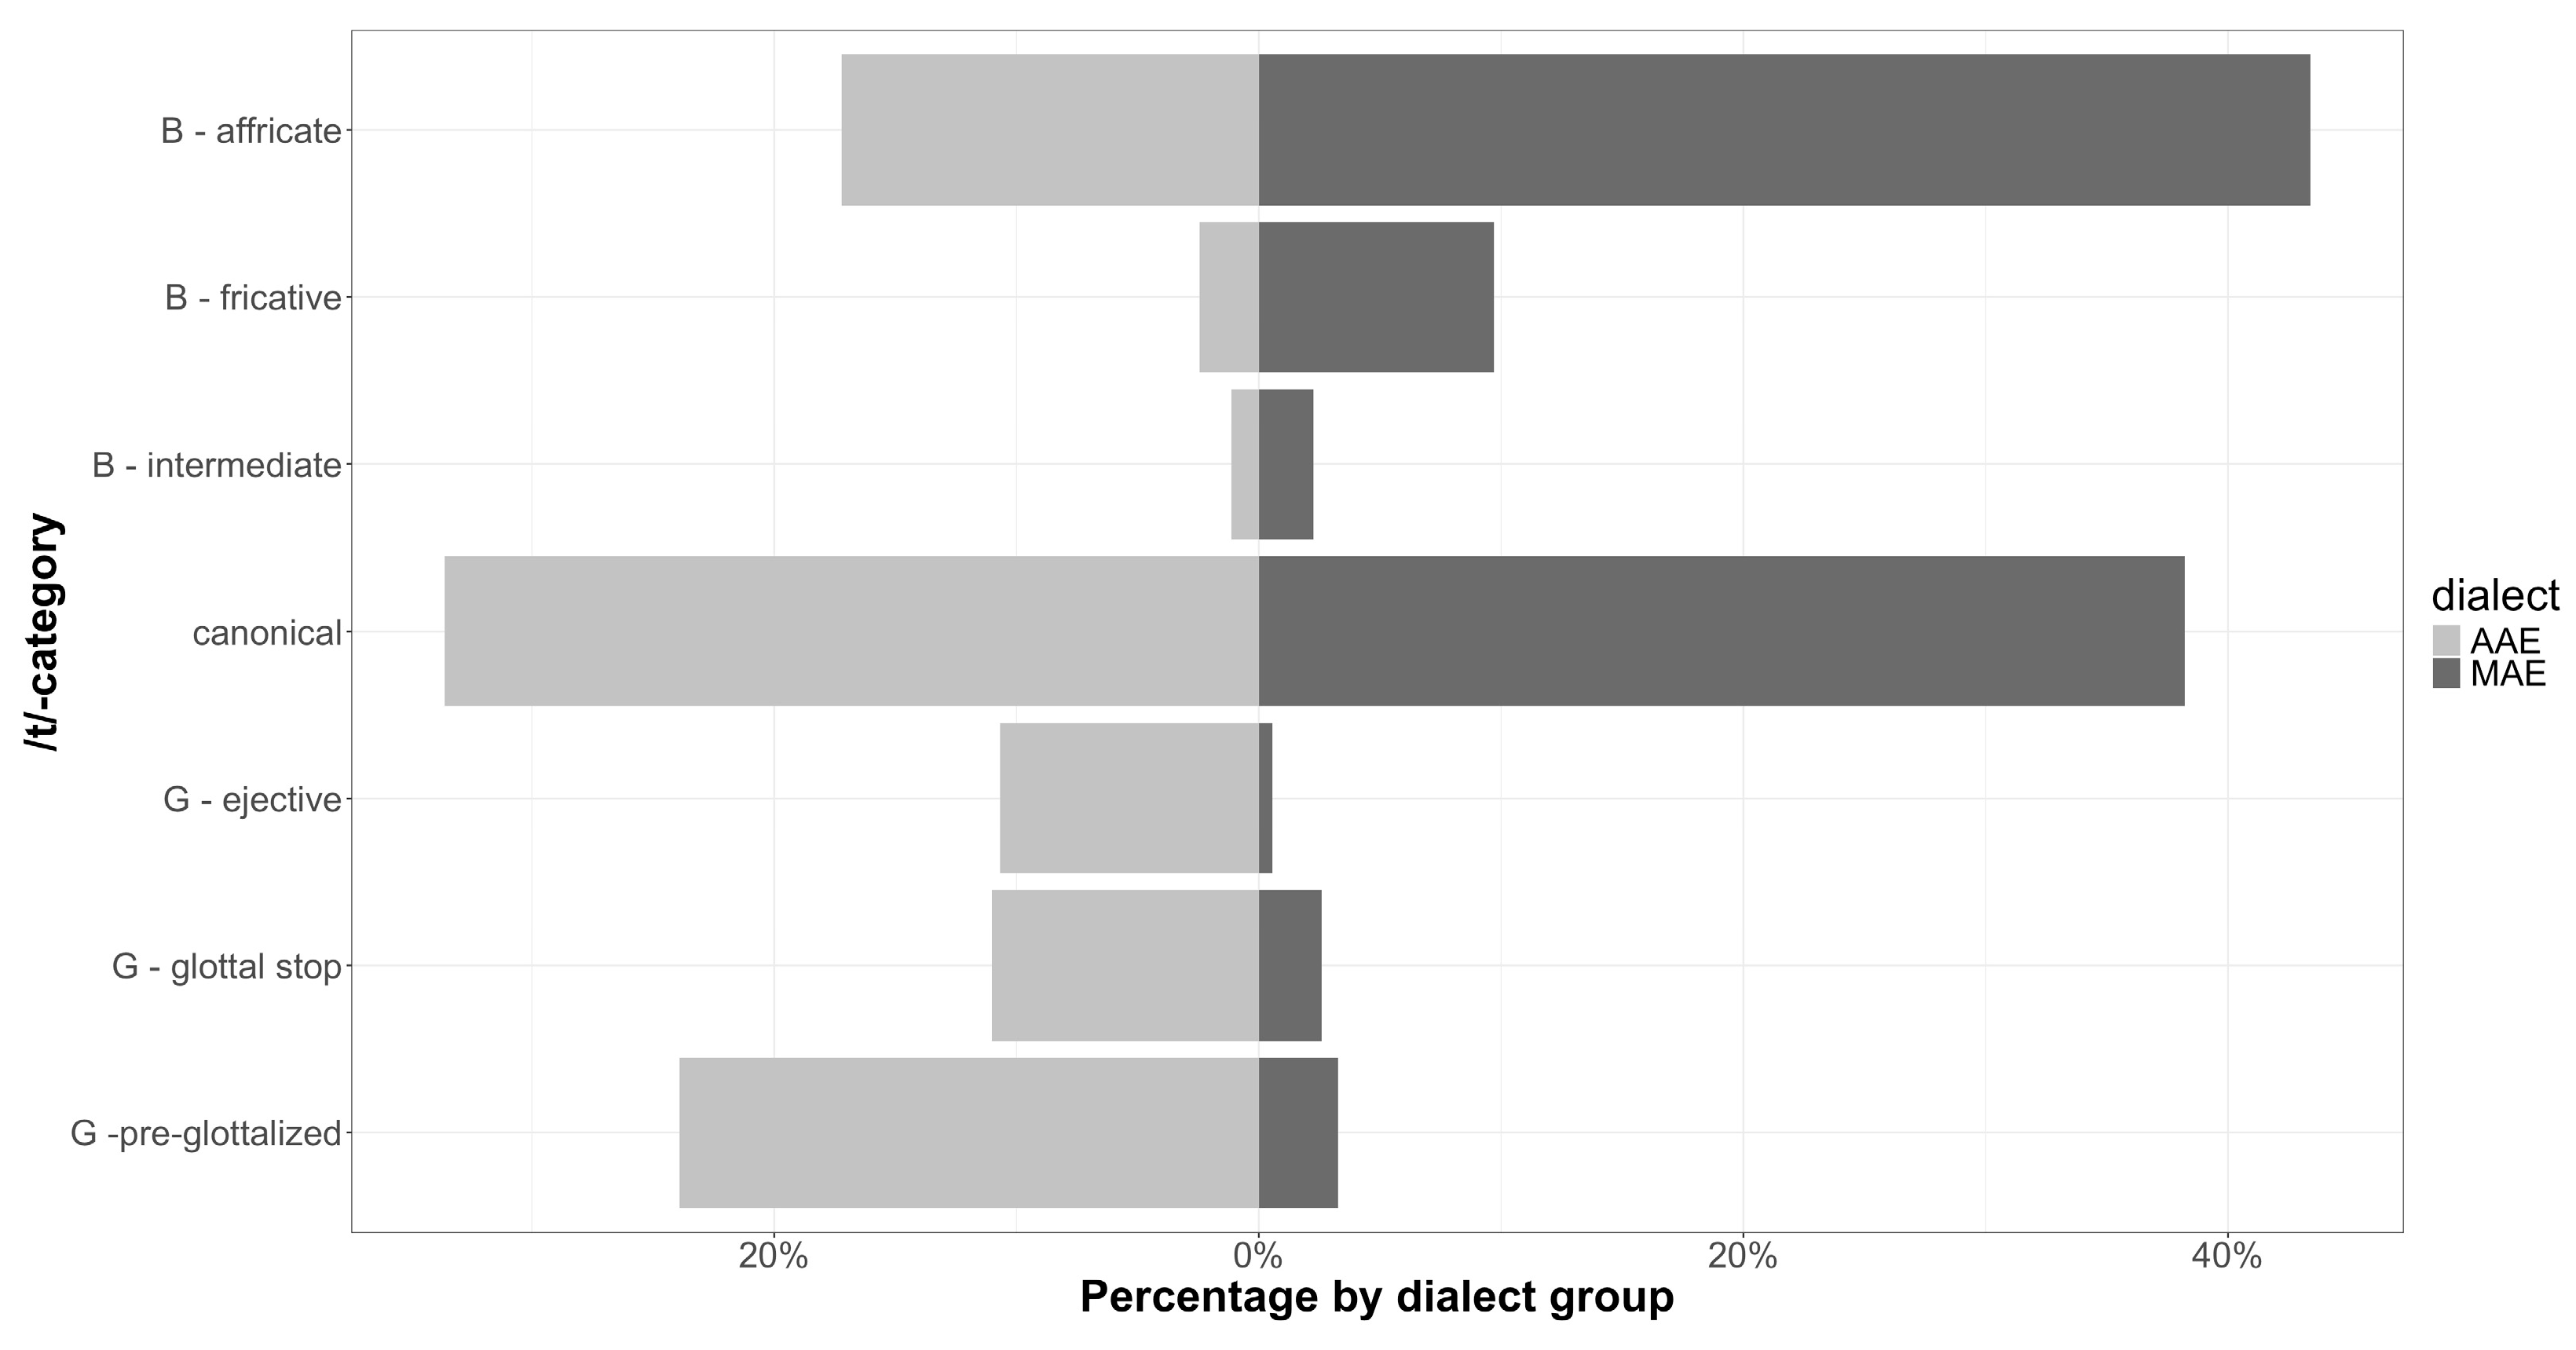
Figure 4. Back-to-back plot showing proportions of /t/ variants in MAE and AAE. B = breathy, G = glottal.
Recall that Figure 1 showed that the most common /t/-category across the entire corpus was canonical /t/. In Figure 4, it can be seen that both dialect groups used this variant to a relatively similar degree (but slightly more for MAE); however, there are starkly evident patterns of sociophonetic distribution for the other variants. Figure 4 demonstrates that MAE speakers used two main variants overall, affricated and canonical /t/, which occurred at rates of 43% and 38%, respectively. Fricatives were the next most common variants for MAE speakers, but they occurred at far lower rates (just under 10%). AAE speakers, by contrast, used a wider spread of variants; in order of frequency of observation there are high rates of canonical /t/ for this group (34% of tokens), followed by pre-glottalized tokens (24%) and affricated /t/ (17%). Compared with the MAE speakers who used very few glottal stops and ejectives (3% and 1%, respectively; 28 tokens in total), AAE speakers used glottal stop variants at a rate of 11% and ejectives at a rate of 10%, with few fricatives (2%) and intermediate tokens (1%). Statistically, AAE speakers had a lower probability than MAE speakers of producing /t/ as an affricate (median difference = −0.233, 95% CI = [−0.598, −0.042], p_gt0 = 0.0007). By contrast, AAE speakers were slightly more likely than MAE speakers to produce /t/ as an ejective (median difference = 0.0001, 95% CI = [0.008, 0.197], p_gt0 = 0.993) or glottal stop (median difference = 0.061, 95% CI = [0, 0.889], p_gt0 = 0.975). Back-to-back plots of the /t/ variants grouped into superordinate categories per dialect are shown in Figure 5.
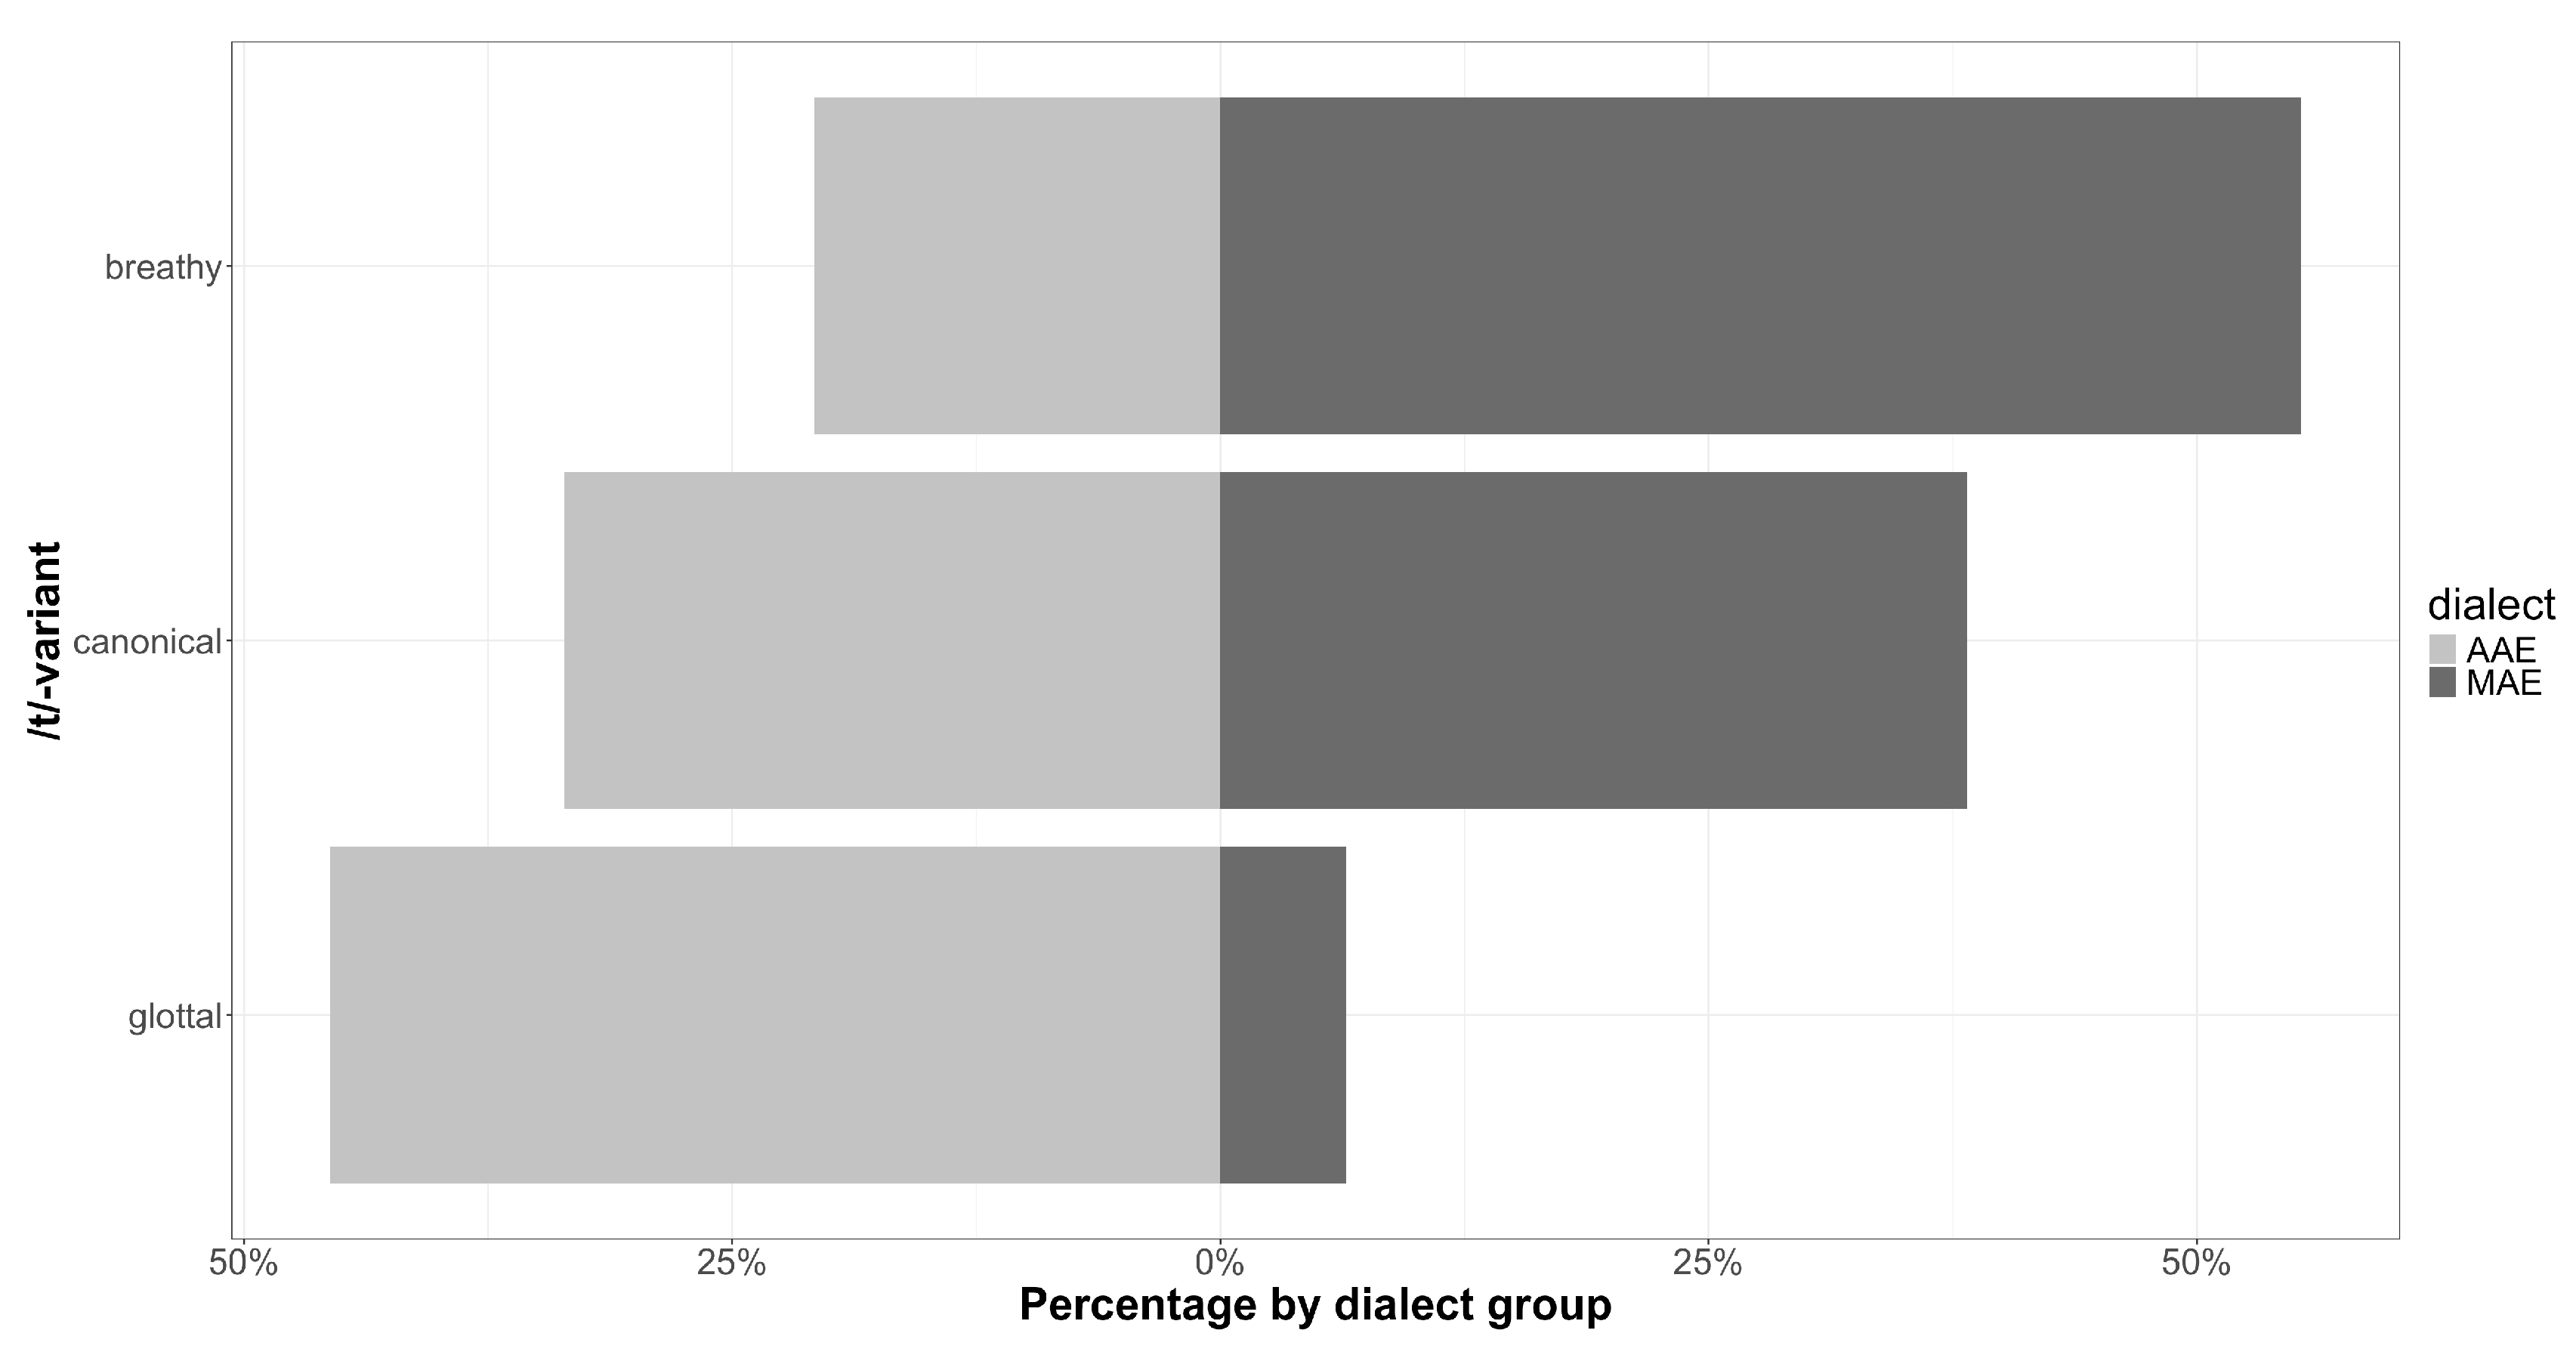
Figure 5. Back-to-back plot showing proportions of /t/ variants by dialect group, according to superordinate categories.
Using the superordinate categories described in Table 3, and not counting canonical [th], which is kept as a separate category, the MAE speakers used tokens which are largely breathy (mainly affricates, then fricatives), while the AAE speakers used a wider range of variants, which can primarily be classified as “glottal” (pre-glottalized, glottal stop, ejective). The breathy tokens were used at a rate of 55% for MAE speakers, compared with 21% breathy tokens for the AAE speakers. By contrast, the AAE speakers used glottal tokens at a rate of 46%, while MAE speakers used them at a rate of 6%. AAE speakers showed a higher probability of glottal variants relative to MAE speakers (median difference = 0.347, 95% CrI [0.001, 0.975], p_gt0 = 0.982), indicating strong evidence that glottal realisations were more frequent among AAE speakers. No credible dialect differences were observed for the breathy or canonical variants, as their credible intervals overlapped zero.

3.4. Age Variation

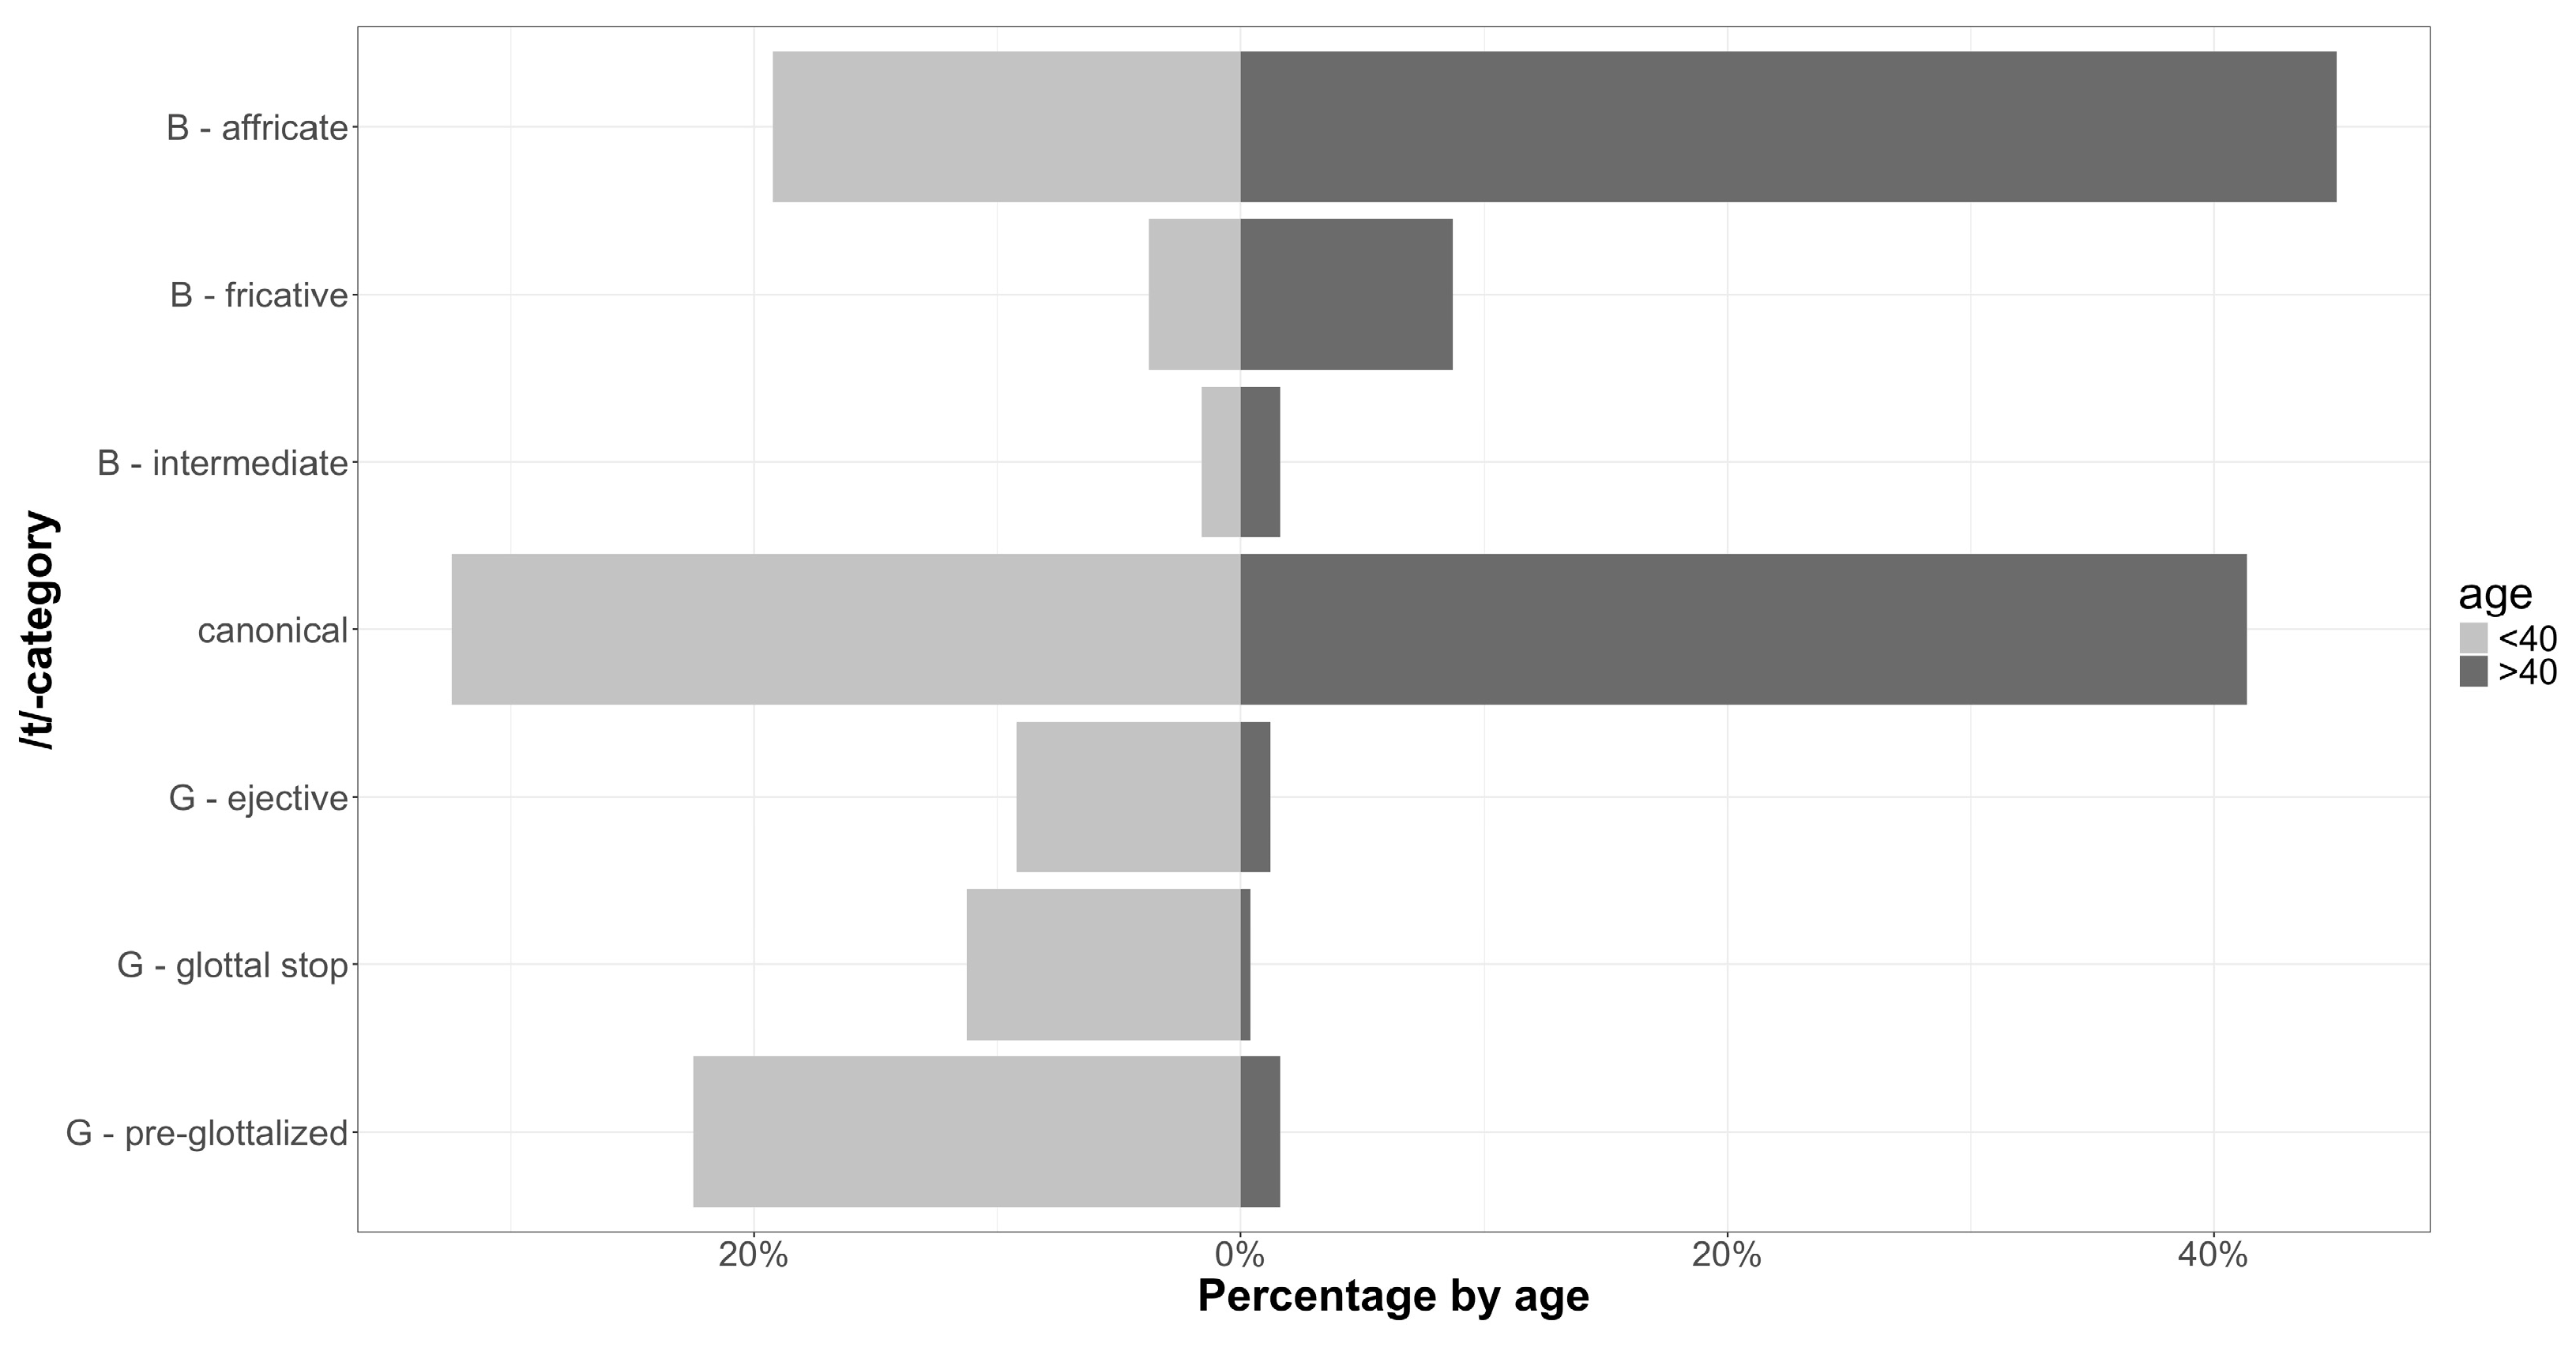
Figure 6 shows the distribution of /t/-categories by percentage, according to the broad age groups, under and over 40 years.
Figure 6. Back-to-back plot showing proportions of /t/ variants within each age group, <40 and >40. B = breathy, G = glottal.
Marked age differences are present in Figure 6 for affricated variants (younger: 19%, older: 45%) and pre-glottalized variants (younger: 22%, older: 2%). However, these differences were not statistically significant. Figure 6 also shows that while both age groups used relatively high amounts of canonical /t/, at 32% for younger speakers and 41% for older speakers, the other /t/-categories occurred at markedly different rates across the age groups. For example, there are very few ejective, glottal stop or pre-glottalized variants used by the over 40s in this dataset, with these occurring at rates of between 1 and 2.5% (amounting to only 24 tokens in total). This is in stark contrast to the younger speakers, who used pre-glottalized variants at a rate of 22%, the glottal stop [ʔ] at a rate of 11%, and ejective variants at a rate of 9%. Fricated /t/, on the other hand, is observed more frequently for older speakers in these data, at a rate of 9%, as opposed to 4% for younger speakers. While these trends are evident, only glottal stops reached statistical significance, occurring more for younger speakers (median difference = 0.067, 95% CI = [0.0007, 0.852], p_gt0 = 0.994).
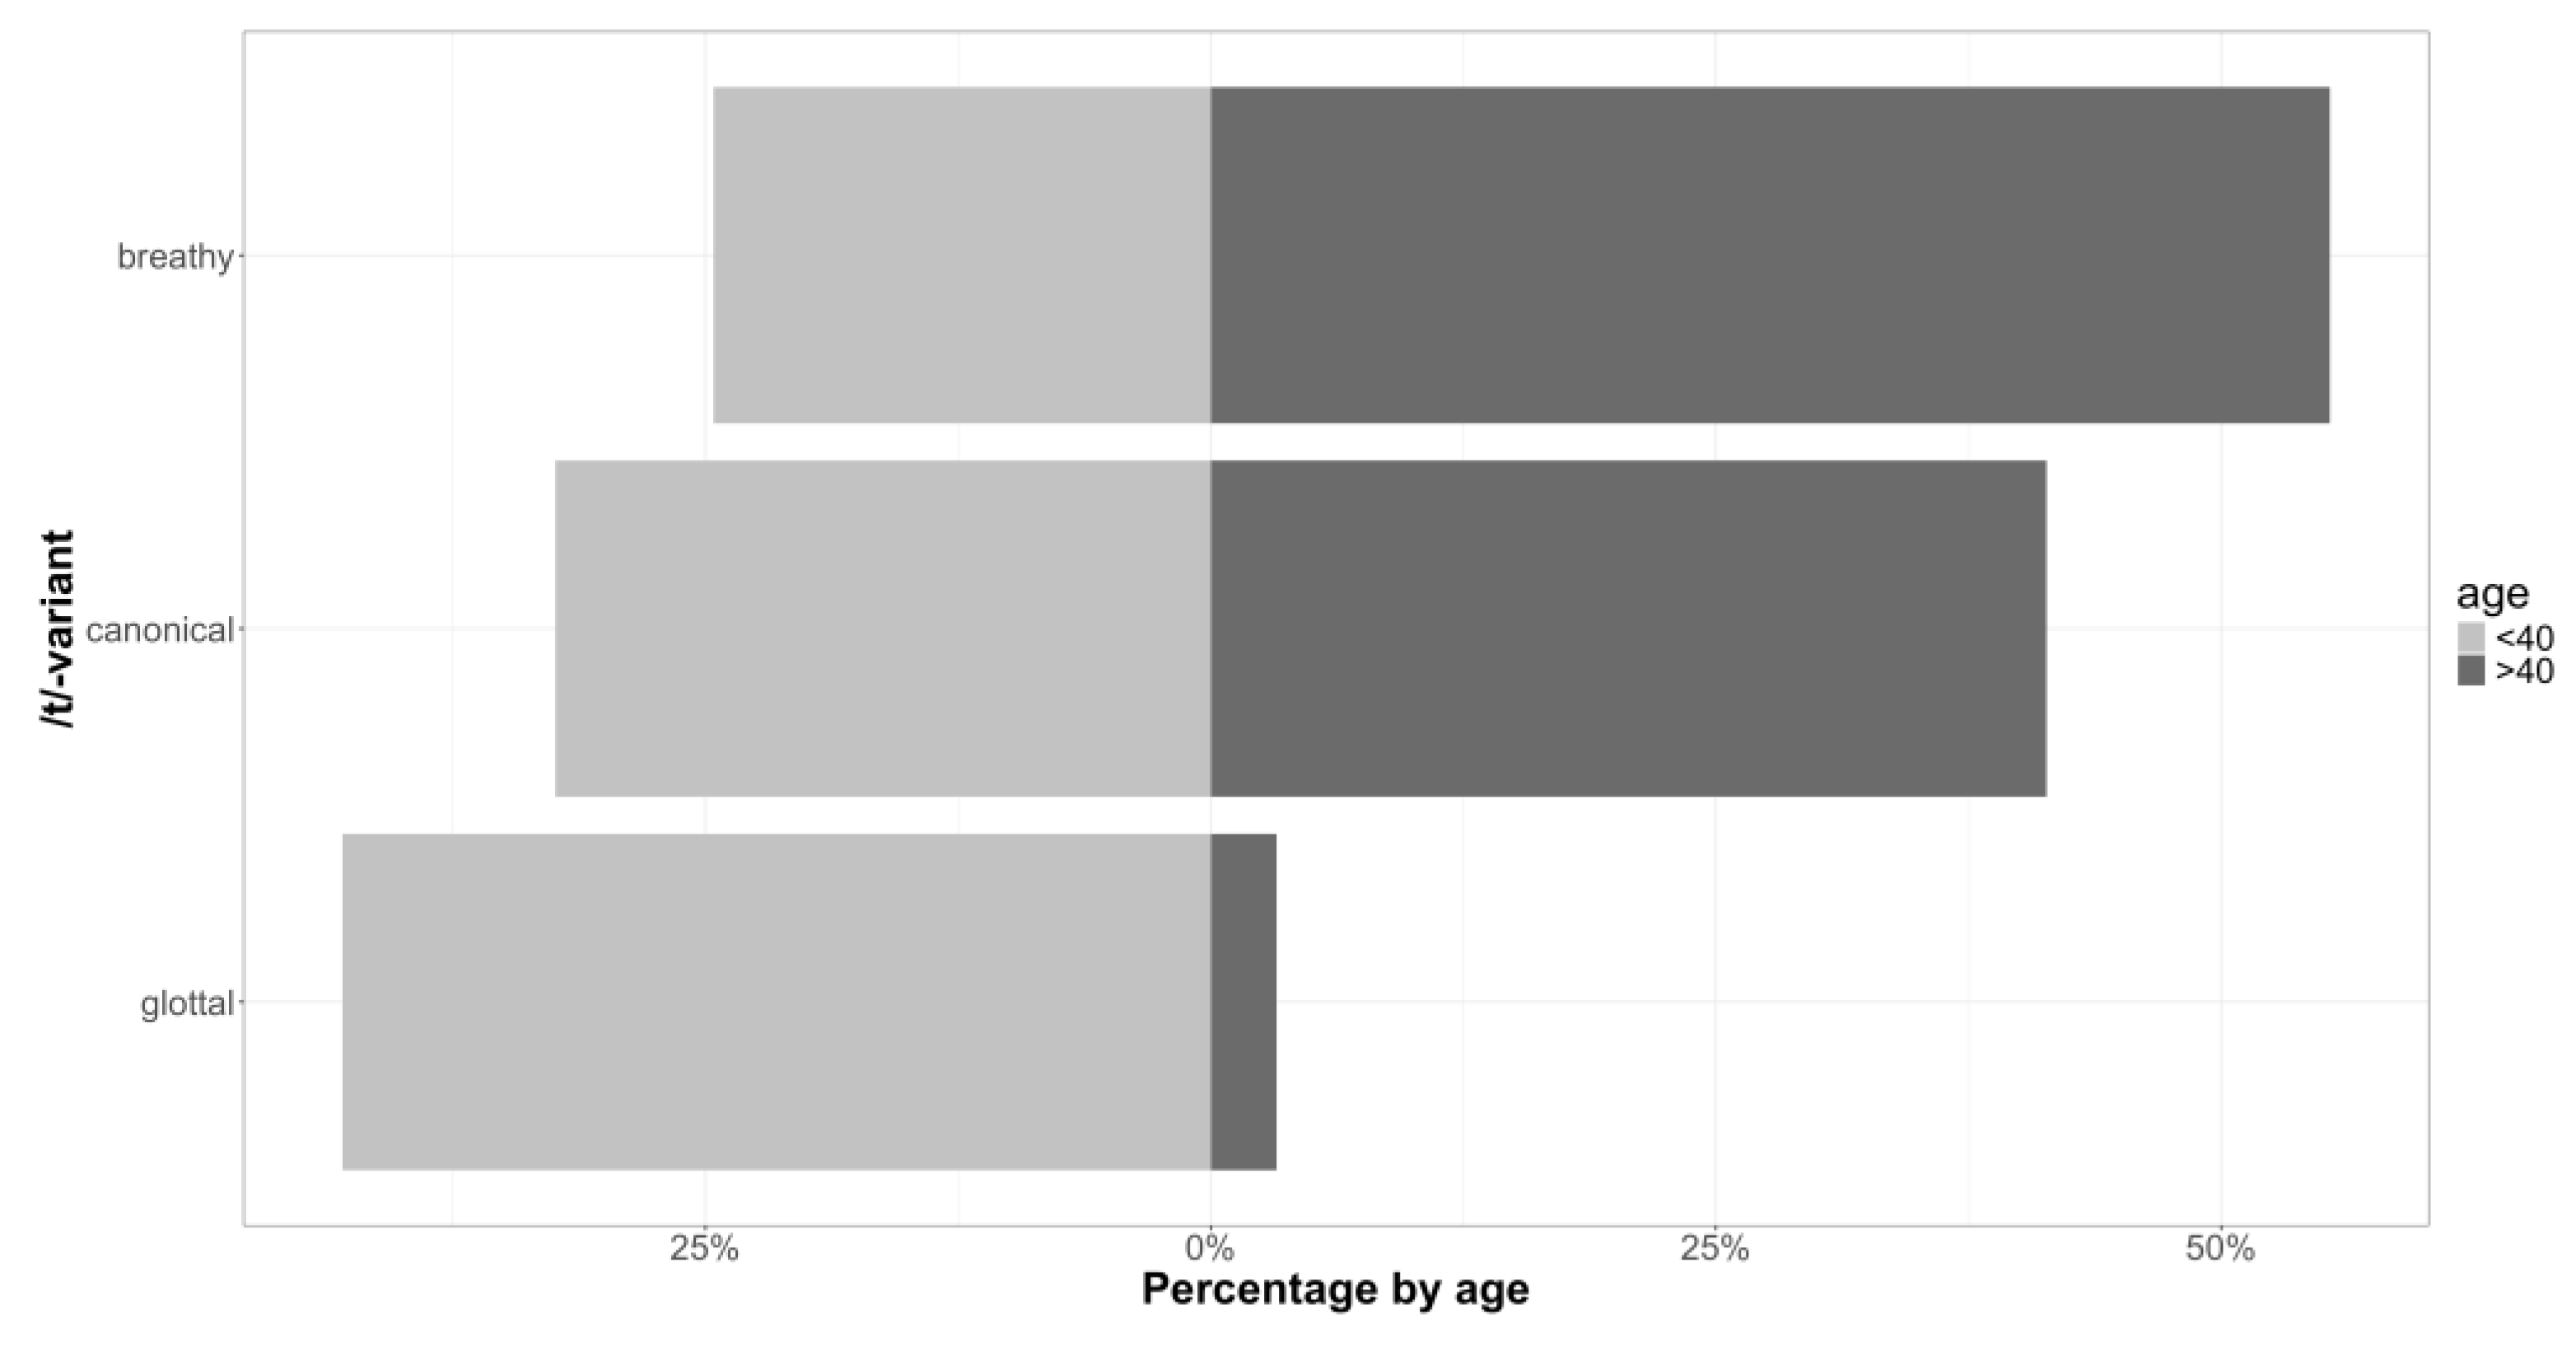
Back-to-back plots showing the distribution of variants by age are shown in Figure 7.
Figure 7. Back-to-back plot showing proportions of /t/ variants by age group, according to superordinate categories.
Similar to the division between AAE and MAE speakers, when the age groups are compared using the superordinate categories, younger speakers used more glottal variants at a rate of 43%, while older speakers used them at a rate of less than 1%. Conversely, older speakers used more breathy variants (55%), while breathy variants occurred only 25% of the time in the younger speakers’ data. A clear age effect emerged for the breathy variant. Speakers under 40 showed a lower probability of producing the breathy variant relative to speakers over 40 (median difference = −0.300, 95% CrI [−0.773, −0.032], Pr > 0 = 0.003), indicating strong evidence of age stratification for this variant. No credible age differences were observed for the canonical or glottal categories.

3.5. Gender Variation

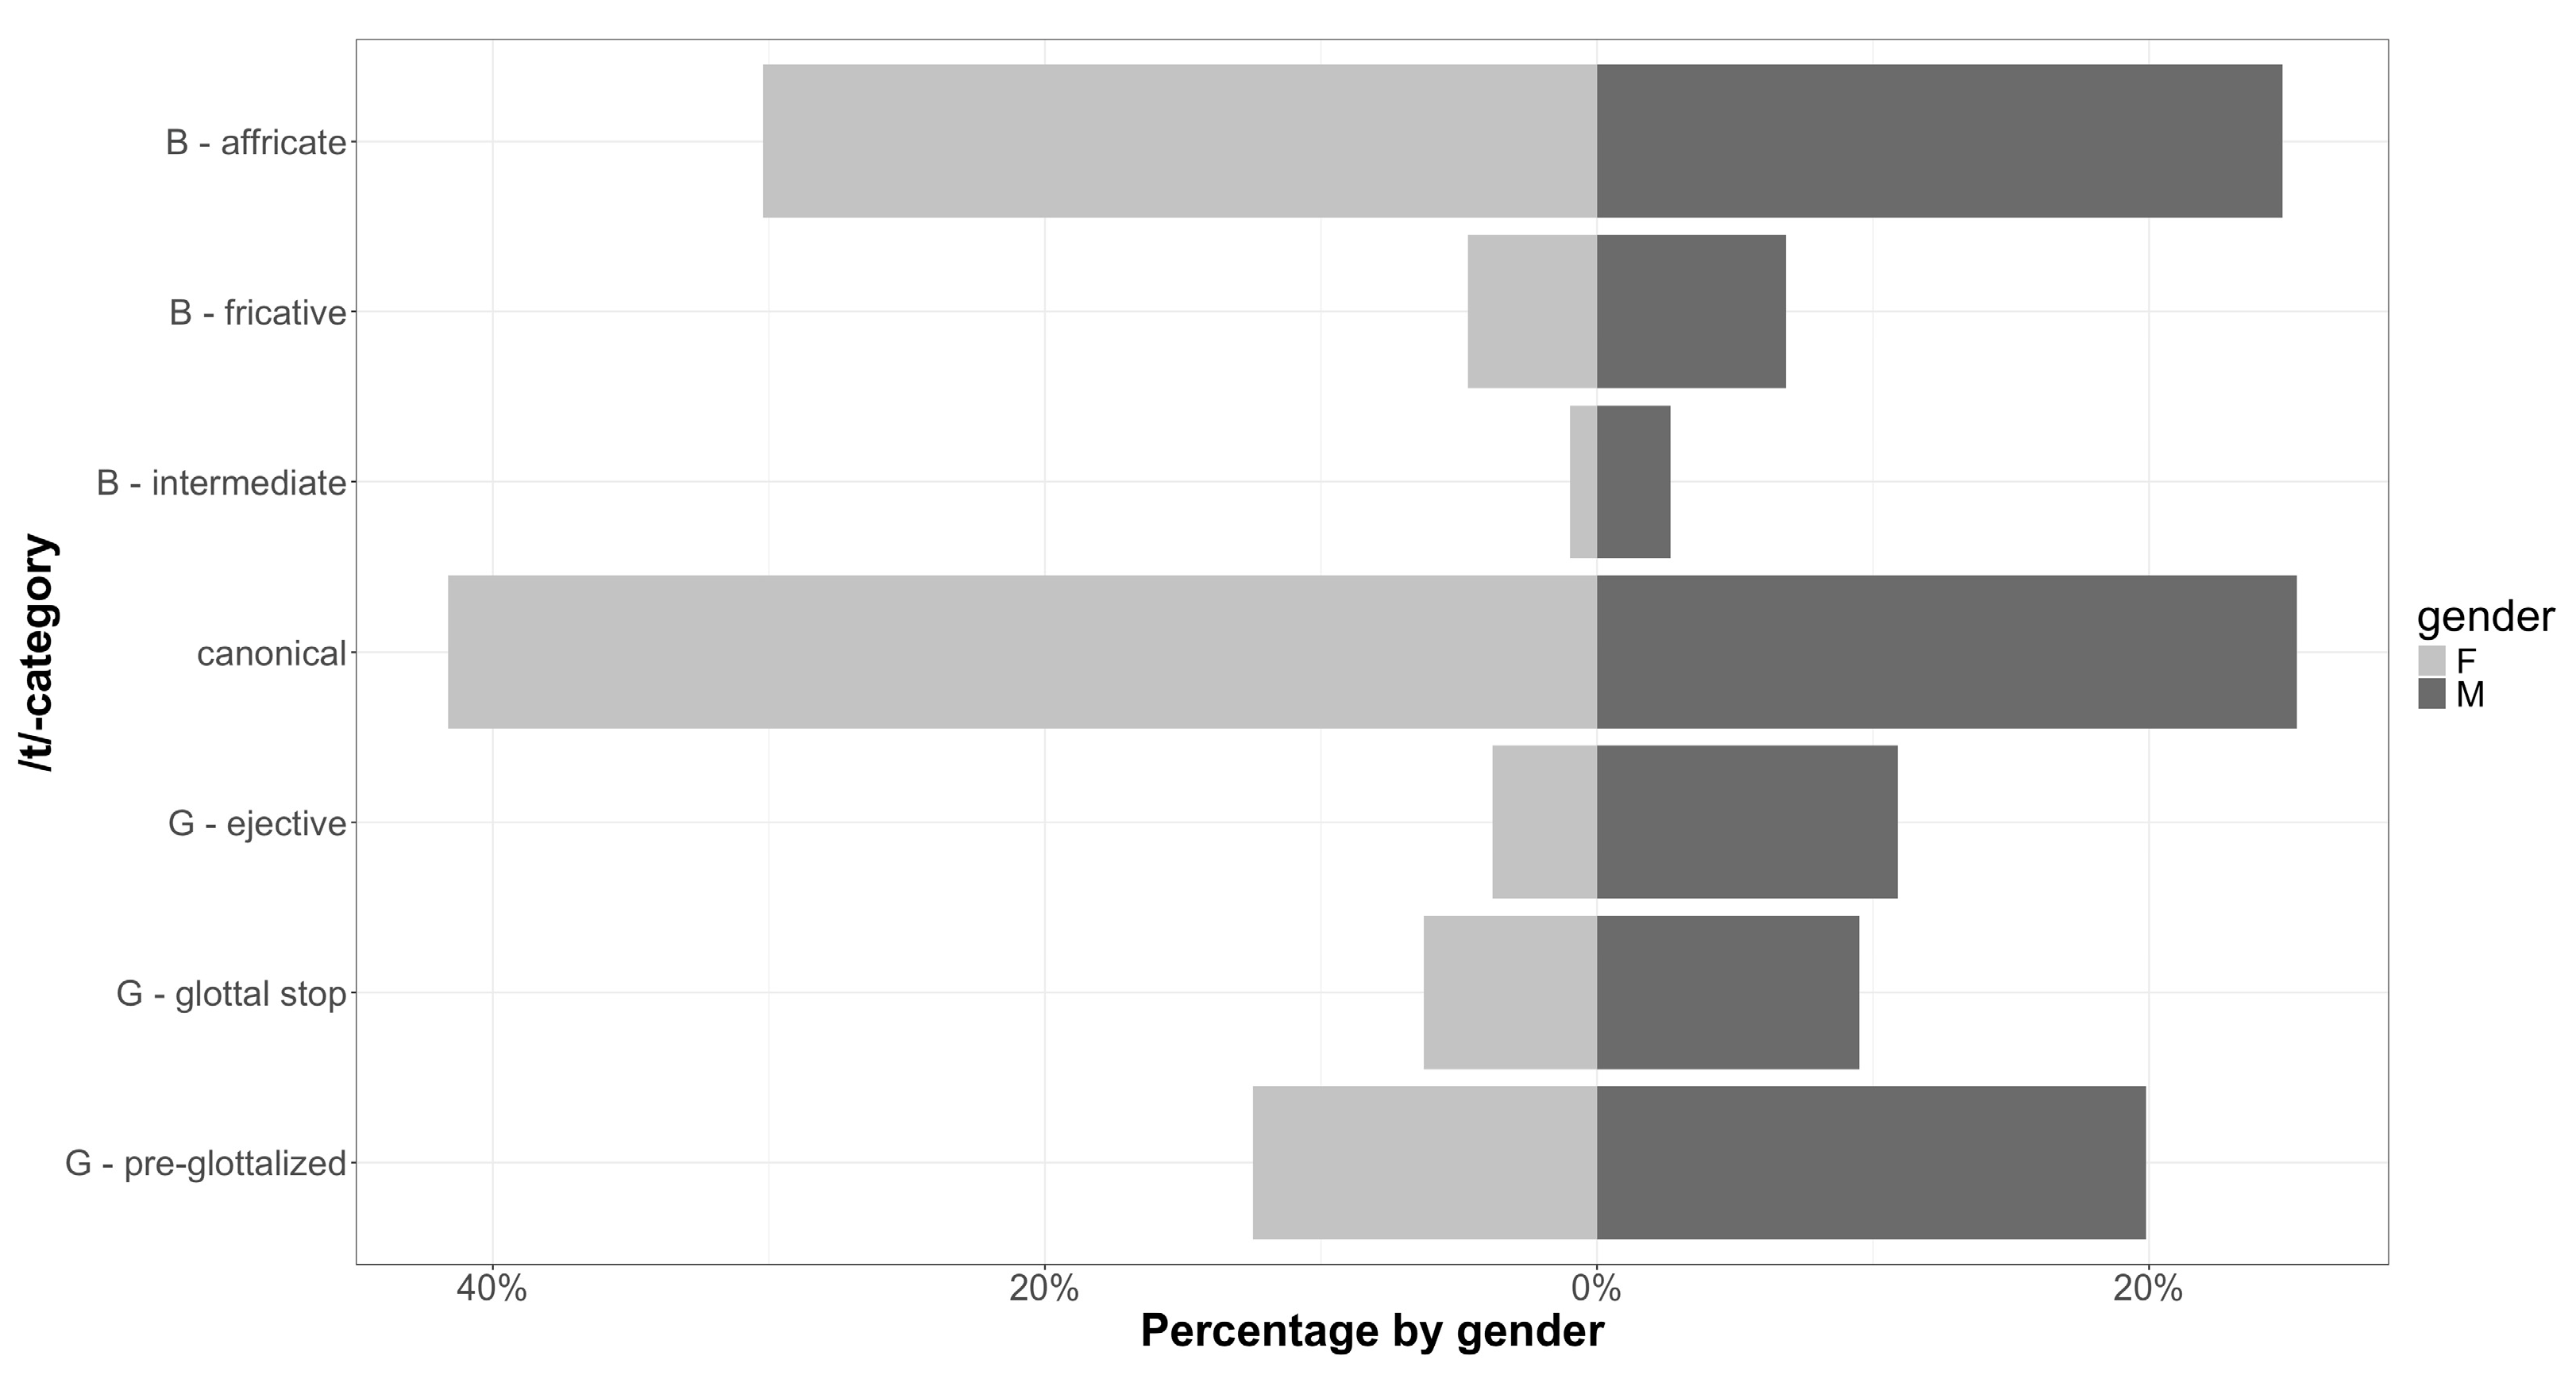
Turning now to the final social factor under analysis, Figure 8 shows the patterning of variants observed in the data according to gender.
Figure 8. Back-to-back plot showing proportion /t/ variants according to gender. B = breathy, G = glottal.
The analysis presented here shows that gender was important for the distribution of /t/-categories in the data, but also that gender differences were smaller and more uncertain than seen for location, dialect and age. Neither male nor female speakers had a higher probability of producing any type of /t/-category. Figure 8 nevertheless shows the way the /t/-categories were distributed by gender, with some clear visual differences between females and males indicating why gender was important to some degree in the statistical model. The figure also shows that almost three-quarters of the female speakers’ tokens were from two main /t/-categories, canonical /t/ (42% of tokens) and affricated /t/ (30% of tokens). Male speakers, on the other hand, favoured three main variants, canonical /t/ (25%), affricated /t/ (24%) and pre-glottalized /t/ (19%), and males also used the ejective, glottal stop, fricative and intermediate categories in higher proportions than the female speakers. Back-to-back plots showing the superordinate categories for gender are shown in Figure 9.
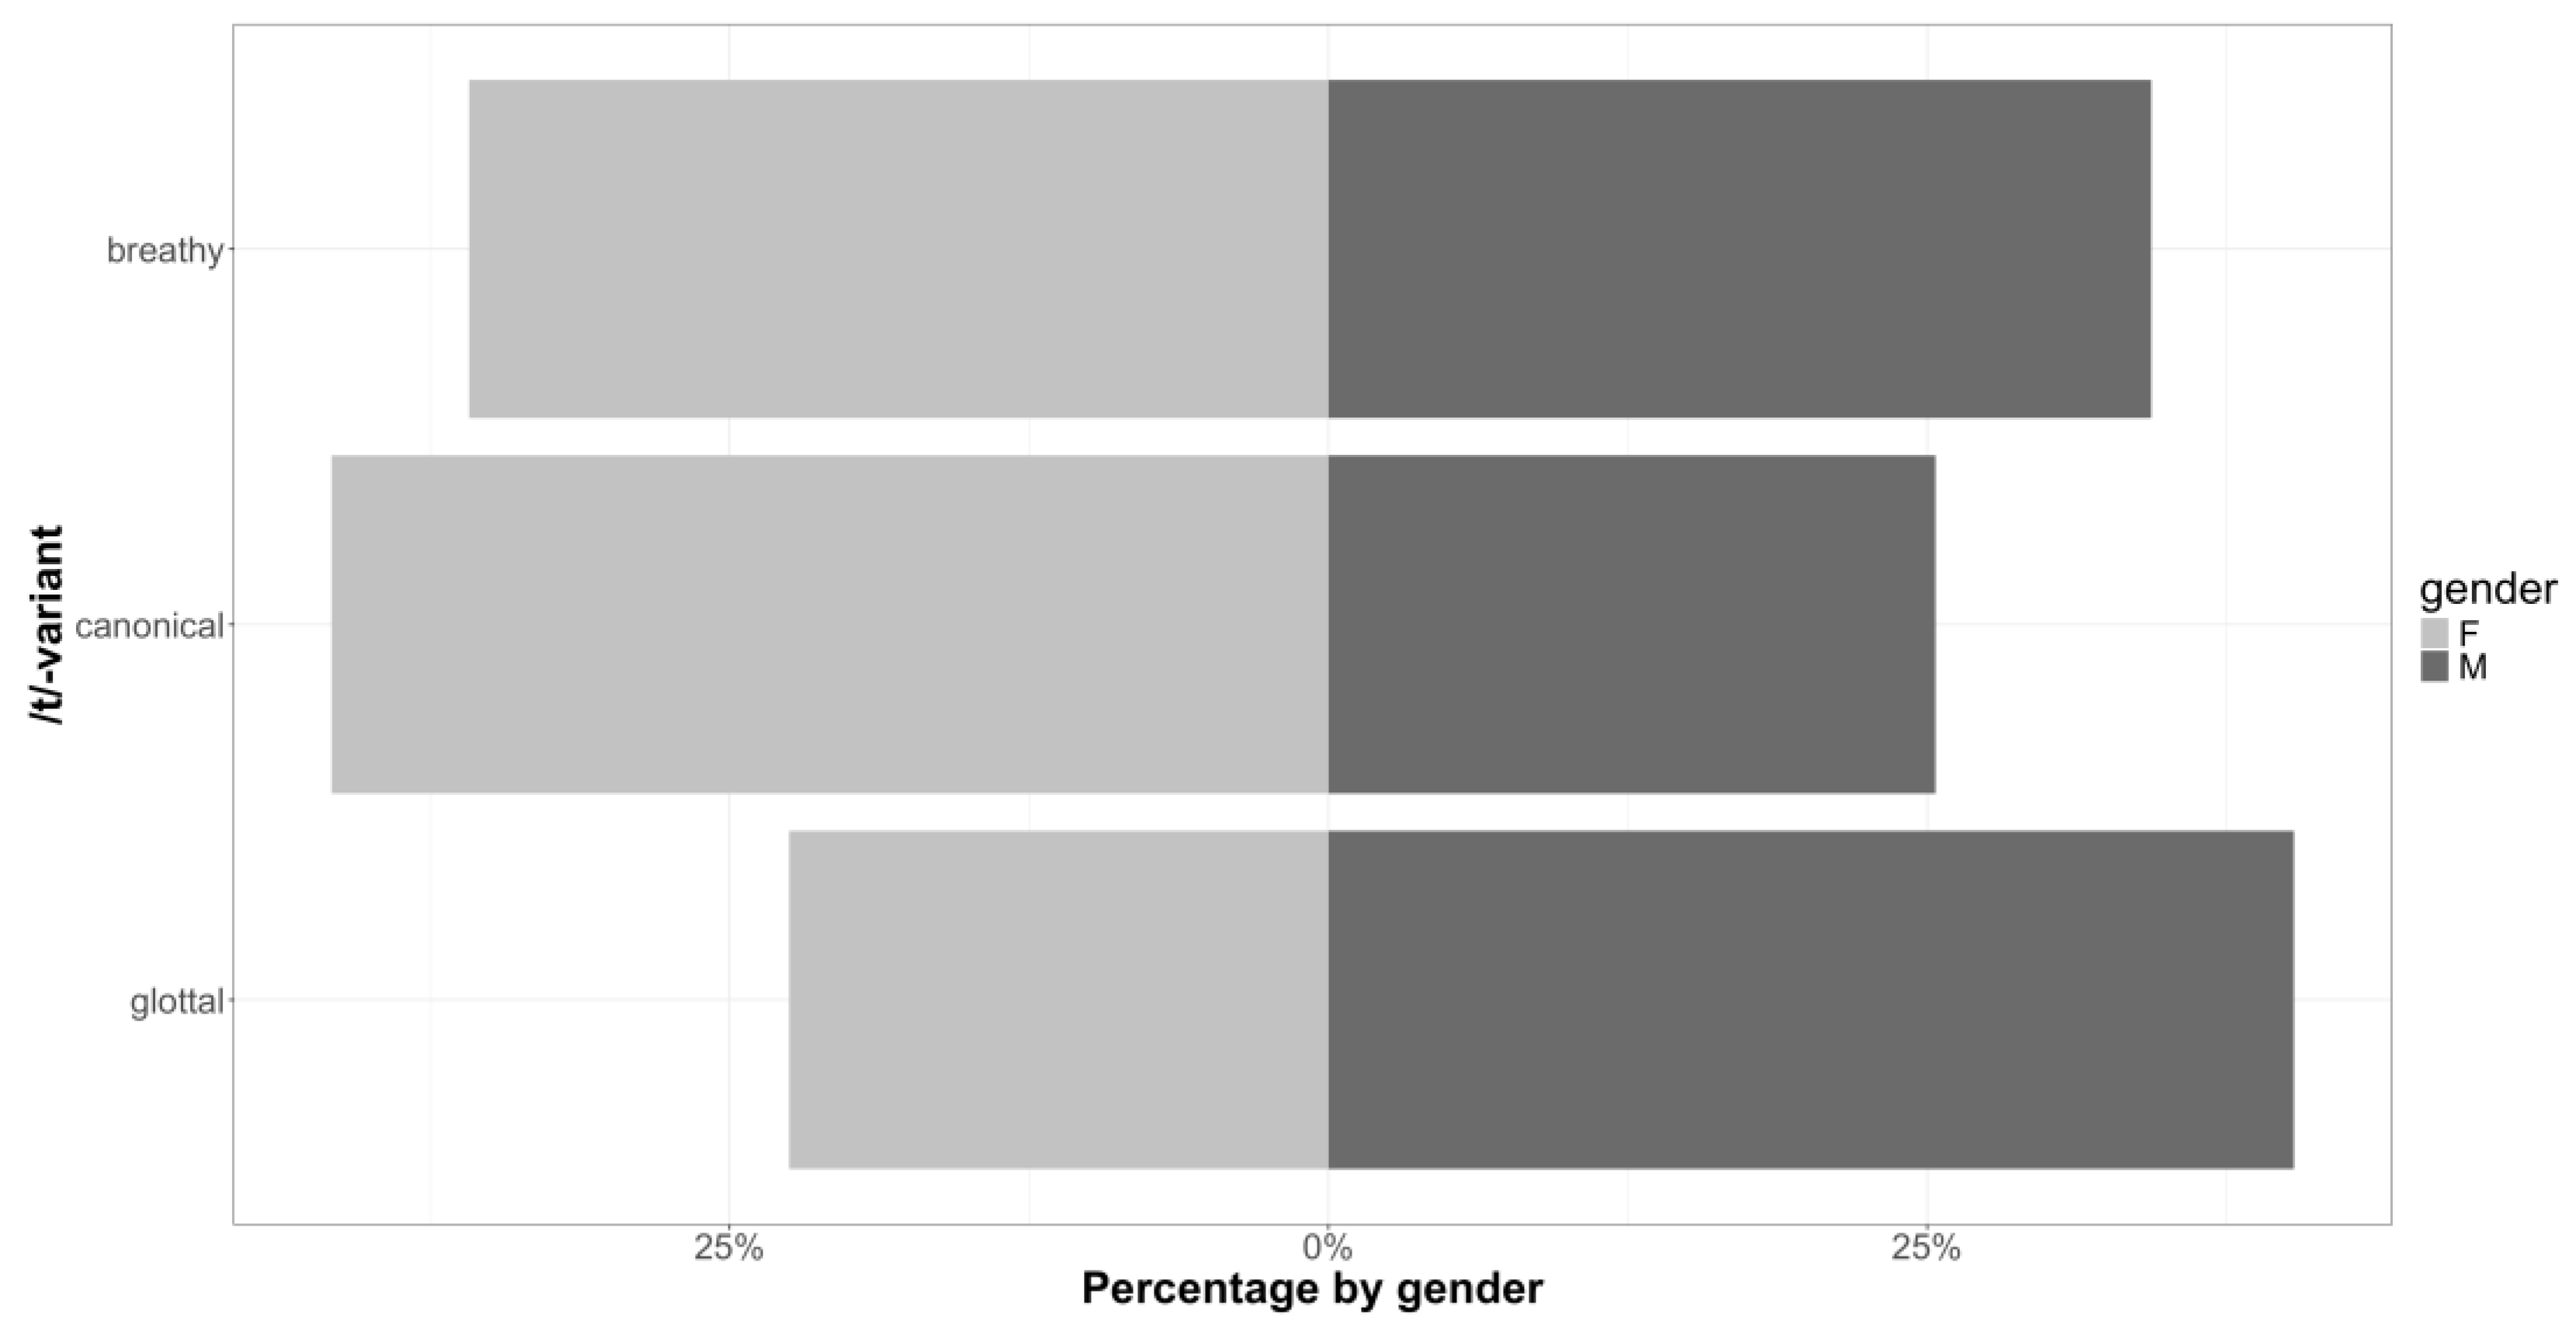
Figure 9. Back-to-back plot showing proportions of /t/ variants by gender, according to superordinate categories.
Applying the superordinate categories is useful for the gender analysis, showing that male speakers used far more glottal tokens (40% of their /t/ productions) than female speakers did (21%). As already mentioned, canonical /t/ was used far more often by women at 42% compared to 25%. Breathy variants, by contrast, were distributed more evenly across the genders, with 35% for female speakers and 34% for male speakers. Pairwise posterior contrasts of predicted probabilities indicated limited evidence for gender differences, with no credible gender differences observed. While female speakers showed a numerically higher probability of the canonical variant relative to males (median = 0.328), uncertainty remained substantial, and the credible interval included zero.

3.6. Variant Interactions

Although the main effects from the variant model indicate that dialect conditions glottal production and age conditions breathy production, these effects do not necessarily operate uniformly across the speech community. The full model included interactions among social predictors in order to assess whether the magnitude or direction of these differences varies across groups. A credible dialect × age interaction (β = 8.77, 95% CrI [1.00, 17.95]) indicated that an age effect differed across dialect groups and that there is a gender effect that varies by location, with a positive location × gender interaction (β = 4.36, 95% CrI [1.18, 7.81]). To examine this, further post hoc pairwise contrasts were computed from the posterior predicted probabilities.
Overall, interaction effects were generally weak, with most contrasts showing credible intervals overlapping zero, indicating limited evidence that social factors substantially modified dialect differences. The dialect × age contrasts showed no reliable interaction effects. Differences between AAE and MAE speakers were broadly similar across age groups for breathy, canonical, and glottal variants (all credible intervals spanning zero), suggesting that dialect-related differences were relatively stable across generations. In contrast, the dialect × location interaction showed evidence of differentiation for the breathy category. The AAE–MAE contrast was substantially larger in Mildura than in Warrnambool (median difference = 0.757, 95% CI = [0.308, 0.949], p_gt0 = 0.998), indicating that regional location modulates dialect differences for breathy realisations. Canonical and glottal contrasts, however, showed wide credible intervals overlapping zero, suggesting weaker or uncertain location-based modulation. Interactions involving gender (dialect × gender and age × gender) showed little evidence of systematic differences. Across breathy, canonical, and glottal categories, posterior contrasts remained centred near zero with wide credible intervals, indicating that gender did not strongly condition dialect or age effects in the present data. Similarly, age × location contrasts showed no reliable interaction effects, with all categories exhibiting credible intervals overlapping zero. This suggests that age-related differences in variant use were broadly consistent across locations. In all, the interaction contrasts indicate that most social effects operate largely additively, with limited evidence for strong interaction structure. The primary exception is the dialect × location effect observed for breathy realisations, where regional location appears to amplify dialect differentiation.

4. Discussion

The aim of this study was to contribute to a more comprehensive picture of sociophonetic variation in /t/ in Australian Englishes, especially in non-urban locations and in AAE. General patterning of the allophonic variants of /t/, as well as sociophonetic variation, were evaluated. Specifically, coda /t/ was examined in two rural locations in Victoria, with four factors under analysis: location, dialect, age and gender.
Across the dataset, the variant [th] was the most frequently observed /t/-category, both for MAE and AAE dialects. [th] has previously been described as common in MAE, and its high frequency in the current dataset, which also includes the non-mainstream variety, further justifies the name “canonical” being used for the aspirated variant as it is indeed the most typical variant for both dialects. It could therefore be argued to be the “phonemic” category, while other variants are underlying forms (see, e.g., Fritche et al., 2021, who argue this relating to child-directed speech). Other frequently observed variants were the affricate [ts] and the pre-glottalized [ˀt]. Together, these three /t/-categories amounted to 79% of all tokens analyzed, while other variants occurred far less frequently.
As for sociophonetic patterning, it was seen that the best-fitting model included all four predictors (location, dialect, age and gender), with random intercepts for person (speaker) and word. When the distribution of variants was examined more closely, however, it was found that dialect and age showed the strongest sociophonetic patterning, with limited patterning for location. Gender was important in the model, but sociophonetic patterning was inconsistent and uncertain. As mentioned earlier, this study expanded the dataset and analysis presented in (Loakes et al., 2022) as far as coda /t/ is concerned. Similar to the current study, Loakes et al. (2022) showed that age and dialect were strongly associated with /t/ patterning; however, the regional and gender patterning in this study is not as evident here, as will be discussed in this section.
Focusing firstly on the strongest patterns in the present dataset, for dialect it was seen that while both MAE and AAE speakers used canonical /t/ in large proportions, there were sociophonetic differences in the likelihood of producing affricates (significantly more for MAE speakers). The AAE speakers also presented a wider distribution of variants overall. Implementation of the superordinate categorization was useful for confirming that canonical variants were used by both groups, but aside from this, MAE speakers had a preference for breathy variants generally, while AAE speakers had a statistically significant preference for glottal variants.
The sociophonetic patterns in /t/ realization observed for dialect are consistent with previous research showing greater variability for AAE speakers (seen here in the wider distribution of variants), i.e., Butcher (2008), Harkins (2000), Mailhammer et al. (2020) and Mailhammer (2021). Mailhammer (2021) discussed the fact that phonetic variants in his studies were observed in both AAE and MAE, but the variants were deployed in different ways and with more variability in the AAE samples, and this is exactly what has been observed in the present data.
This greater variability in AAE is likely linked to the speakers’ exposure to and experience with multiple varieties, i.e., they hear, and in some cases use, both AAE and MAE in their speech communities (see Loakes et al., 2024, for more information about the bidialectalism of the AAE group). This finding is consistent with research on dialect exposure more generally (Clopper & Walker, 2017), which shows that one outcome of exposure to multiple varieties is that language users have more variable distributions, as is seen here. Thus, it is not surprising that AAE speakers use the categories which are favoured by MAE speakers, but they also use other categories and effectively draw from a wider pool of variants.
As for age, while both the older and younger groups used canonical stops, there were differing distributions for many of the other /t/-categories. However, the only significant difference was that younger speakers were more likely to use glottal stops. In the superordinate category analysis, there was a clear age division, with younger speakers producing the majority of the glottal tokens in the corpus, while older speakers were responsible for more breathy and canonical tokens. However, the only statistically significant result was for greater numbers of breathy tokens for older speakers. These findings for age are also broadly consistent with previous research on consonant production in MAE. For example, Penney et al. (2018, 2025) have demonstrated that glottalization is increasingly being used by younger speakers to signal voicelessness in coda /t/ (in combination with reduced vocalic cues). Penney et al. (2020) have also shown that listeners can use glottalization as a cue to /t/ voicelessness, across both older and younger age groups, despite the age difference existing in production (i.e., Penney et al., 2018). These authors note that misalignment in production and perception between older and younger participants is likely due to a sound change led by perception, with both groups using glottalization in categorizing voicelessness when listening, but younger speakers being at an advanced stage of using it in production (Penney et al., 2021, p. 53). The present study additionally contributes to knowledge on what older speakers are doing in production in two non-urban locations. The speakers in the present study used far more breathy variants than described in the Penney et al. (2018, 2021) studies, and rather than being regionally relevant, this could be due to slower rates of sound change in areas with smaller populations. Similar findings have been observed for perception of vowels in Warrnambool and Mildura (Loakes et al., 2024) and production of vowels in Hobart (the capital of an island state in Australia) compared to cities on the mainland continent (Stanley & Loakes, 2025).
While patterns in the present data were less strongly associated with location and gender, these factors nevertheless played some role in how /t/ was produced by speakers. Location-based patterning was limited, and it was only the affricate [ts] which showed a significant difference due to location, with speakers from Warrnambool more likely to produce this variant. The superordinate category analysis showed apparent differences in the distribution of variants, with speakers in Mildura using more glottal tokens and speakers in Warrnambool using more breathy variants, but this pattern was not statistically significant. While there are no other studies focusing on regional variation in Australian English /t/ production which offer a direct comparison, the present findings can be compared with the earlier Warrnambool/Mildura study (Loakes et al., 2022), as the earlier study did indeed highlight a difference in regional and gender distribution which has become less pronounced with the expanded dataset (and removal of the intervocalic context). As noted, the earlier study is largely a preliminary version of the current work, and while the sociophonetic patterns found here were overall very similar, both location-based and gender variation seemed to play a bigger role in the patterns for most /t/-categories in the earlier dataset. This means that adding more data has effectively levelled out some of that apparent variability.
Gender deserves some additional comment, as it has been observed in various studies as highly relevant for patterning in /t/ realization (i.e., Horvath, 1985; Haslerud, 1995; Tollfree, 1996; Tait & Tabain, 2016; Docherty et al., 2018; Ford, 2018; Powell-Davies & Billington, 2024). Contrary to expectations from the literature which has shown some gendered patterning for /t/, in the present study male and female speakers did not have a higher probability of producing any type of /t/-category than any other. There were some clear gender groupings evident, indicating why gender was important in the statistical model, but this was not significant. In the present data, female speakers tended to use two main variants (canonical and affricated /t/), while male speakers used three main variants (canonical and affricated /t/ like the female speakers, but also the pre-glottalized /t/). Male speakers also used more ejective, glottal stop and fricative variants. This is an interesting finding because fricatives have been associated with women in some earlier (but less comprehensive) research, i.e., Haslerud (1995), Tollfree (1996), Jones and McDougall (2009), and Loakes and McDougall (2010), although later research by Shea et al. (2023) shows that this is more complex than just an association with women (with a broad indexical field where “educatedness” is somewhat relevant). Given the large number of breathy tokens in the superordinate analysis in Warrnambool, this present finding relating to fricatives and gender may also show some interplay with location (albeit not statistically).
Weaker associations with gender for the /t/ variants align with recent acoustic-phonetic work on consonants in Australian English. In the 2018 study by Penney et al. analysing the link between glottalization and coda voicing, gender was not a factor in glottalization associated with /t/ closure (although age was). In the White et al. (2025) study on intervocalic /t/ in different Sydney communities, gender was also not a factor in variant distribution at all, with community diversity instead showing strong sociophonetic patterning. This suggests a potential levelling of gender differences in Australian English, perhaps amongst younger people. Certainly, studies with child participants support this hypothesis. For example, while Tait and Tabain (2016) and Ford (2018) found gendered patterning of /t/ in their data, Ford (2018) reported that gender patterning of /t/ reduced with age. She noted that male and female 11–12-year-olds used more similar variants to one another across the cohort compared to the younger speakers in the study (i.e., the 5–6-year-olds and 7–9-year-olds exhibited gender differences). While this particular finding aligns with the suggestion that gender patterns may be levelling somewhat in Australian English, more explicit research would be needed to confirm this hypothesis. Evidently, the fact that the younger speakers in Tait and Tabain (2016) and Ford (2018) had some gendered patterning in their /t/ realisations speaks to the existence of its importance at some level. As shown in other research on /t/, e.g., by Foulkes et al. (2005) in Tyneside English, very young speakers exhibit more gender variation in their speech than older children, which is associated with the gendered patterning they in turn hear from adults. In other words, caregivers actually produce gendered variation with younger children, with girls tending to be exposed to standard variants, and boys to more non-standard variation. However, some research (Fritche et al., 2021) has also shown that mothers use more canonical (aspirated) /t/ variants when talking to children, and fewer allophonic variants. In Australian English, gender was also observed as important in the recent Shea et al. (2023) study on attitudes toward fricated /t/ in Australian English. That study found that listener gender was indeed significant in how judgements were made toward attributes associated with fricated /t/. However, Shea et al. did not explicitly analyse speaker gender because the stimuli had been produced by only six speakers who were treated individually (rather than as two small gender groups) in the model.
With respect to sociophonetic patterning of individual /t/-categories in the present analysis, the apparently low level of importance placed on gender (as opposed to age and dialect) may also point to a broader issue. This issue relates to a less broad view of gender, and is quite apart from potential levelling, but still underscores the need for further research. In their recent work on the production and perception of voice quality in German dialects, Penney et al. (2024) explain that micro-level aspects of gender can be at play in how speakers produce variants and in how listeners interpret them, such as aspects of “gender performance” and various other kinds of social attributes (also touched on by Shea et al., 2023). Penney et al. (2024, p. 2) point out that “speakers are social actors” and that it may be the communicative functions of social meaning driving their articulations. While they are referencing German, these matters highlighted by Penney et al. (2024) are always embedded in sociophonetic research of any kind (also see, e.g., Podevsa & Kajino, 2014; Foulkes & Docherty, 2006) but not always able to be analyzed because of the nature of the study design.
In the present work on Australian English /t/, it was seen that when gender is considered only as an isolated variable with respect to /t/, it is indeed more weakly associated with speaker behaviour than dialect, location and age. It is also acknowledged that the present study used read speech samples, which decontextualize speech from its social context to some extent, likely dampening the ability of speakers to perform important social indexing such as gender. Future work which incorporates an analysis of more naturalistic speech produced by the same speakers is needed to begin understanding how /t/ is used across different styles and the extent to which speakers “perform” their social categories. Future work should also include a more integrated voice quality analysis using dynamic acoustic measurements rather than simply using broad categories.
Some more general observations which are worth highlighting relate to the overall distribution of variants, here inferred to be closely related to voice quality, as made evident in the superordinate category analysis and as discussed throughout this paper. While the investigation here is still a very controlled study, this addition of voice quality, along with /t/ articulation, points to the interconnectedness of variation (see especially Garellek, 2022). Recent research on Australian English by Penney et al. (2025) also links together consonant quality and voice quality, focusing on strategies for achieving voicelessness in coda consonants. Penney et al. (2025) highlight that glottal constriction (which equates with creakiness) and glottal spreading (equating to breathiness) are two different strategies for implementing the same thing, but with differing acoustic consequences. These authors show that young urban speakers of Australian English from Sydney tend to use glottal constriction for /t/ and glottal spreading for /k/, with /p/ being intermediate between the two. The work in the current paper makes similar contentions but shows a wider spread of strategies linked to achieving voicelessness within Australian English (and in this study, the focus was /t/ only). For example, the present data show that in producing /t/, AAE speakers and younger speakers tend to have more glottal constriction, while speakers from Warrnambool and older speakers tend to have more glottal spreading.

5. Conclusions

This study aimed to investigate sociophonetic variation in coda /t/ spoken in two rural locations (Warrnambool and Mildura) in Australia. The four factors under analysis were location, dialect (AAE or MAE), age and gender, and it was shown that age and dialect were strong indicators of how speakers produced /t/ variants. It was also seen that speaker groups tended to use the same overall types of variants when /t/ was classified as either breathy, glottal or simply canonical (aspirated). In other words, speakers within a variety may not all use exactly the same /t/ as one another, but they often share overlapping features which broadly equate with voice quality characteristics.
This study contributes to the growing body of work on consonant variation in Australian English, which is relatively understudied compared with vowel variation. It also adds to knowledge of non-urban varieties of Australian English and has uncovered some patterns of variation that were previously unknown due to a focus on speech in urban varieties. In particular, it showed that full glottal stops and ejectives are a relatively common feature of AAE and that, likely due to slower rates of change combined with sociophonetic factors, not all Australian English speakers link glottalization and voicelessness in their production of /t/. Finally, this work sheds new light on how and why AAE sounds different from the Mainstream variety, further highlighting that L1 AAE speakers draw from a wider pool of phonetic variants than MAE speakers.

Author Contributions

Conceptualization, D.L. and K.M.; methodology, D.L., K.M. and A.G.; software, A.G.; validation A.G.; formal analysis, A.G. and D.L., investigation, D.L., K.M. and A.G.; resources, D.L. and K.M.; data curation, D.L.; writing—original draft preparation, D.L. and K.M.; writing—review and editing, D.L., K.M. and A.G.; visualization, A.G.; supervision, D.L.; project administration, D.L.; funding acquisition, D.L. and K.M. All authors have read and agreed to the published version of the manuscript.

Funding

This research was funded by The ARC Centre of Excellence for the Dynamics of Language (Project ID: CE140100041), The Arts Faculty at The University of Melbourne, and a small grant from The Australian Linguistics Society.

Institutional Review Board Statement

The study was conducted in accordance with the Declaration of Helsinki and approved by the Ethics Committee of The University of Melbourne (project ID 11186, final date of approval 1 December 2020).

Data Availability Statement

Results will be made available by contacting the first author. Voice data is not available for re-analysis due to ethical considerations and restrictions, but data can be shared in its synthesized form (measurements).

Conflicts of Interest

The authors declare no conflicts of interest. The funders had no role in the design of the study; in the collection, analyses, or interpretation of data; in the writing of the manuscript; or in the decision to publish the results.

Abbreviations

The following abbreviations are used in this manuscript:
AAEAustralian Aboriginal English
CDClosure duration
CIConfidence interval
CrICredible interval
MAEMainstream Australian English
MIMildura
VOTVoice onset time
VTTVoice termination time
WNWarrnambool

Appendix A

Table A1. /t/ observations per speaker, showing other relevant sociophonetic information.
Table A2. Summary of model output: variants ~ dialect * location + dialect * gender + dialect * age + location * age + location * gender + gender * age + (1|person) + (1|word).
Table A3. Summary of model output: t cat ~ dialect + location + gender + age + (1|word) + (1|person).
Table A4. (a) Posterior Pairwise Comparisons for dialect (subordinate category); (b) Posterior Pairwise Comparisons for location (subordinate category); (c) Posterior Pairwise Comparisons for gender (subordinate category); (d) Posterior Pairwise Comparisons for age (subordinate category).
Table A5. (a) Posterior Pairwise Comparisons for dialect (superordinate category); (b) Posterior Pairwise Comparisons for location (superordinate category); (c) Posterior Pairwise Comparisons for gender (superordinate category); (d) Posterior Pairwise Comparisons for age (superordinate category).
Figure A1. Aspirated “canonical” /t/ example produced in het by a younger female AAE speaker from Warrnambool. Closure burst (spike) and subsequent aspiration evident, some echo present during /t/ closure period.
Figure A2. Affricate /t/ example in het produced by a younger male MAE speaker from Warrnambool. Closure period and long offset evident. Pre-aspiration/devoicing evident in preceding vowel.
Figure A3. Fricative /t/ example in het produced by an older male MAE speaker from Mildura. Pre-aspiration/devoicing evident in preceding vowel. No evidence of stricture or closure, fricative energy throughout.
Figure A4. Pre-glottalized (unreleased) /t/ in het produced by a younger female AAE speaker from Mildura. Glottalization present in vowel (vertical striations more widely spaced) prior to consonant closure. Some echo evident during closure (no burst evident).
Figure A5. Glottal /t/ example in het produced by a younger female AAE speaker from Mildura. The boundary marker is placed at the offset of modal voice activity in the vowel for illustration purposes only (label placement not relevant for the current paper). At the /e/-/t/ boundary, a spectrogram shows laryngeal activity (creak) then complete glottal closure characterized by a lack of spectral activity. No evidence of formant transition movement coming out of the preceding vowel, as would be evident before an alveolar stop.
Figure A6. Ejective /t/ example in het produced by a younger male AAE speaker from Mildura. Strong laryngealization present in the vowel before (long) /t/ closure, evident via more widely spaced striations. Double burst evident at release, and echo evident from background noise during closure. Double bursts are a classic acoustic characteristic of ejectives indicating release of supralaryngeal stricture (burst 1) and release of glottal closure (burst two) (Ladefoged & Johnson, 2015, p. 147).

Notes

1
Note that where terms such as “Anglo” (Horvath, 1985) and “Anglo-Australian” (Haslerud, 1995) as well as “Standard” (Mitchell & Delbridge, 1965) and “General” (Cox & Palethorpe, 2007) are used in earlier work, the term “Mainstream” is adopted throughout the present work, in line with other recent literature (e.g., Cox et al., 2024; Penney et al., 2025). This label is not intended to invoke ideas of correctness, but rather to distinguish the dominant variety from Aboriginal and ethnocultural varieties. Early uses of the term in this way include work by Harkins (2000) when comparing the Aboriginal and mainstream varieties and by Leitner (2004), who appears to be the first to capitalize Mainstream.
2
Note: An earlier version of this study in which results from a smaller version of the dataset are analyzed in less detail is presented in Loakes et al. (2022).
3
VTT refers to the point within the stop closure at which voicing terminates and often refers to partial voicing regardless of the stop’s phonological voicing category.
4
COEDL refers to the Australian Research Council (ARC) Centre of Excellence for the Dynamics of Language, which is the funding body for this research, as reported in the “funding” section at the end of the paper.
5
These categories are used in Loakes et al. (2022), but in that paper, intervocalic /t/ was also analyzed, and so extra categories relevant to the CVC context (tap, voiced, approximant) are listed there.

References

  1. Australian Bureau of Statistics. (2021). Aboriginal and/or Torres Strait Islander people—2021 Census QuickStats. ABS Website. Available online: https://www.abs.gov.au/census/find-census-data/quickstats/2021/IQSAUS (accessed on 30 March 2026).
  2. Australian Bureau of Statistics. (2022a). Mildura (Vic.)—2021 Census QuickStats. ABS Website. Available online: https://www.abs.gov.au/census/find-census-data/quickstats/2021/LGA24780 (accessed on 30 March 2026).
  3. Australian Bureau of Statistics. (2022b). Warrnambool (Vic.)—2021 Census QuickStats. ABS Website. Available online: https://www.abs.gov.au/census/find-census-data/quickstats/2021/LGA26730 (accessed on 30 March 2026).
  4. Blackwell, L., & McDougall, K. (2024). Sociophonetic variation of filled pauses in Victoria, Australia. In O. Maxwell, & R. Bundgaard-Nielsen (Eds.), Proceedings of the 19th Australasian international conference on speech science and technology, ASSTA, Melbourne, Australia, December 3–5 (pp. 227–231). ASSTA. [Google Scholar]
  5. Boersma, P., & Weenink, D. (2025). Praat: Doing phonetics by computer (Version 6.4.32) [Computer program]. Available online: https://praat.org (accessed on 22 May 2025).
  6. Butcher, A. (2008). Linguistic aspects of Australian Aboriginal English. Clinical Linguistics & Phonetics, 22(8), 625–642. [Google Scholar] [CrossRef] [Scilit]
  7. Butcher, A., & Anderson, V. (2008). The vowels of Australian Aboriginal English. In J. Fletcher, D. Loakes, R. Göcke, D. Burnham, & M. Wagner (Eds.), Proceedings of interspeech 2008 incorporating SST 2008, ISCA, Brisbane, Australia, September 22–26 (pp. 347–350). ISCA. [Google Scholar]
  8. Bürkner, P. C. (2017). brms: An R package for Bayesian multilevel models using Stan. Journal of Statistical Software, 80(1), 1–28. [Google Scholar] [CrossRef] [Scilit]
  9. Clopper, C., & Walker, A. (2017). Effects of lexical competition and dialect exposure on phonological priming. Language and Speech, 60(1), 85–109. [Google Scholar] [CrossRef] [Scilit]
  10. Cox, F., & Fletcher, J. (2017). Australian English: Pronunciation and transcription (2nd ed.). Cambridge University Press. [Google Scholar]
  11. Cox, F., & Palethorpe, S. (2007). Australian English. Journal of the International Phonetic Association, 37(3), 341–350. [Google Scholar] [CrossRef] [Scilit]
  12. Cox, F., Penney, J., & Palethorpe, S. (2024). Australian English monophthong change across 50 years: Static versus dynamic measures. Languages, 9(3), 99. [Google Scholar] [CrossRef] [Scilit]
  13. Dickson, G. (2020). Aboriginal English(es). In L. Willoughby, & H. Manns (Eds.), Australian English reimagined: Structure, features and developments (pp. 134–154). Routledge. [Google Scholar]
  14. Diskin-Holdaway, C., Li, W., & Escudero, P. (2024). Bilingual preschoolers’ phonetic variation keeps up with monolingual peers: The case of voiceless plosives in Australian English. In O. Maxwell, & R. Bundgaard-Nielsen (Eds.), Proceedings of the 19th Australasian international conference on speech science and technology, ASSTA, Melbourne, Australia, December 3–5 (pp. 107–111). ASSTA. [Google Scholar]
  15. Docherty, G., Foulkes, P., González, S., & Mitchell, N. (2018). Missed connections at the junction of sociolinguistics and speech processing. Topics in Cognitive Science, 10, 1–16. [Google Scholar] [CrossRef] [Scilit] [PubMed]
  16. Ford, C. (2018). Acquisition of gender-specific sociophonetic cues in the speech of primary school-aged children [Ph.D. thesis, La Trobe University]. [Google Scholar]
  17. Foulkes, P., & Docherty, G. J. (2006). The social life of phonetics and phonology. Journal of Phonetics, 34(4), 409–438. [Google Scholar] [CrossRef] [Scilit]
  18. Foulkes, P., Docherty, G. J., & Jones, M. J. (2010). Analysing stops. In M. di Paolo, & M. Yaeger-Dror (Eds.), Sociophonetics: A student’s guide (pp. 58–71). Routledge. [Google Scholar]
  19. Foulkes, P., Docherty, G. J., & Watt, D. (2005). Phonological variation in child-directed speech. Language, 81(1), 177–206. [Google Scholar] [CrossRef] [Scilit]
  20. Fritche, R., Shattuck-Hufnagel, S., & Song, J. Y. (2021). Do adults produce phonetic variants of /t/ less often in speech to children? Journal of Phonetics, 87, 101056. [Google Scholar] [CrossRef] [Scilit]
  21. Garellek, M. (2022). Theoretical achievements of phonetics in the 21st century: Phonetics of voice quality. Journal of Phonetics, 94, 101155. [Google Scholar] [CrossRef] [Scilit]
  22. Gelman, A., Carlin, J. B., Stern, H. S., Dunson, D. B., Vehtari, A., & Rubin, D. B. (2014). Bayesian data analysis (3rd ed.). CRC Press. [Google Scholar]
  23. Harkins, J. (2000). Structure and meaning in Australian Aboriginal English. Asian Englishes, 3(2), 60–81. [Google Scholar] [CrossRef] [Scilit]
  24. Haslerud, V. C. D. (1995). The variable (t) in Sydney adolescent speech [Ph.D. thesis, University of Bergen]. [Google Scholar]
  25. Horvath, B. M. (1985). Variation in Australian English: The sociolects of Sydney. Cambridge University Press. [Google Scholar]
  26. Ingram, J. C. L. (1989). Connected speech processes in Australian English. Australian Journal of Linguistics, 9, 21–49. [Google Scholar] [CrossRef] [Scilit]
  27. Jespersen, A. (2016). A first look at declarative rises as markers of ethnicity in Sydney. In J. Barnes, A. Brugos, S. Shattuck-Hufnagel, & N. Veilleux (Eds.), Proceedings of speech prosody 2016, ISCA, Boston, MA, USA, May 31–June 3 (pp. 143–147). ISCA. [Google Scholar]
  28. Jones, M. J., & McDougall, K. (2009). The acoustic character of fricated /t/ in Australian English: A comparison with /s/ and /ʃ/. Journal of the International Phonetic Association, 39(3), 265–285. [Google Scholar] [CrossRef] [Scilit]
  29. Keating, P., & Esposito, C. (2007). Linguistic voice quality. UCLA Working Papers in Phonetics, 105, 85–91. [Google Scholar]
  30. Ladefoged, P., & Johnson, K. (2015). A course in phonetics (7th ed.). Cengage Learning. [Google Scholar]
  31. Leitner, G. (2004). Australia’s many voices: Australian English—The national language. Mouton de Gruyter. [Google Scholar]
  32. Loakes, D., Fletcher, J., & Clothier, J. (2024). One place, two speech communities: Differing responses to sound change in Mainstream and Aboriginal Australian English in a small rural town. In F. Kleber, & T. Rathcke (Eds.), Speech dynamics: Synchronic variation and diachronic change (pp. 117–144). Chapter 4. De Gruyter Mouton. [Google Scholar]
  33. Loakes, D., & Gregory, A. (2022). Voice quality in Australian English. JASA Express Letters, 2, 085201. [Google Scholar] [CrossRef] [Scilit] [PubMed]
  34. Loakes, D., & Gregory, A. (2024). Acoustic analysis of vowels in Australian Aboriginal English spoken in Victoria. Languages, 9(9), 299. [Google Scholar] [CrossRef] [Scilit]
  35. Loakes, D., & McDougall, K. (2010). Individual variation in the frication of voiceless plosives: A study of Australian English speaking twins. Australian Journal of Linguistics, 30(2), 155–181. [Google Scholar] [CrossRef] [Scilit]
  36. Loakes, D., McDougall, K., Clothier, J., Hajek, J., & Fletcher, J. (2018). Sociophonetic variability of post-vocalic /t/ in Aboriginal and mainstream Australian English. In J. Epps, J. Wolfe, J. Smith, & C. Jones (Eds.), Proceedings of the 17th Australasian international conference on speech science and technology, ASSTA, Sydney, Australia, December 4–7 (pp. 5–8). ASSTA. [Google Scholar]
  37. Loakes, D., McDougall, K., & Gregory, A. (2022). Variation in /t/ in Aboriginal and Mainstream Australian Englishes. In R. Billington (Ed.), Proceedings of the 18th Australasian international conference on speech science and technology, ASSTA, Canberra, Australia, December 13–16 (pp. 61–65). ASSTA. [Google Scholar]
  38. Mailhammer, R. (2021). English on Croker Island: The synchronic and diachronic dynamics of contact and variation. De Gruyter Mouton. [Google Scholar]
  39. Mailhammer, R., Sherwood, S., & Stoakes, H. (2020). The inconspicuous substratum: Indigenous Australian languages and the phonetics of stop contrasts in English on Croker Island. English World-Wide, 41(2), 162–192. [Google Scholar] [CrossRef] [Scilit]
  40. Malcolm, I. (2008). Australian creoles and Aboriginal English: Phonetics and phonology. In K. Burridge, & B. Kortmann (Eds.), Varieties of English 3: The Pacific and Australasia (pp. 124–141). De Gruyter Mouton. [Google Scholar]
  41. Malcolm, I. (2018). Australian Aboriginal English: Change and continuity in an adopted language. Cambridge University Press. [Google Scholar]
  42. McDougall, K., Paver, A., Duckworth, M., Blackwell, L., & Loakes, D. (2024). Patterns of silent pausing in Aboriginal and Mainstream Australian Englishes spoken in Warrnambool. In O. Maxwell, & N. Bundgaard-Nielsen (Eds.), Proceedings of the 19th Australasian international conference on speech science and technology, ASSTA, Melbourne, Australia, December 3–5 (pp. 222–226). ASSTA. [Google Scholar]
  43. McElreath, R. (2020). Statistical rethinking: A Bayesian course with examples in R and Stan (2nd ed.). CRC Press. [Google Scholar]
  44. Mitchell, A. G., & Delbridge, A. (1965). The speech of Australian adolescents: A survey. Angus & Robertson. [Google Scholar]
  45. Penney, J., Cox, F., Miles, K., & Palethorpe, S. (2018). Glottalisation as a cue to coda consonant voicing in Australian English. Journal of Phonetics, 66, 161–184. [Google Scholar] [CrossRef] [Scilit]
  46. Penney, J., Cox, F., & Szakay, A. (2020). Glottalisation, coda voicing, and phrase position in Australian English. The Journal of the Acoustical Society of America, 148(5), 3232–3245. [Google Scholar] [CrossRef] [Scilit]
  47. Penney, J., Cox, F., & Szakay, A. (2021). Glottalisation of word-final stops in Australian English unstressed syllables. Journal of the International Phonetic Association, 51(2), 229–260. [Google Scholar] [CrossRef] [Scilit]
  48. Penney, J., Ratko, L., & Cox, F. (2025). Electroglottographic analysis of coda voicelessness in Australian English. Journal of the Acoustical Society of America, 158(2), 1268–1282. [Google Scholar] [CrossRef] [Scilit]
  49. Penney, J., Weirich, M., & Jannedy, S. (2024). Increased breathiness in adolescent Kiezdeutsch speakers: A marker of multiethnolectal group affiliation? Language and Speech. Online first. [Google Scholar] [CrossRef] [Scilit] [PubMed]
  50. Podevsa, R., & Kajino, S. (2014). Sociophonetics, gender, and sexuality. In S. Ehrlich, M. Meyerhoff, & J. Holmes (Eds.), The handbook of language, gender and sexuality (pp. 103–122). Wiley. [Google Scholar]
  51. Powell-Davies, T., & Billington, R. (2024). Realisation of intervocalic /t/ in Australian English: A snapshot. In O. Maxwell, & R. Bundgaard-Nielsen (Eds.), Proceedings of the 19th Australasian international conference on speech science and technology, ASSTA, Melbourne, Australia, December 3–5 (pp. 212–216). ASSTA. [Google Scholar]
  52. Ratko, L., Penney, J., & Cox, F. (2023, August 20–24). Opening or closing? An electroglottographic analysis of voiceless coda consonants in Australian English. Proceedings of Interspeech 2023, ISCA (pp. 1823–1827), Dublin, Ireland. [Google Scholar]
  53. Rodríguez Louro, C., & Collard, G. (2024). The Yarning Corpus: Aboriginal English in southwest Western Australia. Australian Journal of Linguistics, 44(2–3), 146–162. [Google Scholar] [CrossRef] [Scilit]
  54. Schiel, F., Draxler, C., & Harrington, J. (2011, January 29–31). Phonemic segmentation and labelling using the MAUS technique. Workshop on New Tools and Methods for Very-Large-Scale Phonetics Research (pp. 28–31), Philadelphia, PA, USA. [Google Scholar]
  55. Shea, T., Gibson, A., Szakay, A., & Cox, F. (2023). Australian English speakers’ attitudes to fricated coda /t/. Australian Journal of Linguistics, 43(1), 87–119. [Google Scholar] [CrossRef] [Scilit]
  56. Stanley, R., & Loakes, D. (2025). A description of Hobart English monophthongs: Vowel and voice quality. Languages, 10(12), 297. [Google Scholar] [CrossRef] [Scilit]
  57. Tait, C., & Tabain, M. (2016). Patterns of gender variation in the speech of primary school-aged children in Australian English: The case of /p t k/. In C. Carignan, & M. D. Tyler (Eds.), Proceedings of the 16th Australasian international conference on speech science and technology, ASSTA, Paramatta, Australia, December 6–9 (pp. 65–68). ASSTA. [Google Scholar]
  58. Tollfree, L. (1996). Modelling phonological variation and change: Evidence from English consonants [Ph.D. thesis, University of Cambridge]. [Google Scholar]
  59. Tollfree, L. (2001). Variation and change in Australian English consonants: Reduction of /t/. In D. D. Blair, & P. Collins (Eds.), English in Australia (pp. 45–67). John Benjamins. [Google Scholar]
  60. Wang, Y., O’Shannessy, C., Davis, V., Bundgaard-Nielsen, R., Roberts, J., & Foster, D. (2024). Production and perception of stop voicing in Central Australian Aboriginal English: A cross-generational study. Australian Journal of Linguistics, 44(1), 69–98. [Google Scholar] [CrossRef] [Scilit]
  61. Wells, J. C. (1982). Accents of English. Cambridge University Press. [Google Scholar]
  62. White, H., Penney, J., & Cox, F. (2025, August 17–22). Variability in intervocalic /t/ and community diversity in Australian English. Proceedings of Interspeech 2025, ISCA (pp. 121–125), Rotterdam, The Netherlands. [Google Scholar]
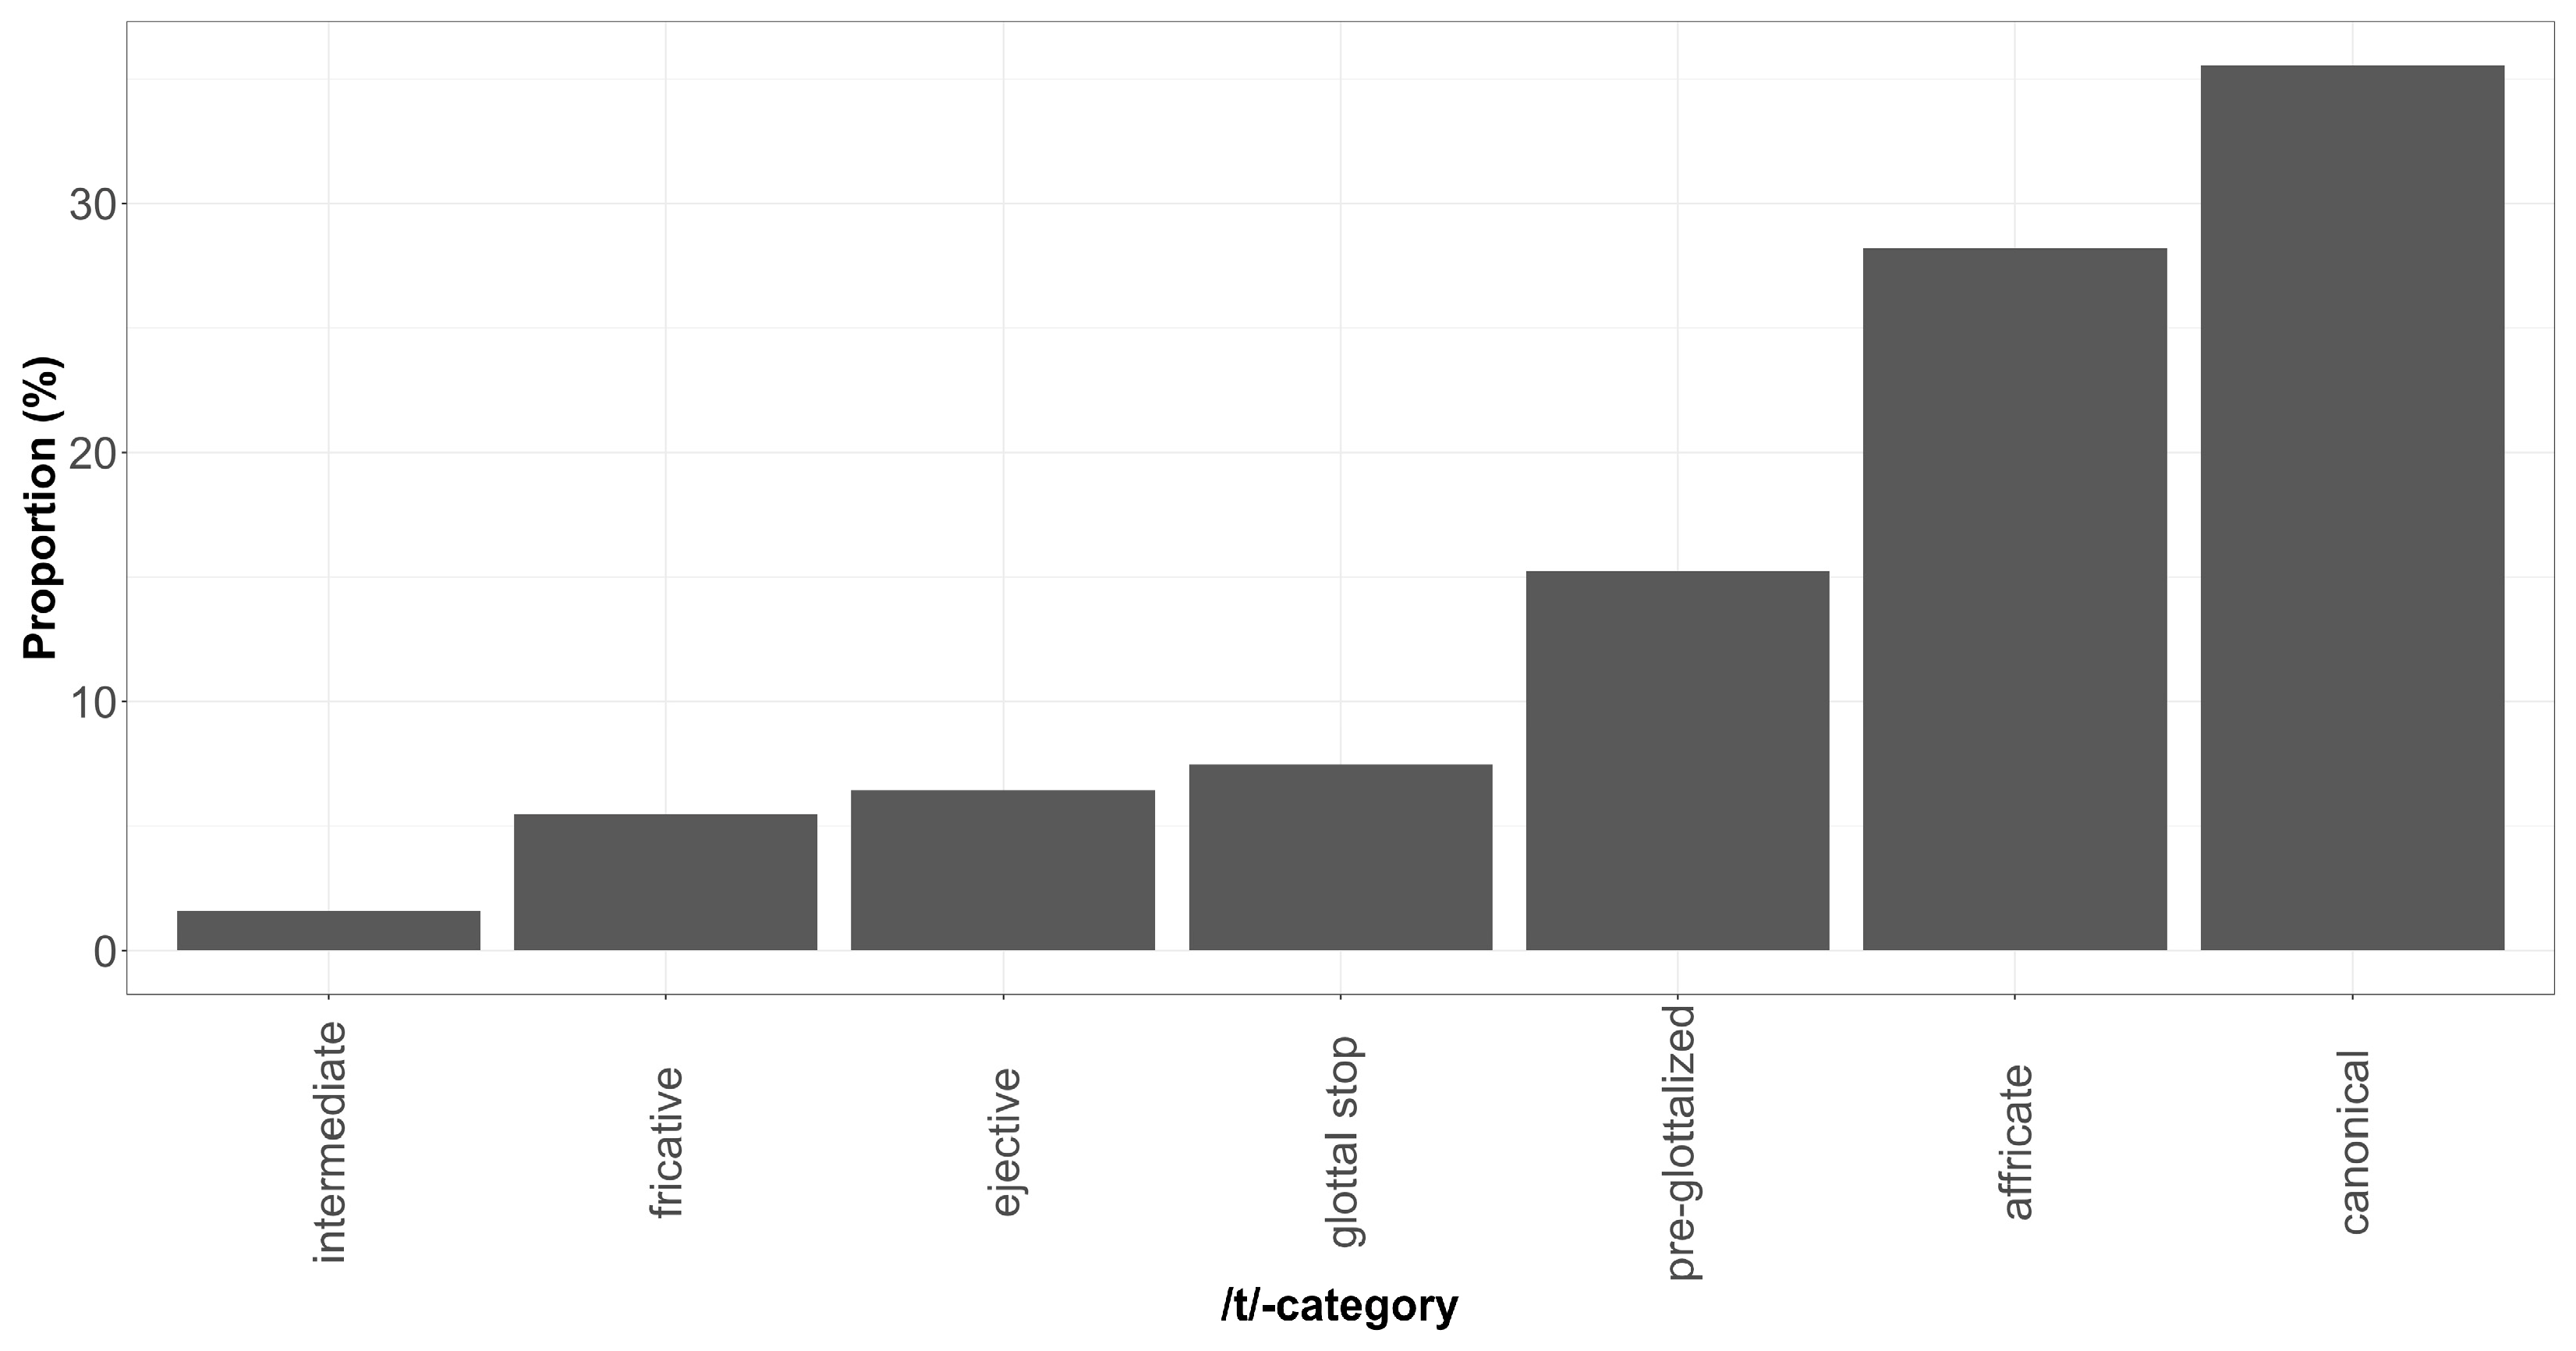
Disclaimer/Publisher’s Note: The statements, opinions and data contained in all publications are solely those of the individual author(s) and contributor(s) and not of MDPI and/or the editor(s). MDPI and/or the editor(s) disclaim responsibility for any injury to people or property resulting from any ideas, methods, instructions or products referred to in the content.

Article Metrics

Citations

Article Access Statistics

Multiple requests from the same IP address are counted as one view.