5.1. Mathematical Model and Parameter Settings of Optimization
In this section, the NACA6415 airfoil is selected as the baseline airfoil. The rationale for this selection is based on validation feasibility and geometric applicability.
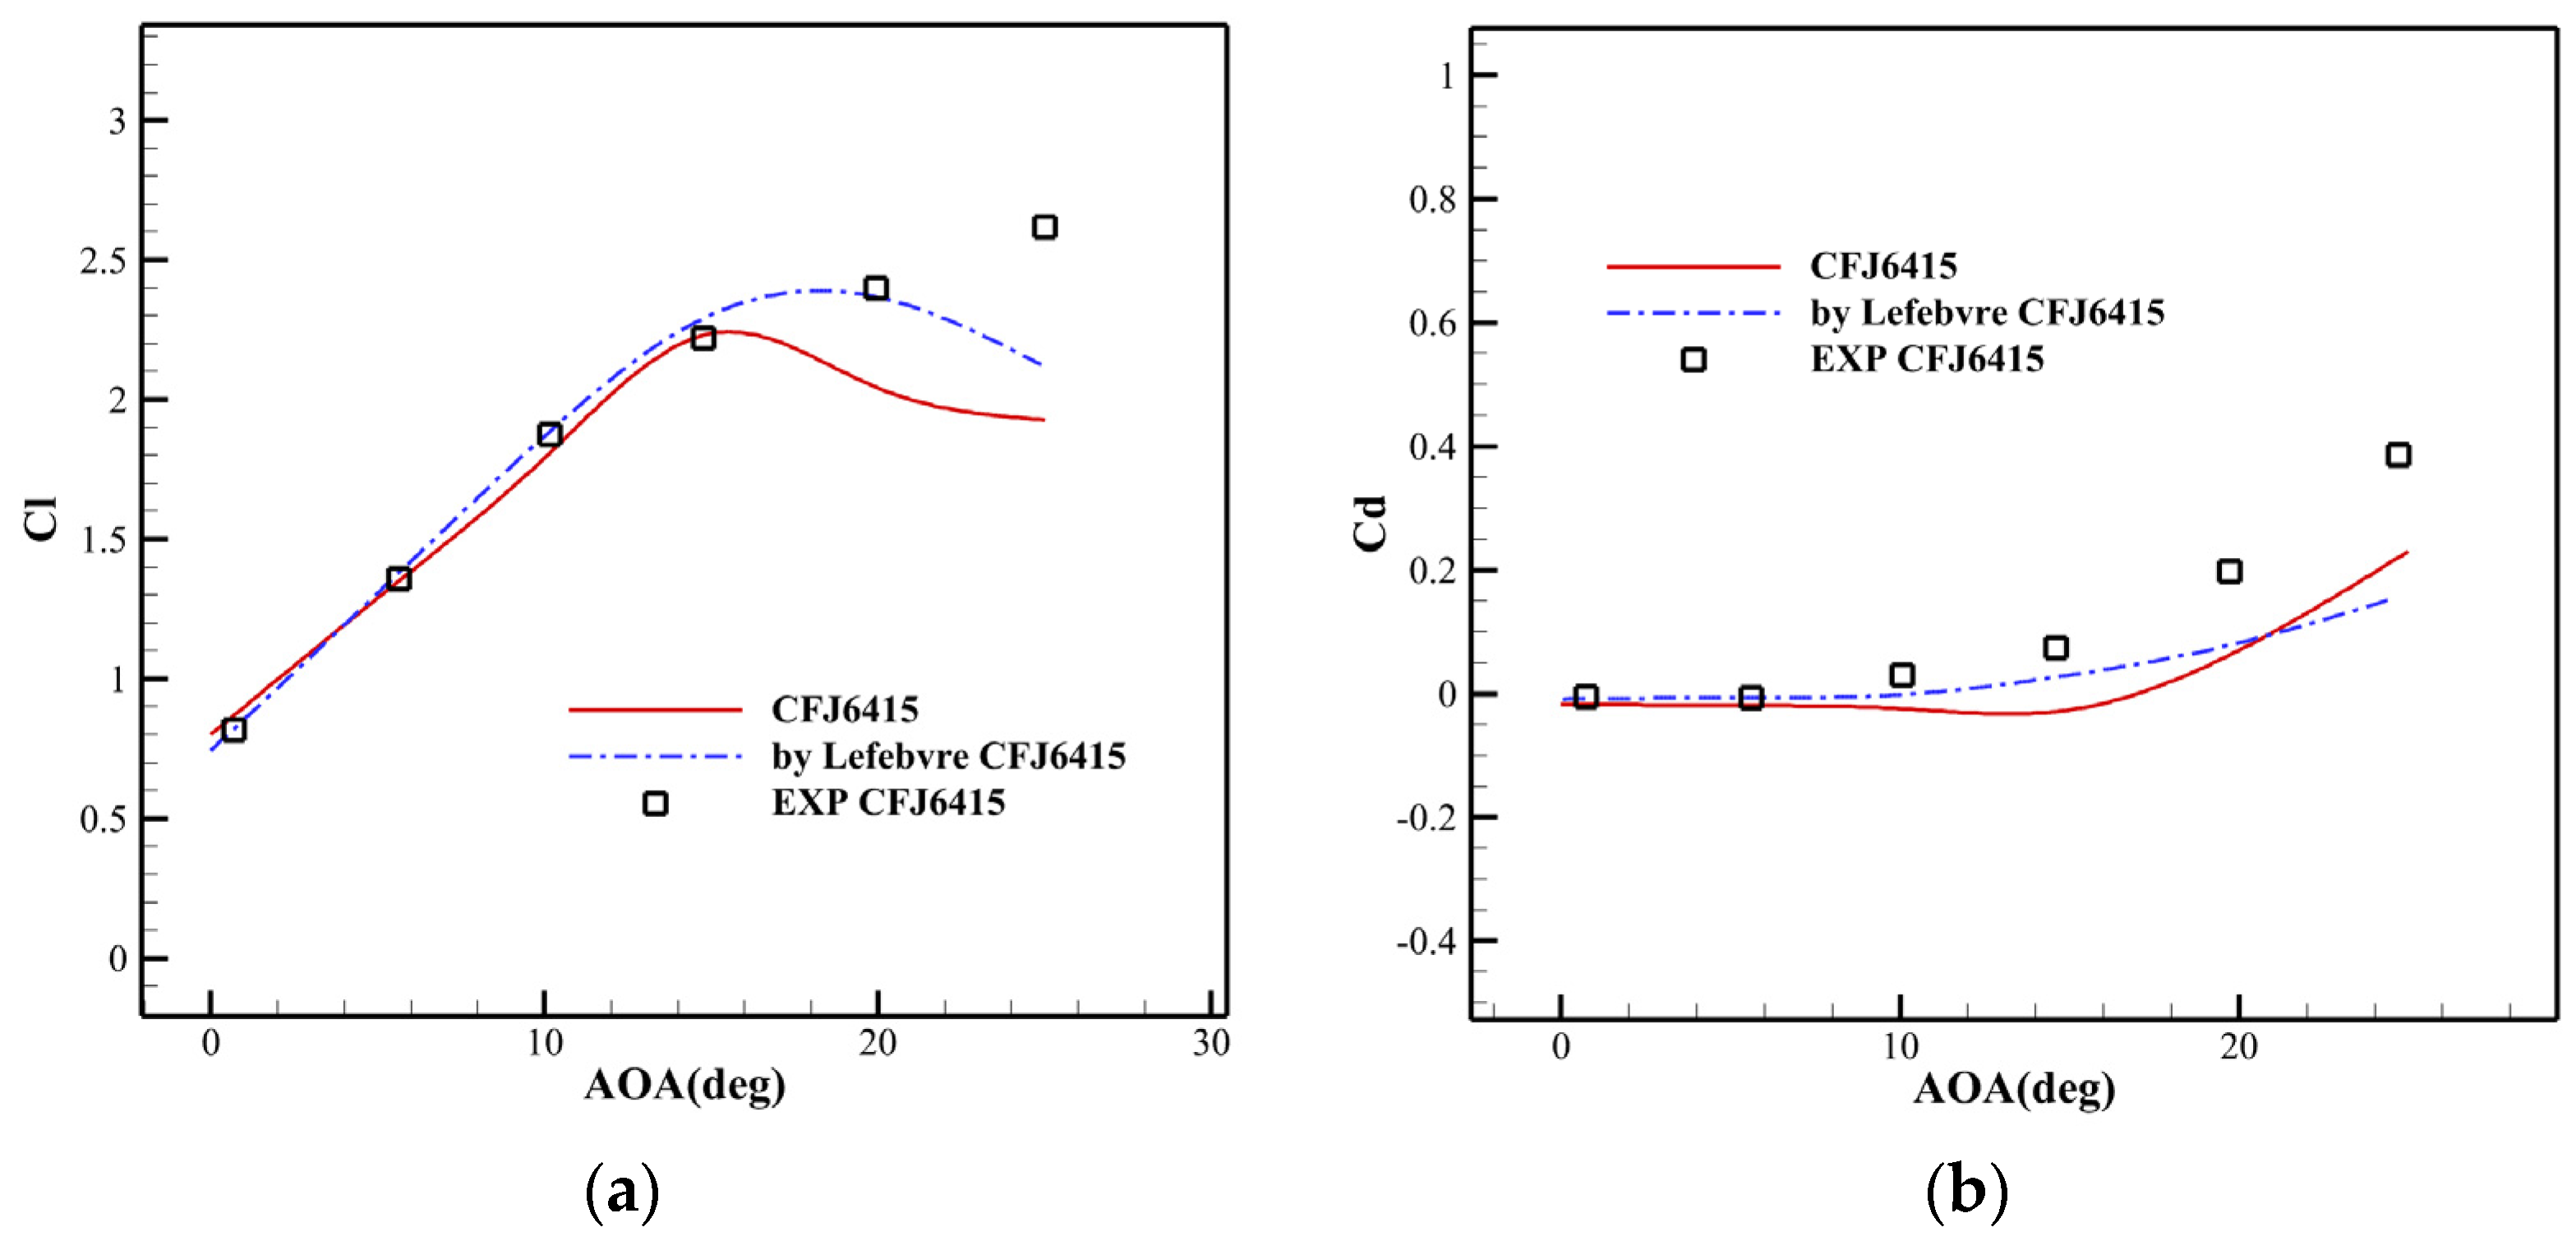
First, the NACA6415-based CFJ configuration has been widely investigated in previous studies, ranging from wind-tunnel experiments using discrete jets [
36] and numerical validations against experimental data [
24], to three-dimensional wing studies [
46] and comparisons between open-slot and discrete configurations [
47]. The availability of these complementary experimental and numerical datasets provides a reliable basis for the quantitative validation of the present numerical method, ensuring the comparability and reproducibility of the optimization results.
Second, regarding geometric applicability, the NACA6415 airfoil possesses a relative thickness of 15%. This thickness offers sufficient geometric space to integrate the CFJ injection and suction slots, as well as the internal recirculation passages, while avoiding the aerodynamic penalties associated with unusually thick reference profiles [
46].
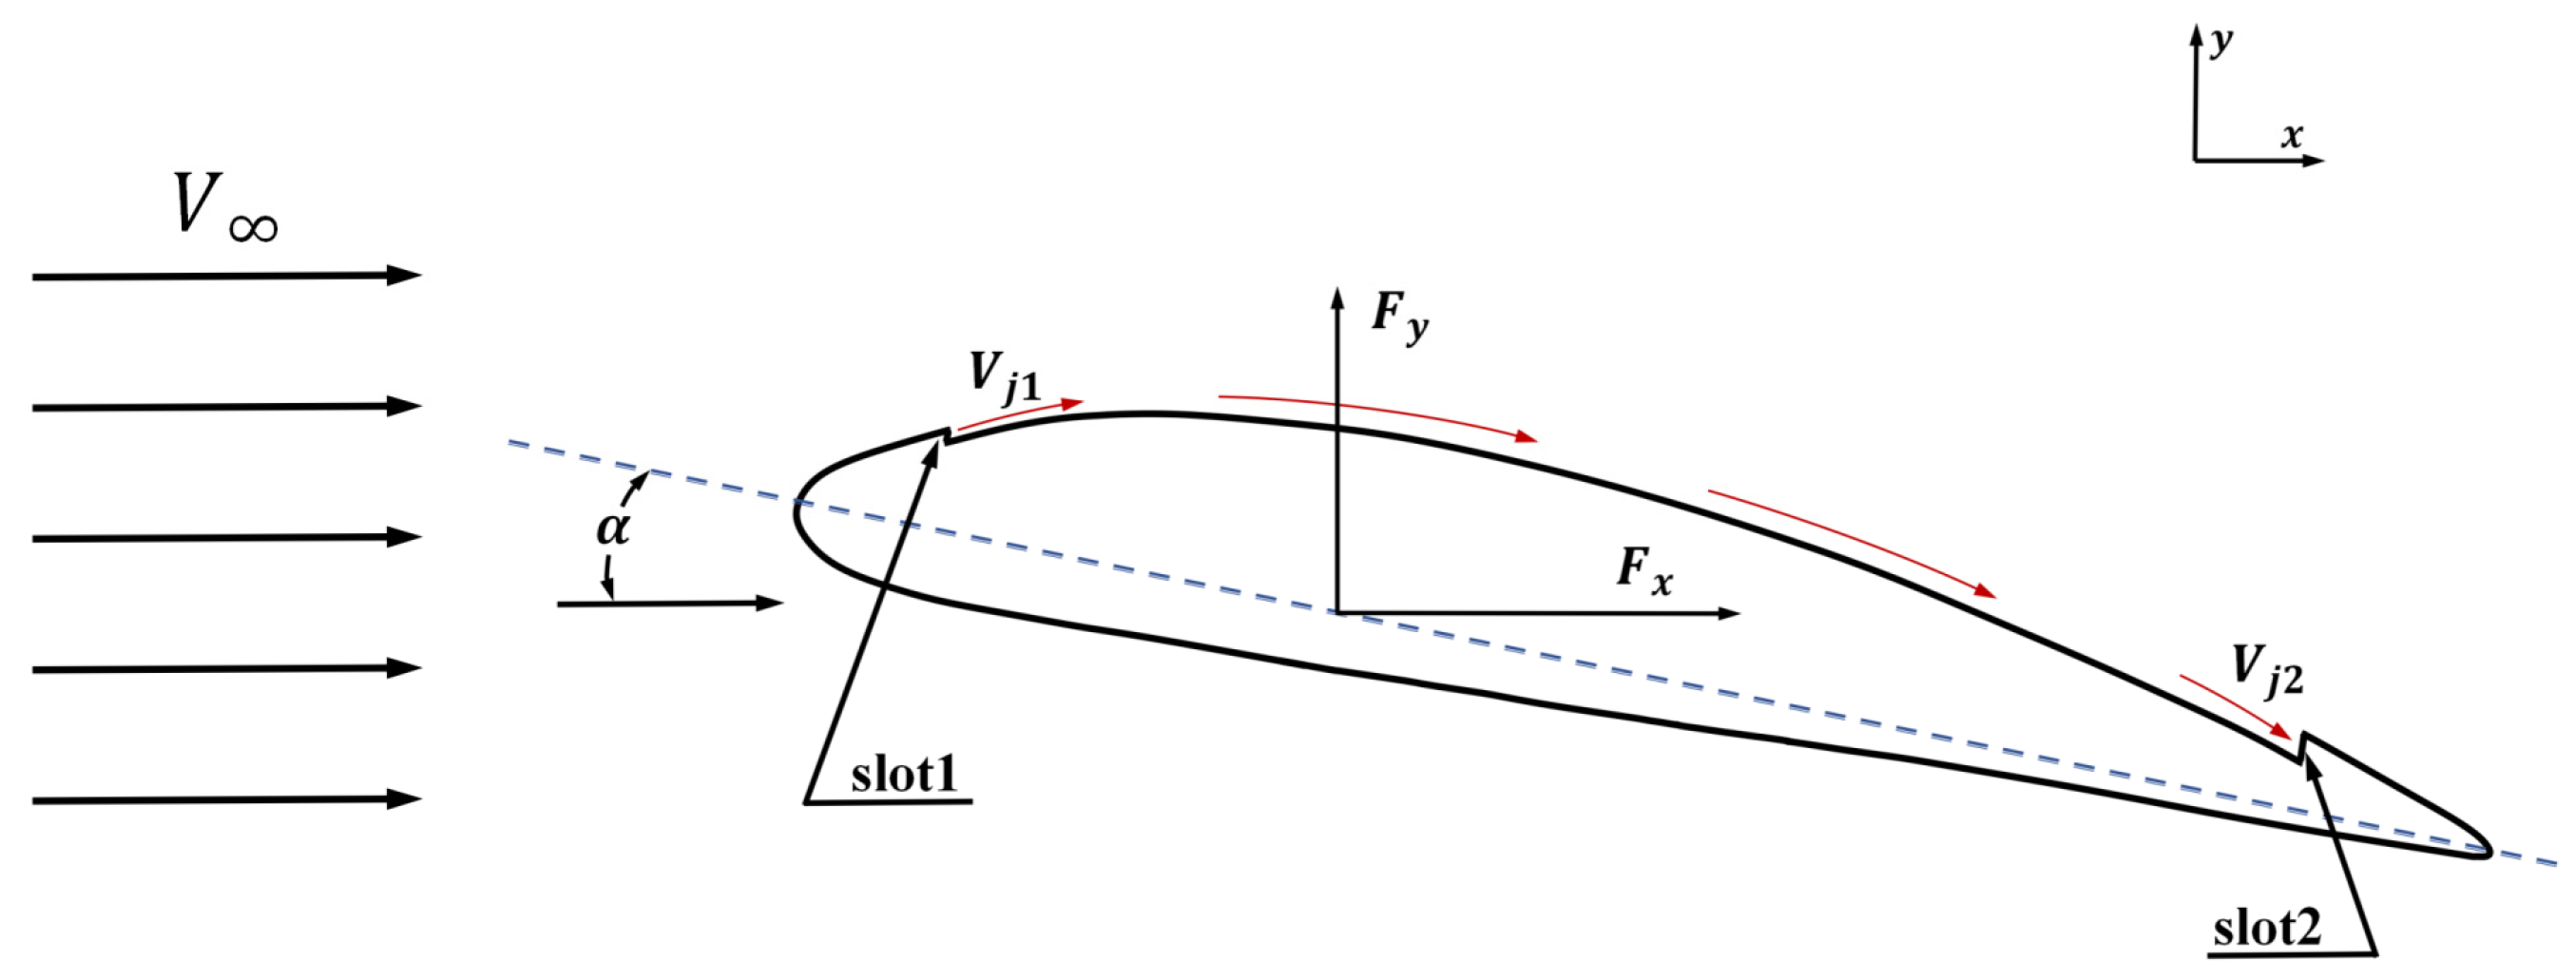
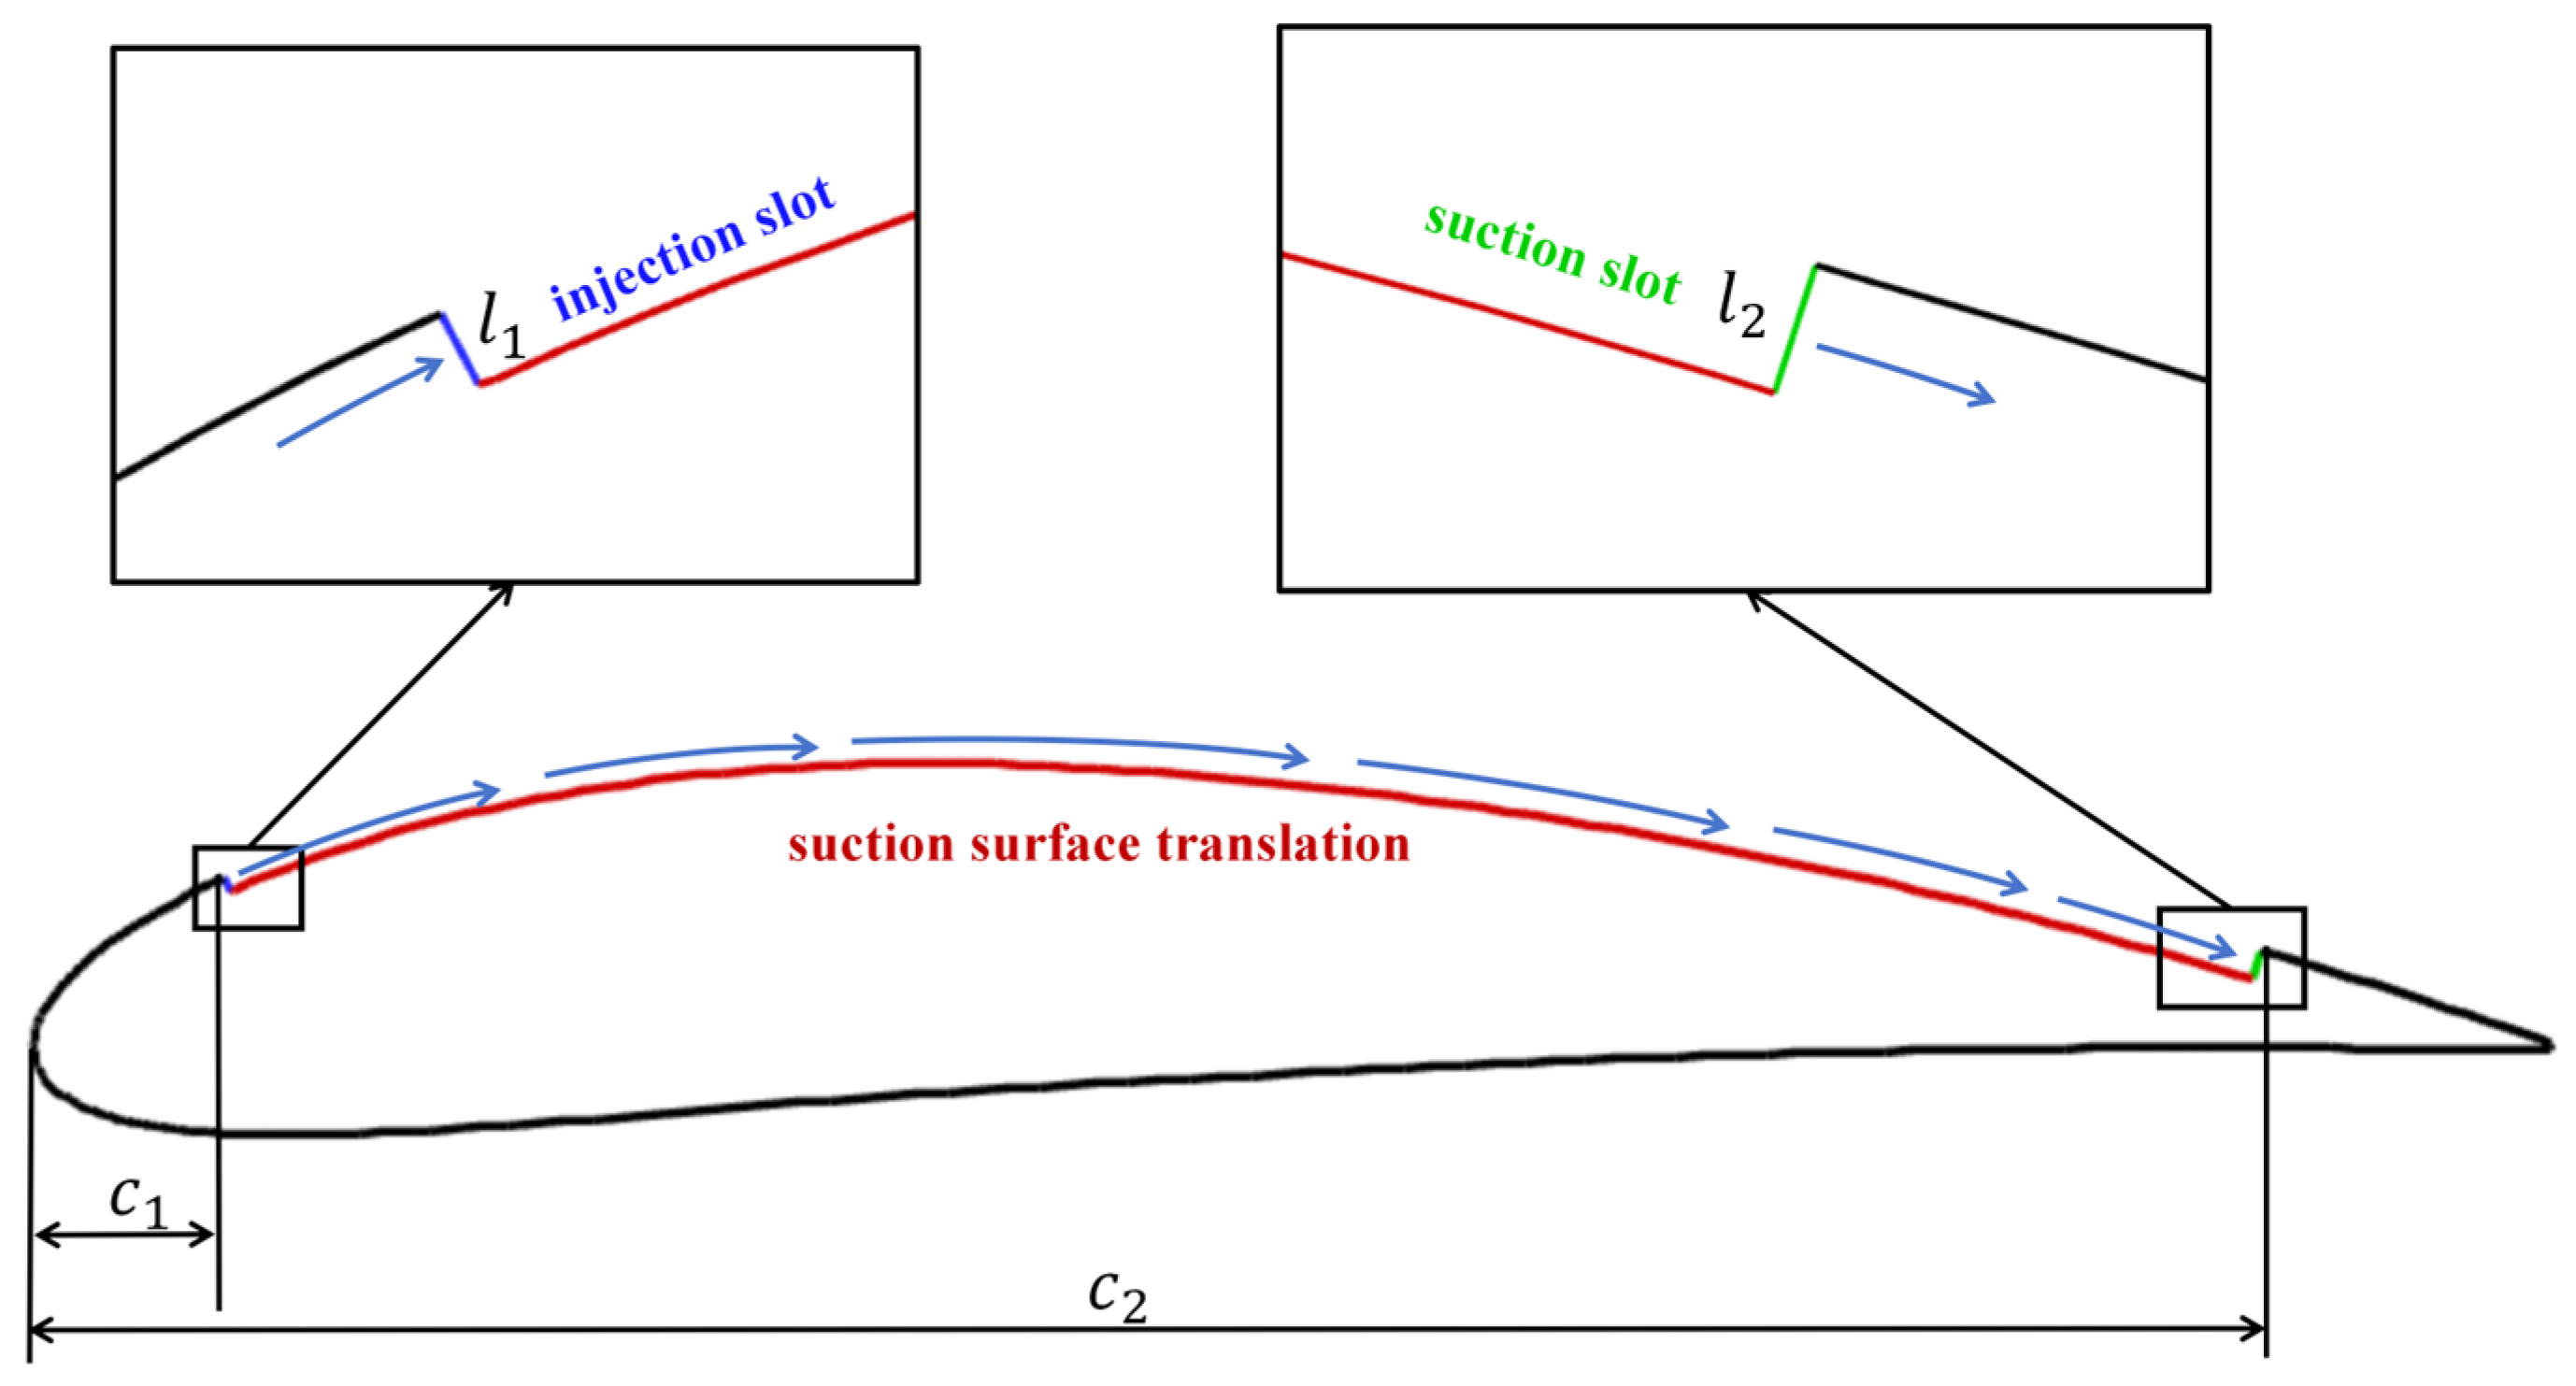
Following the integrated parametrization method described in
Section 4.1, a baseline CFJ airfoil is constructed with a reference chord length
of 0.3048 m. The specific geometric parameters for this baseline CFJ airfoil are summarized in
Table 3. This configuration is designated as “CFJ-Baseline,” where the NACA6415 profile serves as the foundational geometry from which the CFJ-Baseline is derived. Based on this configuration, optimization research for the Co-Flow Jet airfoil is conducted using the integrated parametrization method.
The NACA6415 baseline airfoil is parameterized using an 8th-order CST method, yielding 18 CST parametrization variables. Building upon this, a comprehensive three-category design space is constructed by combining these CST variables with the specific CFJ geometric parameters and jet control parameters. The design operating conditions are summarized in
Table 4.
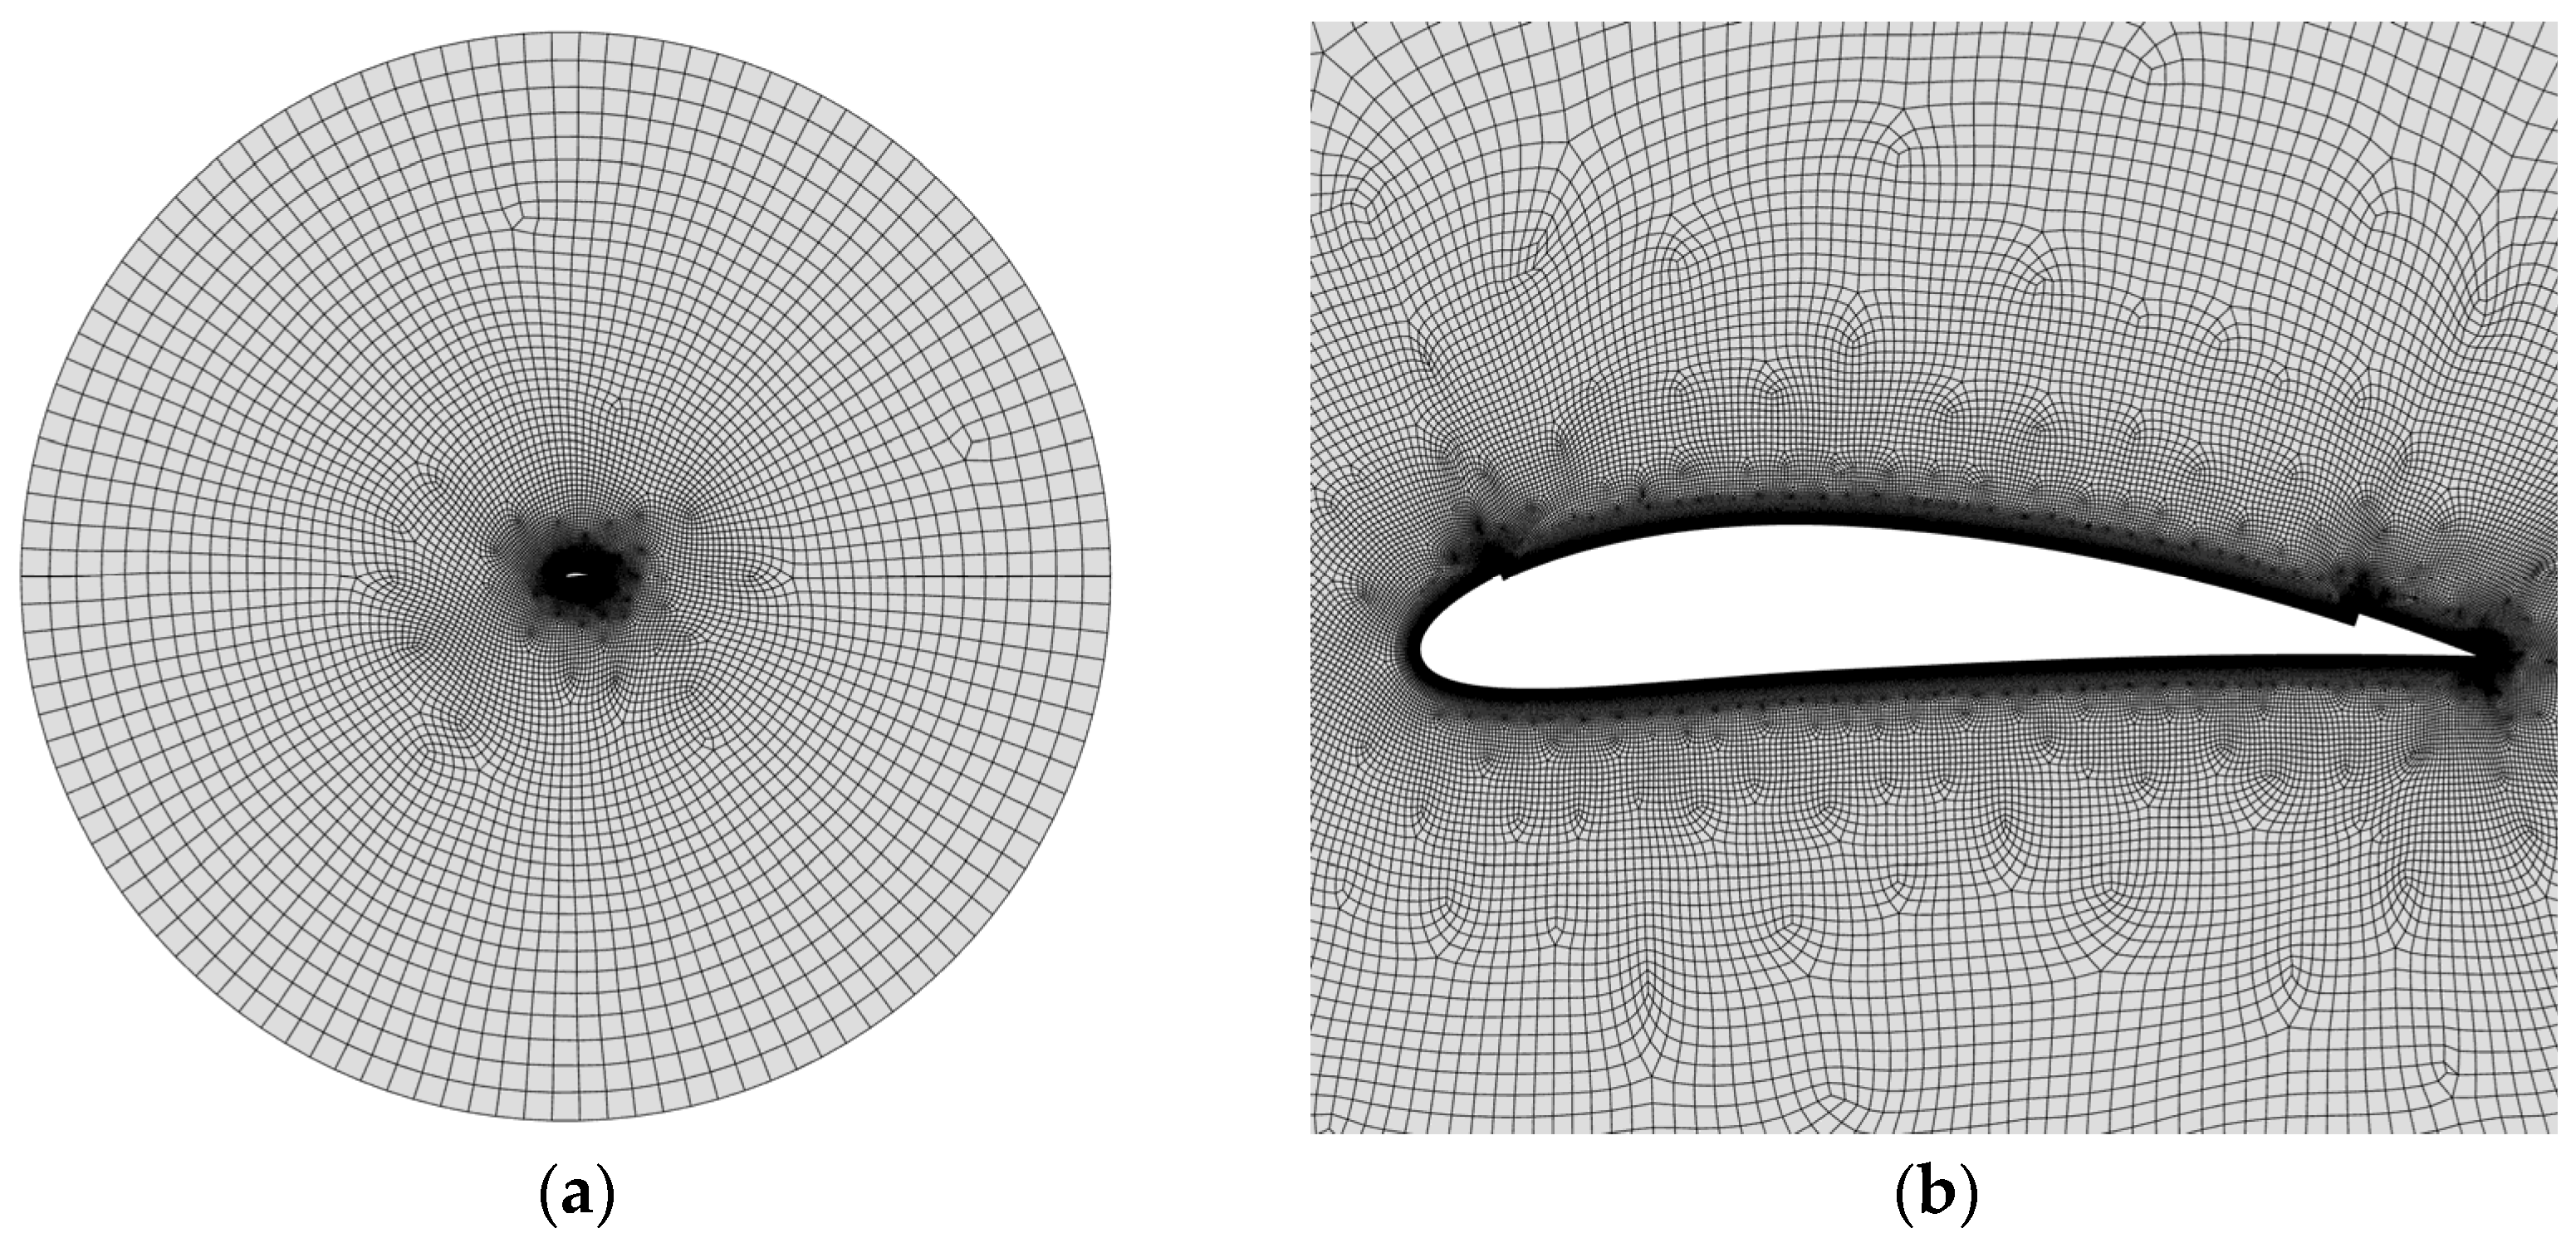
To quantify the mesh-induced discretization uncertainty under the design operating condition, a grid convergence study was conducted for the CFJ-Baseline configuration at Ma = 0.15, Re = 1.026 × 10
6, AOA = 5°, and a jet mass flow rate of 0.3596 kg/s. Three systematically refined meshes containing 56,411, 79,117, and 112,988 cells were examined. The Grid Convergence Index (GCI) procedure based on Richardson extrapolation, with a safety factor of 1.25, was employed to estimate the uncertainty associated with spatial discretization [
48].
As summarized in
Table 5, the asymptotic range check ratios
R for
Cl,
Cd, and
Pc are 1.0007, 1.0082, and 0.9912, respectively. All values satisfy 0.8 ≤
R ≤ 1.2, indicating that the three-grid solutions are within the asymptotic convergence range. The fine-grid GCI values are 0.0142% for
Cl, 0.2543% for
Cd, and 0.3925% for
Pc. Therefore, the mesh-induced discretization uncertainties of all key aerodynamic quantities are below 0.4%. Accordingly, the mesh containing 112,988 cells was adopted for all subsequent optimization simulations.
The design space for the present study is defined as follows:
Additionally, the CST parameterization variables are allowed to fluctuate within ±25% of their initial values, where
c represents the reference chord length (0.3048 m). This range is chosen based on empirical evidence and established studies. It provides a sufficient design space for optimization while preventing severe geometric distortions that could compromise CFD convergence [
49].
As indicated by Equations (8) and (9), the nominal jet momentum coefficient is influenced by the injection slot size. In the present study, the jet mass flow rate
is fixed at 0.3596 kg/s under the design operating condition. This value is derived from the CFJ-Baseline configuration by setting its nominal jet momentum coefficient to 0.12, which is a moderate value within the commonly used range of CFJ experimental and numerical studies [
25,
26,
36,
37].
During optimization, the jet mass flow rate is kept constant, while the injection slot size is allowed to vary within 0.4%
c ≤
l1 ≤ 0.65%
c. The upper bound of
l1 corresponds to the injection slot size of the CFJ-Baseline configuration. Since a larger injection slot would reduce the jet velocity and the nominal jet momentum coefficient under a fixed mass flow rate,
l1 is not allowed to exceed the baseline value. The lower bound of 0.4%
c allows a moderate increase in jet intensity while avoiding an excessively small injection slot. This setting is consistent with previous CFJ parameter studies, which showed that increasing the nominal jet momentum coefficient generally enhances lift, whereas excessive jet intensity may increase power consumption [
24,
25,
26].
Therefore, with the jet mass flow rate fixed at 0.3596 kg/s under the design operating condition, the design space for the nominal jet momentum coefficient
is derived as:
where
is the nominal jet momentum coefficient for the CFJ-Baseline airfoil under the design operating condition, calculated according to Equation (8). The factor 1.625 is obtained from the ratio between the baseline injection slot size and the minimum injection slot size, namely 0.65%
c/0.4%
c = 1.625.
The mathematical model for the multi-objective optimization problem is formulated as follows:
where
,
and
are the lift coefficients, drag coefficients and effective lift-to-drag ratio of the CFJ-Baseline airfoil under the design operating condition, respectively;
is the thickness of the NACA6415 airfoil used to construct the CFJ-Baseline; and
is the thickness of the underlying baseline airfoil corresponding to the CFJ configuration during the optimization process.
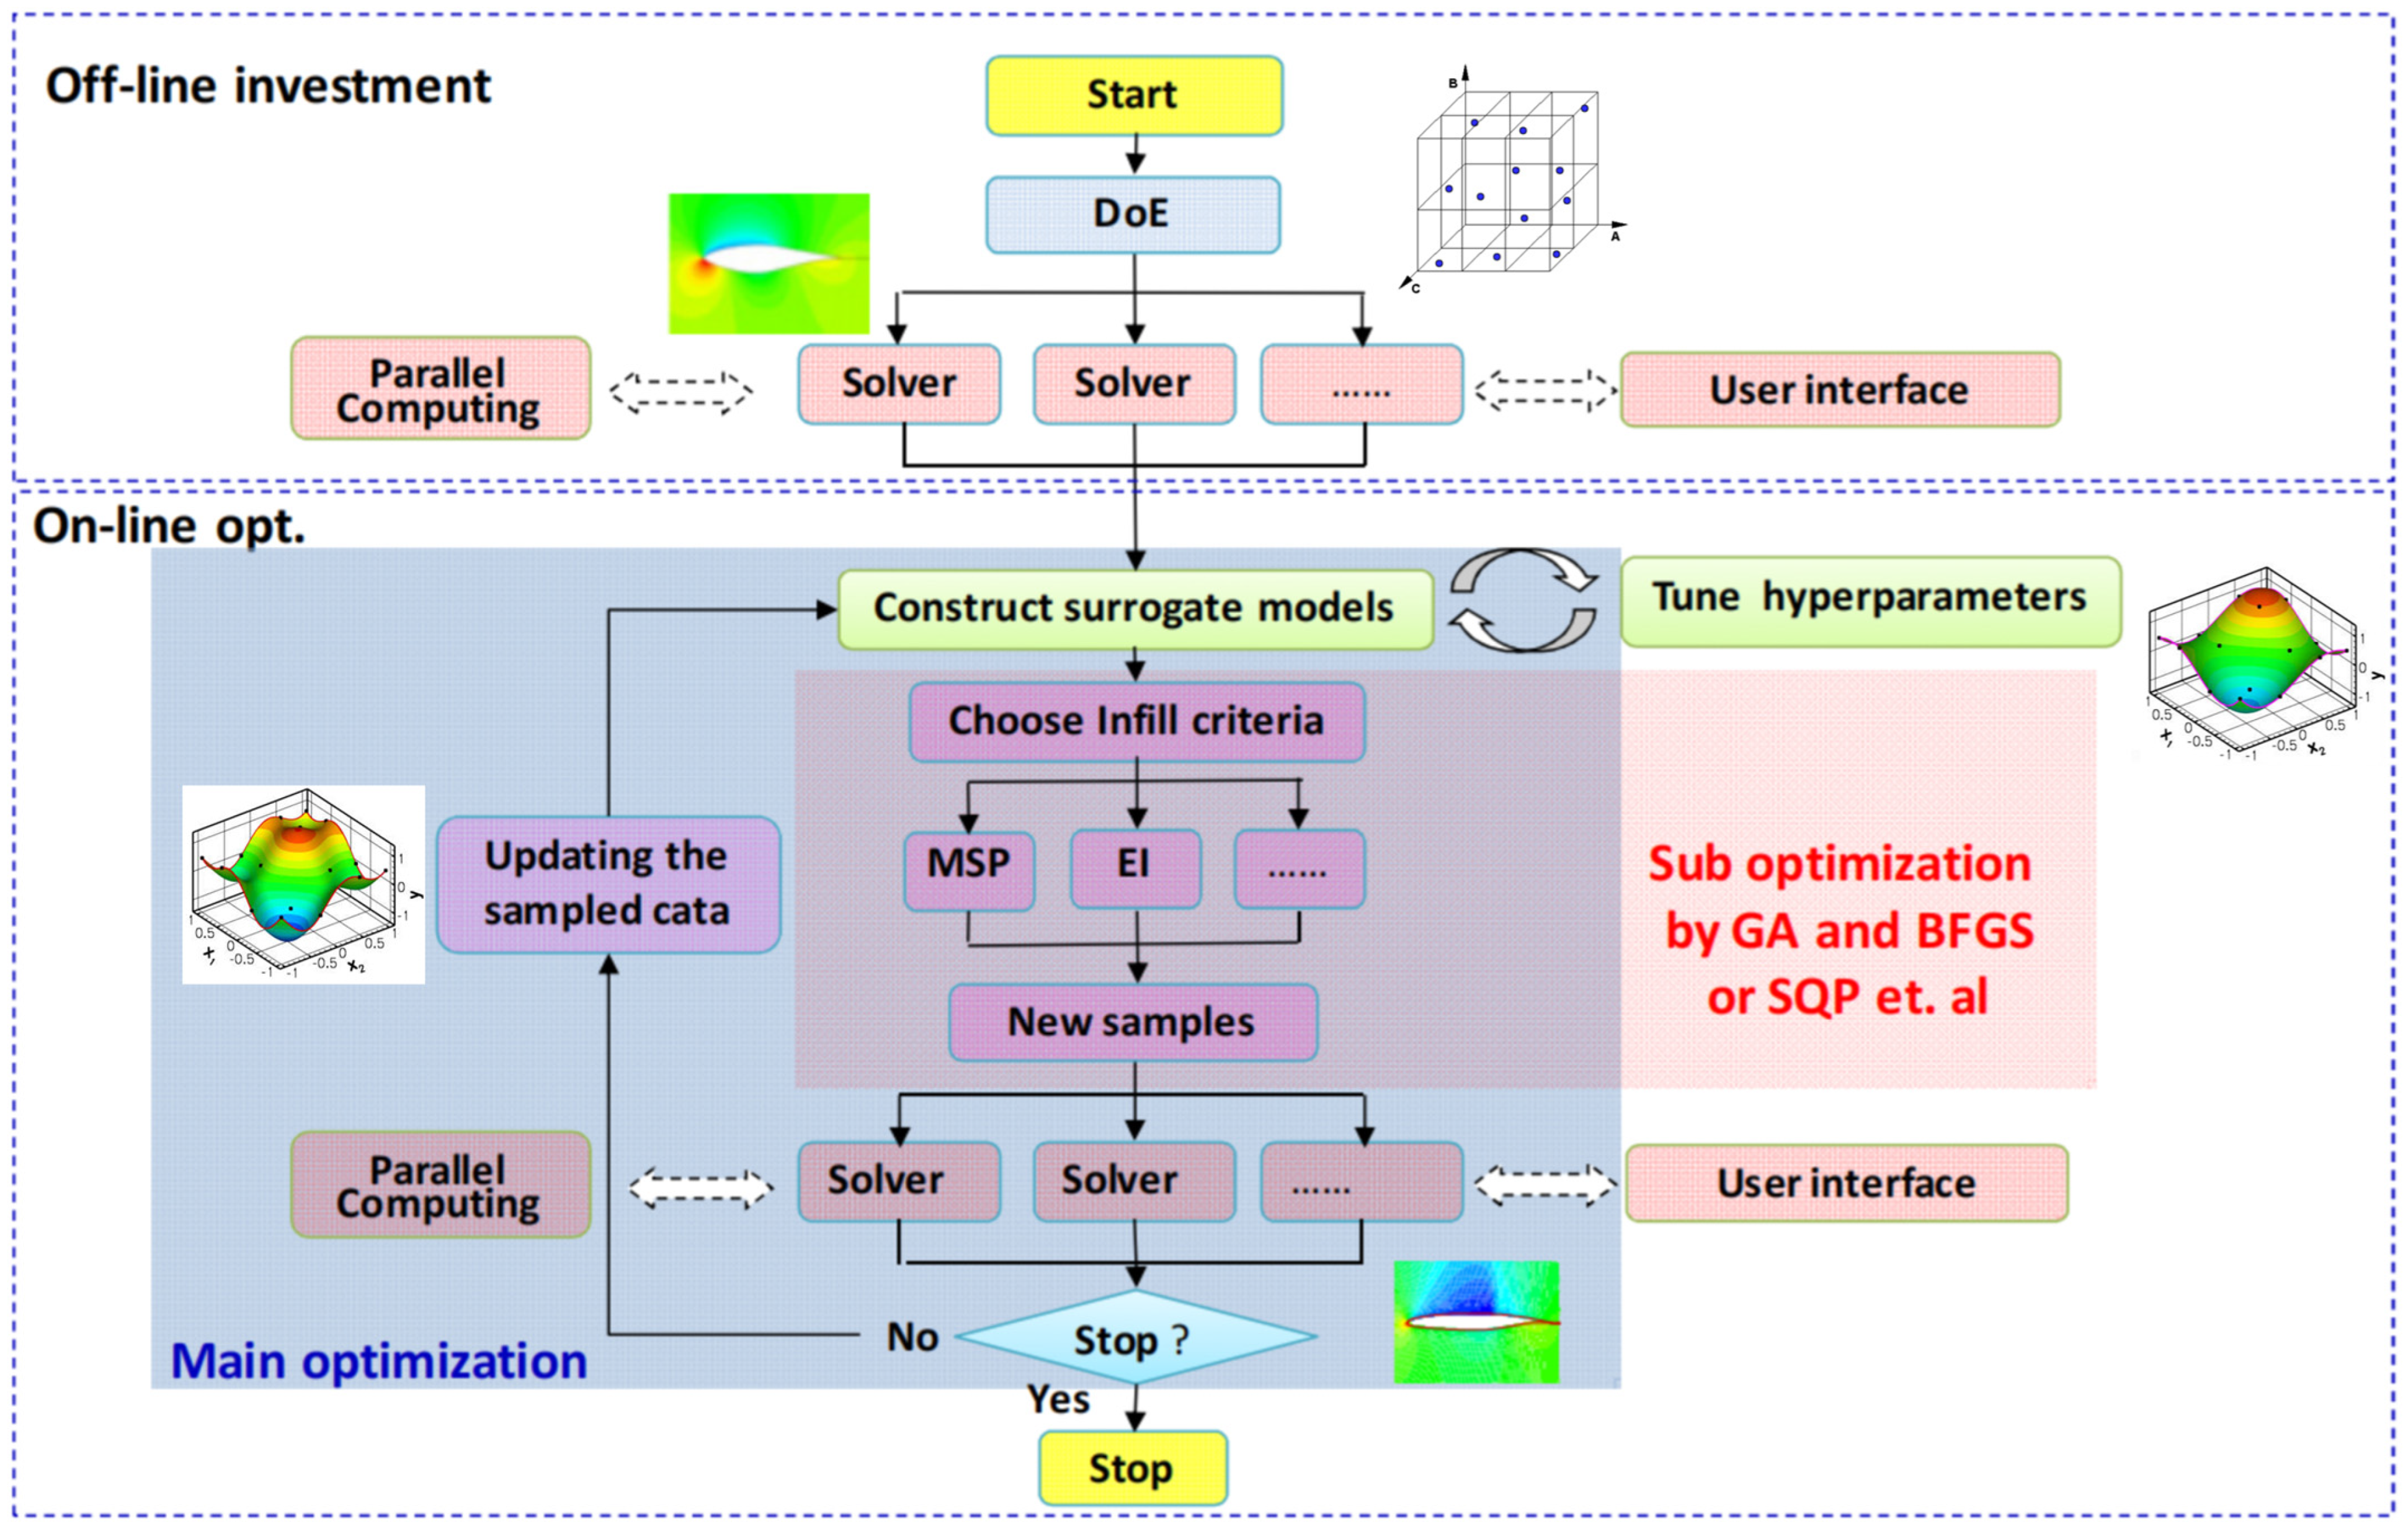
The SurroOpt optimization software was used to construct the initial Kriging surrogate model with 40 sample points. In each iteration, 24 new sample points were added in parallel using a hybrid infill strategy combining the Multi-objective Selection Procedure (MSP) and Expected Improvement (EI) criteria, with a total of 1000 samples calculated. In the surrogate-based optimization framework, the Kriging model is used to guide the adaptive sampling process, and each newly selected sample is evaluated by CFD before being added to the sample database for model updating [
41,
50]. Therefore, the final Pareto solutions reported in this study are selected from the CFD-evaluated sample database rather than from the predicted solutions of the surrogate model.
During the adaptive sampling process, closely spaced sample points in the design space may result in an ill-conditioned correlation matrix of the Kriging model. To improve the numerical stability of the correlation matrix, a small diagonal regularization parameter was introduced during model construction [
42]. Although an ideal Kriging model has an exact interpolation property at the training samples, the introduction of this regularization term slightly relaxes this property. Therefore, an a posteriori consistency assessment was conducted for the final regularized Kriging model using the complete database of 1000 CFD-evaluated samples.
5.2. Optimization Results and Discussion
In this section, the multi-objective optimization results of the Co-Flow Jet airfoil are evaluated within a normalized framework to eliminate the scale disparity between different objective functions. The hybrid infill strategy combining the Multi-objective Selection Procedure (MSP) and Expected Improvement (EI) criteria utilizes 40 initial database samples and 24 parallel infill points per iteration, enabling a dense exploration of both feasible and infeasible boundaries.
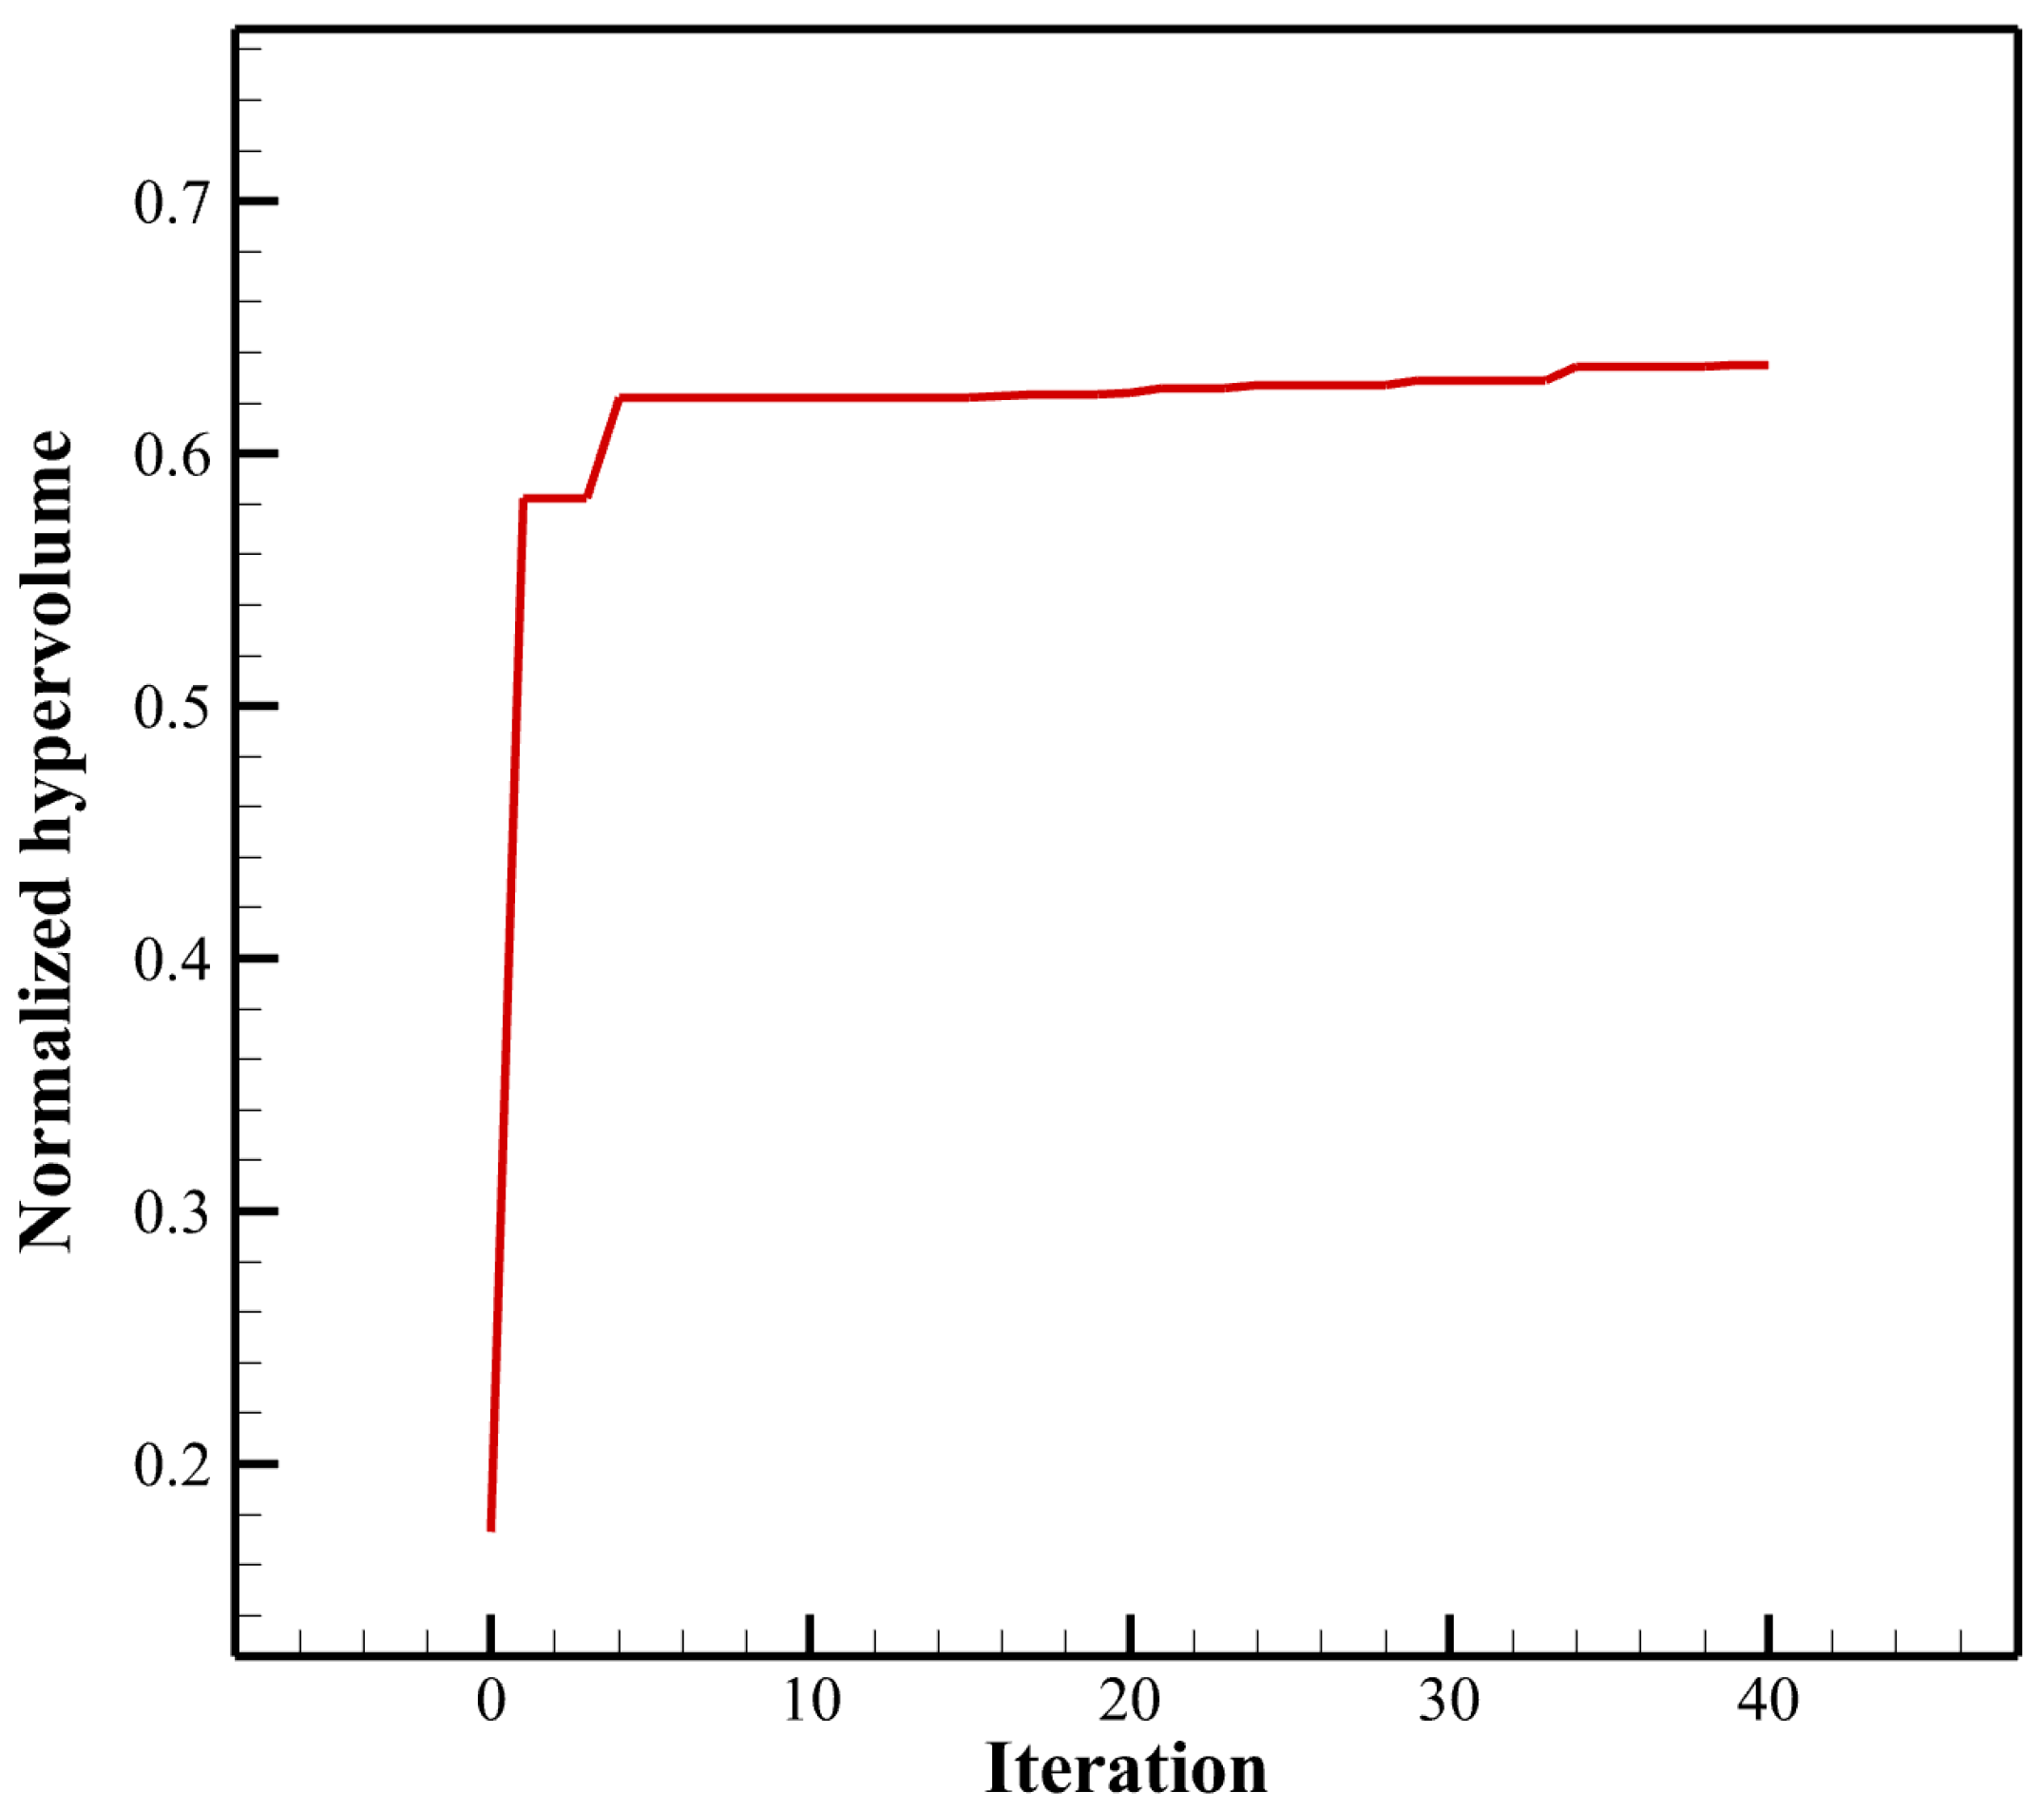
To evaluate the convergence of the multi-objective optimization process, the normalized hypervolume (HV) indicator of the non-dominated solution set [
51] was monitored throughout the iterative optimization, as shown in
Figure 8. The optimization starts with 40 initial samples, and 24 new samples are added in each iteration. Therefore, the cumulative sample count at the k-th iteration is
N = 40 + 24k, where k denotes the iteration number. Accordingly, the 40th iteration corresponds to 1000 CFD-evaluated samples.
As shown in
Figure 8, the normalized HV increases rapidly from 0.173249 at the initial stage to 0.582317 after the first iteration, indicating a significant improvement in the Pareto front at the early optimization stage. The HV further increases to 0.622232 by the 4th iteration, reaching approximately 97.97% of the final value. Thereafter, the growth rate becomes much smaller, and the curve gradually approaches a stable plateau. From the 34th to the 40th iteration, the HV increases only from 0.634482 to 0.635134, corresponding to a relative change of approximately 0.10%. This indicates that the Pareto front becomes sufficiently stable under the present sampling budget of 1000 samples.
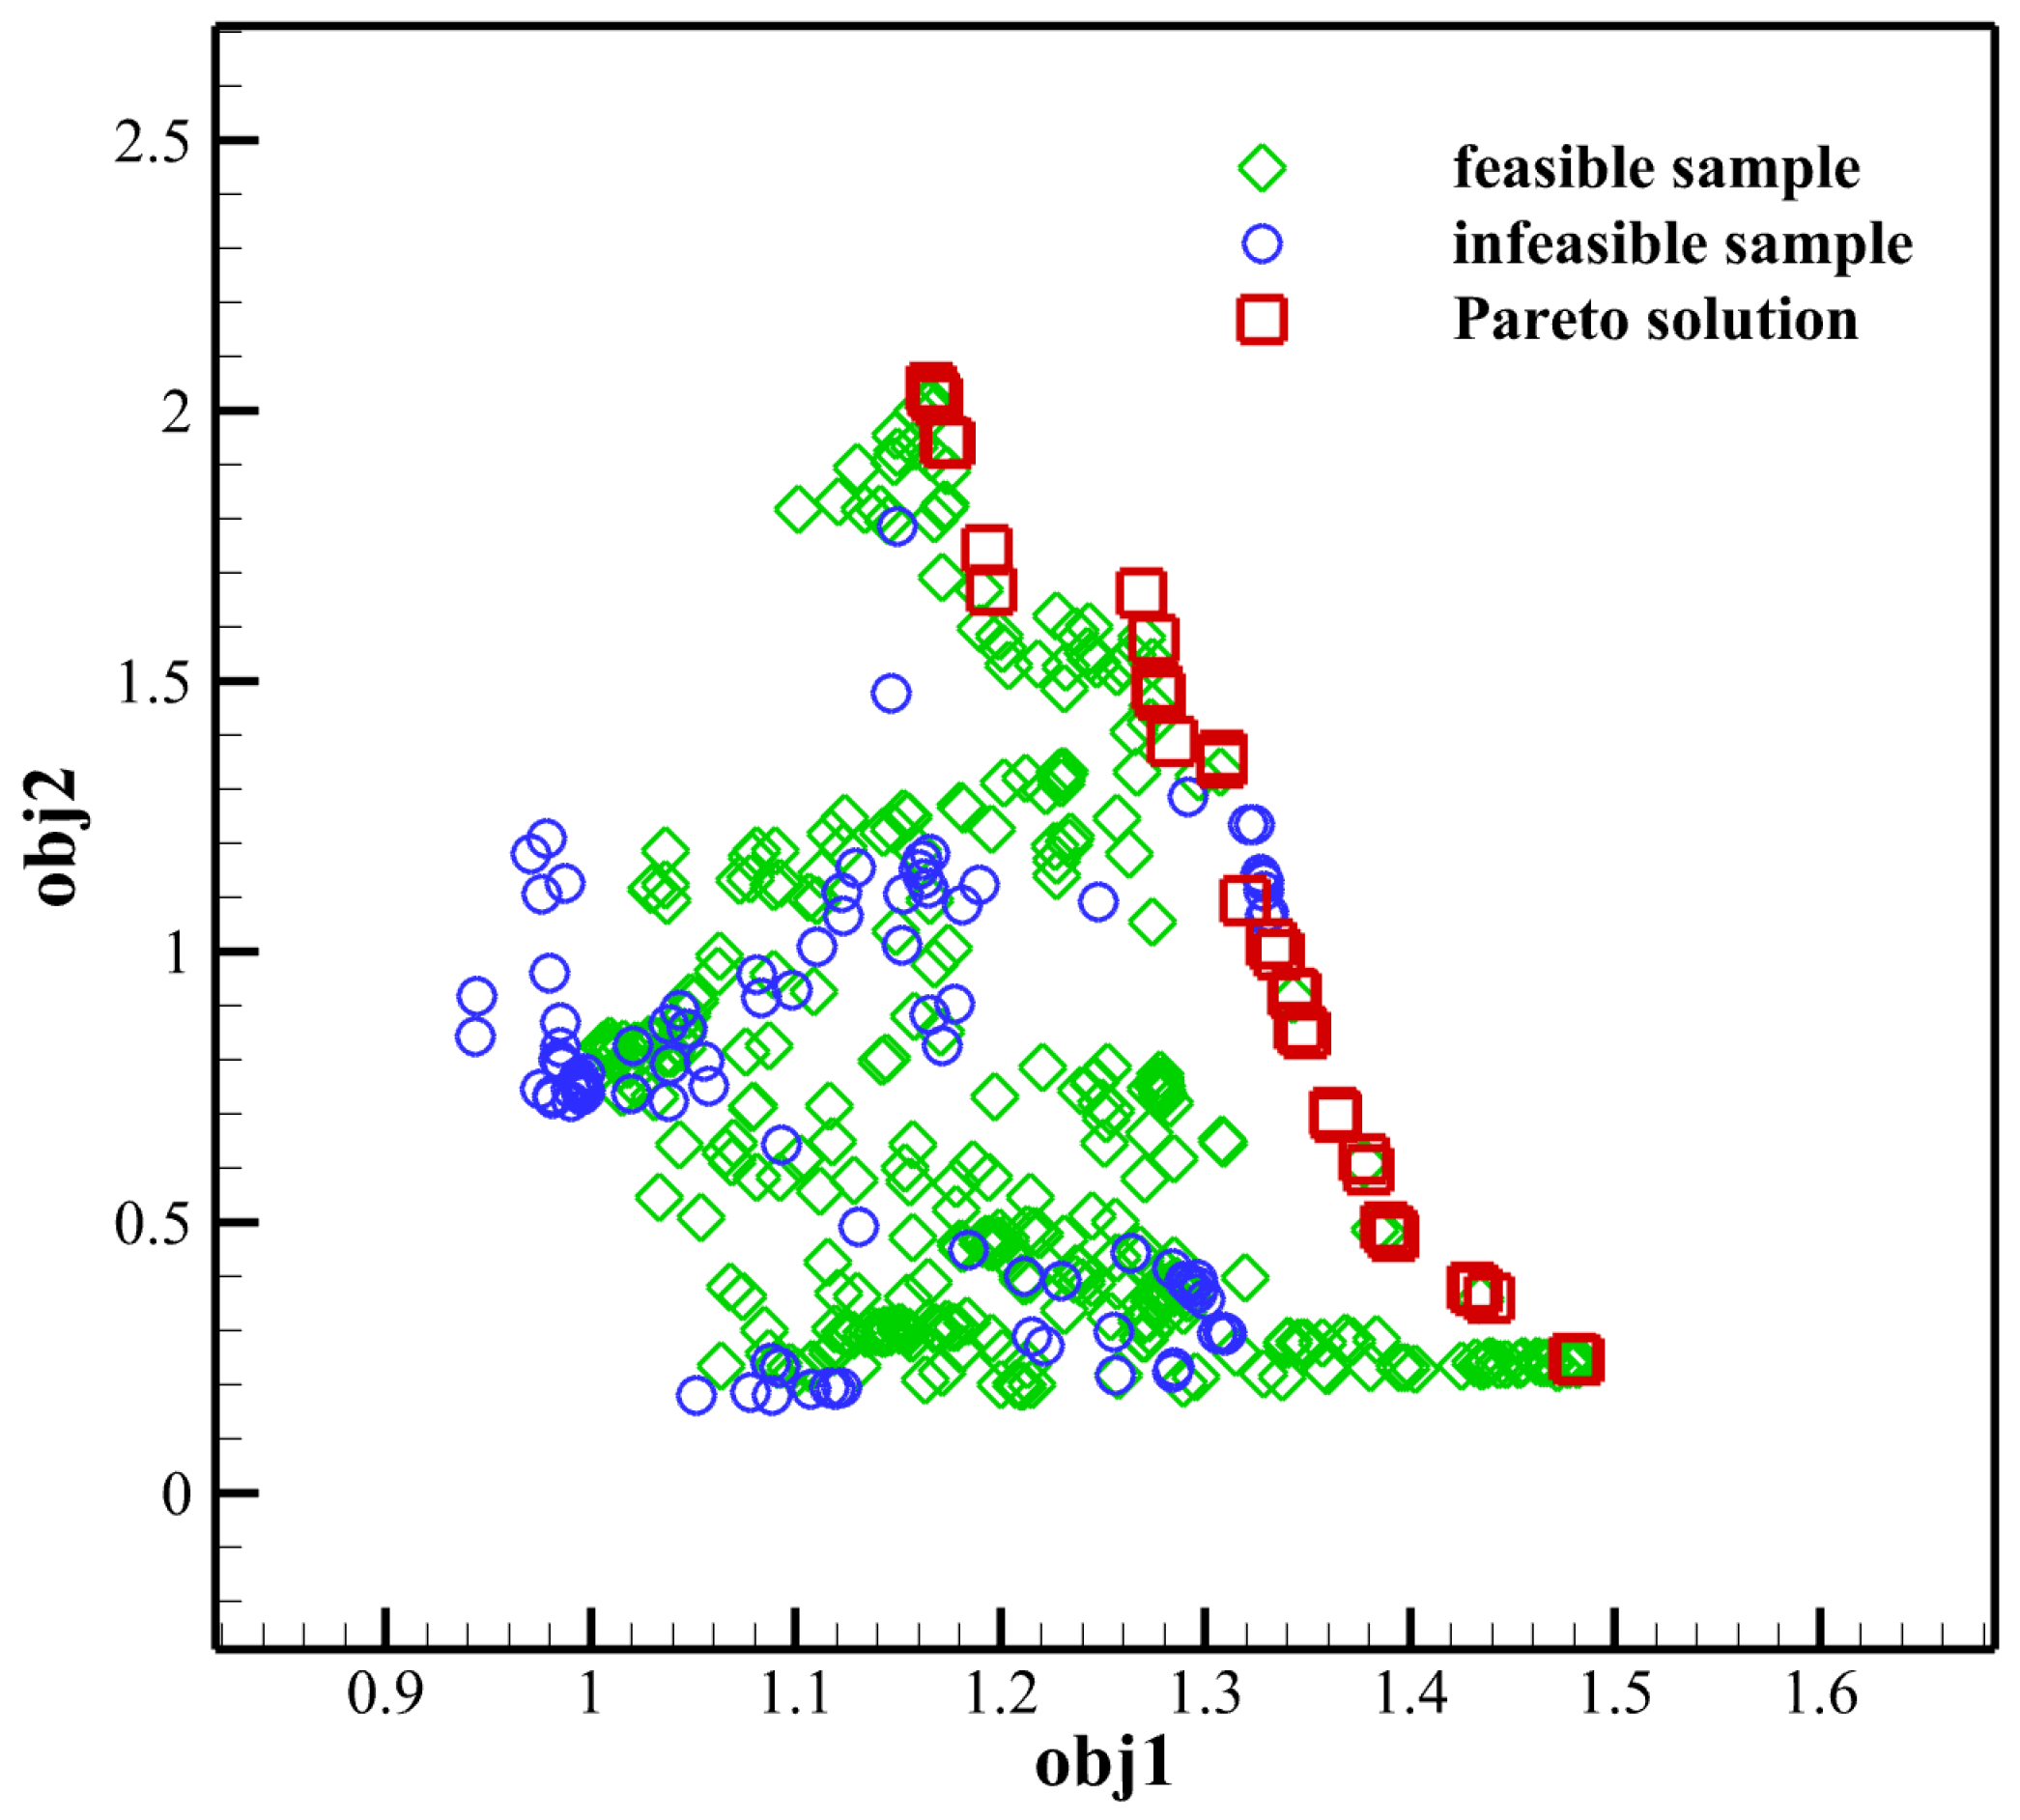
Figure 9 shows the distribution of all samples generated during the iterative two-objective optimization process in the objective space. The green diamonds represent feasible samples that satisfy all prescribed constraints, whereas the blue circles denote infeasible samples that violate at least one constraint. The red squares represent the Pareto solutions identified by non-dominated sorting of the feasible samples. These non-dominated solutions constitute the approximate Pareto front and are highlighted to distinguish the optimal trade-off designs from the remaining samples.
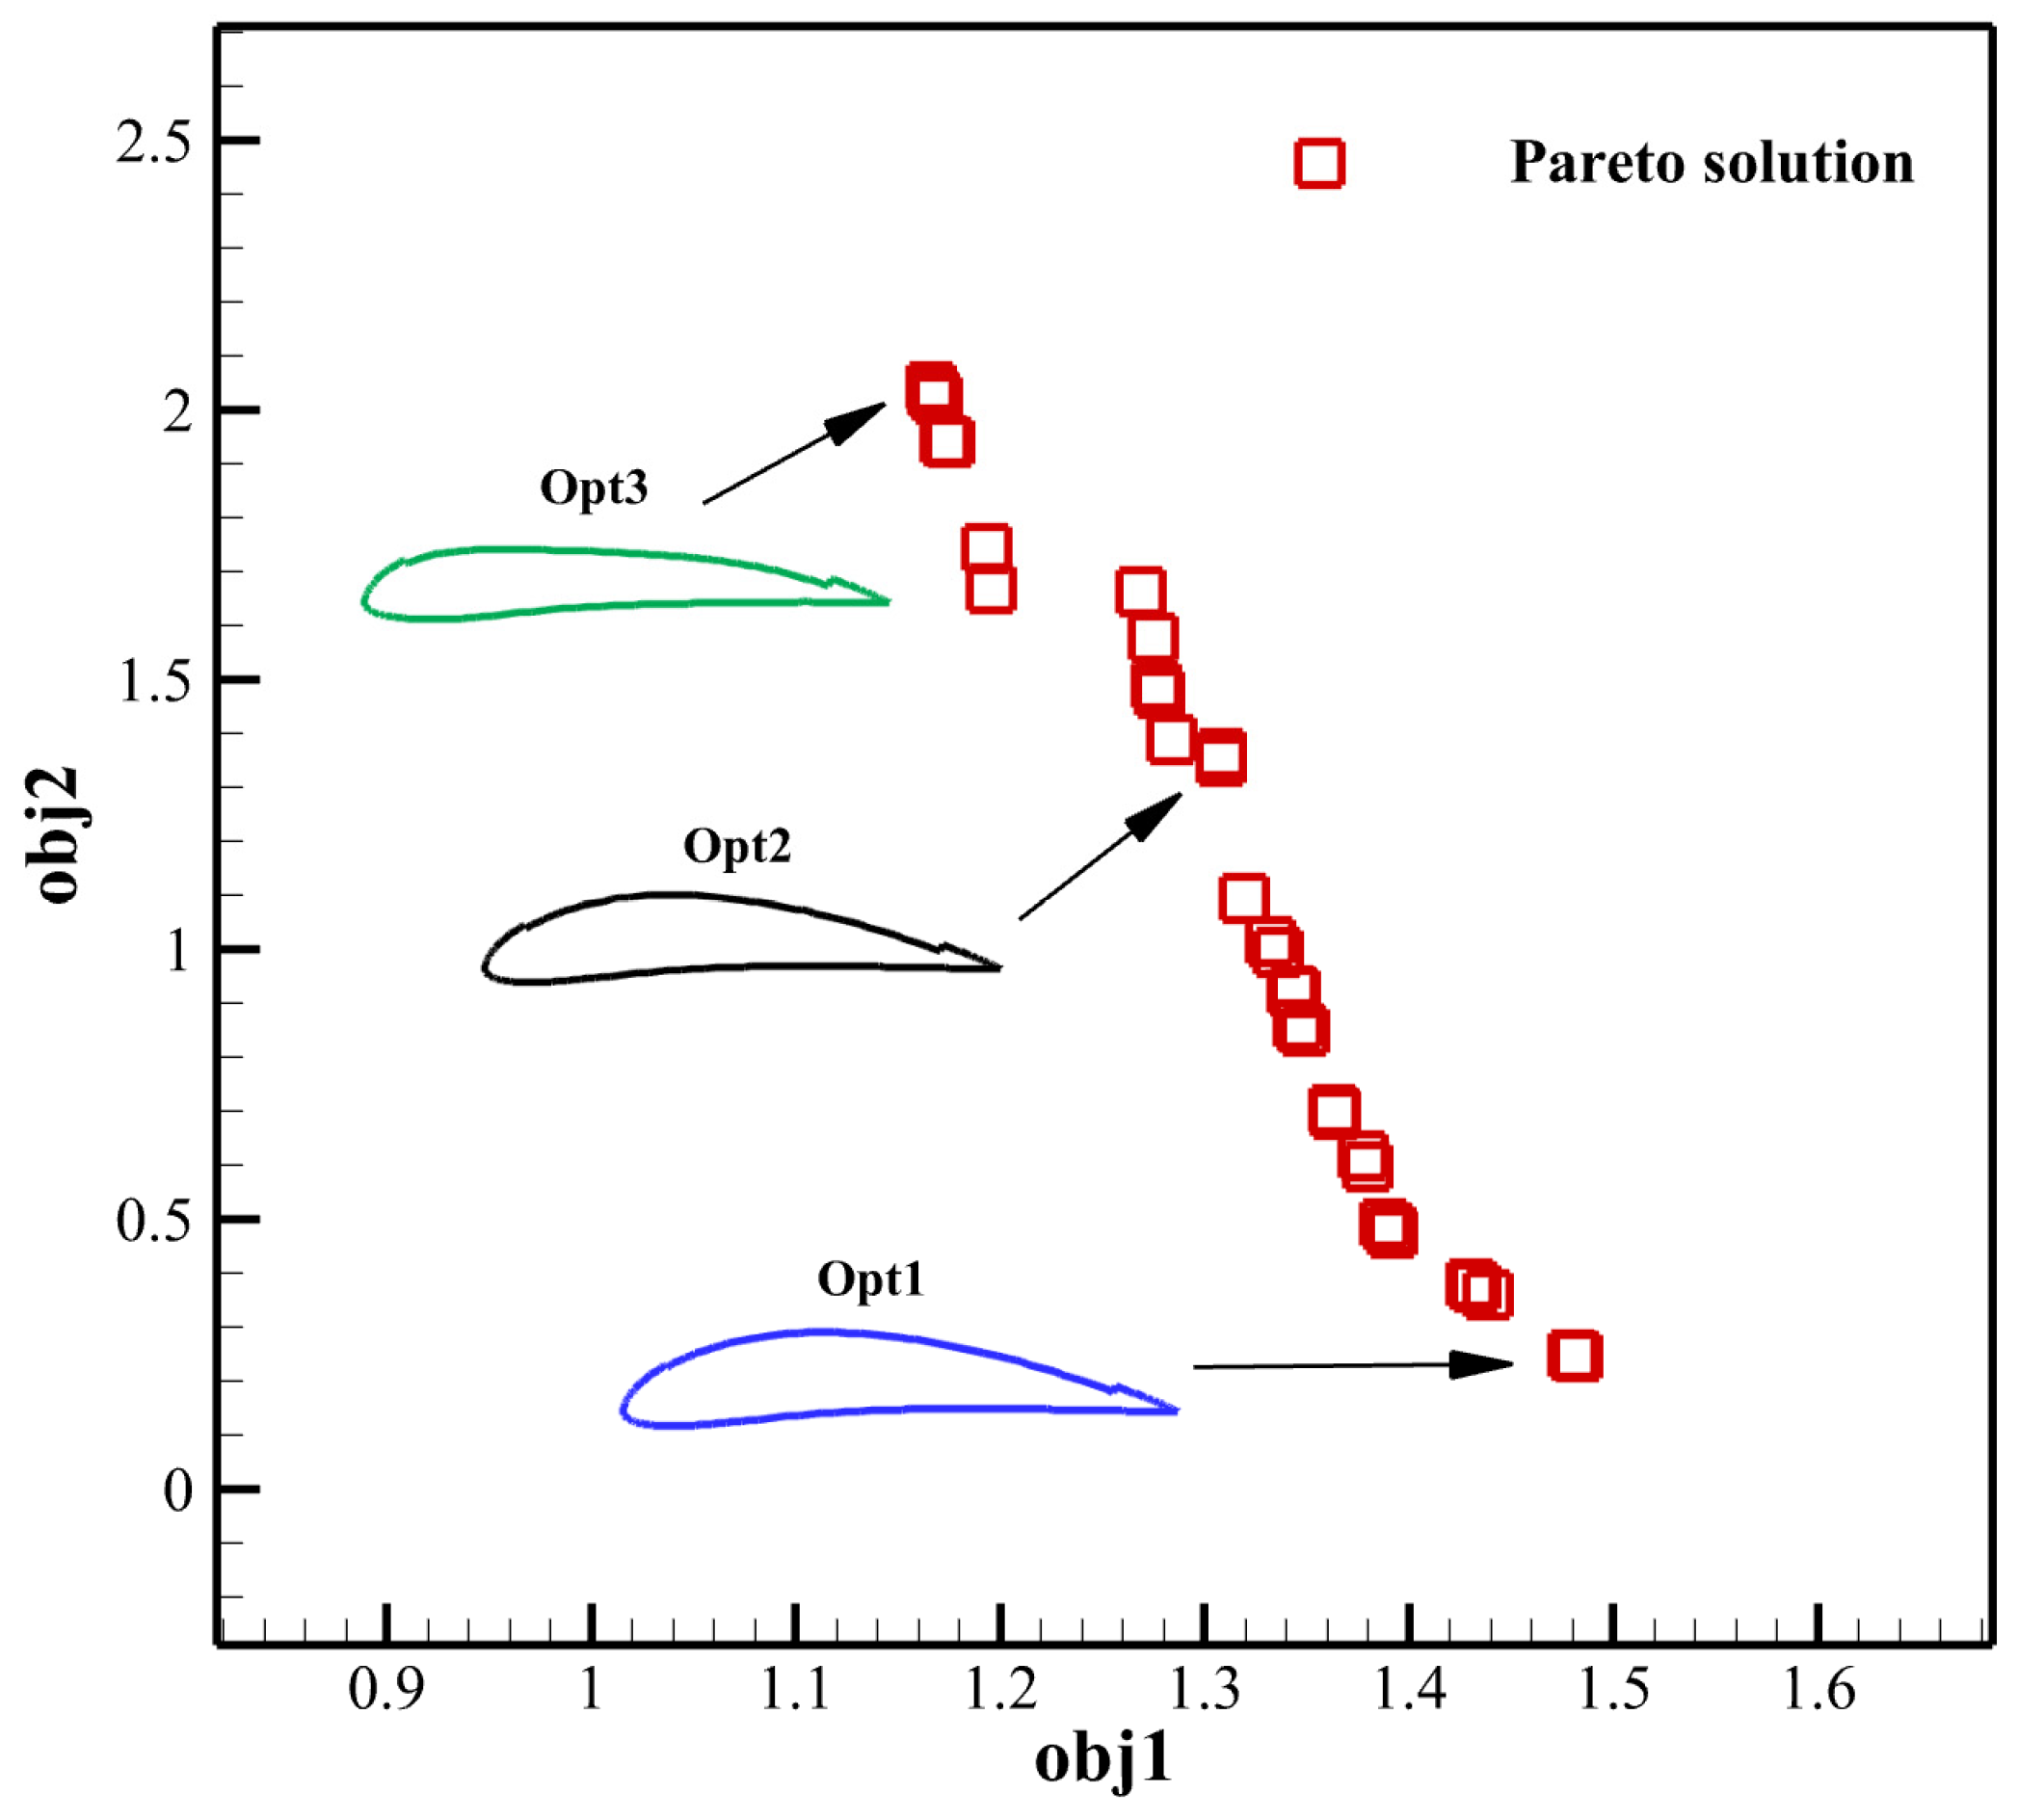
The resulting Pareto optimal solution set consists of 35 optimized airfoils, which represent a non-dominated collection of designs derived from varying weightings of the normalized lift coefficient (obj1) and the normalized effective lift-to-drag ratio (obj2).
Figure 10 presents the finalized approximate Pareto front, from which three representative optimized airfoils, labeled as Opt1, Opt2, and Opt3, are selected for detailed aerodynamic analysis.
Based on the Pareto solutions identified in
Figure 9, three representative optimized airfoils, denoted as Opt1, Opt2, and Opt3, are selected from different regions of the Pareto front for detailed analysis. Opt1 is selected from the lower-right part of the Pareto front and represents a lift-oriented solution with the largest obj1 value. Opt2 is selected from the intermediate region and represents a balanced trade-off between lift enhancement and effective aerodynamic efficiency. Opt3 is selected from the upper-left part of the Pareto front and represents an efficiency-oriented solution with the largest obj2 value. These three airfoils are used as typical designs to illustrate different design preferences within the Pareto-optimal solution set.
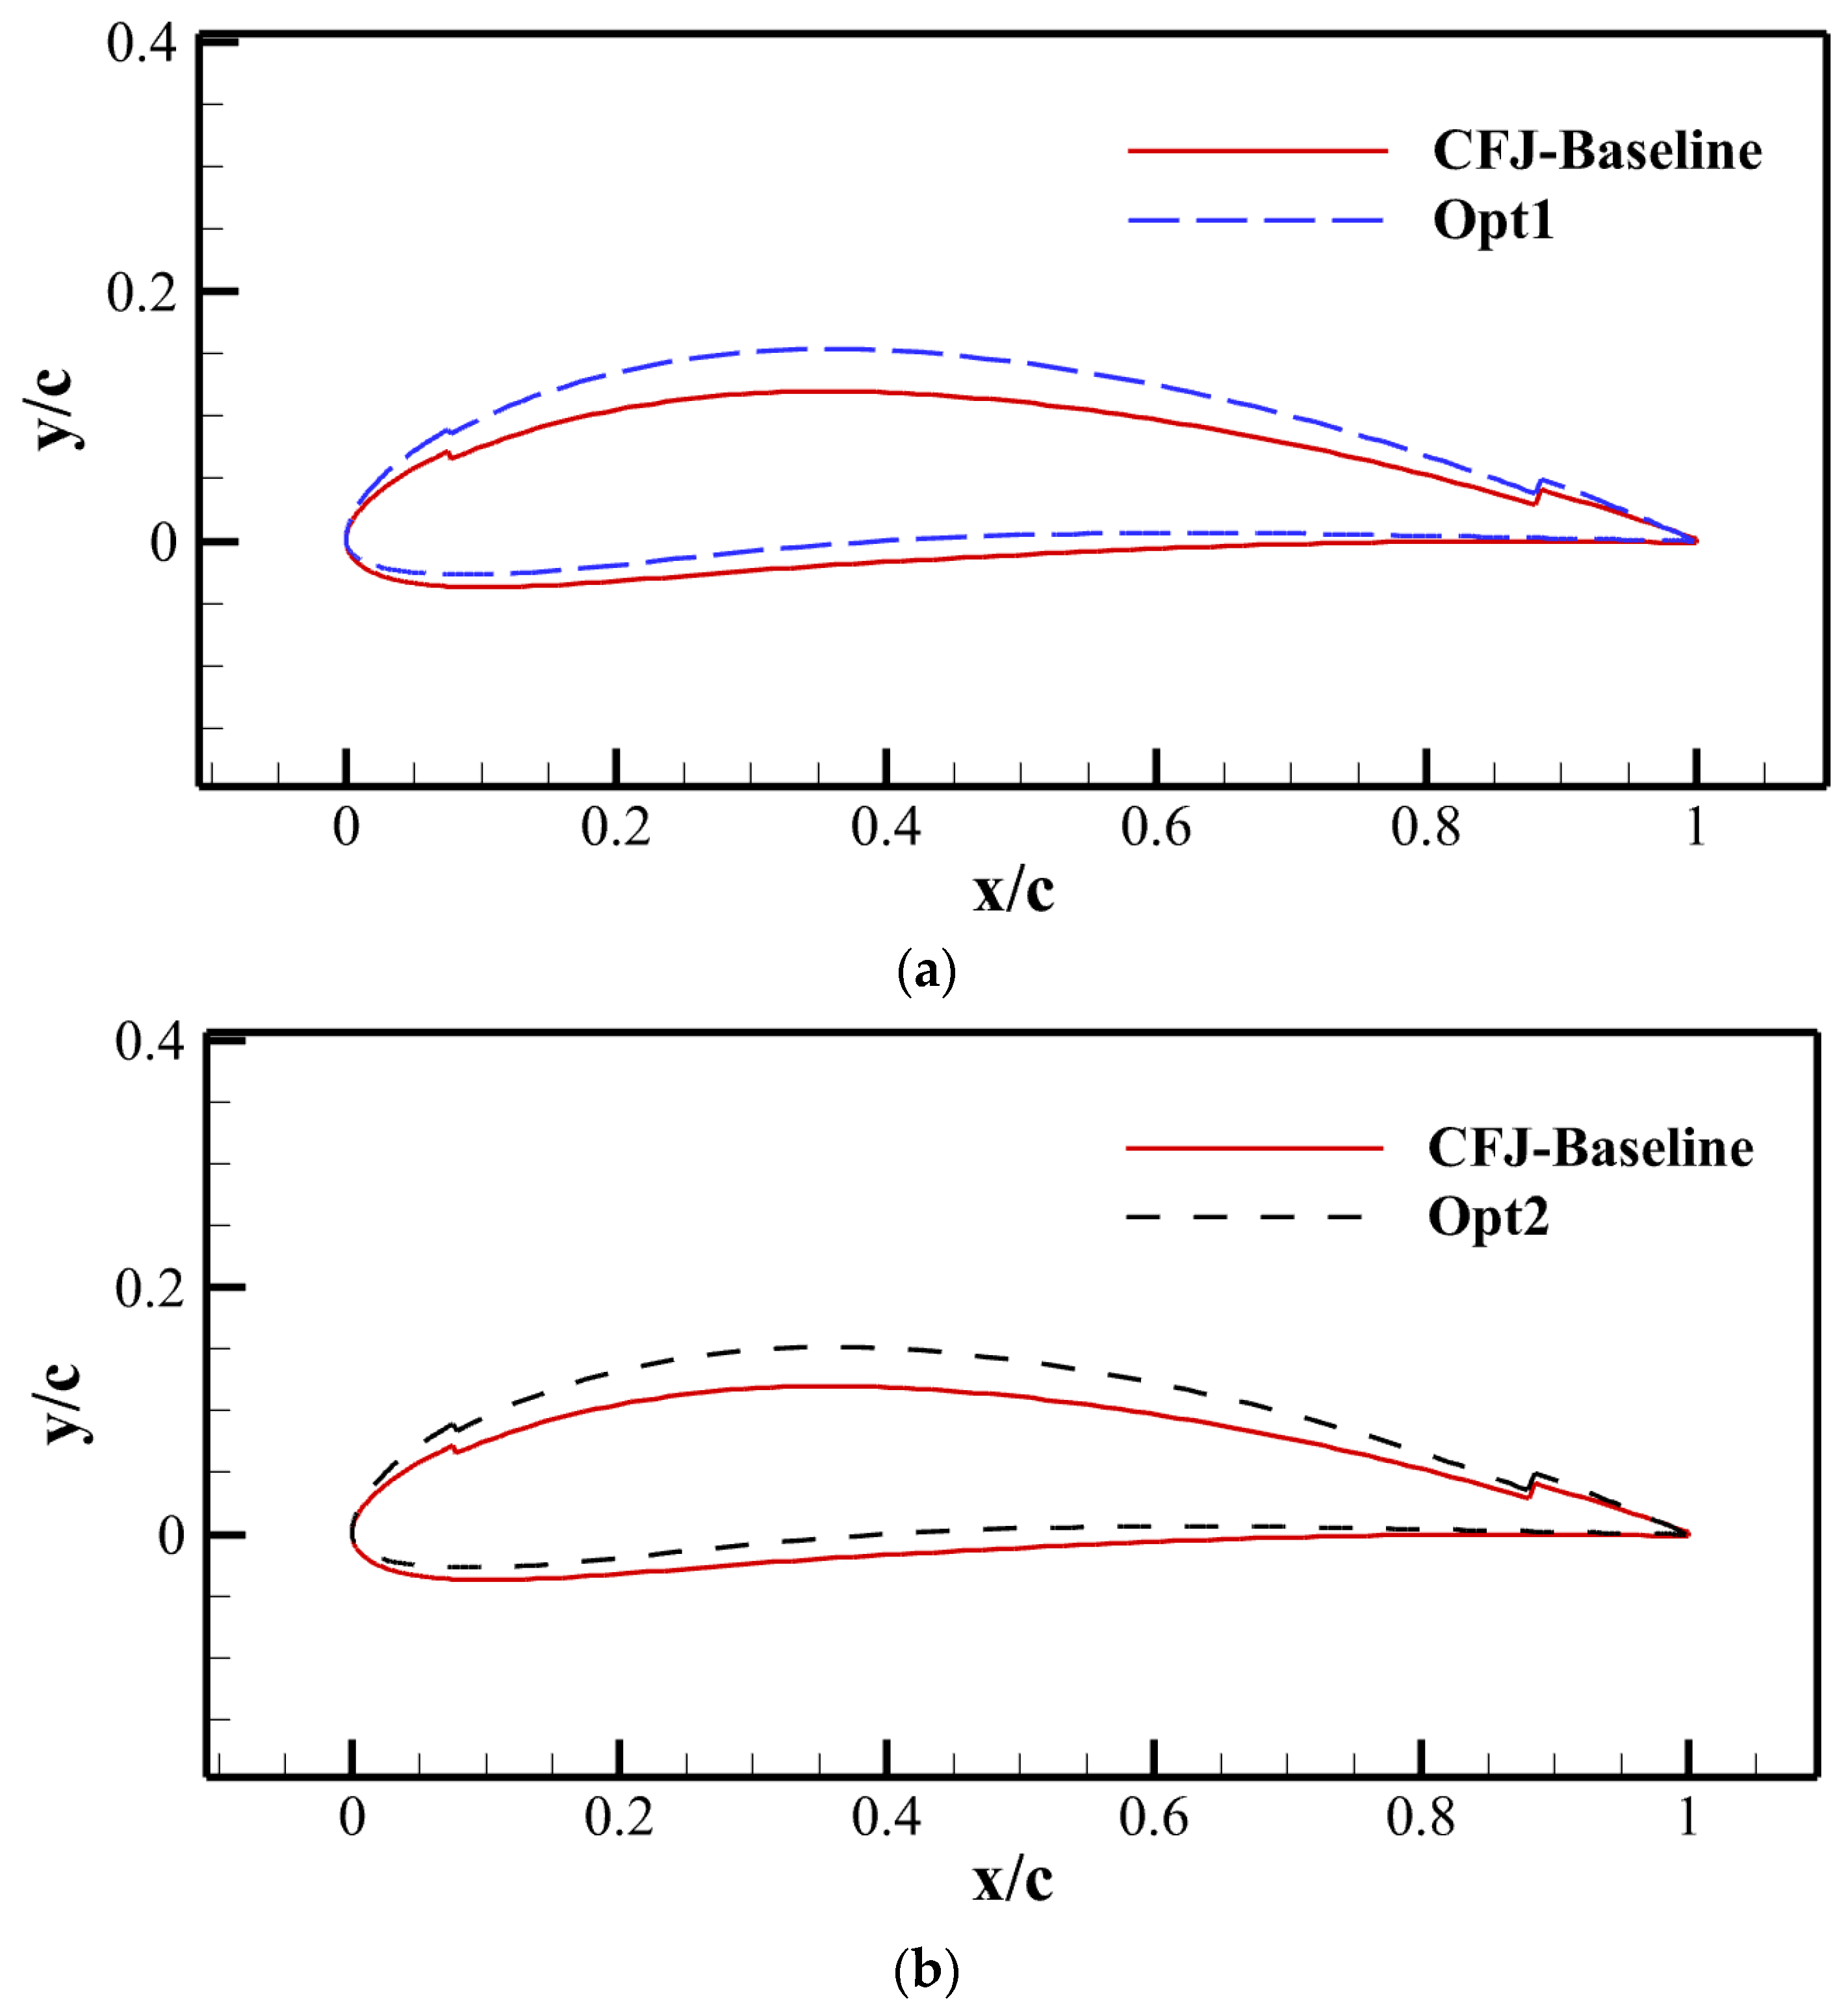
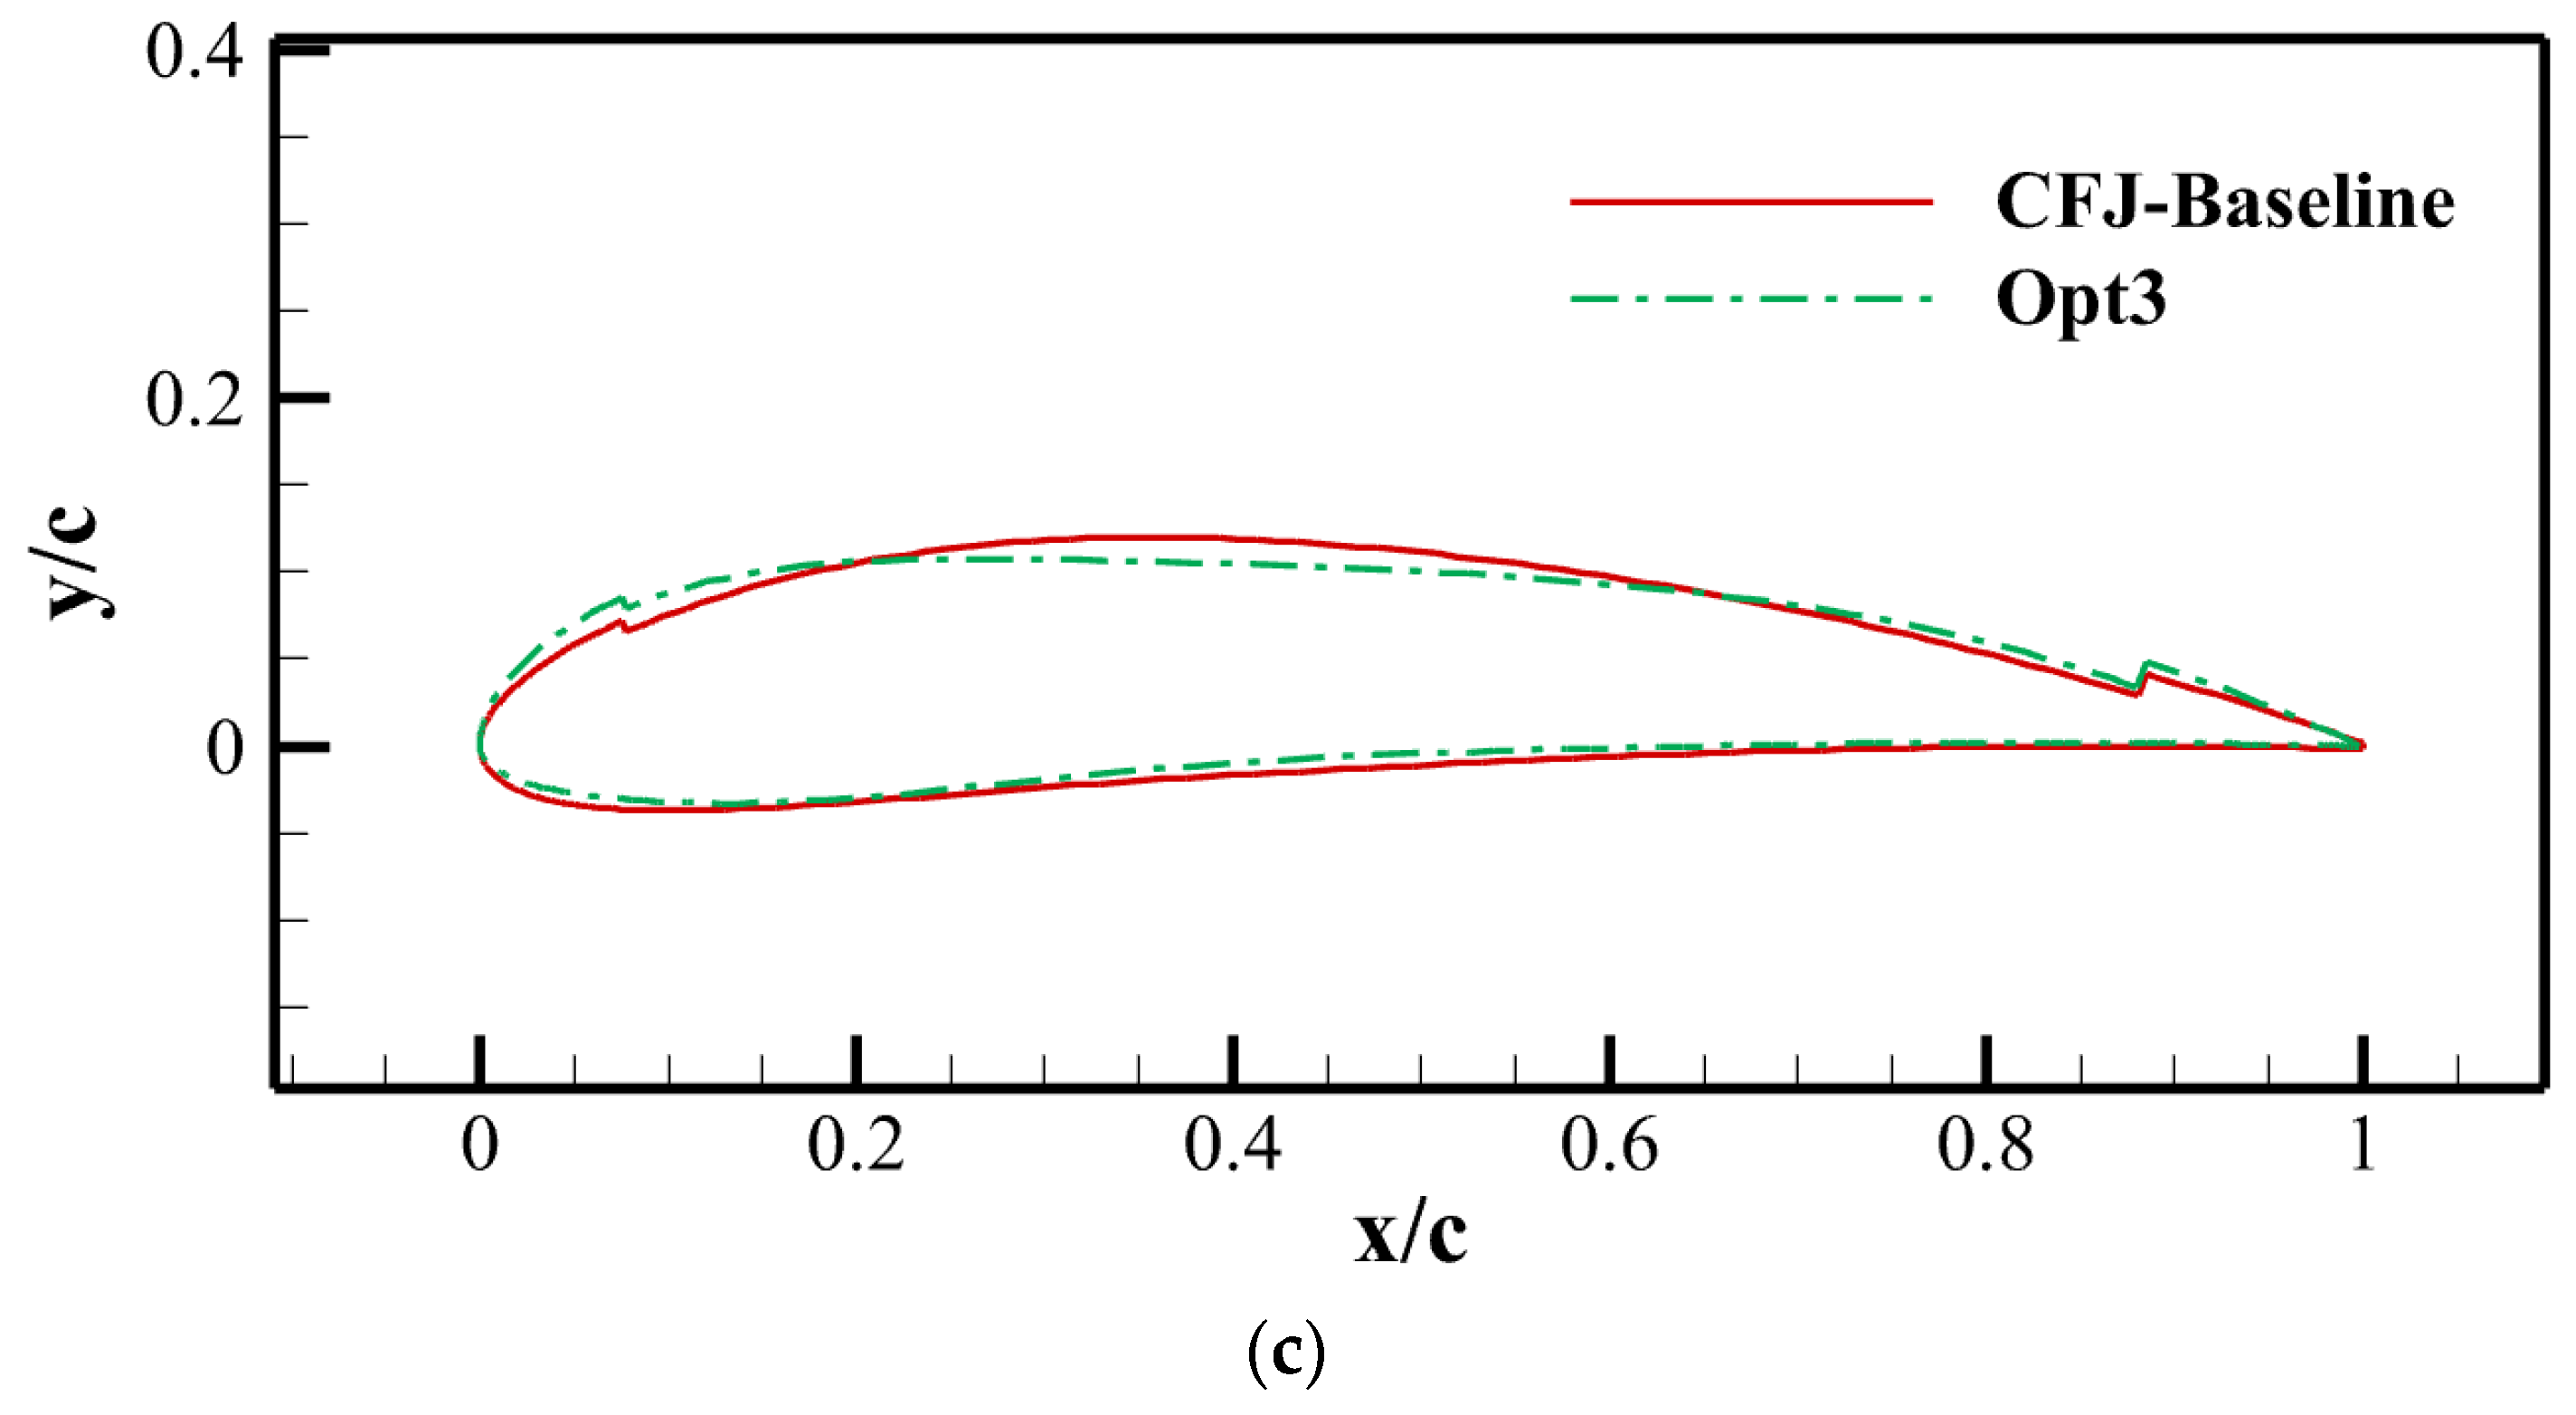
Opt1 is located at the lower-right extremity of the Pareto front where obj1 reaches its maximum extension, which explicitly targets maximum lift enhancement. Opt3 is situated at the upper-left limit where obj2 is prioritized, representing a high energy efficiency configuration. Opt2 is selected from the central inflection region of the front, offering a well-balanced compromise between lift enhancement and energy consumption. The specific performance metrics of the baseline and optimized airfoils under the design operating condition are summarized in
Table 6. Their geometric configurations are compared in
Figure 11.
As shown in
Table 6, the optimized CFJ configurations exhibit distinct trade-offs among lift performance, aerodynamic drag, and power consumption. Although Opt1 has a high lift coefficient and a low aerodynamic drag coefficient, its larger power coefficient leads to an increase in the effective drag coefficient. As a result, the effective lift-to-drag ratio of Opt1 is 9.27, which is lower than that of the CFJ-Baseline configuration. This relatively low effective lift-to-drag ratio indicates that Opt1 is not an efficiency-oriented design. Instead, it corresponds to the lift-oriented extreme of the Pareto front, where lift enhancement is achieved at the expense of increased power consumption. Therefore, Opt1 should be regarded as a candidate for operating conditions where lift is prioritized, rather than for long-endurance operation where efficiency is the primary requirement.
Opt2 demonstrates improvements in both lift and drag coefficients compared to the baseline while maintaining the power coefficient at a relatively low level, yielding an effective lift-to-drag ratio of 50.69. This configuration achieves an excellent balance between lift enhancement and energy consumption, demonstrating robust engineering feasibility as a well-rounded optimization result.
Although the lift enhancement of Opt3 is relatively limited, it exhibits the lowest power and effective drag coefficients. It achieves an effective lift-to-drag ratio of 75.84, which is nearly double that of the baseline configuration, thereby demonstrating superior energy efficiency.
To quantify the consistency between the final regularized Kriging model and the high-fidelity sample database, the final model was reconstructed using all 1000 CFD-evaluated samples, and the predicted normalized objective values were compared with their corresponding CFD values at each sampled design. The absolute relative prediction deviation for the j-th objective was defined as |εj| = |(fj − fj,CFD)/fj,CFD| × 100%, where fj and fj,CFD denote the Kriging-predicted value and the corresponding CFD-evaluated value, respectively. Across the complete sample database, the maximum absolute relative deviations are 1.60% for obj1 and 2.61% for obj2. Because these samples constitute the database used to construct the final model, this assessment is interpreted as an a posteriori consistency check of the regularized surrogate rather than an independent out-of-sample validation.
The prediction consistency at the three representative Pareto solutions is further examined in
Table 7. For Opt1, Opt2, and Opt3, the maximum absolute relative deviations are 0.46% for obj1 and 0.90% for obj2. These small differences demonstrate that the final regularized Kriging model remains closely consistent with the direct CFD responses near the selected Pareto solutions. Nevertheless, the Pareto-front construction, optimization-convergence assessment, and aerodynamic-performance analyses reported in this study are all based on CFD-evaluated samples rather than surrogate-only predictions.
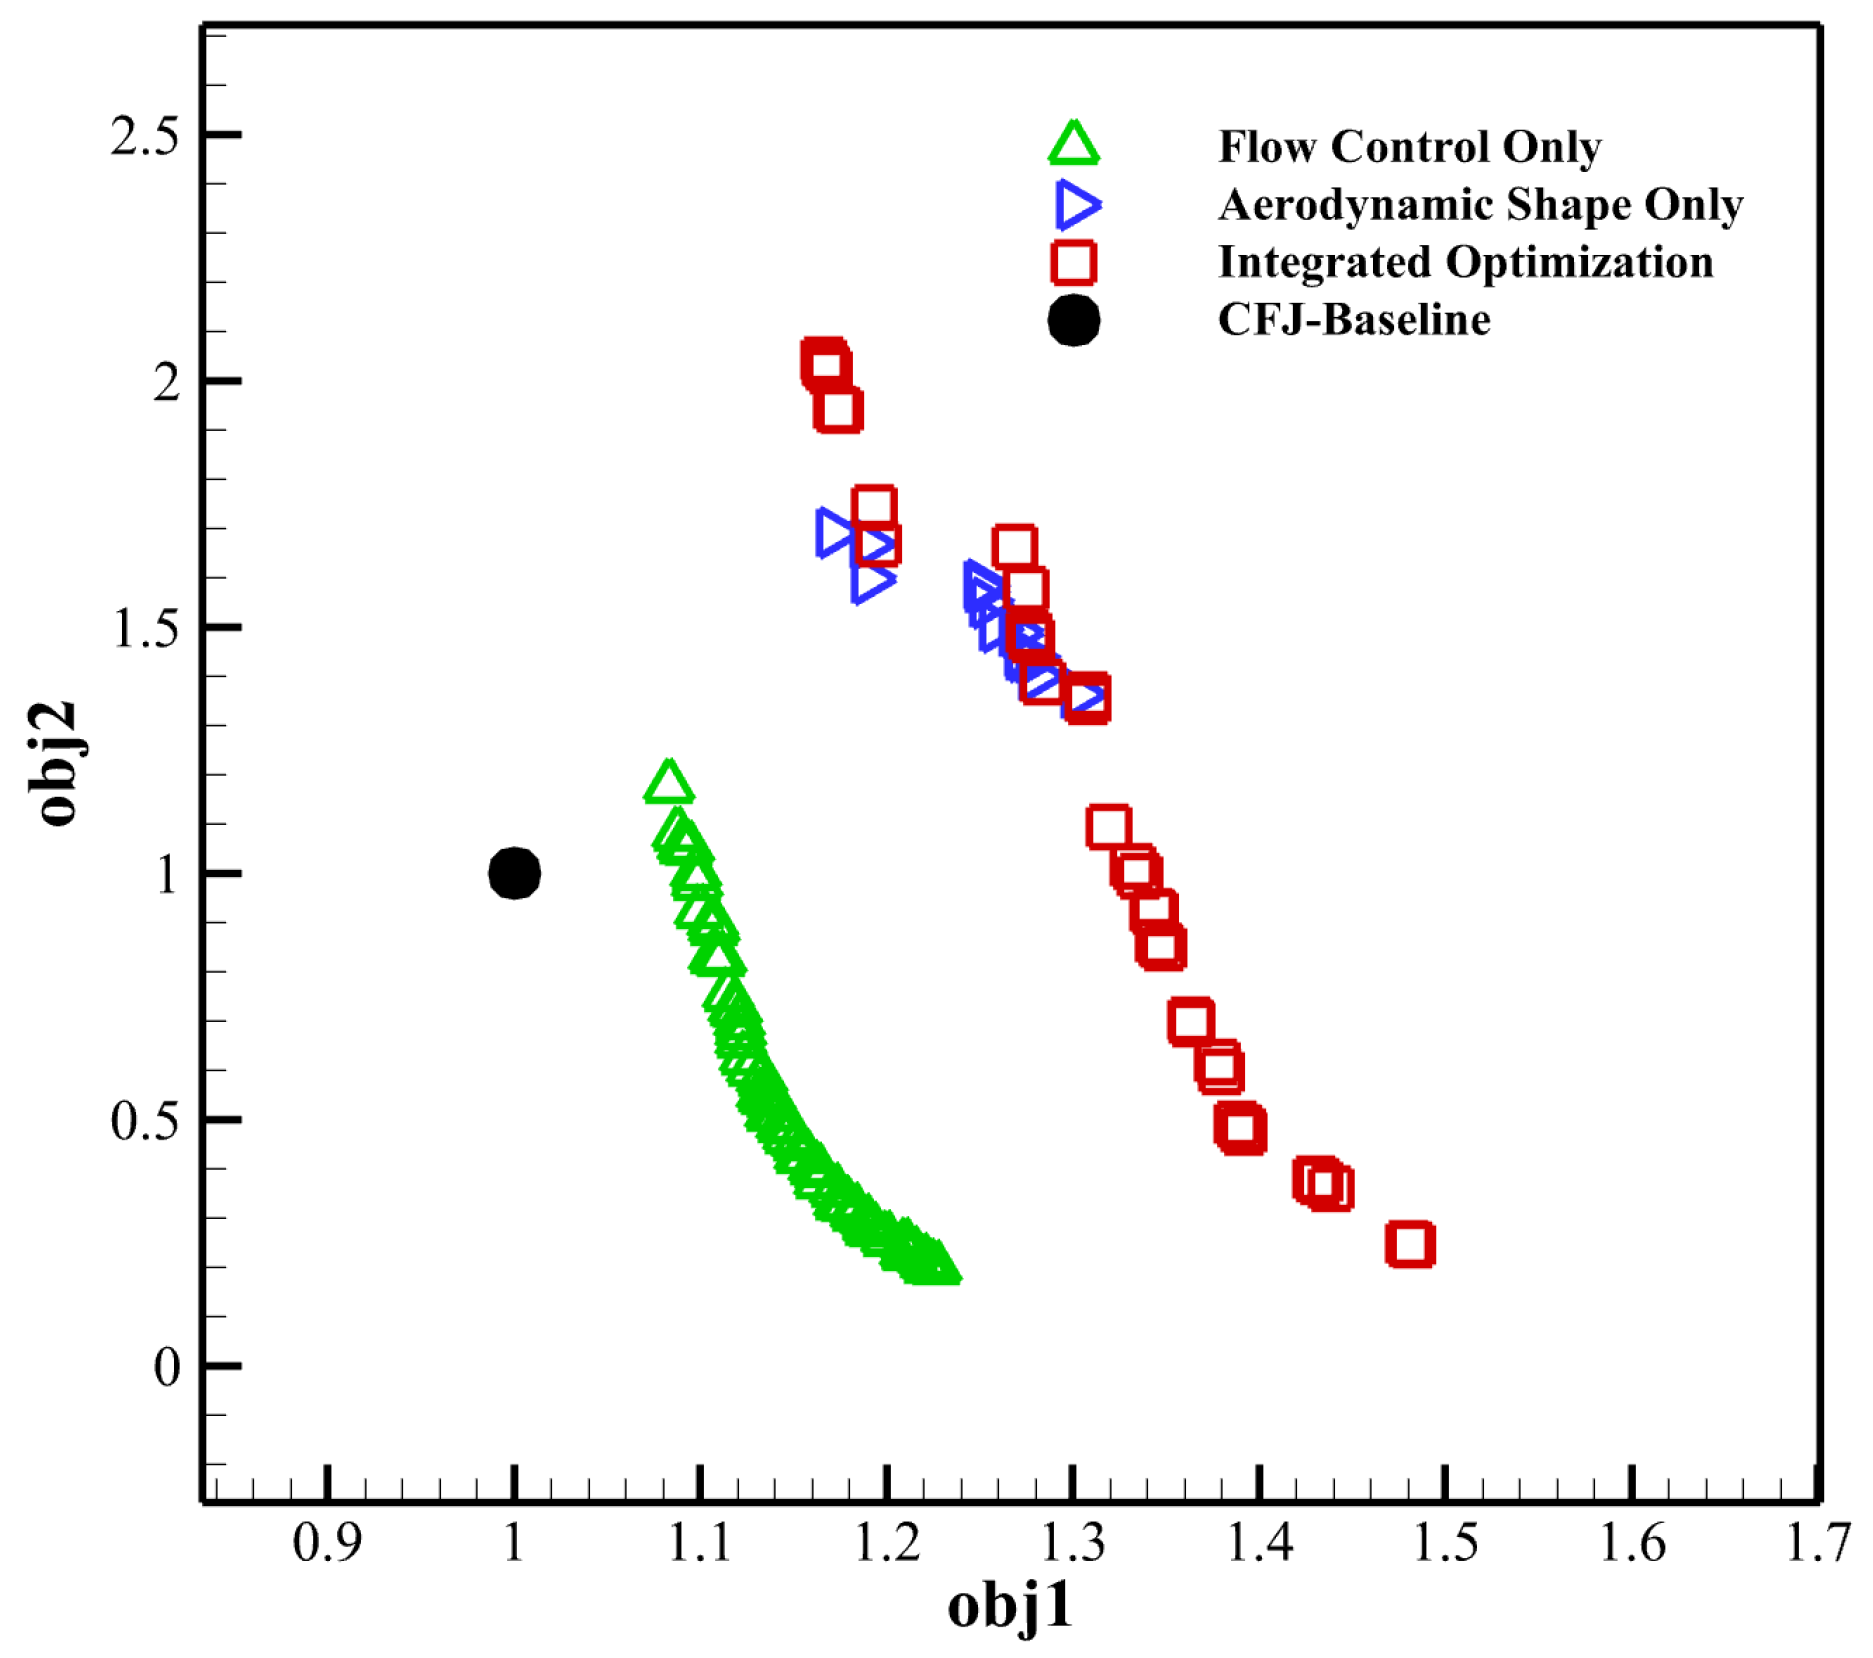
To evaluate the specific contributions of different categories of design variables, two comparative optimization cases were conducted within the same dual-objective framework under the identical normalization criteria. The first case, labeled “Aerodynamic Shape Only”, restricts the design space to the 18 CST parametrization variables while fixing the jet parameters. The second case, labeled “Flow Control Only”, is confined to the dimensions of the injection and suction slots.
The resulting Pareto front comparison is illustrated in
Figure 12. The Pareto front of the integrated design space demonstrates an absolute and comprehensive superiority over both independent sub-spaces. Across the entire range, the integrated optimization successfully pushes the aerodynamic performance boundary far beyond the limits of the decoupled domains, achieving both higher lift and superior efficiency simultaneously.
Specifically, the “Flow Control Only” front is strictly bottlenecked by the frozen baseline profile, locking the maximum achievable lift performance below an obj1 value of 1.23. Although the geometry-focused “Aerodynamic Shape Only” setup shows competitive trade-offs in the mid-efficiency region, it completely fails to expand into the high-lift region, exhibiting a sudden performance termination when obj1 exceeds 1.32. By contrast, the integrated design space fully overcomes these structural boundaries, expanding obj1 to approximately 1.48 while maintaining a significantly higher obj2 curve. This uniform dominance confirms that the strong non-linear coupling between airfoil geometry and flow control parameters can only be captured through the integrated approach, which is essential for identifying improved Pareto-optimal solutions within the predefined integrated design space.
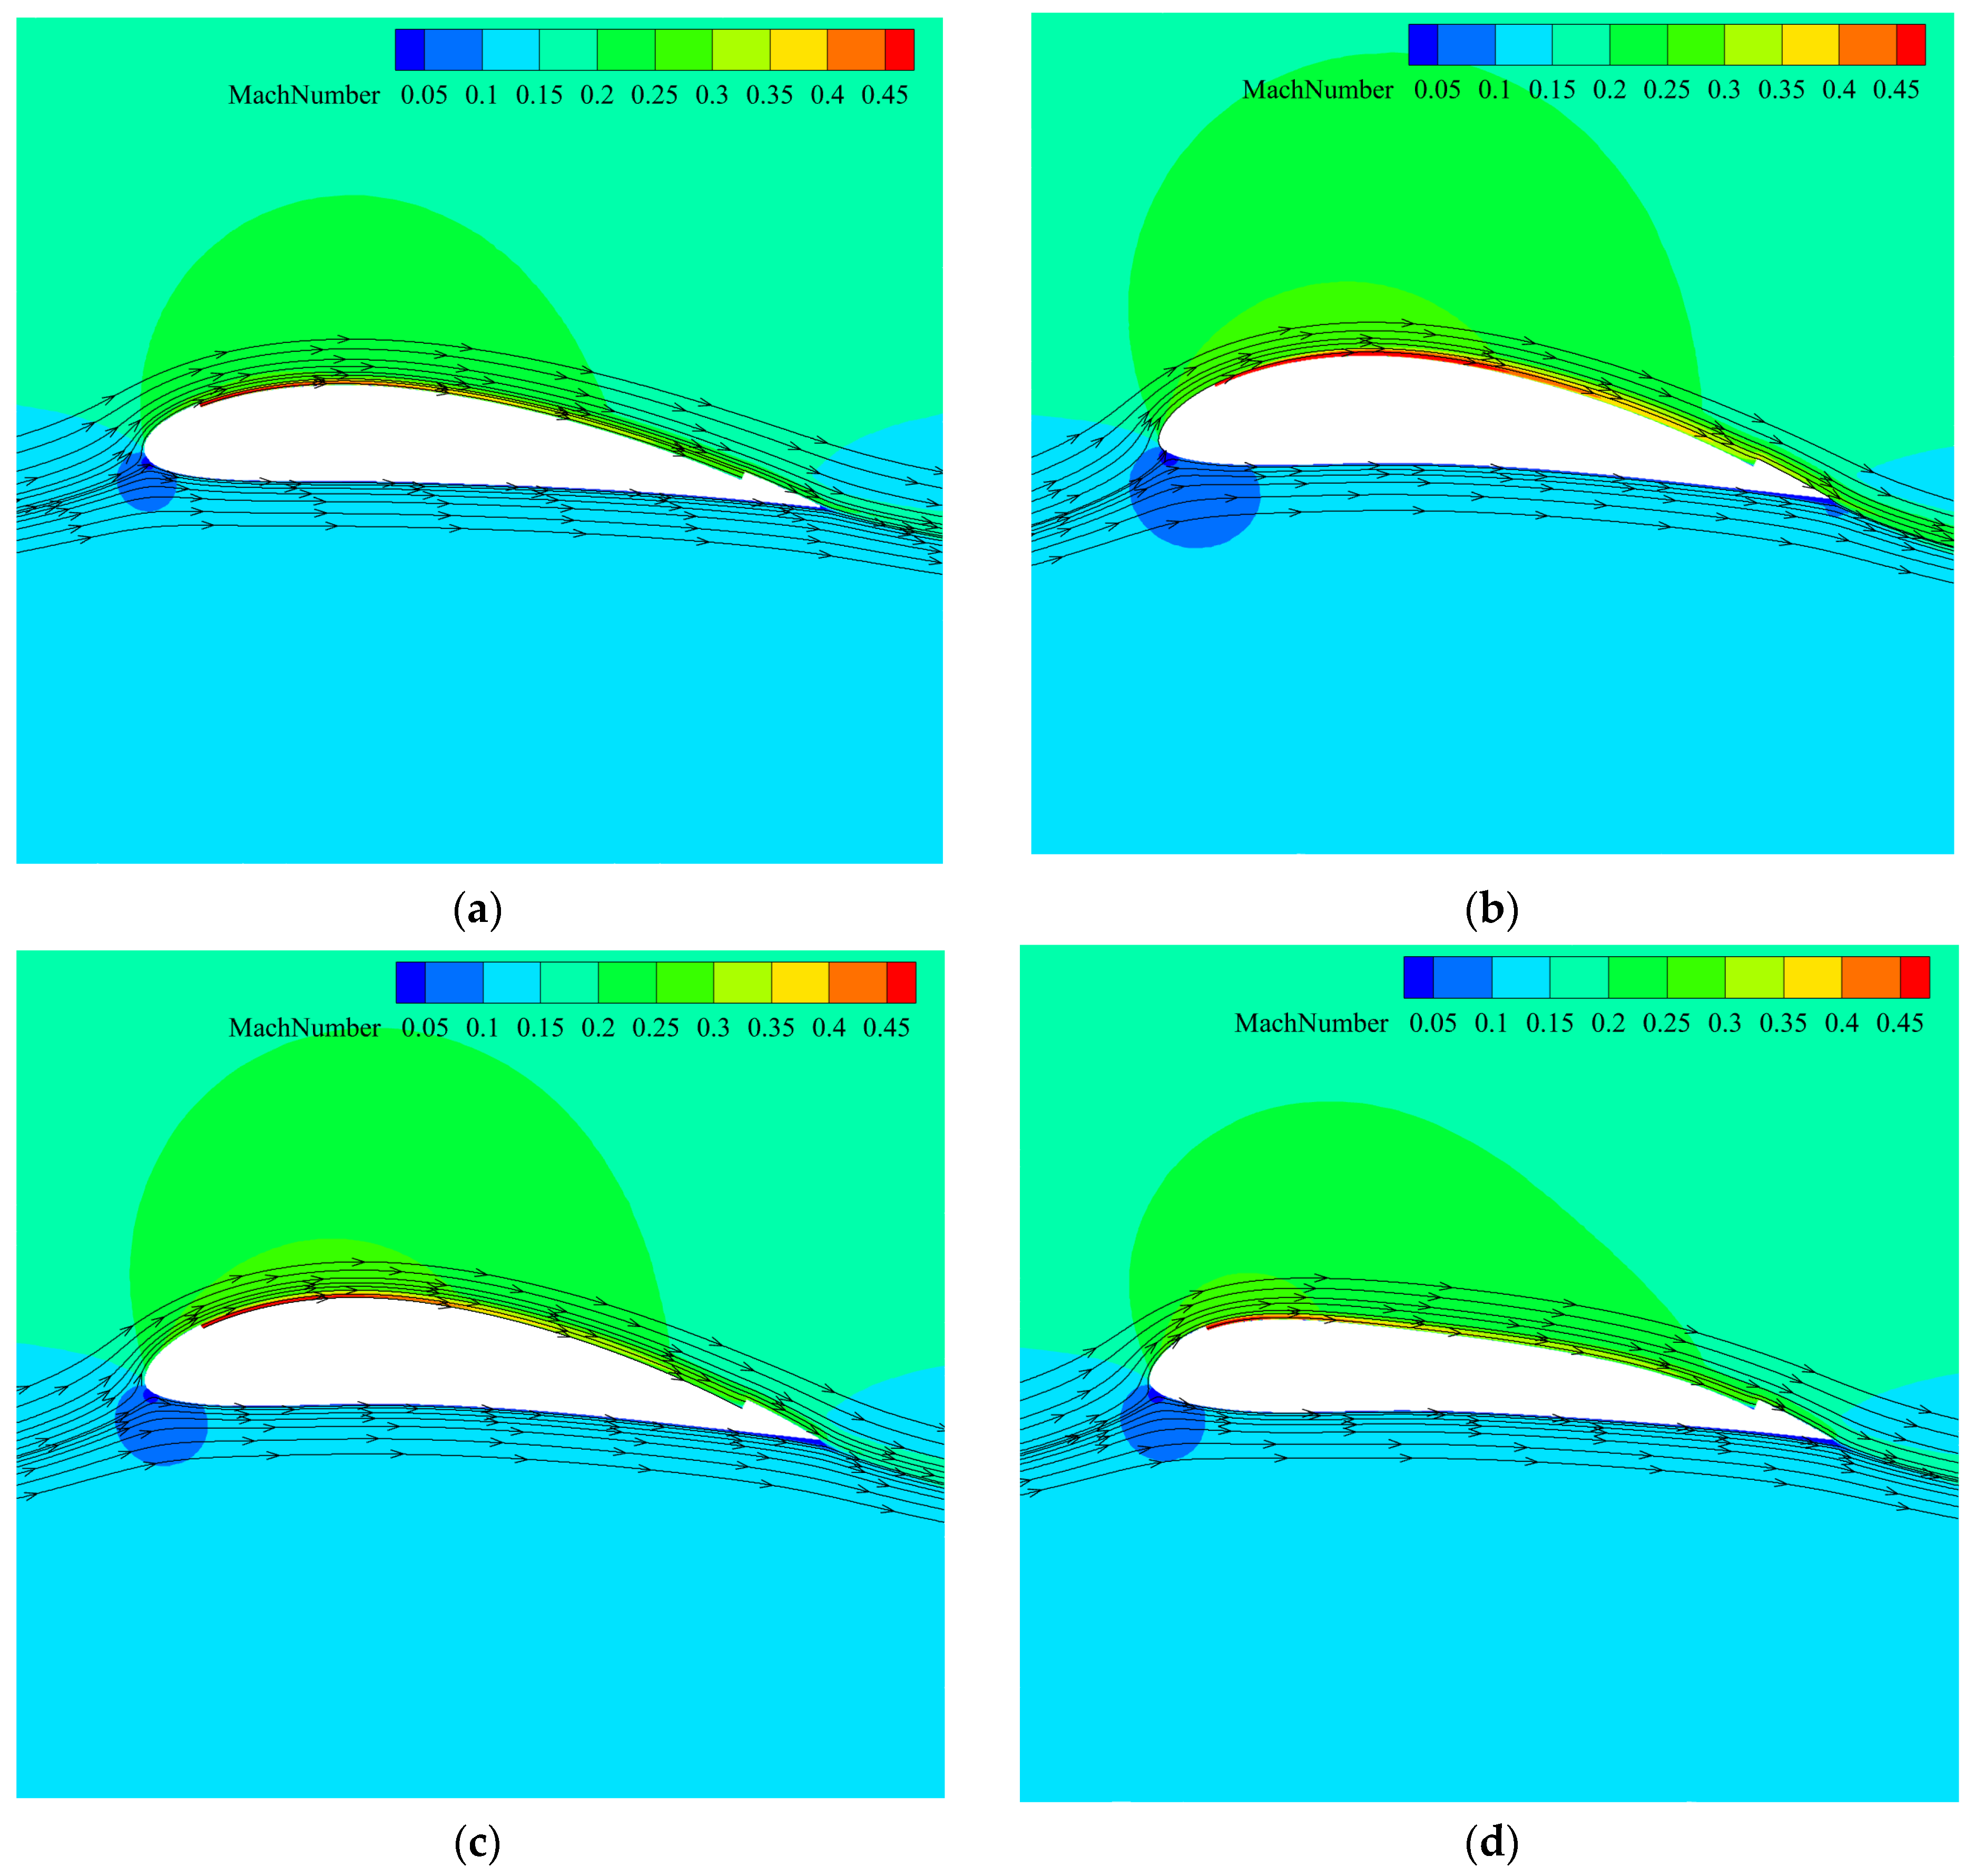
As shown in
Figure 13 and
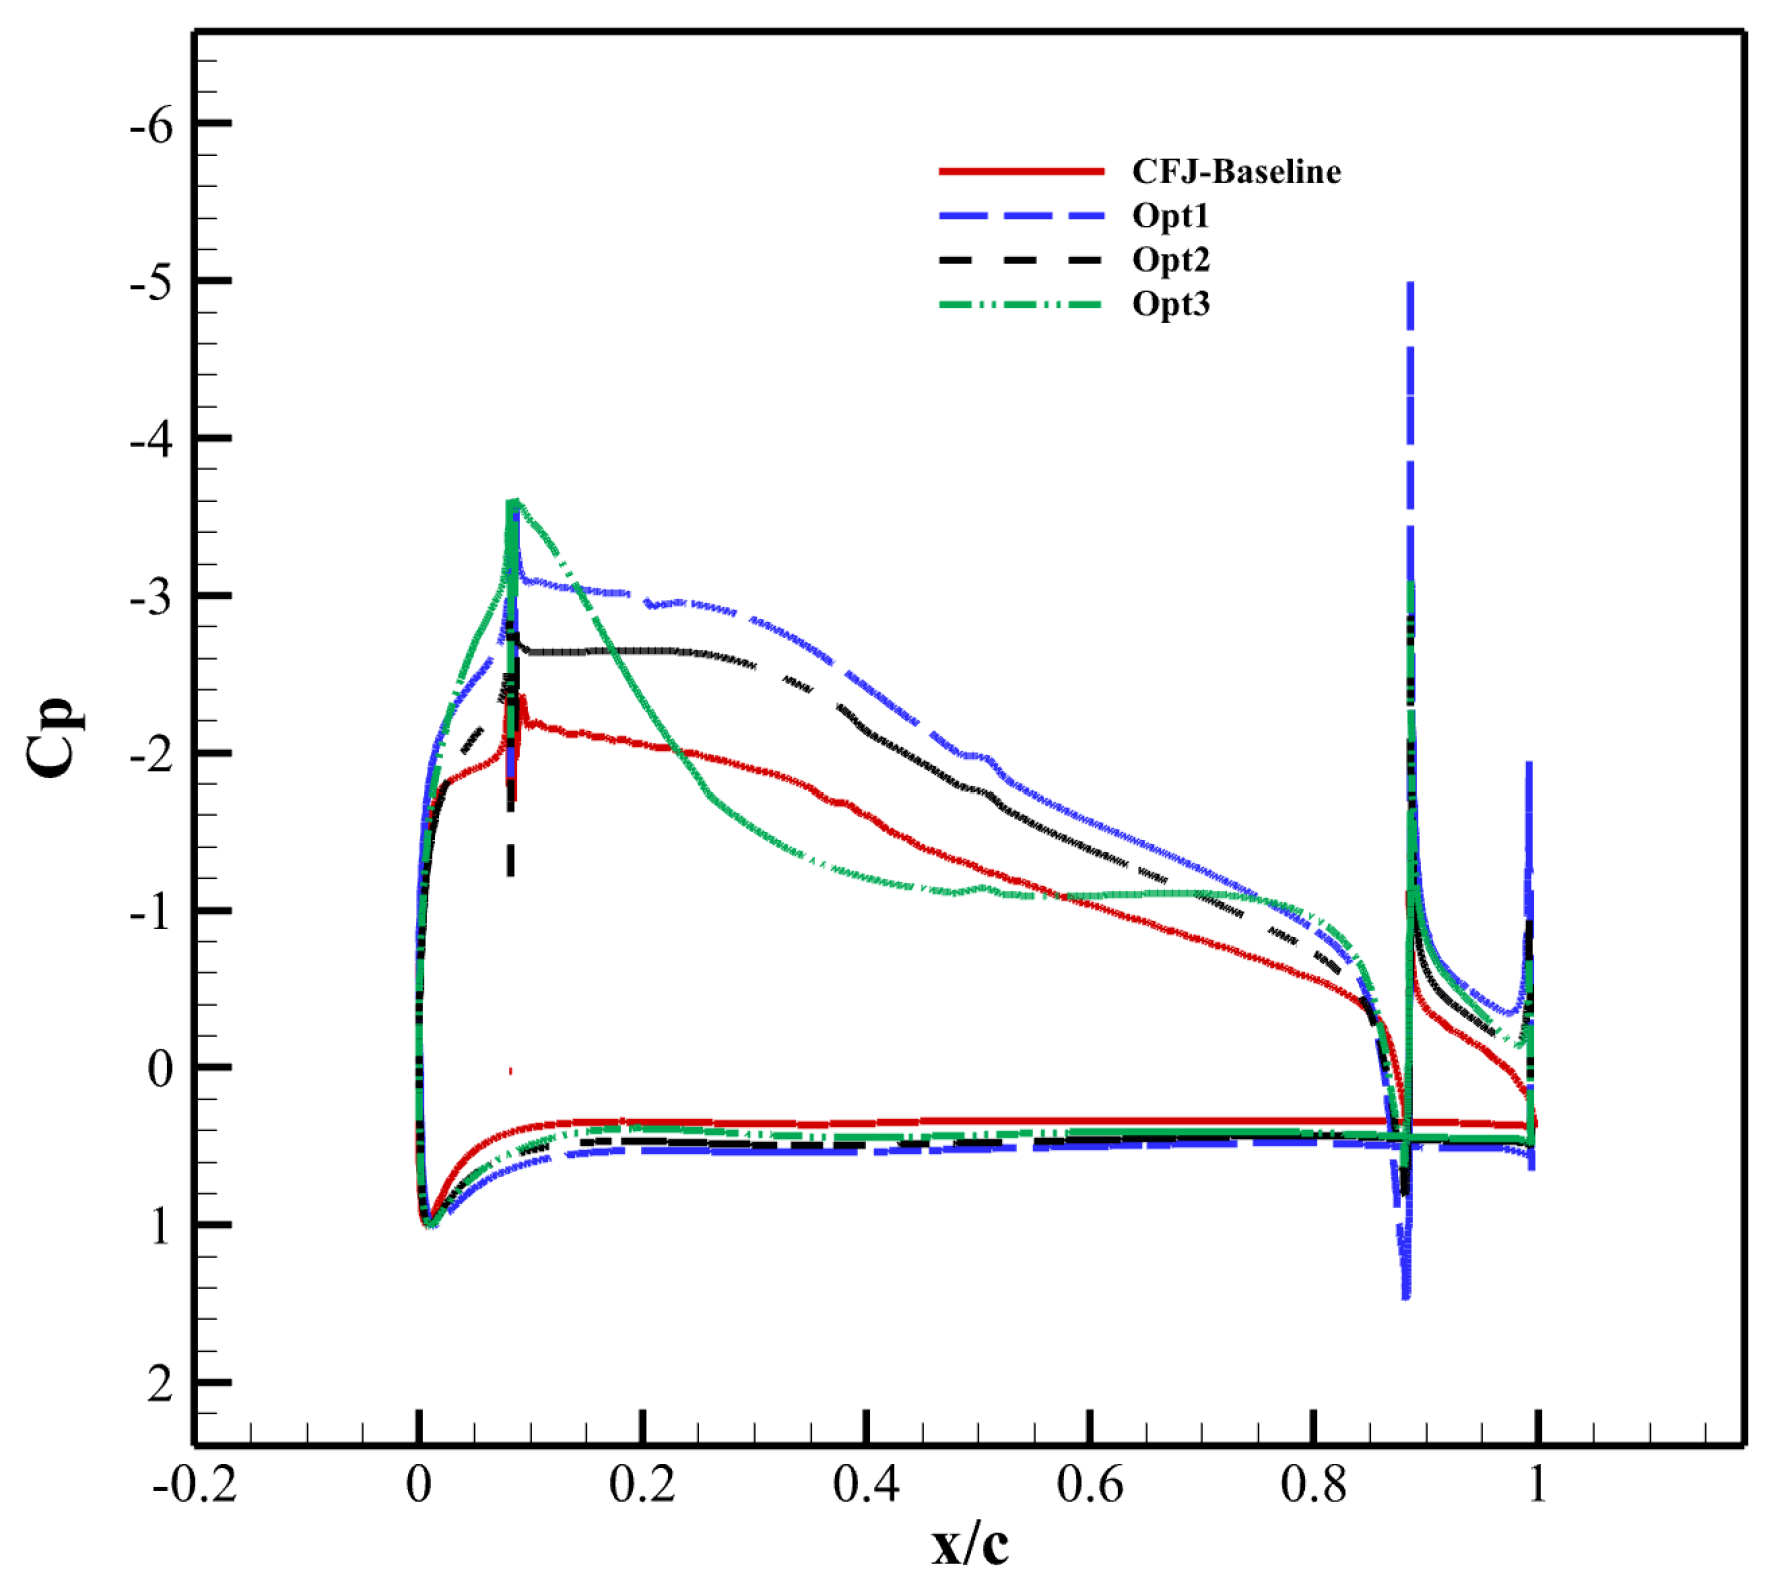
Figure 14, which present the Mach number contours, streamlines, and pressure coefficient (
) distribution plots for both the baseline and optimized airfoils, it is evident that the baseline airfoil exhibits a limited acceleration region on its upper surface. The flow control effect is relatively weak, as indicated by a smaller suction peak in the
distribution, reflecting limited airflow acceleration and a flow state that, while balanced, lacks significant lift enhancement capability.
Opt1 generates a large high-speed region on the upper surface, resulting in a substantial increase in the lift coefficient. As illustrated in the distribution, although Opt3 captures a higher localized peak right at the injection location, Opt1 maintains the highest and most sustained low-pressure platform across the chord from x/c = 0.1 to 0.8. However, the continuous momentum input required to maintain such high acceleration leads to a substantial increase in energy consumption.
Opt2 successfully enhances the upper-surface acceleration region while maintaining flow attachment; with a moderate suction peak and sustained low pressure across the mid-chord, it achieves a superior balance between aerodynamic performance and power consumption.
Opt3 demonstrates an intense velocity acceleration concentrated near the leading-edge injection slot, creating the highest localized suction peak in the distribution around x/c = 0.08. Downstream of this peak, the airflow acceleration tapers off uniformly along the upper surface, maintaining stable flow with minimal momentum input, thereby achieving the lowest effective drag coefficient and the highest effective lift-to-drag ratio.
These results demonstrate that an optimal CFJ configuration and jet input can achieve an effective trade-off between aerodynamic performance and energy consumption by coordinating the Mach number distribution, flow field structure, and pressure gradient variations.
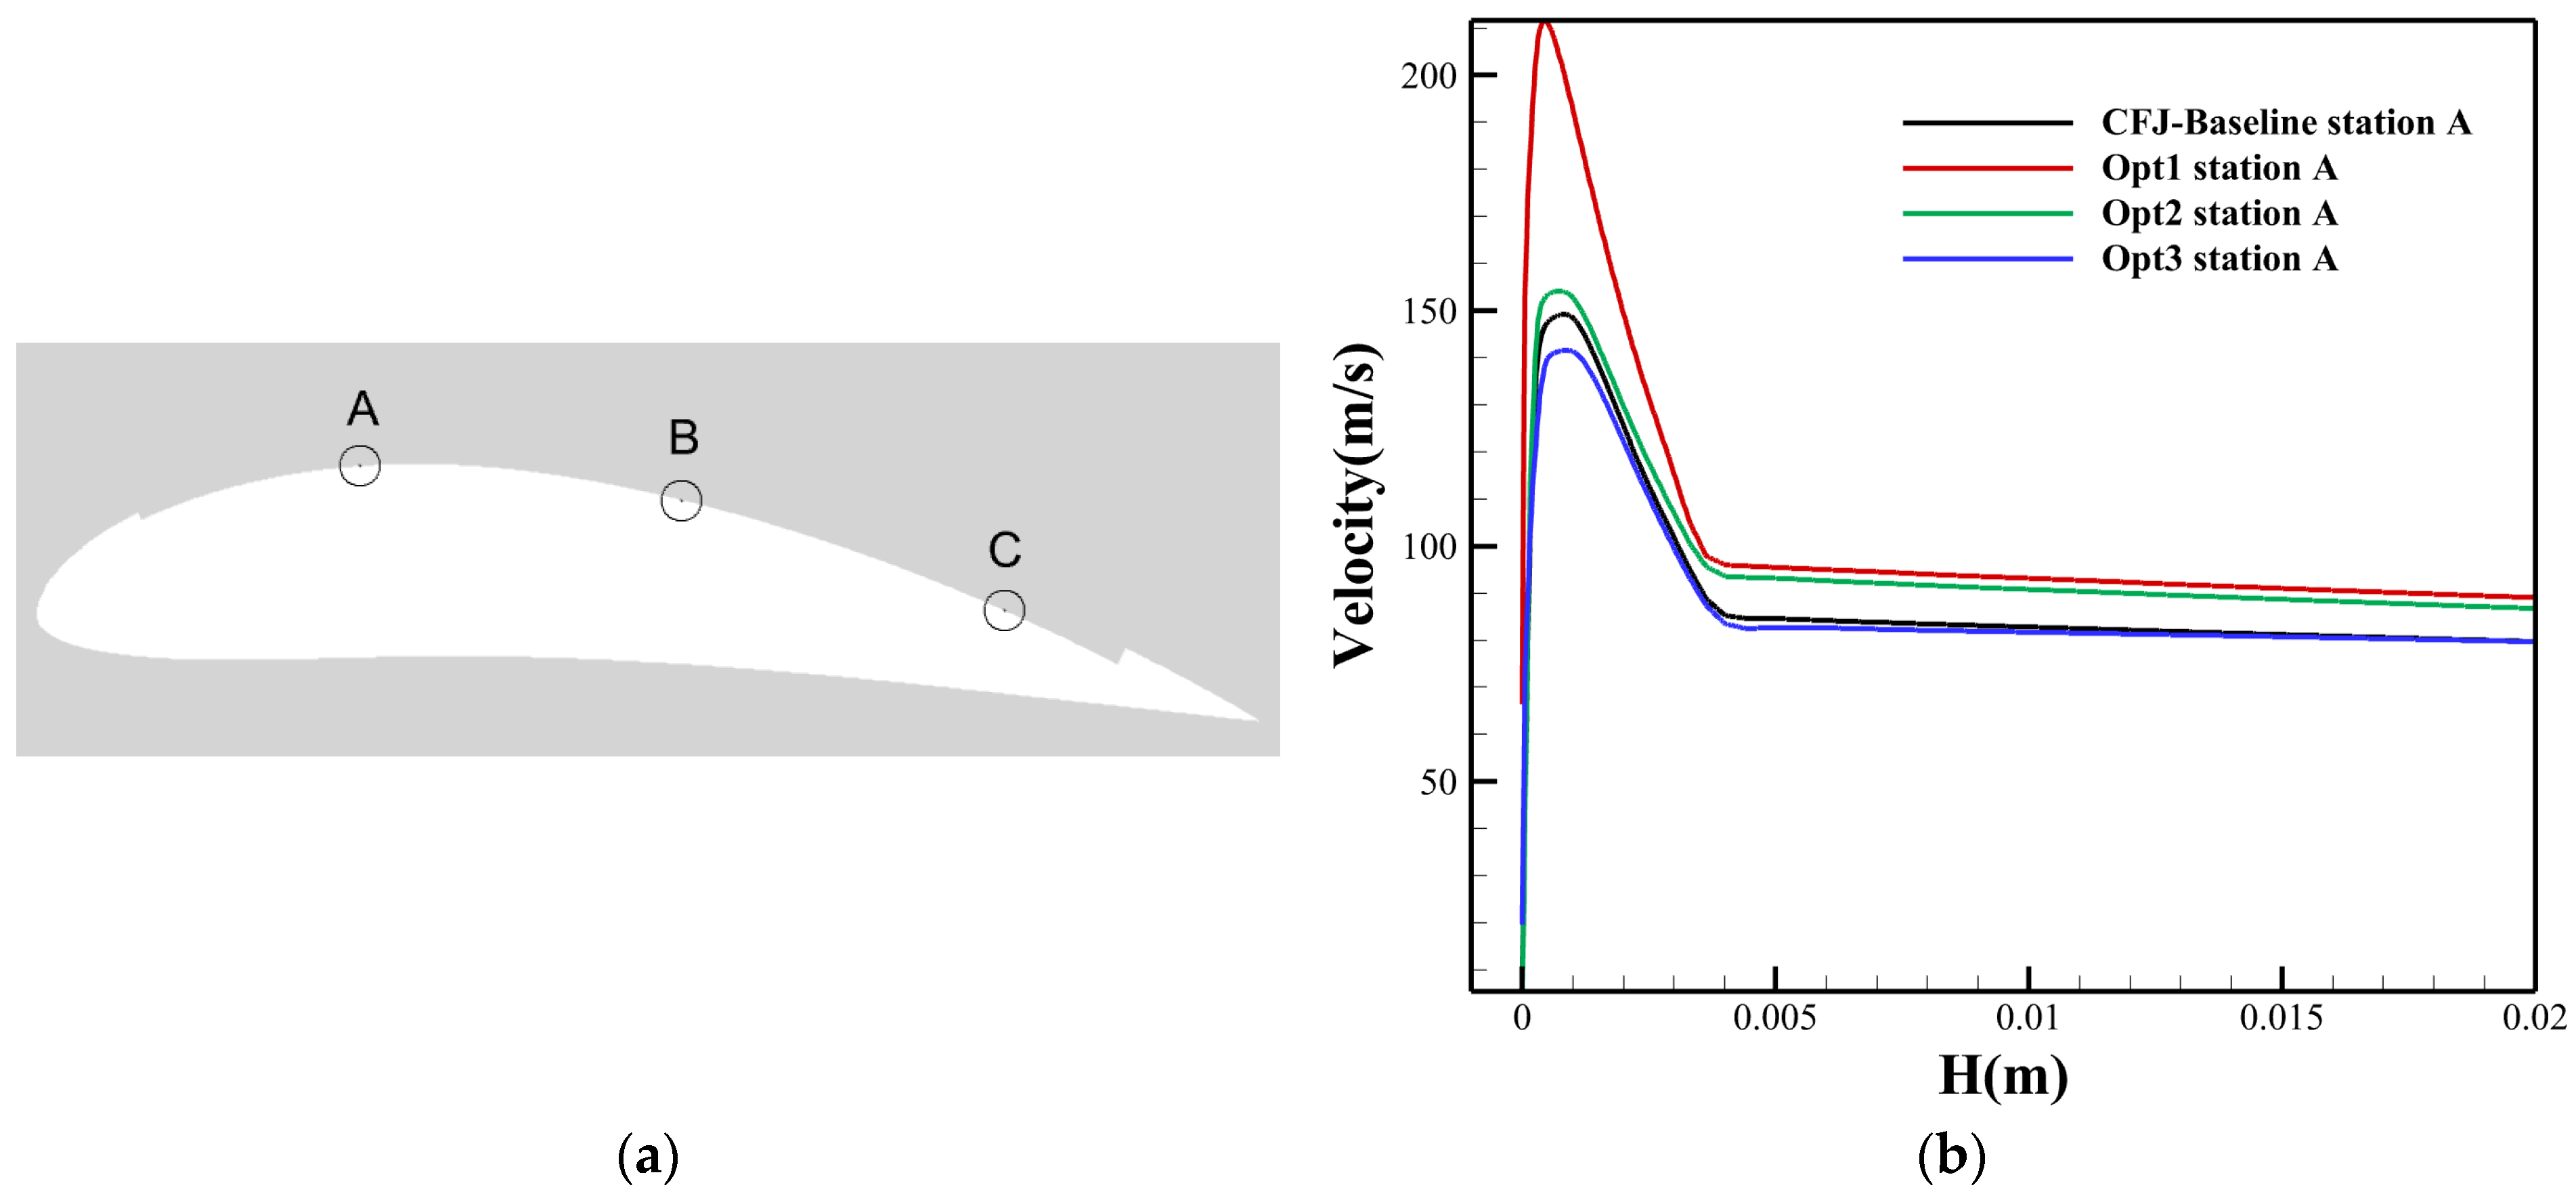
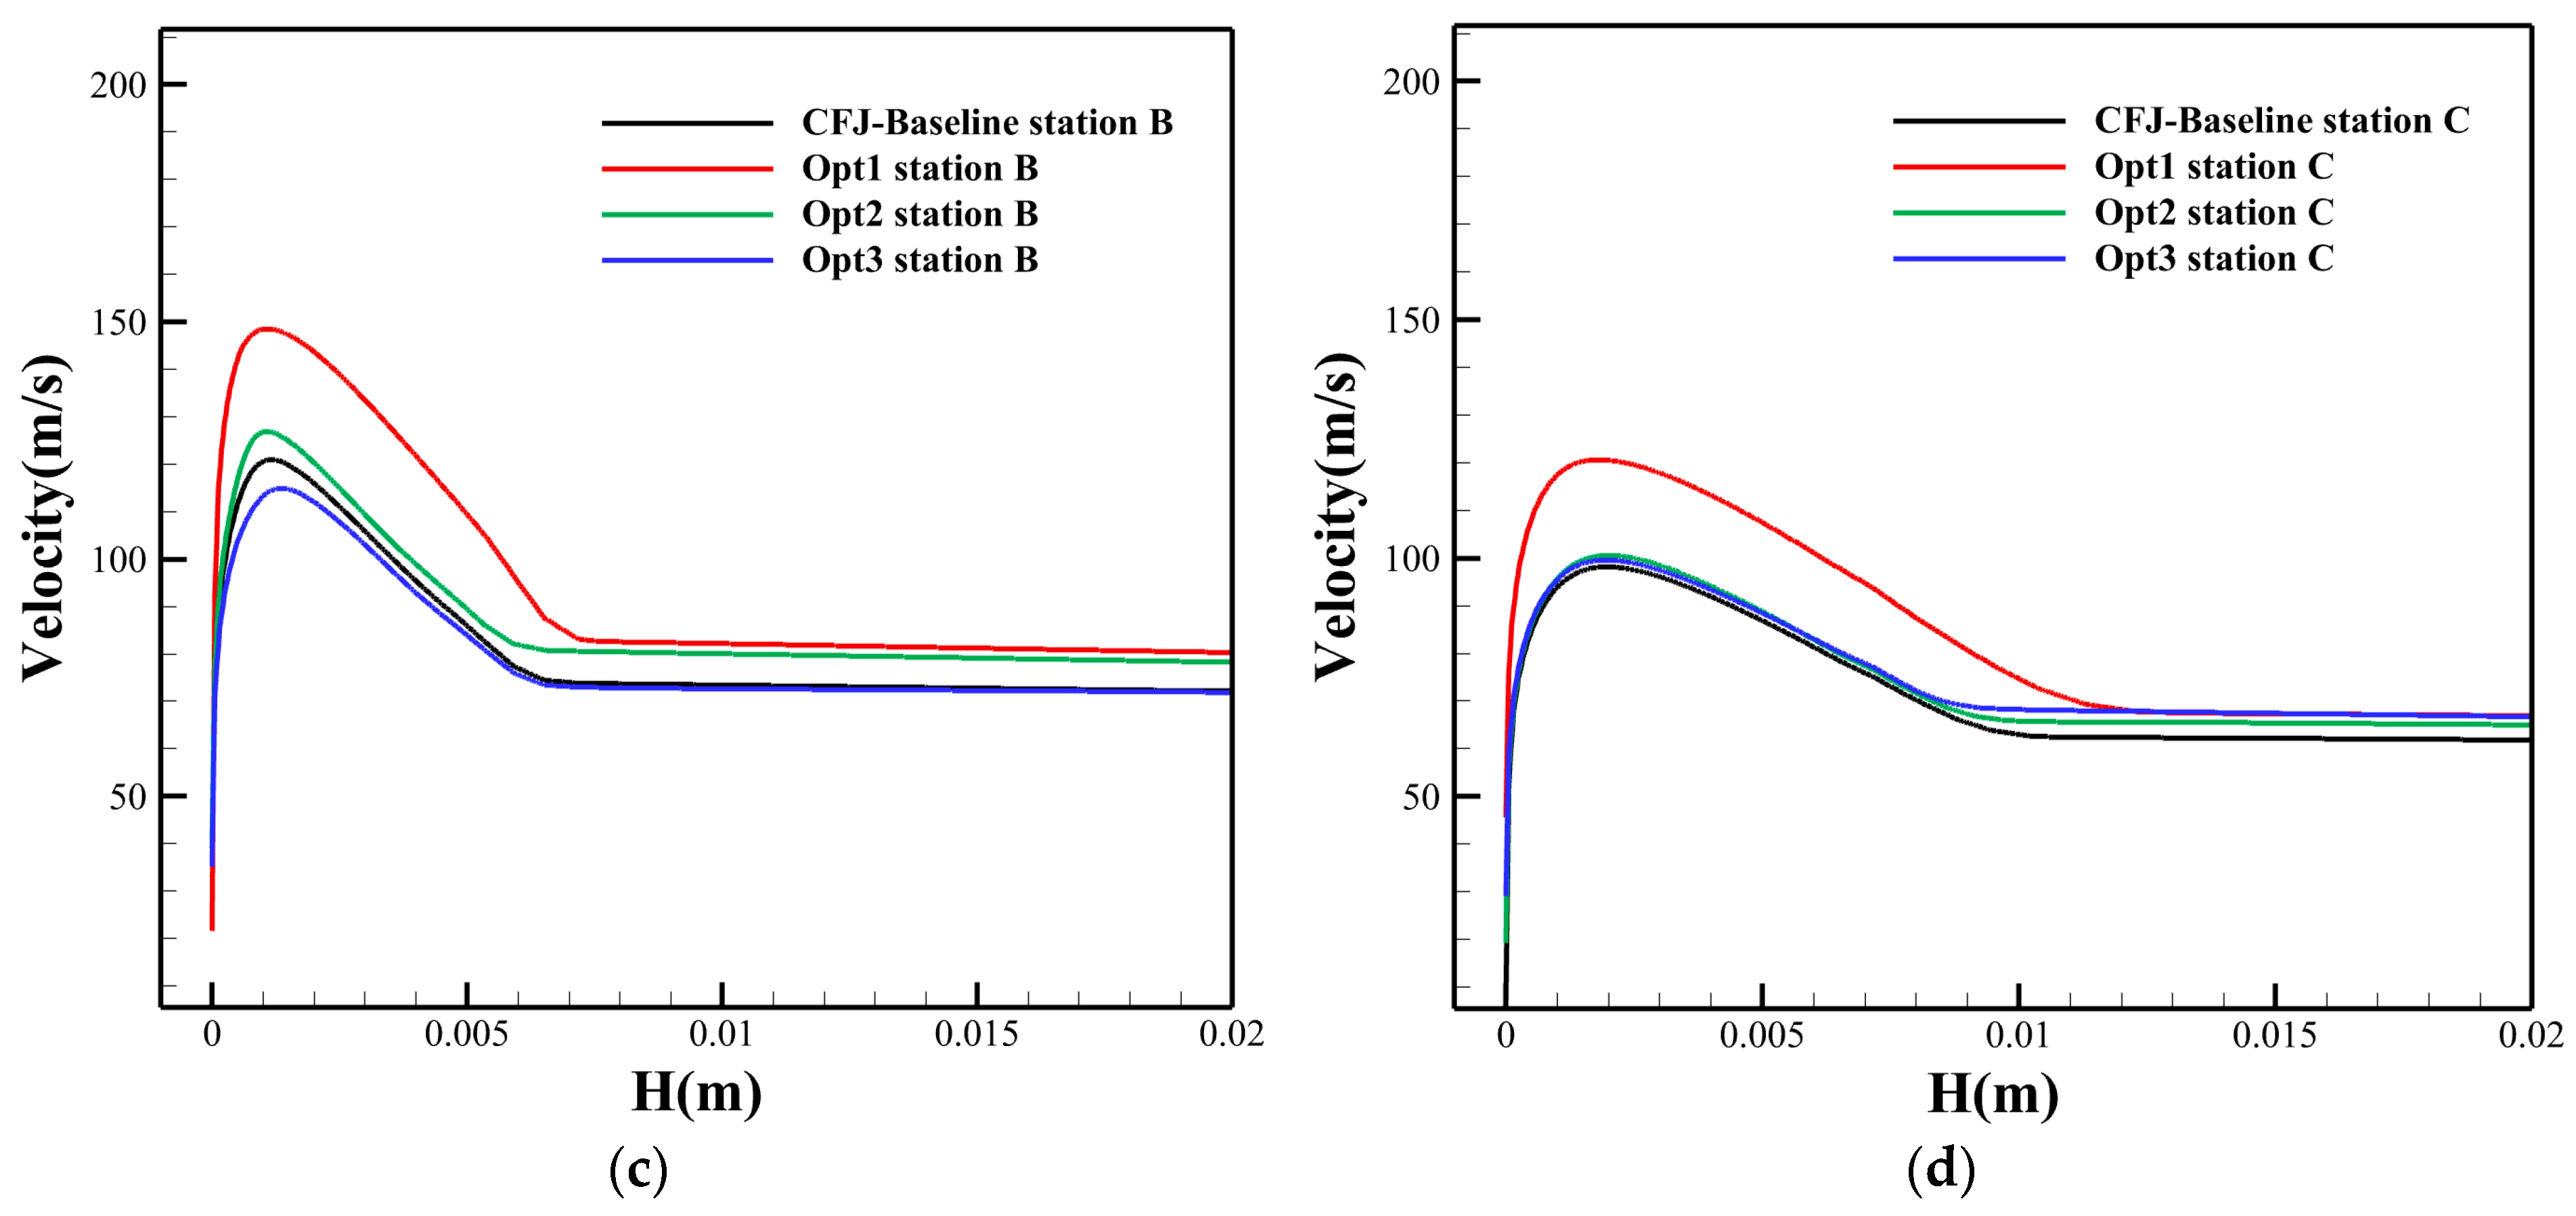
To further examine the boundary-layer behavior associated with the extended low-pressure region of Opt1, velocity profiles normal to the upper surface were extracted at three chordwise stations, namely station A at x/
c = 26.2%, station B at x/
c = 52.5%, and station C at x/
c = 78.7%, as shown in
Figure 15. Here, H denotes the wall-normal distance from the airfoil surface, and Vel denotes the local velocity magnitude.
As shown in
Figure 15, Opt1 exhibits significantly higher velocity levels near the upper surface than the CFJ-Baseline, Opt2, and Opt3 at all three chordwise stations. This tendency is particularly pronounced at stations A and B, where the velocity peak and the near-wall velocity level of Opt1 are significantly higher than those of the other configurations. At station C, although the difference becomes smaller, Opt1 still maintains a higher velocity level over the upper surface. These results indicate that the extended low-pressure region of Opt1 is accompanied by stronger flow acceleration.
The higher boundary-layer velocity of Opt1 is consistent with its lift-oriented design feature. Stronger acceleration over the suction surface enhances the pressure difference between the upper and lower surfaces and contributes to the increase in lift coefficient. However, this improvement is achieved with stronger CFJ actuation and higher power consumption, which is consistent with the increased power coefficient and the reduced effective lift-to-drag ratio of Opt1 discussed above.
Since the power consumption of a practical CFJ system depends on the efficiency of the internal compressor, a parametric analysis was further conducted to evaluate the influence of compressor efficiency on the energy-related performance. In the baseline optimization, the compressor efficiency was set to
η = 100% to focus on the aerodynamic coupling between the airfoil geometry and CFJ parameters, which is consistent with previous CFJ numerical studies [
24]. Previous studies also reported that typical micro-compressors for aerospace applications can achieve efficiencies of approximately 85%, and the efficiency may be even higher for larger-scale applications [
34]. Therefore, four compressor efficiencies, namely
η = 85%, 90%, 95%, and 100%, were considered in the present sensitivity analysis.
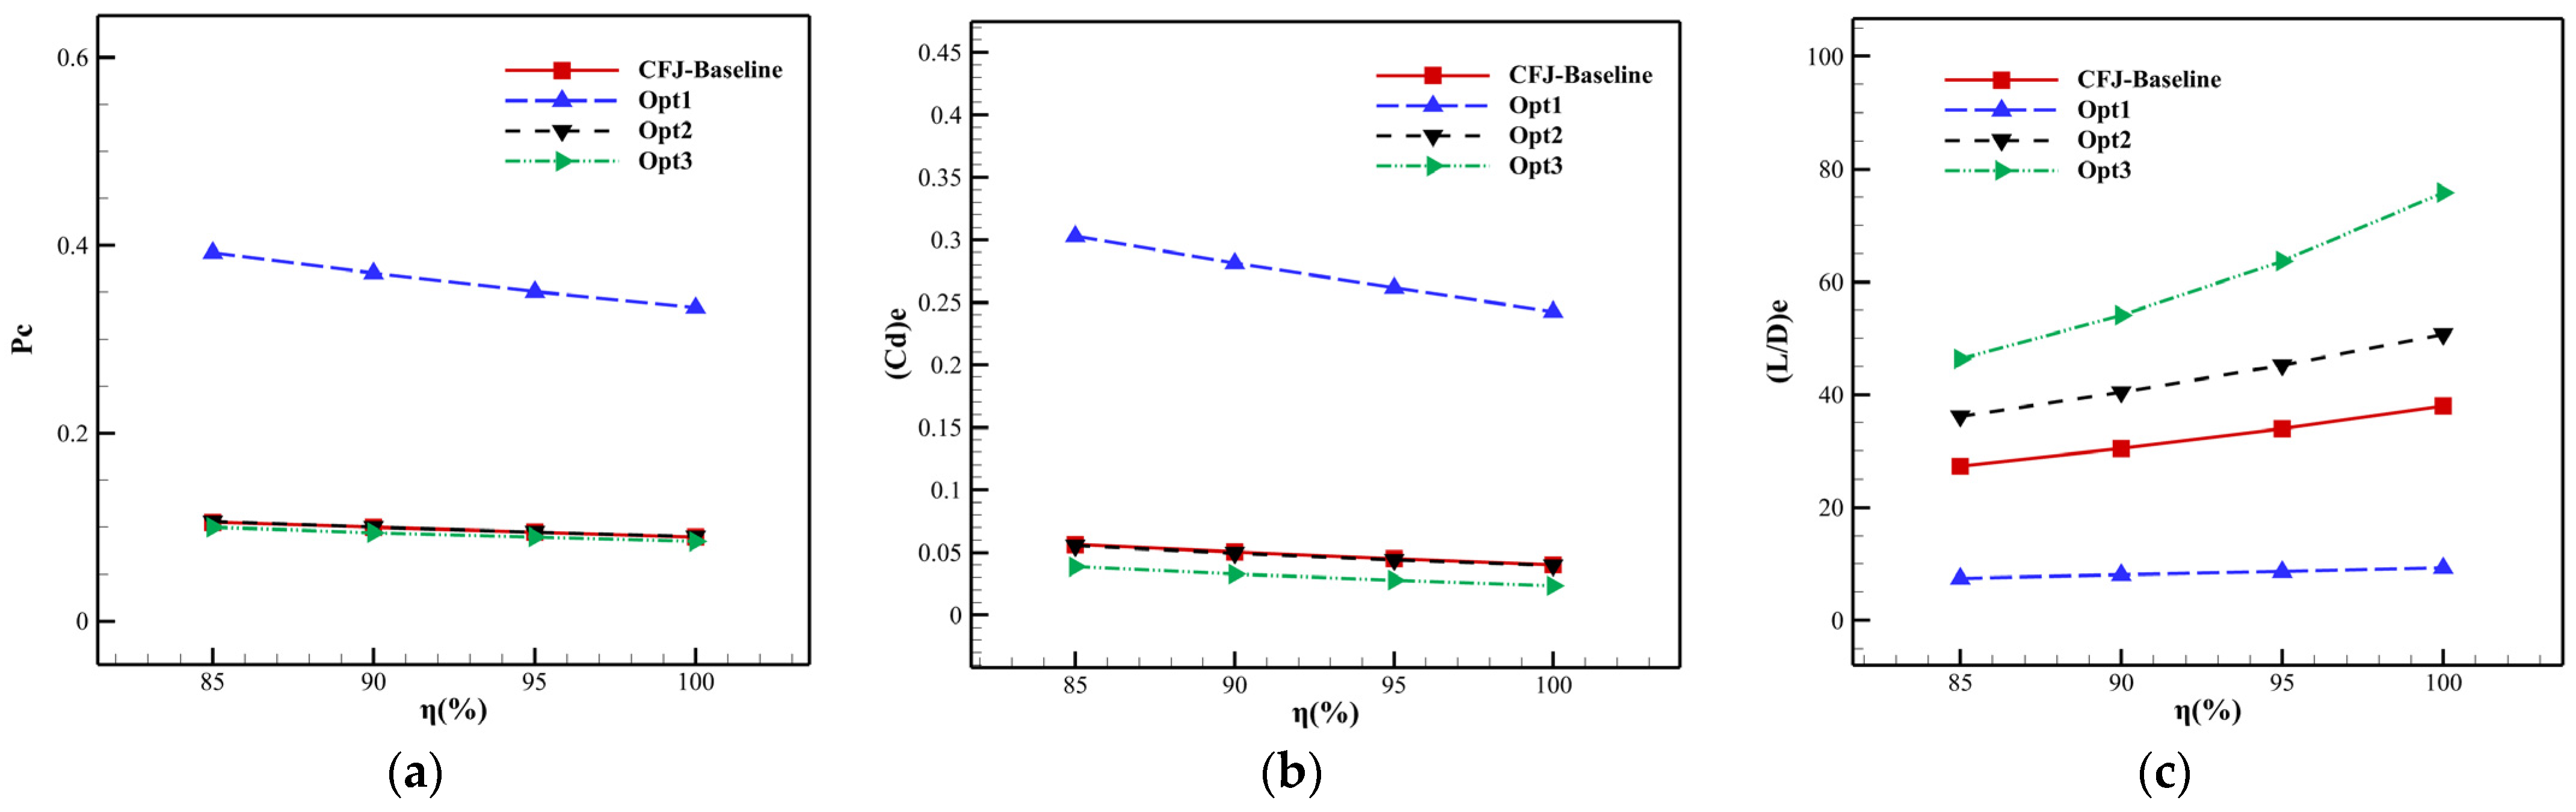
For a given CFJ configuration and a fixed nominal jet momentum coefficient, changing the compressor efficiency does not alter the external aerodynamic flow field. Therefore, the lift coefficient and aerodynamic drag coefficient remain unchanged. The influence of
η is reflected in the power coefficient, effective drag coefficient, and effective lift-to-drag ratio. As shown in
Figure 16, decreasing
η increases the power coefficient and the effective drag coefficient, and consequently reduces the effective lift-to-drag ratio.
For all CFJ configurations, the effective lift-to-drag ratio decreases as the compressor efficiency decreases. This trend is most evident for Opt1 because it has the largest power coefficient and is therefore more sensitive to compressor efficiency. Nevertheless, Opt1 remains a lift-oriented configuration rather than an energy-efficiency-oriented design. For Opt2 and Opt3, the decrease in compressor efficiency also reduces the effective lift-to-drag ratio, but their relative advantages over the CFJ-Baseline are retained. In particular, Opt3 maintains the highest effective lift-to-drag ratio among all configurations even when η is reduced to 85%, indicating that its energy-efficiency-oriented characteristic remains valid under realistic compressor-efficiency assumptions.
These results indicate that the ideal compressor-efficiency assumption affects the absolute value of the effective lift-to-drag ratio but does not change the main performance ranking of the representative Pareto solutions.
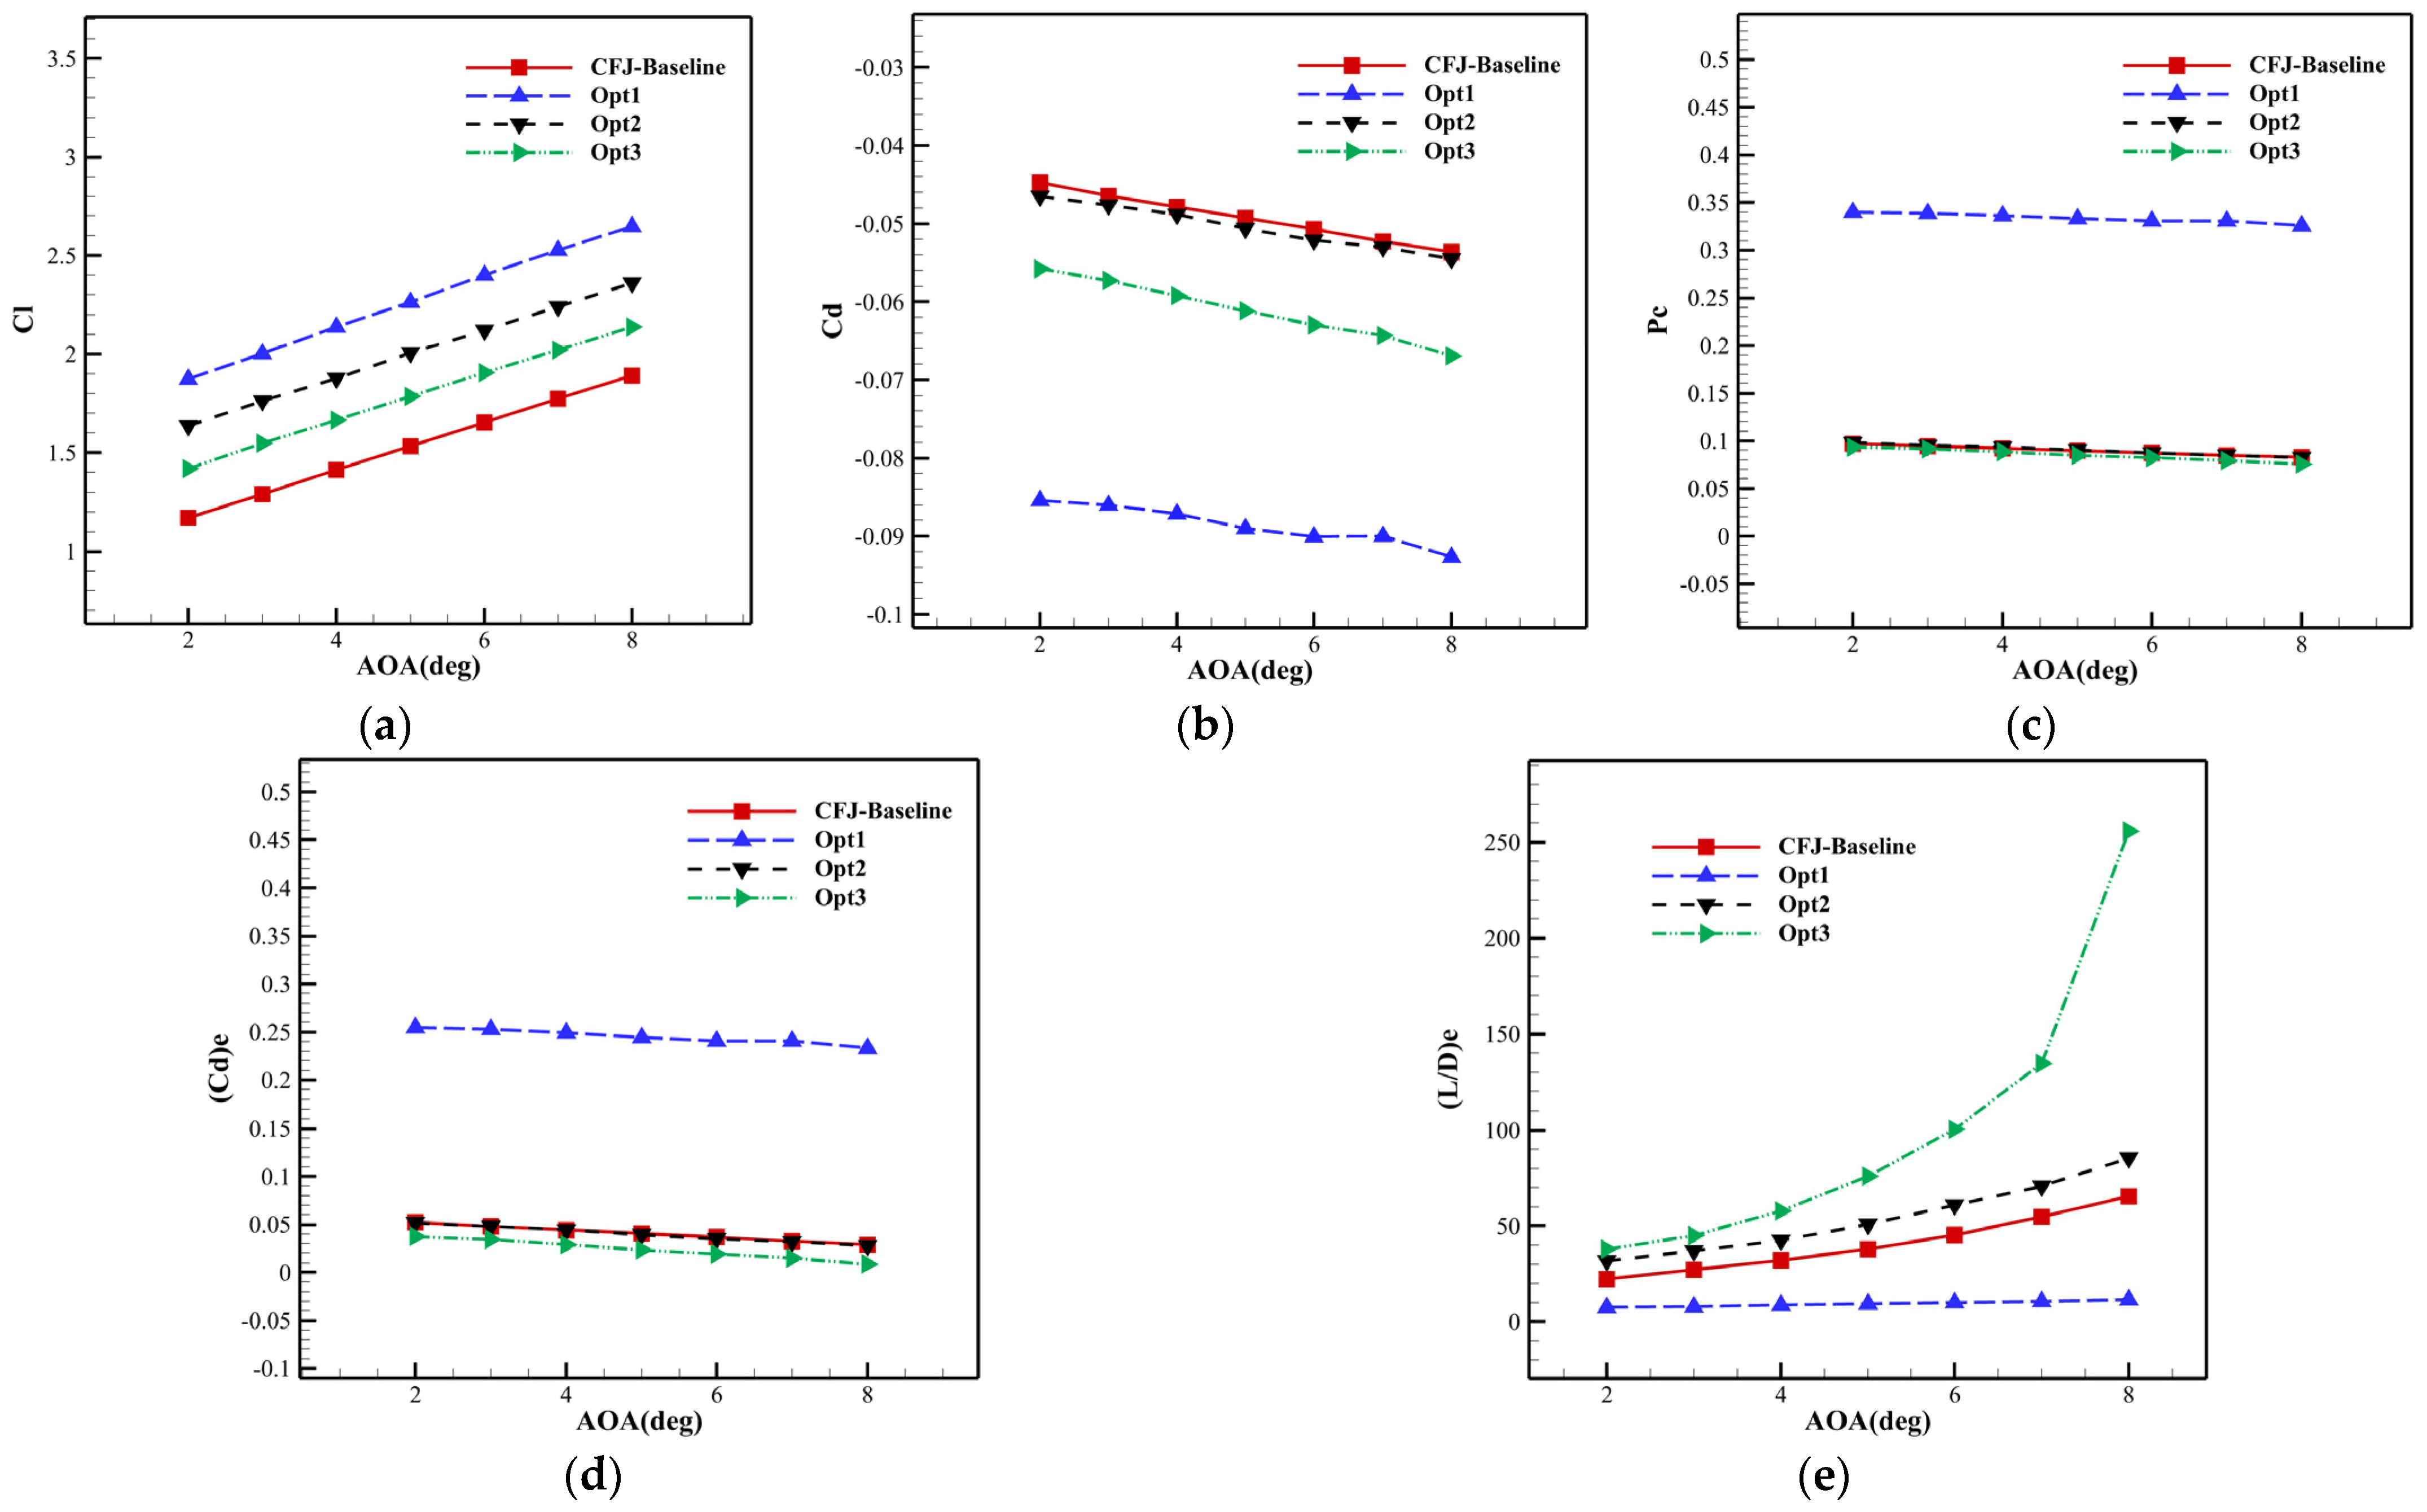
Given the inherent flexibility of active flow control, the full-envelope performance of the CFJ airfoil is determined by the coupling between its geometric configuration and jet intensity. For the optimization design proposed in this study, the primary focus is on its stability near the design operating condition. Therefore, its aerodynamic robustness is validated through numerical simulations across a specific range of angles of attack, while high-angle-of-attack conditions are managed by modulating the jet control intensity.
As shown in
Figure 17, the variations in aerodynamic coefficients for both the baseline and optimized airfoils are presented across the angle of attack range of 2°~8°. In summary, within this range, all optimized CFJ airfoils demonstrate excellent aerodynamic robustness and stable performance trends. Opt1 exhibits strong lift-enhancement control characteristics; Opt2 achieves a balanced trade-off between lift enhancement and energy consumption; and Opt3 demonstrates high-efficiency flow control advantages, characterized by the lowest effective drag and the highest effective lift-to-drag ratio. These results further indicate that a reasonable matching of CFJ geometric parameters and jet intensity can achieve stable and efficient aerodynamic performance near the design operating condition.
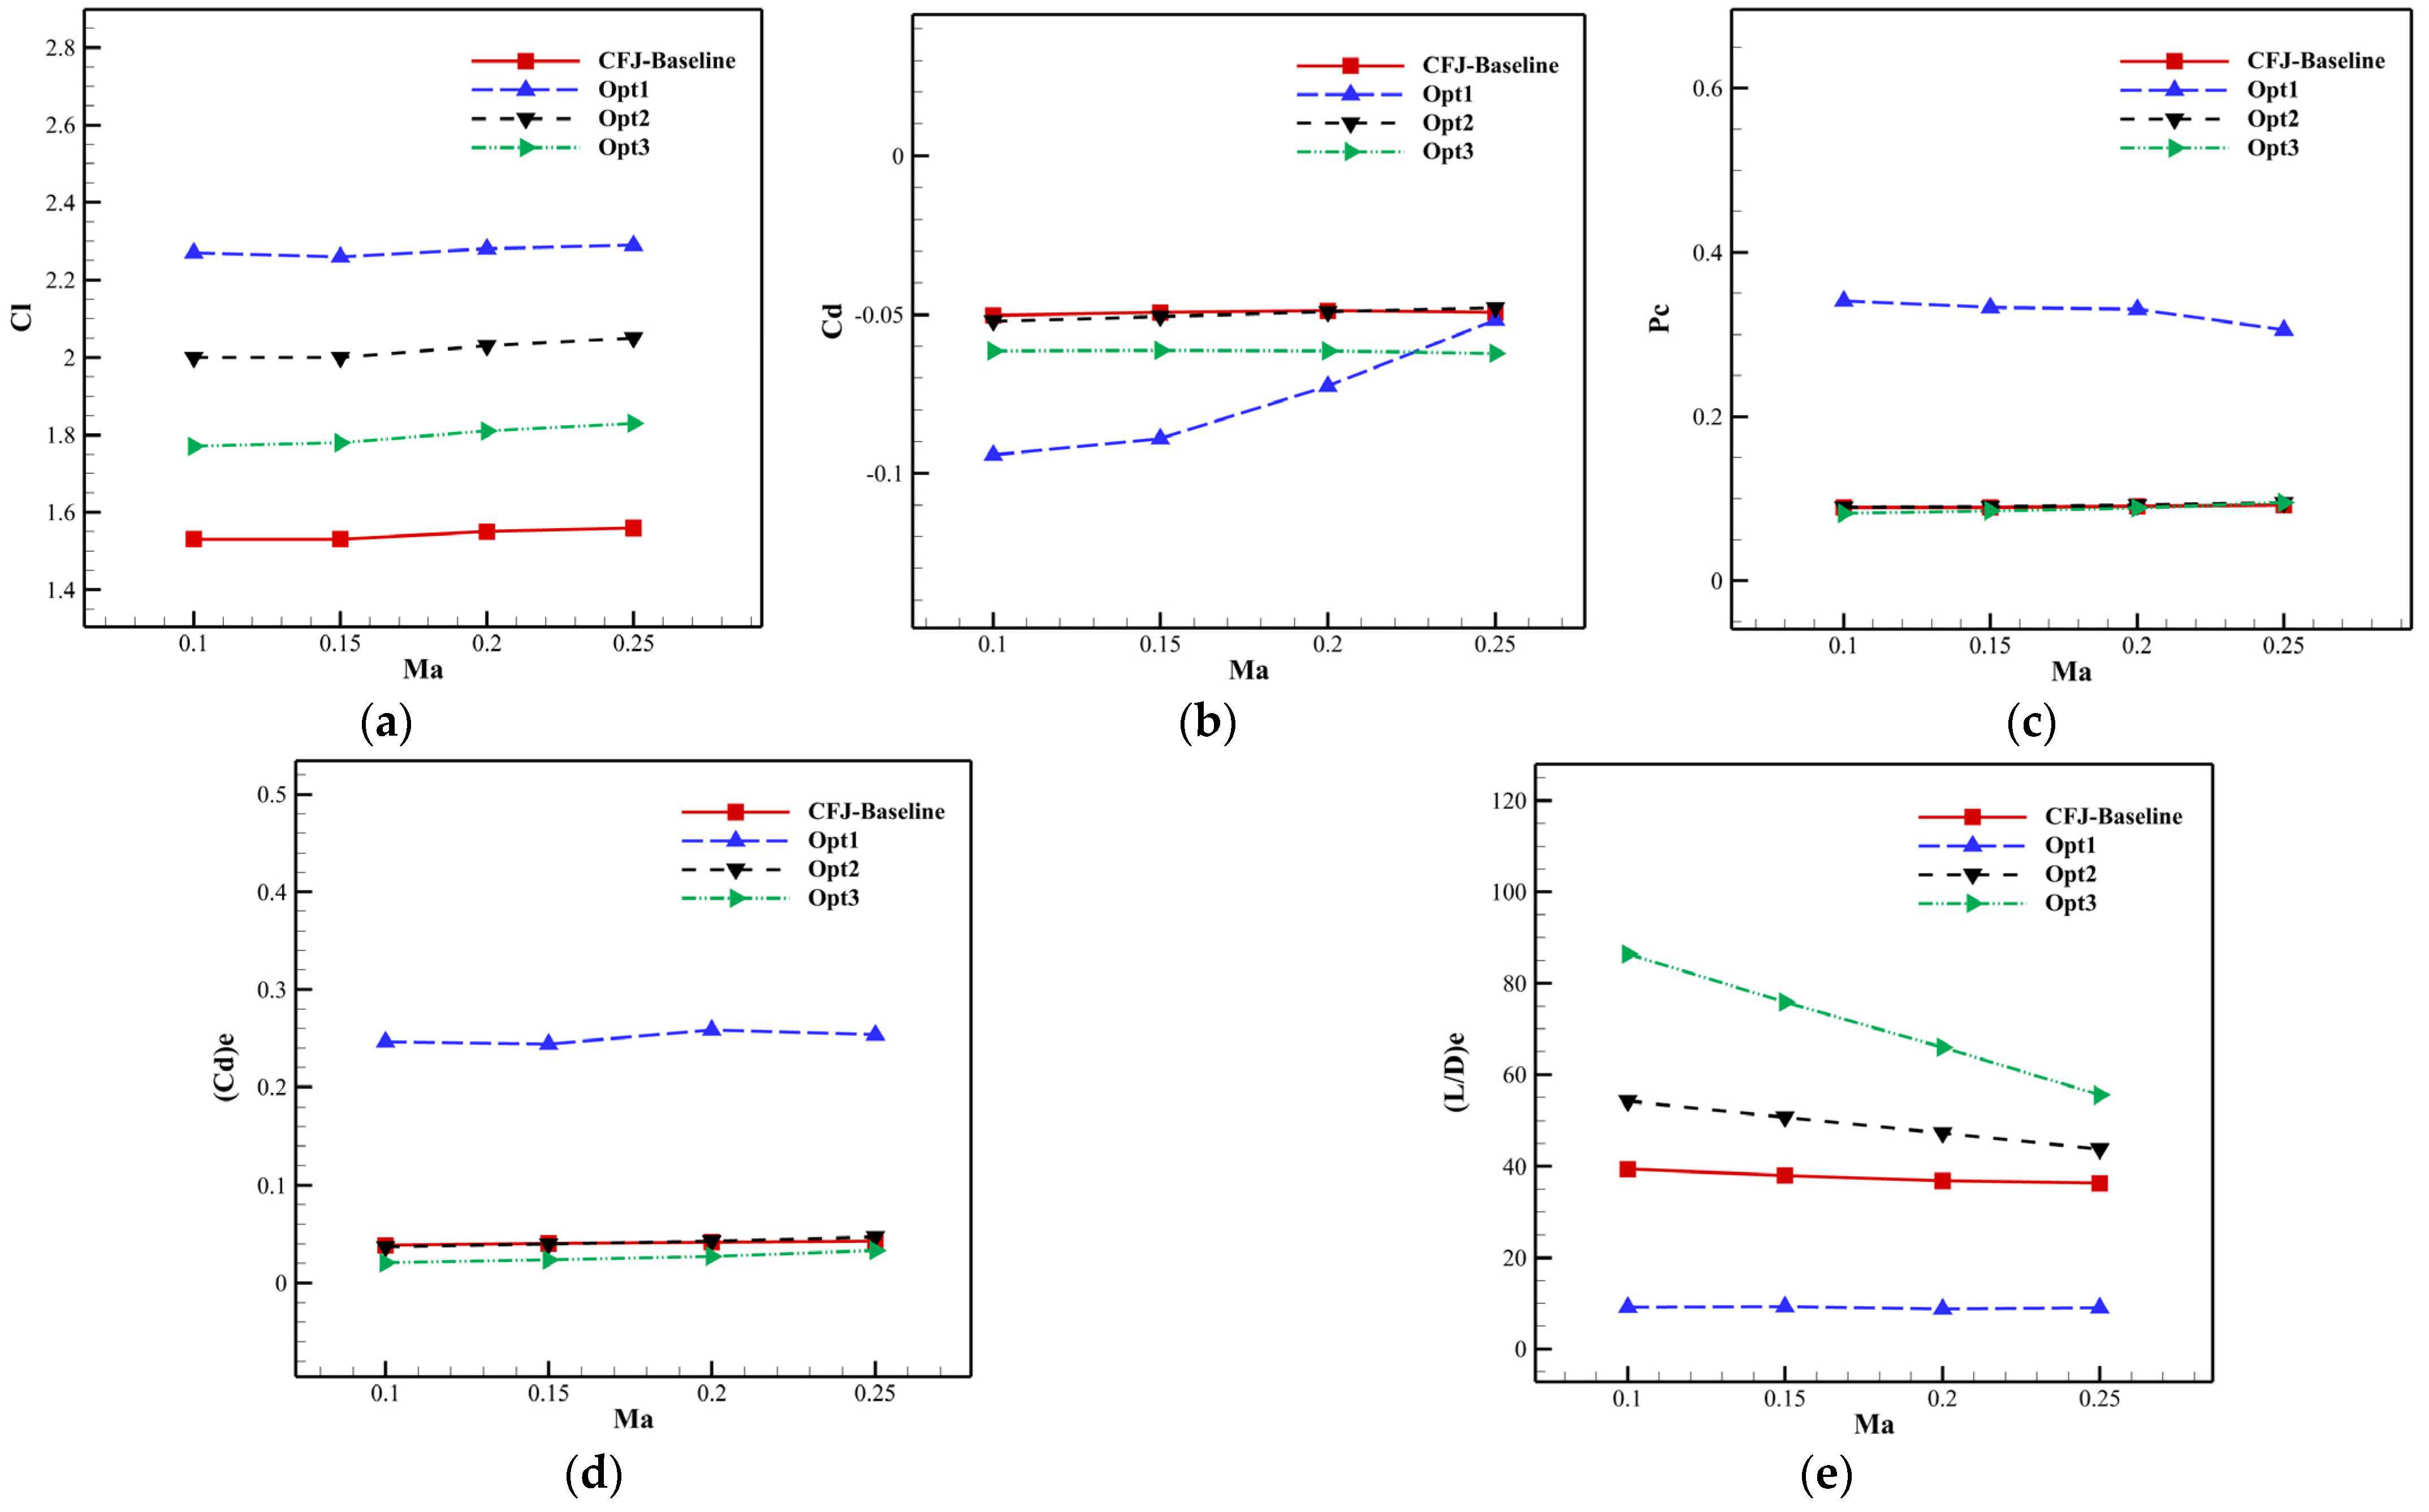
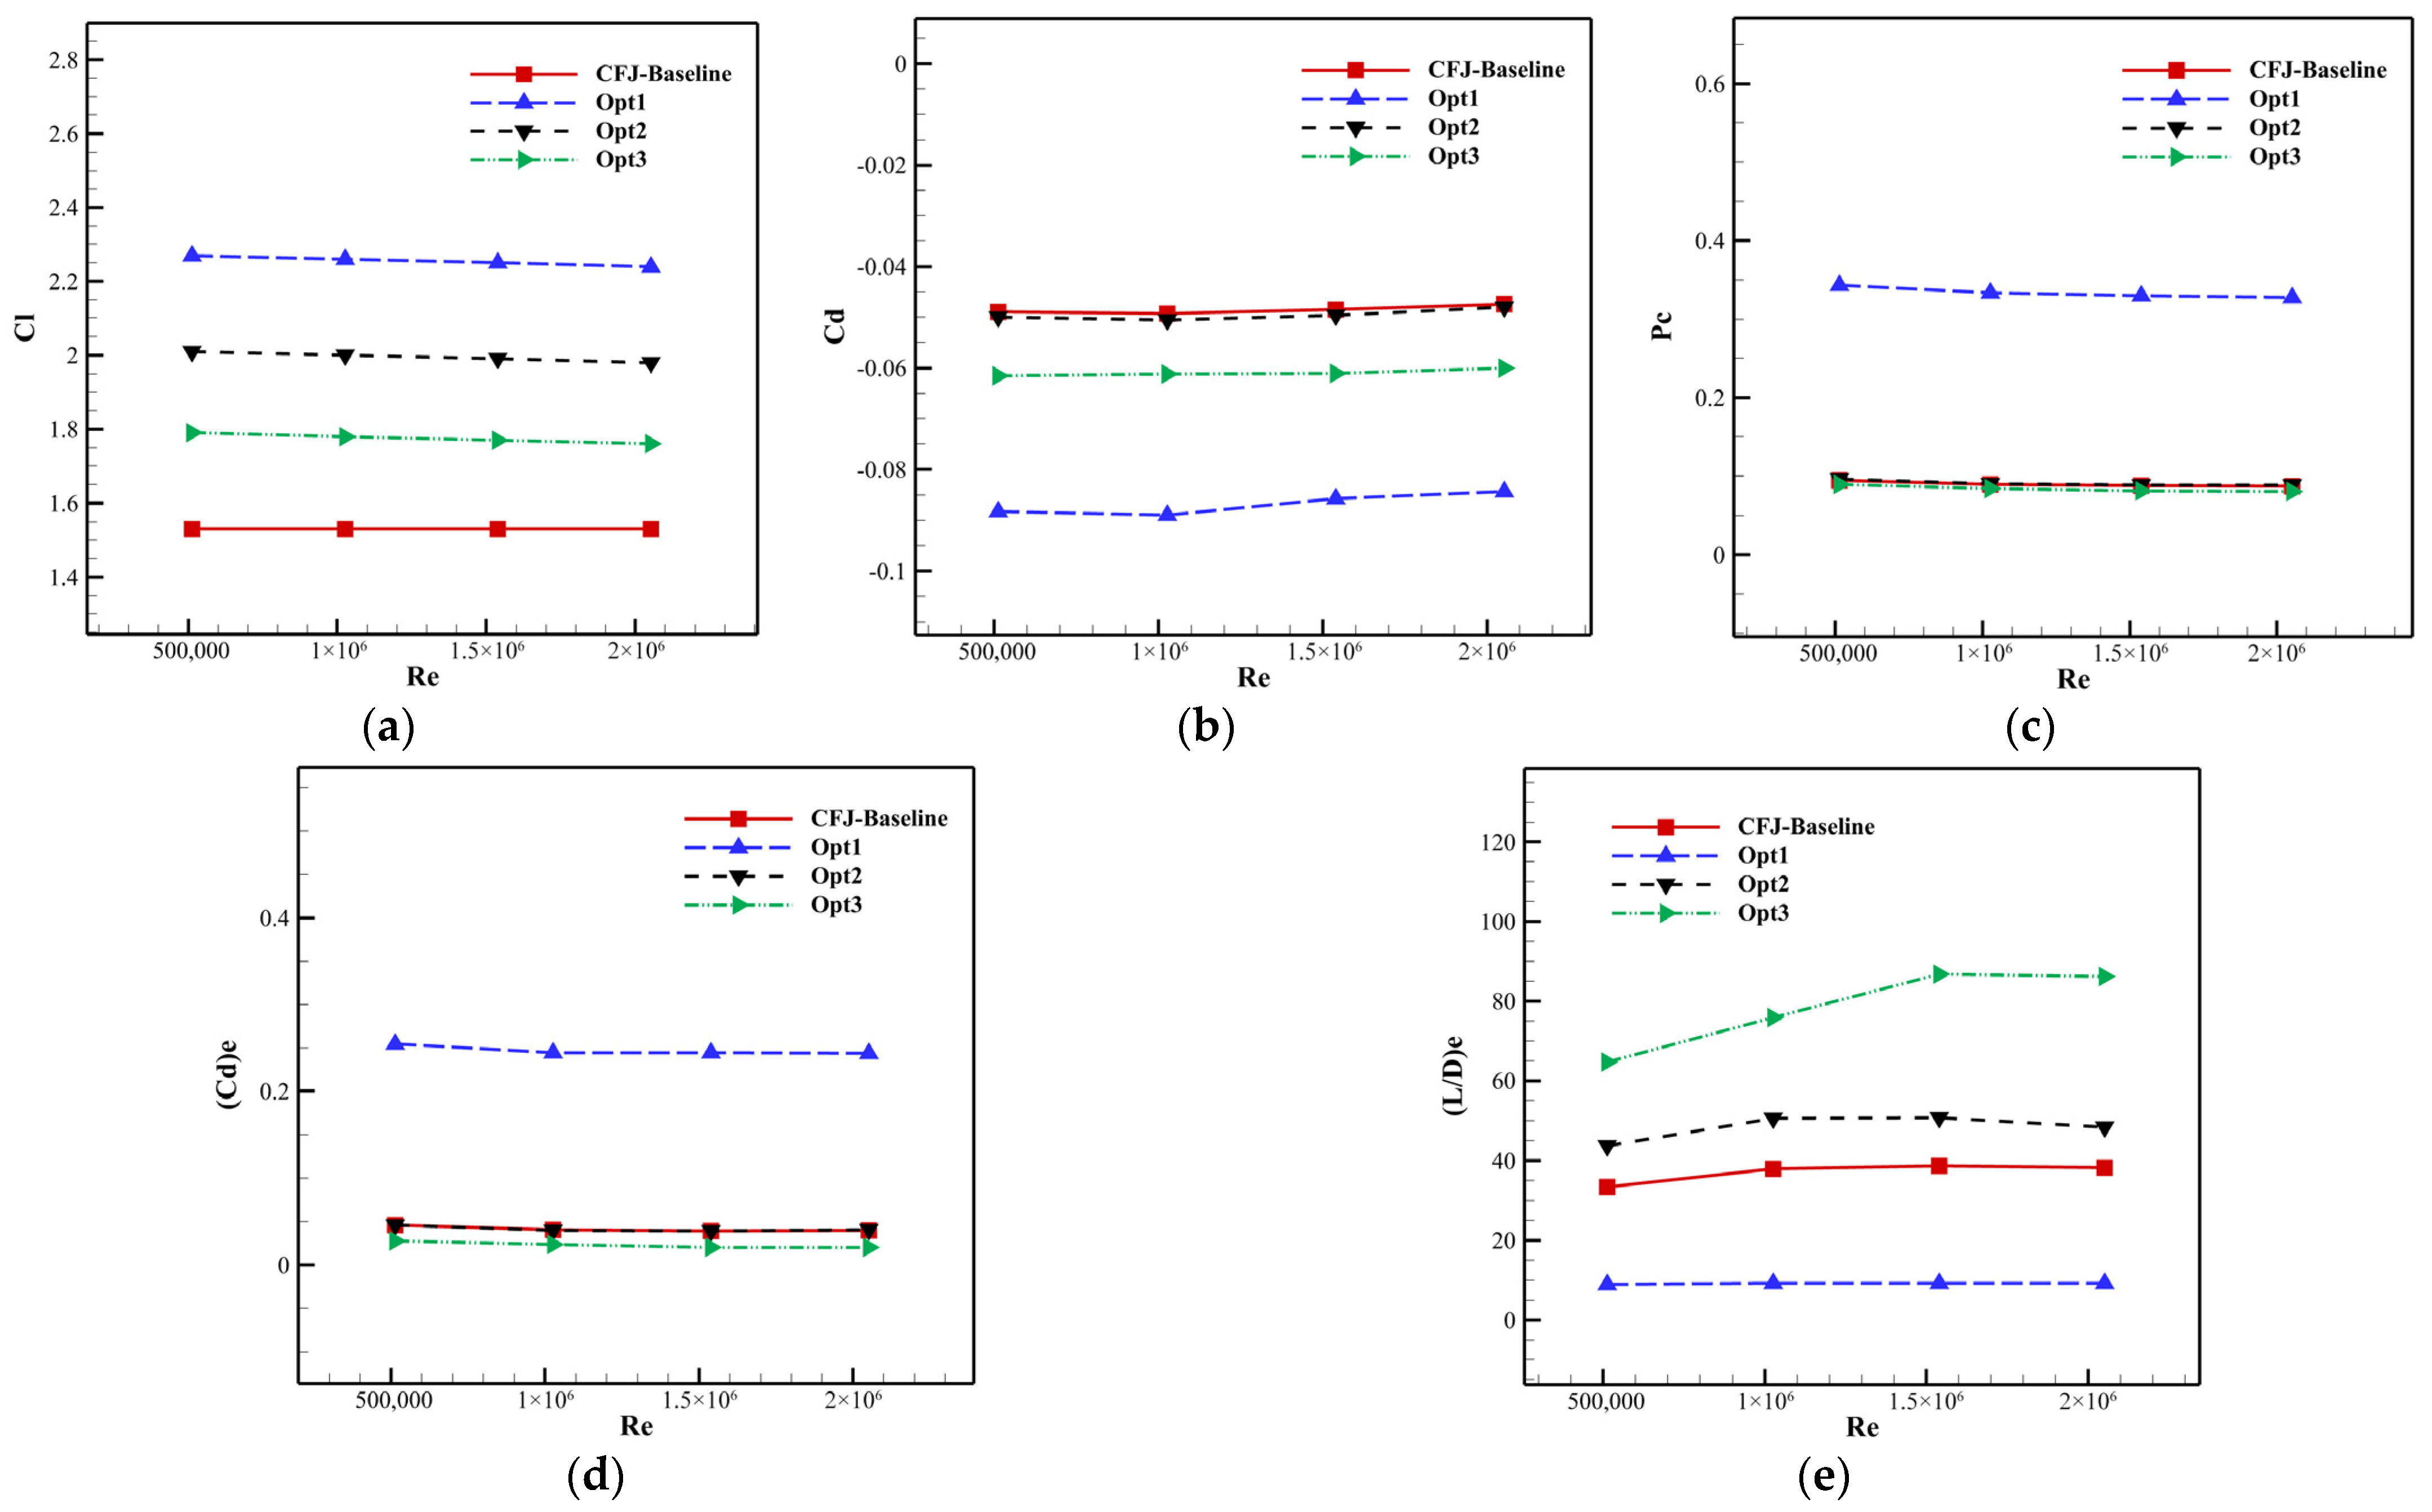
To further evaluate whether the optimized configurations retain their advantages beyond the single design point, additional off-design computations were performed by varying the Mach number and Reynolds number, respectively. In the first group of computations, the Mach number was varied from 0.10 to 0.25 while the Reynolds number was kept at the design value. In the second group, the Reynolds number was varied from 5.13 × 10⁵ to 2.052 × 10⁶ while the Mach number was kept at 0.15. The angle of attack was fixed at 5° in both groups. For each configuration, the nominal jet momentum coefficient was kept the same as that used in the optimization, so that the comparison reflects the off-design aerodynamic response of the optimized airfoil geometry and CFJ parameter combination.
The influence of Mach number on the aerodynamic performance is shown in
Figure 18. Within the investigated Mach number range, the main performance ranking of the optimized configurations is maintained. Opt1 consistently provides the highest lift coefficient and the most pronounced drag reduction, confirming its lift-oriented characteristic. However, because of its much higher power coefficient, its effective lift-to-drag ratio remains low. By contrast, Opt2 and Opt3 maintain significantly higher effective lift-to-drag ratios than the CFJ-Baseline over the whole Mach number range. In particular, Opt3 remains the most energy-efficiency-oriented configuration, although its effective lift-to-drag ratio gradually decreases as the Mach number increases.
The influence of Reynolds number is shown in
Figure 19. The optimized configurations also retain their characteristic performance trends over the Reynolds number range from 5.13 × 10
5 to 2.052 × 10
6. Opt1 maintains the highest lift coefficient, while Opt2 and Opt3 continue to provide improved effective aerodynamic efficiency compared with the CFJ-Baseline. The effective lift-to-drag ratio of Opt3 remains the highest among all configurations and shows a generally increasing trend with Reynolds number. These results indicate that the advantages of the representative optimized airfoils are not restricted to the original design point. Instead, the lift-oriented, balanced, and energy-efficiency-oriented characteristics of Opt1, Opt2, and Opt3 are retained within the examined Mach number and Reynolds number ranges.
Overall, the three optimization schemes represent distinct design priorities. Opt1 focuses on maximum lift enhancement, while Opt2 emphasizes a balance of comprehensive performance. In contrast, Opt3 pursues the maximization of energy efficiency. During the design optimization process, the coupling relationship between lift, drag, and power consumption should be considered holistically to select the appropriate CFJ airfoil based on specific mission requirements.
It should also be noted that the present optimization is performed in a two-dimensional airfoil setting. This configuration can be regarded as an idealized limiting case of an infinite-span, unswept, spanwise-uniform continuous CFJ configuration. Therefore, the present results are mainly intended to verify the feasibility and effectiveness of the proposed integrated optimization framework for simultaneously considering aerodynamic shape parameters and CFJ flow-control parameters.
For practical three-dimensional CFJ wings, additional effects may influence the transferability of the optimized parameters obtained from the two-dimensional study. These effects include finite-span end vortices, spanwise non-uniformity of the jet, three-dimensional vortex structures induced by discrete or non-uniform injection, chordwise interaction between the injection and suction channels, and wing-induced flow effects. Previous studies on discrete CFJ configurations have shown that streamwise and spanwise vortex structures can significantly enhance the mixing between the high-speed jet, the freestream, and the boundary layer, thereby affecting lift enhancement, drag reduction, and energy utilization [
28]. Therefore, the optimized slot locations, slot sizes, airfoil geometry, and jet parameters obtained in the present two-dimensional study have limitations when applied to practical three-dimensional CFJ wings and require further verification.
The extension of the proposed integrated optimization framework to three-dimensional CFJ wings, including finite-span effects, spanwise jet distribution, internal-channel layout, and wing planform parameters, will be considered in future work. The optimized CFJ airfoils in this study can provide suitable initial profiles for CFJ wing optimization.