Article

Research on Time Constraint Strategy of Flight Ground Support Operations Based on Causal Inference


1
College of Aviation Electronics and Electrical, Civil Aviation Flight University of China, Guanghan 618307, China
2
College of Safety Science and Engineering, Civil Aviation University of China, Tianjin 300300, China
*
Author to whom correspondence should be addressed.
Aerospace 2026, 13(3), 272; https://doi.org/10.3390/aerospace13030272
Submission received: 10 February 2026 / Revised: 7 March 2026 / Accepted: 11 March 2026 / Published: 13 March 2026
(This article belongs to the Special Issue Emerging Trends in Air Traffic Flow and Airport Operations Control)

Abstract

To improve the punctuality of flight schedules, causal inference methods are introduced to model the potential causal structure and intervention effects among ground support operations of flights. The effectiveness of these methods in improving flight punctuality is verified under experimental conditions. When the causal relationship of Flight Ground Support (FGS) is determined, the research initiates from the perspective of FGS. A time-constrained strategy based on the Q-learning causal optimal strategy algorithm is proposed to transform causal effects into causal strategies. Initially, the influencing factors of FGS operations are classified into intervention groups. The causal effects of these influencing factors on their target support operations are calculated, and the influence degrees of the causes on the results within the causal relationship are investigated. Subsequently, the time constraint of the FGS process is characterized as a Markov decision process. The experimental results indicate that, compared with the traditional probability strategy, the causal strategy that considers the causal relationship enables over 51% of the flight plans to depart on time, with an average increase of 2.79%. The proposed method is not restricted to a specific airport or a single ground handling process configuration. Under the condition that ground handling operations are observable and sufficient historical operational data are available, it provides an interpretable optimization framework for time-constraint decision-making in flight ground handling operations across airports of different scales.

1. Introduction

With the continuous development of aviation technology and the rapid growth of the civil aviation industry in China, air travel has increasingly become the preferred mode for medium- and long-distance transportation. On a global scale, for large airports that handle tens of millions of passengers annually, the hourly flight capacity during peak periods is approaching saturation. Consequently, departure delays occur frequently, making flight departure delay a critical issue that urgently requires optimization in both domestic and international civil aviation operations. The 2024 Civil Aviation Development Report of China reports that the average flight delay rate of passenger airlines nationwide was 12.9%, increasing by approximately 7% year-on-year, suggesting that further improvements in delay mitigation capacity and operational resilience are still required [1]. Ground support activities and passive factors jointly account for nearly 70% of the total flight delay duration. Ground support activities encompass multiple operations, including passenger and baggage handling, cargo and mail processing, aircraft and apron operations, aircraft equipment support, and crew-related activities. Among the passive factors, the most significant proportion is due to the late arrivals of aircraft, crew members, passengers, and baggage or cargo. Among various causes of flight delays and operational disruptions, solely the activities related to ground support can be effectively addressed from the perspective of airport operation management. Therefore, identifying the crucial factors that influence the efficiency variations in ground support operations and further formulating time-planning and guidance strategies for flight support under the existing operational conditions has emerged as a significant direction for optimizing the flight ground support process.
In the research on the ground support and turnover efficiency of flights, a large amount of work has been carried out from the perspectives of simulation modeling and system analysis [2,3,4]. Causal inference can be divided into causal discovery and causal effect estimation [5]. Silverio et al. utilized simulation models to analyze multiple operational scenarios for estimating the optimal level of buffer time during aircraft turnaround ground support operations [6]. The aim was to support decision-making that strikes a balance between operational scale and delay-related costs. This analysis essentially focused on buffer time configuration, and its contribution to improving ground support efficiency and overall turnaround performance is still limited. Jin et al. reconstructed a theoretical ground support model through discrete operation simulation [7]. By inputting parameters related to aircraft characteristics, including fleet size, aircraft type, and departure time, as well as attributes of ground equipment such as quantity and location, and airport resources such as boarding gates, the model outputs the number of on-time departures. This approach reduced inefficiencies in the workflows of ground vehicles and equipment and investigated the required equipment quantity to fully utilize vehicle transport capacity. Kierzkowski et al. proposed a system dynamics approach for modeling the ground turnaround process of aircraft [8]. The study identified sequential activities carried out during ground-handling operations and presented these activities in a graphical format, while clearly defining the dependency relationships among them. The robustness of the ground support system and the limitations of the proposed model were also investigated. Subsequent studies conducted by the same research group aimed to determine the fundamental time characteristics of additional aircraft categories and to examine the relationships between the duration of individual ground support activities and their associated connection characteristics, such as passenger volume, cargo handling volume, and flight destination. Luo Qian et al. were the first to apply causal theory in the civil aviation airport domain, aiming to uncover the causal relationships among flight ground support operation nodes and thereby reveal the true causes of flight delays [9]. However, the underlying ideas show certain similarities to the present study; the analysis still relies primarily on correlation based on methods.
To overcome the limitations of flight ground handling decision models that rely predominantly on statistical correlations and consequently possess limited capability to characterize the true interventional effects of different actions, we develop a causality-enhanced time-constraint decision framework for flight ground handling operations. In this study, we analyze various ground support operations, such as passenger boarding, baggage loading, and aircraft refueling, to investigate their impact on flight departure delays. Each operation is characterized by its start time and end time, with its duration defined as the difference between these two timestamps. This duration serves as a continuous treatment variable in our causal inference model, allowing us to estimate the average treatment effect of the operation’s completion time on the final flight departure delay. In this framework, causal discovery and causal effect estimation are incorporated into the reinforcement learning-based policy formulation. By leveraging causal structure and average treatment effect information to guide the policy learning process, the proposed framework provides structured guidance for policy search, which contributes to improving the robustness and consistency of time-constraint decisions under complex operational conditions. The framework is not confined to a specific reinforcement learning algorithm and can be applied to a broad range of value-iteration and policy-iteration-based reinforcement learning methods, which facilitates the quantitative evaluation of the impact of time-level interventions on target ground handling operations.

2. Causal Graph of Flight Ground Service Nodes and Influencing Factors

Flight ground support (FGS) refers to a series of support services conducted after an aircraft lands and arrives at the parking stand, covering the process from wheel chocking to chock removal and push-back in preparation for the next flight stage. Each ground support operation is associated with multiple influencing factors, and the effects of different factors on a specific target support operation vary in magnitude and mode.
It is essential to clarify that while our research objects—ground support operations—are processes with measurable durations, our causal inference framework focuses on the effects resulting from their completion. Specifically, we model each operation as an intervention unit, where the duration represents the dose of the treatment. The outcome variable is the deviation of the actual departure time from the scheduled departure time. This approach enables us to estimate how variations in the duration of each operation causally influence the final departure delay. Thus, although our units of analysis are temporally extended processes, our analytical objective remains firmly grounded in the logic of causal inference, which is concerned with the consequences of interventions—in this case, the consequences of operations finishing at different times.
To facilitate a more effective analysis of causal mechanisms, a hierarchical approach inspired by the analytic hierarchy process is employed to investigate the causal relationships among the influencing factors related to flight ground-support operations. Nine crucial ground-support operations within the flight ground-support process are selected as target-level operations, denoted as target nodes. Meanwhile, their corresponding potential influencing factors are defined as the influence level, referred to as factor nodes, as summarized in Table 1.
Given that the time-point data in the current flight ground support operational records are relatively comprehensive, the time differences derived from those recorded time points are employed as quantitative indicators to measure the punctuality and execution efficiency of influencing factors. In this study, such quantitative indicators based on time difference are referred to as reference measures. Table 2 presents the reference measures corresponding to the influencing factors listed in Table 1.
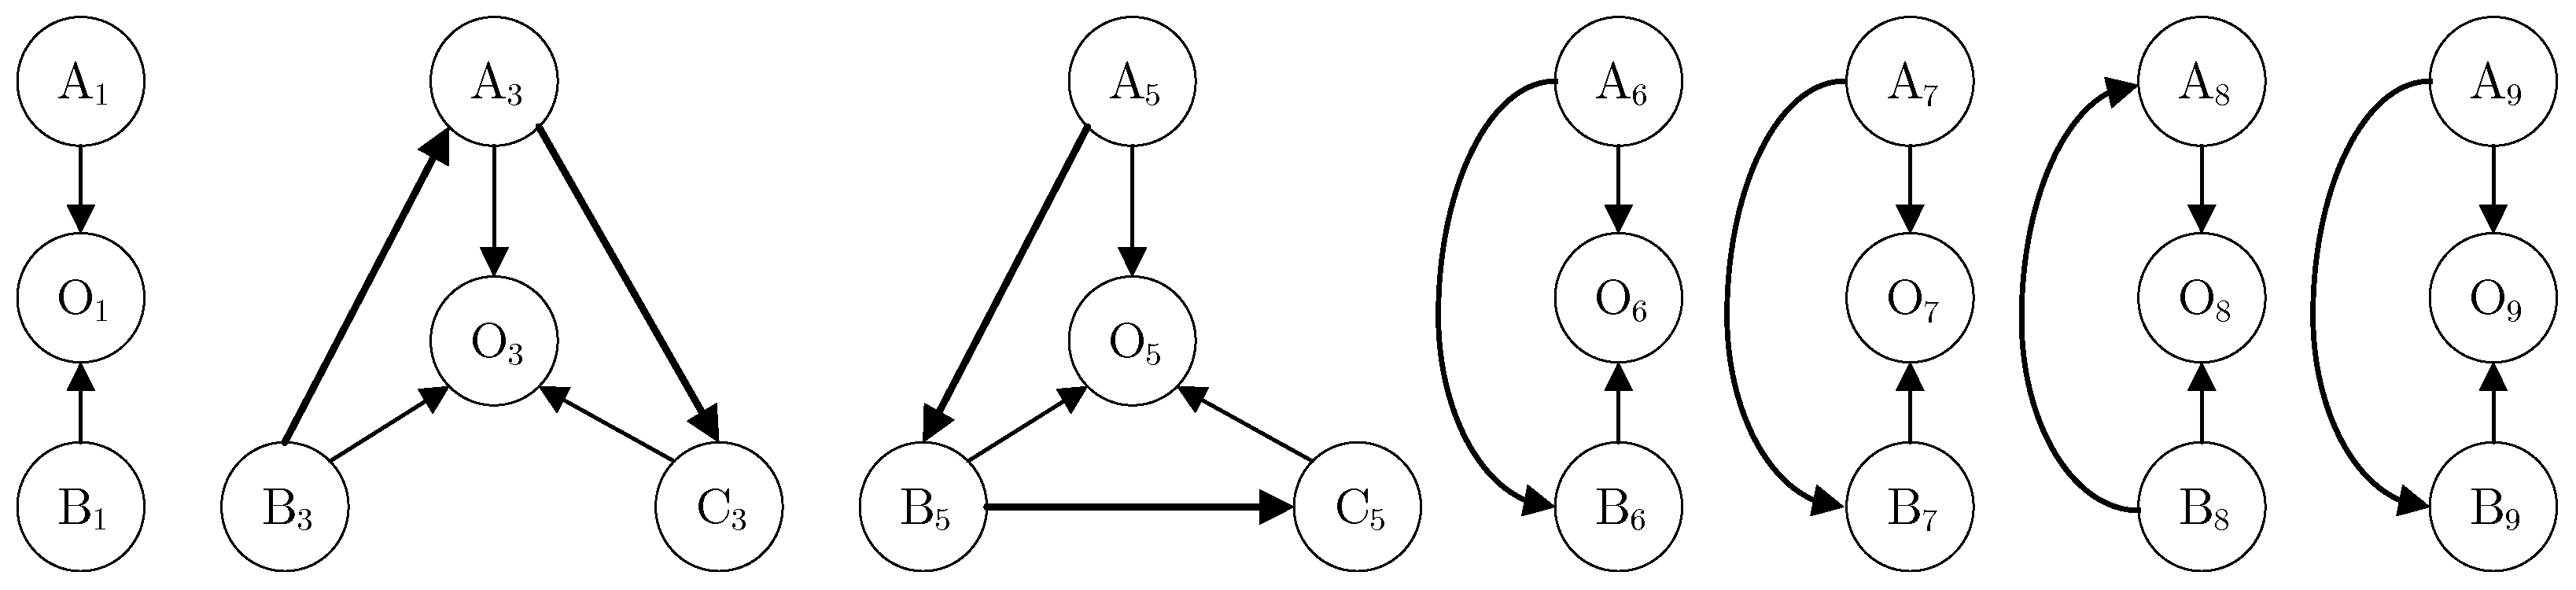
To accommodate the highly coupled structure and heterogeneous variable scales that are inherent in ground support operations of flights, domain-specific prior constraints are introduced into the original algorithmic framework to eliminate causally implausible directions. Furthermore, repeated independent training and the subsequent aggregation of results are employed to improve the stability and robustness of the inferred causal graph, as shown in Figure 1. In the diagram, arrows connect two nodes, pointing from causes to effects, which lays the foundation for the subsequent analysis in this study.

3. Temporal-Constrained Causal Effects of Ground Service Factors

3.1. Concept and Calculation of Causal Effects

This section initially introduces three fundamental concepts in causal effect estimation: unit, intervention, and outcome. The following are definitions:
Definition 1. 
A unit represents the smallest entity for which the effect of an intervention is investigated. A unit can be a physical object, a company, a patient, an individual, or a group of entities or individuals, such as a classroom or a market [10]. In this study, a unit refers to a flight ground service operation.
Definition 2. 
An intervention is an action implemented on a unit to modify its inherent attributes.
Definition 3. 
For a given unit-intervention pair, the outcome that would occur if the unit were exposed to an intervention it has not actually received is termed the counterfactual outcome.
In this study, Y is denoted as a random variable representing the intervention, and Y is denoted as a random variable representing the outcome. Due to the fundamental issue of causal inference, which posits that it is impossible to observe the same unit simultaneously receiving two or more interventions of the same type, the causal effect of an individual unit cannot be directly determined from observational data. However, when the causal graph is known and there are no unobserved confounders, the observed outcomes can serve as proxies for potential outcomes, and the causal effect can be estimated using the Average Treatment Effect (ATE) method [11,12].
ATE = E[Y(T = 1) − Y(T = 0)]
Equation (1) presents the conceptual formula for calculating the Average Treatment Effect. Specifically, the ATE of an intervention with T = 1 relative to T = 0 is defined as the expected difference between the outcome under T = 1 , Y ( T = 1 ) , and the outcome under T = 0 , Y ( T = 0 ) .
When analyzing the data, a challenge emerges as a result of the heterogeneity between units in the treatment and control groups. This heterogeneity prevents the direct calculation of intervention effects through a simple comparison of the outcomes of the two groups. For instance, in the aforementioned example, the distribution of aircraft types varies between flights with punctual ground-staff arrivals and those with delayed arrivals, and the number of flights in each group also differs. Consequently, it is not feasible to directly evaluate how the reference level of ground-staff arrival affects the reference level of the cabin door opening operation by comparing the two groups. To address this issue, the Inverse Probability Weighting (IPW) method can be employed to estimate the true Average Treatment Effect (ATE) [13]. IPW is designed to rectify bias and confounding caused by non-random selection of observed units and missing data. By assigning weights the observed values based on the probability of selection, the analysis can be adjusted to account for this non-randomness. The weighting formula and the corresponding ATE estimation formula are provided below:
Weights   of   the   Treatment   Group   with   T = 1   and   Attribute   X : W x T 1 = 1 e ( X )
Weights   of   the   Control   Group   with   T = 0   and   Attribute     X : W X T 0 = 1 1 e ( X )
Expected   Outcome   under   Y ( T = 1 ) :   E [ Y ( T = 1 ) ] = 1 n i = 1 n T i Y i e ( X i )
Expected   Outcome   under   Y ( T = 0 ) :   E [ Y ( T = 0 ) ] = 1 n i = 1 n ( 1 T i ) Y i 1 e ( X i )
A T E = E [ Y ( T = 1 ) Y ( T = 0 ) ] = 1 n i = 1 n [ T i Y i e ( X i ) ( 1 T i ) Y i 1 e ( X i ) ]
where e ( X ) represents the propensity score, which indicates the probability that a unit with an attribute X belongs to the treatment group, and n denotes the number of units in the study dataset. It is important to note that in the following equations, all weights and expected outcomes are defined based on the attribute X of each unit, which is consistent with the notation introduced in Formulas (2) and (3).
It is worth noting that the inverse probability weighting estimator presented in Formulas (4)–(6) follows the Horvitz-Thompson (HT) formulation, where the sum of weighted outcomes is divided by the sample size n . This formulation maintains theoretical unbiasedness under the assumption that the propensity scores e ( X i ) are correctly specified. An alternative formulation, the Hájek estimator, divides by the sum of the weights and is recognized to be more robust to extreme propensity scores, often resulting in lower mean squared error in finite samples. In our empirical context of flight ground service operations, the estimated propensity scores were well-distributed without extreme values close to 0 or 1. Consequently, the numerical disparity between the HT and Hájek estimates was insignificant, and the HT estimator did not introduce any discernible instability.

3.2. Causal Effects of Influencing Factors on Ground Service Nodes

Since causal influence propagates along directed paths in the causal graph, upstream factors ultimately have an impact on the target ground-service event. Consequently, when calculating causal effects along the causal paths shown in Figure 1, such as B3→A3→O3, B3→A3→C3→O3, A5→B5→O5 and A5→B5→C5→O5, it is not necessary to calculate the causal effects between intermediate influencing factors. Instead, only the direct causal effects, such as A3→O3, B3→O3 and C3→O3, should be calculated.
To estimate the causal effects of influencing factors on ground-service nodes, it is also essential to quantitatively characterize the target ground-service operations so that they can be incorporated into the calculation of causal effects. Therefore, the concept of reference values is employed to quantify the efficiency of operation execution, as detailed in Table 3.
In this study, valid flight ground-service data were collected from a large domestic hub international airport during June and July 2019.
In addition, it is essential to clarify the representativeness and applicability of the sample source. The data used in this study are derived from a single large domestic hub airport over a two-month period. This period is within a typical operational peak season. During this period, the flight density and ground-handling workload remain relatively stable, which adequately reflect the structural characteristics of the ground-handling system under high-intensity operational conditions. The selected airport adheres to unified civil aviation standard operating procedures in terms of ground-handling process configuration, operational specifications, and node organization. It exhibits a high level of consistency in operational mechanisms with most large domestic hub airports. Consequently, the causal structure of ground-handling events identified in this study has a certain degree of typological representativeness within the context of “similar large hub airports.”
It is important to note that there are differences among airports regarding resource allocation, flight structure, meteorological conditions, and operational management strategies. Furthermore, traffic patterns and operational rhythms can vary across seasons, and different factors such as weather may also introduce perturbations to ground handling times. These differences are more likely to affect the magnitude of causal effects (at the parameter level) rather than the fundamental topological structure of ground handling processes (at the structural level). Therefore, the results of this study should be interpreted as statistical causal structures and effect estimates obtained under specific operational contexts. Their transferability across different airports, seasons, and various meteorological conditions requires further validation through the utilization of larger-scale, multi-scenario datasets.
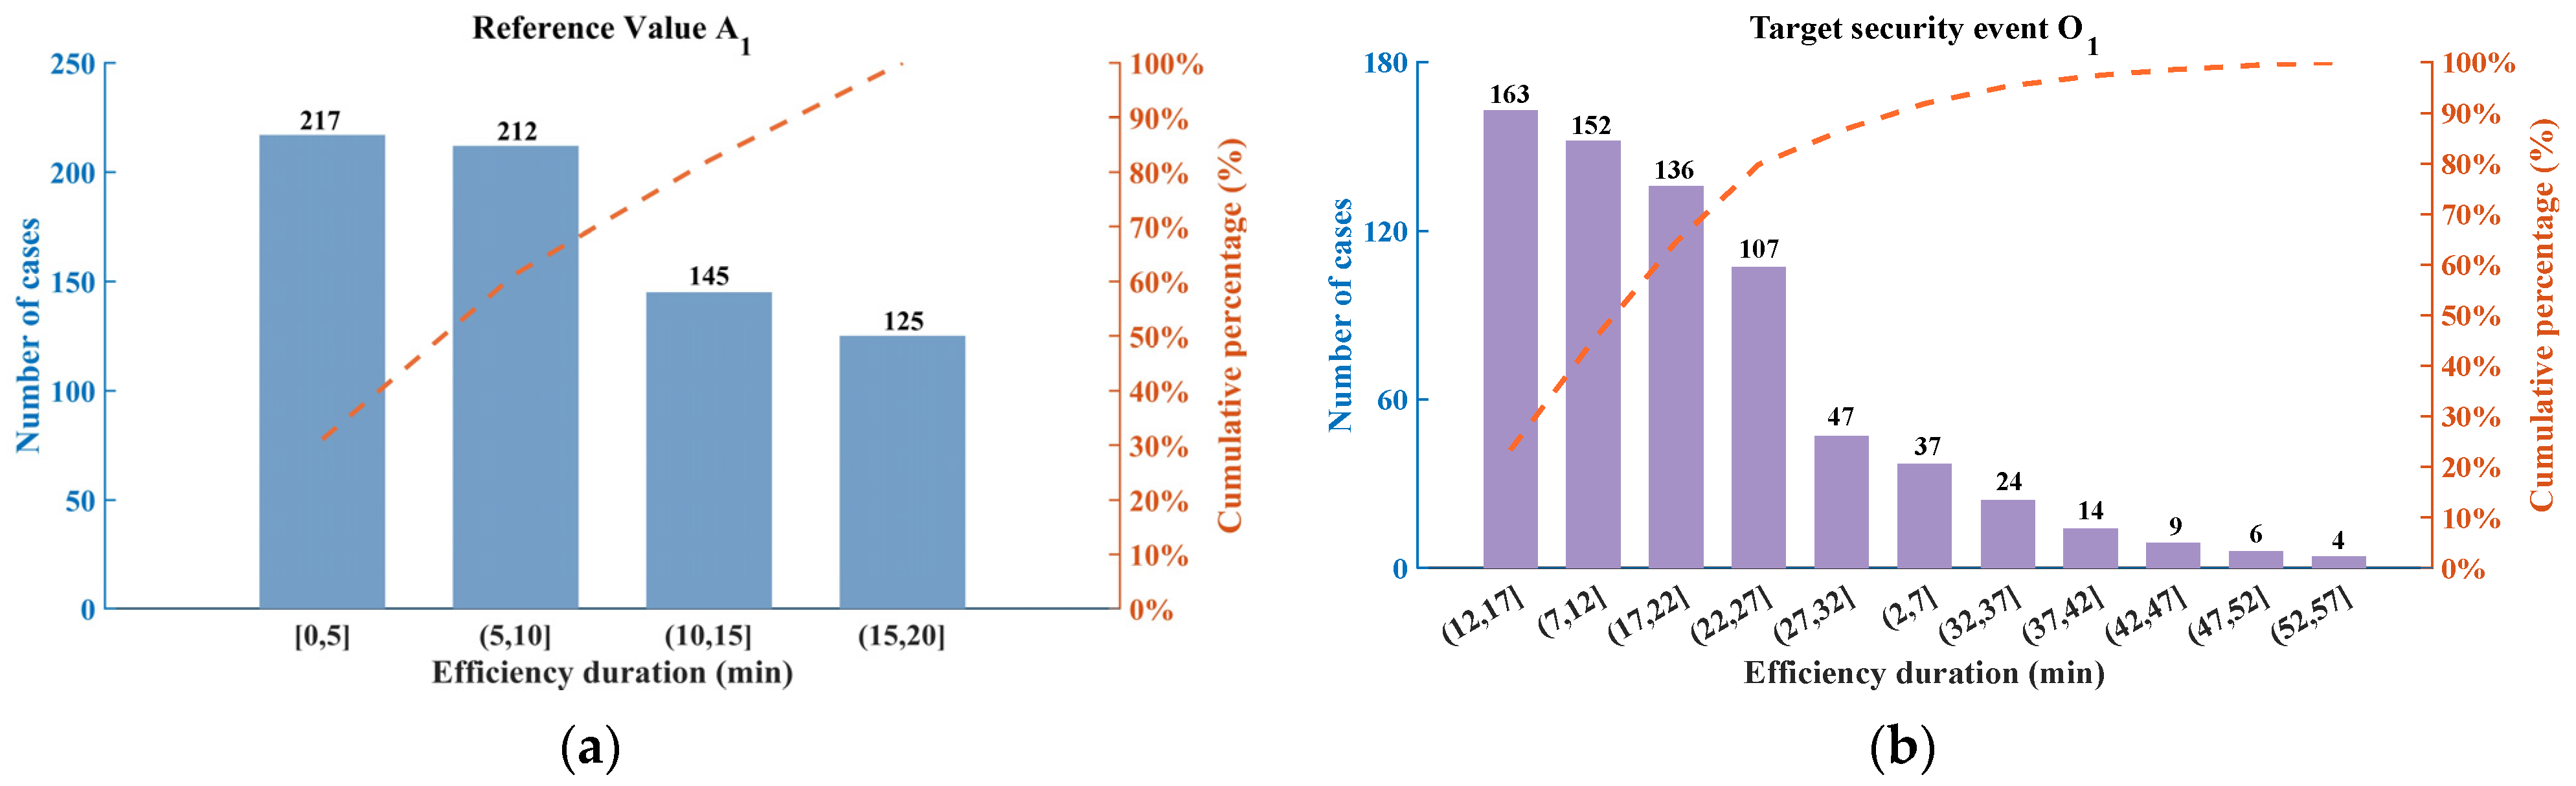
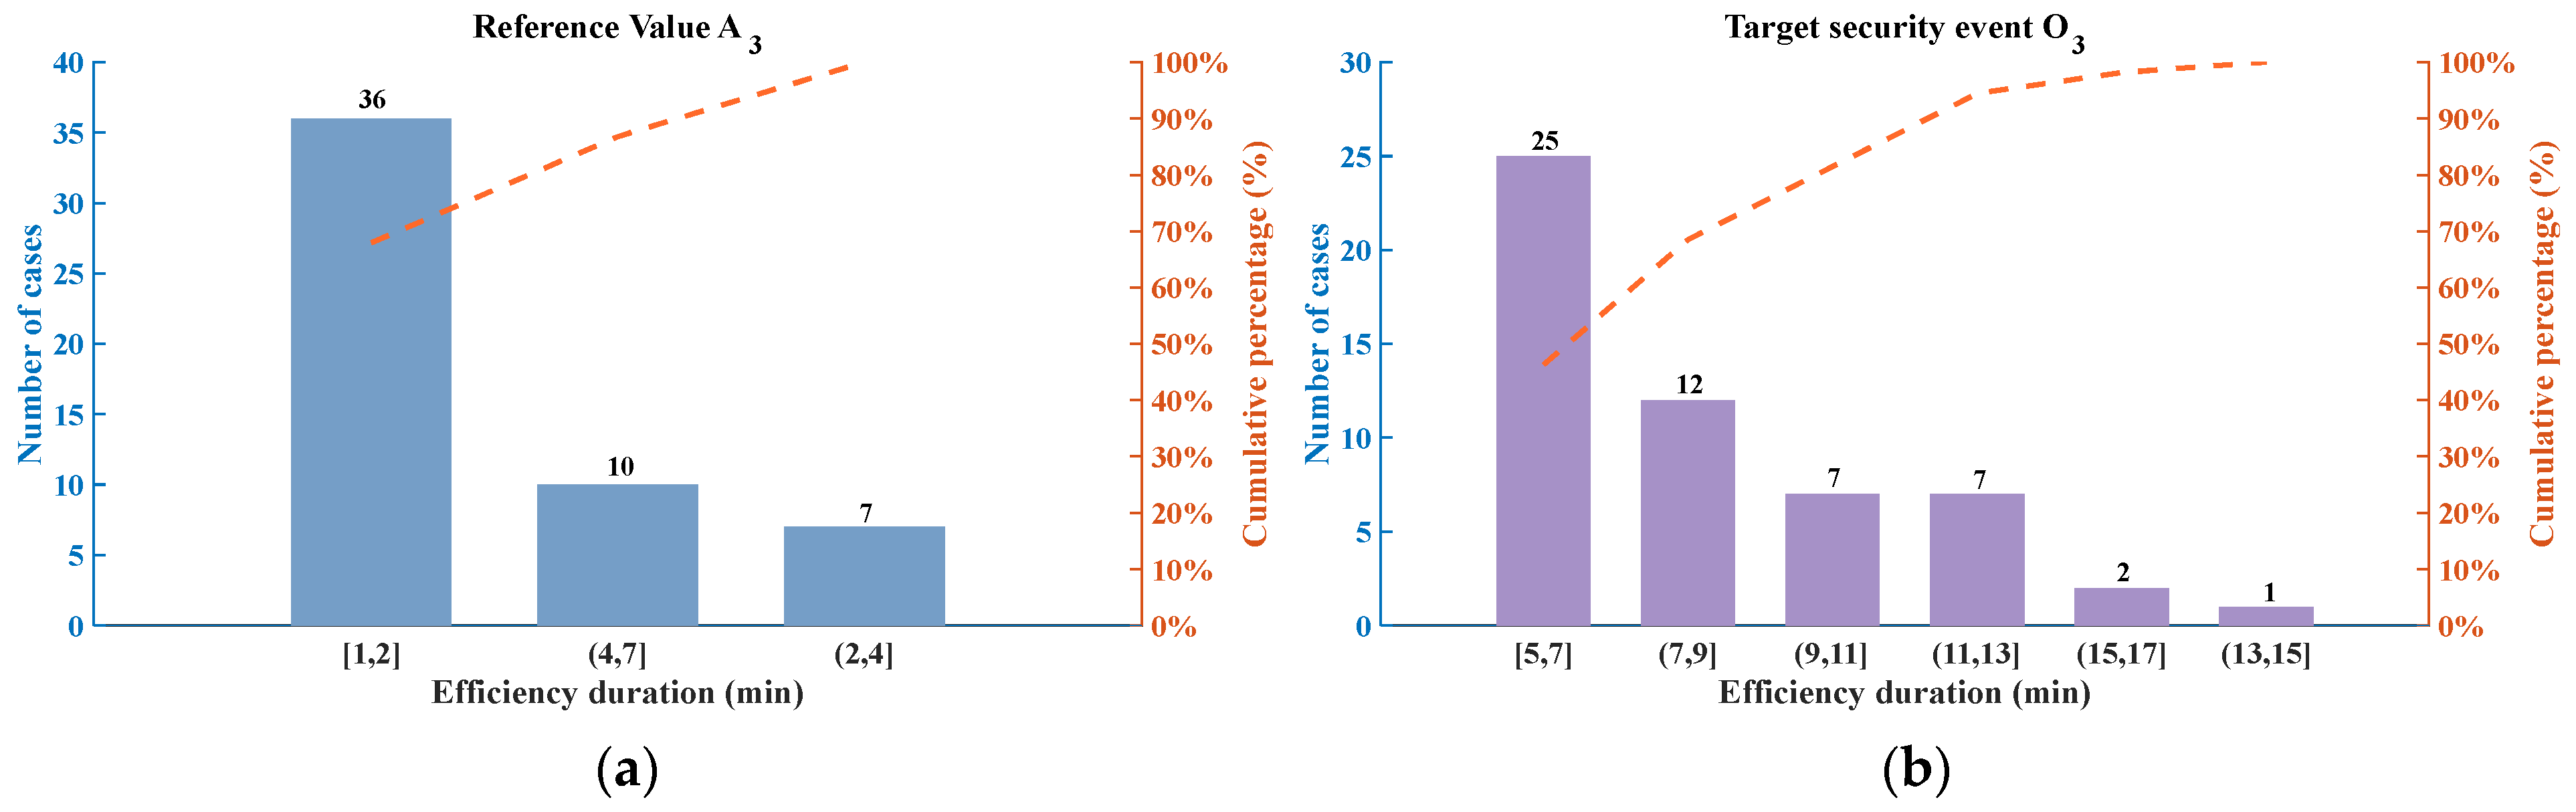
For each ground-service operation under investigation, the dataset is required to include both the quantified reference values of the ground-service operation and the corresponding quantified reference values of its influencing factors, with all reference values being computable from complete records. Based on these criteria, the statistical results of the influencing-factor reference values and the target-operation reference values for ground-service operations O1 and O3 are presented in Figure 2 and Figure 3.
Currently, the vast majority of applications of the ATE involve binary interventions [14]. In contrast, the time reference values of influencing factors in flight ground handling operations are continuous variables. To address this issue and minimize the potential information loss caused by discretization, we employs a statistically based interval partitioning approach to estimate causal effects across multiple intervention intervals. Firstly, initial intervals are constructed through equal-frequency quantile partitioning based on the empirical distribution of the historical data. This data-driven method ensures a balanced sample size across intervals and reduces the influence of extreme values on the stability of estimation. Secondly, to justify the interval boundaries and minimize information loss, statistical consistency tests are conducted on the mean differences in outcome variables between adjacent intervals. In the even that no statistically significant difference is detected between adjacent intervals, they are combined, thereby avoiding excessive discretization when the causal effects are homogeneous. Finally, the interval partitioning scheme is subjected to tests for overlap and sample size constraints to ensure the positivity assumption is satisfied, and candidate partitions that violate these conditions are discarded. The following four figures illustrate the statistical results subsequent to the definition of the intervention intervals. For instance, for operation O1 in Figure 2, the influencing factor A1 is divided into four intervention categories, namely the intervals (0,5], (5,10], (10,15] and (15,20], where each interval is mutually independent. Consequently, different intervention intervals are regarded as distinct intervention states, and the causal effects between any two selected intervals are investigated. Based on the initial interval partitioning, the interval boundaries are further adjusted by incorporating operational rules, workflow, and management experience from the flight ground handling process. This adjustment ensure that each intervention interval corresponds to the typical timescales of ground handling operations. To ensure the reliability of the causal effect estimation, the sample size within each intervention interval and the overlap of covariates are examined. Candidate partitioning schemes with insufficient sample sizes or those failing to satisfy the overlap assumption are discarded. Additionally, a comparative analysis of the ATE results between adjacent intervention intervals is conducted to avoid drastic fluctuations in causal effects resulting from unreasonable interval division, thereby enhancing the stability of the interval-based ATE estimation. For ground handling events involving multiple intervention variables, interval partitioning is performed separately for each variable dimension in accordance with the aforementioned method. On this basis, joint intervention intervals are constructed to estimate the average treatment effect when multiple factors changes simultaneously. This approach avoids the loss of causal semantics associated with similarity-based clustering and more accurately reflects the true causal impact under varying combinations of intervention intensities.
In addition, for the ground service operations shown in the figures above, the corresponding category A influencing factors are jointly determined in conjunction with the category B or category BC influencing factors. Specifically, the category B or category BC factors are associated with the category A factors. For example, when factor A3 falls within the interval (2, 7], factor B3 lies within (0, 25], and factor C3 lies within (0, 30]. All intervention interval values for the ground service operations considered in Table 4, along with the causal effect values of different interventions on the target ground service operations, are calculated using Equations (2)–(7).
ATE = i = 1 n X i T A 1 Y i i = 1 n X i T A 1 i = 1 n X i T A 2 Y i i = 1 n X i T A 2
In Table 4, the numerical subscripts of the influencing factors indicate distinct intervention intervals employed for ATE estimation. Taking the aircraft chock blocking operation O1 as an illustration, four intervention groups are defined. The intervention group labeled as A0~5B0~5 represents the situation in which influencing factor A lies within the interval (0, 5] and influencing factor B also lies within the interval (0, 5]. This intervention group results in an average increase of 2.9 min in the duration of the aircraft chock blocking operation. By analogy, the meanings of the other values presented in Table 4 can be interpreted in a similar fashion.

3.3. Temporal Constraint Framework for Flight Ground Support Operations

After calculating the causal effects of different influencing factor intervention groups on support operations, a comparison of these causal effects facilitates the determination of both the magnitude and outcome of each factor node impact on the target operation. This process enables the identification of the temporal requirements of causal factors, which can enhance the execution efficiency of the corresponding support operations and reduce their completion time. In this study, the temporal requirements of influencing factors intended to improve the efficiency of target support operations are defined as temporal constraints.
Flight ground support exhibits the Markov property. Specifically, given the current support operation node and the states of preceding nodes, the conditional probability distribution of future node states depends exclusively on the current node state. The flight ground-support process is composed of a series of discrete support operations. This characteristic enables the process from aircraft arrival and landing to the completion of ground support, boarding, and departure to be modeled as a Markov chain. A Markov chain is constituted by a set of states and transition probabilities [15]. In the context of flight ground support, a state is equivalent to the duration of the efficiency of the currently executed support operation, whereas the transition probability represents the probability of transitioning from the current operation to the next operation in different states, thereby establishing a connection between the states of consecutive operations. Different states, reflecting varying execution efficiencies, are resulted from different influencing factors. In other words, the intervention intervals of these factors directly affect the efficiency of the subsequent state. To identify which intervention intervals have relatively positive effects on the target operation states, the concept of reward is introduced. Reward is defined as the benefit obtained when entering a particular state. This extension transforms the Markov chain into a Markov reward process. The ultimate objective of this study is to delineate the precise requirements of influencing factors to enhance the punctuality of flight schedules. Consequently, decision-making and trade-offs become critical, which requires a further extension of the Markov reward process into a Markov decision process.
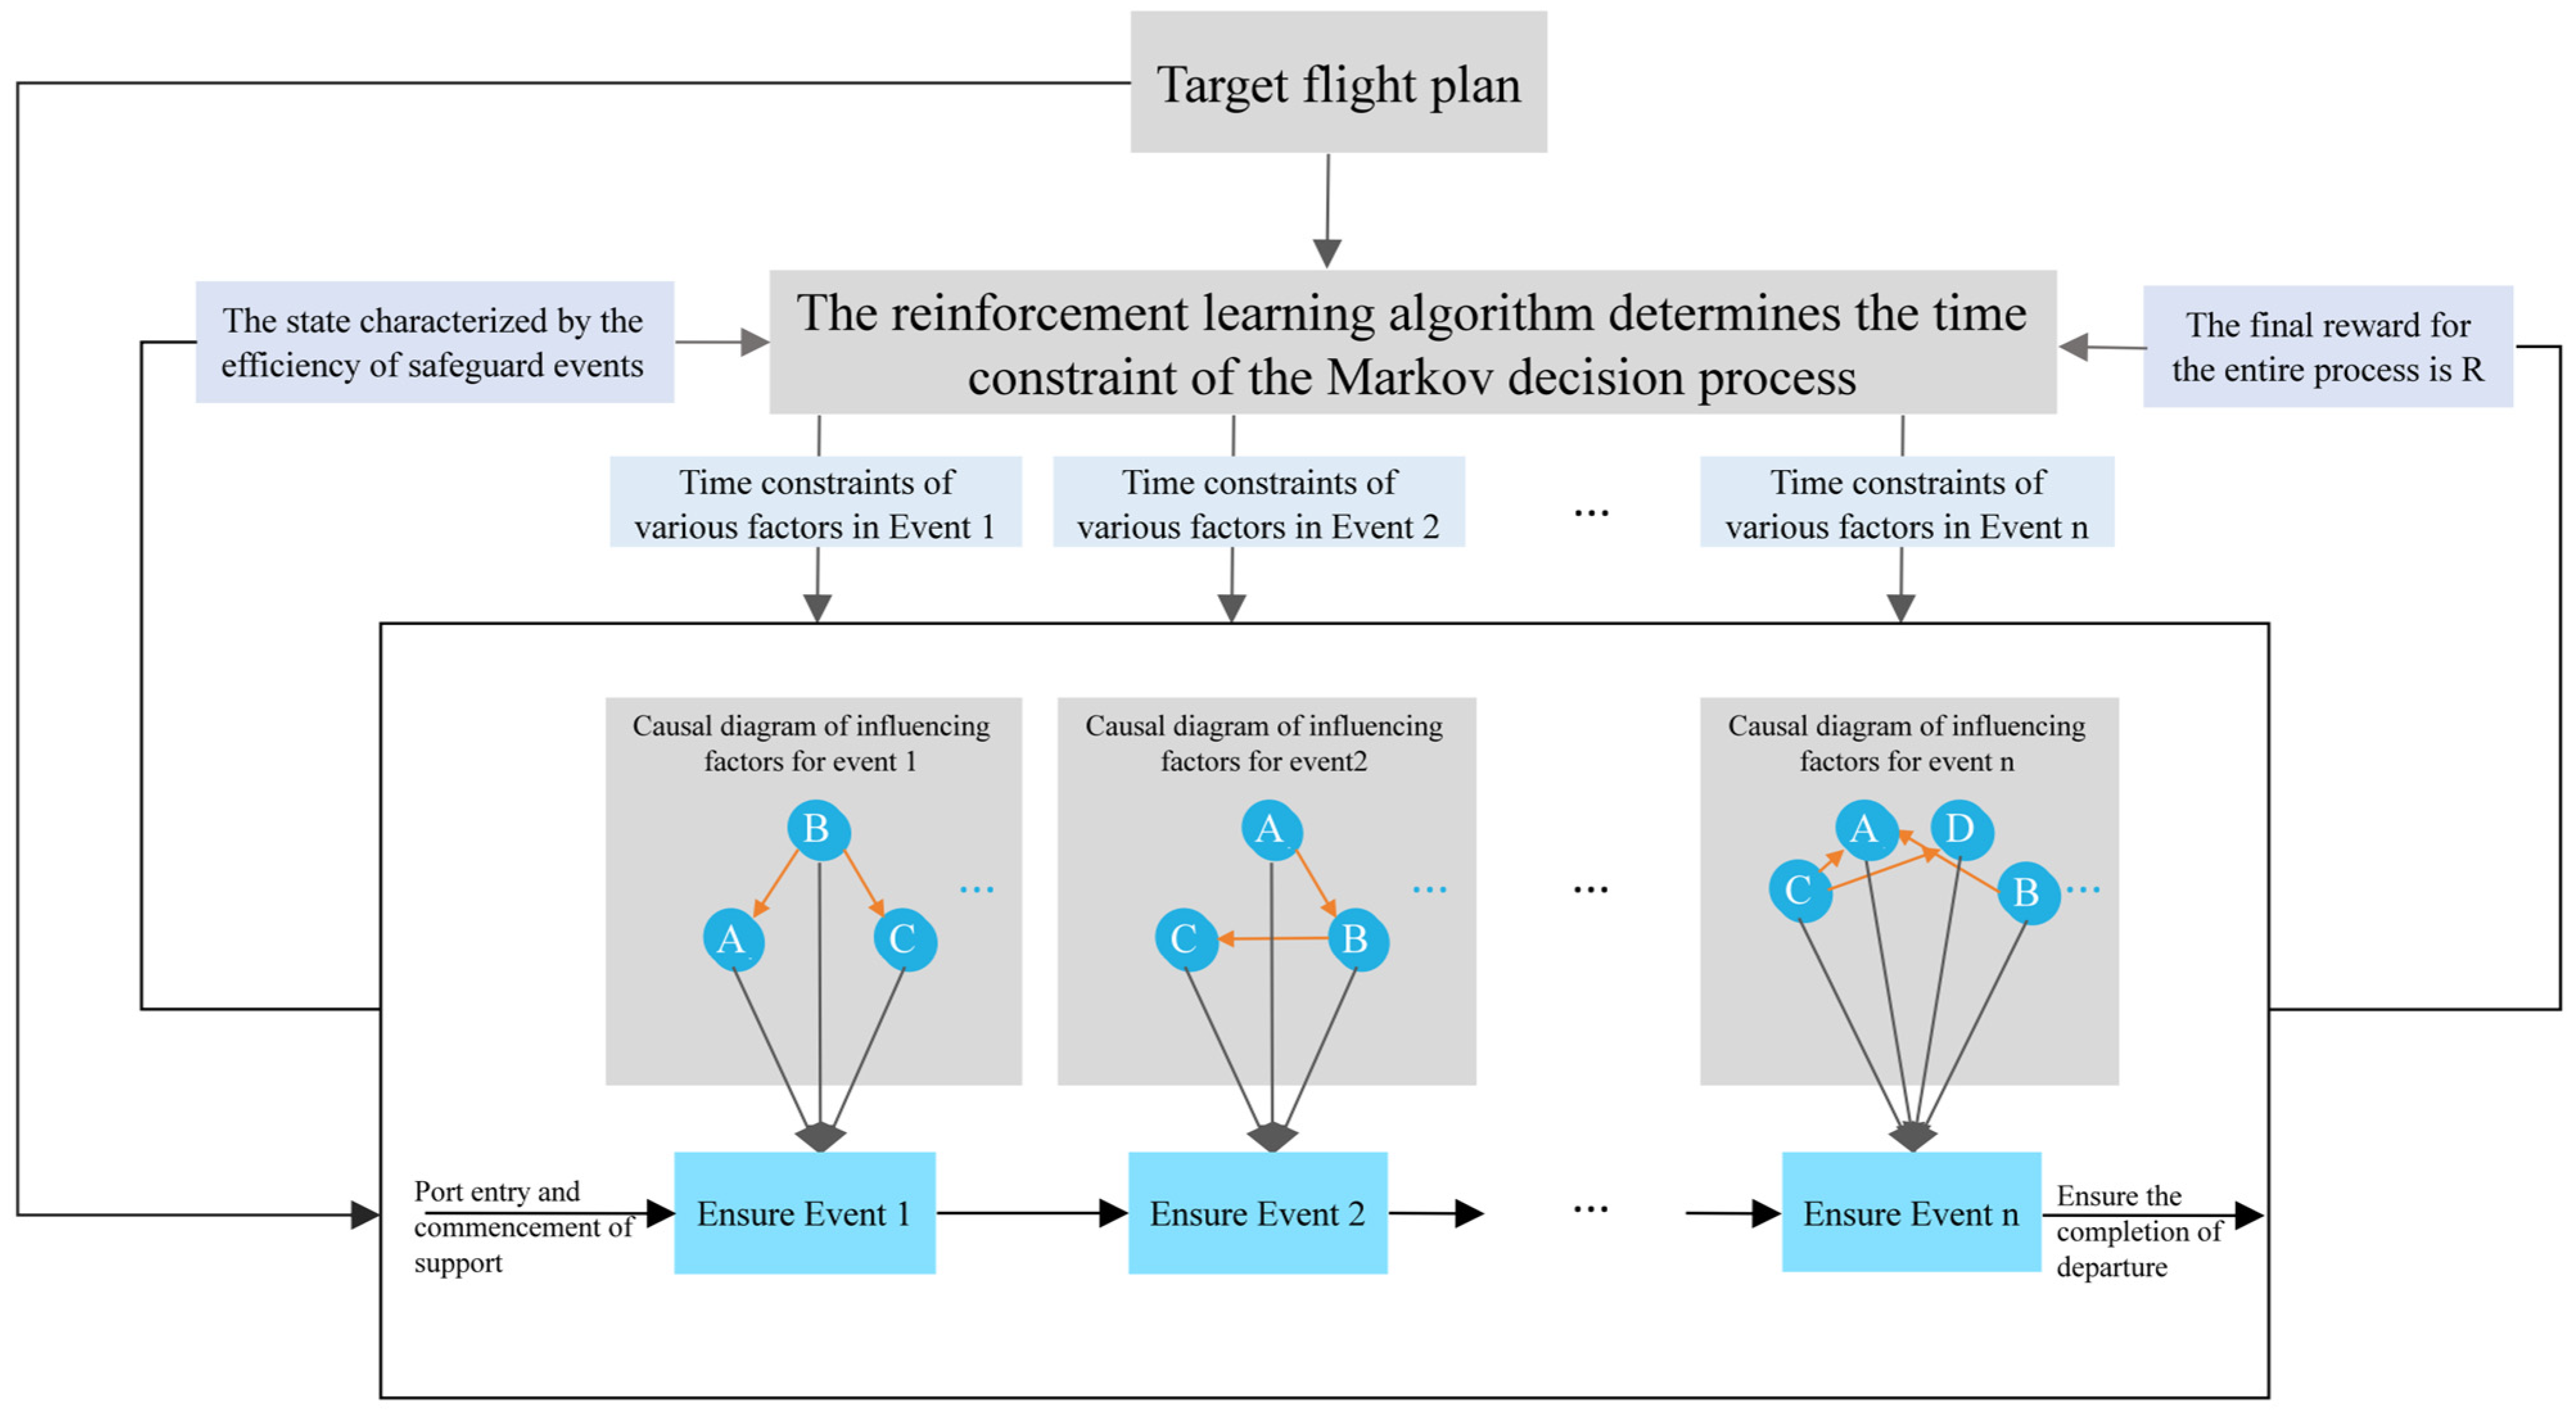
A Markov decision-process model is employed to address the allocation and adjustment of operational indicators in industrial decision-making, particularly within the context of supply chain management [16]. Flight ground support exhibits significant similarities to supply chain management. The process commencing from an aircraft’s arrival and landing to the completion of ground support, boarding, and departure is comparable to the production process in an industrial supply chain. In this comparison, each aircraft can be regarded as a unit of raw material, each executed support operation corresponds to a production step, the completion of ground support represents the completion of processing, and an aircraft’s departure is analogous to a finished product leaving the factory. Based on this similarity, the study of temporal constraints in flight ground support can be formulated as a problem equivalent to solving a Markov decision process. In a standard Markov decision process, a policy is typically defined as π ( a s ) , representing the probability of selecting an action a given state s under observational transition dynamics. Conversely, the action space in this study is not composed of arbitrary control variables, instead, it comprises intervention intervals derived from causal effect estimation (ATE). Each action is associated with the selection of a specific intervention range for influencing factors, and the expected impact on subsequent operational efficiency has been statistically quantified. Therefore, the learned policy represents an intervention-oriented decision strategy grounded in causal inference, rather than a purely reactive control policy based on observational transitions. The state transition dynamics themselves remain observational and data-driven. Building upon this analysis, a temporal constraint model framework is proposed for the support process, which is based on causal reinforcement learning. The structure of the framework is illustrated in Figure 4.
From the arrival to the departure of an aircraft, the ground support process consists of a total of nine crucial support operations. The causal diagram of influencing factors for each operation is illustrated in Figure 1. The temporal constraint methods for the factors of each support operation are associated with the ATE intervention intervals listed in Table 4. The primary reinforcement learning algorithm is described in Section 4. The overall cumulative reward R represents the total reward obtained by implementing these temporal constraint methods or strategies across operations 1 to 9. Reinforcement learning is performed through iterative policy updates based on the cumulative reward and the state representations resulting from the execution of all nine operations. The iteration persists until convergence is achieved, thereby determining the temporal constraint requirements for each of the nine support operations.

3.4. Methodological Positioning of the Proposed Framework

Overall, the methodological choices in this study are formulated to achieve a balance among structural interpretability, statistical rigor, and operational scalability within the context of airport ground-service systems.
On the causal modeling side, alternative methodologies such as Structural Equation Modeling [17], Bayesian networks [18,19], and machine-learning-based heterogeneous treatment effect models [20] provide valuable tools for parameter estimation and nonlinear approximation. However, these methods either require strong a priori structural assumptions, encounter computational scalability challenges in complex operational networks, or reduce structural transparency when applied to safety-critical environments. In comparison, the current study integrates domain knowledge with data-driven causal discovery and statistically grounded interval-based ATE estimation [21], preserving both structural clarity and empirical robustness.
On the policy optimization side, classical dynamic programming methods [22] are capable of computing exact optimal policies when transition probabilities are analytically specified. Deep reinforcement learning approaches [23] offer powerful function approximation capabilities for high-dimensional problems. However, airport ground-service operations are characterized by stochastic disturbances and data-driven transition dynamics instead of fully specified white-box models. Under these circumstances, model-based Bellman equation solvers become less practical, while deep learning methods may introduce unnecessary computational complexity and reduced interpretability.
By combining a structurally interpretable causal graph with a model-free TD(0)-based Q-learning framework [24], we enables the use of causal effect estimates to direct policy optimization without requiring explicit analytical transition matrices. The resultant framework maintains theoretical consistency with causal inference principles while remaining adaptable to the evolving operational data. Instead of proposing a novel standalone algorithm, the contribution of this study is the structured integration of causal reasoning and reinforcement learning for scalable and interpretable decision-making under uncertainty in airport ground-service management.

4. Temporal Constraint Strategies for Enhancing Flight Departure Punctuality

4.1. Causal Identification Assumptions and Structural Validity

It is essential note that the estimation of causal effect and the subsequent optimization of policies in this study are based on explicitly stated identification assumptions. To avoid ambiguity associated with implicit modeling assumptions, this section clarifies the origin of the causal structure, the identification conditions, and the treatment of potential hidden confounding factors.
First, it was not assumed a priori that the causal graph existed. Instead, the causal graph was learned through a reinforcement-learning-based structure search framework that iteratively optimizes candidate directed acyclic graphs. The scoring function combines goodness-of-fit, penalties for structural complexity, and conditional independence tests. Domain-specific directional constraints were incorporated to eliminate causally implausible edges based on operational knowledge of flight ground service processes. Multiple independent training runs and result aggregation were employed to enhance structural stability. Therefore, the resulting causal graph represents the statistically optimal structure within the observed variable set and under domain constraints, rather than an absolute ground-truth causal system.
Second, the estimation of causal effects depends on standard identification assumptions:
(1) Ignorability: conditional upon the observed covariates, the intervention variable is independent of potential outcomes. The model incorporates major operational timing variables and key service events to mitigate the risk of omitted confounding factors.
(2) Positivity: within each covariate stratum, the probability of receiving each intervention level is non-zero. This assumption was empirically supported through covariate overlap tests conducted prior to interval-based ATE estimation, and candidate interval partitions failing the overlap conditions were excluded.
Given the inherent complexity of airport ground operations, which encompasses potential latent factors such as weather conditions, congestion levels, and variability in staff coordination, the possibility of hidden confounding cannot be completely eliminated. To evaluate robustness, a ±10% perturbation analysis was performed on key ATE estimates, and the resulting policy rankings were examined. The relative ordering of major intervention strategies remained stable under reasonable perturbations, indicating a moderate robustness of the causal-enhanced strategy to estimation deviations.
Consequently, the causal findings in this study should be interpreted as statistically supported causal inferences under observational data and explicitly stated identification assumptions, rather than a comprehensive structural representation of the operational system.

4.2. Reinforcement Learning Elements and Evaluation of Optimal Temporal Constraint Settings

The Markov decision process stands as one of the standard models commonly employed in reinforcement learning. Consequently, this section explores the temporal constraints of flight ground support operations using a reinforcement learning algorithm integrated with causal theory, including causal discovery and causal effects. The correspondence between the elements of reinforcement learning and the research context is summarized as follows:
(1) Agent: A software program responsible for making intelligent decisions.
(2) Environment: The fundamental logic and sequence of the support process, along with the execution status of the current operation.
(3) State: The support operation in which the flight is involved at a specific time and the duration of its completion.
(4) Action: The selection of a specific intervention interval combination for influencing factors at a given support operation, where each intervention interval corresponds to a predefined duration range derived from causal effect estimation.
(5) Policy: The mapping from states to actions adhered to by the agent, representing the conditional probability of selecting action a t given the current state s t .
(6) Reward: A metric gauging the alignment between the scheduled departure time and the actual departure time of the flight. The smaller the difference, the greater the cumulative reward.
r t = λ ( T t T r e f ) + β
where r t denotes the immediate reward at decision step t ; T t represents the actual execution duration of the target support operation; T r e f is the predefined reference duration for that operation; λ > 0 is a scaling parameter introduced to ensure numerical stability; and β is a constant shift term applied for reward normalization.
For each ground support operation, there exists a set of influencing factors that produces the minimum duration for that operation, which is termed the Local Optimal Temporal Constraint, corresponding to the ATE intervention intervals. The reward serves as the crucial criterion for determining the termination of algorithm iteration. The collection of influencing factor sets for each operation that satisfies the reward requirement throughout the entire process is defined as the Global Optimal Temporal Constraint. A simple aggregation of the local optimal temporal constraints for individual operations does not necessarily improve the alignment of the flight schedule. Optimization should be directed at the set of intervention groups that achieve the overall optimal temporal constraint. For instance, if each support operation is completed in the most efficient manner independently, the difference between the scheduled and actual departure times may become excessively large, potentially reducing the punctuality of flight departures instead of improving it.

4.3. Temporal Constraint Strategies Based on Probability and Causal Effects

For specific sparse instance in the flight data shown in Figure 2 and Figure 3, time reference distributions with frequencies accounting for less than 10% to 20% of the total are excluded. Such cases exhibit an extremely low probability of occurrence in the context of conventional probabilistic analysis. Moreover, they are highly likely to result from inaccuracies in data acquisition. Consequently, these low-probability operations are removed during the computation of temporal constraint strategies. Subsequently, intervention groups that account for 80% to 90% of the data are selected for further analysis. Once these temporally constrained action strategies are implemented, the states of the corresponding target operations change accordingly. This phenomenon occurs because a non-averaged action selection strategy is adopted, in which the probabilities associated with temporal constraint strategies are directly utilized as action selection probabilities. This design reduces the exploration component of the learning process and enables faster convergence. In addition, state transition probabilities are introduced to incorporate state variation. This enables the quantification of the possible maximum and minimum execution durations of the target support operation after a specific constraint strategy is applied. These values are obtained by accumulating the products of the state transition probabilities and the corresponding maximum and minimum durations of the target operation states.
Under the policy defined in Section 3.3, action selection probabilities are determined differently for conventional and causal strategies. The conventional probability-based approach utilizes observed data to calculate the frequency probabilities of different influencing factor intervention groups, namely action groups, executed under a given support operation. These frequency probabilities are directly adopted as the temporal constraint strategy π o r d ( a | s ) for influencing factors within the conventional probabilistic framework. When causal relationships are consideration, larger causal effect values on the target support operation indicate that the corresponding action strategies tend to extend the execution duration of the target operation. Consequently, the probability that the agent selects such temporal constraint strategies should be lower. Based on this principle, the causal strategy constructs a mapping between causal effect values and constraint strategy probabilities by applying reciprocal amplification and normalization to the ATE values. This mapping establishes a probabilistic representation of constraint strategies that clearly reflects their causal impacts on the target operation.
The probabilities of the conventional strategy π ( a | s ) and the causal strategy π a t e ( a | s ) for the state-action pairs of different temporal constraint strategy-action groups are shown in Table 5. Additionally, it shows the possible duration ranges of the corresponding support operations under each action, which are indicated by subscript indices.
The reward values reported in Table 5 are constructed based on the negative absolute deviation between the execution duration of the target support operation and its reference duration, aiming to quantify the immediate impact of different actions on operational efficiency. The reward function adopts a linear penalty structure, which exhibits greater robustness compared to squared-error formulations and effectively mitigates the excessive influence of extreme delay samples on the policy learning process. To ensure numerical stability and smooth policy updates, the reward values are further linearly scaled and shifted in practical implementation.
In Table 1 and Table 5, the bridge docking operation doses not have any associated influencing factors, and consequently, it lacks any temporal constraint action groups. Only the transition probability from state O2 to state O3 is available. To integrate this operation into the overall process, the transition probability for this operation is treated as the strategy probability for selecting an action. As shown in Table 5, certain action groups exhibit identical probabilities under both the conventional and causal constraint strategies. These cases typically fall into two categories. The first category occurs when there is no action group, and the conventional strategy probability is employed as a substitute for the causal strategy probability. The second category represents scenarios in which conventional and causal assessments of the action are consistent. However, the probabilities of most causal strategy differ significantly from those of conventional probabilities. For example, consider the action groups A0~A5 and A5~A15 corresponding to the disembarkation of arriving passengers. The probabilities of causal strategy for these groups are nearly contrary to the conventional probabilities. This discrepancy occurs because the influencing factor, labeled ‘availability of disembarkation assistants’, exhibits a causal effect, indicating that when disembarkation assistants arrive 5 to 15 min before the cabin door opens, there is a greater probability that the operation state can be confined within 0 to 6 min. The last column of the table represents the magnitude of the rewards, which reflects varying levels of encouragement and penalty. Given that the reward design in reinforcement learning is inherently subjective, specific reward values were assigned to each action to facilitate the agent to lean more effectively.

4.4. Ground Handling Temporal Constraint Optimal Strategy Algorithm

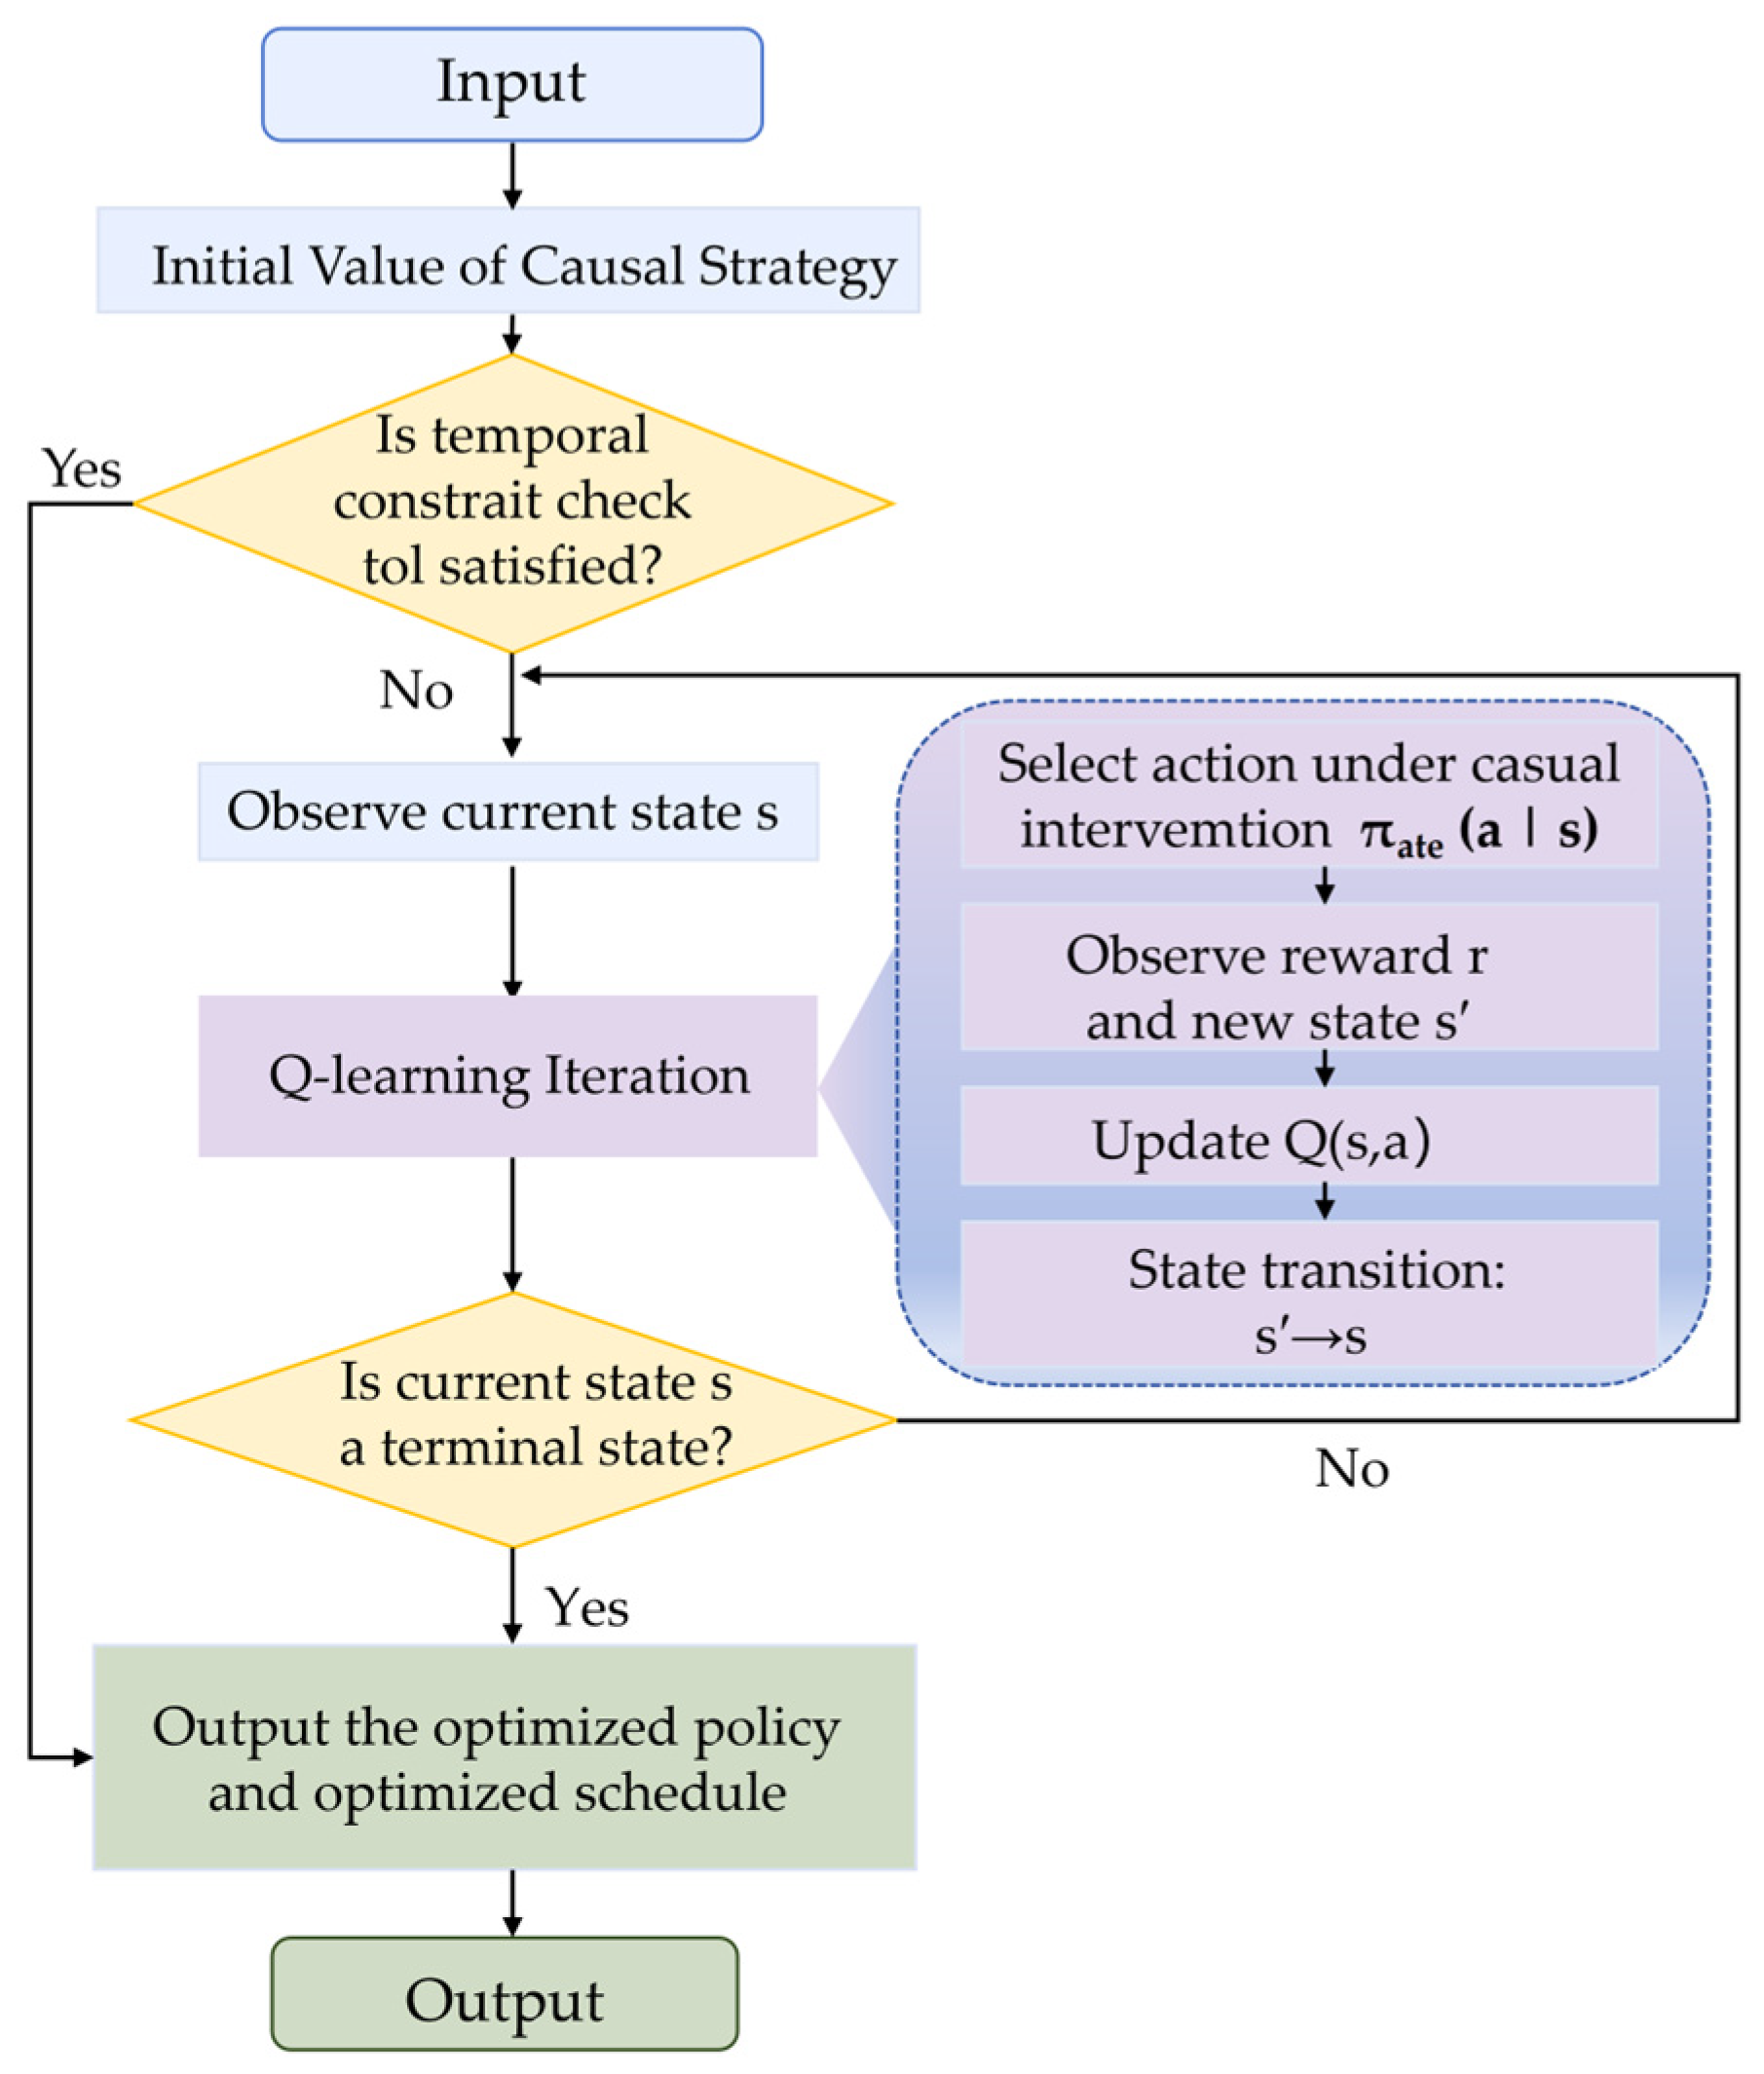
Building upon the prior background and research, this section proposes a causal optimal strategy algorithm based on Q-learning by integrating the causal analysis presented previously [25]. The algorithm is based on two types of value functions [26], which are defined in Equations (8) and (9).
V π ( s ) = a A π ( a | s ) q π ( s , a )
The state value function V π ( s ) is defined as the expected long-term return obtained by taking actions in accordance with a given policy from a known current state s . It represents the expected cumulative reward that can be achieved starting from this state.
q π ( s , a ) = R s a + γ s P s s a V π ( s )
The state-action value function q π ( s , a ) is defined as the expected long-term return obtained by taking action a in a known current state s and subsequently following a given policy. It represents the expected cumulative reward that the agent can achieve from selecting this action until reaching a terminal state.
In the flight ground support process, the initial dynamics of the environment are unknown, and the task scenario has a relatively long duration, encompassing up to nine states. Traditional methods are characterized by the drawback of time-consuming value function computation. In contrast, updating state-action values instead of state values enables a clear assessment of the value of different actions in a given state, which is conducive to policy formulation. Therefore, in line with the temporal difference approach, Equation (10) employs the value of the next action to replace the current state value.
Q ( s t , a t ) Q ( s t , a t ) + α [ R + γ max α Q ( s t , a t ) Q ( s t , a t ) ]
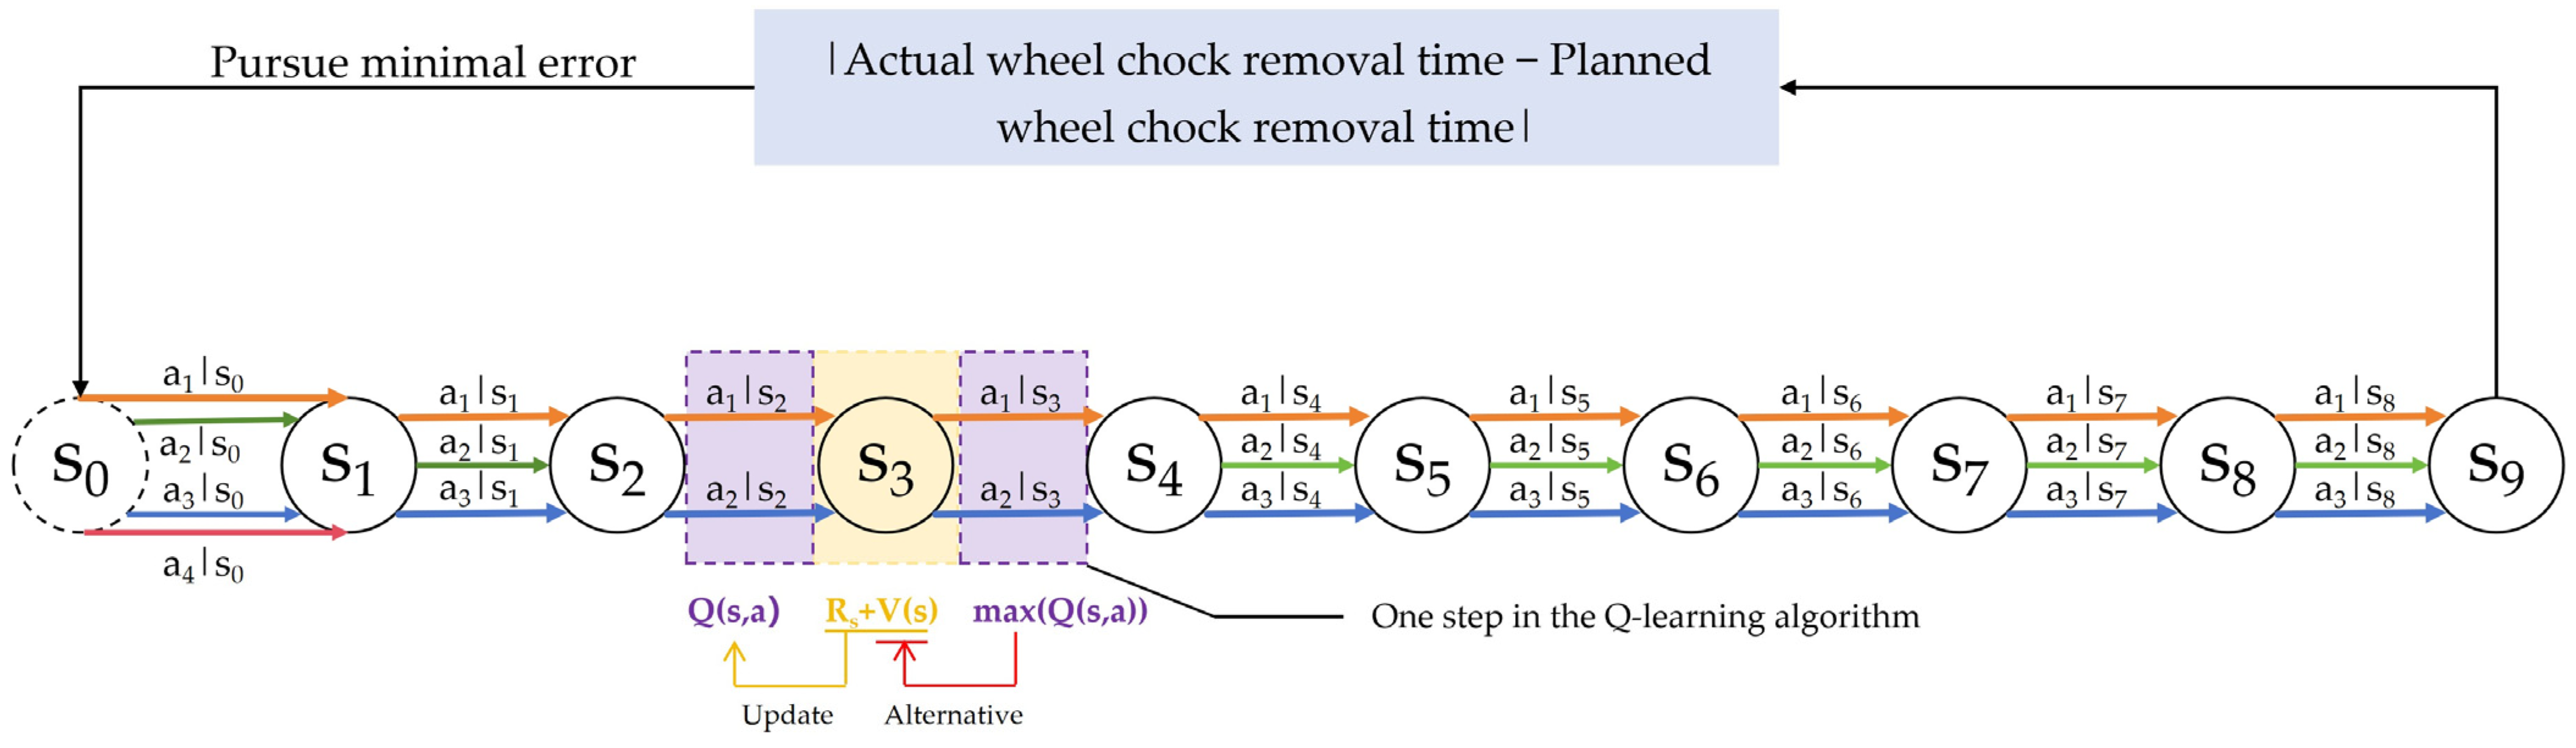
where s t and a t denote the state and action at time step t . Based on the nine flight ground support operations examined in this study, a diagram illustrating the target representation of optimal strategy iteration was constructed. Both the states and the actions available at each state are depicted in Figure 5.
In Figure 5, states s 1 to s 9 correspond to the nine flight ground support operations listed in Table 3. s 0 is a virtual state that precedes s 1 . From this state, four actions, a 1 | s 0 to a 4 | s 0 , can be selected. Upon executing an action, the system transitions to s 1 , where an action is then chosen to determine the transition to s 2 , and this process continues sequentially until reaching s 9 . The time periods of all states are accumulated and added to the actual block-in time of the flight. This cumulative duration is compared with the planned block-out time by calculating the difference between the scheduled and actual departure times. If the resulting values satisfy the threshold requirements defined by the algorithm, the actions selected at each state are output. Otherwise, the process illustrated in Figure 5 is repeated until the requirements are satisfied. If the search exceeds a predetermined maximum time, the agent is considered unable to find a solution that meets the criteria under the current policy, and the iteration comes to an end. The pseudocode of the algorithm is presented in Figure 6.

4.5. Robustness Checks for Causal Effect Estimation

To further evaluate the impact of potential unobserved confounding factors or estimation errors on the policy outcomes, a lightweight parameter perturbation analysis was conducted on the ATE estimates for key intervention intervals. Specifically, proportional perturbations of ±10% were applied to the ATE values of the intervention intervals corresponding to each target ground handling event, as follows:
A T E = A T E × ( 1 ± 0.1 )
Based on the perturbed ATE values, the interval ranking comparison was re-performed. The results indicate that within the ±10% perturbation range, the ranking order of the intervention intervals for each ground handling event remains consistent, and the optimal intervention interval remains unchanged. Further analysis reveals that the minimum difference in ATE between adjacent intervals across all target events exceeds the corresponding maximum perturbation magnitude, demonstrating the stability of the ranking relationships within a reasonable perturbation range.
These findings suggest that, within the observed data conditions, the proposed interval-based causal effect estimation exhibits a certain degree of robustness against moderate estimation errors, thereby enhancing the reliability of the subsequent policy analysis conclusions. It should be noted that this analysis represents a parameter perturbation robustness check and does not provide conclusive evidence of the absence of hidden confounding.

5. Experimental Validation and Comparison

To validate the proposed algorithm, the experimental data employed are identical to those presented in Figure 2 and Figure 3. The aim of identifying the optimal strategy is to allocate the delay between actual and scheduled departures during the ground-service process, thereby improving the punctuality of flight schedules. Additionally, the algorithm can provide the execution efficiency and time requirements for each type of service operation under the conditions investigated in this study. Partial data, including the differences between the planned and actual chock removal times as well as between the actual and scheduled departure times, are shown in Table 6.
Due to the relatively compact state–action space and the causally informed initialization strategy, the Q-learning agent reaches a stable policy within only a few iterations.
The total time constraint of the ground service process is obtained by calculating the differences between the values in the second and third columns. By employing the strategy algorithm, the time constraints for each influencing factor of the service operations that satisfy the total time constraint can be determined. Consequently, the difference between the total time constraint calculated by the algorithm and the theoretical total time constraint shown in Table 6 (i.e., the total ground service process time constraint) is equal to the difference between the actual and planned chock removal times illustrated in Figure 7.
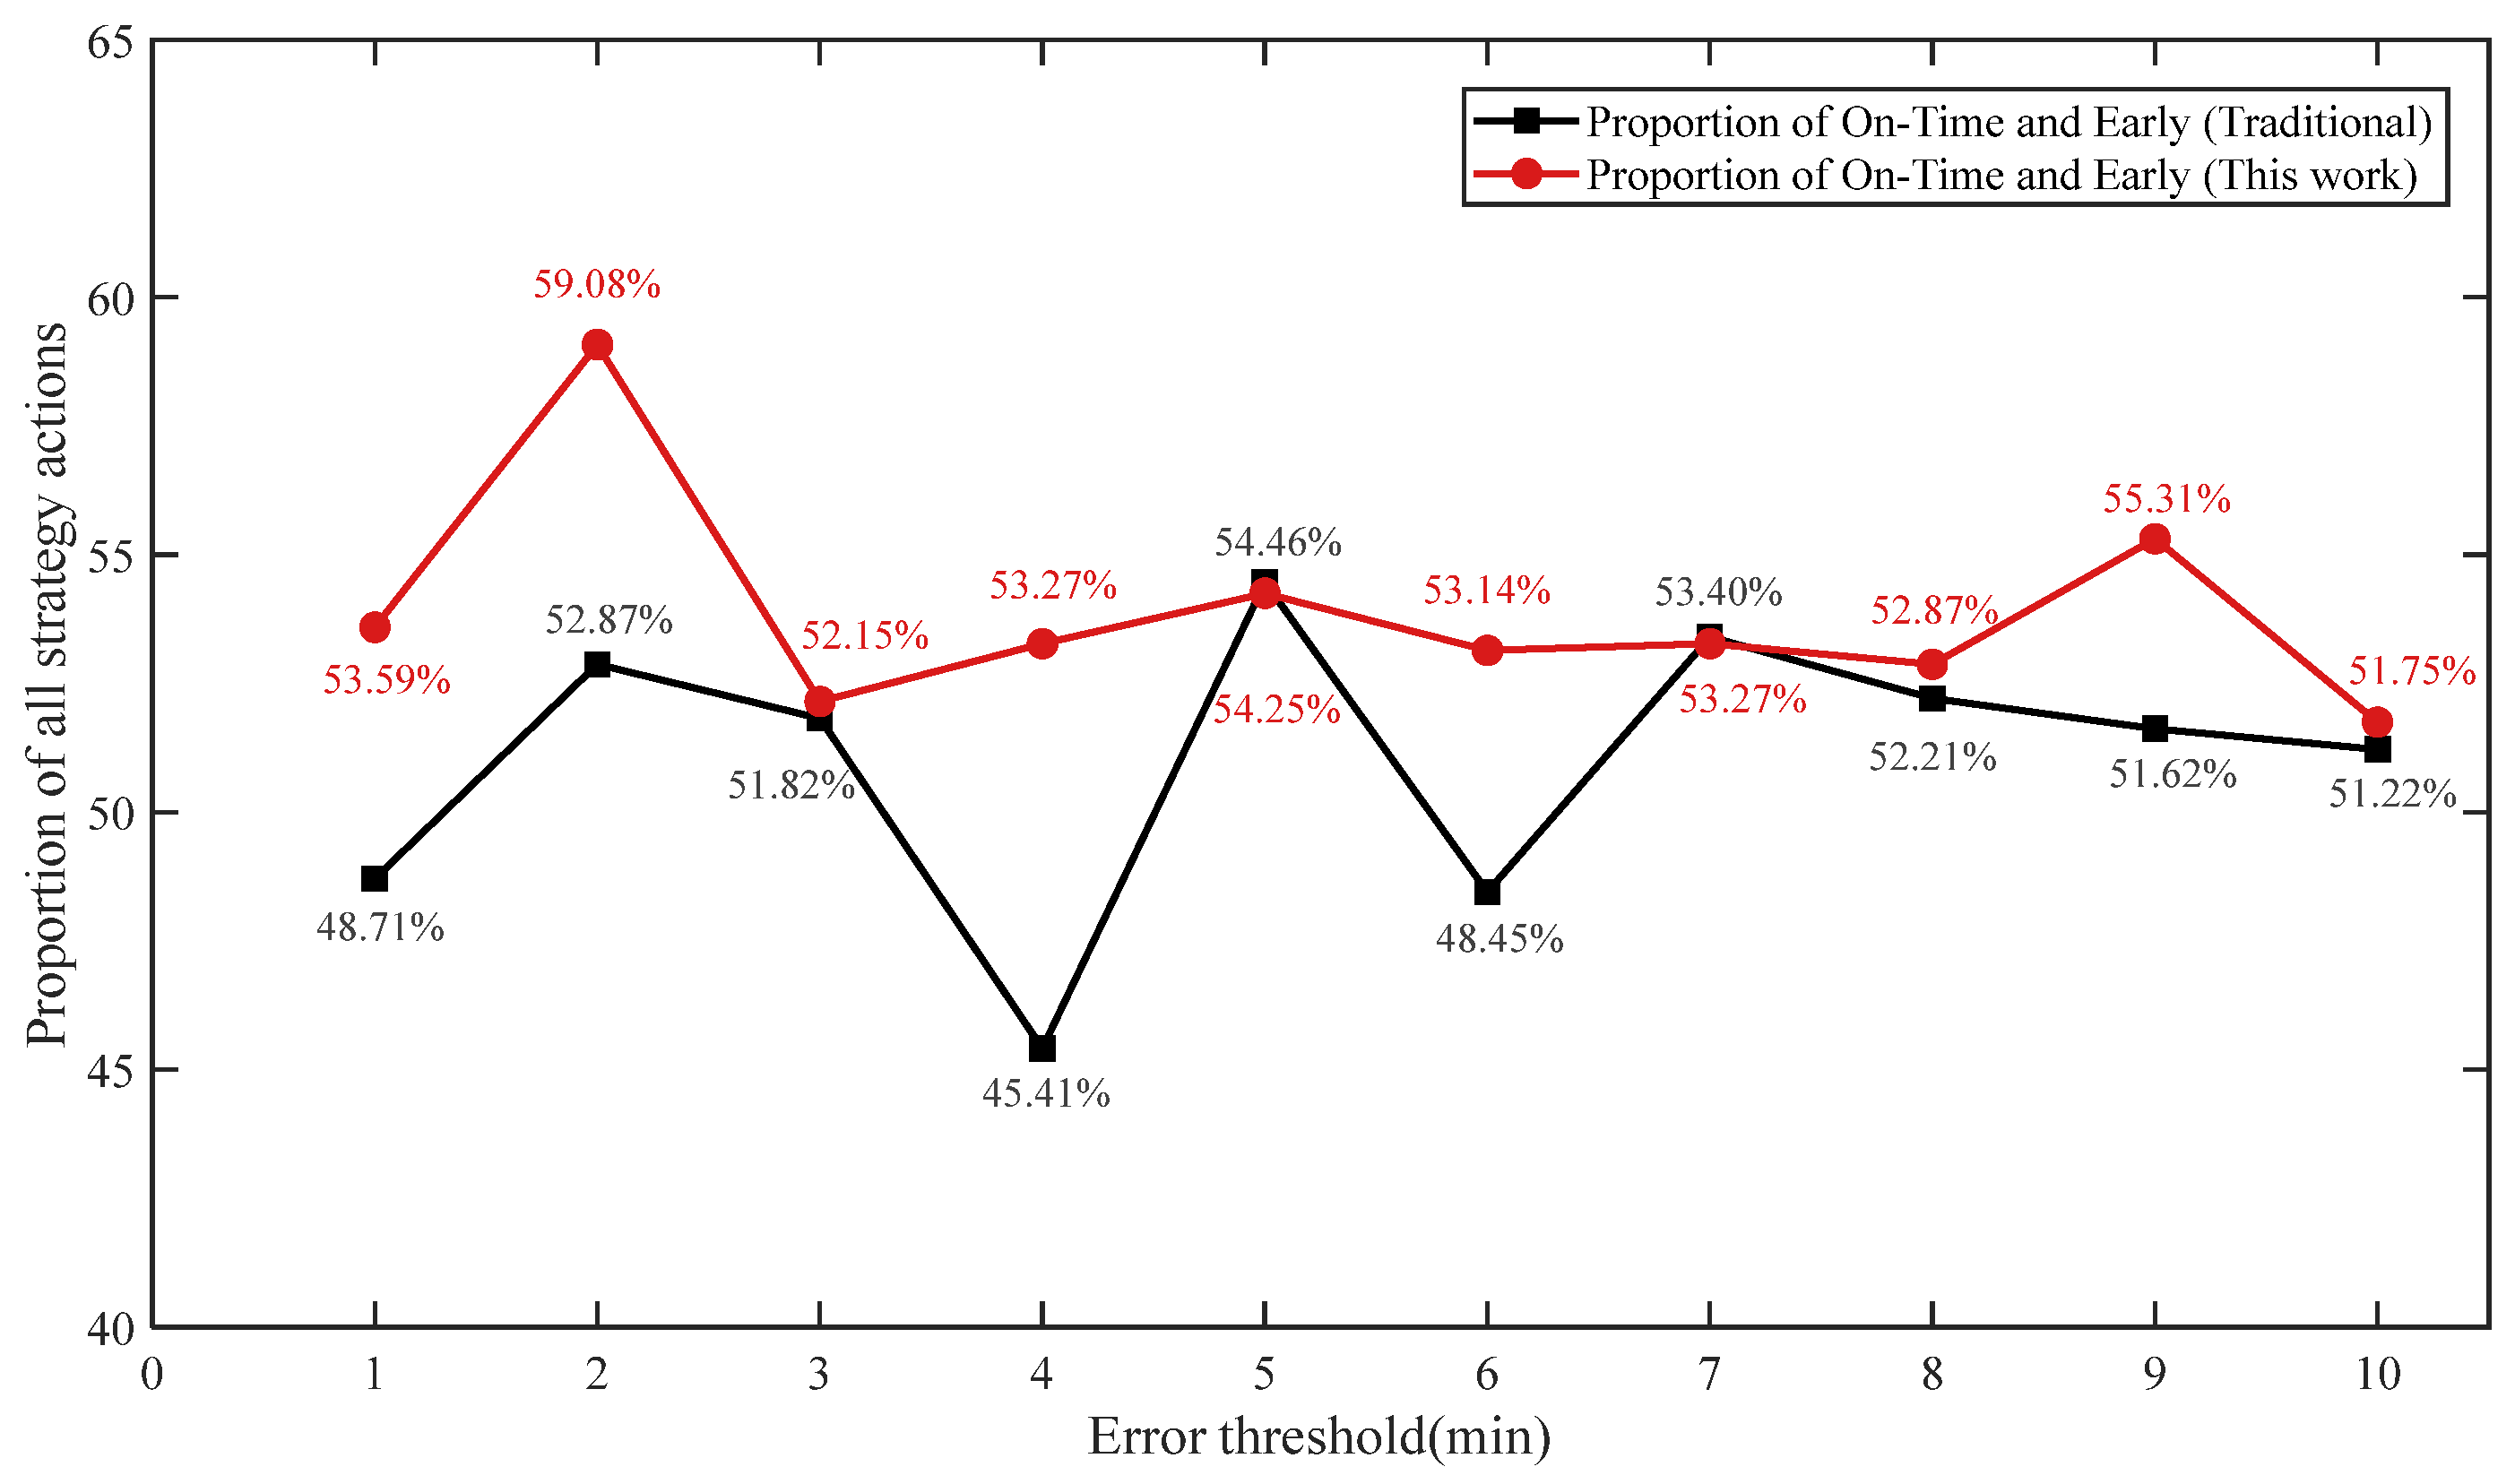
A total of 1515 flight cases were utilized in the experiments. Both the conventional probabilistic strategy and the causal strategy algorithm were applied to analyzing these data. The error threshold was set within the range of 1 to 10 min, and the number of cases in which the total time constraint provided by each strategy was delayed, on time, or early in comparison with the theoretical total time constraint was recorded. The statistical results are shown in Figure 7.
It is shown in Figure 6 that the causal strategy, which accounts for causal relationships, evidently enhances the proportion of strategy actions that achieve on-time or early completion when compared with the conventional probabilistic strategy. The proportion exceeds 51% in all cases, with an average improvement of 2.79%. Conversely, the conventional strategy shows proportions below 50% for error thresholds of 1, 4, and 6 min, dropping as low as 45.41%. These findings indicate that the causal strategy time constraint method is more efficacious than the conventional probabilistic approach in improving the punctuality of flight schedules.

6. Conclusions

In this study, the temporal constraints of flight ground service operations were investigated from a causal perspective. By integrating causal theory into a reinforcement learning framework, a causal-guided decision model was developed to determine the optimal time allocations for individual ground service events, with Q-learning serving as the policy optimization solver. The results indicate that incorporating causal effect information into the decision-making process improves policy stability and enhances departure punctuality when compared with strategies that rely solely on historical statistical frequency.
From a managerial perspective, the findings suggest that airport ground operation control should transcend correlation-based adjustments and instead place emphasis on causally significant operational nodes. The identified high-impact service events provide airport managers with a structured reference for prioritizing resource allocation, coordinating critical service activities, and formulating time-buffer policies. Moreover, the framework offers a data-driven tool for evaluating alternative temporal adjustment schemes before implementation, thus reducing trial-and-error decision risks in complex operational settings.
It is crucial to note that, owing to limitations in the quality and scope of the historical data, only nine key ground service operations were incorporated in the analysis. Other operational processes and potential influencing factors were not included. Consequently, the identified causal structure and policy performance should be interpreted within the context of the selected airport and time period. Future research should incorporate multi-seasonal and multi-airport datasets to evaluate the structural stability and transportability of the proposed causal-guided framework.
Overall, we represent an exploratory attempt to integrate causal reasoning into a well-established reinforcement learning paradigm for the optimization of airport ground service. It is recommended that further research be encouraged to enhance the integration of causal inference methodologies and advanced machine learning techniques within complex operational systems.

Author Contributions

Conceptualization, X.X.; methodology, X.X. and W.W.; software, X.X. and H.F.; validation, M.Z. and W.W.; formal analysis, L.X.; investigation, X.X.; writing—original draft preparation, X.X. and H.F.; writing—review and editing, X.X. and M.Z.; visualization, L.X.; supervision, M.Z.; project administration, M.Z.; funding acquisition, M.Z. All authors have read and agreed to the published version of the manuscript.

Funding

This research was funded by the R&D Program of CAAC Key Laboratory of Flight Techniques and Flight Safety (Grant No. GY2025-16C), and the Project of Sichuan Provincial Engineering Research Center of Smart Operation and Maintenance of Civil Aviation Airports (Grant No. JCZX 2024ZZ14).

Data Availability Statement

Data available on request due to restrictions.

Conflicts of Interest

The authors declare no conflicts of interest.

References

  1. Focus on the Statistical Bulletin of Civil Aviation Industry Development in 2019[EB/OL]. (2020-06-07). Available online: https://www.gov.cn/xinwen/2020-06/13/5519220/files/c5cf239470c64d7fb5cde4626ba9b37e.pdf (accessed on 12 February 2026).
  2. Wang, M.; Liu, C.; Geng, Z. Statistical methods of causal inference. Chin. Sci. Math. 2018, 48, 1753–1778. [Google Scholar]
  3. Yao, L.; Chu, Z.; Li, S.; Li, Y.; Gao, J.; Zhang, A. A survey on causal inference. ACM Trans. Knowl. Discov. Data 2021, 15, 1–46. [Google Scholar] [CrossRef]
  4. Cheng, L.; Guo, R.; Moraffah, R.; Sheth, P.; Candan, K.S.; Liu, H. Evaluation methods and measures for causal learning algorithms. IEEE Trans. Artif. Intell. 2022, 3, 924–943. [Google Scholar] [CrossRef]
  5. Truong, D. Using causal machine learning for predicting the risk of flight delays in air transportation. J. Air Transp. Manag. 2021, 91, 101993. [Google Scholar] [CrossRef]
  6. Silverio, I.; Juan, A.A.; Arias, P. A simulation-based approach for solving the aircraft turnaround problem. In International Conference on Modeling and Simulation in Engineering, Economics and Management; Springer: Berlin/Heidelberg, Germany, 2013; pp. 163–170. [Google Scholar]
  7. Jin, H.; Garcia, E.; Mavris, D.N. Simulation of integrated approach for aircraft turnaround process. In Proceedings of the 2018 AIAA Modeling and Simulation Technologies Conference, Kissimmee, FL, USA, 8–12 January 2018; p. 0418. [Google Scholar]
  8. Kierzkowski, A.; Kisiel, T. A simulation model of aircraft ground handling: Case study of the Wroclaw airport terminal. In Information Systems Architecture and Technology: Proceedings of 37th International Conference on Information Systems Architecture and Technology–ISAT 2016–Part III; Springer: Cham, Switzerland, 2017; pp. 109–125. [Google Scholar]
  9. Luo, Q.; Zhang, L.; Xing, Z.; Xia, H.; Chen, Z.X. Causal Discovery of Flight Service Process Based on Operation Sequence. J. Adv. Transp. 2021, 2021, 2869521. [Google Scholar] [CrossRef]
  10. Imbens, G.W.; Rubin, D.B. Causal Inference in Statistics, Social, and Biomedical Sciences; Cambridge University Press: Cambridge, UK, 2015. [Google Scholar]
  11. Yadlowsky, S.; Namkoong, H.; Basu, S.; Duchi, J.; Tian, L. Bounds on the conditional and average treatment effect with unobserved confounding factors. Ann. Stat. 2022, 50, 2587–2615. [Google Scholar] [CrossRef] [PubMed]
  12. Wu, P.; Luo, S.; Geng, Z. On the comparative analysis of average treatment effects estimation via data combination. J. Am. Stat. Assoc. 2025, 120, 2250–2261. [Google Scholar] [CrossRef]
  13. Austin, P.C.; Stuart, E.A. Moving towards best practice when using inverse probability of treatment weighting (IPTW) using the propensity score to estimate causal treatment effects in observational studies. Stat. Med. 2015, 34, 3661–3679. [Google Scholar] [CrossRef] [PubMed]
  14. Fan, Q.; Hsu, Y.C.; Lieli, R.P.; Zhang, Y. Estimation of conditional average treatment effects with high-dimensional data. J. Bus. Econ. Stat. 2022, 40, 313–327. [Google Scholar] [CrossRef]
  15. Guo, X.; Huang, Y.; Zhang, Y. On Average optimality for non-stationary Markov decision processes in Borel spaces. Math. Oper. Res. 2025, 50, 2552. [Google Scholar] [CrossRef]
  16. Liu, C.; Ding, J.; Sun, J. Reinforcement learning based decision making of operational indices in process industry under changing environment. IEEE Trans. Ind. Inform. 2020, 17, 2727–2736. [Google Scholar] [CrossRef]
  17. Anderson, J.C.; Gerbing, D.W. Structural equation modeling in practice. Psychol. Bull. 1988, 103, 411–423. [Google Scholar] [CrossRef]
  18. Koller, D.; Friedman, N. Probabilistic Graphical Models: Principles and Techniques; MIT Press: Cambridge, MA, USA, 2009. [Google Scholar]
  19. Chickering, D.M. Optimal structure identification with greedy search. J. Mach. Learn. Res. 2003, 3, 507–555. [Google Scholar]
  20. Spirtes, P.; Glymour, C.; Scheines, R. Causation, prediction, and search. Technometrics 1996, 45, 272–273. [Google Scholar]
  21. Rosenbaum, P.R.; Rubin, D.B. The central role of the propensity score in observational studies for causal effects. Biometrika 1983, 70, 41–55. [Google Scholar] [CrossRef]
  22. Baxter, L.A. Markov decision processes: Discrete stochastic dynamic programming. Technometrics 1995, 37, 353. [Google Scholar] [CrossRef]
  23. Kavukcuoglu, K.; Silver, D.; Rusu, A.A.; Veness, J.; Bellemare, M.G.; Graves, A.; Riedmiller, M.; Fidjeland, A.K.; Ostrovski, G.; Petersen, S.; et al. Human-level control through deep reinforcement learning. Nature 2015, 518, 529–533. [Google Scholar] [CrossRef] [PubMed]
  24. Gadaleta, M.; Chiariotti, F.; Rossi, M.; Zanella, A. D-DASH: A deep Q-learning framework for DASH video streaming. IEEE Trans. Cogn. Commun. Netw. 2017, 3, 703–718. [Google Scholar] [CrossRef]
  25. Cao, Y.; Wang, B.C.; Sun, B. Stackelberg games for continuous-time stochastic linear quadratic systems via Q-learning. Sci. China Inf. Sci. 2025, 68, 210204. [Google Scholar] [CrossRef]
  26. Bosisio, A.; Soldan, F.; Pisani, M.; Bionda, E.; Belloni, F.; Morotti, A. A Q-learning algorithm for optimizing on-load tap changer operation and voltage control in distribution networks with high integration of renewable energy sources. J. Mod. Power Syst. Clean Energy 2025, 13, 2063. [Google Scholar]
Figure 1. Causal graph of flight ground service operations.
Aerospace 13 00272 g001
Figure 2. Statistical results of reference values for ground service operation O1: (a) Statistics of reference values for factor A1; (b) Statistics of reference values for ground service operation O1.
Aerospace 13 00272 g002
Figure 3. Statistical results of reference values for ground service operation O3: (a) Statistics of reference values for factor A3; (b) Statistics of reference values for ground service operation O3.
Aerospace 13 00272 g003
Figure 4. Temporal constraint model framework for the support process. In the figure, A–D denote the influencing factors of the events, and n represents the index of the event.
Aerospace 13 00272 g004
Figure 5. Q-learning objective in flight ground support.
Aerospace 13 00272 g005
Figure 6. Causal Optimal Time-Constrained Strategy Algorithm Based on Q-learning.
Aerospace 13 00272 g006
Figure 7. Proportion of on-time and early arrivals under two strategies.
Aerospace 13 00272 g007
Table 1. Nine flight ground support operations and influencing factors.
Target Level (Target Nodes)Influence Level (Factor Nodes)
Aircraft wheel chocking operation O1Arrival of wheel chocking personnel at stand A1Aircraft arrival condition
at stand B1
Passenger boarding bridge docking operation O2None
Cabin door opening operation O3Boarding bridge docking punctuality A3Arrival status of ground handling personnel B3Boarding bridge docking process C3
Arrival passenger disembarkation operation O4Arrival status of disembarkation assistance personnel A4
Cabin cleaning operation O5Arrival status of cabin cleaning personnel A5Disembarkation efficiency of arrival passengers B5Total cabin cleaning time C5
Departure passenger boarding operation O6Arrival status of boarding personnel A6Boarding efficiency of departure passengers B6
Cabin door closing operation O7Disembarkation efficiency of arrival passengers A7Boarding efficiency of departure passengers B7
Boarding bridge removal operation O8Interface condition of boarding bridge removal A8Arrival status of boarding bridge ground personnel B8
Aircraft pushback and wheel chock removal operation O9Arrival status of pushback ground personnel A9Tug docking efficiency B9
Table 2. Quantitative reference measures for influencing factors.
Influencing Factors of Flight
Ground Support
Quantitative Reference Measure
1. Arrival of wheel chocking personnel
at stand
Time difference between flight arrival at stand and arrival of wheel chocking personnel
2. Aircraft arrival condition at standTime difference between flight arrival at stand and aircraft arrival inspection time
3. Boarding bridge docking punctualityTime difference between cabin door opening time and boarding bridge completion time
4. Arrival status of ground
handling personnel
Same as item 1
5. Boarding bridge docking processTime difference between boarding bridge completion time and arrival of boarding bridge personnel
6. Arrival status of disembarkation
assistance personnel
Time difference between cabin door opening time and arrival of disembarkation personnel
7. Arrival status of cabin cleaning personnelTime difference between arrival of cabin cleaning personnel and flight arrival at stand
8. Disembarkation efficiency of arrival passengersTime difference between end time of cabin cleaning and end time of passenger disembarkation
9. Total cabin cleaning timeTime difference between end time and
start time of cabin cleaning
10. Arrival status of boarding personnelTime difference between arrival of boarding personnel and end time of cabin cleaning
11. Boarding efficiency of
departure passengers
Time difference between end time and
start time of passenger boarding
12. Interface condition of
boarding bridge removal
Time difference between cabin door closing time and arrival of boarding bridge removal personnel
13. Arrival status of boarding
bridge ground personnel
Time difference between cabin door opening time and arrival of boarding bridge removal personnel
14. Arrival status of pushback
ground personnel
Time difference between arrival of pushback personnel and release time of flight clearance
15. Tug docking efficiencyTime difference between tug connection time and boarding bridge removal time
Table 3. Reference values for quantifying ground service operations.
Target Ground Service OperationTime Reference Value
Aircraft wheel chocking operation O1Time of chocking completion minus arrival time of ground staff
Passenger boarding bridge docking operation O2Time of jet bridge completion minus arrival time of jet bridge staff
Cabin door opening operation O3Time of passenger disembarkation start minus flight arrival time at the stand
Arrival passenger disembarkation operation O4Time of passenger disembarkation end minus cabin door opening time
Cabin cleaning operation O5Time of cabin cleaning end minus passenger disembarkation end time
Departure passenger boarding operation O6Time of passenger boarding end minus cabin cleaning end time
Cabin door closing operation O7Time of cabin door closing minus passenger boarding end time
Boarding bridge removal operation O8Time of jet bridge withdrawal minus cabin door closing time
Aircraft pushback and wheel chock removal operation O9Time of chock removal minus ground vehicle attachment time
Table 4. Intervention intervals for ground service operations and corresponding ATE.
Target Ground Service OperationATE Intervention Interval GroupsATE Value (min)
Aircraft wheel chocking operation O1A0~5B0~52.9
A5~10B5~107.6
A10~15B10~159.8
A15~20B15~2013.8
Cabin door opening operation O3A−1~2B−1~20C0~181.42
A2~7B0~25C0~302.96
Arrival passenger disembarkation operation O4A0~51.88
A5~150.67
Cabin cleaning operation O5A0~6B−9~9C0~150.81
A6~11B−10~8C0~120.52
A11~17B−10~11C0~151.34
Departure passenger boarding operation O6A−10~−2B3~200.77
A−2~6B7~243.33
A6~14B7~3010.54
Cabin door closing operation O7A0~4B0~210.45
A4~8B5~220.16
A8~12B3~230.31
Boarding bridge removal operation O8A27~39B−1~100.54
A39~51B6~210.22
A51~63B8~290.76
Aircraft pushback and wheel chock removal operation O9A−3~10B0~104.03
A10~23B−1~201.03
A23~49B−1~200.22
Table 5. Probabilities of temporal constraint strategies for support events.
Target Support OperationTemporal Constraint Strategies (Action Groups)State Variation in the Target Support OperationConventional Strategy ProbabilityCausal Strategy ProbabilityReward Corresponding to the State Variation in the Target Support Operation
O1A0~5B0~5O7.7~12.70.310.551.7
A5~10B5~10O11.9~16.90.300.20−0.4
A10~15B10~15O17.7~22.70.200.15−1.7
A15~20B15~20O22.5~27.50.190.10−4
O2NoneO3.5~9.50.620.624
NoneO3.5~9.50.180.181
NoneO3.5~9.50.200.20−2
O3A−1~2B−1~20C0~18O5.7~7.70.670.673.3
A2~7B0~25C0~30O9.5~14.50.330.33−1
O4A0~5O3.2~8.70.710.263.1
A5~15O3.3~8.80.290.743.1
O5A0~6B−9~9C0~15O5~100.410.323
A6~11B−10~8C0~12O4.5~9.50.410.493
A11~17B−10~11C0~15O5.3~11.30.180.192.3
O6A−10~−2B3~20O12.7~19.70.460.763.9
A−2~6B7~24O17.9~29.90.330.181.2
A6~14B7~30O29.9~37.90.210.06−1.7
O7A0~4B0~21O1~70.410.192
A4~8B5~22O1~50.380.533
A8~12B3~23O1.7~3.70.210.283.3
O8A27~39B−1~10O1~50.330.242
A39~51B6~21O1~30.400.593
A51~63B8~29O1~20.270.174
O9A−3~10B0~10O−2~70.140.041.3
A10~23B−1~20O2.3~7.50.430.171.3
A23~49B−1~20O−0.7~6.30.430.792.6
Table 6. Experimental data of Q-learning algorithm.
IndexTime Deviation Between Scheduled and Actual Wheel Chock Removal (min)Time Deviation Between Actual and Scheduled Departure (min)Total Time Constraint of the Ground Handling Process (min)
112517108
21128104
311311102
411913106
51151996
612115106
7961086
Disclaimer/Publisher’s Note: The statements, opinions and data contained in all publications are solely those of the individual author(s) and contributor(s) and not of MDPI and/or the editor(s). MDPI and/or the editor(s) disclaim responsibility for any injury to people or property resulting from any ideas, methods, instructions or products referred to in the content.