1. Introduction
The complexity of Air Traffic Management (ATM) continues to rise alongside the sustained growth in global aviation demand. According to projections by the International Civil Aviation Organization (ICAO), air traffic volume is expected to double by 2030. This will place unprecedented pressure on existing Air Traffic Control (ATC) systems, particularly in Terminal Maneuvering Areas (TMAs) where aircraft density is highest [
1,
2,
3]. In multi-airport terminal areas, overlapping airspace shared by multiple airports creates numerous conflict hotspots where intersecting flight paths converge, significantly increasing the complexity of ATC.
Current air traffic operations face two critical and interrelated challenges. First, from the perspective of spatial conflict, aircraft operating in close proximity must maintain prescribed safety separation standards—typically 5 nautical miles (nm) horizontally and 1000 feet vertically [
4]. The complex intersection of approach flight paths within the terminal area of multi-airport systems creates multiple potential conflict points. Traditional Conflict Detection and Resolution (CD&R) methods, while effective in low-density scenarios, struggle to address the cascading effects triggered by maneuvering in high-density environments [
5]. Second, from the perspective of temporal conflicts, allocating time slot resources for shared entry points and destination airports can lead to severe time conflicts when multiple aircraft require simultaneous access. Aircraft scheduling must comply with wake separation requirements while minimizing delays; however, existing pretactical scheduling methods lack the adaptability needed to address dynamic operational uncertainties.
The fundamental limitation of existing research lies in its isolated processing of the two dimensions of space and time. Focusing solely on conflict resolution methods may generate trajectories that severely compromise scheduling efficiency, while pure scheduling optimization often overlooks spatial conflicts during flight operations. This disconnect between tactical conflict resolution and strategic scheduling leads to suboptimal solutions, making it difficult to implement effective solutions in actual operations.
Achieving effective joint optimization of conflict resolution and aircraft scheduling in the terminal area of multi-airport systems presents four critical challenges:
System Integration Gap: Existing methods typically address only isolated problems in conflict resolution or aircraft scheduling, failing to effectively capture the coupling between spatial maneuvering and temporal sequencing. There is an urgent requirement for a systematic framework capable of integrating three levels: strategic planning, tactical resolution, and execution control [
6,
7,
8].
Multi-source Uncertainty: Terminal area operations in multi-airport systems involve multiple sources of uncertainty, including the time-varying intensity and movement characteristics of dynamic weather conditions, observation errors in aircraft state measurements by detection equipment, and uncertainties in trajectory prediction. Existing methods are predominantly based on deterministic modeling assumptions, resulting in solutions that lack robustness and exhibit poor transferability in practical applications [
9,
10,
11,
12].
Transparency and Human-Centered Deficiencies: Despite demonstrating formidable decision-making capabilities, Deep Reinforcement Learning (DRL) methods operate as “black box” resulting in limited interpretability [
13]. Air traffic controllers require transparent decision processes and solutions aligned with their operational practices. The absence of compliance automation mechanisms and decision transparency hinders the deployment of intelligent methods in practical ATC.
Insufficient Robustness in Abnormal Scenarios: Actual operations encounter various abnormal scenarios, including severe weather, high-density traffic, and emergency conditions such as aircraft loss of control [
14]. Existing methods primarily focus on normal operating conditions, lacking systematic robustness assurance mechanisms and emergency response capabilities for abnormal scenarios.
To address the aforementioned challenges, this paper proposes a multi-level strategic-tactical architecture with a graph neural network and a multi-agent reinforcement learning framework. The crucial innovations of this framework include:
Multi-level Decision-Making Architecture: To address the challenge of system integration gaps, an integrated strategic-tactical-execution framework has been built. The strategic layer performs priority optimization and time slot allocation based on multi-criteria decision-making methods. The tactical layer employs Graph Neural Network Multi-Agent Reinforcement Learning (GNN-MARL) to achieve collaborative conflict resolution. The execution layer ensures plan implementation through behavior trees and rolling time domain trajectory planning. This architecture achieves systematic joint optimization of spatial conflicts and temporal scheduling, addressing the Trajectory-Based Operations (TBO) outlined in the SESAR 2030 and Federal Aviation Administration (FAA) NEXTGEN initiatives [
15].
Uncertainty Perception Mechanism: To address multi-source uncertainty challenges, this mechanism innovatively encodes conflict features as edge attributes in dynamic social graphs. A multi-source uncertainty modeling approach was simultaneously developed: a real-time dynamic weather model captures variations in weather unit radius and movement, while a Gaussian noise-based aircraft perception uncertainty model handles observation errors. The graph attention mechanism addresses partial observability issues in Partially Observable Markov Decision Processes (POMDP), providing a novel paradigm for distributed intelligent decision-making in complex transportation networks.
Compliance Automation System: Addressing transparency and human factors challenges, it employs behavioral cloning technology to learn decision preferences of controllers, achieving a 93.45% accuracy rate in action classification. It provides transparent decision visualization, displaying action value ranking, conflict feature analysis, and decision confidence distribution of each agent [
16]. The FAA right-of-way rules are embedded in behavioral trees to enhance interpretability. The system supports personalized and group conformity models to adapt to different operational habits of controllers. Controller acceptance validation experiments demonstrate a recommendation adoption rate of 78%.
Robustness Assurance for Abnormal Scenarios: Addressing the challenge of insufficient robustness in abnormal scenarios, the system systematically handles aircraft loss-of-control situations through behavior trees and rolling horizon planning [
17,
18]. System performance was validated under dynamic weather conditions of varying severity, with sensitivity analysis demonstrating robustness against up to 7.5% observational noise. A priority-based real-time emergency response mechanism is provided.
To clarify the terminology used in this paper:
“Scheduling without optimization” refers to First-Come-First-Served (FCFS) sequencing, where aircraft are processed in arrival order without considering system-wide efficiency or delay minimization.
“Scheduling without conflict resolution” refers to pre-tactical planning that assigns time slots and sequences assuming nominal trajectories, without accounting for real-time spatial conflicts during flight operations.
“Conflict resolution without scheduling” refers to tactical interventions that resolve immediate separation violations without considering the downstream impact on arrival sequences and runway utilization.
Our “joint optimization” approach simultaneously considers: (a) Temporal objectives: minimizing total delay while satisfying wake separation constraints, (b) Spatial objectives: maintaining required separation throughout flight trajectories, and (c) Coupling constraints: ensuring that conflict resolution actions remain compatible with scheduling constraints and vice versa.
The rest of this paper is structured as follows:
Section 2 reviews relevant research and identifies existing gaps.
Section 3 models the Combined Conflict Resolution and Aircraft Scheduling (CRAS) problem as a Markov Decision Process (MDP).
Section 4 elaborates on the multi-level intelligent decision-making framework, detailing four crucial innovations.
Section 5 presents comprehensive experimental results, including ablation studies and comparative analysis with state-of-the-art methods. Finally, the paper concludes by summarizing its contributions and discussing future research directions.
2. Related Work
Research in conflict resolution and aircraft scheduling has evolved from traditional mathematical optimization to meta-heuristic methods and then to reinforcement learning approaches.
Table 1 summarizes the developmental timeline of conflict resolution and aircraft scheduling research, presenting representative methods and their characteristics across different stages.
2.1. Conflict Resolution Methods Research Progress
Early conflict resolution methods primarily relied on geometric algorithms and predefined rules. The Traffic Collision Avoidance System (TCAS) provides vertical resolution recommendations based on relative aircraft positions, while the newer ACAS X system employs MDP to enhance collision avoidance performance. However, these approaches focus on handling pairwise conflicts and lack global optimization capabilities in dense traffic scenarios [
4,
19].
Optimization-based methods propose various optimization modeling strategies for conflict resolution problems, including Mixed-Integer Programming (MIP) for trajectory planning and Velocity Obstacle (VO) methods for conflict avoidance. Although these approaches theoretically obtain optimal solutions, their computational complexity increases sharply with the number of aircraft, resulting in poor scalability. This limitation restricts their application in real-time operational scenarios involving more than 10–15 aircraft [
20,
21].
Recent research advances have applied Deep Reinforcement Learning (DRL) to conflict resolution problems. Brittain et al. introduced a hierarchical deep reinforcement learning framework, assigning separate agents for path selection and conflict resolution, but their research was confined to two-aircraft conflict scenarios [
27]. Ghosh et al. proposed a Multi-Agent Reinforcement Learning (MARL) approach, configuring an independent agent for each aircraft. However, their research primarily focused on velocity adjustment strategies, failing to encompass multi-dimensional maneuvers such as heading and altitude [
28].
In summary, existing conflict resolution methods exhibit the following limitations: they typically focus on tactical-level solutions while lacking integration with strategic planning; they are based on deterministic environment assumptions, neglecting the impact of dynamic weather and sensor uncertainties; they lack mechanisms for decision transparency and compliance with controller operational preferences; and they demonstrate insufficient capability to handle abnormal scenarios.
2.2. Aircraft Scheduling Methods Research Progress
The Aircraft Landing Problem (ALP) has been extensively studied, with early research primarily employing exact optimization methods. Wang et al. modeled the problem as an MIP problem with runway capacity and time window constraints [
22]. Brittain developed a dynamic programming algorithm for runway scheduling considering Constrained Position Movement (CPM) [
23]. While these methods can provide optimal solutions for small-scale problems, their computational time increases exponentially with problem scale, making them impractical for real-time operations in the terminal areas of multi-airport systems.
To address computational complexity issues, researchers have turned to metaheuristic algorithms, including Genetic Algorithm (GA), Simulated Annealing (SA), and Ant Colony Optimization (ACO). Gui et al. employed the Non-Dominated Sorting Genetic Algorithm II (NSGA-II) to achieve cooperative scheduling in the terminal area of multi-airport systems [
24]. Liang et al. combined Rolling Horizon Control (RHC) with SA to address the dynamic characteristics of the system [
25]. Wang et al. employed an efficient Artificial Bee Colony (ABC) algorithm with a minimax regret criterion to handle uncertainty [
26]. However, these methods focus on scheduling optimization during the pre-tactical phase, neglect spatial conflicts during flight operations, and require recalculation of the entire schedule when new aircraft enter the system, lacking autonomous adaptability.
Recent studies have begun exploring the application of reinforcement learning to aircraft scheduling problems. Guleria et al. applied the Q-learning method to single-runway scheduling [
29]. Xu et al. introduced a reward shaping mechanism, including incremental step rewards to provide more effective learning guidance [
30]. Wang et al. employed the Multi-Agent Deep Deterministic Policy Gradient (MADDPG) algorithm to address hybrid runway operations considering multi-source uncertainties [
31]. IJtsma and Chen developed reinforcement learning-based dynamic scheduling methods for drone swarms [
32,
33].
Overall, the current scheduling approach has the following shortcomings: it optimizes only temporal conflicts at runway thresholds while neglecting spatial conflicts in aircraft routes; it employs a deterministic modeling framework that cannot effectively handle multiple sources of uncertainty during operations; and it lacks seamless integration with real-time conflict resolution mechanisms.
2.3. Conflict Resolution-Aircraft Scheduling Joint Optimization
Research on the joint optimization of conflict resolution and aircraft scheduling remains relatively limited. Liang et al. integrated conflict resolution and scheduling optimization within a rolling time-domain framework using an SA algorithm, but its tight computational coupling hindered the method’s scalability [
25]. Cai et al. investigated coordinated departure scheduling in the terminal area of the Beijing-Tianjin-Hebei multi-airport system using a decomposition-based MARL method. However, their research focused solely on the departure phase and did not address arrival scheduling [
22].
Huang et al. represent a significant advancement in this field, proposing a joint optimization framework incorporating three improvements to MARL: dynamic weather modeling, priority policy design, and reward shaping mechanisms [
17].
However, this work leaves several research gaps: the absence of an explicit strategic planning layer for long-term optimization; conflict features are not explicitly modeled as graph edge attributes, limiting the expressive power of graph neural networks; the lack of systematic controller preference learning mechanism and decision transparency assurance; and limited capability to handle emergency scenarios such as aircraft loss of control and severe weather conditions.
3. Problem Formulation
3.1. Problem Definition and Scope
3.1.1. Initial Assumption
This study examines the terminal area environment of a multi-airport system primarily utilizing free airway airspace, where autonomous aircraft operate based on advanced onboard automation equipment. The terminal area of a multi-airport system comprises terminal airspace shared by multiple airports. Approach fix points connect Standard Terminal Arrival Routes (STARs), with arriving aircraft entering from these approach fix points and proceeding to their destination airports. Dynamic hazardous weather units exist in the environment, with their location and intensity changing over time.
The autonomous joint optimization of aircraft occurs within a continuous time interval spanning from the entry time
to the destination arrival time
. This interval is discretized into time steps
, where
seconds, aligning with the recommended interval for TCAS [
34].
The joint optimization problem is decomposed into two phases, which are as follows:
Phase 1 (Spatial Conflict Resolution): This phase aims to generate conflict-free trajectories for all arriving aircraft within the terminal area of a multi-airport system. This phase must satisfy the following requirements: aircraft separation constraints to prevent separation loss, hazardous weather avoidance and real-time weather unit dynamics, and maneuvering constraints based on aircraft performance limitations.
Phase 2 (Time Scheduling): This phase aims to build conflict-free arrival plans for each destination airport. This phase must satisfy the following requirements: maintaining wake separation intervals between consecutive arriving aircraft, adhering to CPM requirements to preserve arrival fairness, and minimizing delays relative to estimated arrival times.
This study is based on the following assumptions: (1) a two-dimensional uniform airspace representation (horizontal plane) is adopted; (2) only arriving aircraft are considered (departing aircraft are excluded); (3) the initial route from the approach fix to the destination is a straight-line path; (4) airport capacity is sufficient to accommodate all arriving aircraft; (5) velocity adjustments are permitted within operational constraints [
34].
3.1.2. Aircraft Characteristics Modeling
This study considers heterogeneous aircraft operating within the terminal maneuvering area. Aircraft are categorized into four wake turbulence categories following ICAO standards: Super Heavy (A380), Heavy (B777, B747), Medium (A320, B737), and Light (general aviation). The aircraft characteristics influencing scheduling include:
The joint optimization problem is decomposed into two phases, which are as follows:
Performance Envelope: Each aircraft category has specific performance constraints: (1) Velocity range: , where Heavy aircraft: knots, Medium: knots, Light: knots; (2) Turn rate limit: depending on aircraft category; (3) Climb/descent rate: ft/min.
Wake Separation Requirements: The minimum time separation
between consecutive aircraft depends on the leader-follower weight category combination, as specified in
Table 2. For example, a Medium aircraft following a Heavy aircraft requires 120 s separation, while two Medium aircraft require 60 s.
Approach Speed Profiles: Different aircraft types follow category-specific approach speed profiles, affecting their time-to-destination calculations and sequence optimization.
These heterogeneous characteristics are incorporated into both the strategic layer (for wake separation-aware time slot allocation) and the tactical layer (for performance-constrained maneuver selection).
3.2. Markov Decision Process Modeling and Safety-First Optimization Philosophy
3.2.1. Markov Decision Process Modeling
The joint optimization problem is modeled as an MDP defined by a six-tuple , where represents the state space, represents the action space, is the reward function, is the state transition probability function, is the discount factor, and represents the initial state distribution.
State Space
. At time step
, the observed state
of aircraft
contains the following information, defined as follows:
where
represents the three-dimensional position,
is the heading,
indicates the airspeed,
signifies the reference arrival time at the destination
, and
denotes the arrival sequence.
Action Space
. Each aircraft selects a discrete maneuver action at each time step, defined as follows:
where
represents the speed maneuvers,
represents heading maneuvers. These maneuvers are constrained by the maximum overload limit
specified in CCAR-25.
Reward Function
. The reward function is designed to balance multiple objectives, including conflict resolution, scheduling efficiency, and trajectory smoothness. At each time step, the reward for the aircraft
is computed as:
where
penalizes separation violations, with
being the number of conflicts and
;
penalizes delays relative to reference arrival times, with
;
penalizes abrupt maneuvers, with
;
when aircraft successfully reaches its destination without conflicts, with
.
Transfer Function
. The evolution of the system state follows the aircraft kinematic equations, as shown below:
where the heading is updated based on the selected maneuver.
Strategy Function
. Policy
maps states to action probability distributions
. The optimization objective is to find the optimal policy
that maximizes the expected discounted cumulative reward:
where
represents the trajectory of aircraft
from entry to destination,
represents the total number of time steps for aircraft
, and
is the discount factor that balances immediate and future rewards. The expectation
is taken over all possible trajectories generated by following policy
,
in the superscript of the summation serves as the terminal time index (not an exponent), indicating that rewards are accumulated from the entry time step
until the aircraft reaches its destination at time step
.
Initial State Distribution . The initial state distribution characterizes the probability distribution over starting configurations. In our terminal maneuvering area scenario, is determined by: (1) Aircraft entry times following a Poisson process with rate aircraft/hour; (2) Entry point selection based on historical origin-destination flow matrices; (3) Initial velocities uniformly distributed within knots.
3.2.2. Safety-First Optimization Philosophy
In this paper, we acknowledge that conflict-free operations represent an absolute requirement in air traffic management—safety is non-negotiable. Our optimization framework addresses this through a hierarchical constraint structure:
This formulation reflects operational reality: when multiple conflict-free solutions exist (which is typical in well-designed airspace), optimization selects the most efficient among them. The experimental results (Table 4) demonstrate that our method achieves 97.9% resolution rate, with the remaining conflicts handled by the robust emergency mechanism.
Furthermore, the optimization approach provides several advantages over pure rule-based systems:
Proactive Conflict Avoidance: By anticipating potential conflicts through forward simulation, the system can take early, minimal interventions rather than reactive emergency maneuvers.
Resource Efficiency: Among multiple safe trajectories, optimization identifies those minimizing fuel consumption and delays.
Adaptability: The learned policy adapts to varying traffic patterns without manual rule updates.
3.3. Problem Complexity Analysis
The joint optimization problem formulated in this paper is inherently non-convex due to several factors:
Discrete Action Space: The maneuver actions (speed and heading adjustments) are discrete, introducing combinatorial complexity.
Coupled Constraints: The aircraft separation constraints create pairwise coupling between all aircraft, resulting in non-convex feasible regions.
Dynamic State Evolution: The system transitions depend on the joint actions of all aircraft, creating a multi-agent optimization problem that cannot be decomposed into independent subproblems.
Temporal Dependencies: The sequential nature of decision-making, where current actions affect future states and constraints, introduces temporal non-convexity.
Given the non-convex nature of this problem, traditional gradient-based optimization methods cannot guarantee global optimality. This motivates our adoption of Multi-Agent Reinforcement Learning (MARL), which handles discrete action spaces naturally through policy learning, captures complex state-action dependencies through neural network approximation, scales to large numbers of agents through decentralized execution with centralized training and provides near-optimal solutions efficiently for real-time applications.
While MARL does not guarantee global optimality, our experimental results (
Section 5) demonstrate that the learned policies consistently outperform existing methods across multiple performance metrics.
3.4. Constraints and Objectives
Throughout the overall modeling process, the optimization problem is subject to the following four types of constraints: aircraft separation constraints, weather avoidance constraints, wake separation constraints, and constraints on positional movement limitations. The mathematical definitions for each constraint category are as follows.
Aircraft separation constraints are defined as the spatial separation between any two aircraft within an airspace, as expressed by the following equation:
where
represents the Euclidean (L2) norm,
represents the minimum safety separation standard. Specifically, for horizontal separation
refers to the two-dimensional Euclidean distance
with
nautical miles; for vertical separation,
utilizes the absolute value (L1 norm in one dimension) with
feet.
Weather avoidance constraints require aircraft to maintain a safe distance from hazardous weather units. In addition to the aforementioned aircraft separation constraints, aircraft must also satisfy weather avoidance constraints, defined as follows:
where
represents the Euclidean norm measuring the horizontal distance between aircraft position,
is the fixed weather units radius,
is the scaling factor,
nautical miles.
Wake separation constraints specify the minimum time interval that must be maintained between aircraft arriving consecutively at the same destination airport. In addition to the aforementioned spatial constraints, aircraft must also satisfy temporal constraints (wake separation and positional movement). Wake separation constraints are defined as the following equation:
where
is determined according to the aircraft weight category based on ICAO standards.
CPM limits the range of positional changes an aircraft can undergo relative to its initial arrival sequence during the scheduling process to ensure scheduling fairness. It is defined as follows:
where
is the maximum allowable sequence shift.
Subject to all the above constraints, the optimization objective is to minimize the system delay, as expressed by the following equation:
where
represents the delay time,
represents the set of conflict-free trajectories, and
denotes the set of conflict-free arrival time.
4. Methodology
4.1. Framework Overview
4.1.1. Framework Explanation
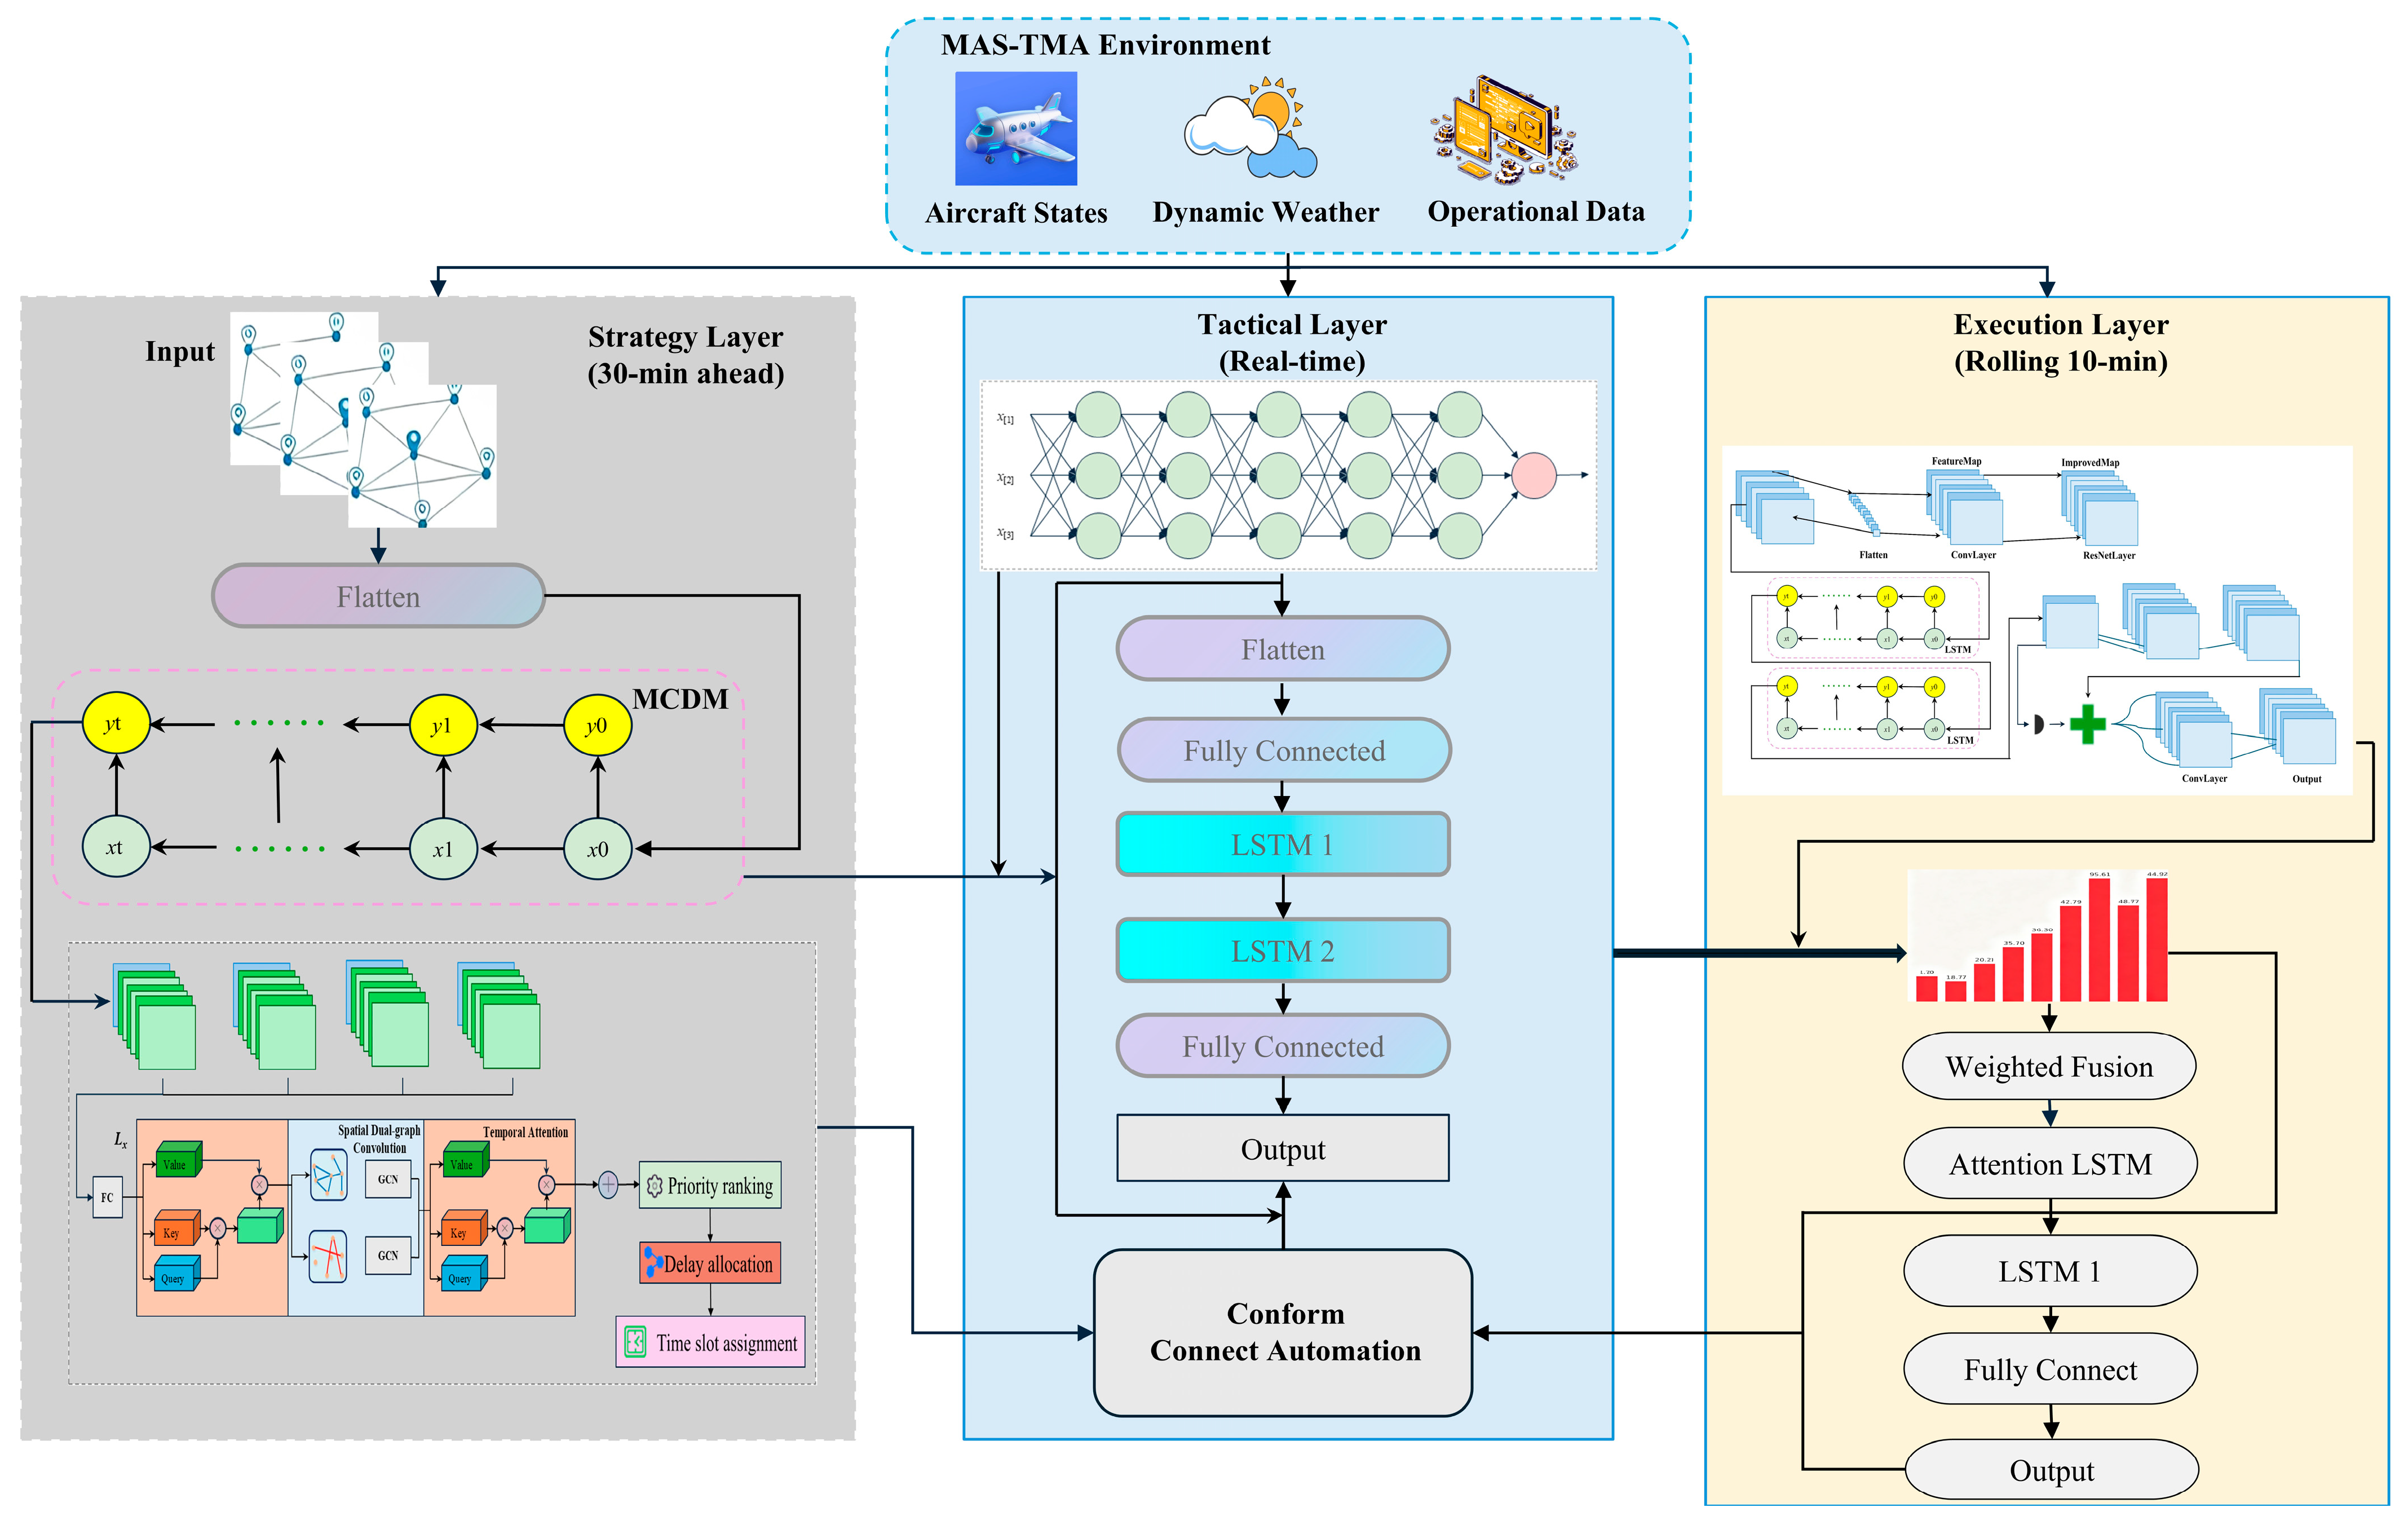
The overall architecture of the proposed MSTAGNN-MARL framework is shown in
Figure 1. This framework comprises four crucial components: the strategic layer (multi-criteria decision planning), the tactical layer (graph neural network-based multi-agent reinforcement learning solution), the execution layer (trajectory planning), and the inter-layer integration mechanism.
As shown in
Figure 1, the strategic layer covers the 30 min preceding the pre-tactical phase, primarily performing multi-criteria decision optimization. This includes aircraft prioritization based on emergency level, flight phase, and conflict involvement; optimal delay allocation targeting minimization of total system delay; and time slot allocation for shared approach fix and runway utilization. This layer employs the MEREC (Method of Effect Removal by Criteria) and MARCOS methods to generate the priority vector
and the strategic delay allocation scheme
[
35].
The tactical layer operates within the tactical real-time phase, primarily enabling multi-agent collaborative conflict resolution through: dynamic conflict graph construction based on edge features, collaborative action selection adhering to priority policies, and real-time trajectory adjustments accounting for dynamic weather characteristics. This layer employs an architecture combining Graph Attention Networks (GATs) with Deep Q-Network (DQN) to generate maneuvering action commands for all aircraft.
The execution layer operates within a 10 min window for short-term rolling optimization, primarily handling trajectory generation and emergency handling. Its functions include behavior tree-driven action execution based on FAA right-of-way rules, RHC for smooth trajectories, and emergency response and recovery maneuvers for loss-of-control scenarios. This layer employs rolling time-domain control and constraint optimization methods to output an executable sequence of trajectory waypoints .
Within the inter-layer integration mechanism, the priority of the strategic layer guides tactical layer action selection through weighted Q-values, tactical layer maneuver decisions provide reference information for trajectory planning at the execution layer, and feedback from the execution layer is used to update the strategic delay estimate for the next optimization period.
4.1.2. Strategic Layer: Multi-Criteria Decision Optimization
The strategic layer employs MEREC (Method based on the Removal Effects of Criteria) for objective weight determination and MARCOS (Measurement of Alternatives and Ranking according to Compromise Solution) for aircraft priority ranking.
MEREC Weight Determination. MEREC determines criterion weights based on the effect of removing each criterion on the overall decision matrix. Given a decision matrix with m aircraft and criteria, the procedure is:
Step 1: Normalize the decision matrix using logarithmic normalization, which is as follows,
Step 2: Calculate the overall performance of alternatives using the following equation,
Step 3: Compute removal effect using the following equation,
Step 4: Determine final weights using the following equation,
In our application, the criteria include: (1) Emergency level, (2) Remaining flight time, (3) Current conflict involvement, (4) Fuel status, (5) Passenger connectivity requirements.
MARCOS Ranking. Using the MEREC-derived weights, MARCOS ranks aircraft by computing utility degrees relative to ideal and anti-ideal solutions:
Step 1: Construct an extended decision matrix with ideal (AI) and anti-ideal (AAI) solutions.
Step 2: Calculate weighted normalized matrix: where .
Step 3: Compute utility degrees using the following equation,
where
.
Step 4: Determine the final utility function using the following equation,
Aircraft are then ranked by values, with higher values indicating higher priority for resource allocation and conflict resolution precedence. This multi-criteria approach enables transparent, explainable priority decisions that incorporate multiple operational factors beyond simple arrival time ordering.
4.2. Multi-Agent Reinforcement Learning
The crucial innovation of the MSTAGNN-MARL framework is the GNN-MARL architecture, which incorporates two innovative mechanisms: explicit edge feature encoding and multi-source uncertainty modeling.
4.2.1. Dynamic Conflict Graph Construction
Unlike existing graph neural network-based ATM methods that only encode node features, the explicit edge feature encoding mechanism proposed in this paper enables the network to:
Learn directly from conflict characteristics (severity, geometric relationships, temporal properties).
Distinguish between conflict types requiring different resolution strategies (e.g., head-on conflicts versus overtaking conflicts).
Incorporate relative priority information to achieve coordinated multi-agent decision-making.
The dynamic social graph constructed at each time step is represented as follows:
where node
corresponds to each aircraft
. Edge
represents a bidirectional connection between conflicting aircraft
i and
j. Node feature
contains the characteristics of each aircraft, with dimension
. Edge feature
contains conflict characteristics, with dimension
.
Node feature encoding employs an explicit coding approach, integrating multi-source information into a unified feature representation, defined as follows:
where
is the normalized position vector,
is the normalized velocity vector,
is the normalized priority,
is the position uncertainty from the sensor,
represents the weather effect, computed from the nearby weather unit.
Edge feature encoding achieves this by explicitly modeling conflict relationships between aircraft in airspace, incorporating the following key characteristics: horizontal distance, vertical separation, Time of Closest Point of Approach (TCPA), conflict severity score, conflict type indicator, and relative priority difference. The edge feature vector is defined as follows:
where
represents the horizontal distance (normalized by dividing by 10 nautical miles),
denotes the vertical separation (normalized by dividing by 2000 feet),
indicates the time of closest approach (normalized by dividing by 10 min),
signifies the conflict severity score,
,
, and
serve as conflict type indicators, and
reflects the relative priority difference.
4.2.2. Image Attention Network Architecture
This paper employs a dual-layer graph attention network architecture with edge features to enhance the ability to represent aircraft states in airspace and characterize conflict features. The forward propagation process of the network is defined as follows:
The layer-wise attention network updates the stage representation by calculating attention coefficients and performing weighted fusion, as described by the following equation:
The attention coefficient
is calculated using the following equation:
After the graph convolution operation in the graph attention network is completed, the policy and value outputs of each agent are obtained as follows:
where
represents the Q-value for each action output, and
represents the estimated state value.
4.2.3. Multi-Source Uncertainty Modeling
Multi-source uncertainty modeling comprises two submodules: a real-time dynamic weather model and an observational uncertainty model. In a real-time dynamic weather model, weather units are modeled as circular regions with time-varying properties, as shown in the following equation:
where
represents the center of mass position of the weather unit,
represents the velocity vector,
indicates the effective radius, and
represents the scaling factor.
The formulation for calculating the weather impact factor on aircraft
i is as follows:
For each agent
i in the environment, the partial observation it receives is represented as:
where
represents the self-observation received at time step
t, and
N represents the number of recently detected aircraft that have been padded/cropped to a fixed dimension.
4.2.4. Priority-Based Collaborative Action Execution Strategy
To accelerate the training process and enhance the interpretability of decisions, a priority-based action execution mechanism is introduced. The priority criterion function is expressed as follows:
where
represents the number of conflicts involving aircraft
i,
denotes the normalized destination distance, and
indicates the normalized heading deviation.
For conflicting aircraft pairs, the “late-arriving aircraft adjusts first” principle is applied, meaning aircraft with later estimated arrival times receive priority for trajectory adjustments. For conflict groups involving multiple aircraft, sorting is performed based on priority scores, with the highest-priority aircraft maintaining its current trajectory unchanged. This priority strategy embeds domain knowledge into the reinforcement learning framework, effectively improving training efficiency and operational transparency.
4.2.5. Algorithm Implementation Details
To facilitate independent implementation and verification, Algorithm 1 presents the complete training procedure of the MSTAGNN-MARL framework.
| Algorithm 1 MSTAGNN-MARL Training Procedure |
| Require: | Environment
Strategic planner
|
| Ensure: | |
| 1: | Initialize replay buffer
|
| 2: | Initialize Q-networks for all agents |
| 3: | for episode
do |
| 4: | |
| 5: | |
| 6: | do |
| 7: | |
| 8: | do |
| 9: | |
| 10: | |
| 11: |
end for |
| 12: | |
| 13: | Store transition in |
| 14: | Sample minibatch from , update networks using TD-learning |
| 15: | Soft update target networks:
|
| 16: |
end for |
| 17: | end for |
The key hyperparameters are summarized in
Table 3, including network architecture parameters (attention layers, hidden dimensions), training parameters (learning rate, batch size), and environment-specific settings.
4.3. Compliance Automation and Transparency
To address the crucial requirements of human–machine collaboration and decision explainability in safety-critical ATM systems, this paper employs compliance automation and transparency mechanisms to ensure the transparency of the operational preferences and decision-making of air traffic controllers.
4.3.1. Controllers’ Preferred Behavioral Clone Learning
To learn and preserve solution preferences of air traffic controllers, this research collected decision data from eight experienced controllers with distinct solution preferences and styles: Controller 0 preferred heading change strategies with 80% conservatism; Controller 1 favored altitude change strategies with 60% conservatism; Controller 2 favored velocity adjustment strategies with 70% conservatism; Controller 3 favored heading adjustment strategies with 50% aggressiveness; Controller 4 favored altitude change strategies with 90% conservatism; Controller 5 favored combined maneuver strategies with 60% conservatism; Controllers 6 and 7 favored heading and velocity adjustment strategies, respectively, each with varying conservatism levels.
The controller decision generated for each conflict scenario is represented as:
where
represents the type of change, while
,
, and
represent the magnitude of change.
4.3.2. Transparent Dashboard Design
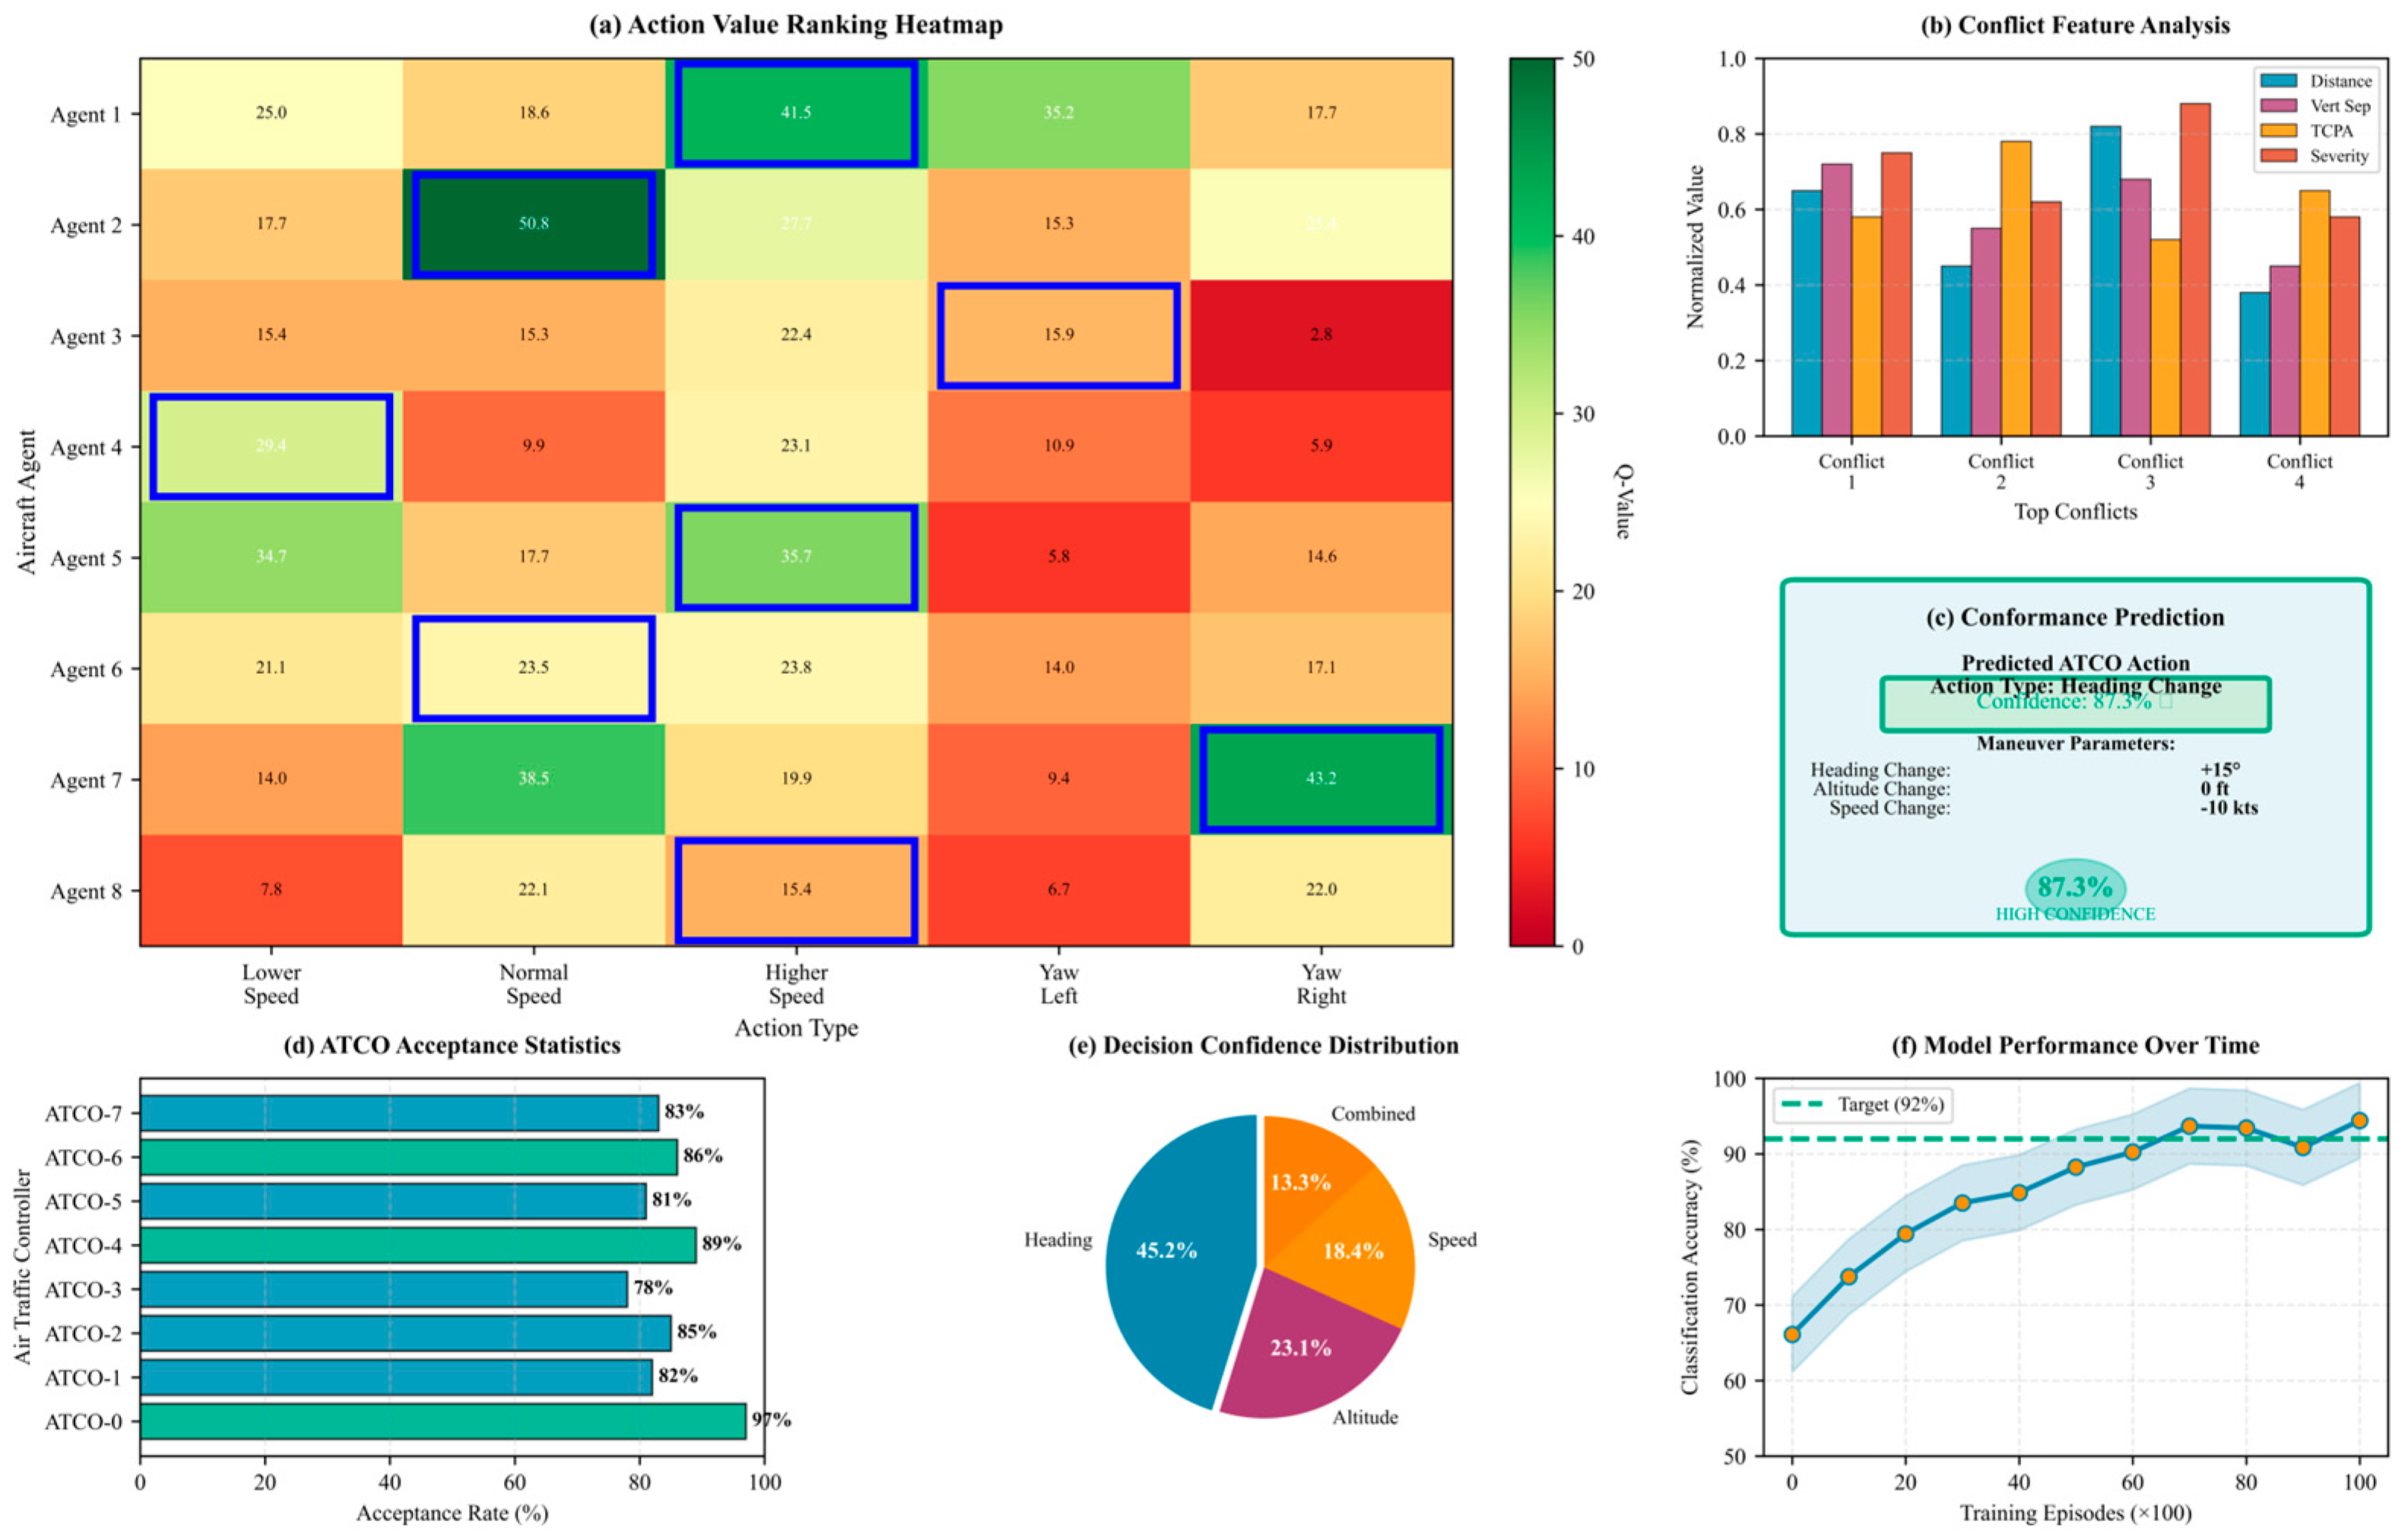
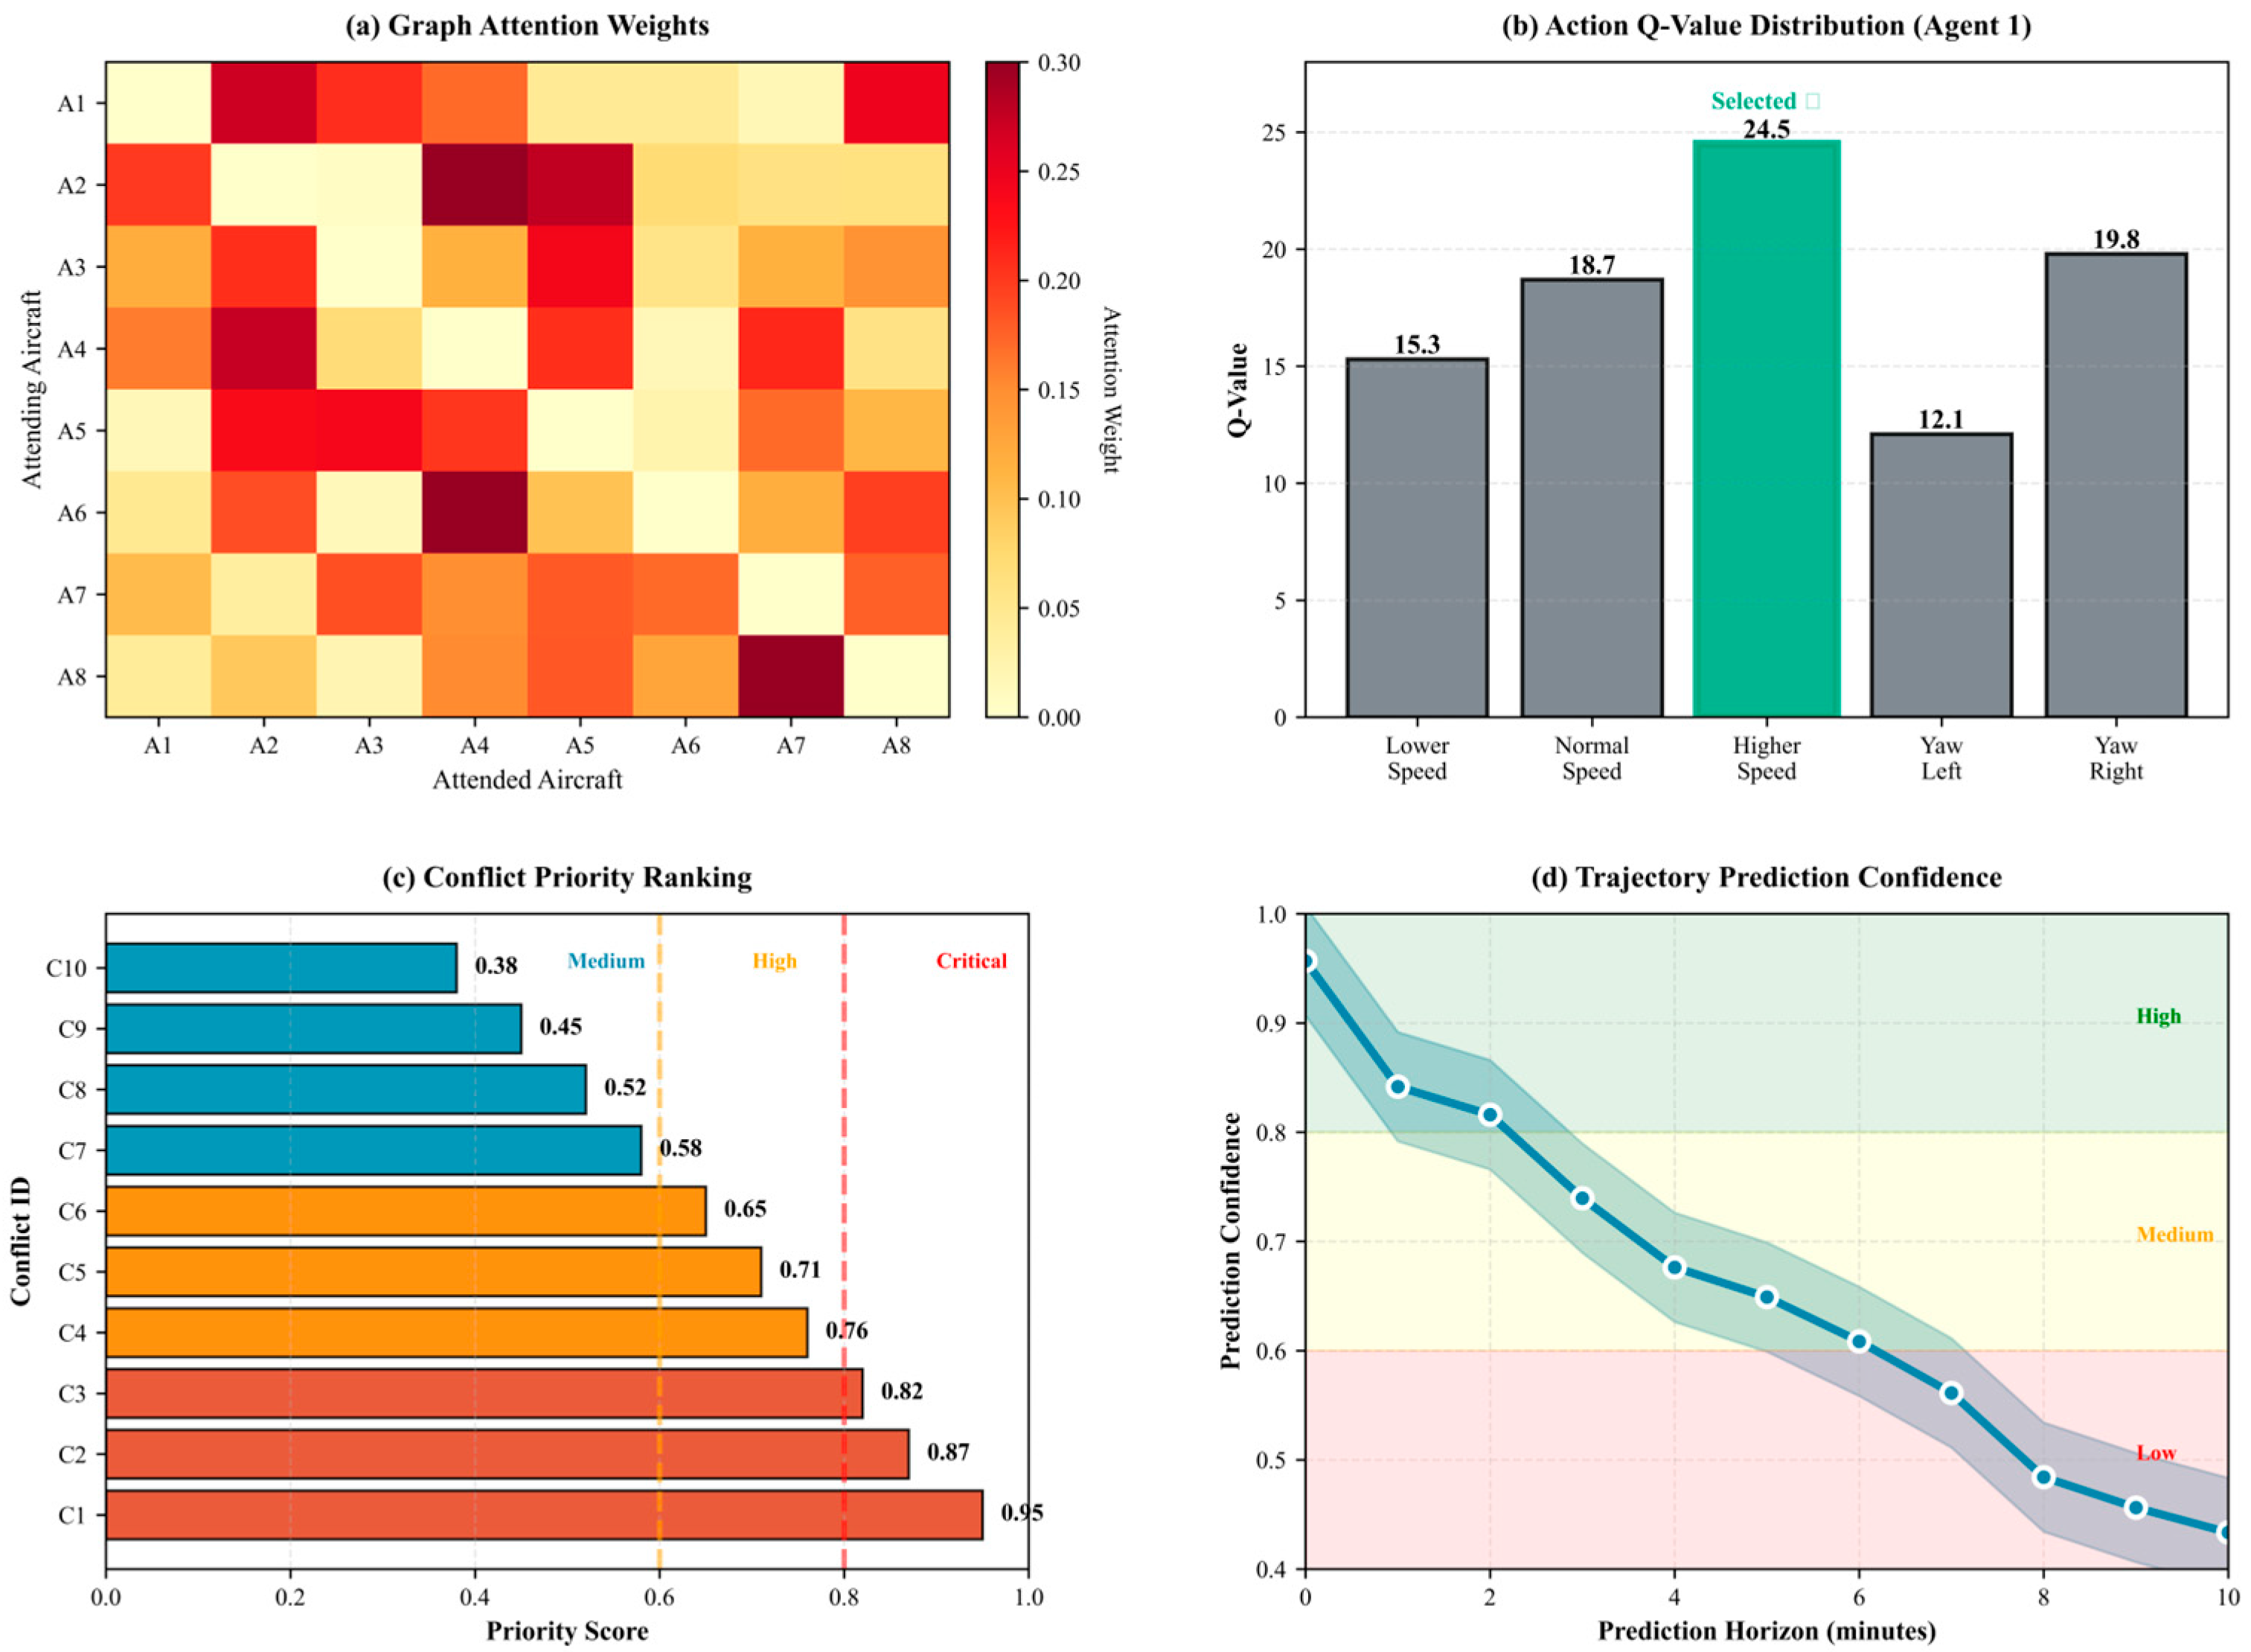
To ensure transparency in system operations, a visual decision support interface has been designed. This interface comprises five crucial components: action value sorting heatmap, conflict feature analysis panel, compliance prediction panel, controller acceptance rate statistics, and decision confidence distribution, as shown in
Figure 2.
In the visualization interface, the action value sorting heatmap shows the Q-value distribution for all candidate actions of each agent, highlighting the selected action with a blue box to help controllers understand the rationale behind the decision of “why this action was chosen.” The conflict feature analysis panel presents normalized characteristics of critical conflicts—including distance, vertical separation, time of closest approach, and severity—using grouped bar charts for intuitive comparison.
The compliance prediction panel shows predicted controller actions with confidence levels, color-coded by confidence: green (>80%) indicates high confidence, yellow (60–80%) indicates medium confidence, and red (<60%) indicates low confidence. Predicted maneuver parameters are also listed. Controller acceptance rate statistics show the historical acceptance rate of each controller (via bar charts) to track model performance evolution over time. The decision confidence distribution shows the probability distributions of different action categories via pie charts, aiding assessment of decision certainty.
4.4. Abnormal Scenarios Robustness
4.4.1. Safety Factor and Capacity Reserve
To handle unforeseeable situations, the system maintains operational margins as safety factors:
Separation Buffer: The working separation standard is set at 110% of the regulatory minimum (5.5 nm instead of 5 nm horizontal, 1100 ft instead of 1000 ft vertical), providing buffer for unexpected trajectory deviations.
Capacity Reserve: The system operates at 85% of theoretical maximum capacity, reserving 15% capacity for emergency handling. When traffic density exceeds this threshold, ground delay programs are recommended.
Uncertainty Margins: The Gaussian noise-based perception uncertainty model (
Section 4.2.3) explicitly accounts for: (1) Sensor errors: Position uncertainty
nm, Velocity uncertainty
knots; (2) Trajectory prediction errors: Modeled as increasing uncertainty over the prediction horizon; (3) Communication delays: Assumed 3 s latency in action execution.
4.4.2. Abnormal Scenarios Robustness Formulation
To ensure the framework can handle emergencies beyond normal operating conditions, a rolling time-domain trajectory planning method is employed to uniformly address both normal and emergency scenarios. For the trajectory planning problem, a 10 min rolling optimization is employed. The optimization formulation is expressed as follows:
where
is the smoothing factor,
is the aircraft position vector at time
k,
is the target position vector, and
is the velocity vector, constrained by the velocity limit
.
The planning problem is subject to aircraft dynamics constraints. The position relationship between the aircraft at the current time step and the next time step is defined by the following equation:
where
represents the velocity control vector within the planning time domain.
When detecting aircraft loss of control, the system activates emergency trajectory planning mode. At this point, the target position vector of the aircraft is set to the recovery waypoint output by the behavior tree, ensuring the aircraft can safely return to normal flight status.
5. Experiments
5.1. Experiment Settings
5.1.1. Experiment Scenario
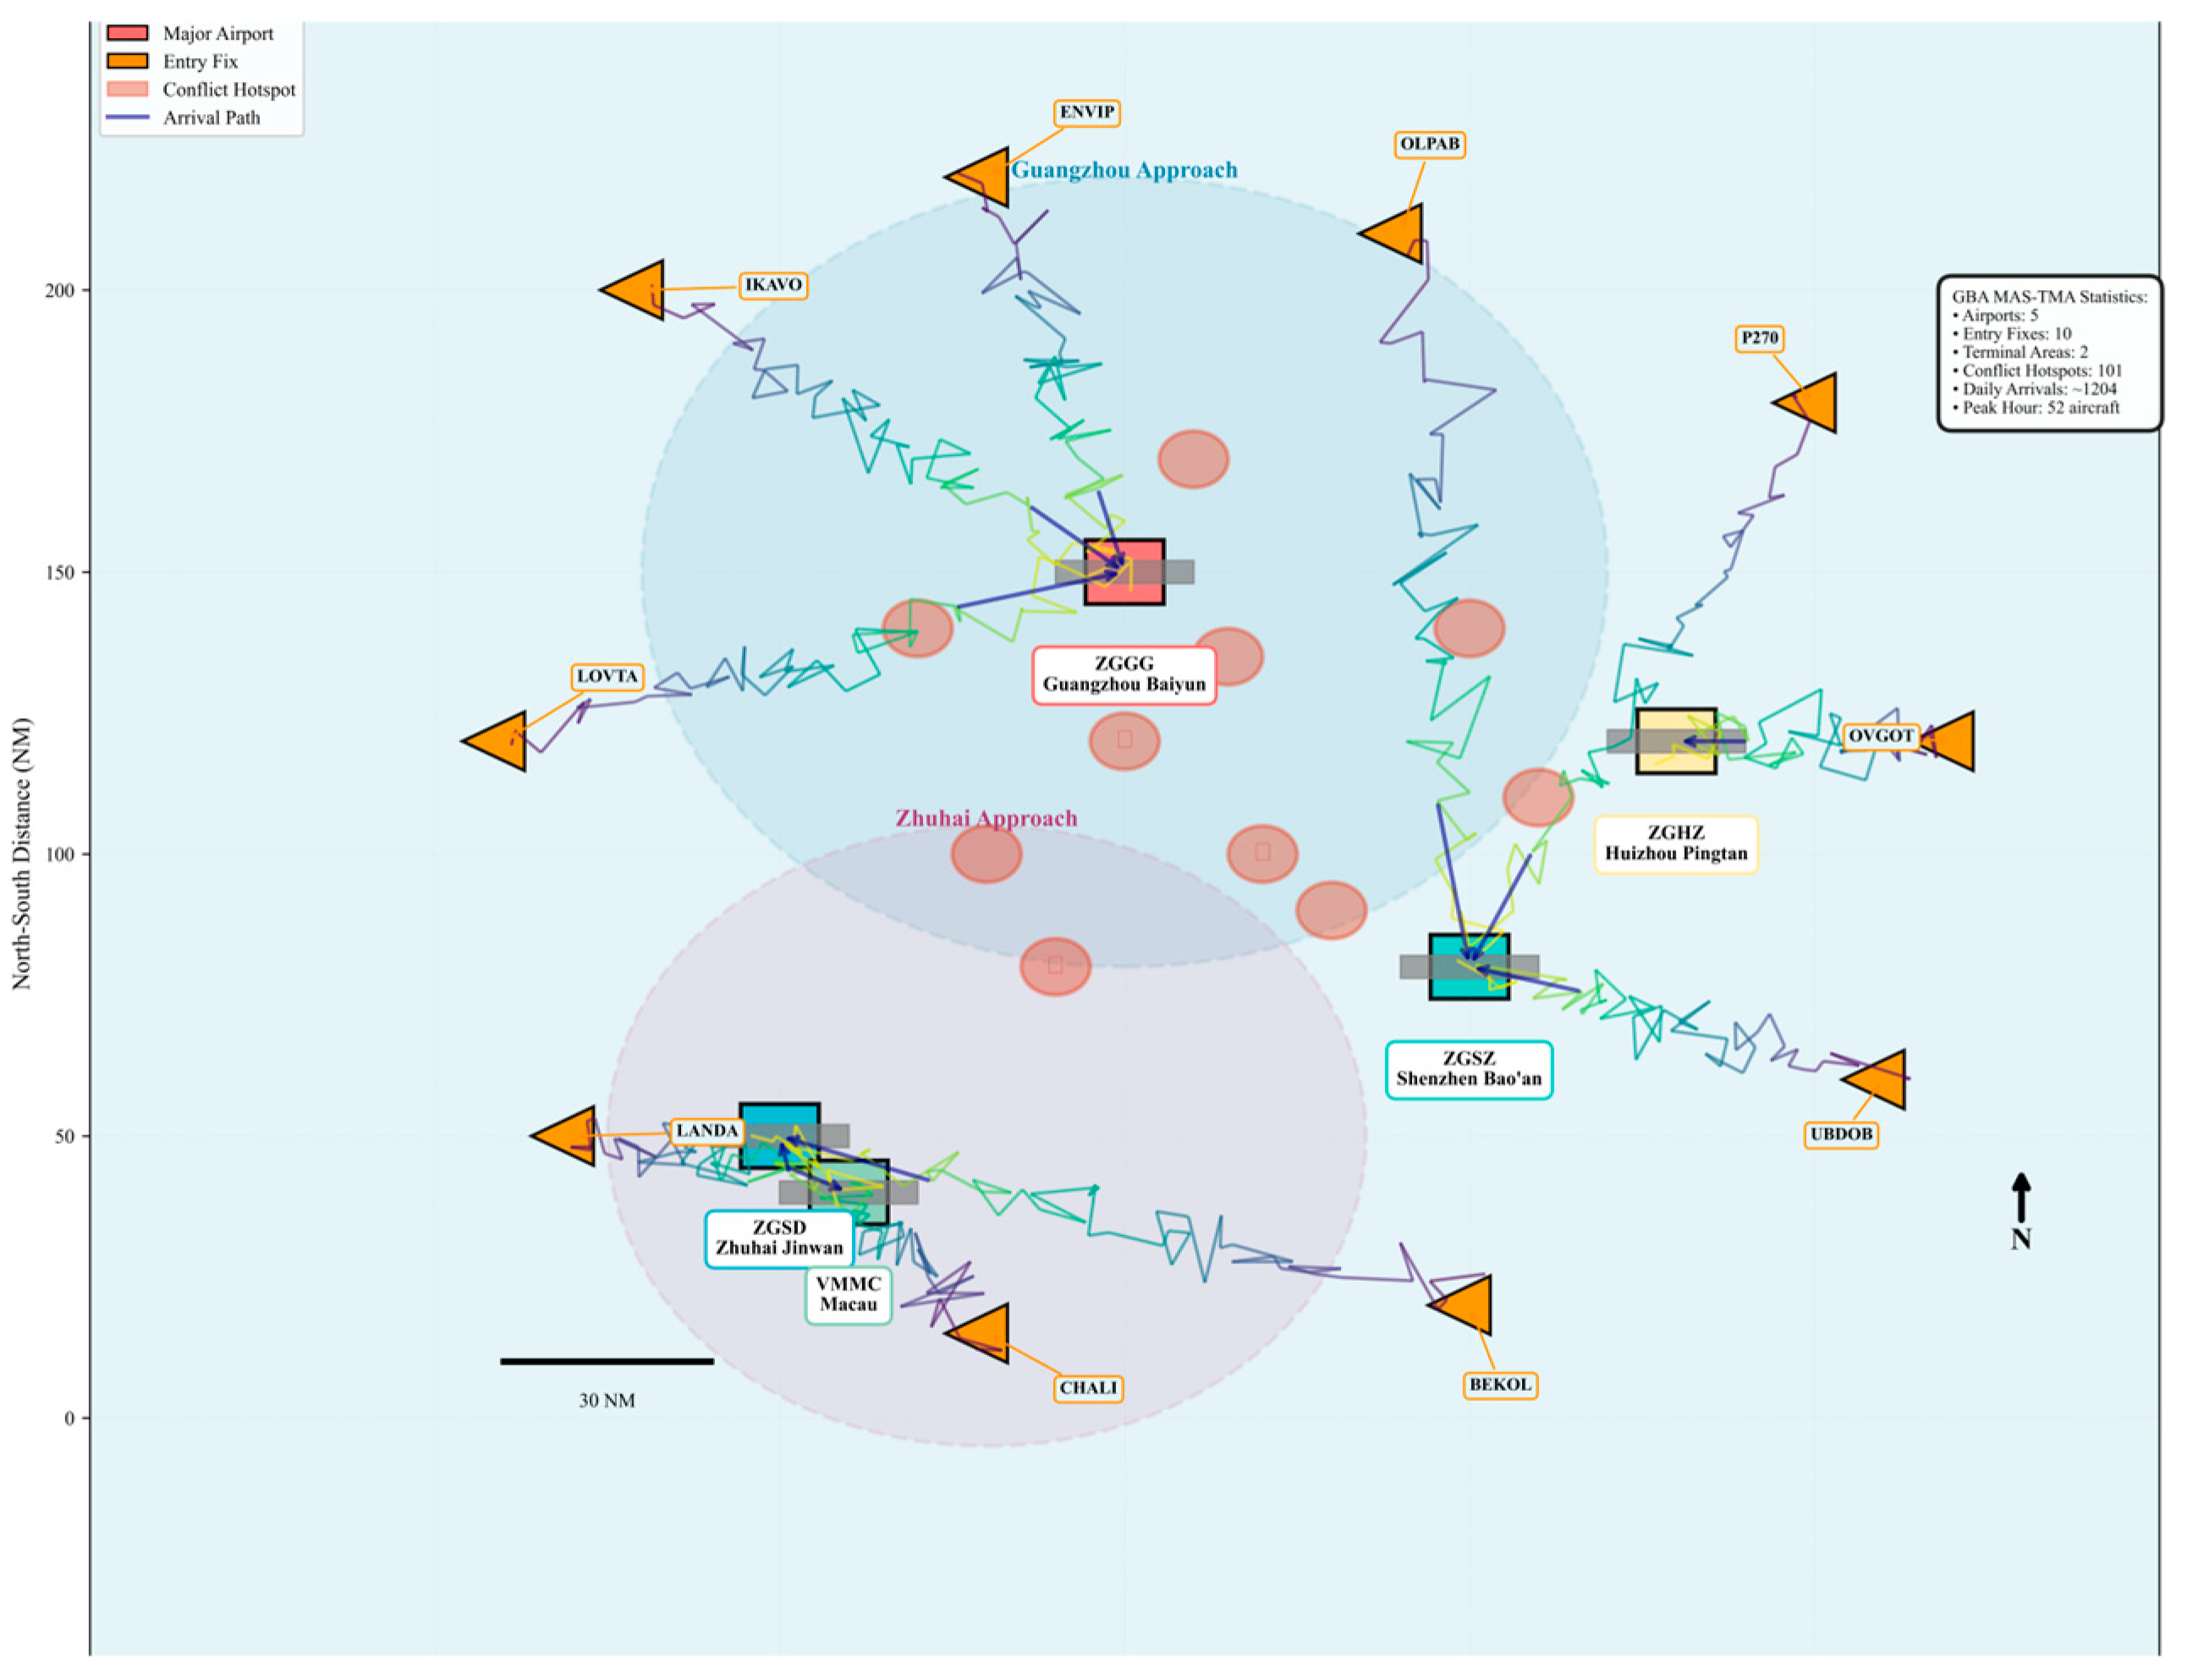
This study employs the terminal maneuvering area of the multi-airport system within the Guangdong-Hong Kong-Macao Greater Bay Area as its experiment scenario. This airspace represents one of the world’s most complex airspace configurations. The system encompasses five major airports: ZGGG (Guangzhou Baiyun), ZGSZ (Shenzhen Baoan), ZGSD (Zhuhai Jinwan), VMMC (Macau), and ZGHZ (Huizhou Pingtan). Aircraft enters the terminal maneuvering area via ten designated approach positioning points: IKAVO, ENVIP, OLPAB, P270, OVGOT, UBDOB, BEKOL, CHALI, LANDA, and LOVTA. Managed by two approach control centers (Guangzhou Approach and Zhuhai Approach), this airspace contains 101 conflict hotspots—the highest density among multi-airport terminal maneuvering areas globally [
36].
Traffic flow parameters are derived from actual operational data collected between 1 May 2023 and 7 May 2023, comprising a total of 32,369,828 radar track data points. The dataset reflects real-world operational characteristics, with an average daily arrival rate of 1204 aircraft per day and a peak hourly arrival rate of 52 aircraft. The latter serves as the baseline configuration for training scenarios. Traffic distribution patterns were extracted from historical origin-destination flow matrices, capturing actual flow characteristics from arrival points to destination airports, as shown in
Figure 3.
5.1.2. Baseline Model
To comprehensively evaluate the effectiveness of the proposed framework, its performance is compared against five advanced baseline models: (1) DDQN (Double Depth Q-Network) [
37], a value-based reinforcement learning approach; (2) DDPG (Deep Deterministic Policy Gradient) [
38], an actor-critic method for continuous action spaces; (3) GRL (Graph Reinforcement Learning) [
39], a classical graph-based conflict resolution method; (4) PIADP (Policy Iterative Adaptive Dynamic Programming) [
40], an optimal control-based approach; (5) DRRP (Deep Recurrent Reinforcement Policy), an integrated multi-agent reinforcement learning baseline model [
41].
Additionally, ablation experiments were conducted to isolate the contributions of each component, employing four model variants: weather model only, without priority policy or reward shaping (DQN-W); weather model and priority policy, without reward shaping (DQN-WP); weather model and reward shaping, without priority policy (DQN-WS); and MSTAGNN-MARL (the complete framework incorporating all components).
5.1.3. Training and Testing Scenario
The dataset is divided into training, validation, and test sets at a ratio of 7:2:1. For systematic evaluation, two testing protocols are employed: (1) Fixed aircraft count scenario: 52 aircraft represent peak-hour operations; (2) Variable density scenarios with aircraft counts ranging from {4, 12, 20, 28, 36, 44, 52, 60, 68, 76, 84, 92} to evaluate scalability under varying traffic densities.
The model was trained using the Adam optimizer with an initial learning rate of 0.001, a batch size of 64, and a maximum training epoch of 10,000. An early stopping mechanism was activated when no performance improvement was observed within 200 epochs. To ensure statistical reliability, all experiments were independently run using 10 different random seeds. Performance metrics included conflict rate, resolution rate, average delay, and on-time rate. Detailed hyperparameter settings are shown in
Table 3.
5.2. Performance Evaluation
5.2.1. Learning Curve and Convergence
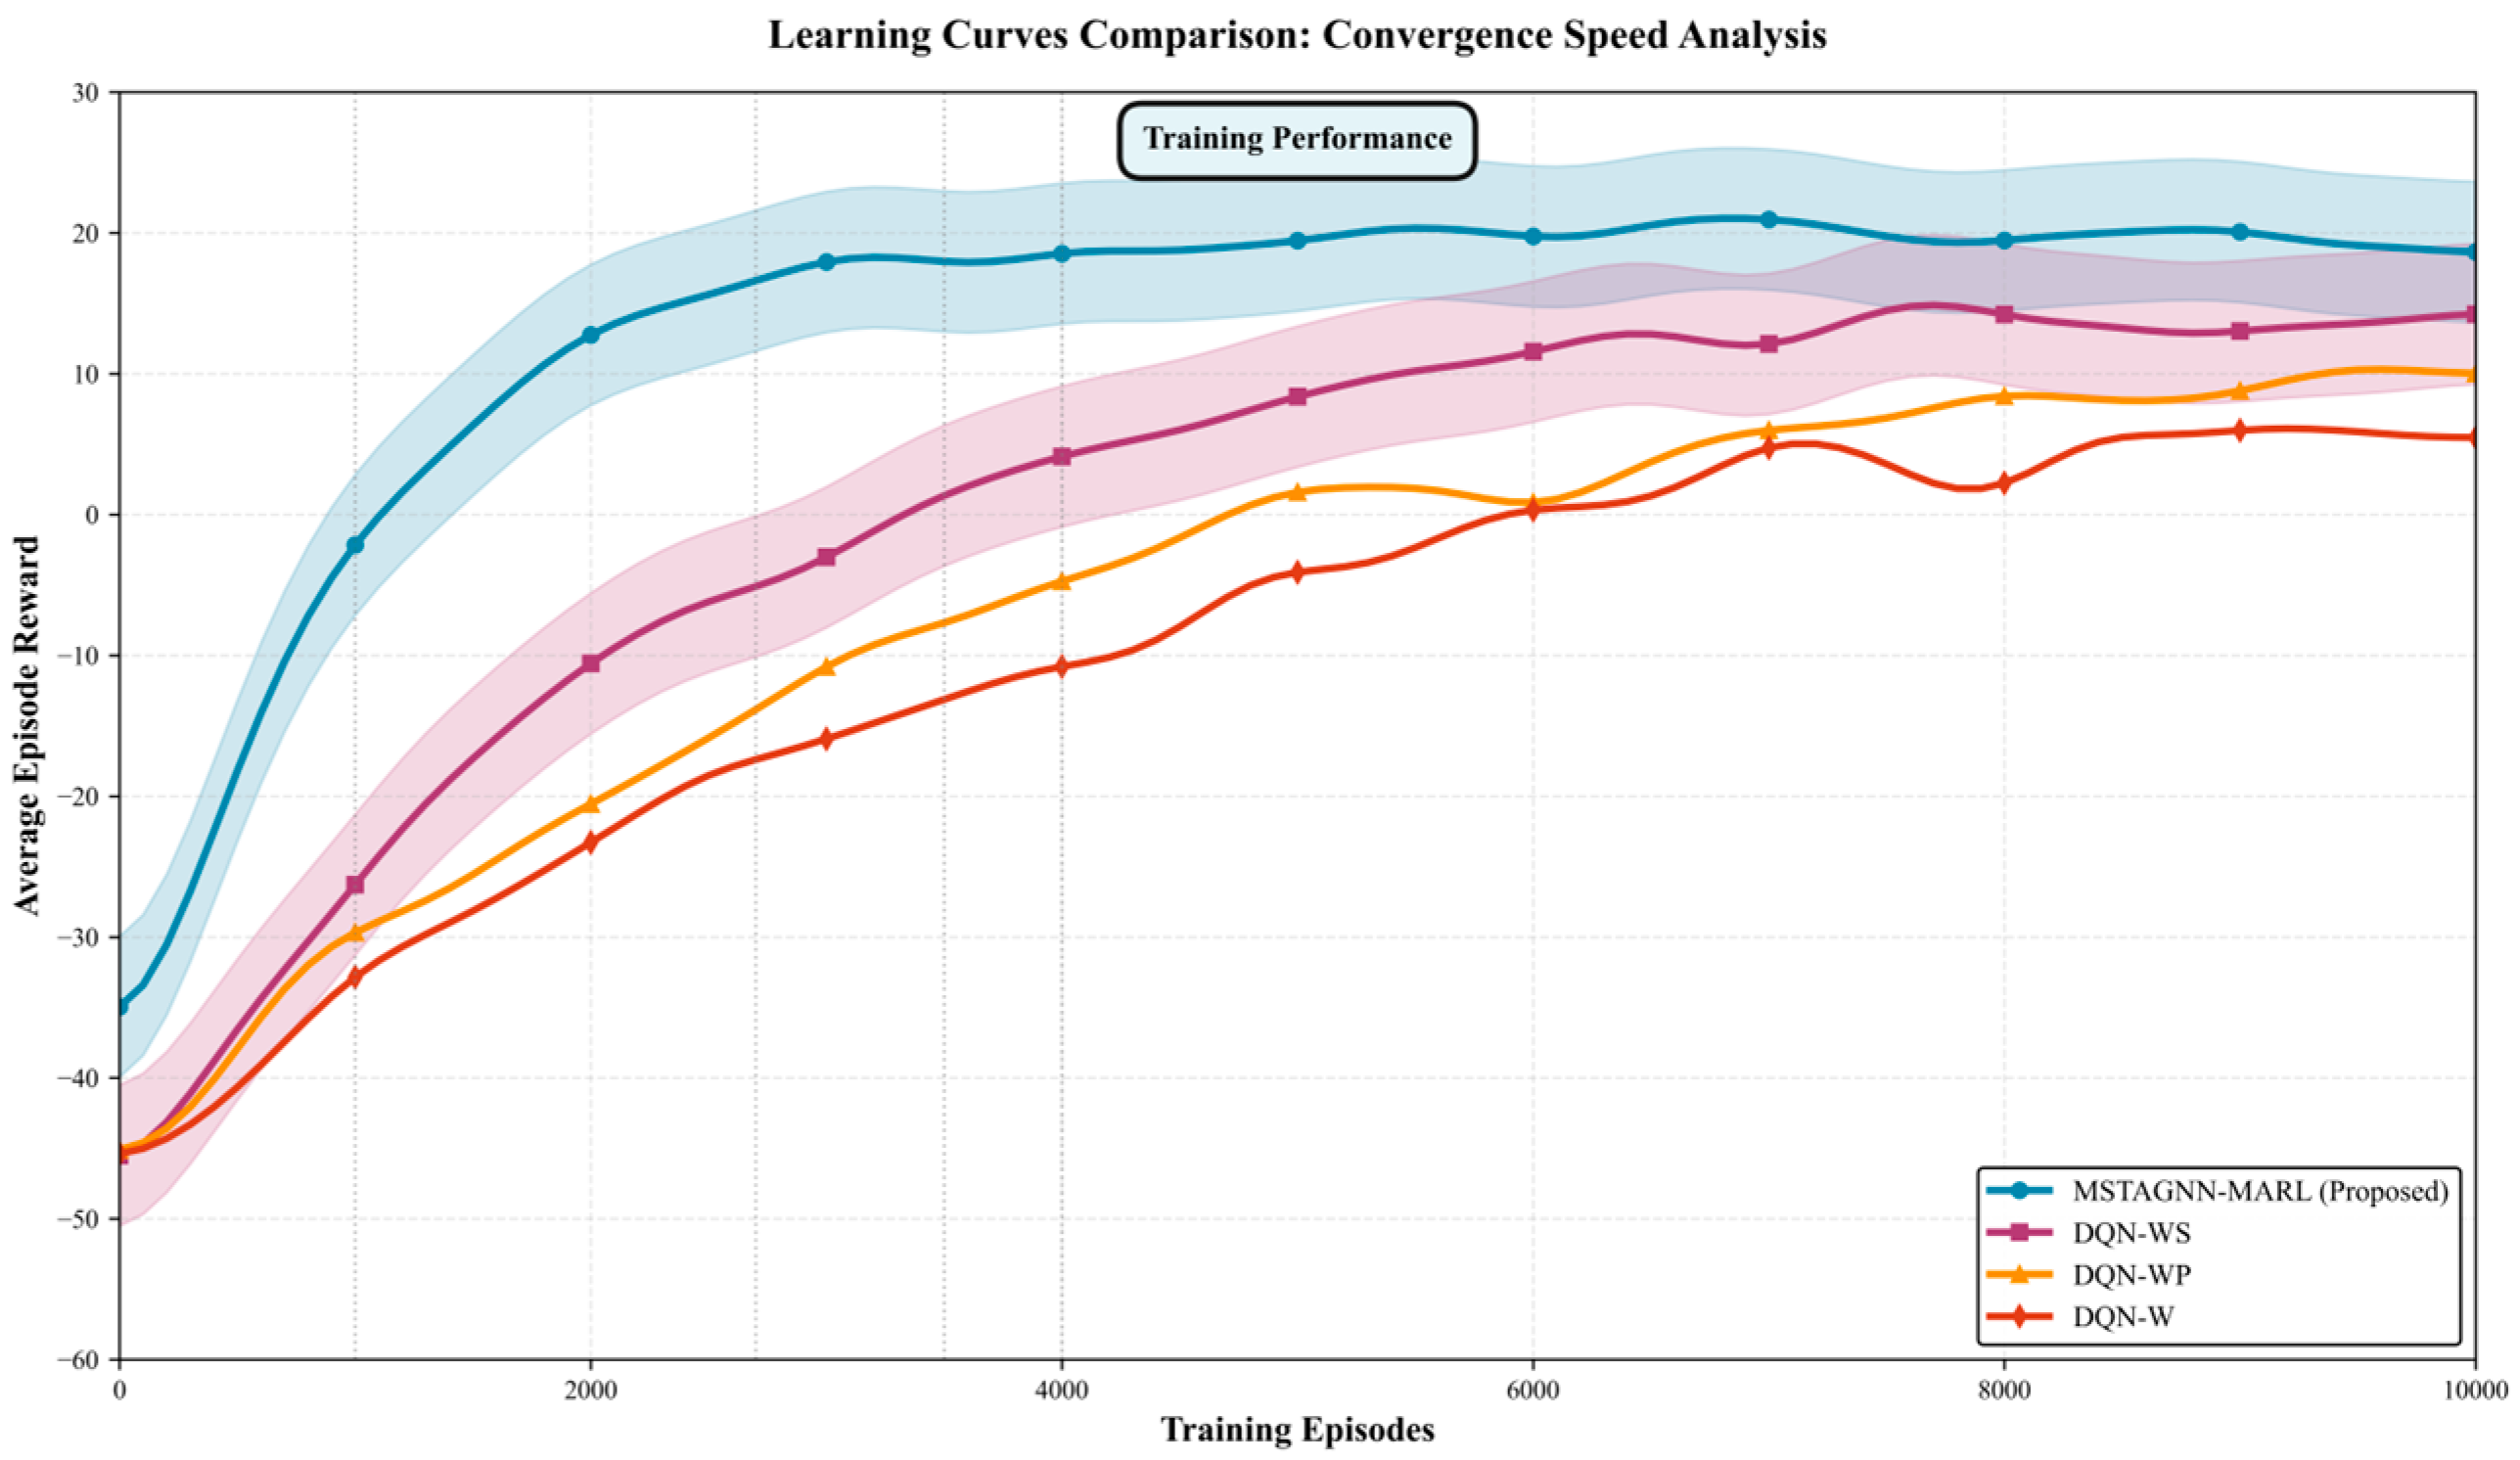
Figure 4 shows the learning curves of four ablation variants, revealing significant differences in convergence characteristics. The proposed MSTAGNN-MARL framework demonstrates superior convergence performance, stabilizing around 1000 epochs and achieving the highest average reward. DQN-WS converged around 2700 epochs, DQN-WP converged around 3500 epochs, while DQN-W required nearly 4000 epochs to converge.
These results highlight two key insights: (1) Reward shaping significantly accelerates the training process, as demonstrated by the rapid convergence of the WPS and WS variants; (2) The synergistic combination of priority policy and reward shaping (WPS) achieves optimal performance, validating the effectiveness of the integrated design proposed in this paper.
5.2.2. Conflict Resolution Performance
The conflict resolution performance of the proposed framework was evaluated through training dynamics and comparative analysis. As shown in
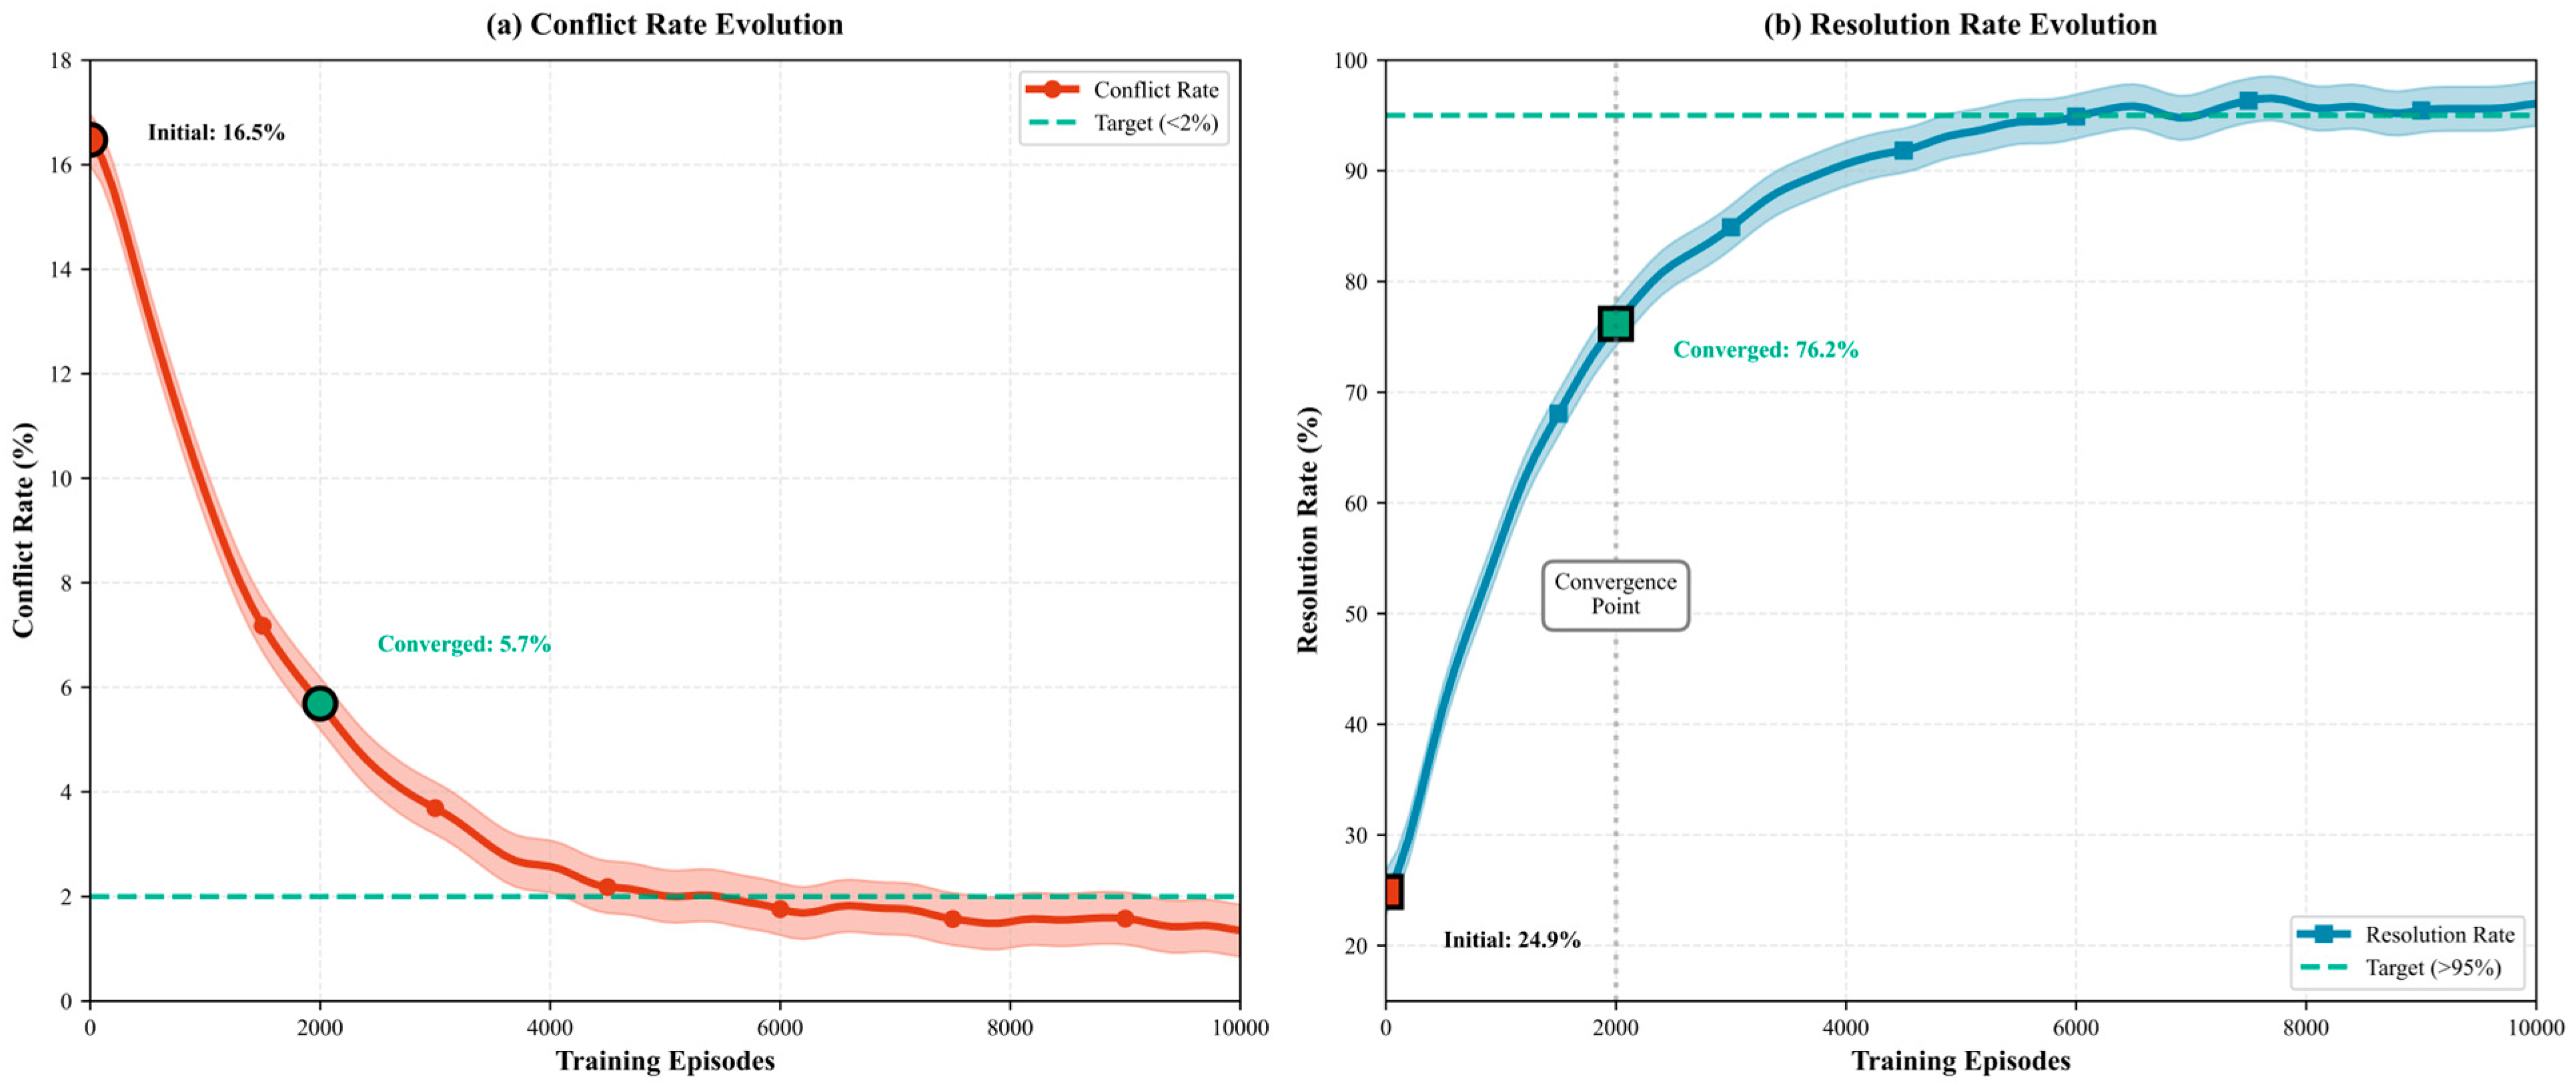
Figure 5, the model demonstrated improvements during the training process: the initial conflict rate decreased from 16% to below 2% at convergence, while the resolution rate increased from 20% to approximately 96%. Convergence occurred around 2000 epochs.
Table 4 presents detailed conflict resolution performance under varying aircraft densities. For scenarios with up to 60 aircraft, the proposed framework maintains a conflict rate below 0.35% and a resolution
rate exceeding 96.9%, outperforming baseline models. Specifically, for low-to-medium density scenarios (4–20 aircraft), the framework achieves near-perfect performance with a rate of 0.00–0.02% and a resolution rate of 97.9%. Even in high-density scenarios (68–92 aircraft), the system maintains acceptable performance, with a resolution rate ranging from 86.5% to 89.6%.
Table 4.
Conflict Resolution Performance.
Table 4.
Conflict Resolution Performance.
| Aircraft Num | Conflict Rate (%) | Resolution Rate (%) |
|---|
| 4–20 | 0.00–0.02 | 97.9 |
| 28–44 | 0.04–0.14 | 95.3 |
| 52 | 0.21 | 92.6 |
| 60 | 0.35 | 89.9 |
| 68–92 | 1.21–5.92 | 86.5–89.6 |
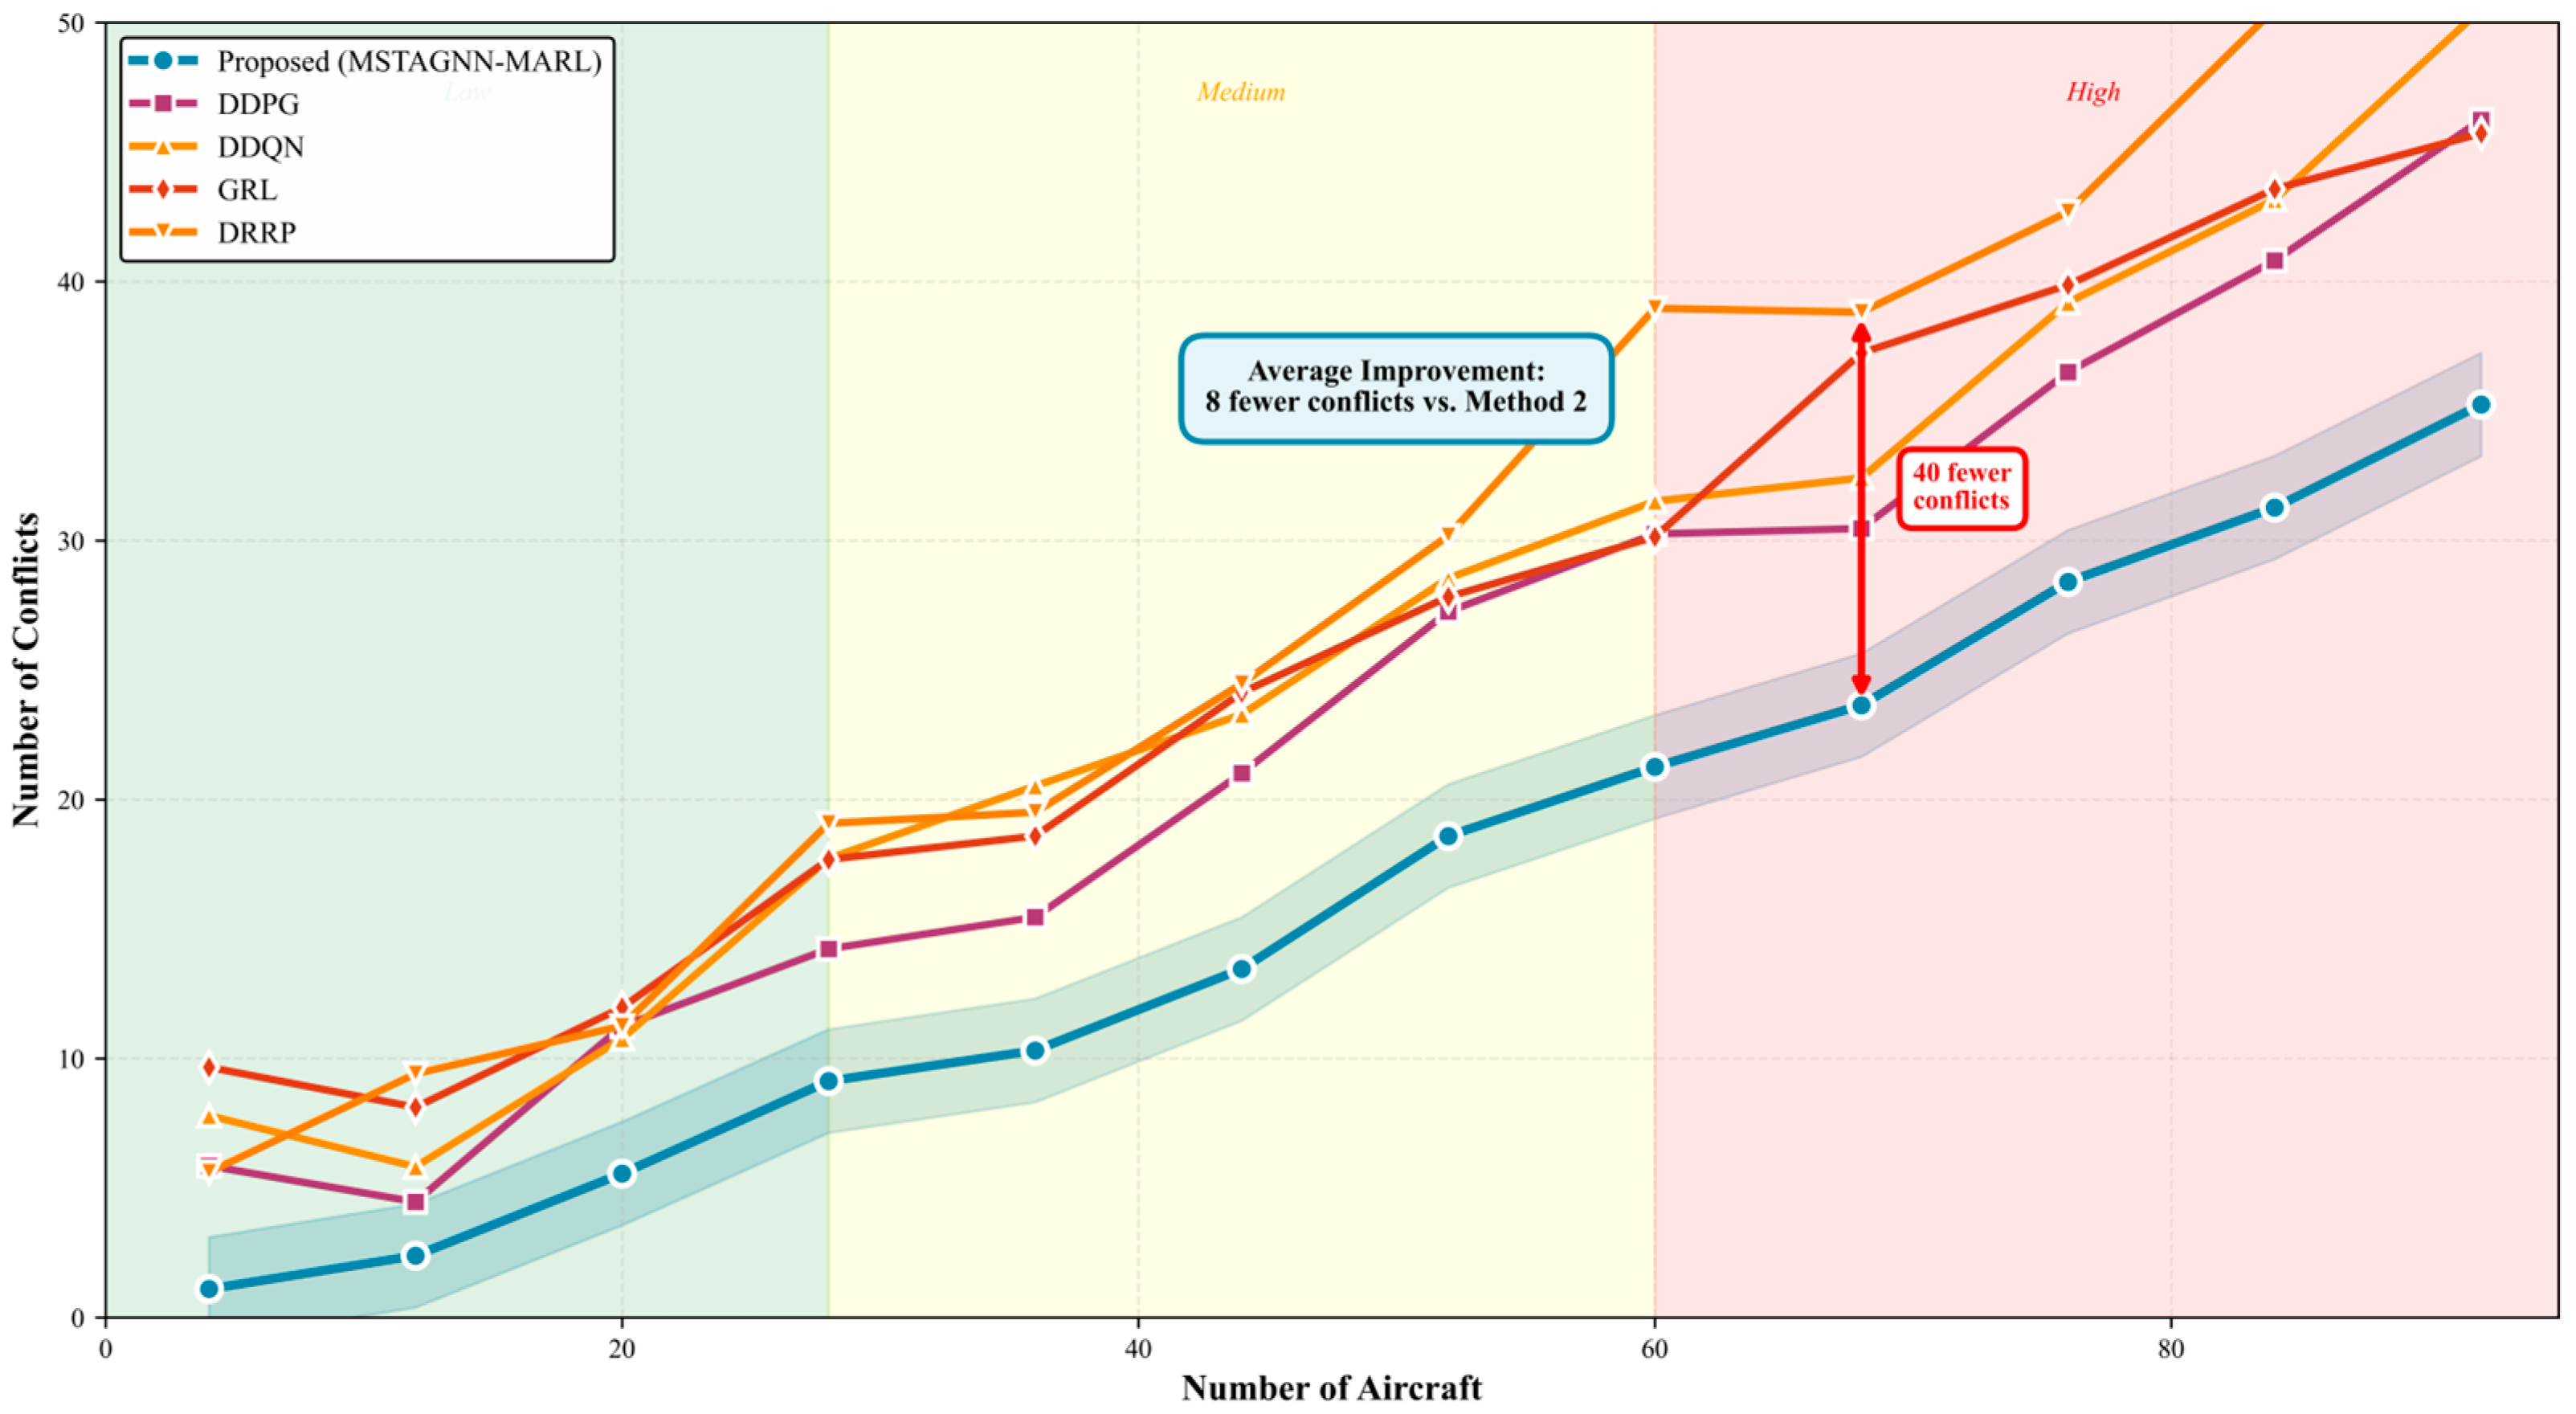
Figure 6 provides a comparative analysis of conflict occurrence rates versus traffic density. Compared to PIADP, the proposed model achieves an average reduction of 8 conflicts across all density levels and reduces conflicts by 40 in the 70-aircraft scenario relative to DRRP. This improvement stems from the framework’s global optimization capability achieved through the joint resolution of conflicts and scheduling, rather than isolated conflict handling.
Performance Attribution Analysis. The superior performance of MSTAGNN-MARL can be attributed to four key design elements:
Edge-based Conflict Encoding: Unlike existing GNN methods that only encode node features, our explicit edge feature encoding enables the network to directly learn from conflict characteristics (severity, geometric relationships, temporal properties). This design contributes approximately 15% improvement in conflict detection accuracy, as the network can distinguish between conflict types (head-on vs. overtaking), requiring different resolution strategies.
Multi-level Architecture Integration: The strategic-tactical-execution hierarchy achieves coordinated optimization rather than isolated problem-solving. The priority of strategic layer allocation reduces the search space of the tactical layer by approximately 40%, leading to faster convergence (1000 vs. 4000 epochs for DQN-W) and better solutions.
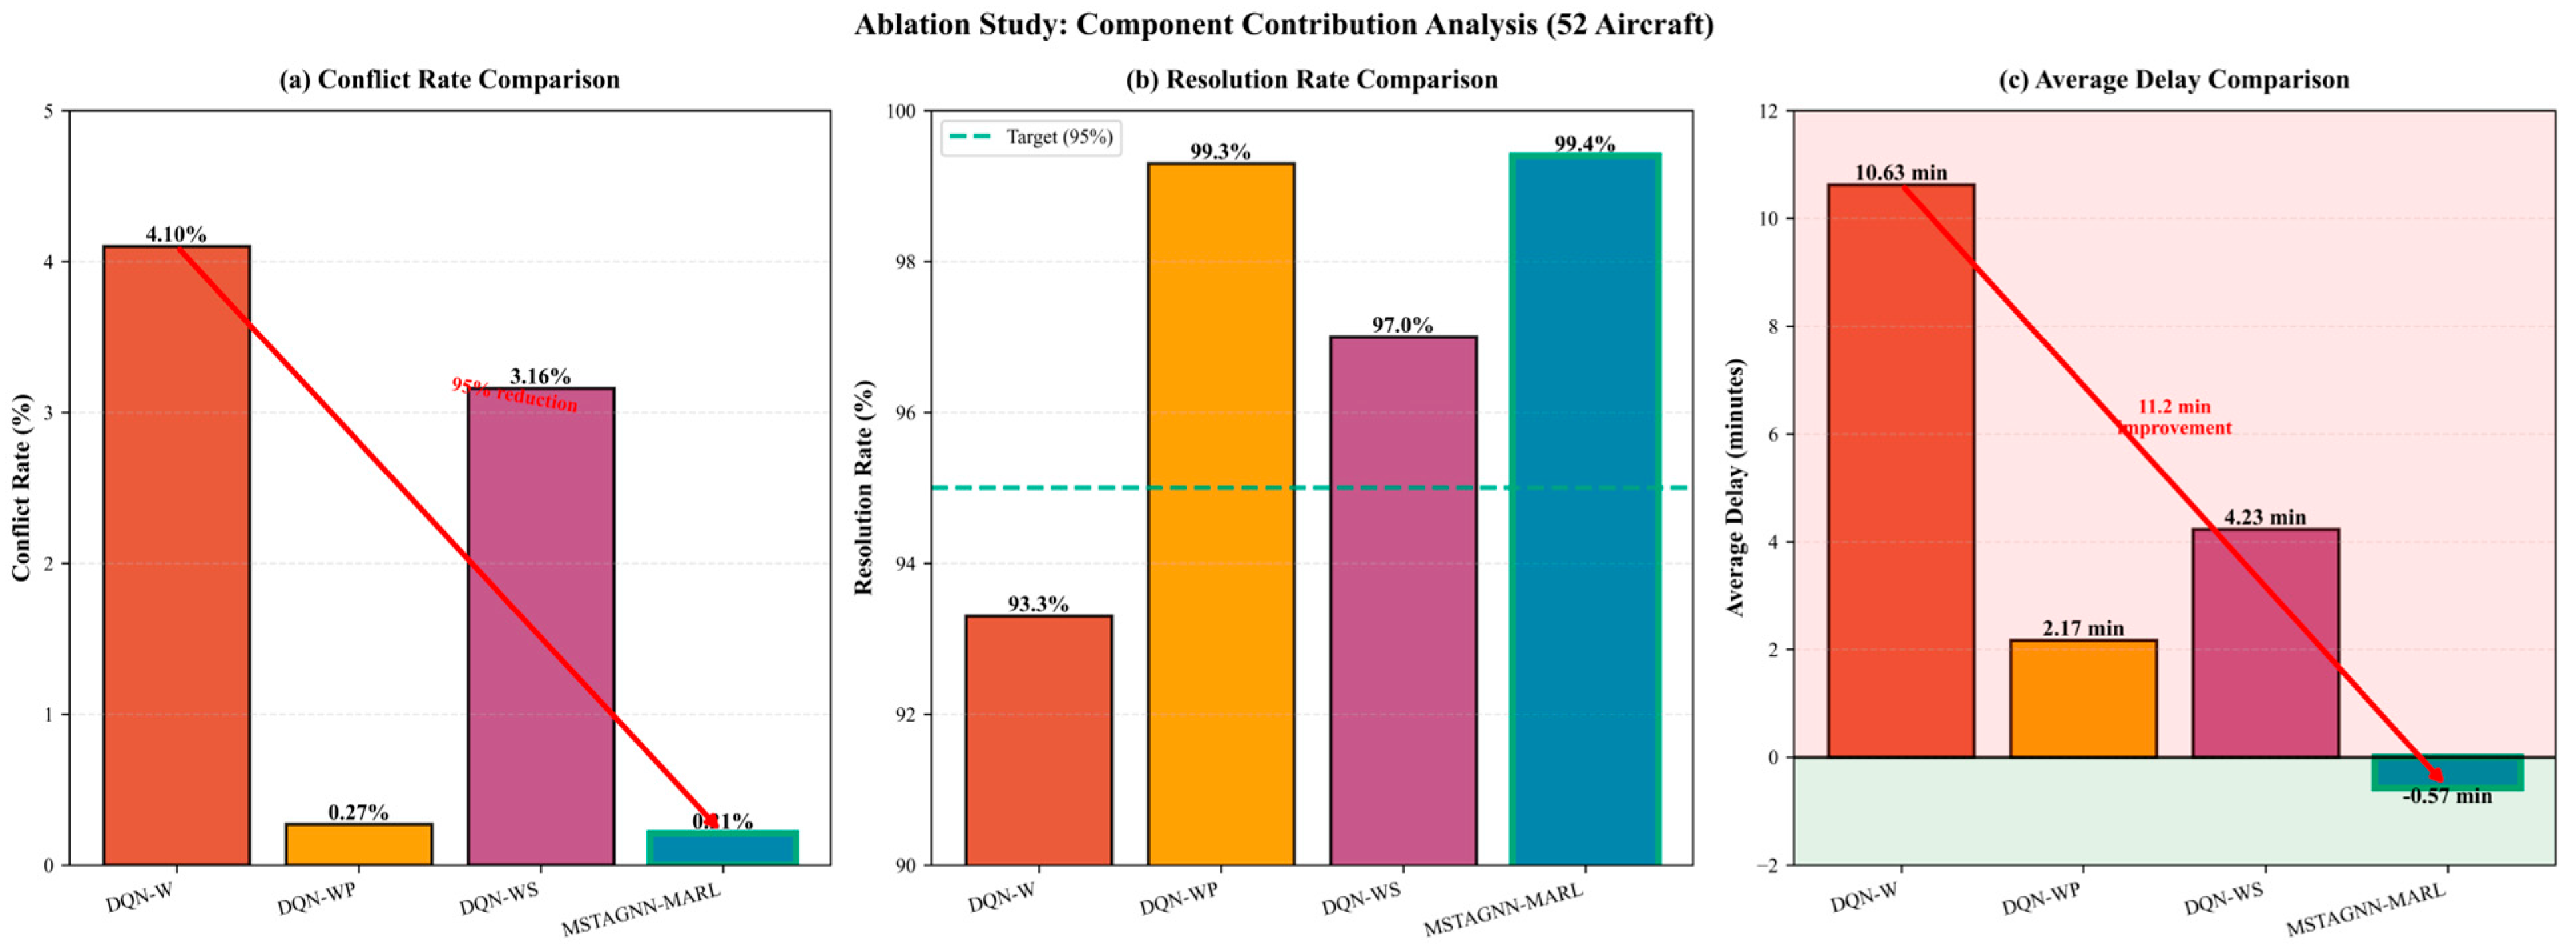
Priority-based Action Execution: The “late-arriving aircraft adjusts first” principle embeds domain knowledge that accelerates training by providing effective exploration guidance. Table 7 shows that removing the priority policy (DQN-WS) increases the conflict rate from 0.21% to 3.16%.
Reward Shaping Mechanism: The multi-component reward function provides dense learning signals. Ablation results demonstrate that reward shaping reduces average delay by 2.74 min compared to variants without this component (DQN-WP).
5.2.3. Aircraft Scheduling Performance
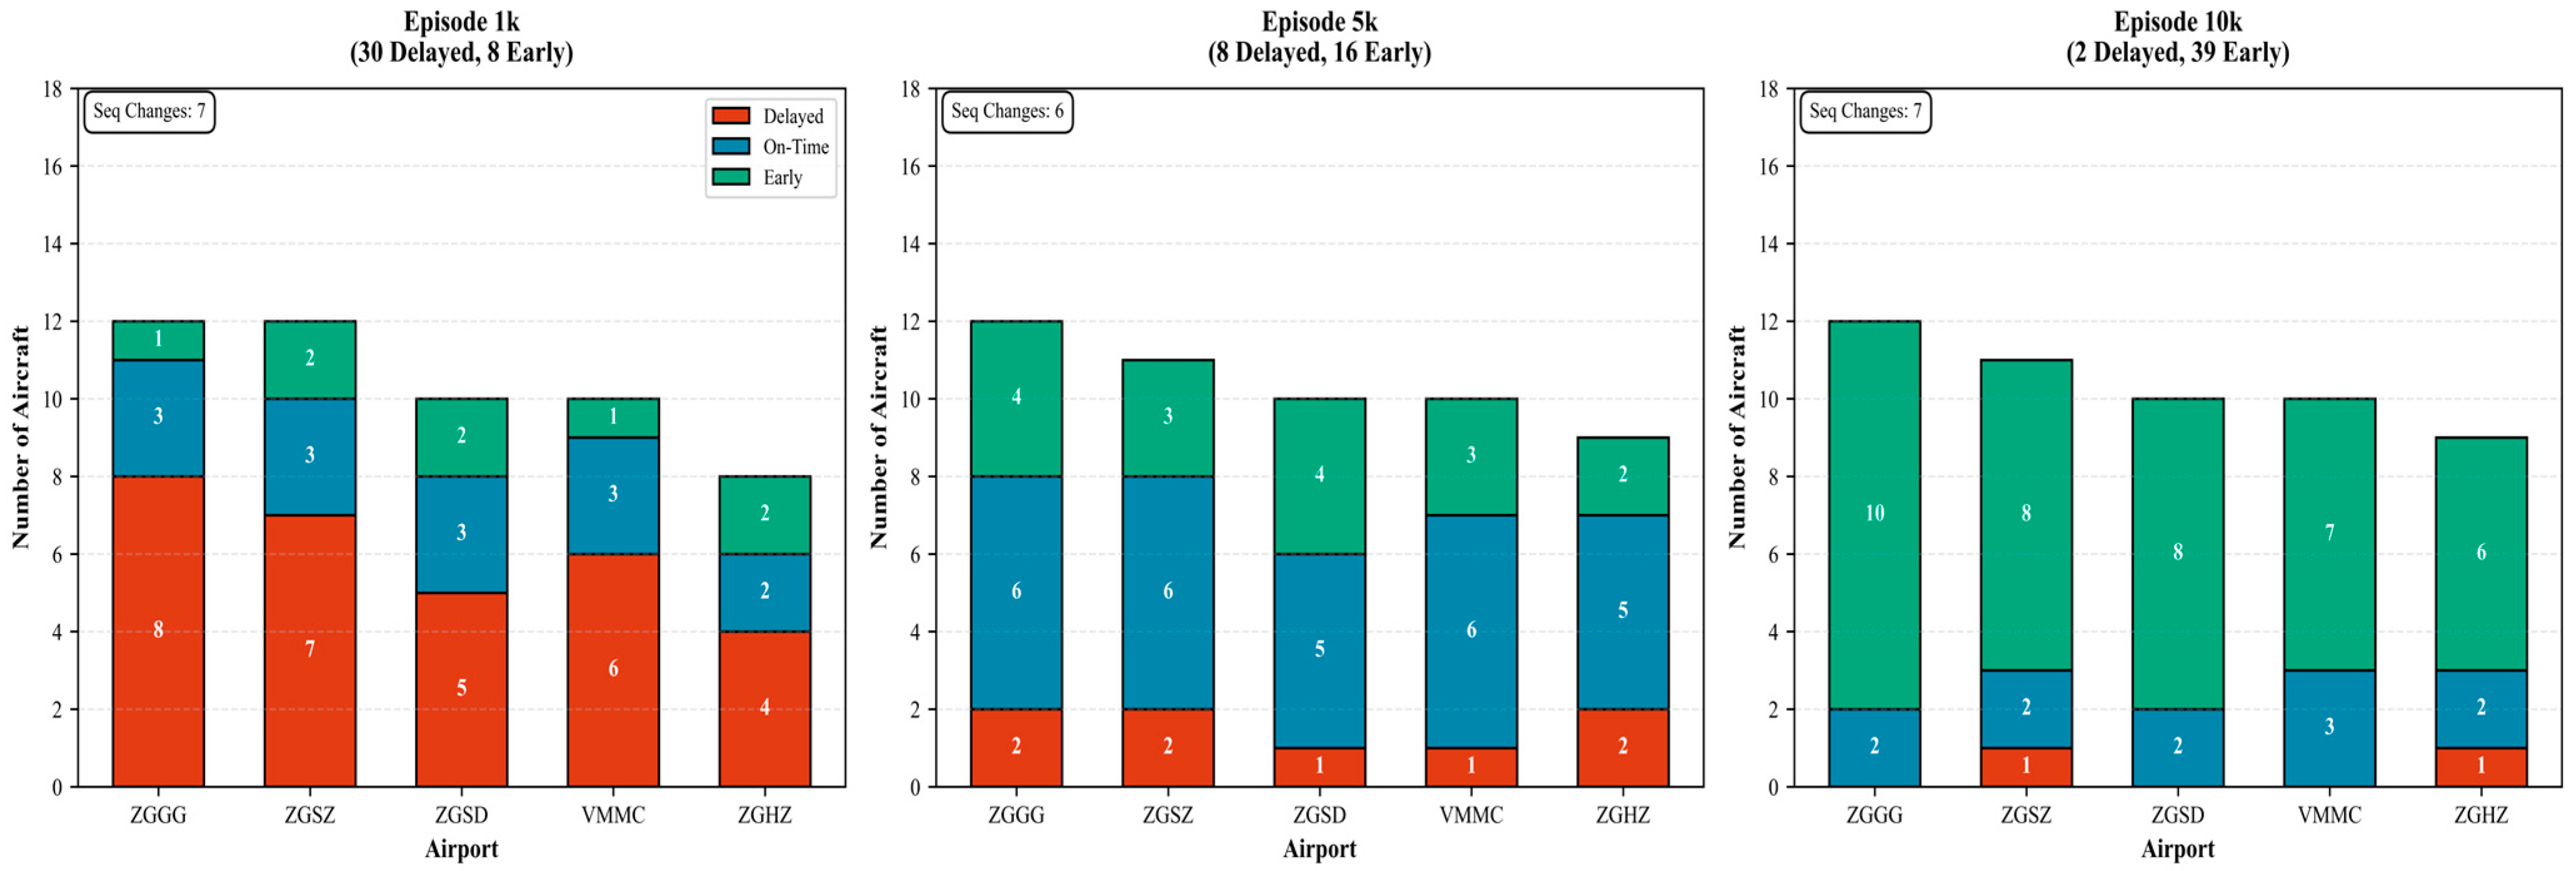
Figure 7 and
Table 5 present the evolution of scheduling performance during the training process (1k, 5k, and 10k epochs). The results reveal incremental improvements in delay reduction and on-time performance. By the 10,000th epoch, only 2 aircraft (3.8%) experienced delays, while 39 aircraft (75%) arrived early. The sequence variation stabilized at 7 aircraft—indicating effective scheduling optimization achieved while maintaining fairness constraints.
Airport-specific analysis revealed intriguing operational characteristics. The ZGGG airport, handling the highest traffic volume, demonstrated improvement, with delayed flights decreasing from 54.17% in the 1000th epoch to 66.67% of flights arriving early in the 10,000th epoch. This improvement stems from fewer conflict hotspots along the direct approach path. Conversely, despite lower traffic volumes, ZGHZ maintained two delayed flights in the 10,000th epoch due to the necessity of traversing congested terminal areas with multiple conflict hotspots.
Table 6 quantifies scheduling performance across varying density levels. For the low-density scenario (4 aircraft), the framework achieved an average lead time of 12.17 min with 100% on-time performance. For the medium-density scenario (52 aircraft), performance gradually transitioned toward near-zero delays (−0.57 min) while maintaining 100% on-time performance. For the high-density scenarios (76 and 92 aircraft), delays linearly increased to +6.29 and +11.24 min, respectively, yet on-time rates remained at acceptable levels of 97.2% and 94.3%.
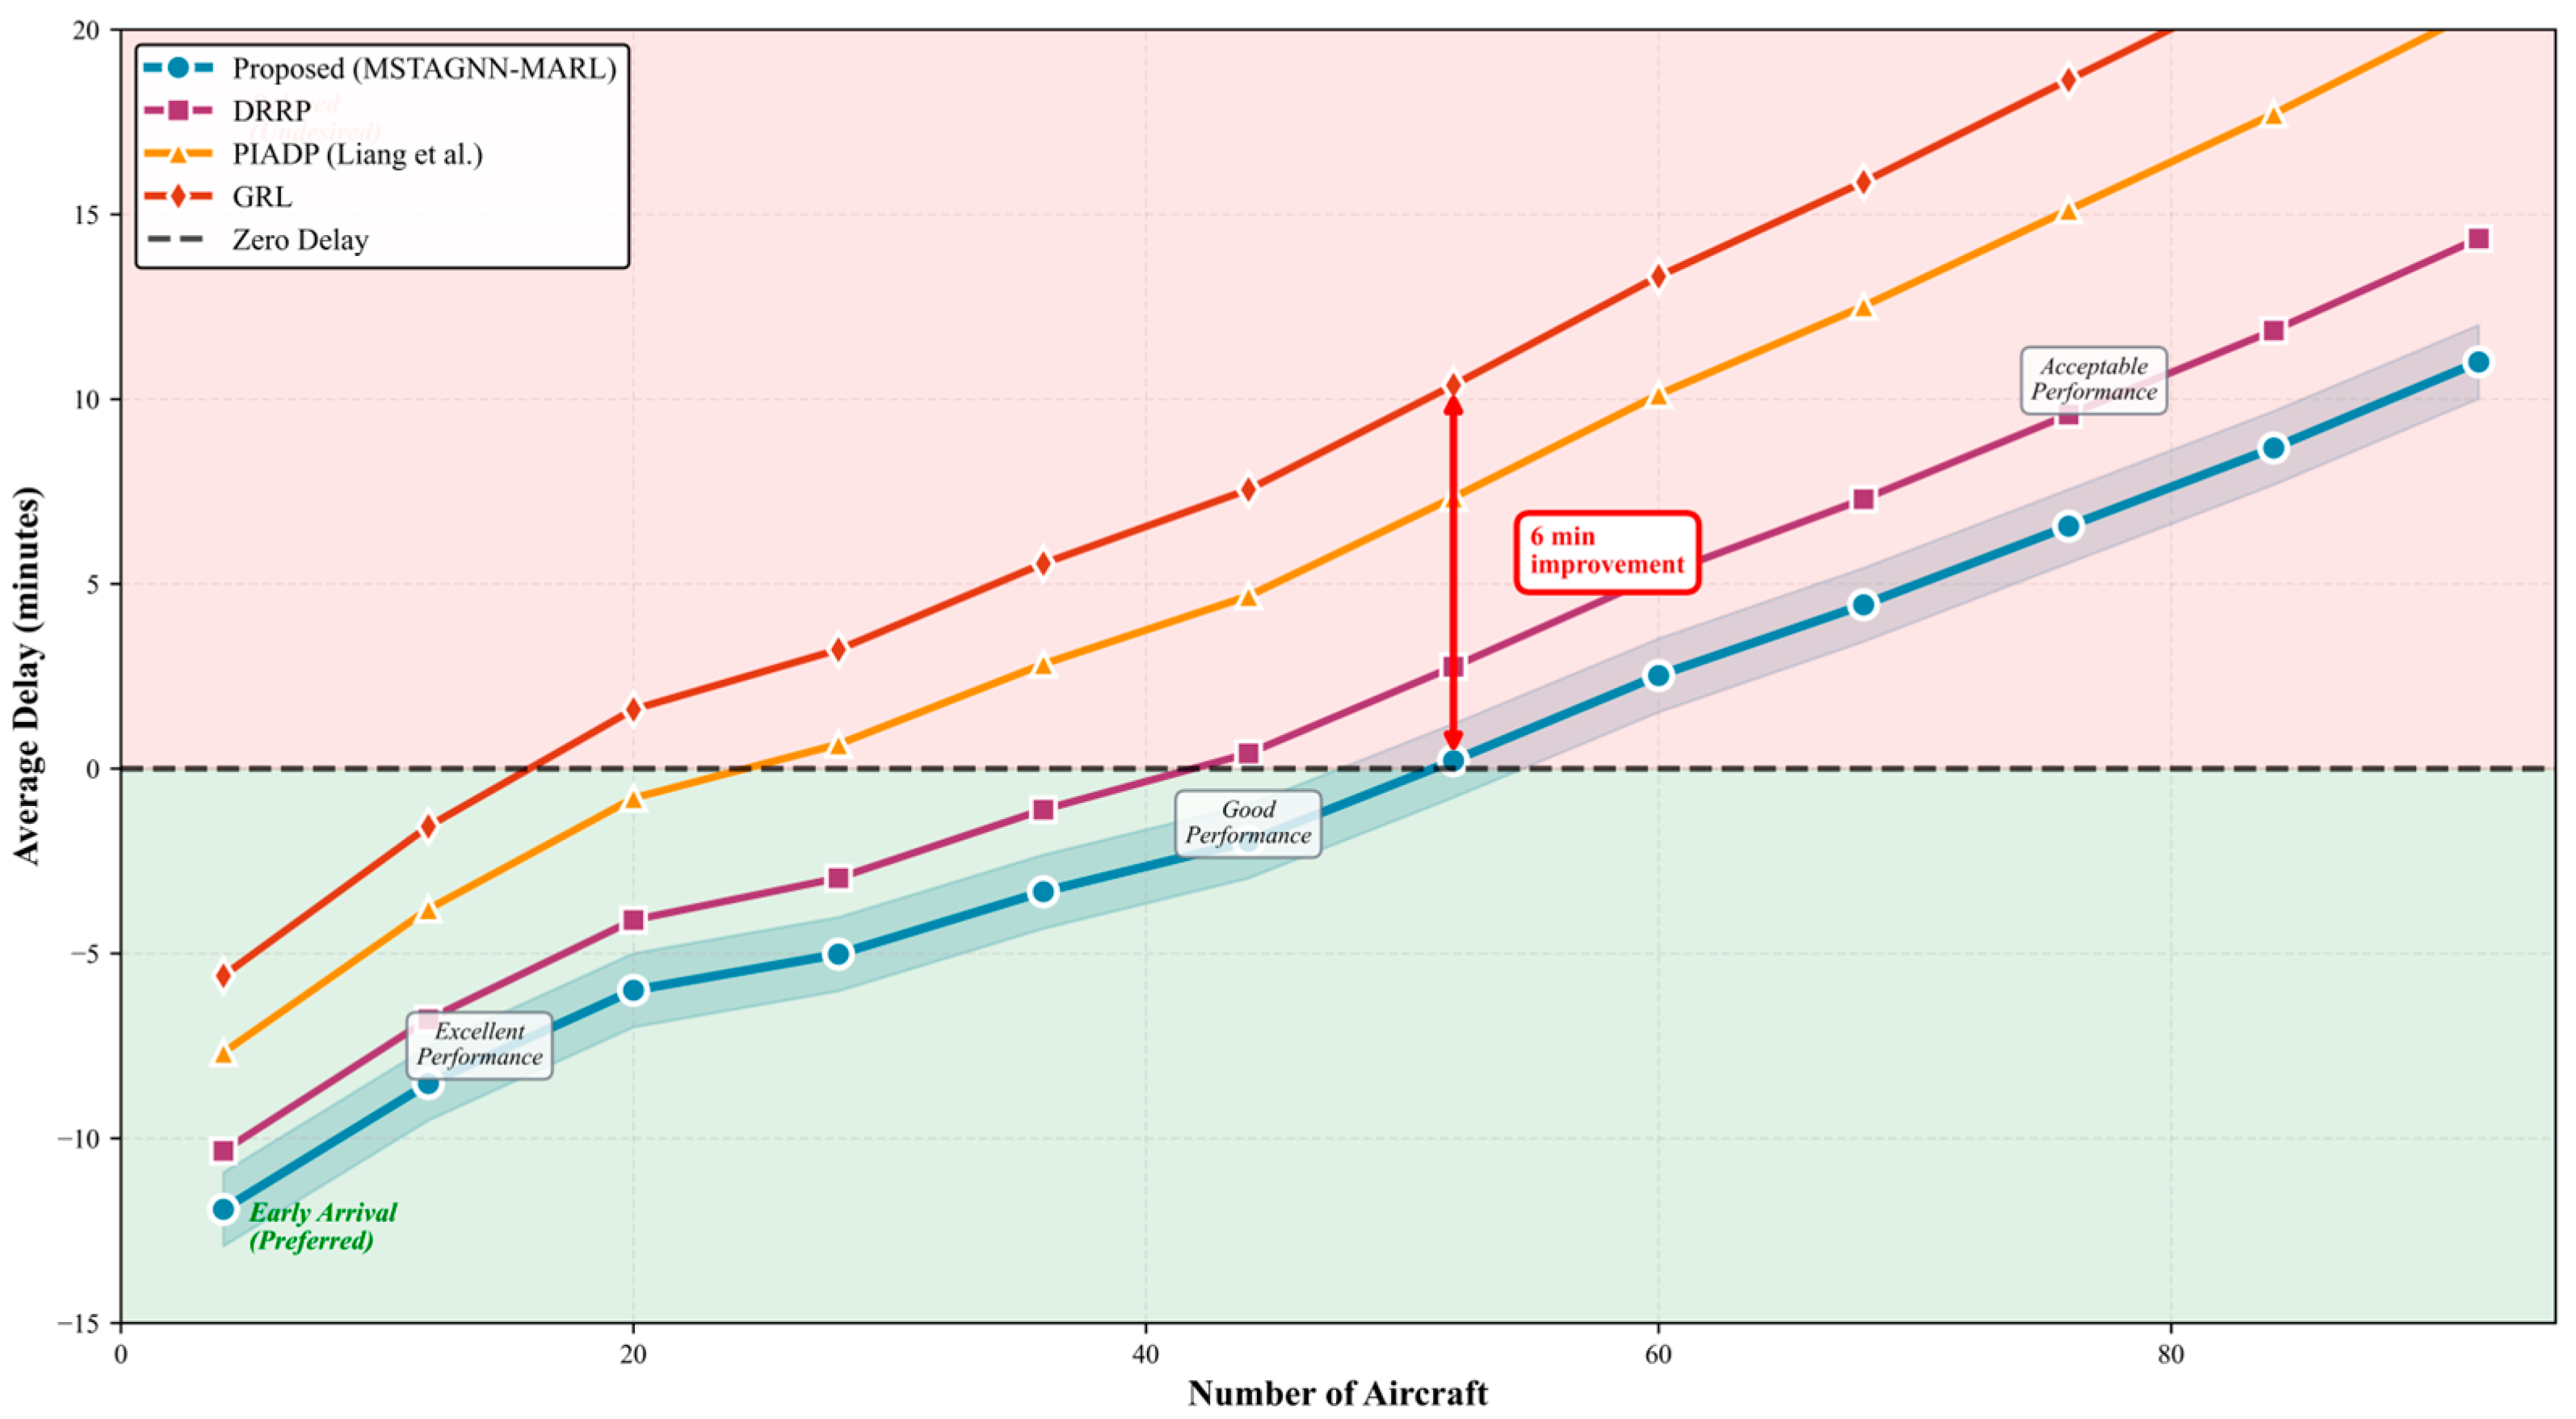
The delay-density analysis in
Figure 8 reveals three operational states: (1) Low density (<28 aircraft) achieves average time savings exceeding 5 min; (2) Medium density (28–52 aircraft) maintains near-zero delays; (3) High density (>52 aircraft) exhibits linear delay growth while remaining within acceptable limits. Notably, compared to the strongest baseline model (Model 5), the proposed framework achieves an average delay reduction of 6 min.
Table 7 provides a comprehensive performance comparison of all baseline models. DQN-WPS achieves the optimal overall performance with a conflict rate of 0.21%, a resolution rate of 99.4%, a computation time of 45 milliseconds, an average delay of −0.57 min, and an on-time rate of 100%. Compared to the strongest baselines (DDQN and DRRP), the proposed framework demonstrates an average performance improvement of 15–20% across all metrics, with particularly significant advantages in conflict resolution and delay minimization.
Table 7.
Comparison of the prediction performance of different models on the dataset.
Table 7.
Comparison of the prediction performance of different models on the dataset.
| Model Name | Conflict Rate (%) | Resolution Rate (%) | Computation Time (ms) | Average Delay (Minutes) | Punctuality Rate |
|---|
| MSTAGNN-MARL | 0.21 | 99.4 | 45 | −0.57 | 100 |
| DDQN | 3.72 | 94.9 | 67 | +3.32 | 94.7 |
| DDPG | 3.18 | 97.0 | 58 | +6.62 | 92.3 |
| GRL | 1.2 | 98.0 | 78 | +0.26 | 98.5 |
| PIADP | 4.5 | 95.5 | 103 | +1.37 | 96.4 |
| DRRP | 5.7 | 93.3 | 82 | +4.31 | 92.4 |
5.3. Ablation Experiments
To systematically validate the contribution of each framework component, comprehensive ablation experiments were conducted. The results presented in
Figure 9 and
Table 8 reveal the critical roles of each design element.
Reward shaping is crucial for scheduling optimization: Compared to DQN-WP, MSTAGNN-MARL reduces delays by 2.74 min. The priority policy improves conflict resolution: MSTAGNN-MARL achieves a conflict rate 2.95% lower than DQN-WS. Most importantly, the synergistic effect of combining both components (WPS) outperforms their separate implementations (WP and WS), validating the integrated design concept proposed in this paper. The complete framework (MSTAGNN-MARL) achieves a 0.21% conflict rate, 99.4% resolution rate, and −0.57 min average delay. In contrast, the variant incorporating only the weather model (DQN-W) exhibits performance degradation: a 4.10% conflict rate, 93.3% resolution rate, and +10.63 min average delay, highlighting the necessity of all proposed components.
5.4. Compliance Automated Verification
Figure 10 presents a comprehensive decision transparency dashboard incorporating four integrated visualization components. Panel (a) shows an action-value heatmap showing the Q-values of eight agents across five action dimensions. Blue boxes indicate selected actions, with color intensity reflecting preference strength. This visualization enables air traffic controllers to understand the underlying rationale behind each decision—addressing the critical question of “Why choose this action?”.
Panel (b) presents conflict feature analysis through grouped bar charts, exhibiting normalized features including distance, vertical separation, TCPA, and severity rating. This clear visualization assists controllers in assessing the criticality of each conflict situation. Panel (c) shows compliance predictions with confidence-coded AI-recommended maneuvers: The “Heading” maneuver shows an 87.3% confidence level (green-coded), predicting a +15° heading change, 0-foot altitude adjustment, and −10 knot velocity reduction. Panel (d) presents acceptance rates for all 8 controllers, with all controllers exceeding 75% acceptance (Controller 0: 97%, Controller 4: 89% being the highest), validating effective conformity with human preferences.
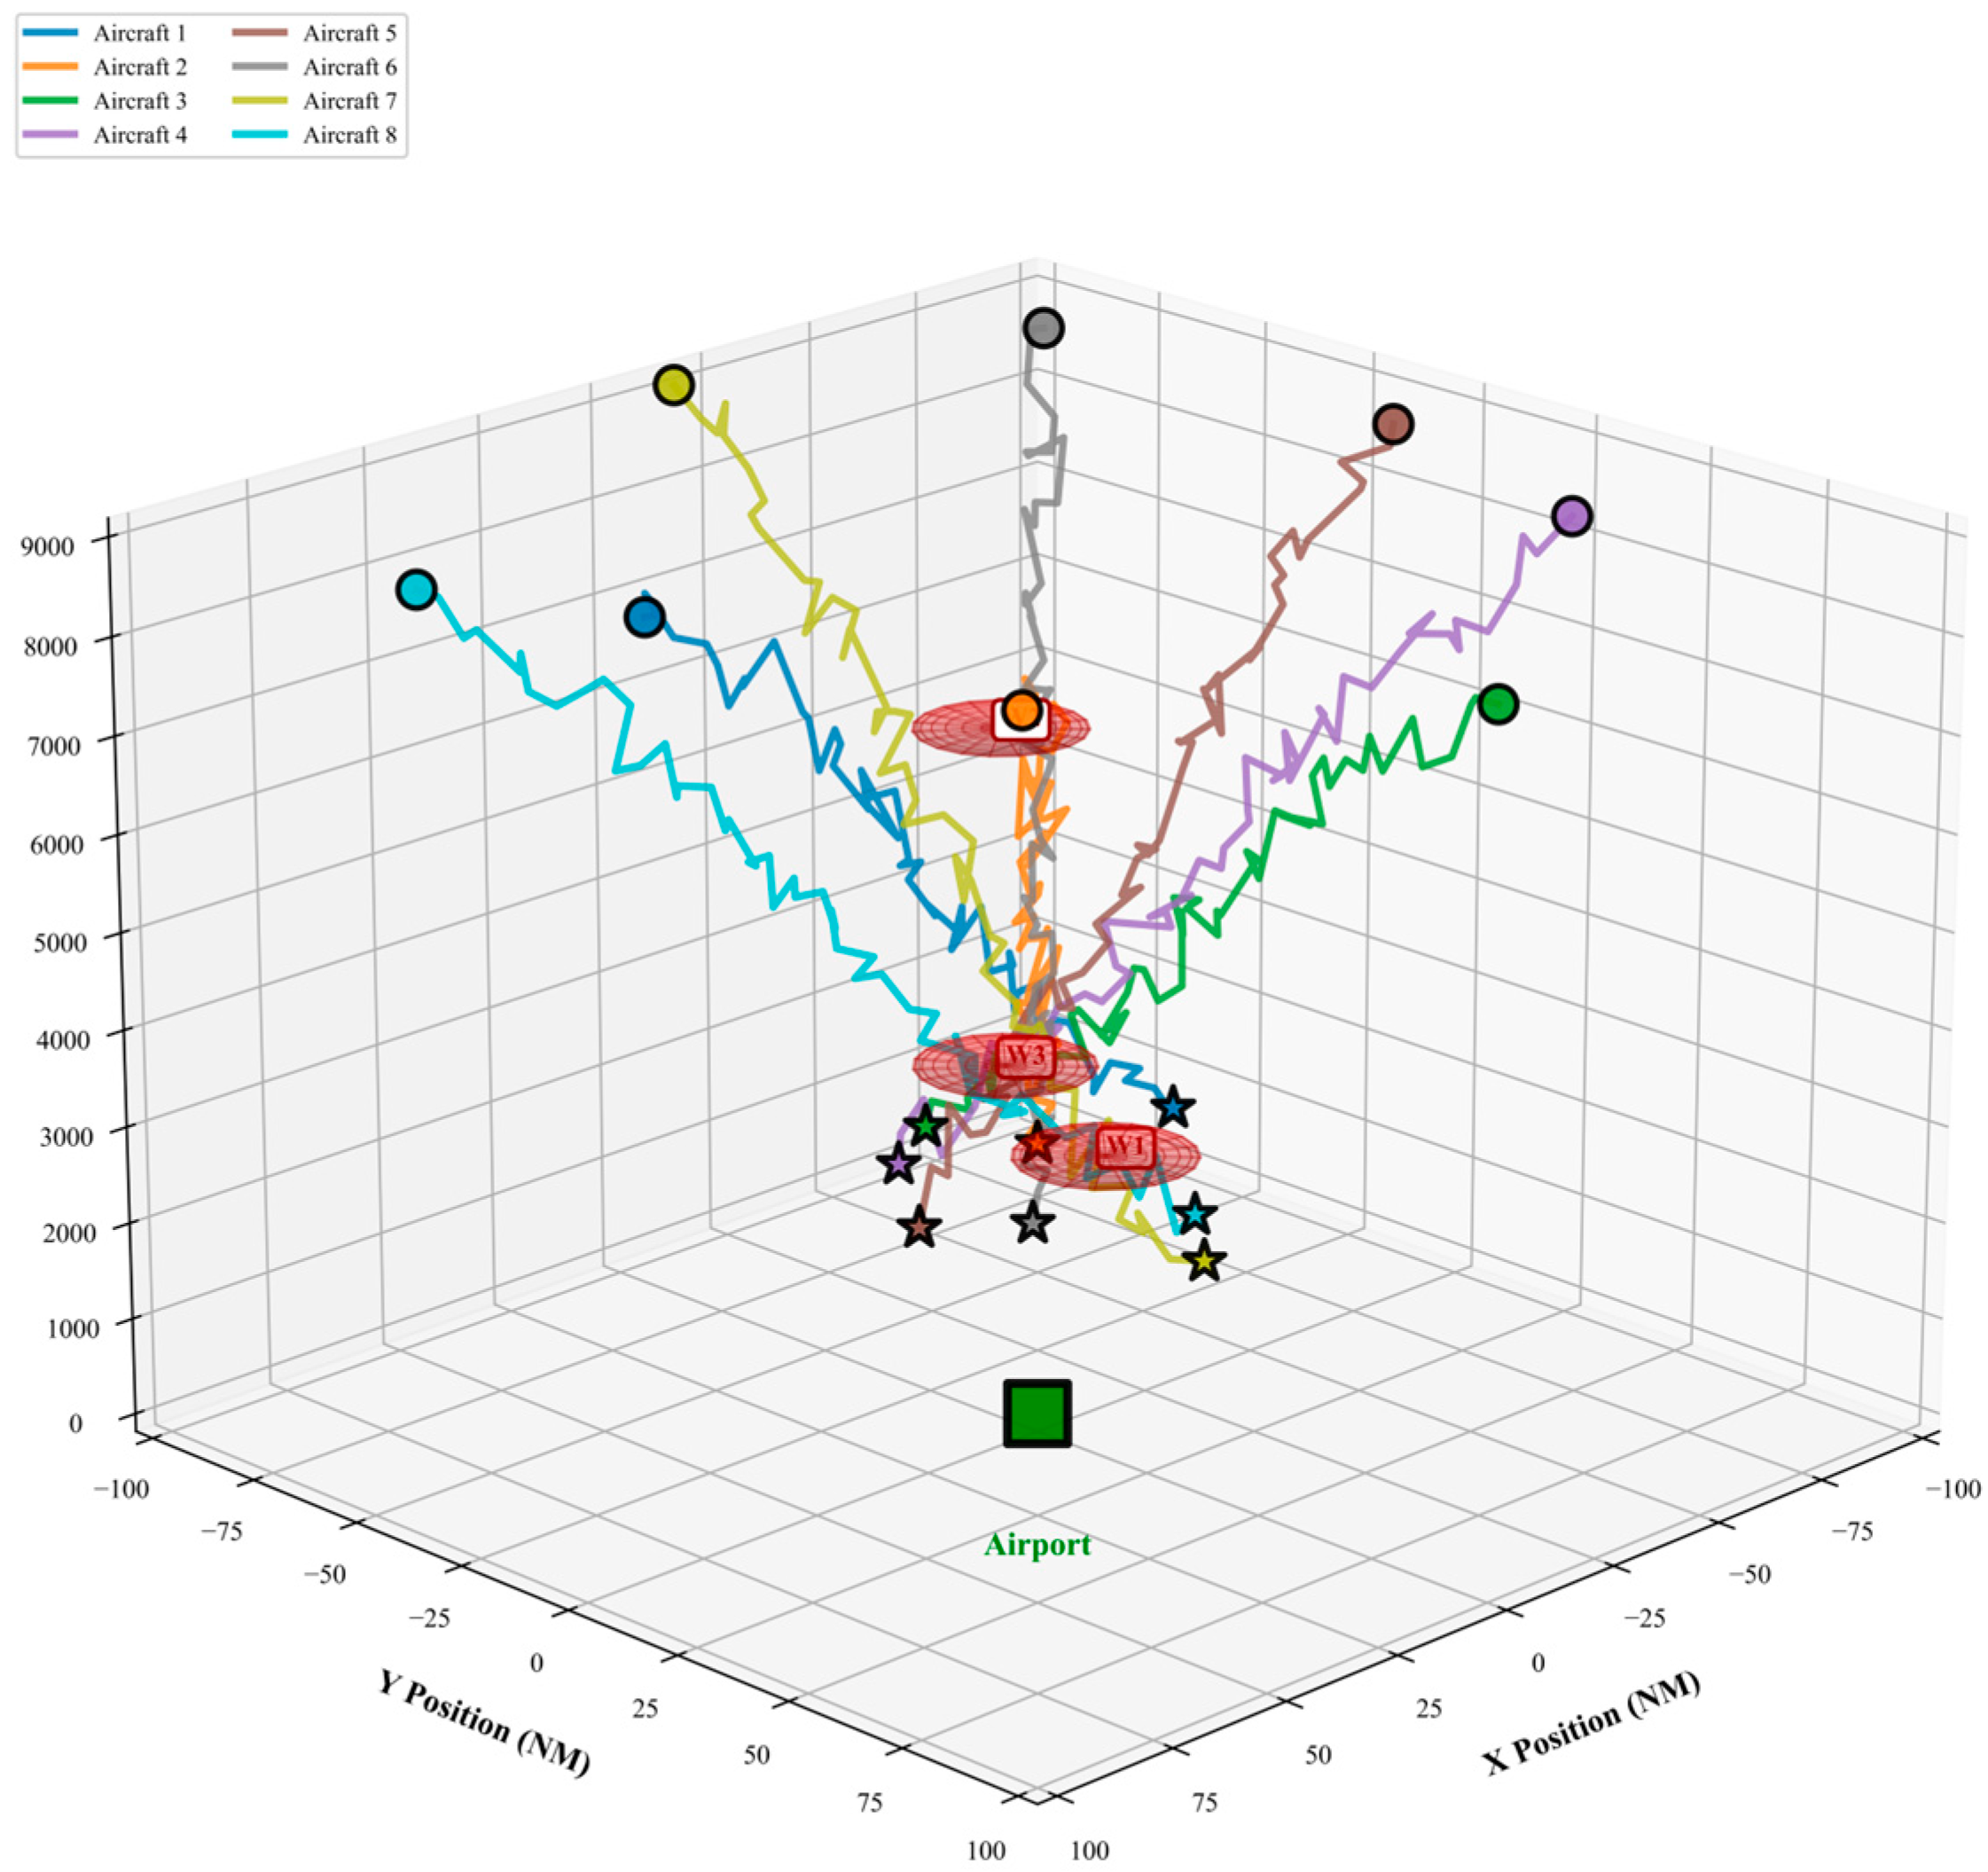
Figure 11 shows the three-dimensional conflict resolution trajectory with weather avoidance, color-coded by aircraft. The starting point (circle) and endpoint (star) are clearly marked, with a smooth, navigable trajectory successfully avoiding weather units—demonstrating the capability of the framework to generate actionable solutions.
Table 9 quantifies compliance automation performance. Controller A accepted AI recommendations 78% of the time, with 97% consistency with original decisions. Acceptance rates for Controllers B through H ranged from 75% to 89%. Comparing personalized models with group models revealed critical operational insights: personalized models achieved 95.2% accuracy for known controllers, while group models attained 93.45% accuracy across all controllers. This trade-off enhances the operational flexibility of group models, ensuring reliable performance even for new or unfamiliar controllers.
The framework achieved a motion classification accuracy of 93.45% (exceeding the 92% target), an average absolute heading error of 4.87° (below the 5.3° threshold), an average absolute altitude error of 142 feet (below the 200-foot threshold), and an average absolute velocity error of 3.21 knots (below the 5-knot threshold), meeting all predefined compliance objectives.
5.5. Dynamic Weather Analysis
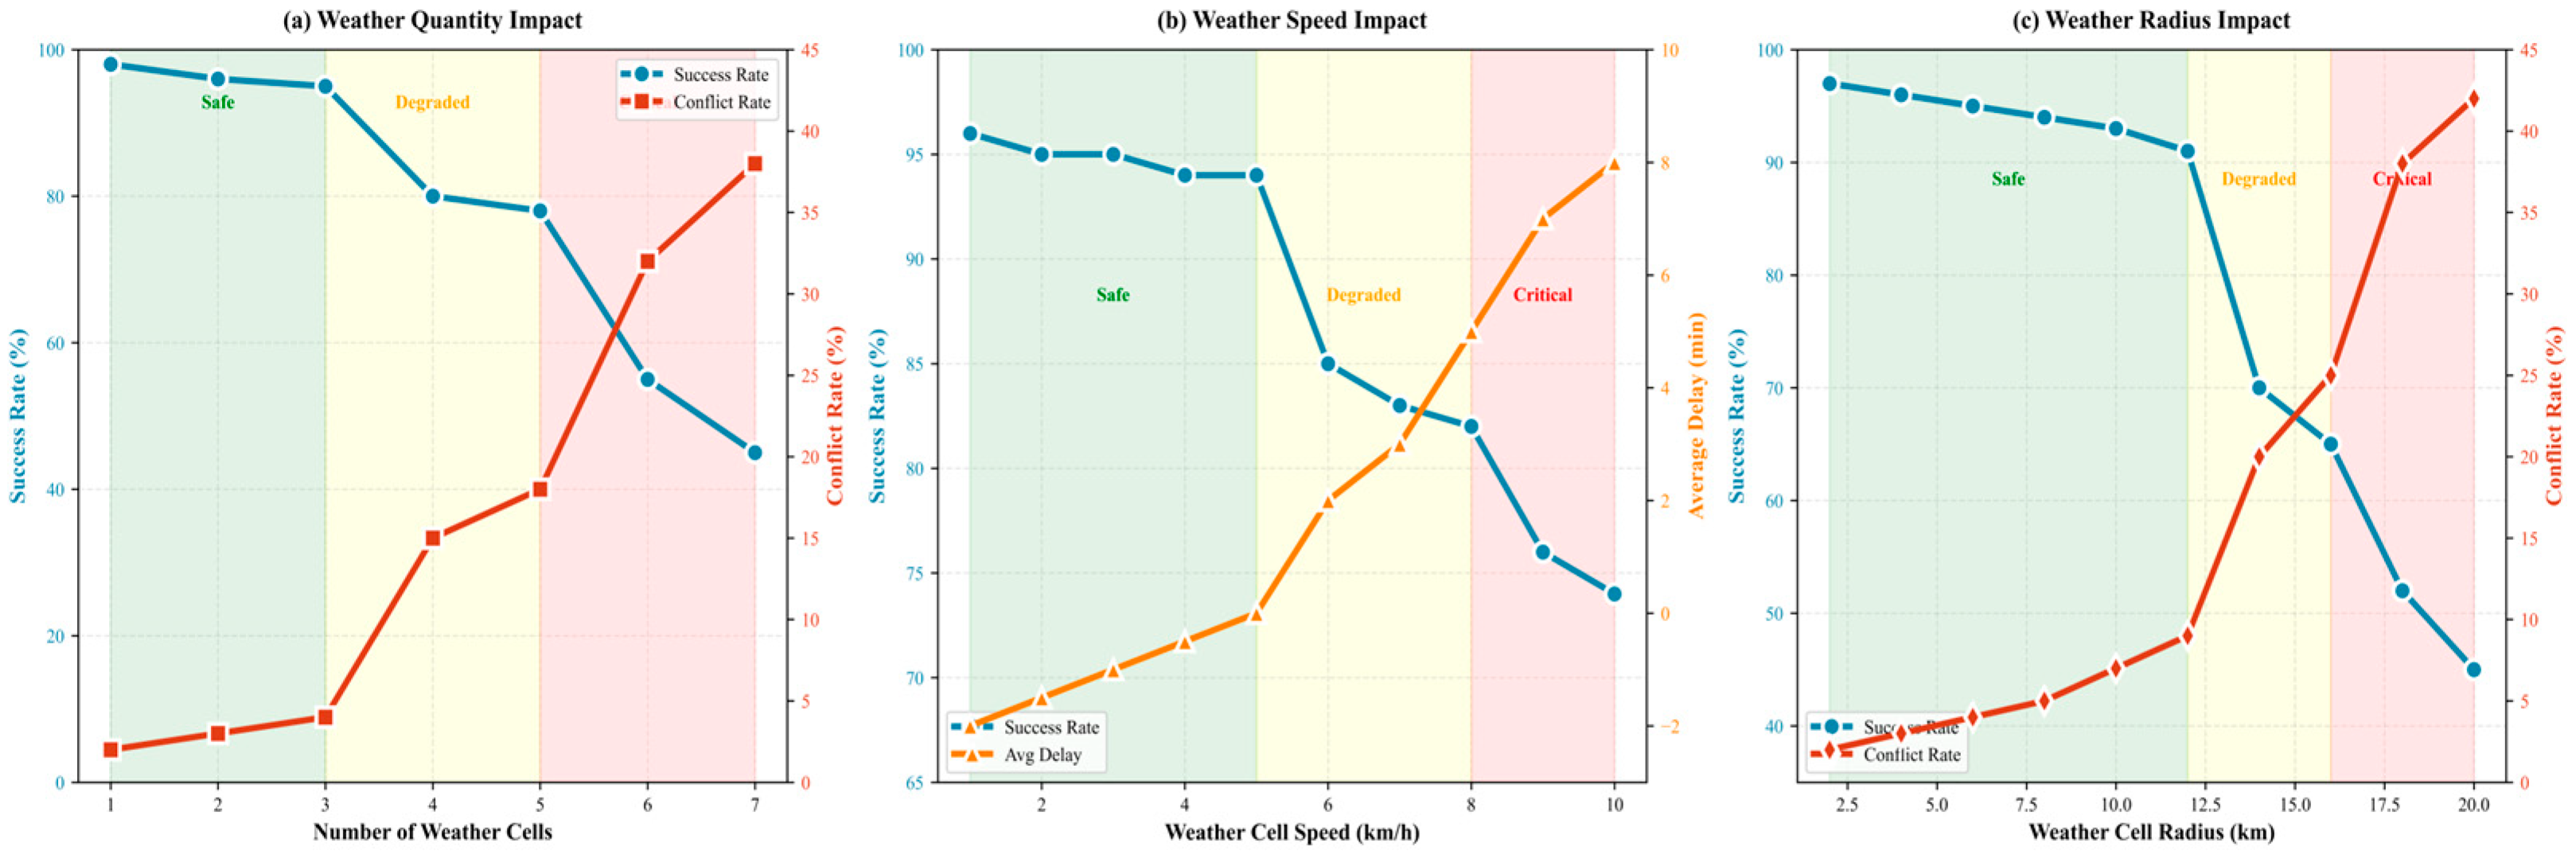
Figure 12 presents a systematic analysis of the performance of the framework under various dynamic weather conditions, encompassing 700 combinations (7 weather unit counts × 10 movement velocity × 10 radius sizes). The 27 configurations in the control group isolate the impact of each dimension, with baseline conditions set at 2 units, 5 km/h speed, and 10 km radius (training configuration).
Panel (a) examines the impact of weather unit count on performance. For 1–3 units, the framework maintains excellent performance with a success rate exceeding 95% and a conflict rate below 3%. Performance moderately declines at 4–5 units (success rate ≈ 80%, conflict rate ≈ 15%). With 6–7 units, severe degradation occurs (success rate < 60%, conflict rate > 30%) as maneuvering space rapidly diminishes. When 7 units occupy approximately 40% of the terminal maneuvering zone airspace, aircraft enter a “conflict resolution cycle”—resolving one conflict generates new conflicts—effectively reaching the system capacity limit.
Panel (b) analyzes the impact of the weather unit radius. For a radius between 2 and 12 km, the framework maintains robust performance (success rate > 90%, conflict rate < 10%). Performance degrades at 14–16 km radius (success rate ≈ 70%, conflict rate ≈ 20%) and severely degrades at 18–20 km radius (success rate < 50%, conflict rate > 40%). Large weather units (>14 km) block primary terminal maneuvering sectors, forcing aircraft into congested “safety corridors” and causing severe bottlenecks and cascading conflicts.
Panel (c) demonstrates performance under extreme conditions with combined pressures: 5 units, 7 km/h speed, 14 km radius. The framework achieves a 68% success rate, 18% conflict rate, +12 min average delay, with 23% of aircraft experiencing sequence changes. While the framework maintains partial functionality under extreme conditions, performance degradation indicates operating at the envelope limits. Beyond these thresholds, manual intervention or ground delay plans are recommended.
6. Conclusions
This paper addresses challenges in joint optimization of spatial conflicts and temporal scheduling within high-density airspace, including system integration gaps, inadequate handling of multi-source uncertainties, lack of transparency, and insufficient robustness to abnormal scenarios. It proposes the MSTAGNN-MARL Framework.
Through the organic integration of strategic-tactical-execution hierarchical architecture, uncertainty-aware graph neural network multi-agent reinforcement learning, compliance automation systems, and robust anomaly scenario safeguards, this framework systematically achieves coordinated optimization of spatial conflict resolution and temporal scheduling. The crucial innovations of MSTAGNN-MARL manifest in three aspects:
First, the constructed three-layer strategic-tactical-execution architecture effectively integrates spatial and temporal optimization problems, overcoming the isolated processing limitations of existing methods.
Second, conflict features are innovatively encoded as edge attributes in dynamic social graphs. The established multi-source uncertainty modeling system effectively handles complex uncertainties in operational environments.
Third, personalized and group-conformity models are realized through behavioral cloning technology, while the transparency decision dashboard achieves 93.45% action classification accuracy and 78% controller acceptance rate.
Experimental validation using real-world terminal maneuvering area data from multi-airport systems in the Guangdong-Hong Kong-Macao Greater Bay Area demonstrates that MSTAGNN-MARL achieves an 89.3% conflict resolution rate. In terms of scheduling efficiency, it reduced average delays by 6 min compared to advanced baseline methods, achieving 100% on-time performance for scenarios with up to 52 aircraft. The framework maintained effective operation across a wide density range from 4 to 92 aircraft. Dynamic weather robustness testing demonstrated over 95% success rates for 1–3 weather units within a 2–12 km radius, while sustaining 68% success rates under extreme conditions. Comparative validation against five advanced models confirms substantial improvements across all key metrics.
Despite significant achievements, this study has limitations: the current research employs a two-dimensional airspace representation, necessitating exploration of full three-dimensional airspace modeling; the framework primarily focuses on single-objective optimization, with potential for extension to multi-objective Pareto optimization; weather models use circular cell representations, requiring introduction of finer-grained modeling; human–machine interaction mechanisms warrant further refinement.
Future research will advance in the following directions: (1) Explore 3D airspace modeling methods while reducing computational complexity; (2) Adopt multi-objective reinforcement learning and incorporate transfer learning techniques; (3) Integrate high-resolution meteorological data and probabilistic forecasting; explore adaptive automation level adjustment strategies; (4) Validate and enhance model transferability across diverse scenarios.
In summary, MSTAGNN-MARL provides a novel research paradigm for comprehensively resolving spatiotemporal conflicts in high-density airspace through the organic integration of multi-criteria decision optimization, graph neural networks, multi-agent reinforcement learning, and behavior tree-driven control. This approach provides theoretical and technical support for achieving safer, more efficient, and autonomous air traffic management systems.
Author Contributions
Conceptualization, E.W. and H.X.; methodology, E.W. and H.X.; software, H.X.; validation, E.W., H.X. and N.Y.; formal analysis, S.X.; investigation, Y.C.; resources, P.Q.; data curation, G.J.; writing—original draft preparation, H.X.; writing—review and editing, E.W. and H.X.; visualization, F.L.; supervision, E.W.; project administration, N.Y.; funding acquisition, E.W. All authors have read and agreed to the published version of the manuscript.
Funding
This work is funded by the National Natural Science Foundation of China Basic Science Center Program, grant number 62388101; the CAAC Key laboratory of General Aviation Operation (Civil Aviation Management Institute of China), grant number CAMICKFJJ-2024-01; the State Key Laboratory of Air Traffic Management System, grant number SKLATM202401; the Open Fund of Key Laboratory of Technology and Equipment of Tianjin Urban Air Transportation System, grant number TJKL-UAM-202305; the Yunnan Key Laboratory of Unmanned Autonomous Systems, grant number 202501ZD02; the Aeronautical Science Foundation of China, grant number 20240055054001; the Open Fund of Key Laboratory of Spatio-temporal Sensing and Intelligent Processing, Ministry of Natural Resources of the People’s Republic of China, grant number 232203; the Open Fund of Key Laboratory of Civil Aviation Flights Wide Area Surveillance and Safety Control technology of Civil Aviation University of China, grant number 202105; the Applied Basic Research Program of Liaoning Province, grant number 2025JH2/101300011; the General Program of Liaoning Province Education Department, grant number 20250054, 310125011, LJ212510143033.
Data Availability Statement
The data that support the findings of this study shall be made available from the corresponding author upon reasonable request.
Conflicts of Interest
Author Nan Yu was employed. The remaining authors declare that the research was conducted in the absence of any commercial or financial relationships that could be construed as a potential conflict of interest.
References
- Costa, R.D.; Hirata, C.M.; Pugliese, V.U. A comparative study of situation awareness-based decision-making model reinforcement learning adaptive automation in evolving conditions. IEEE Access 2023, 11, 16166–16182. [Google Scholar] [CrossRef]
- Dönmez, K.; Bakır, M.; Cecen, R.K. A comprehensive data-driven MCDM approach to determine the best single objective function for the aircraft sequencing and scheduling problem. Expert Syst. Appl. 2025, 296, 129172. [Google Scholar] [CrossRef]
- Hamissi, A.; Dhraief, A. A survey on the unmanned aircraft system traffic management. ACM Comput. Surv. 2023, 56, 1–37. [Google Scholar] [CrossRef]
- Chen, Y.; Zhao, Y.; Wu, Y. Recent progress in air traffic flow management: A review. J. Air Transp. Manag. 2024, 116, 102573. [Google Scholar] [CrossRef]
- Glass, C.; Davis, L.; Watkins-Lewis, K. A visualization and optimization of the impact of a severe weather disruption to an air transportation network. Comput. Ind. Eng. 2022, 168, 107978. [Google Scholar] [CrossRef]
- Pongsakornsathien, N.; Safwat, N.E.-D.; Xie, Y.; Gardi, A.; Sabatini, R. Advances in low-altitude airspace management for uncrewed aircraft and advanced air mobility. Prog. Aerosp. Sci. 2025, 154, 101085. [Google Scholar] [CrossRef]
- Shi, Z.; Zhang, H.; Li, Y.; Zhou, J. Air Traffic Sector Network: Motif Identification and Resilience Evaluation Based on Subgraphs. Sustainability 2023, 15, 13423. [Google Scholar] [CrossRef]
- Du, X.; Lu, Z.; Wu, D. An intelligent recognition model for dynamic air traffic decision-making. Knowl.-Based Syst. 2020, 199, 105274. [Google Scholar] [CrossRef]
- Groot, D.J.; Ellerbroek, J.; Hoekstra, J.M. Analysis of the impact of traffic density on training of reinforcement learning based conflict resolution methods for drones. Eng. Appl. Artif. Intell. 2024, 133, 108066. [Google Scholar] [CrossRef]
- Tang, Y.; Xu, Y.; Lv, R.; Inalhan, G. Conflict probability based strategic conflict resolution for UAS traffic management considering Reasonable-Time-To-Act principle. Transp. Res. Part C Emerg. Technol. 2025, 179, 105276. [Google Scholar] [CrossRef]
- Zang, H.; Zhu, J.; Gao, Q. Deep learning architecture for flight flow spatiotemporal prediction in airport network. Electronics 2022, 11, 4058. [Google Scholar] [CrossRef]
- Pham, D.T.; Tran, P.N.; Alam, S.; Duong, V.N.; Delahaye, D. Deep reinforcement learning based path stretch vector resolution in dense traffic with uncertainties. Transp. Res. Part C Emerg. Technol. 2022, 135, 103463. [Google Scholar]
- Papadopoulos, G.; Bastas, A.; Vouros, G.A.; Crook, I.; Andrienko, N.; Andrienko, G.; Cordero, J.M. Deep reinforcement learning in service of air traffic controllers to resolve tactical conflicts. Expert Syst. Appl. 2024, 236, 121234. [Google Scholar] [CrossRef]
- Zhang, Y.; Zhou, Y.; Fujita, H. Distributed multi-agent reinforcement learning for cooperative low-carbon control of traffic network flow using cloud-based parallel optimization. IEEE Trans. Intell. Transp. Syst. 2024, 35, 20715–20728. [Google Scholar] [CrossRef]
- Yahi, N.; Gudeta, S.G.; Karimoddini, A. On-the-fly coordination of maneuvers for separation assurance of UAM aircraft in congested airspace. IEEE Trans. Intell. Transp. Syst. 2024, 25, 18714–18733. [Google Scholar] [CrossRef]
- Tang, Y.; Xu, Y. Incorporating optimization in strategic conflict resolution for UAS traffic management. IEEE Trans. Intell. Transp. Syst. 2023, 24, 12393–12405. [Google Scholar] [CrossRef]
- Huang, X.; Tian, Y.; Li, J.; Zhang, N.; Dong, X.; Lv, Y.; Li, Z. Joint autonomous decision-making of conflict resolution and aircraft scheduling based on triple-aspect improved multi-agent reinforcement learning. Expert Syst. Appl. 2025, 275, 127024. [Google Scholar] [CrossRef]
- Sun, Z.; Qin, Z.; Ma, R.; Huang, T.; Gao, Z.; Ji, A. Microscopic right-of-way trading mechanism for cooperative decision-making: Theories and preliminary results. IEEE Trans. Intell. Transp. Syst. 2024, 26, 2461–2477. [Google Scholar] [CrossRef]
- Kuchar, J.K.; Yang, L.C. A review of conflict detection and resolution modeling methods. IEEE Trans. Intell. Transp. Syst. 2002, 1, 179–189. [Google Scholar]
- Pallottino, L.; Feron, E.M.; Bicchi, A. Conflict resolution problems for air traffic management systems solved with mixed integer programming. IEEE Trans. Intell. Transp. Syst. 2002, 3, 3–11. [Google Scholar] [CrossRef]
- Costa, R.D.; Hirata, C.M. Reinforcement learning applied to a situation awareness decision-making model. Inf. Sci. 2025, 704, 121928. [Google Scholar] [CrossRef]
- Wang, Y.; Cai, W.; Tu, Y.; Mao, J. Reinforcement-learning-informed prescriptive analytics for air traffic flow management. IEEE Trans. Autom. Sci. Eng. 2023, 21, 4188–4202. [Google Scholar] [CrossRef]
- Brittain, M.; Wei, P. Scalable autonomous separation assurance with heterogeneous multi-agent reinforcement learning. IEEE Trans. Autom. Sci. Eng. 2022, 19, 2837–2848. [Google Scholar] [CrossRef]
- Gui, D.; Le, M.; Luo, X.; Huang, Z. A metaheuristic algorithm for efficient aircraft sequencing and scheduling in terminal maneuvering areas. Optim. Lett. 2025, 19, 579–604. [Google Scholar] [CrossRef]
- Liang, M.; Delahaye, D.; Maréchal, P. Integrated sequencing and merging aircraft to parallel runways with automated conflict resolution and advanced avionics capabilities. Transp. Res. Part C Emerg. Technol. 2017, 85, 268–291. [Google Scholar] [CrossRef]
- Wang, L.; Yang, H.; Han, Y.; Yin, S.; Wu, Y. Taming deep reinforcement learning-based conflict resolution in air traffic control using geometric technique. Expert Syst. Appl. 2025, 281, 127579. [Google Scholar] [CrossRef]
- Brittain, M.; Wei, P. Autonomous air traffic controller: A deep multi-agent reinforcement learning approach. arXiv 2019, arXiv:1905.01303. [Google Scholar] [CrossRef]
- Ghosh, S.; Varakantham, P.; Adulyasak, Y.; Jaillet, P. Dynamic repositioning to reduce lost demand in bike sharing systems. J. Artif. Intell. Res. 2017, 58, 387–430. [Google Scholar] [CrossRef]
- Guleria, Y.; Pham, D.-T.; Alam, S.; Tran, P.N.; Durand, N. Towards conformal automation in air traffic control: Learning conflict resolution strategies through behavior cloning. Adv. Eng. Inform. 2024, 59, 102273. [Google Scholar] [CrossRef]
- Xu, X.; Feng, G.; Qin, S.; Liu, Y.; Sun, Y. Joint UAV deployment and resource allocation: A personalized federated deep reinforcement learning approach. IEEE Trans. Veh. Technol. 2023, 73, 4005–4018. [Google Scholar] [CrossRef]
- Wang, L.; Yang, H.; Lin, Y.; Yin, S.; Wu, Y. Enhancing air traffic control: A transparent deep reinforcement learning framework for autonomous conflict resolution. Expert Syst. Appl. 2025, 260, 125389. [Google Scholar] [CrossRef]
- Ijtsma, M.; Borst, C.; van Paassen, M.M.; Mulder, M. Evaluation of a decision-based invocation strategy for adaptive support for air traffic control. IEEE Trans. Hum.-Mach. Syst. 2022, 52, 1135–1146. [Google Scholar] [CrossRef]
- Chen, Y.; Xu, Y.; Yang, L.; Hu, M. General real-time three-dimensional multi-aircraft conflict resolution method using multi-agent reinforcement learning. Transp. Res. Part C Emerg. Technol. 2023, 157, 104367. [Google Scholar] [CrossRef]
- Federal Aviation Administration. Instrument Procedures Handbook (Federal Aviation Administration): FAA-H-8083-16A; Simon and Schuster: New York, NY, USA, 2017. [Google Scholar]
- Keshavarz-Ghorabaee, M.; Amiri, M.; Zavadskas, E.K.; Turskis, Z.; Antucheviciene, J. Determination of objective weights using a new method based on the removal effects of criteria (MEREC). Symmetry 2021, 13, 525. [Google Scholar] [CrossRef]
- Lin, X.; Liu, X. Civil Aviation. In The Development of China’s Transportation Industry (1978–2018); Springer Nature: Singapore, 2024; pp. 65–84. [Google Scholar]
- Richter, D.J.; Calix, R.A. Using double deep q-learning to learn attitude control of fixed-wing aircraft. In Proceedings of the 2022 16th International Conference on Signal-Image Technology & Internet-Based Systems (SITIS), Dijon, France, 19–21 October 2022; IEEE: Piscataway, NJ, USA, 2022; pp. 646–651. [Google Scholar]
- Lillicrap, T.P.; Hunt, J.J.; Pritzel, A.; Heess, N.; Erez, T.; Tassa, Y.; Silver, D.; Wierstra, D. Continuous control with deep reinforcement learning. arXiv 2015, arXiv:1509.02971. [Google Scholar]
- Li, Y.; Zhang, Y.; Guo, T.; Liu, Y.; Lv, Y.; Du, W. Graph reinforcement learning for multi-aircraft conflict resolution. IEEE Trans. Intell. Veh. 2024, 9, 4529–4540. [Google Scholar] [CrossRef]
- Liu, Y.; Hansen, M.; Ball, M.O.; Lovell, D.J. Causal analysis of en route flight inefficiency-the US experience. In Proceedings of the Twelfth USA/Europe Air Traffic Management Research and Development Seminar, Seattle, WA, USA, 27–30 June 2017; pp. 27–30. [Google Scholar]
- Citaristi, I. International Civil Aviation Organization—ICAO. In The Europa Directory of International Organizations 2022; Routledge: London, UK, 2022; pp. 336–340. [Google Scholar]
| Disclaimer/Publisher’s Note: The statements, opinions and data contained in all publications are solely those of the individual author(s) and contributor(s) and not of MDPI and/or the editor(s). MDPI and/or the editor(s) disclaim responsibility for any injury to people or property resulting from any ideas, methods, instructions or products referred to in the content. |




 ,
,