Article

Momentum- and Energy-Based Analyses of the Aerodynamic Effects of Boundary Layer Ingestion and Propulsion–Airframe Integration on a Blended Wing Body–Turbofan Configuration

1
Institute of Mechanics, Chinese Academy of Sciences, Beijing 100190, China
2
School of Aeronautics, Northwestern Polytechnical University, Xi’an 710072, China
*
Authors to whom correspondence should be addressed.
Aerospace 2025, 12(9), 846; https://doi.org/10.3390/aerospace12090846
Submission received: 13 August 2025 / Revised: 14 September 2025 / Accepted: 15 September 2025 / Published: 18 September 2025
(This article belongs to the Special Issue Advanced Aircraft Technology (2nd Edition))

Abstract

Boundary layer ingestion (BLI) propulsion offers notable benefits for blended wing body (BWB) aircraft, and understanding the interrelated effects of BLI and propulsion–airframe integration (PAI) is critical for early-stage design decisions. This study numerically applies combined momentum- and energy-based analyses to a closely coupled but non-integrated BWB–turbofan configuration enabling a continuous transition from non-BLI to BLI conditions. By introducing an idealized capture streamtube–airframe interaction force, the drag of BLI layout is decomposed into additional and external components, enabling quantification of a lift-to-drag ratio improvement of 1.7–2.6, corresponding to a 7.14–8.27% gain in power saving coefficient (PSC). Additional drag reduction, the primary contributor to total drag savings, is analytically attributed to inlet total pressure loss. The resulting decrease in required thrust under BLI shows strong mathematical correlation with jet dissipation reduction, revealing an intrinsic link between drag reduction and power saving. PAI exerts a significant influence on the BLI benefits, including nacelle cowl drag penalties, significant variations in shock wave location and strength, and notable suppression of both boundary layer and wake dissipation for the portion of cowl immersed in the airframe wake. These findings inform the transition from podded to BLI engine layouts.

1. Introduction

The Blended Wing Body (BWB) is considered one of the most promising configurations for next-generation civil aircraft, offering significant advantages in overall performance to meet “green aviation” goals [1,2,3,4]. Among the key technologies enabling BWB development, advanced engine and propulsion–airframe integration (PAI) play critical roles [4,5]. BWB engines are typically mounted at the aft upper surface of the airframe and can be categorized as podded, embedded, or distributed. Embedded and distributed engines are integrated into the airframe and adopt boundary layer ingestion (BLI) technology to increase propulsion efficiency and fuel economy, representing a key direction for future development [3,4].
BLI propulsion enhances fuel economy by ingesting the airframe boundary layer to recover the wake momentum deficit [6,7]. Smith [8] introduced the power saving coefficient (PSC) to quantify BLI performance, emphasizing that effective wake recovery and propulsor design are essential, with potential power savings of up to 20%. Drela [9] proposed the power balance method, which offers a consistent framework for analysing integrated propulsion–airframe systems. In addition, Arntz et al. [10] incorporated exergy analysis, showing that a BLI-enabled BWB aircraft could reduce exergy waste to 3% and achieve fuel savings of up to 1.5%. Lv et al. [11,12] further demonstrated that idealized BLI configurations can enhance propulsive efficiency by at least 27%, albeit at the expense of increased drag. Mutangara et al. [13] demonstrated through mechanical energy analysis that BLI’s energy recovery efficacy is governed by propulsor design, integration, and operational conditions. Kim and Felder [14] examined BLI under transonic conditions and noted that electric fans particularly benefit from BLI, especially when shock wave interactions are involved. Efforts to improve momentum-based performance accounting have focused on enhancing its applicability to BLI analysis [15]. Together, these studies form a solid theoretical basis for evaluating BLI performance in future aircraft designs.
Accurately and efficiently estimating the benefits of BLI is critical during conceptual design. To support this need, various modelling approaches have been developed, particularly for early design phases [16,17,18,19,20,21,22]. Most use simplified, physics-based models that avoid high computational cost and are generally classified as uncoupled, weakly coupled, and strongly coupled approaches. Common methods include actuator disc models, parallel compressor models, body force approaches, and boundary conditions at the fan face and nozzle exit. Depending on the desired fidelity, these models may use inputs such as boundary layer profiles, fan operation maps, inlet distortion metrics, or engine component geometries and parameters. They are typically used to enable multidisciplinary coupling between airframe aerodynamics and propulsion, facilitating trade-off analyses involving thrust placement, fan sizing, and inlet geometry [16,17].
BLI propulsors are typically placed on the aft fuselage to ingest a greater portion of the boundary layer. Nonnegligible PAI effects introduce new challenges in aerodynamics [23,24,25,26], conceptual and optimal design [27,28,29,30], and wind tunnel tests with a powered propulsor [31,32,33]. The primary research objective is to evaluate and maximize the BLI benefits of this integration. A representative configuration is the MIT-developed D8 “double bubble” transport aircraft. Uranga et al. [33,34] applied a power balance framework to evaluate BLI gains through both analytical modelling and wind tunnel testing of a 1:11-scale powered D8 model, showing up to 8.2% cruise power savings—primarily from a 5.2% reduction in jet dissipation. Hall et al. [35] supported these findings via integrated aerodynamic–propulsion simulations.
Another widely studied BLI layout is NASA’s single-aisle turboelectric aircraft with the aft boundary-layer propulsion (STARC-ABL) concept. Several studies have employed coupled aero–propulsive analysis frameworks to assess its performance benefits. Gray et al. [36] used fully integrated computational fluid dynamics (CFD) and thermodynamic cycle models within OpenMDAO to optimize the BLI fan system, consistently finding a 33% increase in net thrust compared to a podded configuration across the fan pressure ratio range of 1.2 to 1.35. Yildirim et al. [37] reported improvements of over 10% in certain mission segments based on PSC analysis.
BWB has garnered significant interest as a natural platform for BLI because of its large planar surface area and ample internal space for integrating embedded propulsion systems [38,39]. Studies of BLI-enabled BWB layouts have aimed to quantify aerodynamic and propulsive benefits via energy-based and CFD-based methods. Zhao et al. [40] employed a power balance approach accounting for wake dissipation, viscous losses, and pressure-volume work, reporting a 5% power savings under current design parameters and a maximum potential of 18.8% under idealized conditions. Ochs et al. [41] conducted numerical research on the N2A-EXTE configuration, achieving 4.2–4.5% gains in propulsive efficiency due to improved wake recovery and reduced inlet distortion. Hardin et al. [42] conducted a full system study and reported that BLI can enhance fuel economy when integrated with advanced power systems and low-pressure-ratio fans, although inlet–fan compatibility remains a challenge. Li et al. [43] examined distributed propulsion layouts, stressing the importance of accounting for fan–inlet coupling and inflow distortion in conceptual design. Overall, these studies confirm that BLI offers notable power savings in BWB aircraft, provided that integration is carefully managed.
Existing studies have confirmed that PAI effects influence BLI benefits; however, in highly integrated configurations, the positive impact of reduced wetted area can mask other potential adverse PAI effects, and isolating the respective contributions of BLI and PAI remains challenging. This study investigates a closely coupled but non-integrated configuration in which a high-bypass-ratio turbofan ingests the boundary layer of a BWB layout. The non-integrated airframe–propulsion arrangement has been employed in previous numerical and experimental studies to evaluate the theoretical benefits of BLI for highly idealized shapes [44,45,46] and is first adapted here to investigate the aerodynamics in a BWB layout. This configuration allows for a continuous transition from non-BLI to BLI intake conditions while maintaining a constant wetted area, which is beneficial for isolating BLI-related performance gains and analysing the effects of the PAI. To inform early-stage design decisions prior to detailed integration, this study analyses both the BLI gains and PAI effects—as well as the underlying mechanisms—using momentum- and energy-based methods.
The remainder of this paper is organized as follows. Section 2 introduces the numerical method, engine boundary conditions, and performance accounting methodology. Section 3 describes the geometric model and operating conditions. Section 4 presents both momentum- and energy-based analyses, identifies the sources of benefit, and examines the effects of the PAI. Section 5 discusses the limitations and applicability of the results. Section 6 summarizes the main conclusions of the study.

2. Methodology

2.1. Numerical Methods and Validation

The finite volume method was employed to solve the steady three-dimensional Reynolds-averaged Navier–Stokes (RANS) equations. The convective term was addressed via the second-order upwind scheme, and the diffusive term was addressed via the central difference scheme. The implicit second-order backward Euler scheme was used for time discretization. The turbulence model was the shear–stress transport (SST) k-ω model [47].
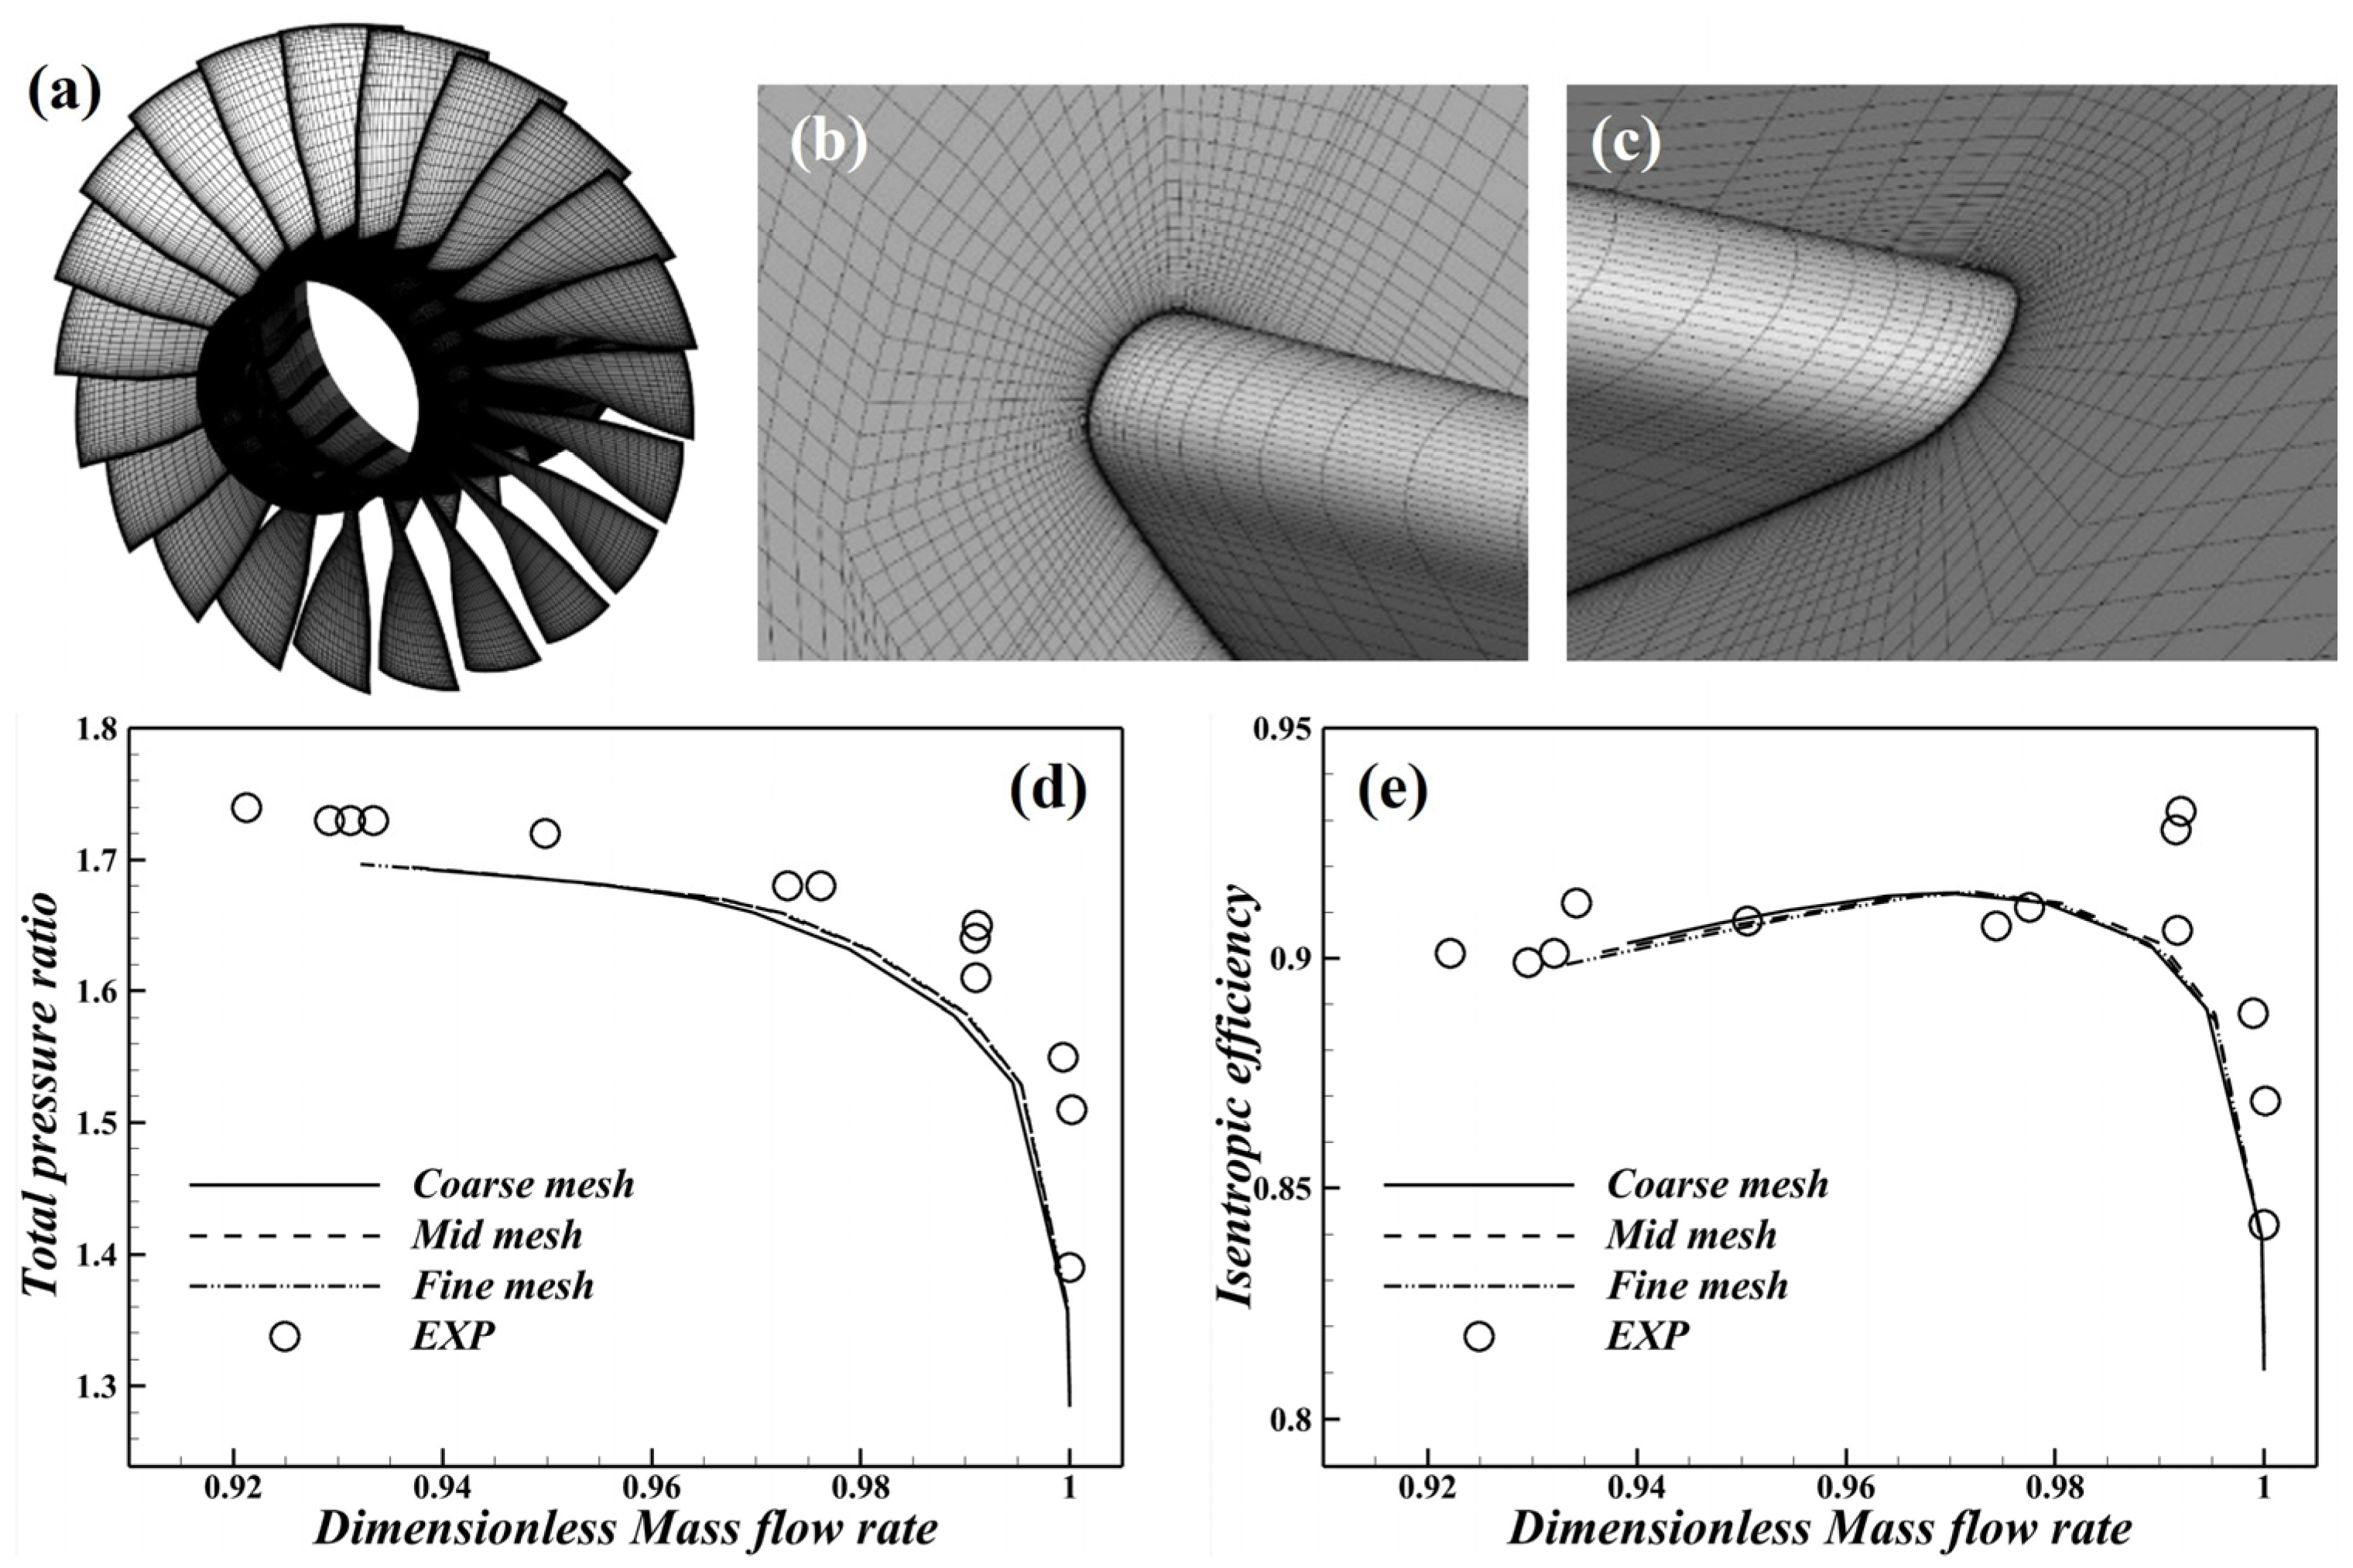
The computational mesh is a multiblock structured body-fitted mesh with an O-H topology, as sketched in Figure 1a. The near-wall region adopts an O-type topology to ensure orthogonality. The nondimensional wall-normal height of the first-layer mesh Δy+ is kept at approximately 1.0 with a wall-normal growth rate of 1.1, where Δy+ = Δyuτ/ν and uτ = (τw/ρ)1/2, with Δy, ν, τw, and ρ representing the height of the first-layer mesh, kinematic viscosity, wall stress, and density, respectively.
Numerical verification was first conducted for the baseline configuration used in this study—the NPU-300(Northwestern Polytechnical University, Xi’an, China), a wide-body BWB civil aircraft developed by Northwestern Polytechnical University [4,5,48,49,50,51]. Designed for intercontinental missions at a cruise Mach number of 0.85 with a passenger capacity of 300, the NPU-300 features a podded twin-engine layout powered by GE-nx turbofans. The conceptual design of this configuration has been largely finalized through previous work. This study aims to theoretically evaluate the potential performance gains that BLI technology could offer for this aircraft.
A 1/72-scale wind tunnel model of the NPU-300 was tested in the FL-3 transonic wind tunnel at the AVIC Aerodynamics Research Institute to obtain aerodynamic forces and visualize flow structures. The test model has a wingspan of 0.9 m, and the tests were conducted at a Mach number of 0.85 under cruising conditions. Subfigures b and c in Figure 1 show the model installed in the test section, along with the numerical mesh used in the simulations; the numerical mesh contains of approximately 8.0 × 10⁶ elements. Subfigures d and e in Figure 1 present the comparison of the aerodynamic characteristics between the numerical and experimental data. In the linear regime, the lift, drag, and pitching moment coefficients are well captured by the simulations. Discrepancies arise beyond stall, especially in the deep-stall region. Since this study focuses on cruise performance at low angles of attack, the numerical method is considered sufficiently accurate for the present study.
NASA Rotor-67 is a transonic axial rotor designed in the 1980s, for which comprehensive experimental data are available [52]. It has also been widely used as a benchmark case in numerical studies of compressor aerodynamics [53,54]. In this study, Rotor-67 is employed as a reference configuration to estimate fan performance degradation under BLI inlet distortion. A full-annulus simulation was performed as the second numerical validation case.
An O–H topological mesh was used, with approximately 2.24 × 10⁷ elements for the medium-density mesh, and 1.12 × 10⁷ and 3.41 × 10⁷ elements for the low- and high-density meshes, respectively. Mesh refinement was applied near the blade leading and trailing edges, tip clearance, and root region. Subfigures a to c in Figure 2 show the global and local views of the computational mesh. The rotor was simulated at a rotational speed of 16,043 rpm (≈1680 rad/s). Subfigures d and e in Figure 2 compare the numerical and experimental results for isentropic efficiency and total pressure ratio as functions of the dimensionless mass flow rate. The predicted isentropic efficiency agrees well with the experimental data, except near the peak efficiency point. The pressure ratio is slightly underpredicted but remains consistent with other numerical studies [53,54]. Overall differences among the grid densities are small; however, near the peak efficiency the medium and fine meshes are closer to the experimental data. Therefore, we select the medium mesh for the subsequent simulations with distorted inlet condition.

2.2. Aerodynamic Performance Accounting Methods for BLI Layout

2.2.1. Drag Calculation Method

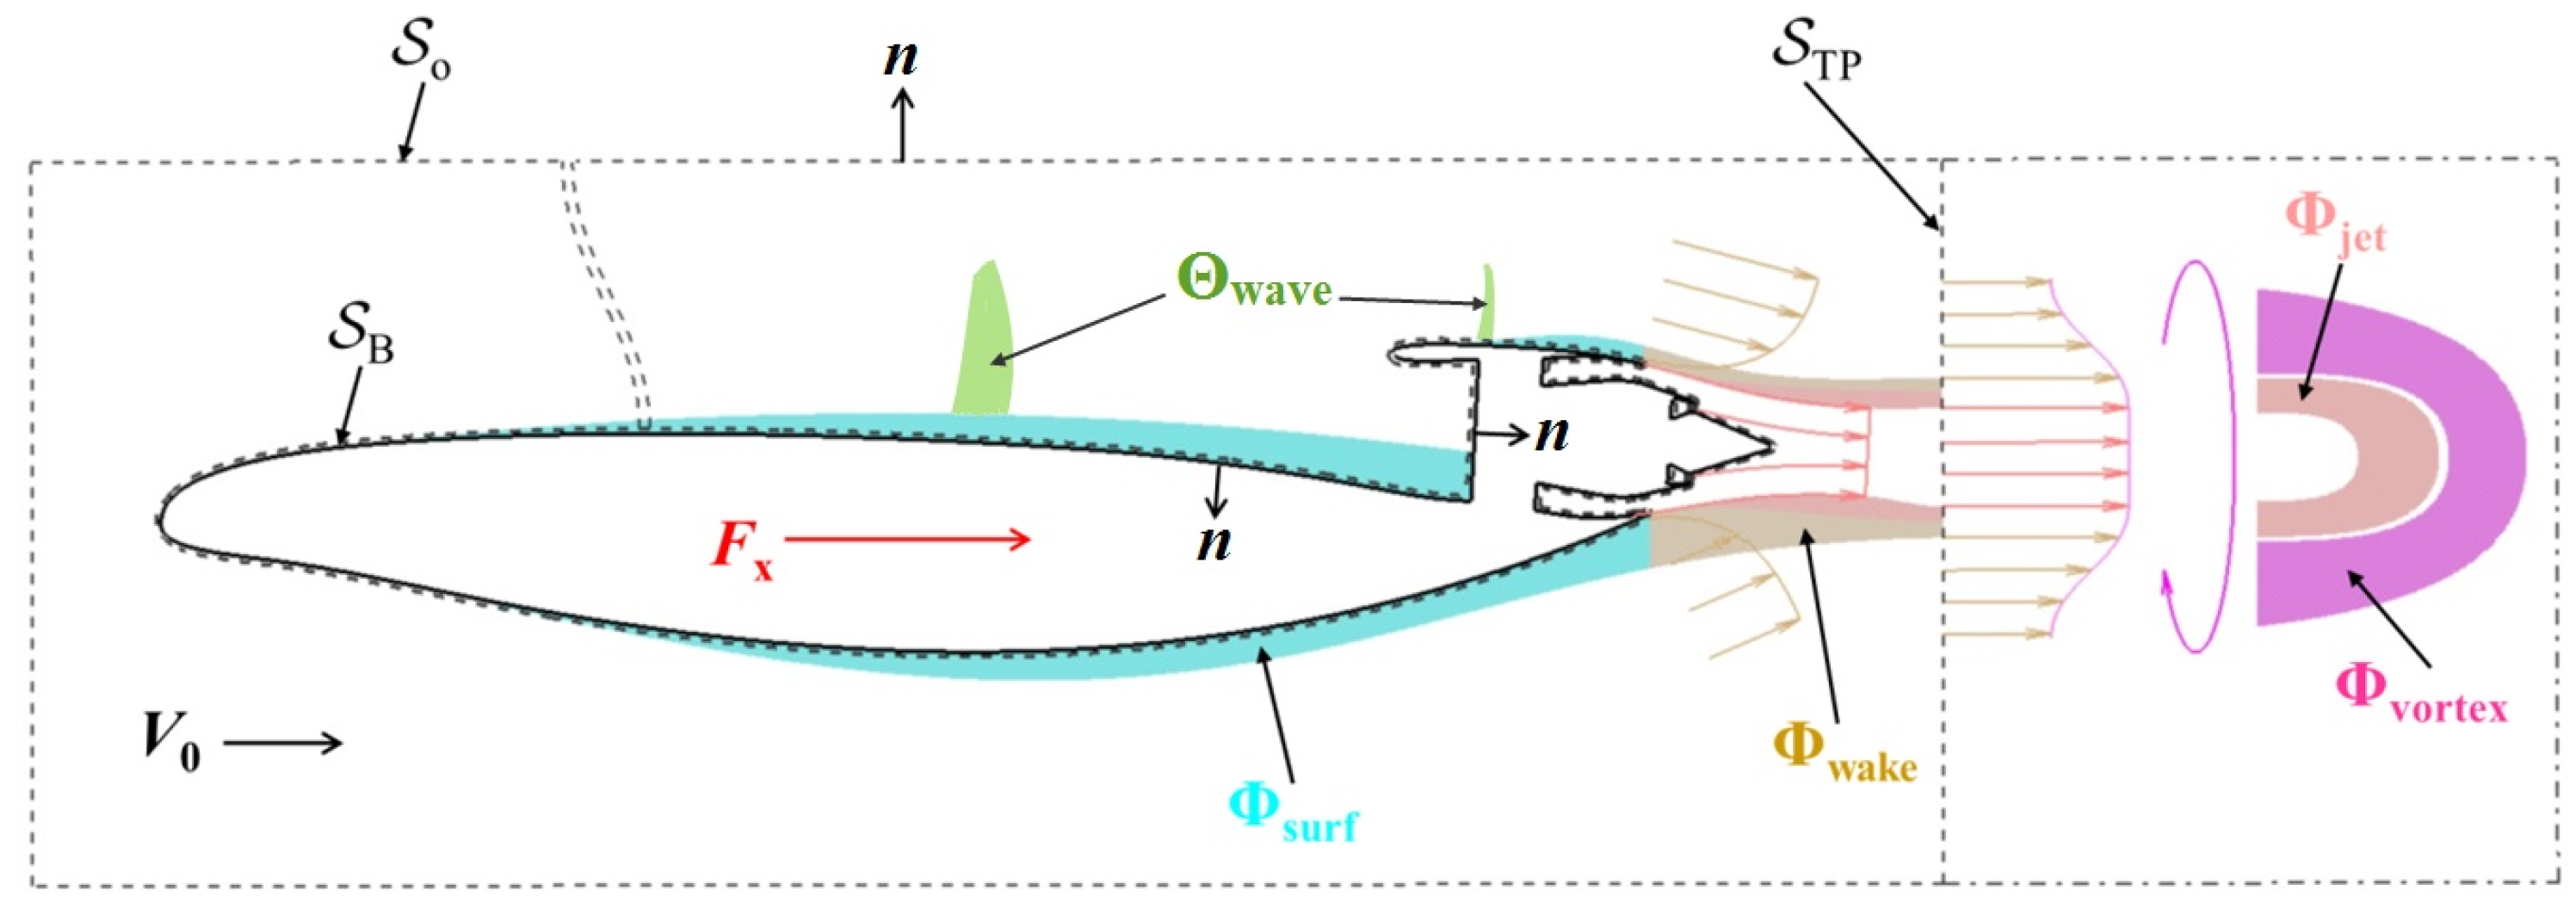
In this section, a drag calculation method for a BLI layout is formulated by combining the streamtube and wall control volume analyses. The primary difference from non-BLI propulsion lies in the interaction between the capture streamtube and the airframe, which is modelled as an ideal force term in the control volume framework. Figure 3 and Figure 4 illustrate the streamtube and wall control volumes, respectively.
Figure 3 defines the streamtube control volume used for BLI drag analysis, bounded upstream by the far-field cross-section, and downstream by the engine exhaust plane. The lateral boundaries include the surface interacting with the airframe and the internal surface of the engine duct. This volume encompasses the entire airflow passing through the engine. Boundary surfaces are colour-coded, with matching labels indicating the applied forces on each surface. Characteristic stations are labelled using a notation adapted from Ref. [55]. In this study, thrust F acts opposite to the freestream direction, whereas the drag D acts along it. FG is the total thrust; it is a quantifiable fluid–fluid force evaluated on the ideal streamtube outlet plane. Dram is the ram drag, Dadd represents the additional drag on the capture streamtube surface, Dduct accounts for the internal drag due to the interaction between the capture streamtube and the internal surface, and DBLI is defined as BLI drag, which is the idealized drag imposed by the airframe on the ingested flow.
Figure 4 illustrates the wall-based control volume used for BLI drag analysis. Within this framework, Fduct represents the internal thrust generated along the engine internal surface; in practice, it is a fluid–solid force that is difficult to quantify directly. Dcowl denotes the drag on the nacelle cowl; and Dscrub accounts for the scrubbing drag acting on the turbine and nozzle fairing cone. The aerodynamic forces acting on the airframe are divided into two components: Dairframe_BLI, which is the force exerted by the capture streamtube on the airframe, and Dairframe_rest, which corresponds to the drag from the remaining portions of the airframe. It is evident that Fduct is equal in magnitude to Dduct, and similarly, Dairframe_BLI is equal in magnitude to DBLI as defined in the streamtube-based analysis.
The scalar axial force balance equations for the streamtube control volume and the wall-based control volume, along with the corresponding interaction force equivalence conditions, are expressed as follows:
F G D ram D add D duct D BLI = 0
F x = F duct D cowl D scrub D airframe_BLI D airframe_rest
F duct D duct = 0
D BLI D airframe_BLI = 0
where Fx is the net axial force. By combining Equations (1)–(4), the following expression for Fx can be derived:
F x = F G D scrub D ram F net D add + D BLI D add_BLI D cowl + D airframe_BLI + D airframe_rest D out_BLI
where Fnet is the net thrust; Dadd_BLI denotes the additional drag associated with BLI; and Dout_BLI denotes the external drag acting on the nacelle cowl and the airframe.
The net thrust Fnet consists of three components, each of which can be expressed as follows:
F G = ( p 9 f p 0 ) A 9 f + m ˙ 9 f V 9 f x 0 + ( p 9 c p 0 ) A 9 c + m ˙ 9 c V 9 c x 0
D scrub = fairing cone ( p p 0 ) n x 0 + τ n x 0 d A
D ram = m ˙ 0 V 0
where p, A, and m ˙ represent the pressure, cross-sectional area, and mass flow rate, respectively. V, x0, and n denote the velocity vector, the freestream direction, and the unit normal vector to the wall, respectively. τ denotes the viscous stress tensor. The subscripts f and c refer to the bypass (fan) and core streams, respectively. Station 0 denotes the undisturbed freestream, and 9f and 9c denote the bypass and core nozzle exits, respectively.
The BLI additional drag, Dadd_BLI, which includes both Dadd and DBLI, is derived by applying the momentum theorem to the 0 → 1 section of the control volume in Figure 3 and is expressed as:
D add_BLI = D add + D BLI = ( p 1 p 0 ) A 1 + m ˙ 1 V 1 x 0 m ˙ 0 V 0
The BLI external drag, Dout_BLI, which represents the surface drag on the nacelle cowl and airframe, is defined as:
D out_BLI = D cowl + D airframe_BLI + D airframe_rest = cowl airframe ( p p 0 ) n x 0 + τ n x 0 d A
Then, the total drag D of the BLI layout can be calculated as:
D = D add_BLI + D out_BLI
For a non-BLI layout, there is no interaction between the capture streamtube and the airframe. This condition leads to:
D BLI = D airframe_BLI = 0
and the total drag D reduces to the traditional form:
D = D add + D cowl + D airframe D out
where Dadd and Dout represent the conventional additional drag and the external drag acting on the wall, respectively.

2.2.2. Power Balance Analysis Method

The power balance analysis method has been widely applied in BLI-related studies. In this work, we adopt the analytical framework developed by Drela [9] and Hall et al. [35], along with the treatment of shock wave dissipation as used by Zhao et al. [40]. Figure 5 illustrates the fluid control volume used for the power balance analysis.
The engine’s mechanical power PK used in this study is expressed as:
P K = p p 0 + 1 2 ρ V 2 V 0 2 V n d S B = 2 , 9 f , 9 c p p 0 + 1 2 ρ V 2 V 0 2 V n d S
where d S is the boundary differential element, Station 0 denotes the undisturbed freestream, station 2 denotes the fan face, and 9f and 9c denote the bypass and core nozzle exits, respectively. Subscript B means the body surface.
The corresponding power saving coefficient (PSC) is defined as:
P S C = P K P K P K
where PK and PK denote the engine’s mechanical power in the baseline and analysed configurations, respectively.
The dissipation terms include the boundary layer dissipation Φsurf, the wake dissipation Φwake, the jet dissipation Φjet, the vortex dissipation Φvortex. and the shock wave dissipation Θwave:
Φ surf = 1 2 V ed 2 V 2 ρ V d S TE
Φ wake = 1 2 V ed V 2 ρ V d S TE
Φ jet = 9 f , 9 c 1 2 ρ V V 0 2 V n + p p 0 V V 0 n d S
Φ vortex = 1 2 ρ v v 0 2 + w w 0 2 V n d S TP
Θ wave = V wave p p 0 V d V
where Ved denotes the velocity at the edge of the boundary layer, v and w denote the velocities in y and z axis, S TE represents the trailing edge surface where the velocity deficit occurs, and S TP denotes the Trefftz plane. The shock wave region V wave is identified via the sensor ζ [40,56,57]:
ζ = V p a p > 0.95
where a denotes the speed of sound. The engine propulsion efficiency ηP is calculated based on Φjet and PK as:
η P = P K Φ jet P K

2.3. Engine Boundary Conditions for BLI Layout

In conceptual design, a turbofan is often modelled by imposing boundary conditions at the fan face and nozzle exit. In this study, the fan face is specified by mass flow rate, while the exit is defined by both the mass flow rate and the total temperature. Given the limited availability of detailed geometry and component-level data for the commercial turbofan used, we estimate the impact of BLI by adjusting the inlet mass flow rate, fan and core temperature ratio, based on the known boundary conditions corresponding to clean (non-BLI) inlet conditions.
The average total pressure loss ε is defined as:
ε = 1 p t , dis p t , clean
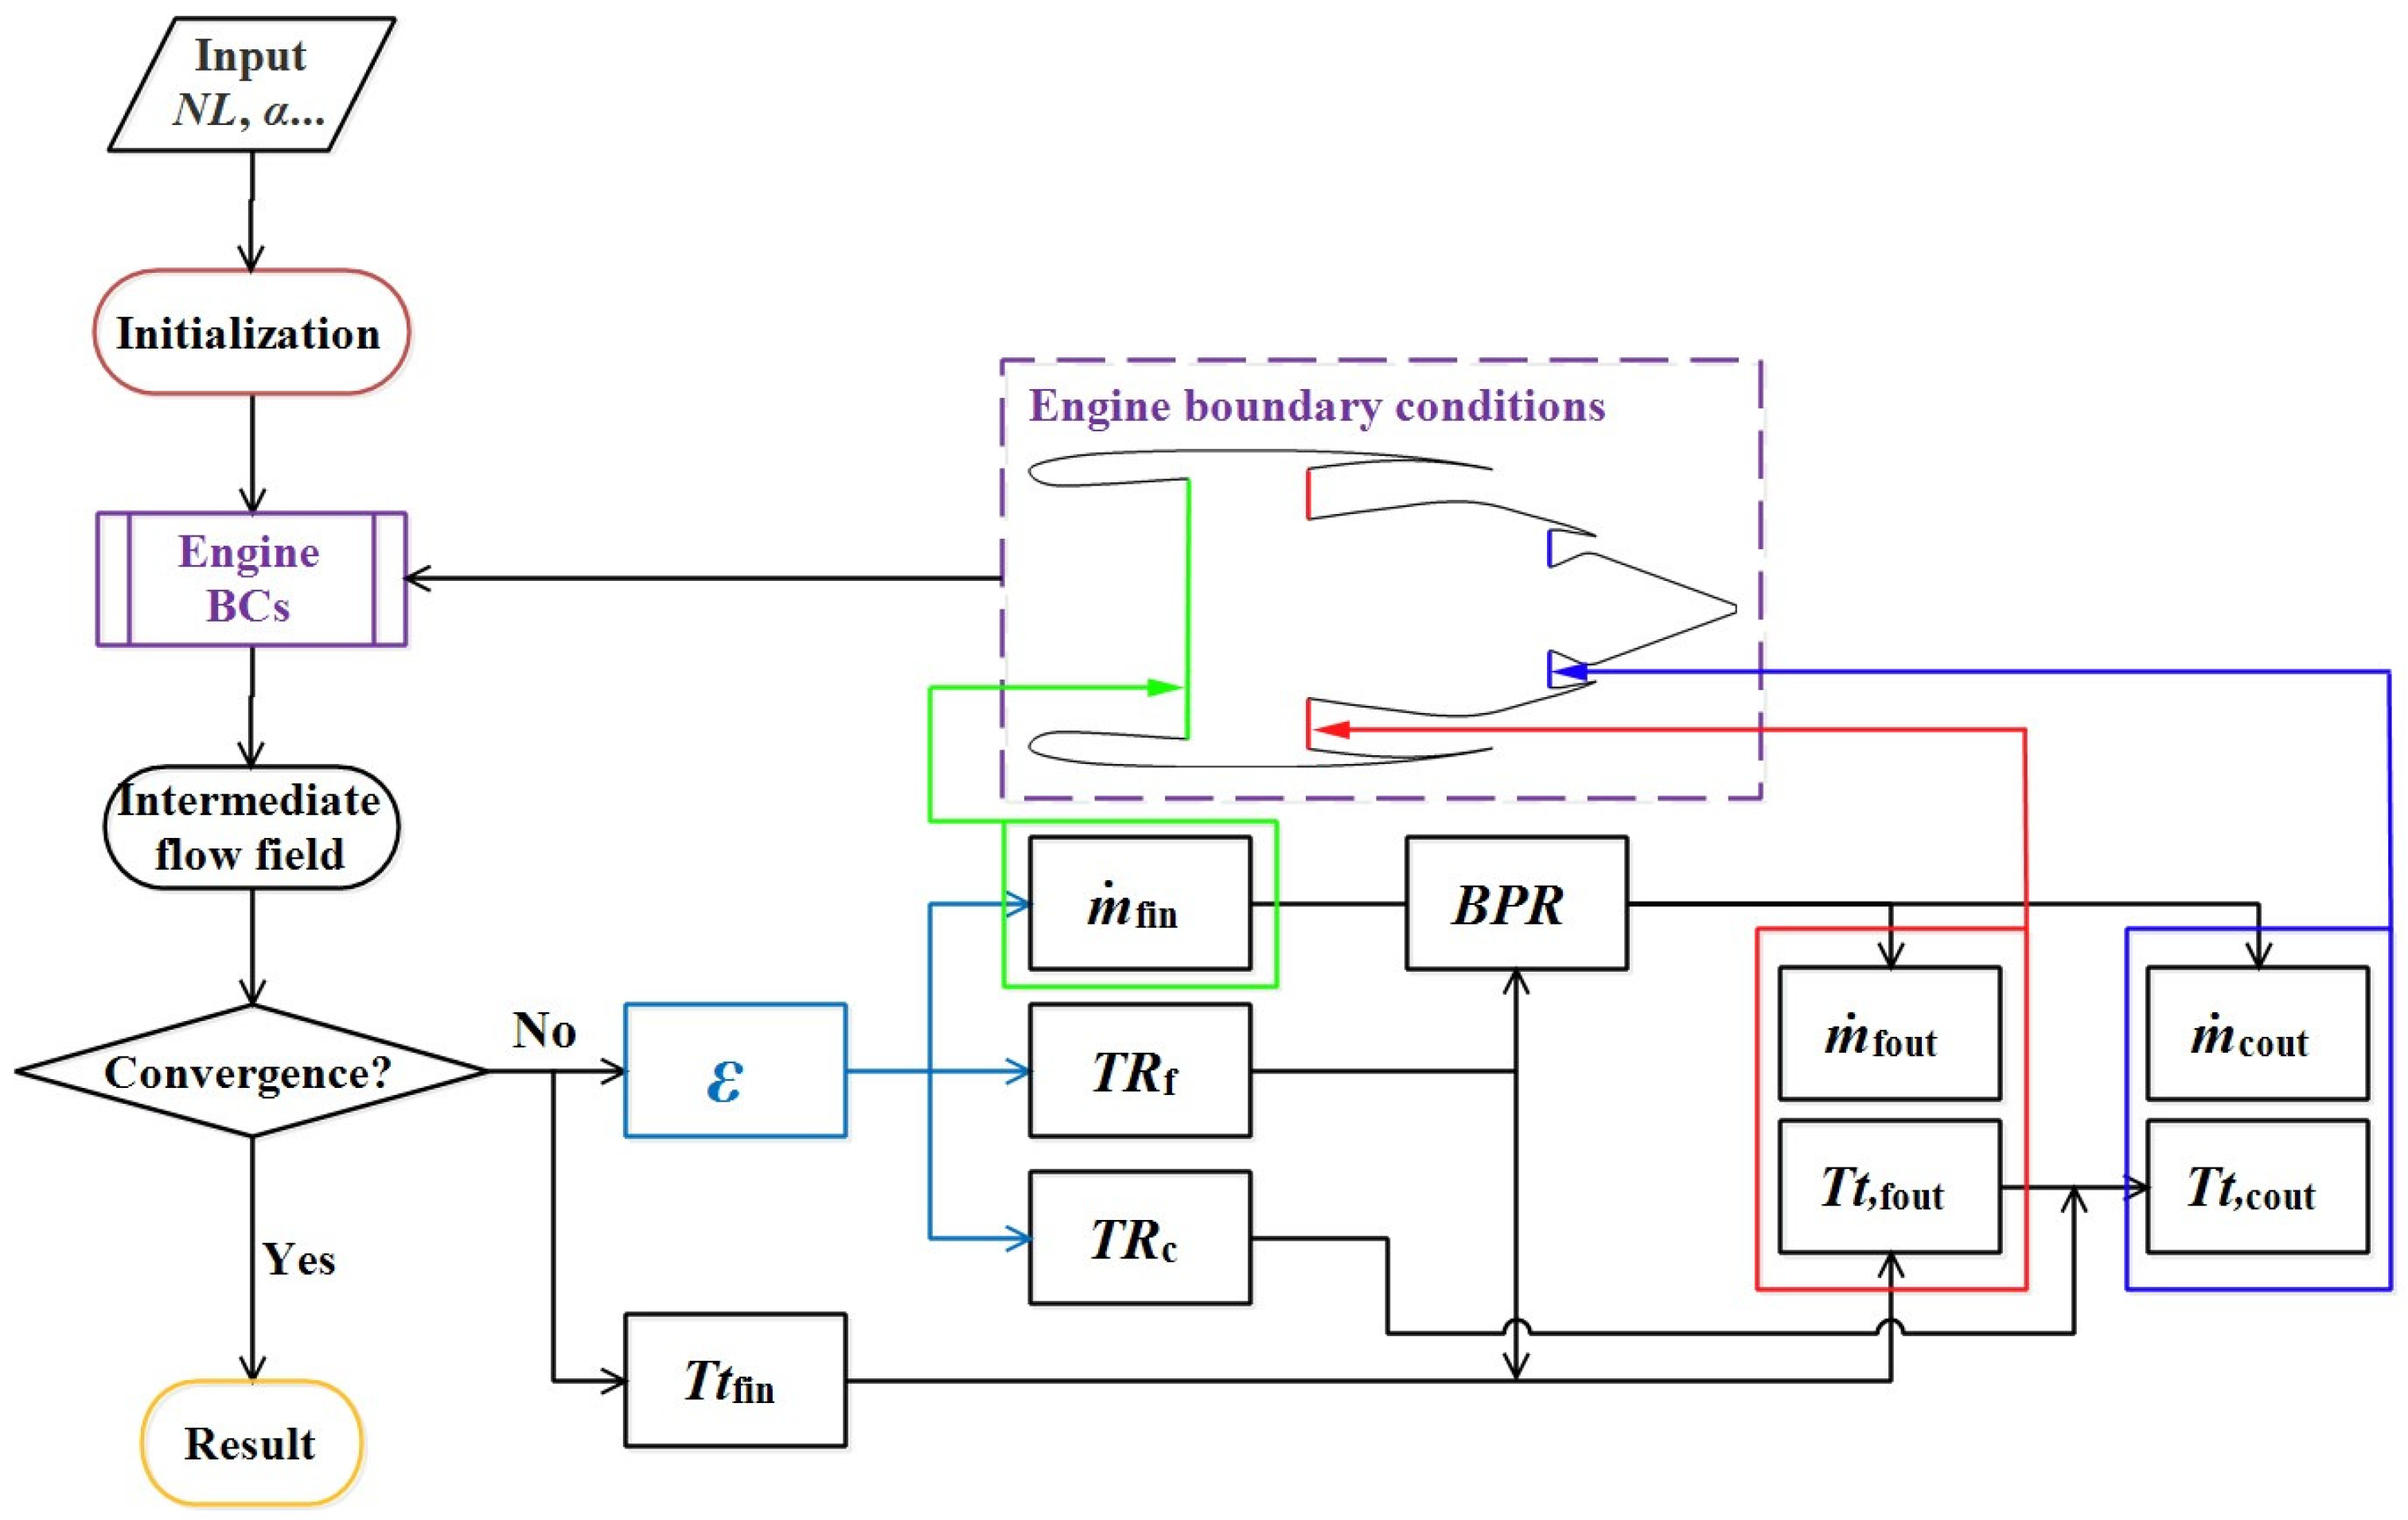
where pt,dis and pt,clean represent the average total pressure at the fan face under distorted and clean inlet conditions, respectively. The pressure loss ε serves as a key indicator for evaluating the impact of BLI and can be easily updated during CFD simulation. Figure 6 outlines the iterative procedure used to determine the engine boundary conditions for BLI layouts. Specifically, the inlet mass flow rate m ˙ fin , fan temperature ratio TRf, and core temperature ratio TRc are adjusted based on the total pressure loss ε relative to the clean baseline conditions. The bypass ratio (BPR) determines the partitioning of mass flow between the fan and core. The total temperature of the bypass fan exit Tt,fout is determined by the inlet total temperature Tt,fin multiplied by TRf. Similarly, the core exit total temperature Tt,cout is obtained by scaling Tt,fout via TRc.
We first establish an estimated relationship between the average total pressure loss ε and the fan total temperature ratio TRf by comparing a series of full-annulus rotor simulations under both clean and distorted inlet conditions, which are detailed in Appendix A. Rotor67 was selected for the simulations because it resembles the GE-nx engine fan: both are transonic axial compressors with comparable blade counts (22 vs. 18) and similar performance parameters, including total pressure ratios (1.631 vs. 1.622) and total temperature ratios (1.165 vs. 1.167). Based on a comparison of the simulated results under distorted and clean inlet conditions, the fan temperature ratio loss factor τf is defined to quantify the percentage loss in TRf at peak efficiency due to inlet distortion.
The distorted fan temperature ratio is estimated via the following formulation:
T R f = 1 τ f N L , ε T R f , clean
where TRf,clean is the fan total temperature ratio under clean inlet conditions. τf (NL, ε) represents the distortion-induced fractional loss in the fan temperature ratio. It is derived by first fitting the loss data from full-annulus CFD simulations under a reference distortion condition (denoted with subscript ref) as a function of the engine rotational speed NL. This reference loss is then scaled proportionally based on the actual average total pressure loss ε computed from the flow field. In addition, a dynamic distortion correction factor fd is applied to account for the unsteady nature of the inlet distortion encountered in real flight conditions. Thus, the reduction factor τf is given by:
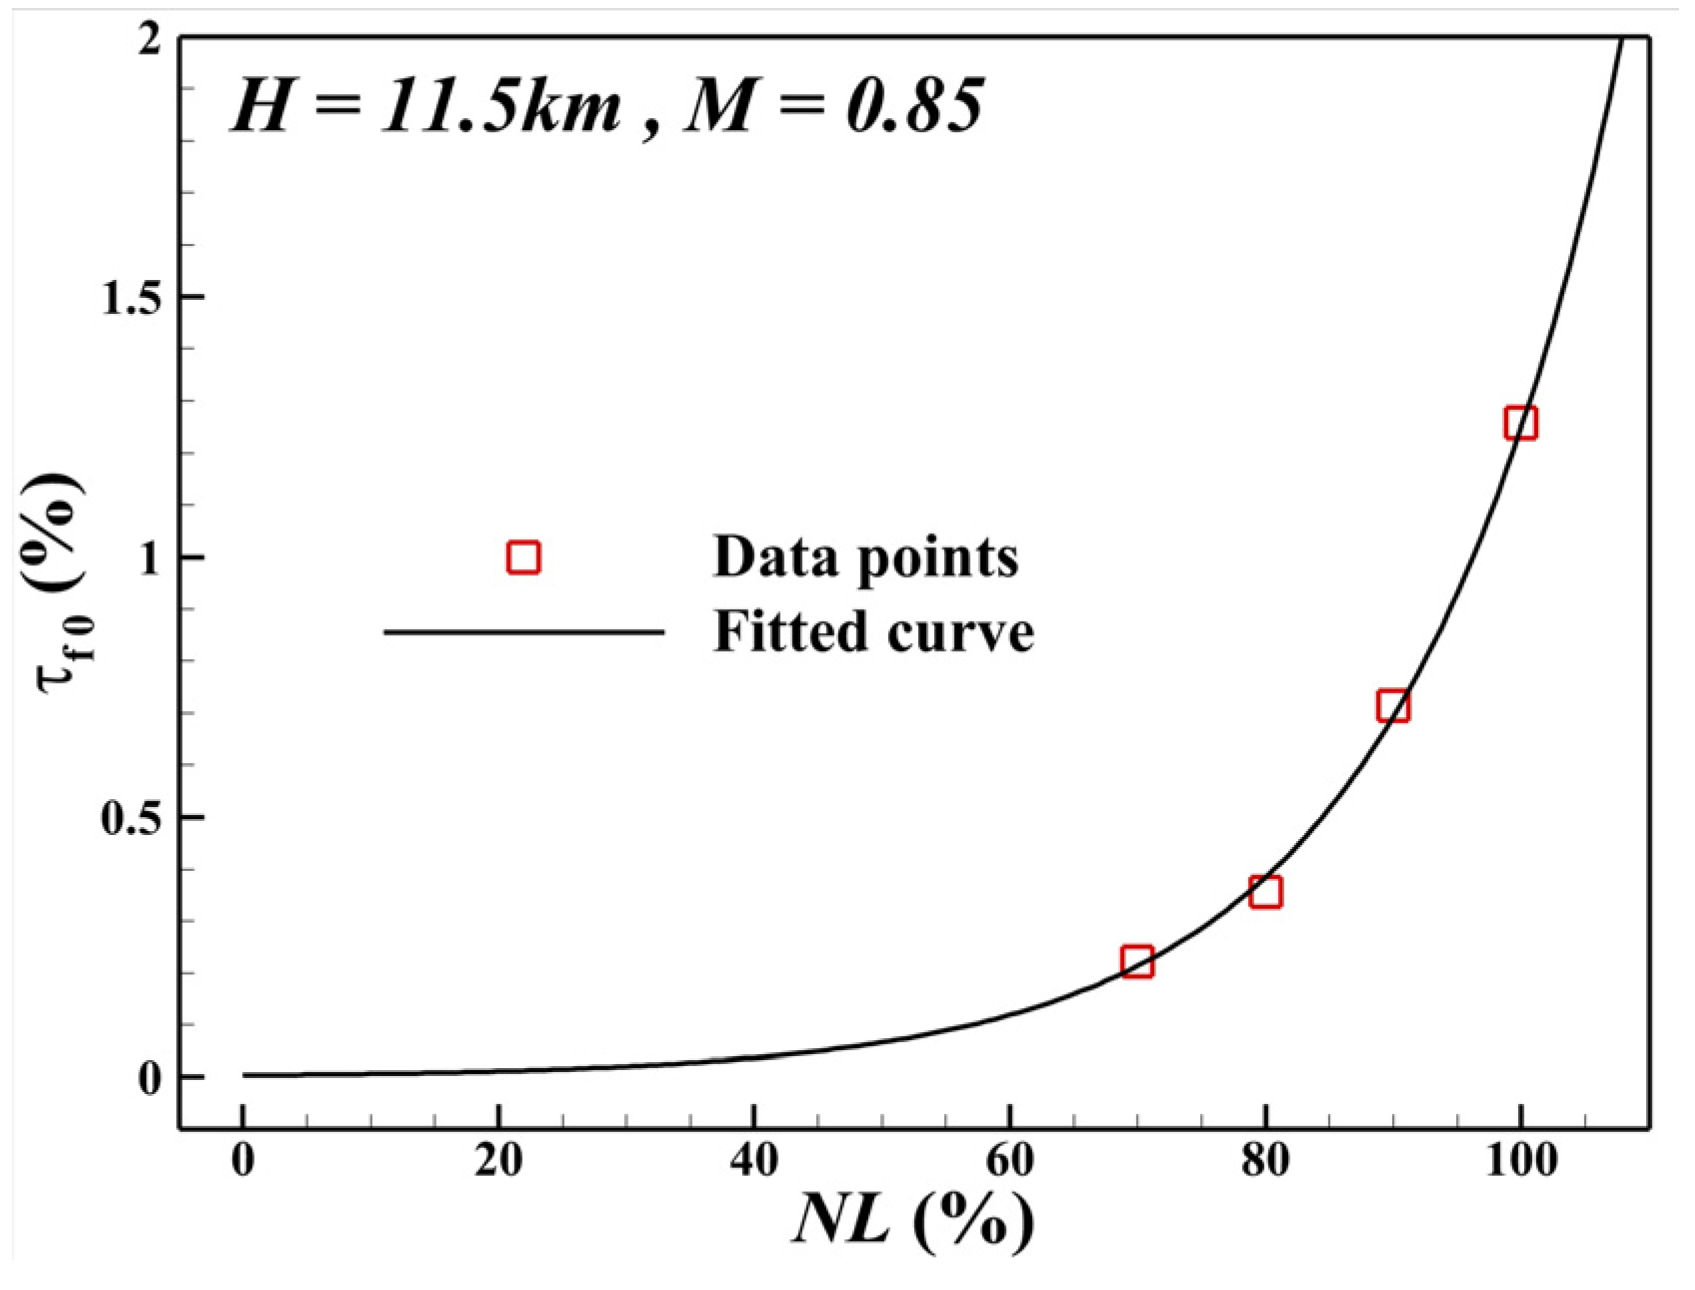
τ f N L , ε = f d ε ε ref 0.003459 × e 0.058904 N L %
where fd was set to 1.5, and NL was used in percentage form, as applied consistently in this study. The simulated results and parameter determination procedure are detailed in Appendix A.
To quantify the relationship between the average total pressure loss ε and the intake mass flow rate m ˙ fin , a quasi-one-dimensional model of the intake is adopted, in which m ˙ can be expressed as:
m ˙ = γ R p t T t A M 1 + γ 1 2 M 2 γ + 1 2 ( γ 1 )
where A is the cross-sectional area of the fan face; M, pt, and Tt are the Mach number, total pressure, and total temperature, respectively; and γ and R denote the isentropic exponent and the specific gas constant, respectively. By comparing the distorted and clean inlet conditions, the ratio of the corresponding intake mass flow rates can be written as:
m ˙ dis m ˙ clean = p t , dis p t , clean f ( M dis ) f ( M clean )
where the function f(M) is defined as:
f ( M ) = M 1 + γ 1 2 M 2 γ + 1 2 ( γ 1 )
According to the analysis of the distorted flow profile at the fan face under cruise conditions in Appendix A, at an altitude of H = 11,500 m and a freestream Mach number of 0.85, the ratio f ( M dis ) / f ( M clean ) is found to be close to unity. Therefore, its effect on the mass flow rate is negligible. As a result, the intake mass flow rate under distorted conditions can be approximated as follows:
m ˙ fin 1 ε m ˙ clean
For modern turbofan engines, the bypass stream dominates the thrust, and many BLI studies focus solely on the fan stream [28,33,34,35], effectively assuming an infinite bypass ratio. However, based on the intake distortion tests by Debogdan et al. [58], a bottom-located distortion pattern is inferred to cause a loss of the core temperature ratio (TRc) approximately 2–6% at NL = 77–90%. The core losses are attributed primarily to the total pressure distortion near the hub downstream of the low-pressure compressor. A similar hub-region distortion is observed downstream of the fan in this study (Figure A1e), indicating a comparable loss mechanism.
We apply a qualitative correction to account for the loss of TRc caused by the inlet distortion. This enables a more robust and conservative assessment of BLI benefits and improves the credibility of the overall performance gain, despite the fact that such a correction implies a noticeable thrust loss.
A reference core temperature ratio loss factor τc,ref of 4% is adopted based on the experimental trends, representing a midpoint within the observed range of 2–6% in the intake distortion tests [58]. This selection is supported by the following considerations: (1) the experimental fan speeds (77–90%) closely match those in this study (75–94%); (2) both distortion profiles are bottom-located and circumferential, though not identical; and (3) the simulated flow field suggests a similar core loss mechanism, as discussed earlier. Nevertheless, we acknowledge that this is a simplified approximation intended for a conceptual evaluation.
The reference loss factor τc,ref is scaled proportionally by the simulated average total pressure loss ε to obtain the distortion-induced core loss factor τc, which is defined as:
τ c ε = ε ε ref τ c , ref
and the corrected core temperature ratio under distorted inflow is then given by:
T R c = 1 τ c ε T R c , clean
Equations (30) and (31) are phenomenological corrections from limited experimental data. They likely overpredicts the core losses due to differences in both the distortion characteristics and the bypass ratio between the reference experiment and the present study. This correction mainly reflects a shift in the engine operating point, without fundamentally affecting the analysis of benefit sources or underlying mechanisms.

3. Geometric Model and Operating Conditions

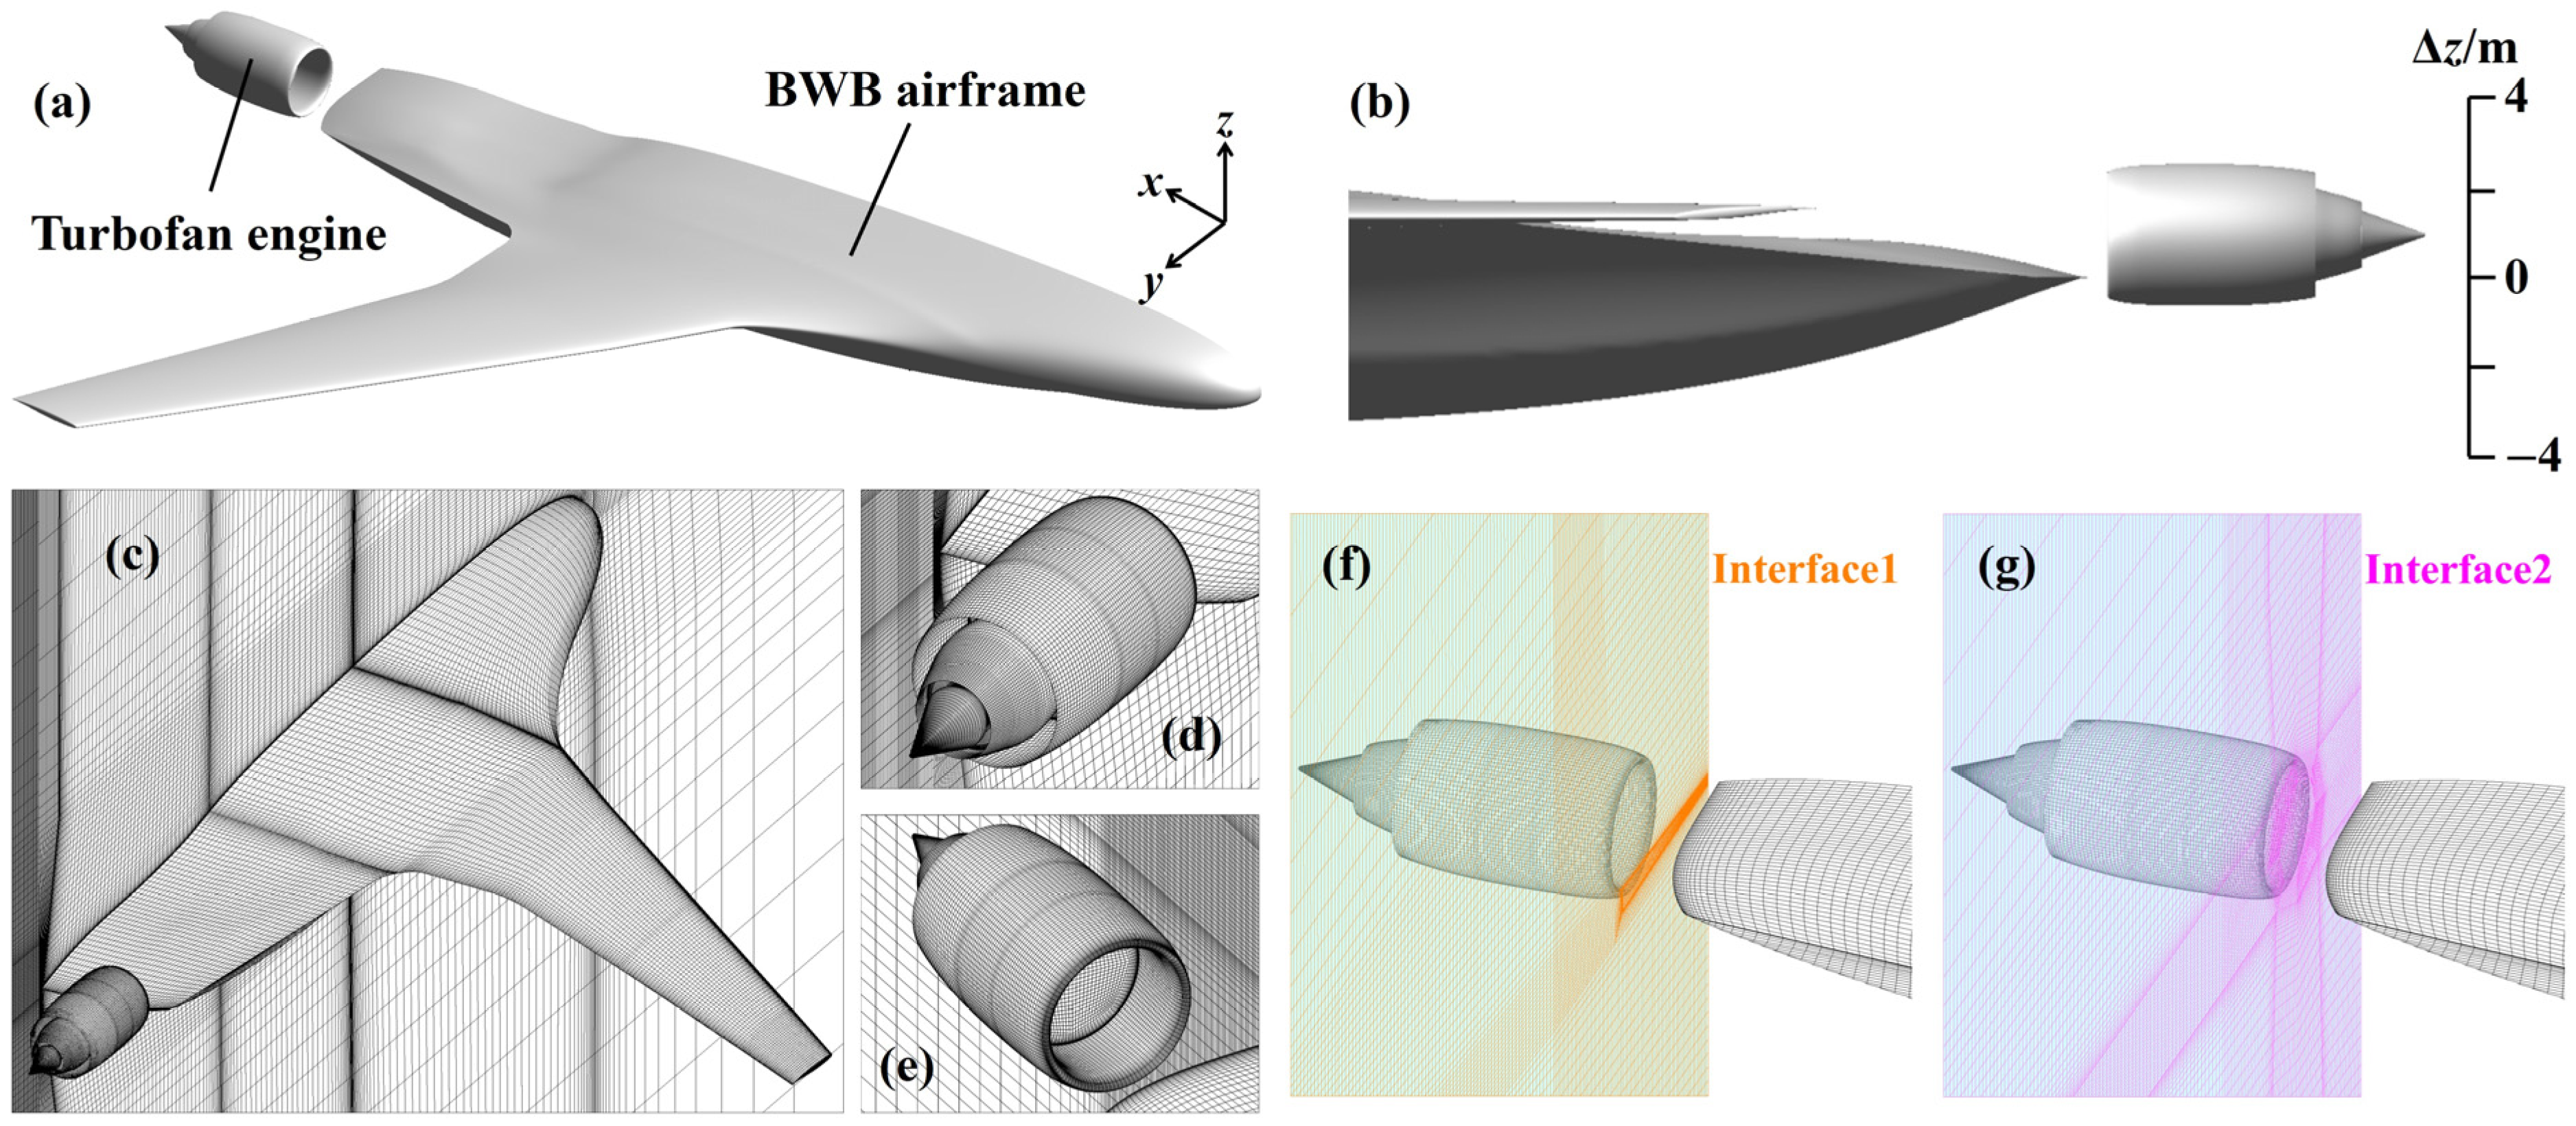
The geometric model consists of a BWB airframe and a separate turbofan engine, forming a non-integrated airframe–propulsion arrangement, as illustrated in Figure 7a. By varying the vertical offset between the airframe trailing edge and the engine axis (Δz in Figure 7b), the inlet condition continuously transitions from a clean to a BLI state, enabling the parametric evaluation of BLI effects. The configuration is designed with the following characteristics:
(a)
The total wetted area is kept constant throughout the transition, thereby avoiding the friction drag reduction typically associated with highly integrated BLI layouts. This approach allows partial separation of BLI benefits from PAI effects.
(b)
The engine position is varied continuously, facilitating not only a direct comparison between BLI and non-BLI conditions, but also an investigation of different levels of the ingested boundary layer.
The computational domain is divided into an airframe domain and an engine domain. Interface 1 and 2 define the downstream boundary of the airframe domain and the upstream boundary of the engine domain, respectively, as illustrated in subfigures (f,g) in Figure 7. Throughout all cases, the mesh of the airframe domain remains fixed, whereas the mesh of the engine domain is adjusted according to the engine position, ensuring consistent grid topology and local resolution.
All simulations are performed under cruise conditions: a flight altitude of 11,500 m, Mach number of 0.85, angle of attack of 1.3°, and engine rotational speed NL ranging from 70% to 95%.

4. Results

4.1. Overview of Airframe–Engine Flow Interaction

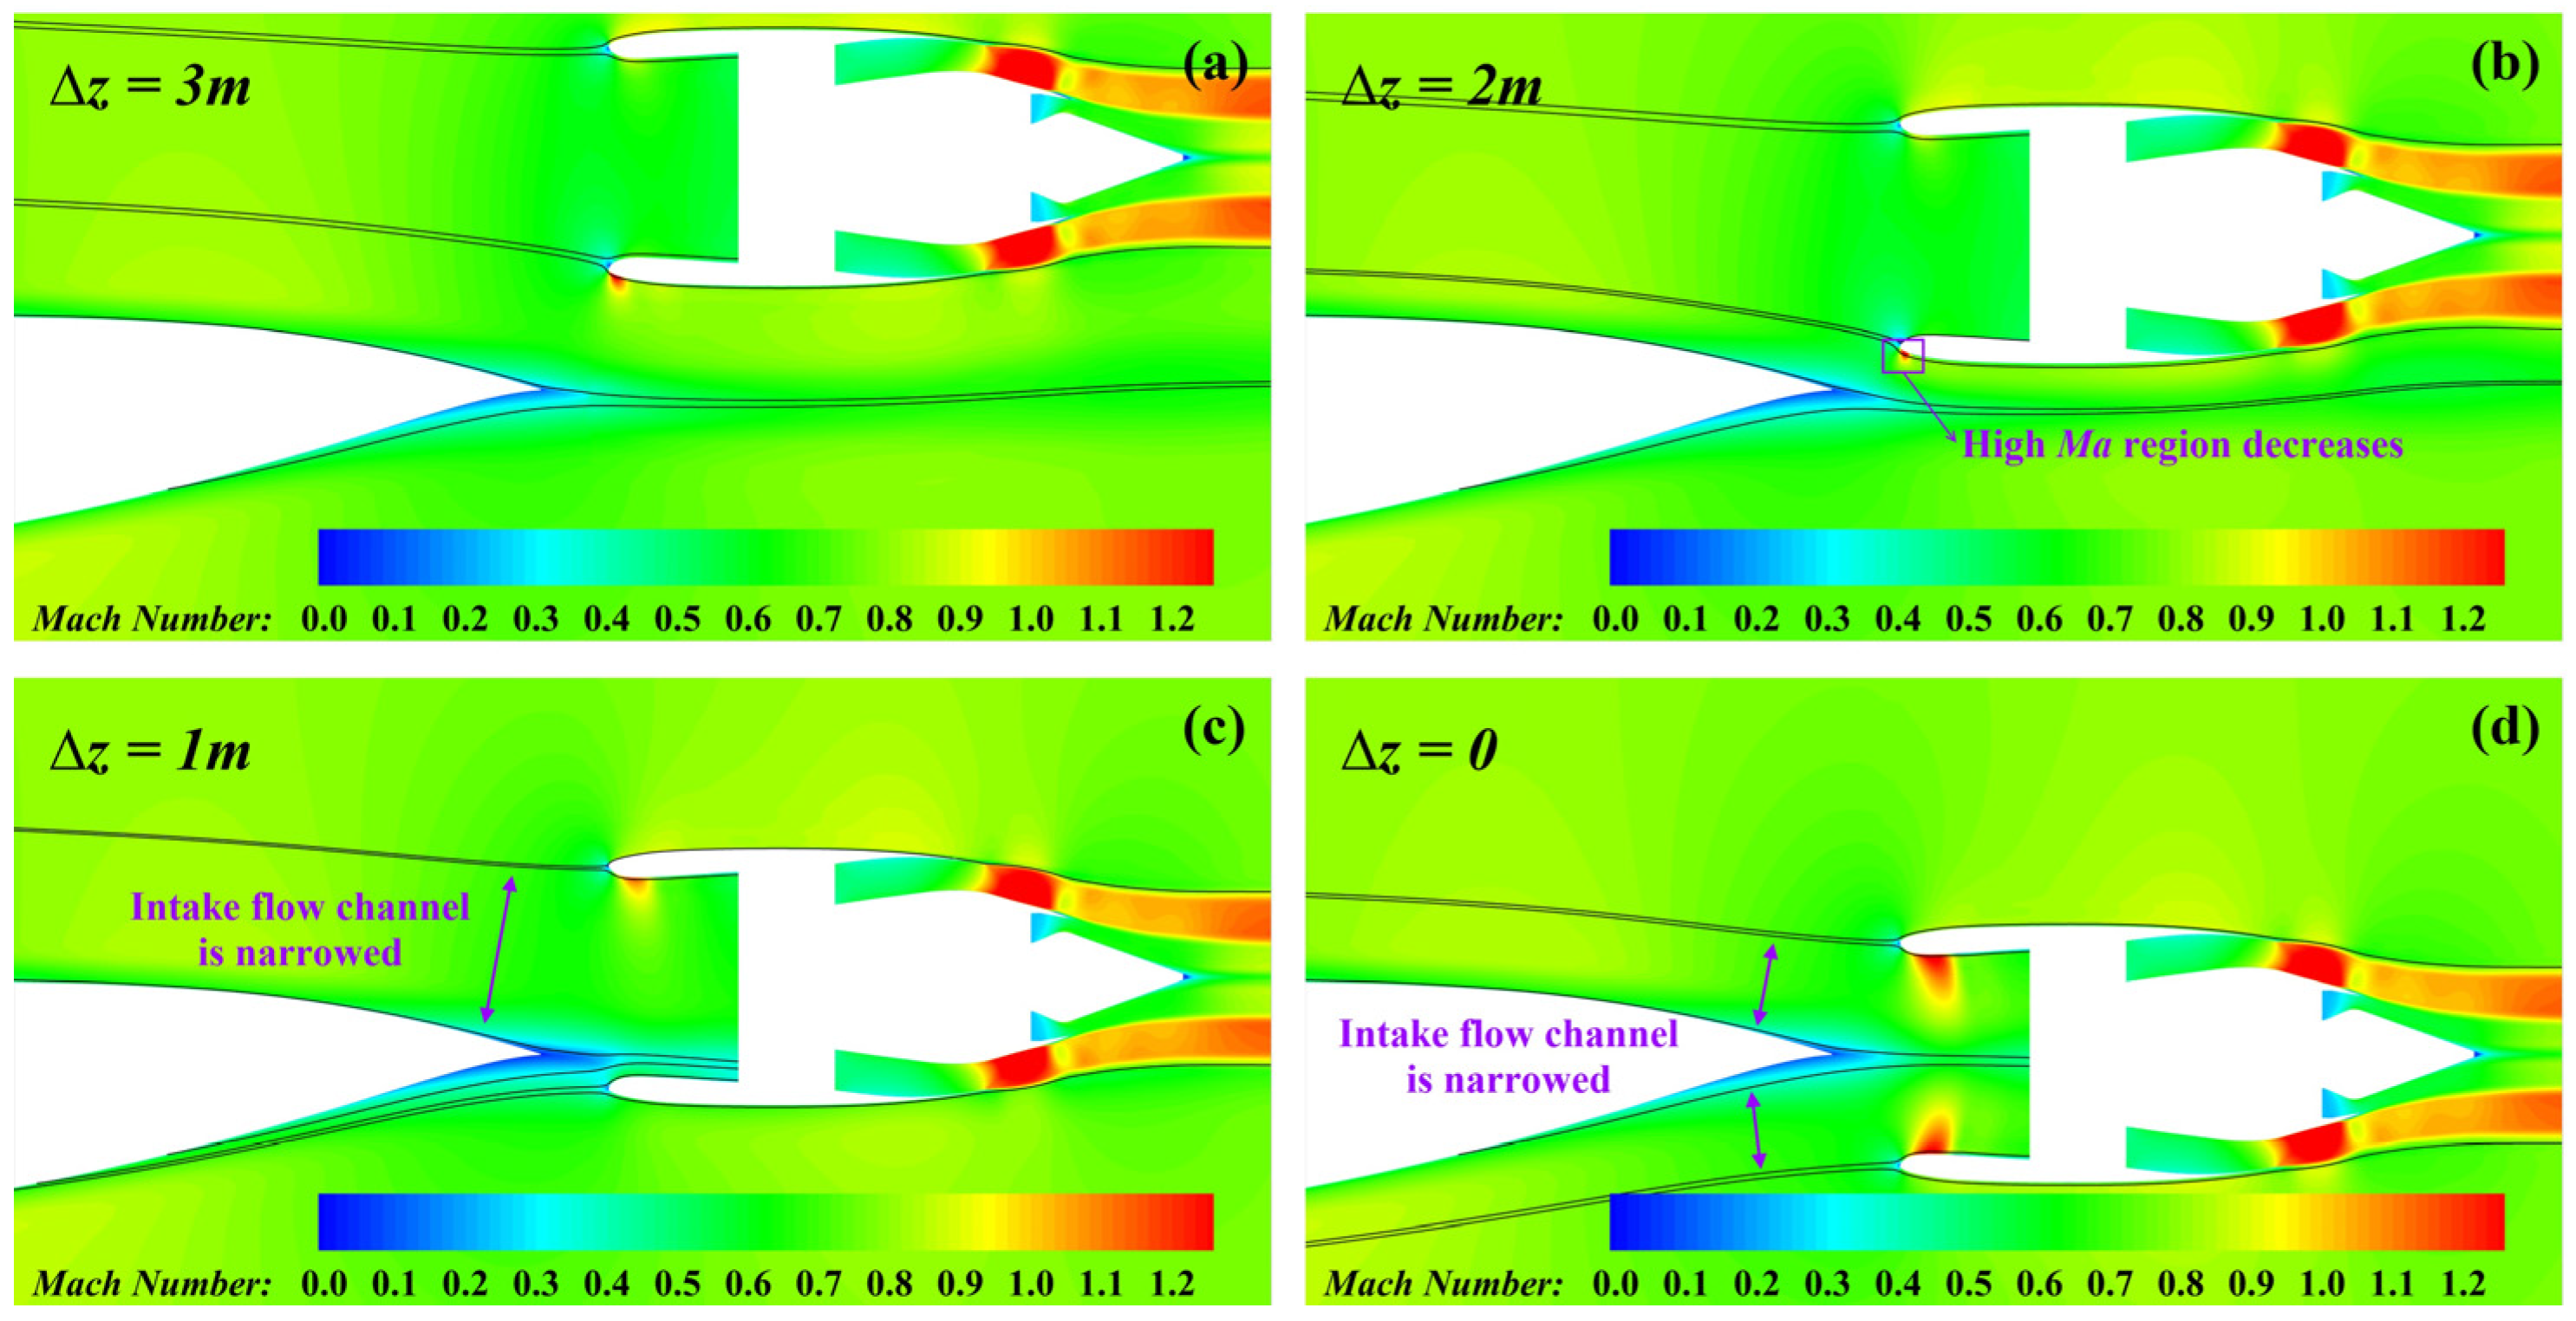
Figure 8 presents the Mach number contours on the engine symmetry plane for different vertical positions. At Δz = 0 and 1 m, the engine ingests the airframe wake, corresponding to BLI conditions. At Δz ≥ 2 m, the engine operates outside the airframe wake, representing non-BLI conditions. Although the distortion pattern at Δz = 0 differs from the canonical BLI profile studied in Appendix A, the same boundary condition determination method is applied for consistency. As the engine moves downwards, the high Mach region on the lower surface of the nacelle cowl diminishes because of the decelerating influence of the airframe wake. Under BLI conditions, flow acceleration within the inlet is observed, caused by the narrowing of the intake flow channel. The airframe’s presence within the capture streamtube deforms its shape and moves the stagnation point outwards toward the downstream surface of the nacelle cowl.

4.2. Momentum-Based Analysis

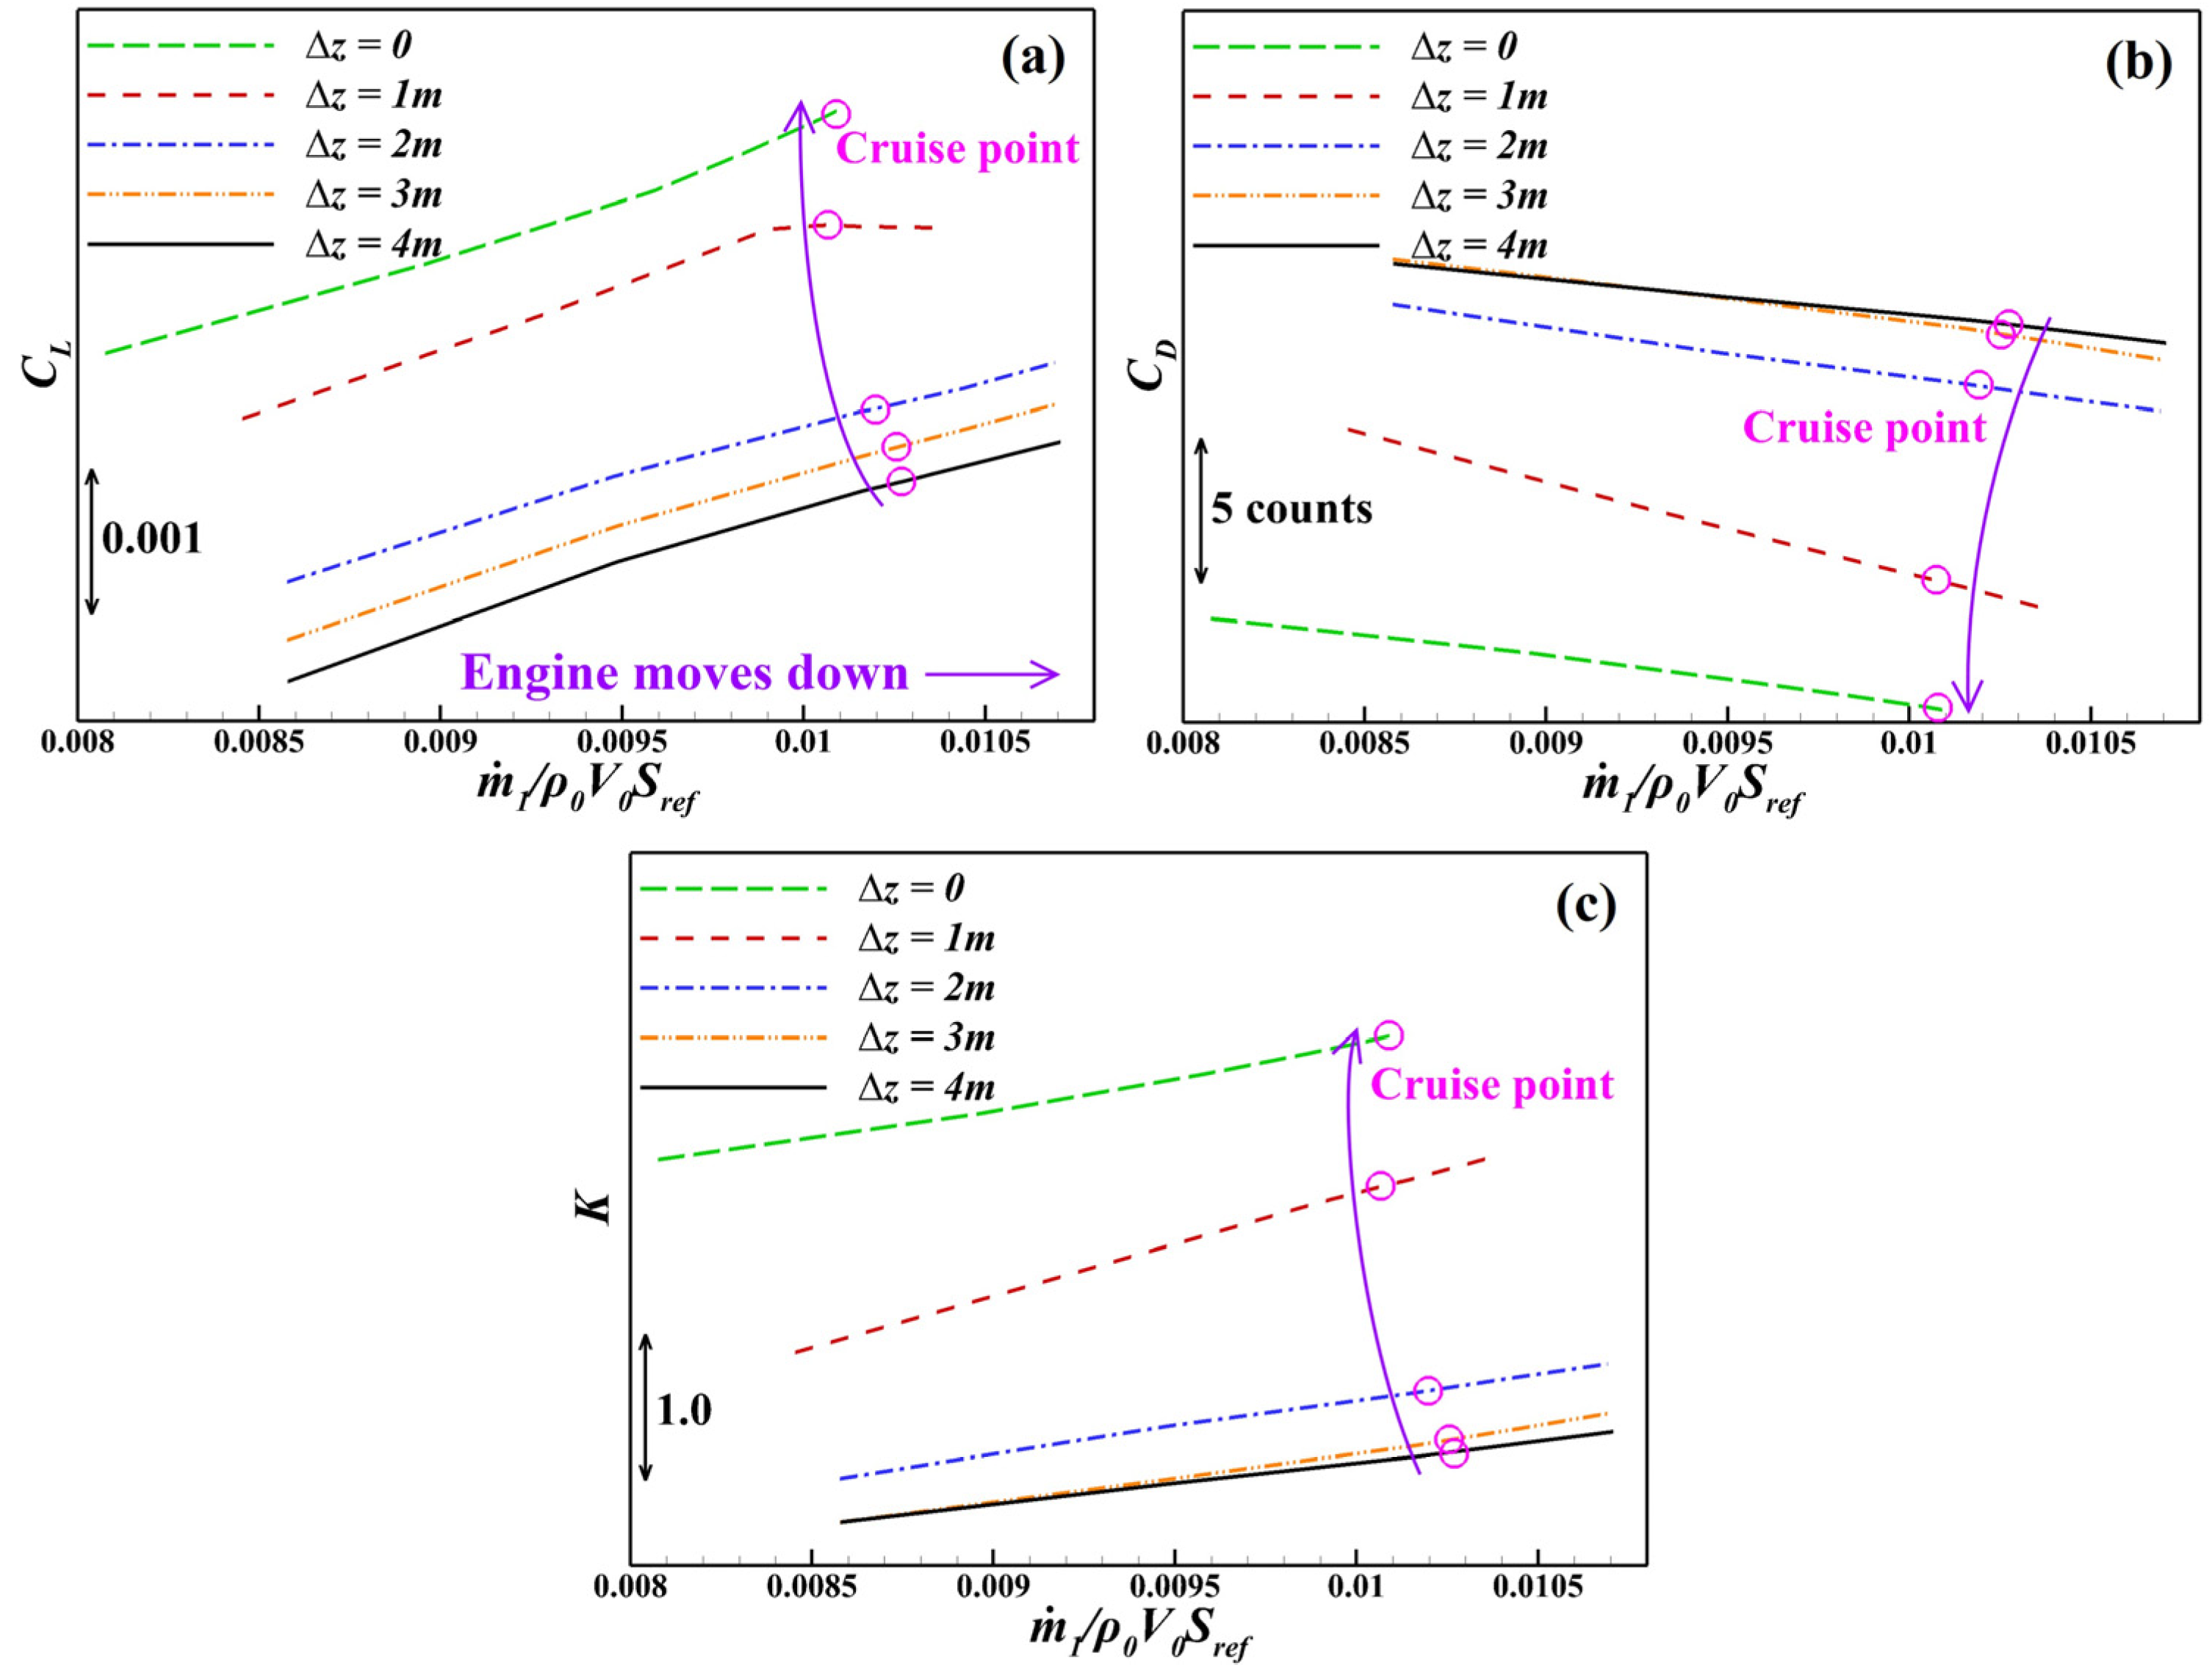
Figure 9 illustrates the variations in lift, drag, and the lift-to-drag ratio as the engine is vertically repositioned. The horizontal axis denotes the dimensionless mass flow rate, with the cruise point (where the axial force coefficient CX = 0) marked. The arrows indicate downward engine movement. The lift coefficient CL shows a minor sensitivity to the engine position or rotational speed, varying by less than 0.0025 during cruising. This is negligible compared with the BWB’s typical cruise CL of 0.2–0.3. In contrast, the drag coefficient CD decreases significantly with downward engine movement. Under the BLI condition, the drag coefficient decreases by 9.0–13.5 counts (1 count = 0.0001), leading to an increase in the lift-to-drag ratio K by 1.7–2.6.
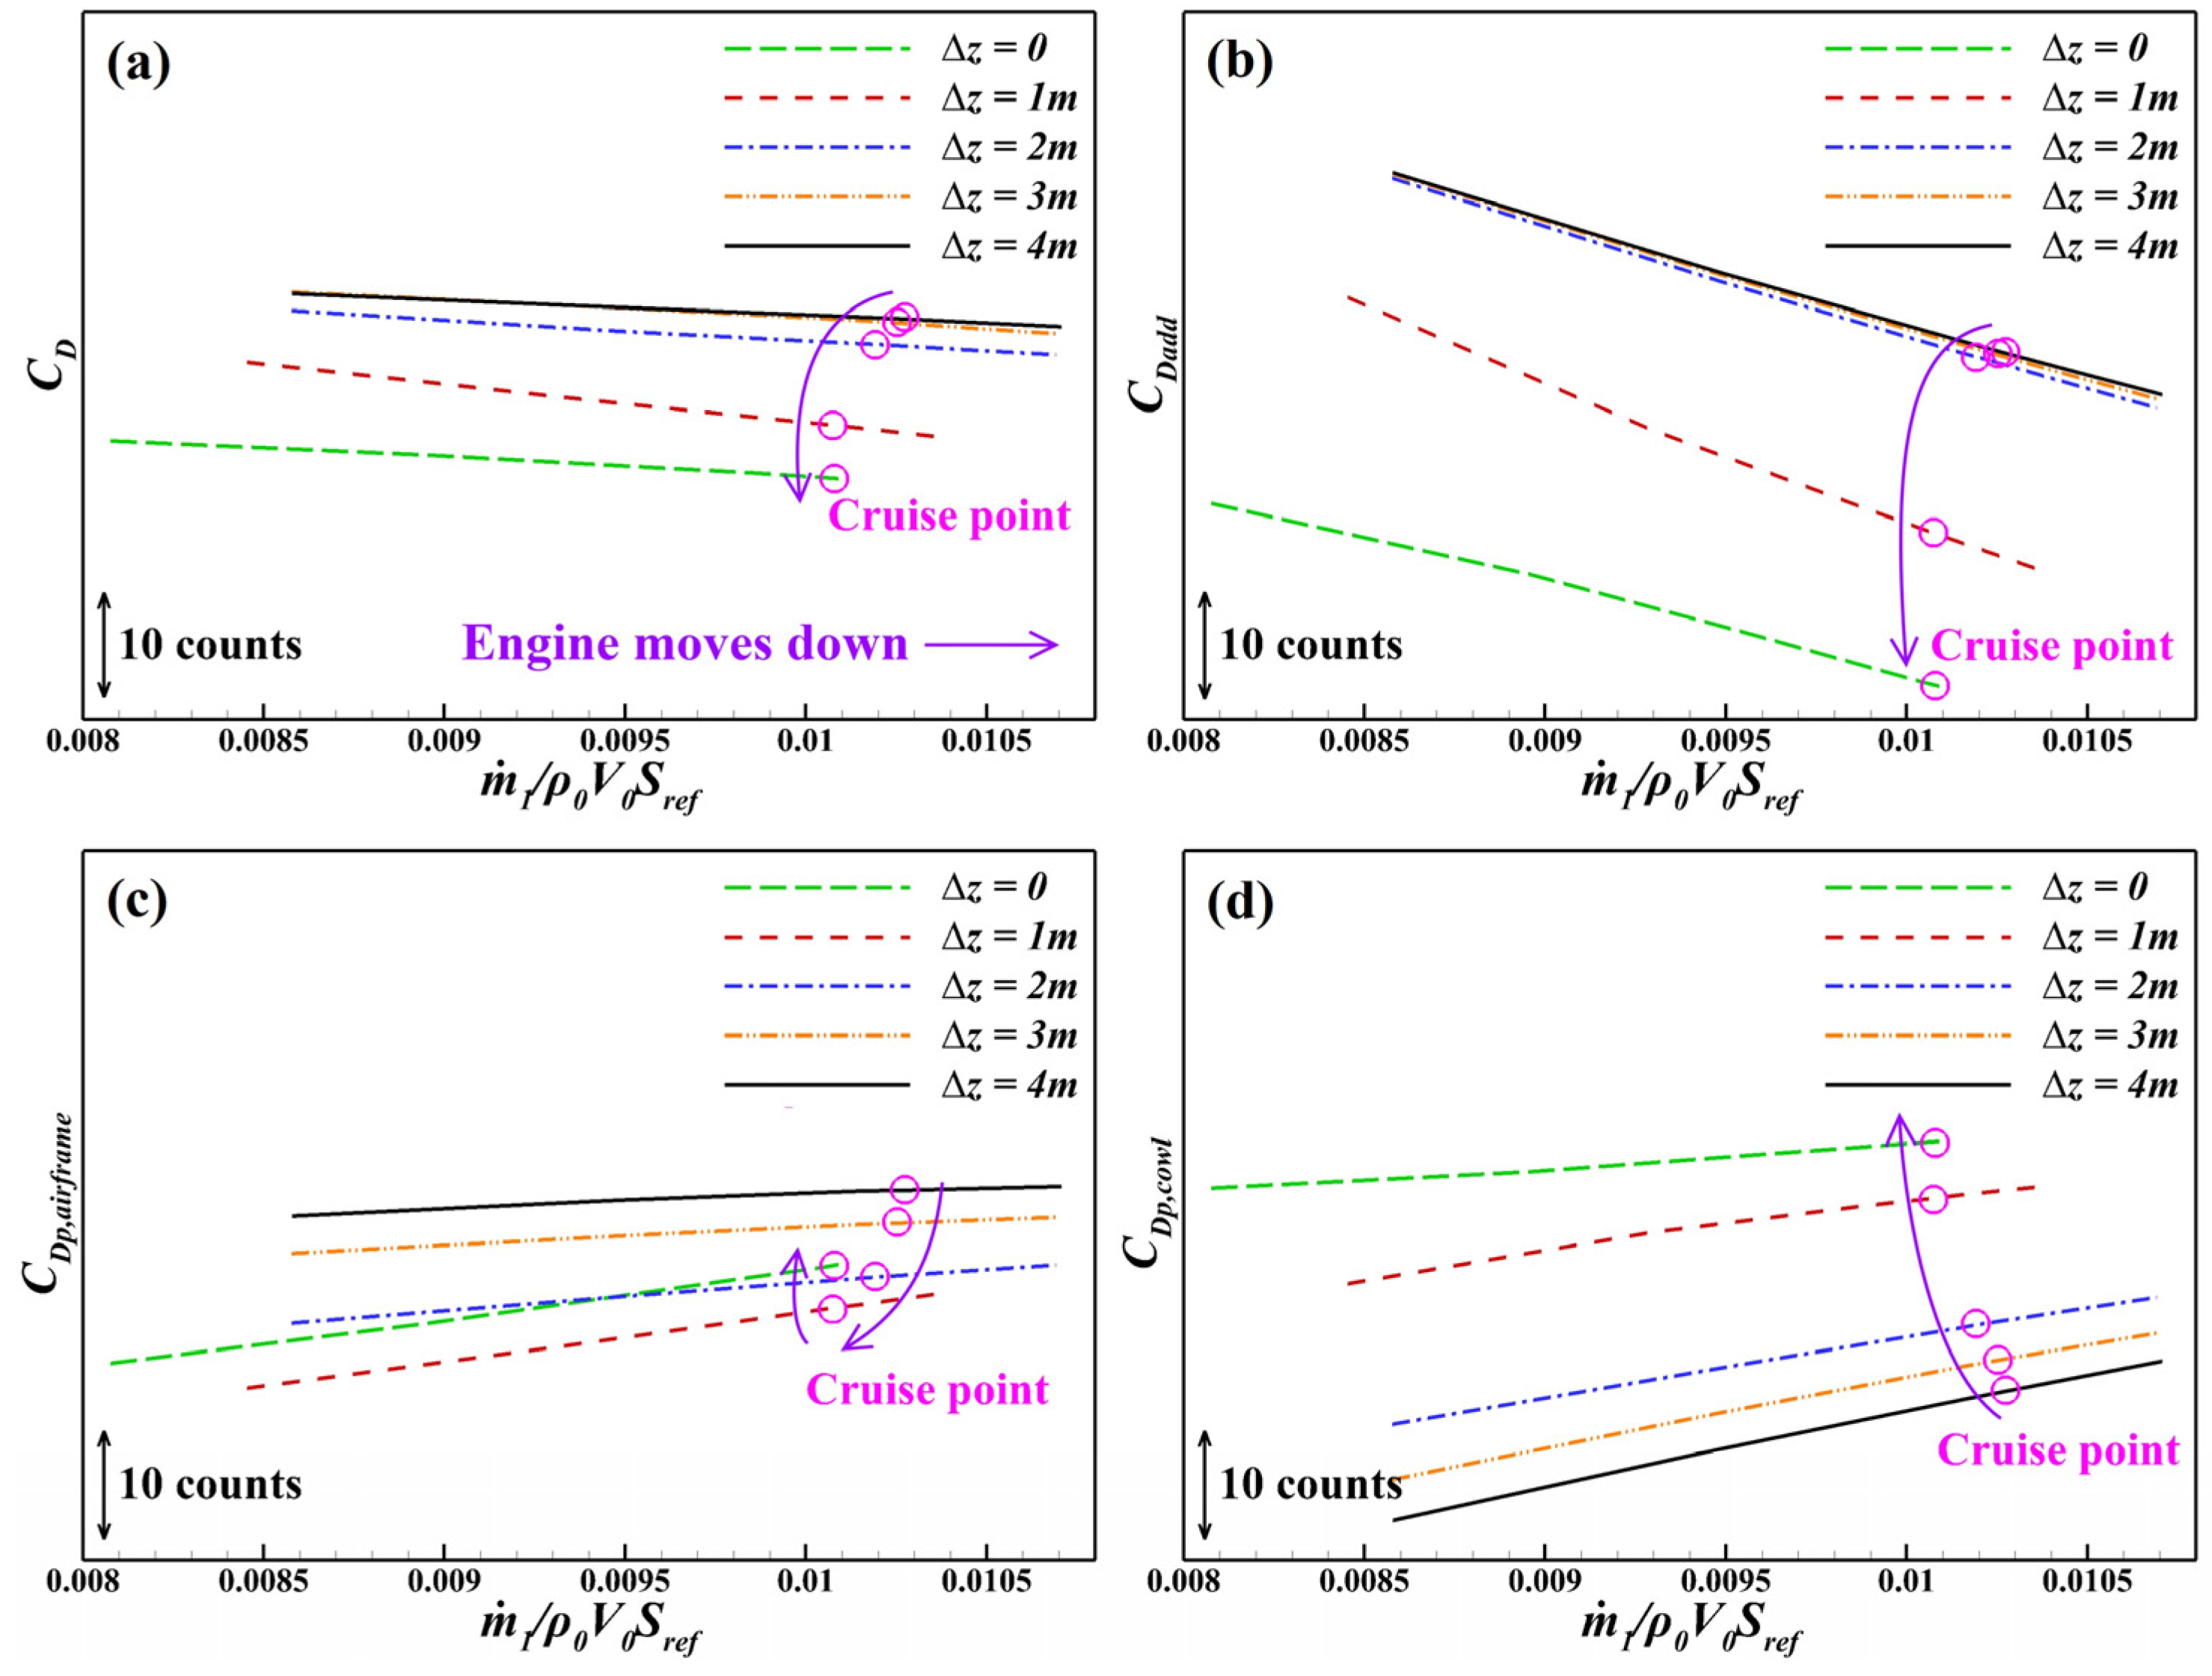
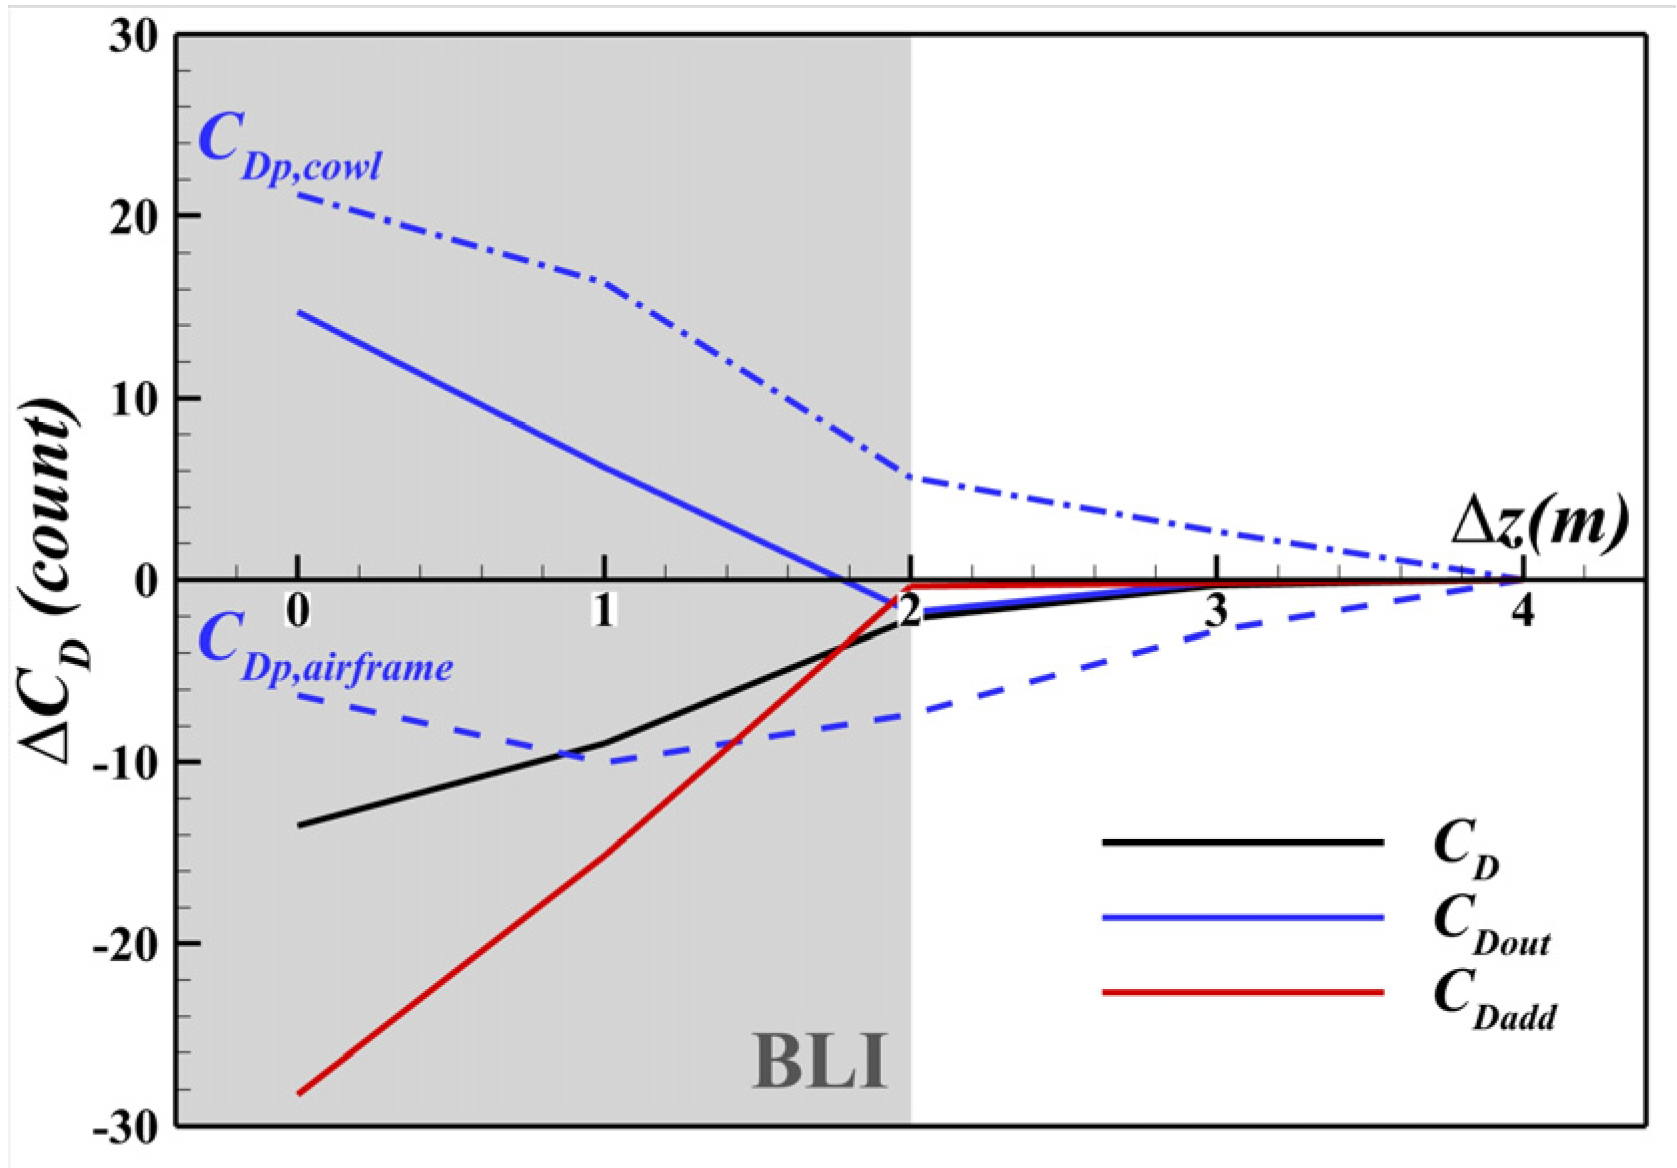
Figure 10 shows the variation in drag components with engine position and rotational speed. As friction drag remains nearly constant due to the fixed wetted area, only the pressure drag components are analysed. During cruising, as the engine moves downwards, the additional drag coefficient CDadd decreases significantly (by up to 28 counts), indicating strong sensitivity to BLI. The airframe pressure drag coefficient CDp,airframe first decreases and then increases slightly, with a maximum reduction of 10 counts, suggesting a weaker BLI influence. In contrast, the cowl pressure drag coefficient CDp,cowl increases approximately linearly with engine descent under non-BLI conditions but exhibits a steeper growth rate in the BLI state. This suggests that, beyond the effects of BLI itself, the relative positioning between the airframe and engine further influences the cowl pressure drag.
Figure 11 shows the changes in each drag component relative to the Δz = 4 m reference condition during cruise. The blue dashed and dotted lines represent the airframe and cowl pressure drag deviations, respectively; their sum (solid blue line) gives the external drag variation. The solid red line denotes the additional drag, and the solid black line represents the total drag. The white and grey areas correspond to non-BLI and BLI states, respectively. In the non-BLI state, the external drag remains nearly constant as decreases in airframe drag offset increases in cowl drag. Additional drag also varies little, resulting in nearly unchanged total drag. In the BLI state, the external drag increases significantly as the engine moves downwards, but this is outweighed by the larger reduction in additional drag, leading to an overall decrease in total drag. Therefore, the reduction in additional drag is the dominant contributor to the drag benefit of BLI configurations.
To elucidate the mechanism underlying the additional drag reduction, the additional drag expression in Equation (9) is reformulated as:
D add = 1 2 ρ 0 V 0 2 A 1 C p + m ˙ 1 V 1 x 0 V 0 Δ V
Equation (32) indicates that Dadd primarily depends on the pressure coefficient Cp, intake mass flow rate m ˙ 1 , and velocity deficit ΔV. Its local contribution can be represented as:
D add A = 1 2 ρ 0 V 0 2 C p + ρ V V V 0
where D add / A denotes the contribution of any position in Section 1 to the additional drag. The first term corresponds to the static pressure component, and the second term corresponds to the momentum deficit, both of which increase with Cp and V. This structure is analogous to that of total pressure, which at any point in the inlet plane can be approximated by:
p t = 1 2 ρ 0 V 0 2 C p + p 0 1 + γ 1 2 γ R T V 2 γ γ 1
Although Equations (33) and (34) differ in form—with the former representing a linear combination of static pressure and momentum deficit terms, and the latter representing a product of a pressure-based term and a velocity-dependent exponential term—they both reveal a joint and positive dependence on Cp and V when temperature variation is negligible. This structural resemblance implies an internal link between local total pressure and the additional drag contribution, though such an analogy remains qualitative. Figure 12 shows the distributions of D add / A and total pressure pt along the intersection line between the engine symmetry plane and Section 1. The two quantities exhibit similar deficit regions, which to some extent reflects their underlying connection.
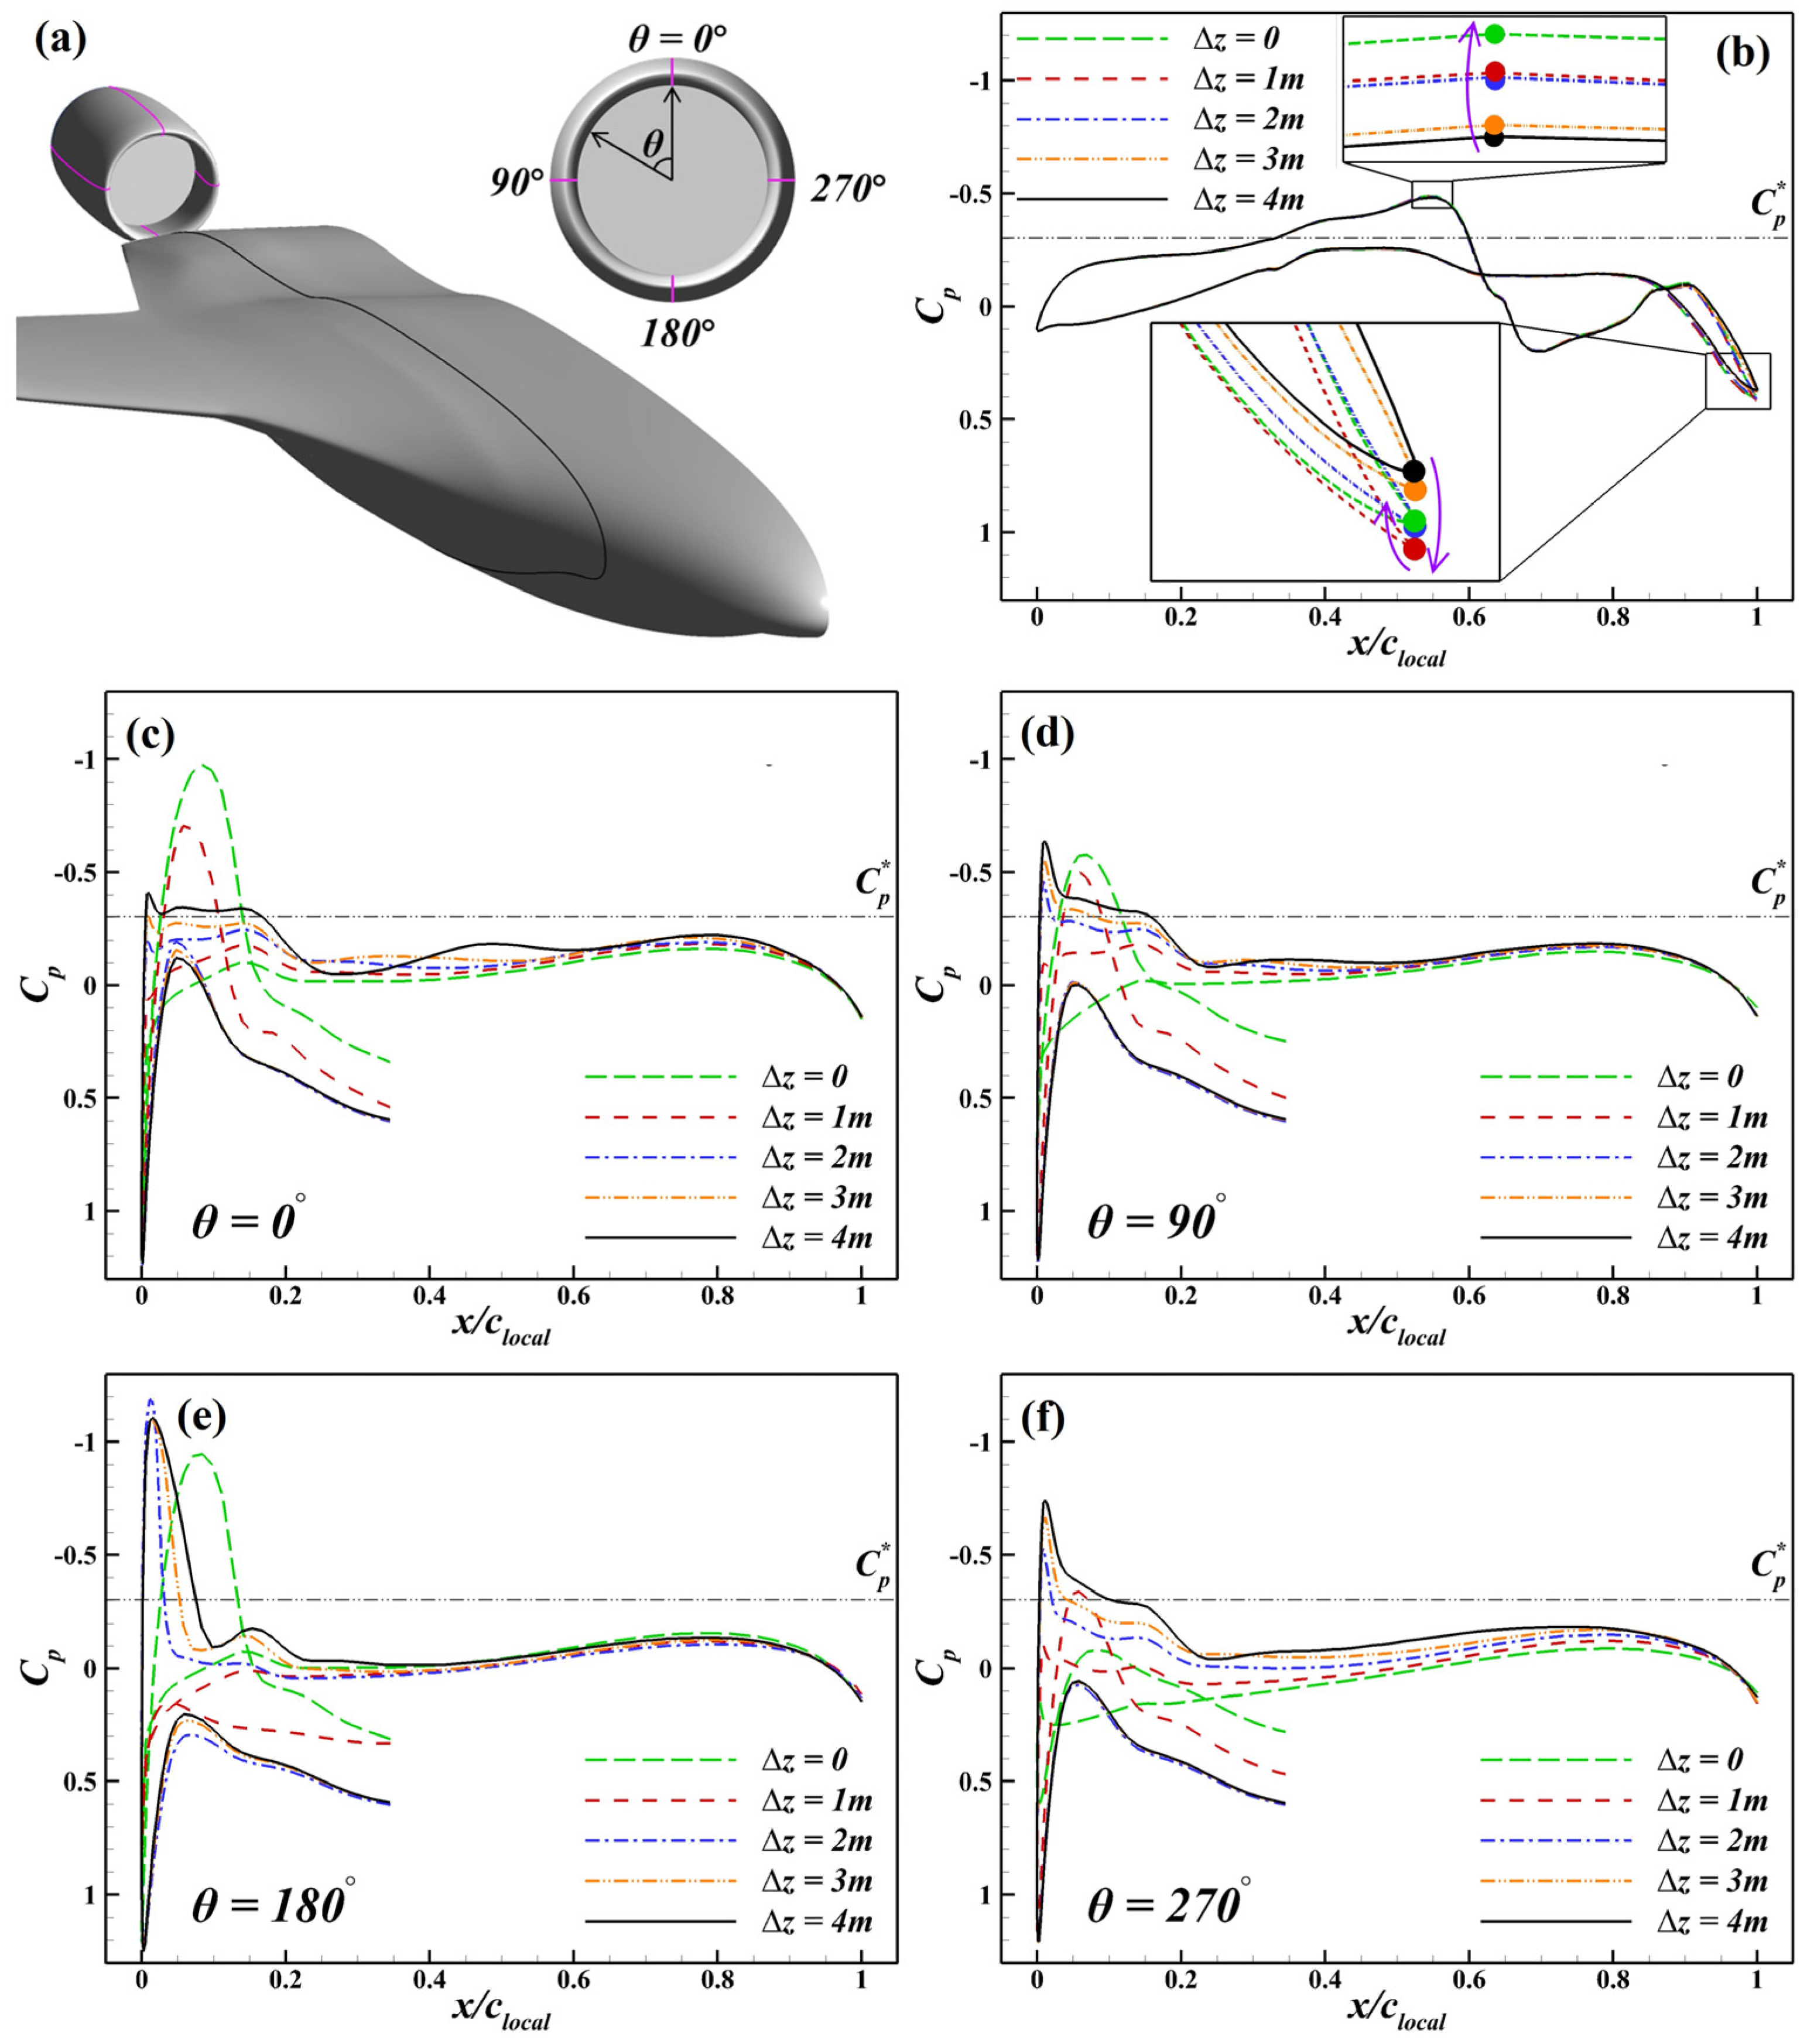
The reduction in additional drag is attributed primarily to the BLI effect, whereas the increase in external drag—particularly cowl pressure drag—is induced by changes in flow features associated with the propulsion–airframe integration (PAI) effect. Figure 13 presents the pressure distributions on the airframe airfoil upstream of the engine and on the cowl at different positions under cruise conditions.
As the engine moves downwards, the airframe pressure distribution remains nearly unchanged except near the trailing edge, where Cp first increases (Δz = 4 m to 1 m) and then slightly decreases (Δz = 1 m to 0). This trend aligns with the variation in airframe pressure drag shown in Figure 10c, indicating that the trailing-edge Cp dominates the change. The observed increase–then–decrease pattern of trailing-edge pressure is attributed to the movement of the cowl lower lip stagnation point, which first approaches and then recedes from the airframe; at Δz = 1 m, the stagnation region is closest to the trailing edge, generating a local high-pressure zone that “pushes” the aft body, thereby minimizing the pressure drag and maximizing the trailing-edge Cp. A slight intensification of the shock wave on the upper surface is also observed, caused by local acceleration due to a narrower capture streamtube.
For the cowl, as the engine descends, the leading-edge pressure increases, and the shock wave weakens. This results from the outward shift in the stagnation point. Meanwhile, the chordwise pressure gradient transitions from “low-front–high-aft” to “high-front–low-aft,” which dominates the variation in cowl drag. In the inlet, pressure profiles remain consistent under non-BLI state, but decrease significantly under BLI, with shock wave formation observed—primarily due to the stagnation point movement and the inlet flow acceleration.
In summary, as the engine moves downwards, the BLI effect significantly reduces the additional drag, whereas the PAI effect contributes to an increase in the external drag. For the configuration studied in this work, the drag reduction due to BLI outweighs the drag penalty from the PAI, resulting in a net decrease in total drag and an improvement in the lift-to-drag ratio. This outcome highlights the competing influence of BLI and PAI, underscoring the importance of managing their trade-off. In the design of BLI layouts, special attention should be paid to the potential adverse effects of PAI.

4.3. Energy-Based Analysis

4.3.1. Engine Mechanical Power and PSC Benefit

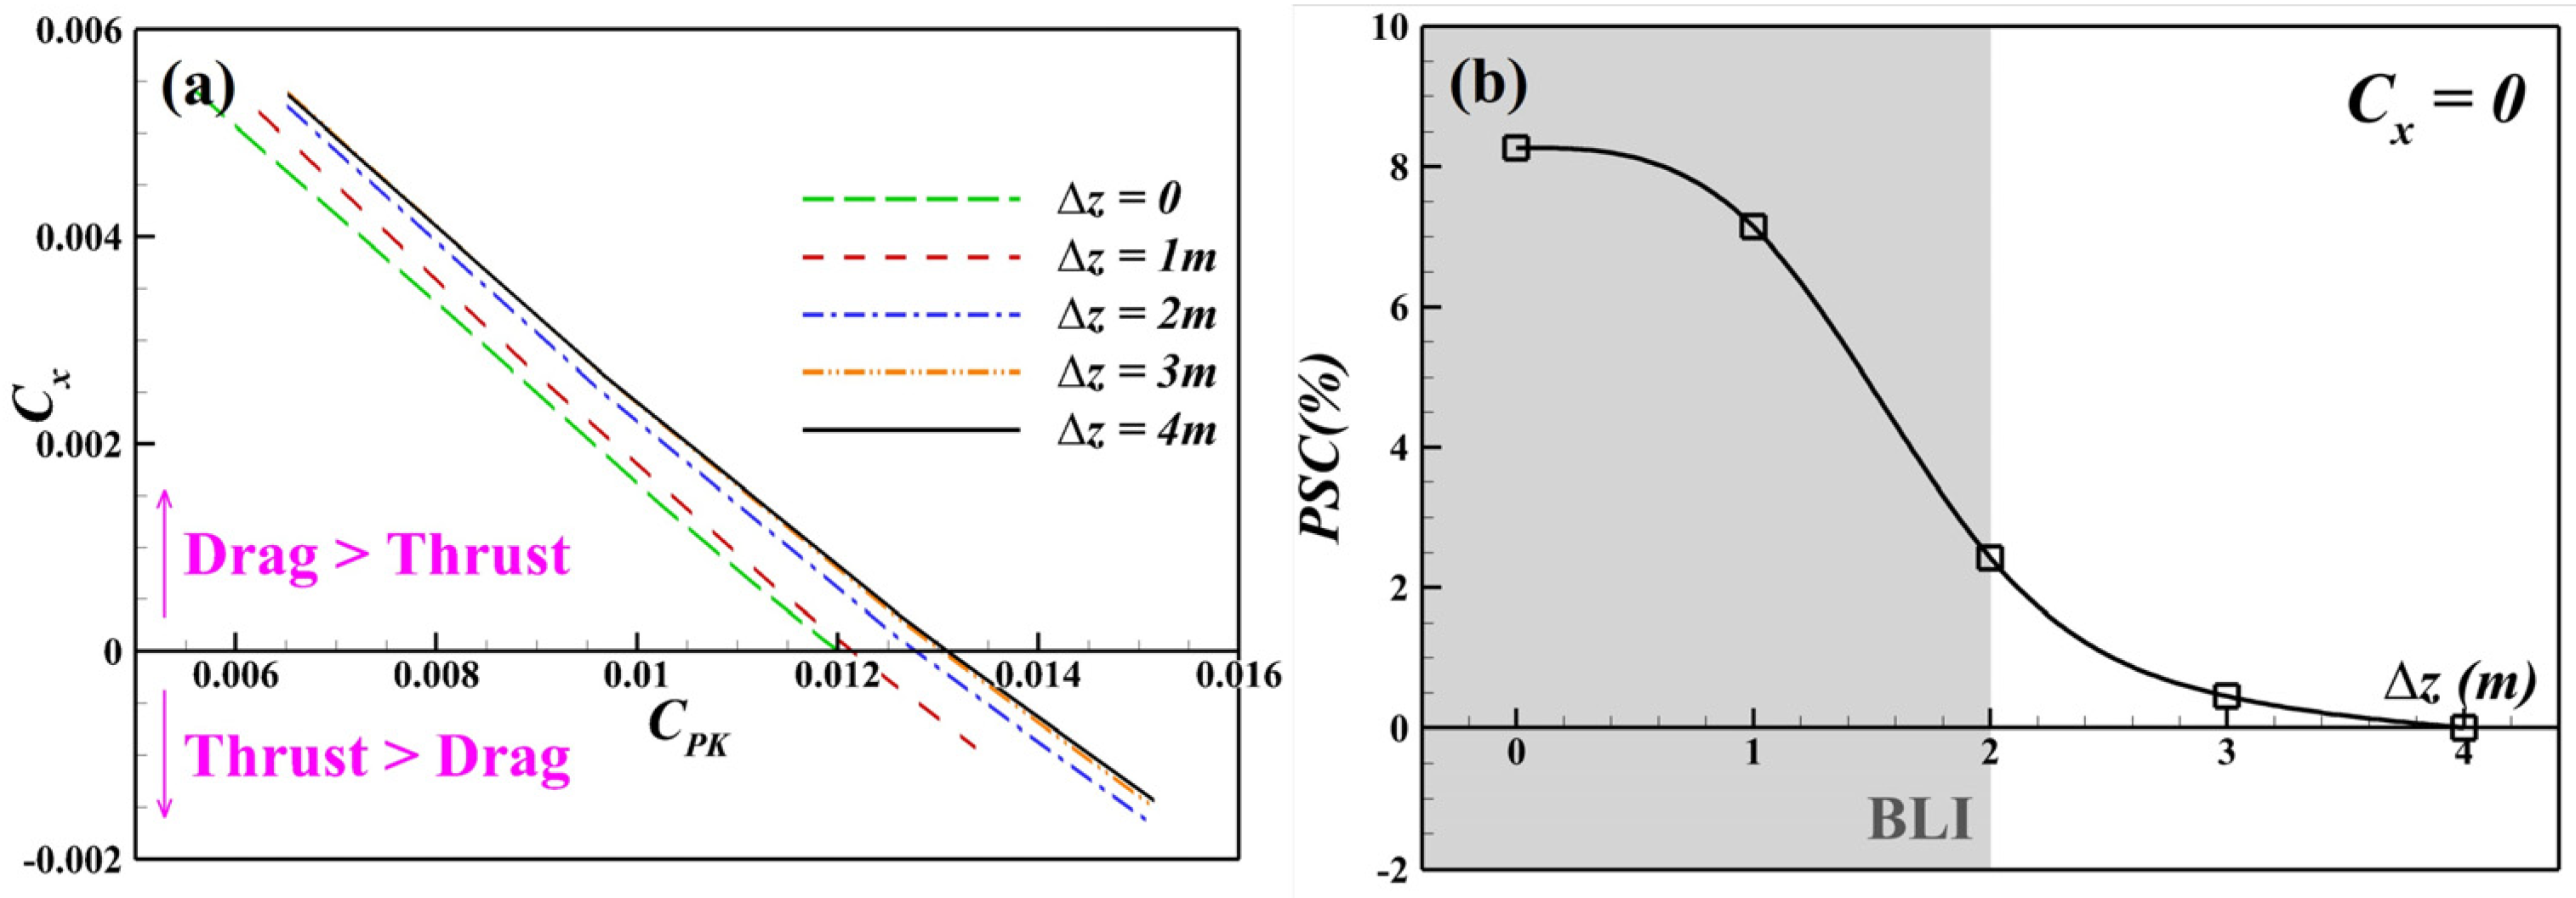
Figure 14a shows the relationship between the axial force coefficient CX and the engine mechanical power coefficient CPK, which is defined as:
C P K = P K 1 2 ρ 0 V 0 3 S ref
and all energy-related coefficients are nondimensionalized in this form.
As CPK increases, CX tends to decrease approximately linearly. As the engine moves down, the mechanical power required to produce the same axial force decreases, indicating a decrease in fuel consumption to maintain a particular flight condition. Figure 14b shows the power saving coefficient PSC during cruising, which is calculated on the basis of the Δz = 4 m configuration. In the non-BLI stage, the PSC reaches 2.42%, reflecting the favourable influence of the PAI effect. After entering the BLI stage, the PSC increases significantly to 7.14–8.27%, demonstrating the combined impact of the BLI and PAI effects on fuel economy.

4.3.2. Boundary Layer Dissipation

Figure 15 shows the relationship between the boundary layer dissipation coefficients and CX for the airframe and cowl. The airframe dissipation coefficient CΦsurf,airframe remains nearly constant with respect to the axial force coefficient CX, indicating minimal sensitivity to the engine operating state. During cruising, the engine’s downward movement leads to a slight reduction in airframe boundary layer dissipation, with values approximately 0.00525. The maximum decrease occurs at Δz = 2 m, reaching approximately 0.000123 (2.3% of the mean value), indicating a minor but favourable effect of the PAI on airframe boundary layer dissipation as the engine approaches the airframe.
In contrast, the cowl dissipation coefficient CΦsurf,cowl shows a more distinct trend. It decreases with increasing engine rotational speed in the non-BLI stage, but remains nearly unchanged in the BLI stage. As the engine moves downwards, CΦsurf,cowl in cruise decreases further, with a sharper reduction observed after entering the BLI stage, indicating the combined effects of PAI and BLI. Due to the smaller wetted area, CΦsurf,cowl is approximately an order of magnitude lower than CΦsurf,airframe. The values of CΦsurf,cowl are concentrated at approximately 0.00026 in the non-BLI stage and 0.00020 in the BLI stage.
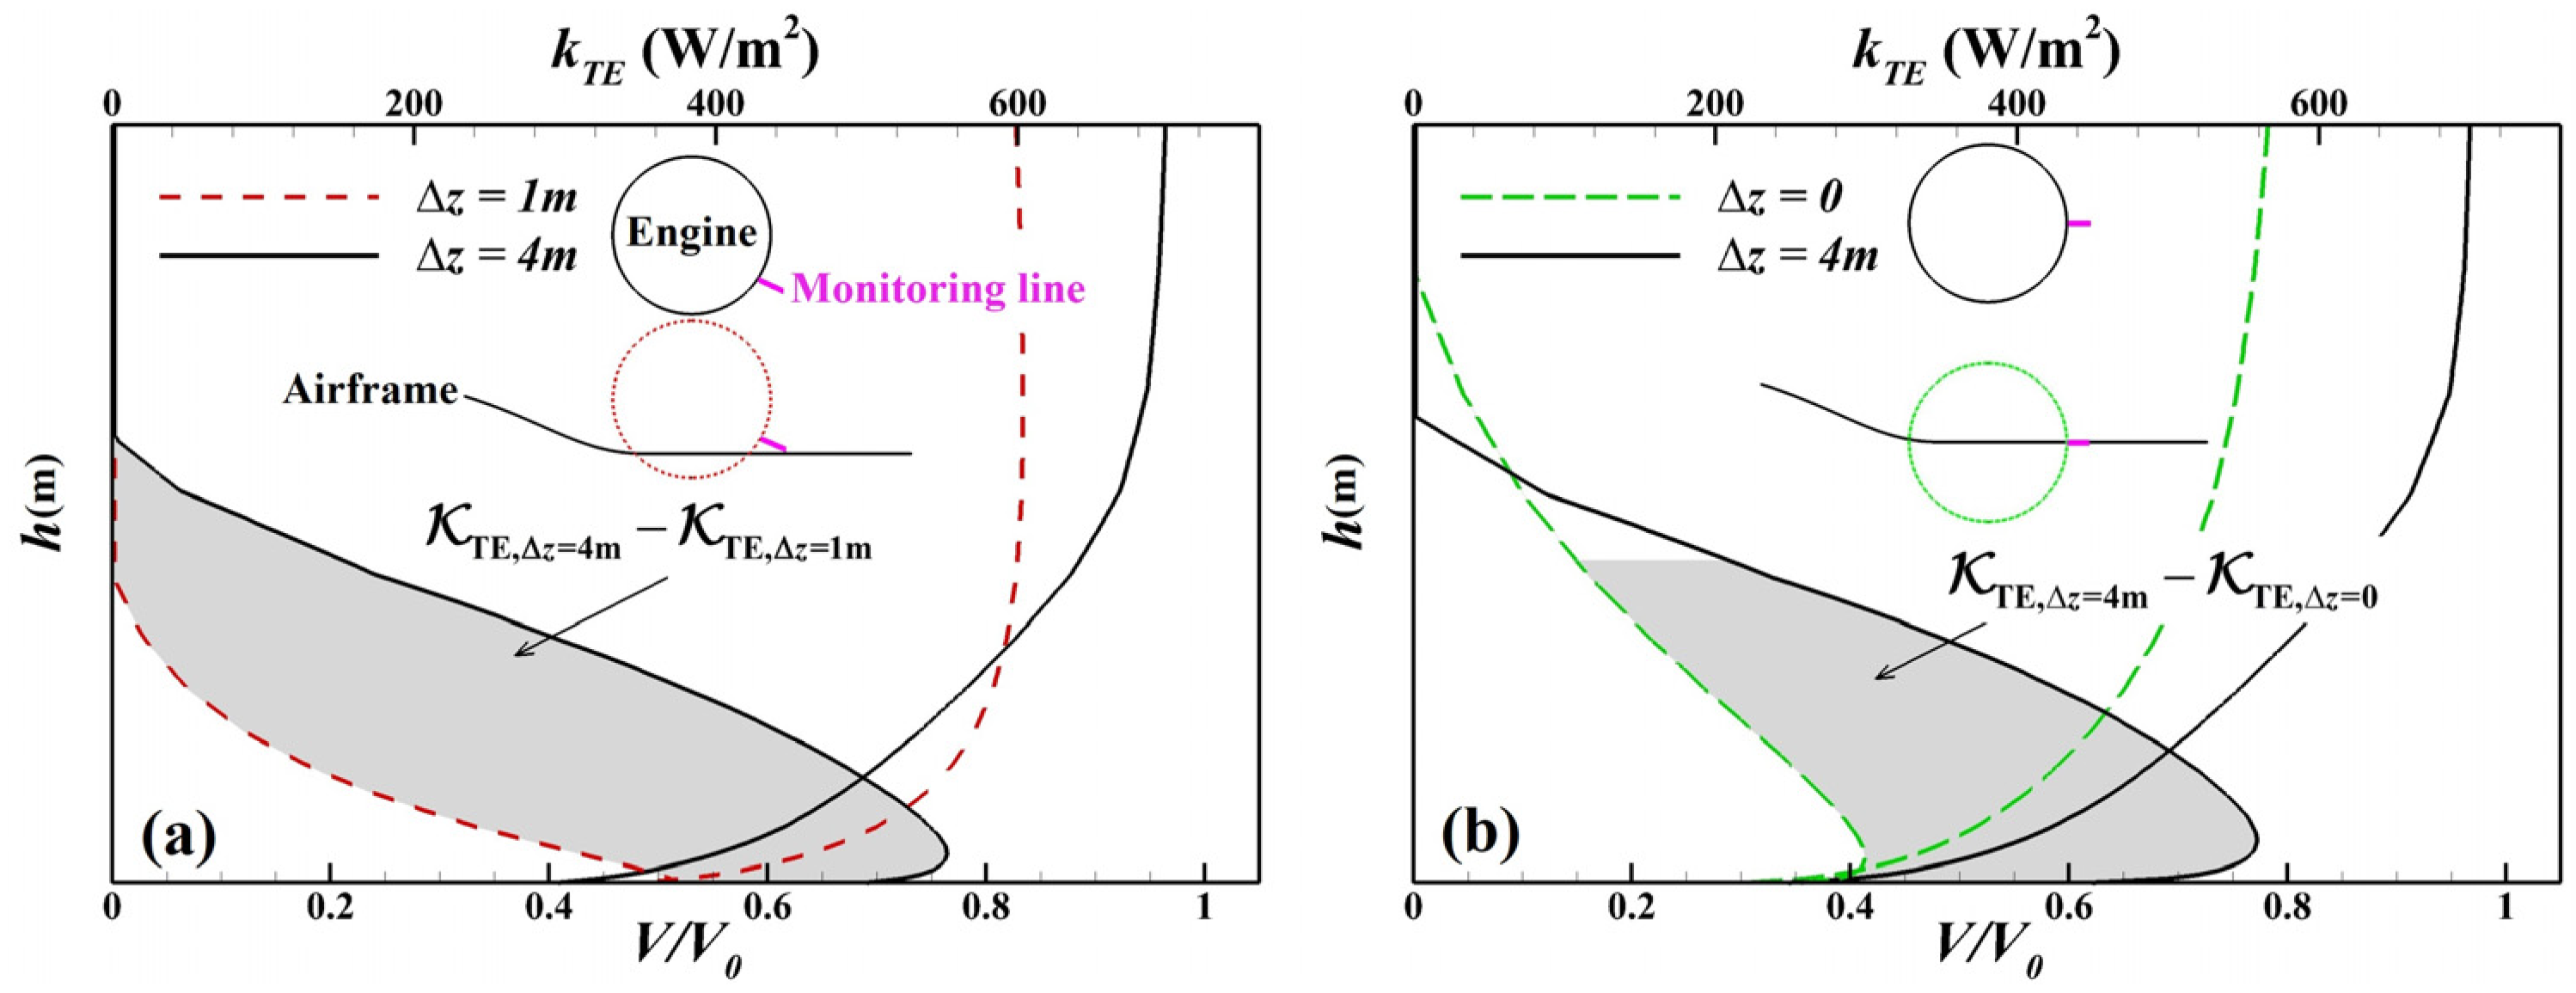
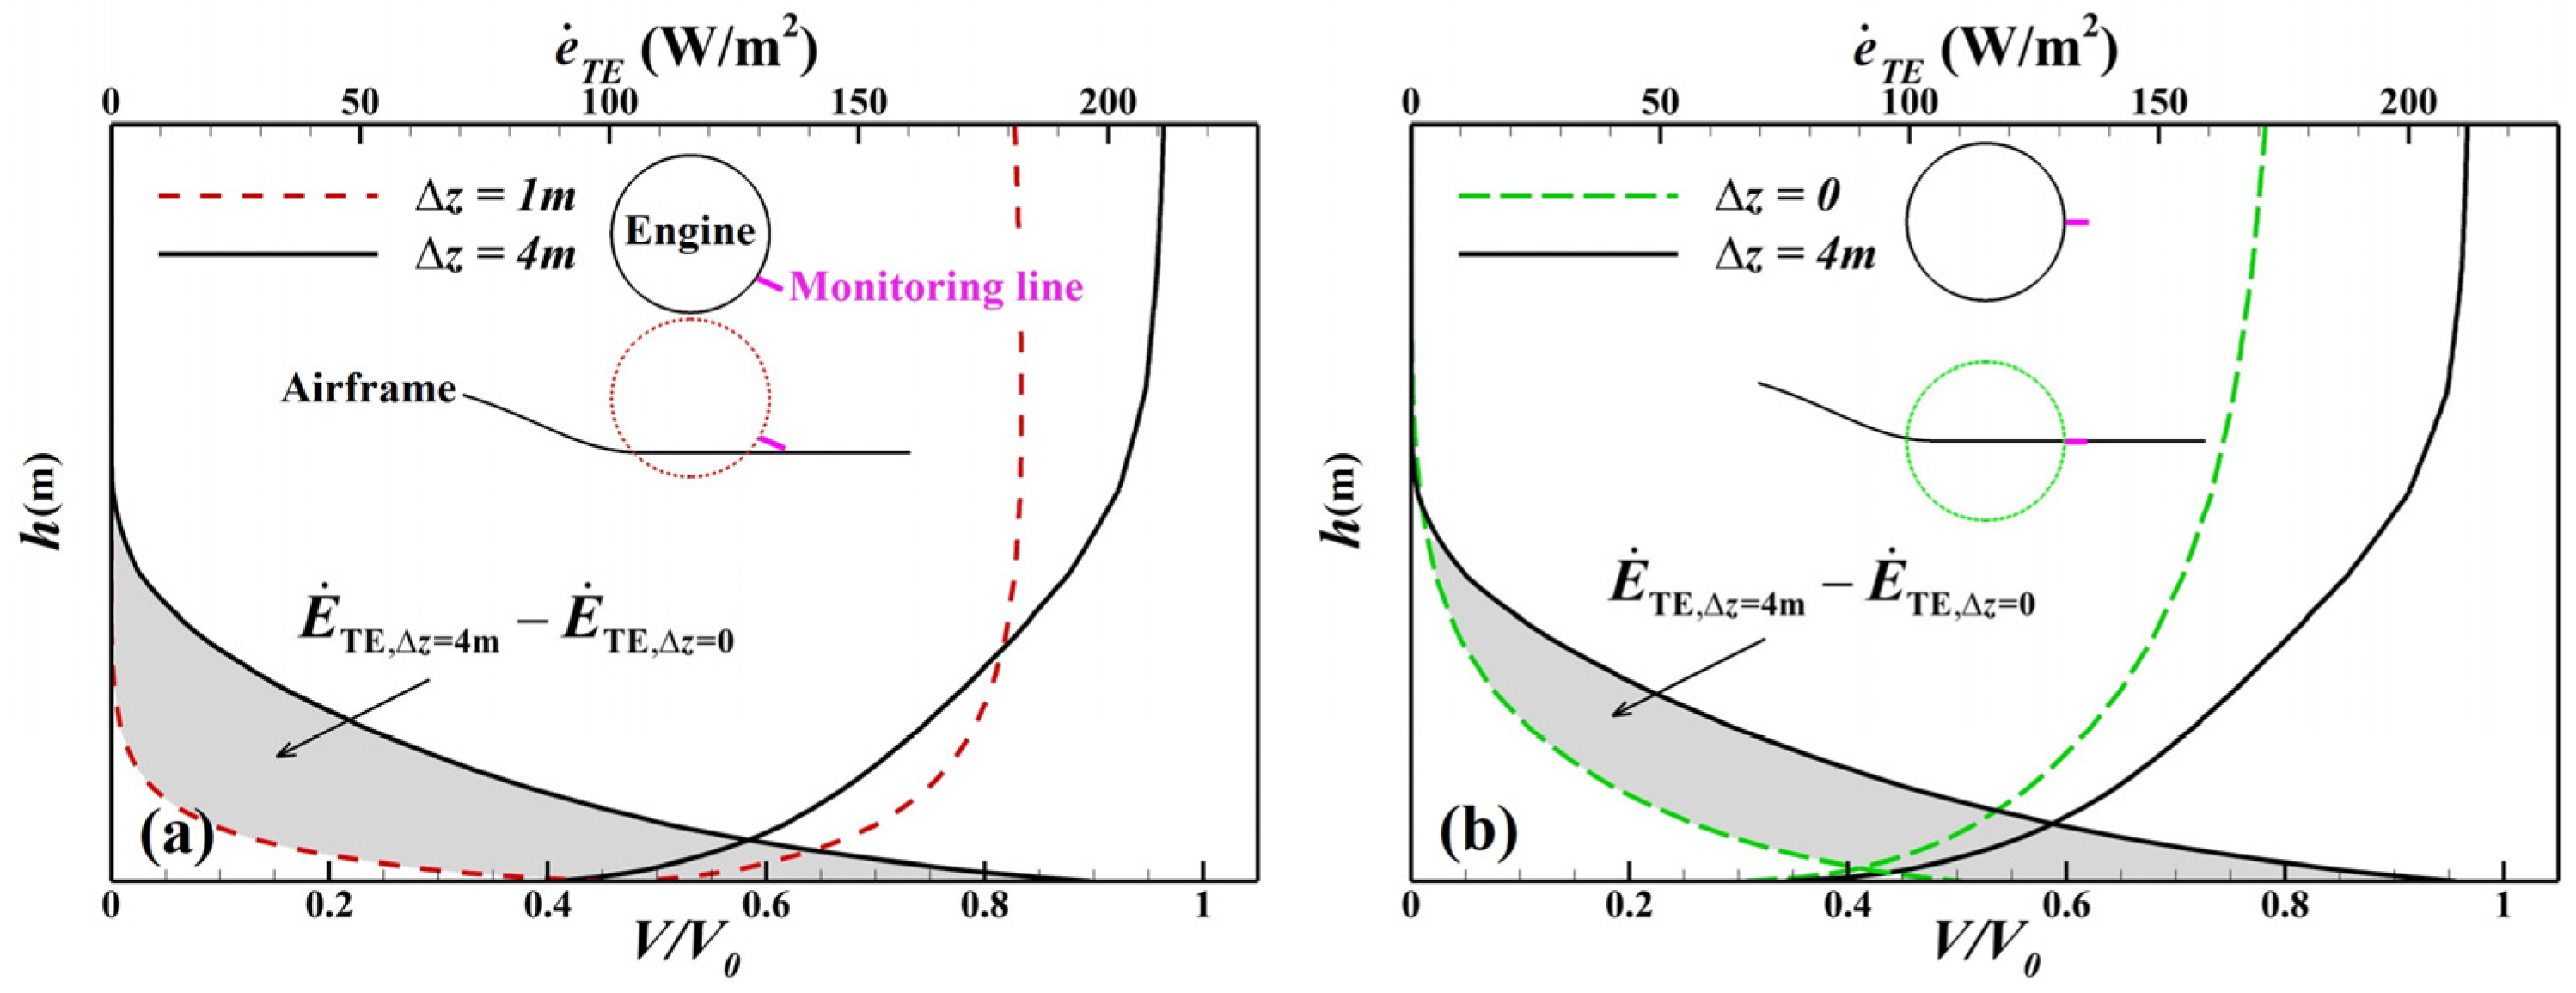
To investigate the influence of the airframe wake on cowl boundary layer dissipation, a vertical monitoring line is placed on the cowl trailing edge (indicated by the pink lines in Figure 16). The kinetic energy defect across this line is defined as:
K TE = 1 2 V ed 2 V 2 ρ V d h
where Ved denotes the velocity at the boundary layer edge and h is the wall-normal distance. The local kinetic energy defect per unit length is as follows:
k TE = 1 2 V ed 2 V 2 ρ V
Figure 16 compares the velocity profiles and kTE distributions along the monitoring line for the non-BLI and BLI stages. The grey region indicates the integrated difference in kTE along the h-direction, representing the variation in K T E . The results show that, in the Δz = 1 m and Δz = 0 cases, where the cowl is located within the airframe wake, the boundary layer dissipation of the cowl is significantly reduced compared to the non-BLI condition at Δz = 4 m. This difference is attributed to the local velocity profile modifications—specifically, the reduced edge velocity of the boundary layer weakens the kinetic energy defect. This confirms that the presence of the airframe wake is a dominant factor in reducing the Boundary layer dissipation on the cowl surface.

4.3.3. Wake Dissipation

Since part of the airframe wake in BLI configurations is ingested into the engine and cannot mix freely with the downstream flow, it should not be included in the wake dissipation assessment. To define the spanwise integration region for wake dissipation, we use the spanwise kinetic energy deposited at the trailing edge location y as:
E ˙ TE ( y ) = 1 2 V ed V 2 ρ V d h
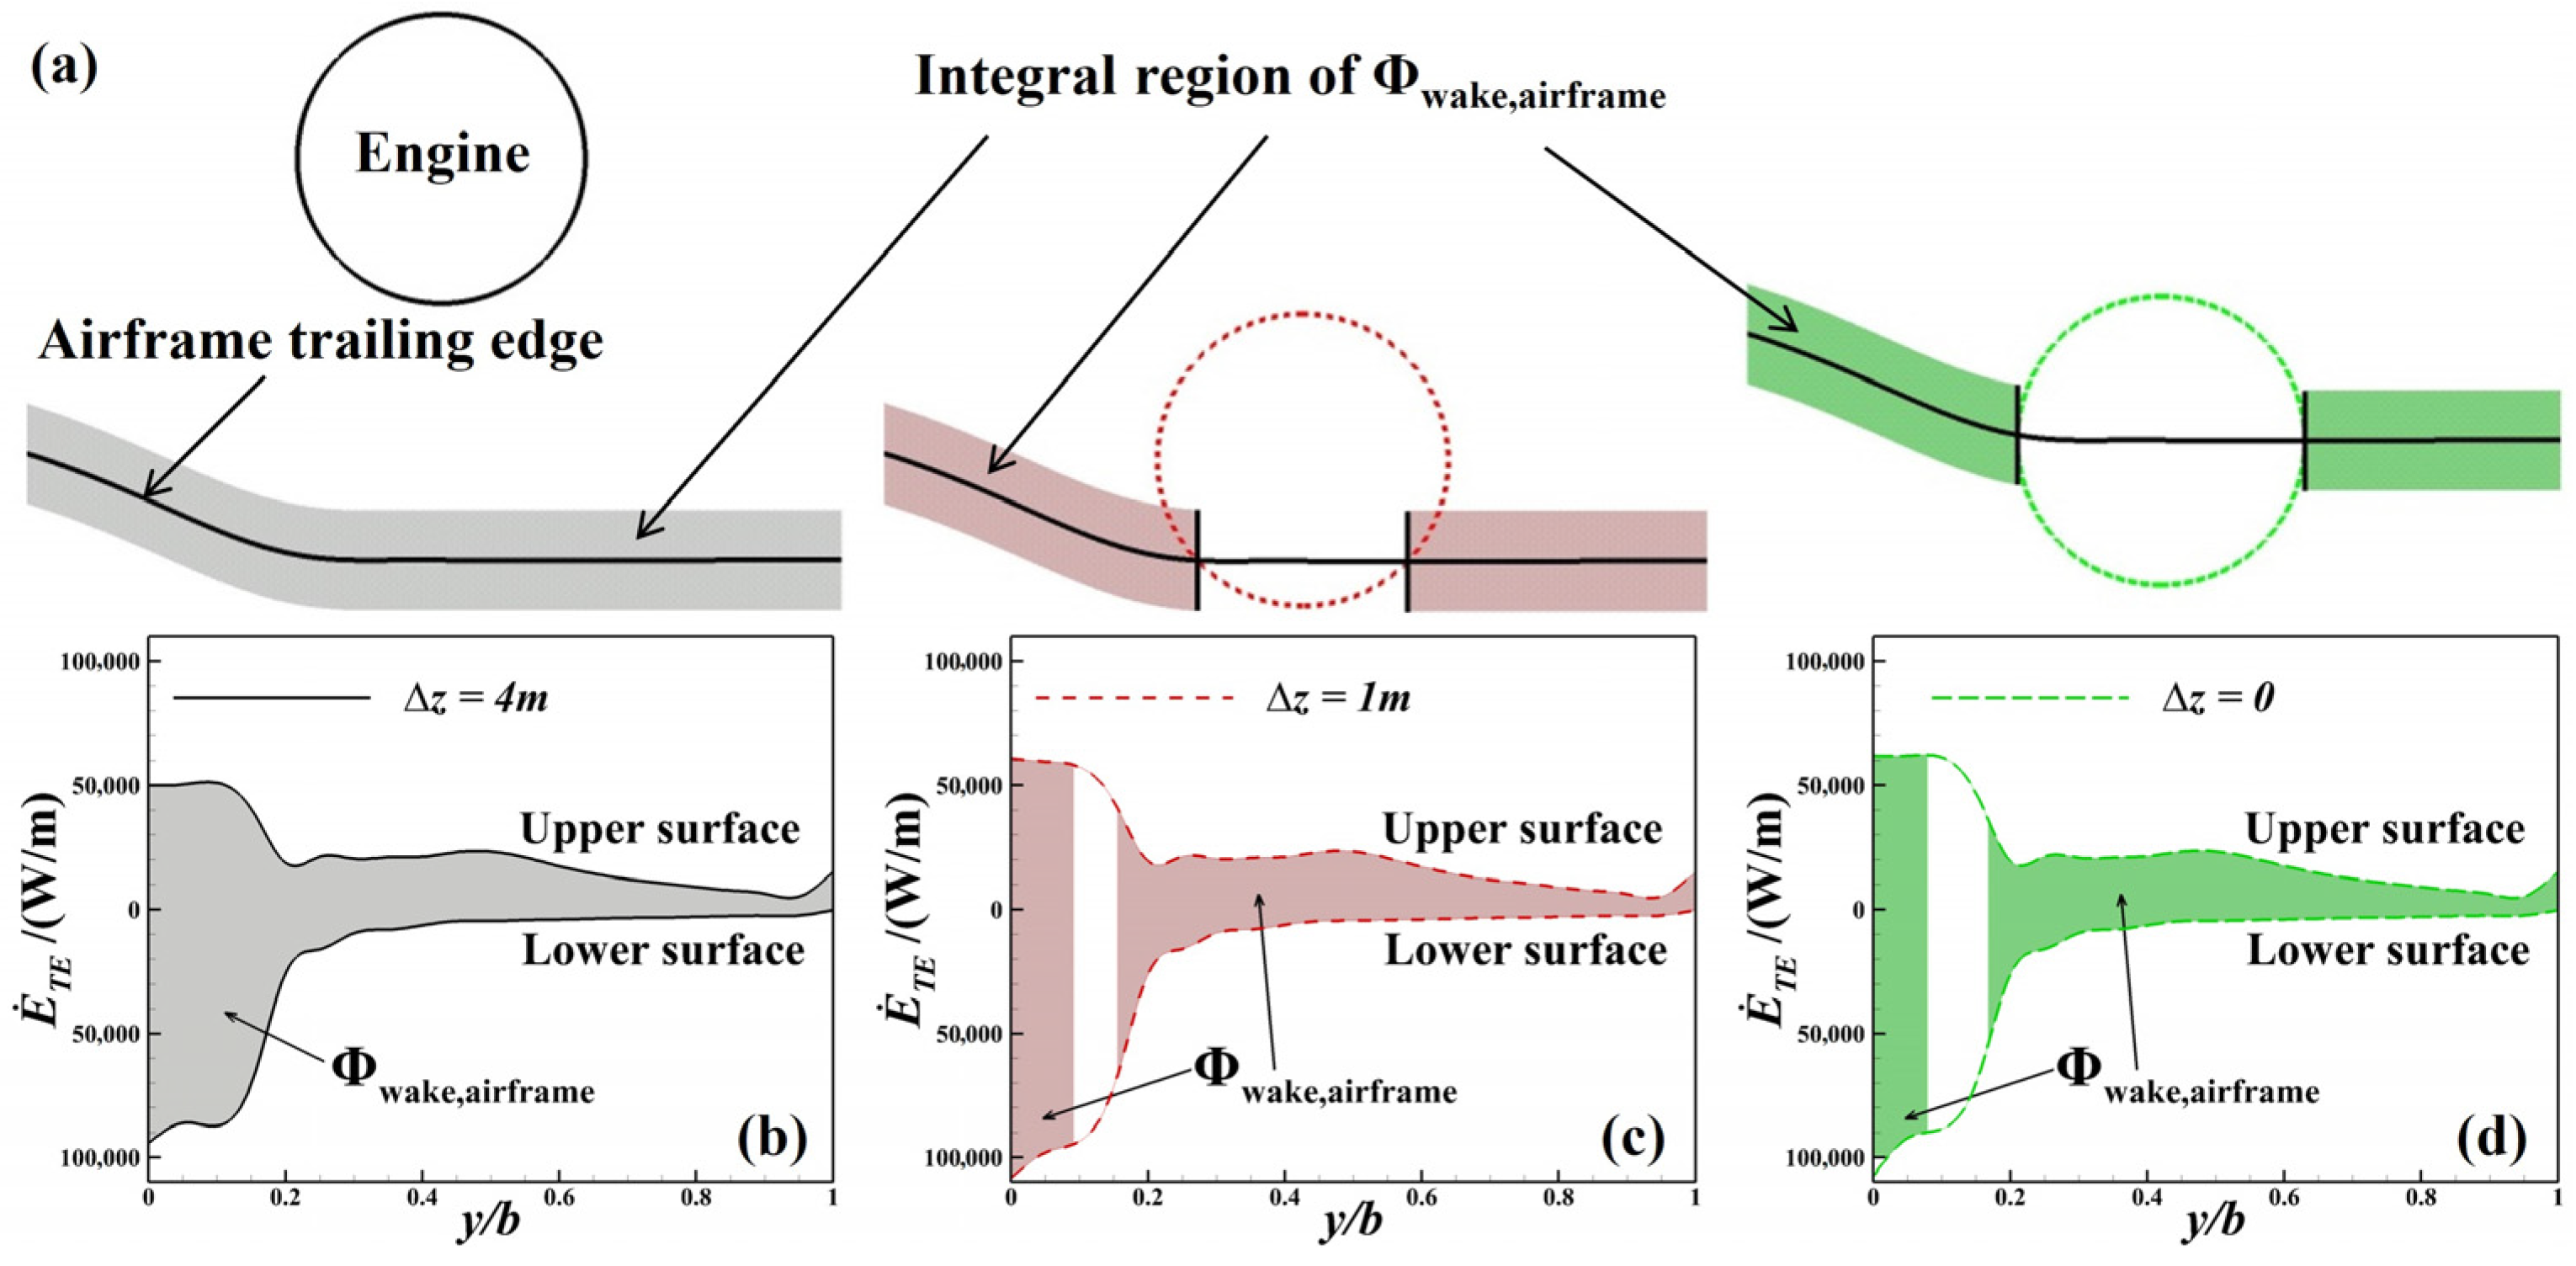
Figure 17 shows the schematic integration region of wake dissipation for the Δz = 4 m, 1 m and 0 configurations under cruise conditions. The portion of airframe wake ingested into the engine is excluded from the integration. The distribution of E ˙ TE ( y ) along the wingspan is presented, and the area enclosed by the shaded region represents the airframe wake dissipation Φwake,airframe.
Figure 18 shows the relationship between the wake dissipation coefficients and CX for the airframe and cowl. The airframe wake dissipation coefficient CΦwake,airframe remains nearly constant in the non-BLI stage and shows little dependence on the axial force coefficient CX. In the BLI stage, CΦwake,airframe is significantly lower, with a greater reduction at Δz = 0 than at Δz = 1 m, because more wake is ingested. The values are approximately 0.00102 in the non-BLI stage and between 0.00082 and 0.00089 in the BLI stage.
For the cowl, CΦwake,cowl increases with engine rotational speed in the non-BLI stage, possibly because of the interaction between the wake and jet shear layers. During cruise, downward engine movement reduces CΦwake,cowl, with a more pronounced drop in the BLI stage, consistent with the behaviour of boundary layer dissipation. Owing to the smaller wetted area, CΦwake,cowl is an order of magnitude lower than CΦwake,airframe, and is concentrated at approximately 3.88 × 10⁻⁵ in the non-BLI stage and 2.82 × 10⁻⁵ in the BLI stage.
The reduction in cowl wake dissipation in the BLI stage follows the same mechanism as the boundary layer dissipation reduction. The downstream kinetic energy deposited per unit length is defined as:
e ˙ TE = 1 2 V ed V 2 ρ V
Figure 19 presents the velocity profile and e ˙ TE distribution along the vertical monitoring lines on the cowl trailing edge for the Δz = 0 and Δz = 1 m states, compared with the Δz = 4 m state. The grey region marks the change in E ˙ TE . The results indicate that the airframe wake can significantly reduce the cowl wake dissipation, again attributed to the reduced edge velocity in the local boundary layer.

4.3.4. Jet Dissipation

Figure 20 shows the variation in the jet dissipation coefficient CΦjet and the propulsion efficiency ηP with CX. As CX decreases, CΦjet increases nearly linearly, whereas ηP decreases continuously, indicating that higher engine rotational speeds lead to increased jet dissipation and reduced propulsion efficiency. For the same CX, lowering the engine position results in a reduced CΦjet and increased ηP, with this trend being more pronounced in the BLI state. At the cruise point, CΦjet is approximately 0.0019 and ηP is approximately 85% in the non-BLI state, whereas in the BLI state, CΦjet can be reduced to 0.0013 and ηP can be increased to 89%. These results demonstrate that BLI can significantly reduce jet dissipation and enhance propulsion efficiency.
Jet dissipation is strongly influenced by the engine exhaust conditions. For simplicity, the internal/bypass nozzle is modelled as a quasi-one-dimensional nozzle with a cross-sectional area Aout and a mass flow rate m ˙ out , allowing the jet dissipation to be rewritten as:
Φ jet = 1 2 ρ out V out V out V 0 2 A out + p out p 0 V out V 0 A out = V out V 0 1 2 m ˙ out V out V 0 + p out p 0 A out
Equation (40) shows that jet dissipation is positively correlated with the exhaust mass flow rate, nozzle exit velocity, and exit pressure. These parameters also serve as the primary factors influencing engine thrust. Neglecting the scrubbing drag, the net engine thrust can be expressed as:
F G D ram = m ˙ out V out V 0 + p out p 0 A out
where FG and Dram are the total thrust and ram drag.
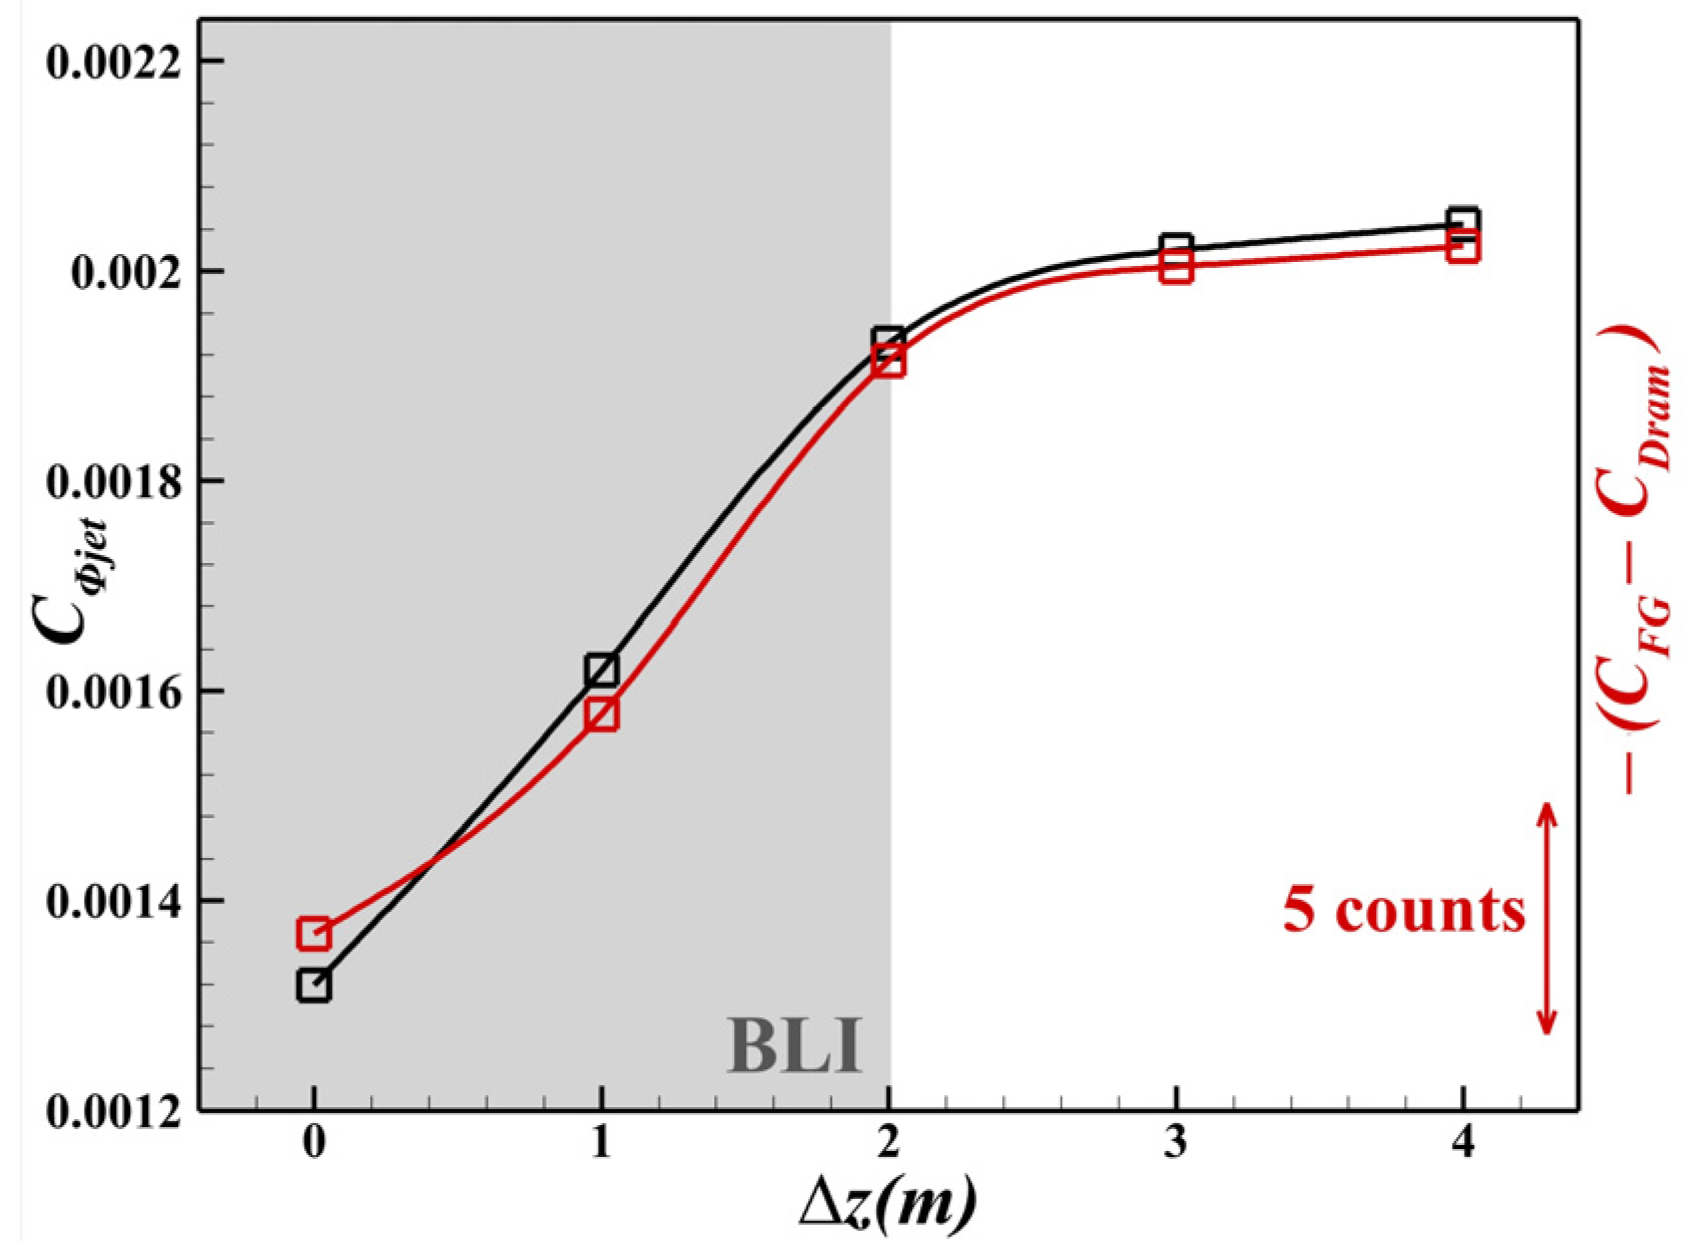
Figure 21 shows the variation in CΦjet and − (CFGCDram) with engine position, revealing an almost identical trend. These results suggest that the reduction in jet dissipation is attributed primarily to the decrease in the required thrust, which is itself a consequence of drag reduction resulting from the combined effects of BLI and PAI.

4.3.5. Vortex Dissipation

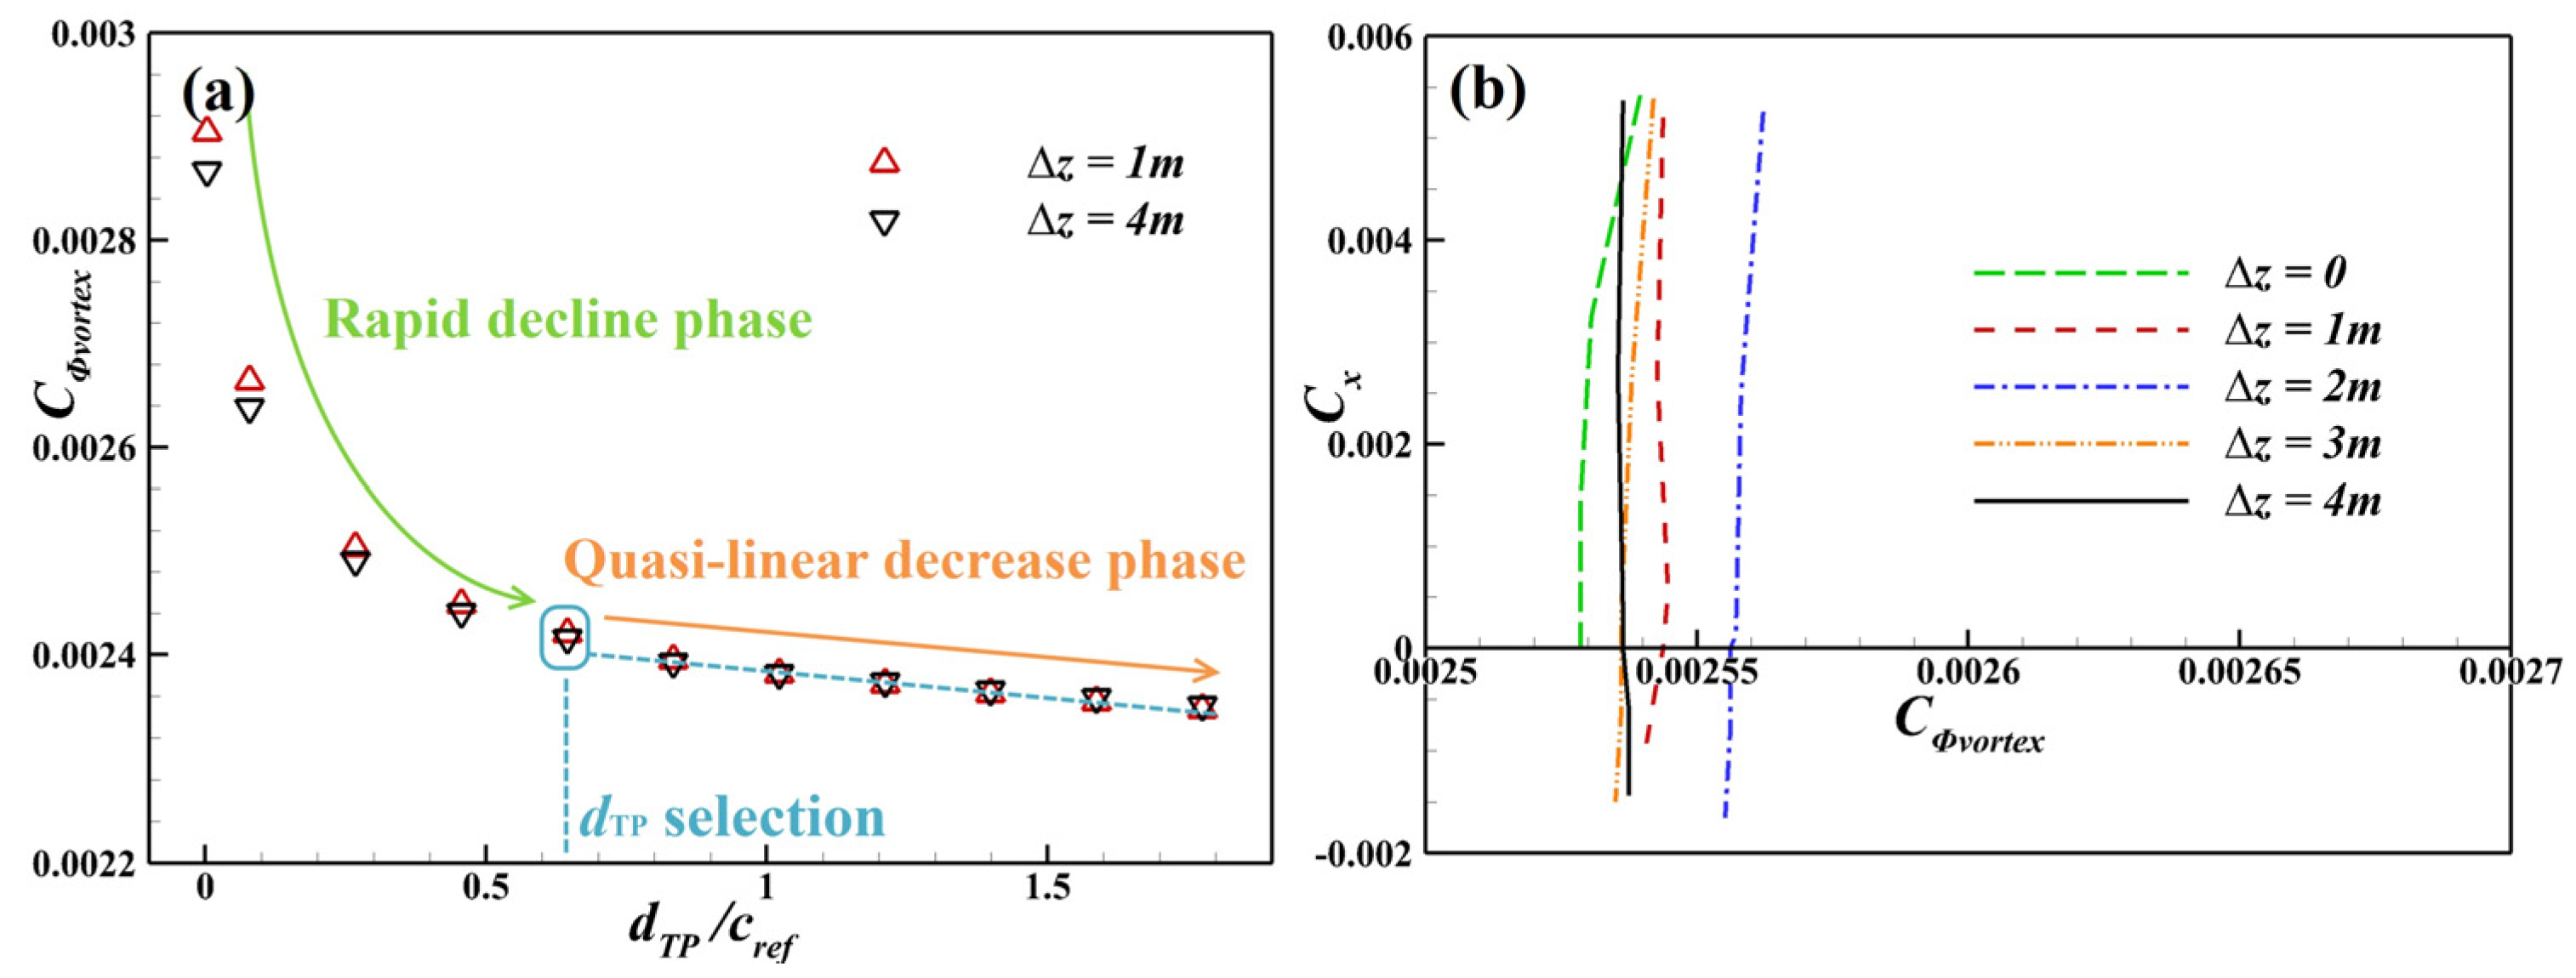
Jet vortex dissipation is influenced by the placement of the Trefftz plane (TP). Figure 22a illustrates the variation in CΦvortex with the streamwise TP position, where dTP is the streamwise distance from the engine tail cone to the TP, normalized by the reference chord length cref of the BWB airframe based on the full projected area. For both Δz = 1 m and Δz = 4 m states, CΦvortex initially decreases rapidly with increasing dTP, and then decreases gradually in a quasi-linear trend. The first stage reflects the rapid dissipation of lateral momentum nonuniformities within the engine jet, whereas the second stage is attributed to the slow decay of lift-induced vortices. To minimize jet influence while retaining sufficient lift-induced vortex strength, the TP is placed at the start of the linear-decay region to evaluate CΦvortex, as marked in Figure 22a.
Figure 22b shows the variation in CΦvortex with CX. The results indicate that CΦvortex is largely insensitive to both the operating conditions and vertical position of the engine. Under cruise conditions, its variation remains within 0.00003 across all cases, with an average value of 0.00254. The fluctuation accounts for only approximately 1.2% of the mean, suggesting that when the lift variation is minor, as shown in Figure 9a, the change in vortex dissipation is negligible.

4.3.6. Shock Wave Dissipation

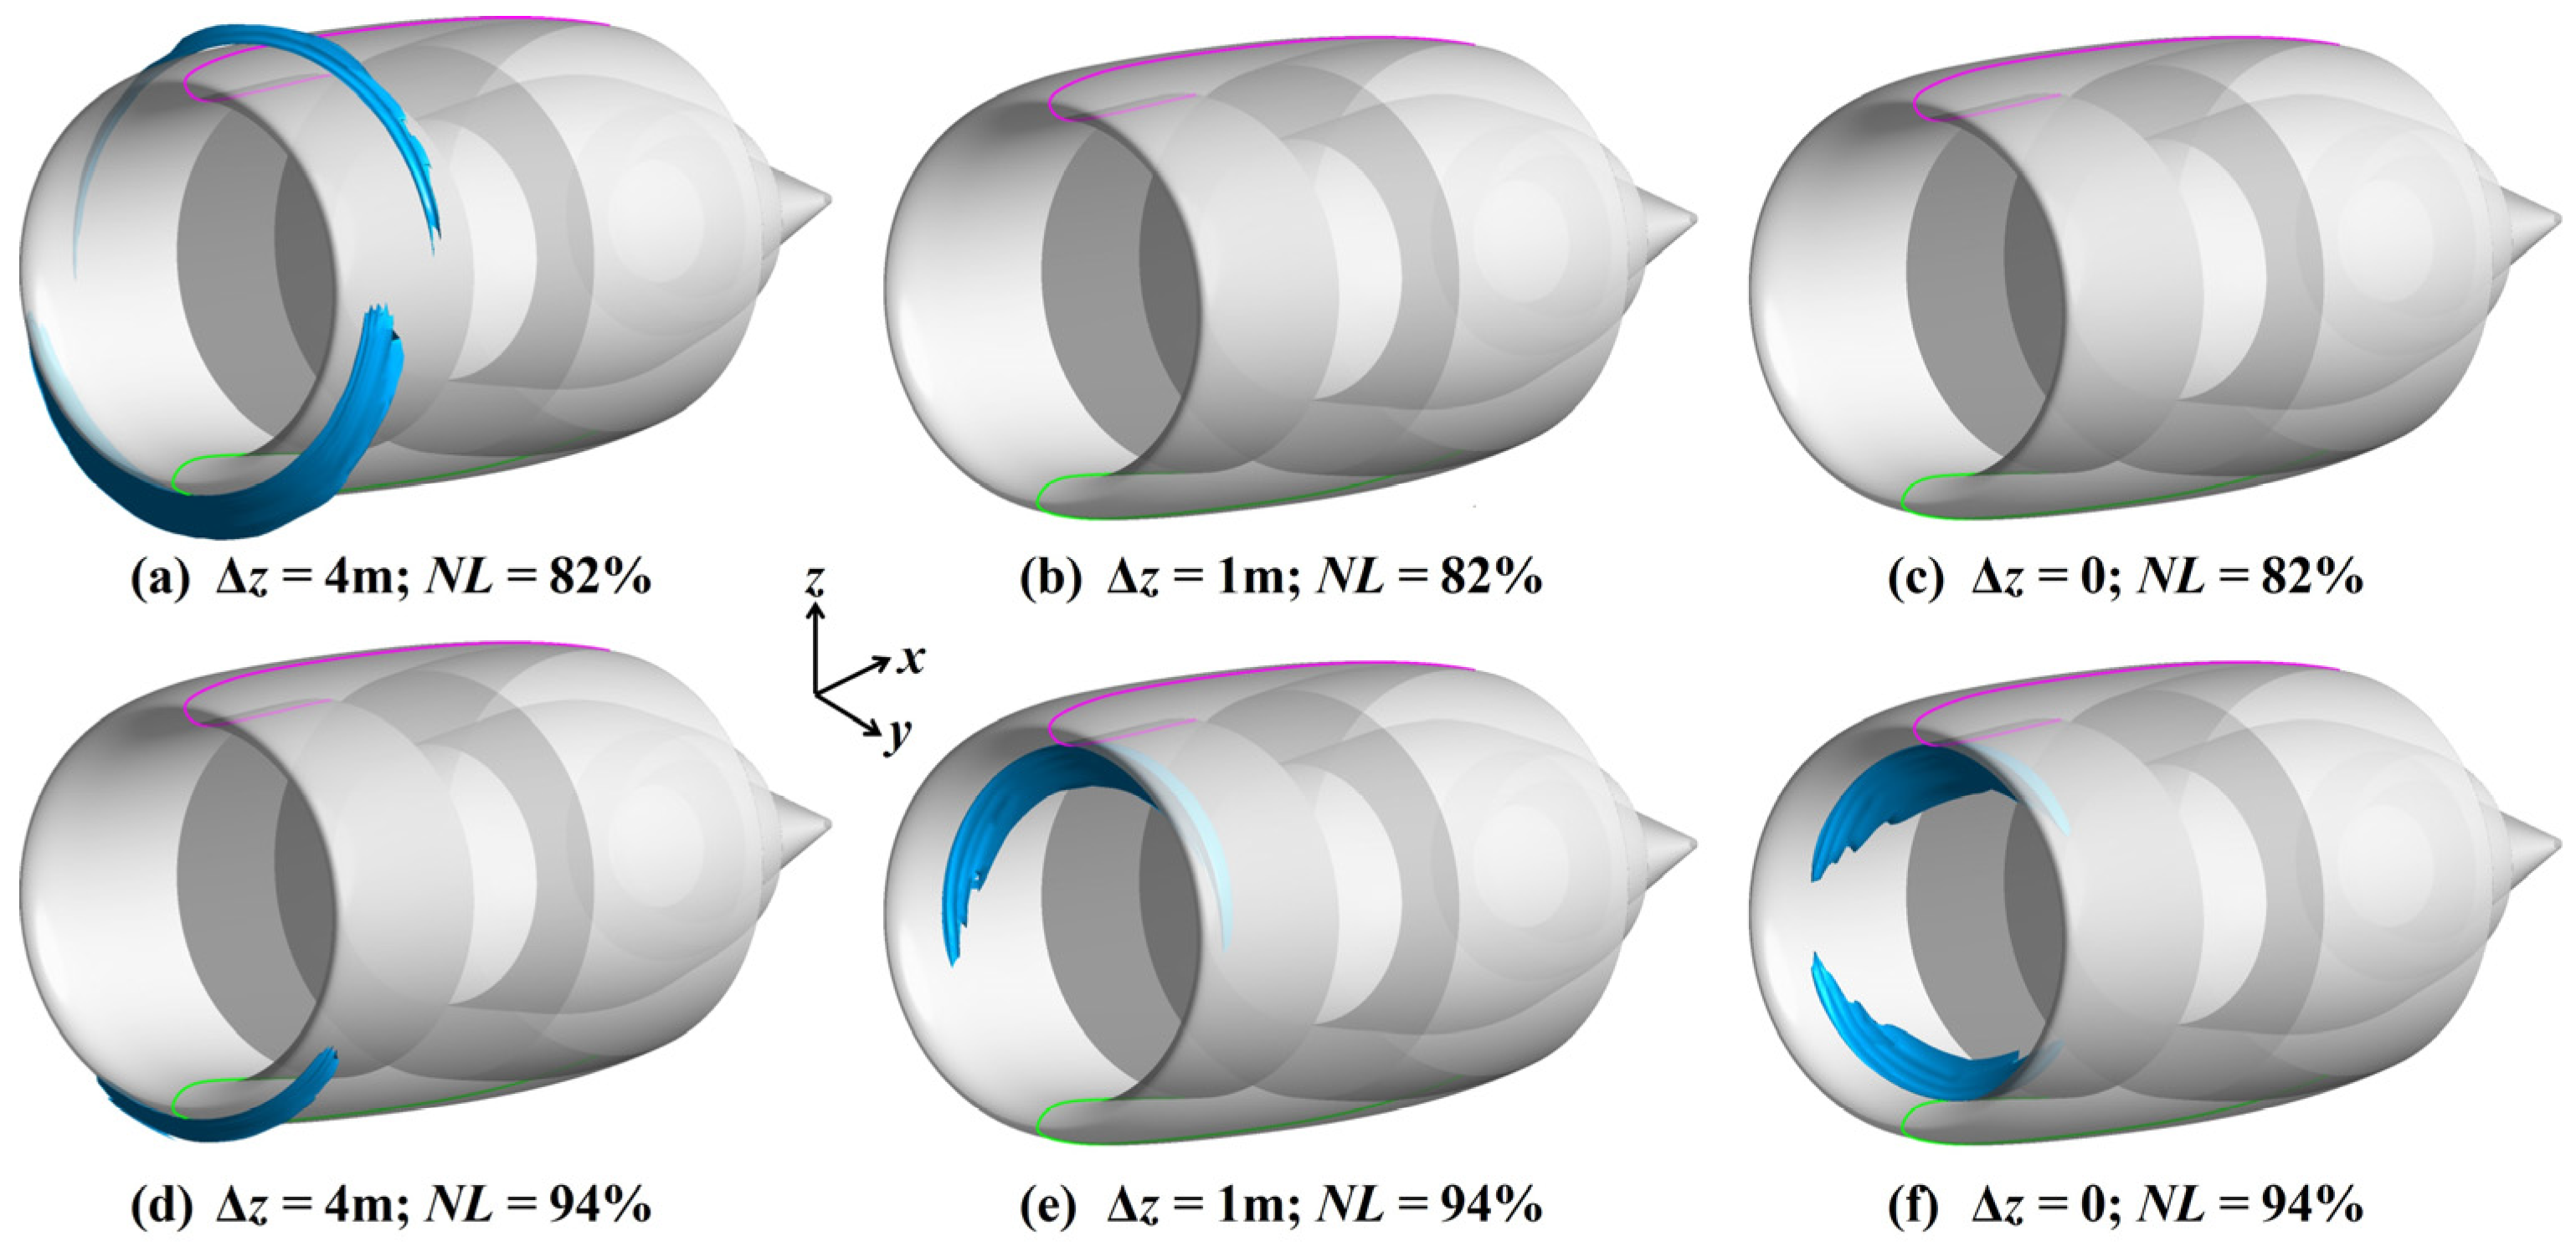
Figure 23 shows the surface pressure distributions and the shock wave regions for two engine positions and rotational speeds (Δz = 4 m, NL = 82%; Δz = 1 m, NL = 94%). Four types of shock waves are identified: the airframe shock wave, cowl shock wave, inlet shock wave, and jet shock wave. The airframe shock wave shows negligible differences in location and strength between the two states. In contrast, the cowl and inlet shock waves appear at different locations under different engine conditions. The jet shock wave forms within the exhaust jet and is governed by the engine operating parameters. Since Equation (18) already accounts for downstream pressure and velocity inhomogeneities in the jet dissipation Φjet, the shock wave dissipation Θwave considers the airframe, cowl, and inlet shock waves.
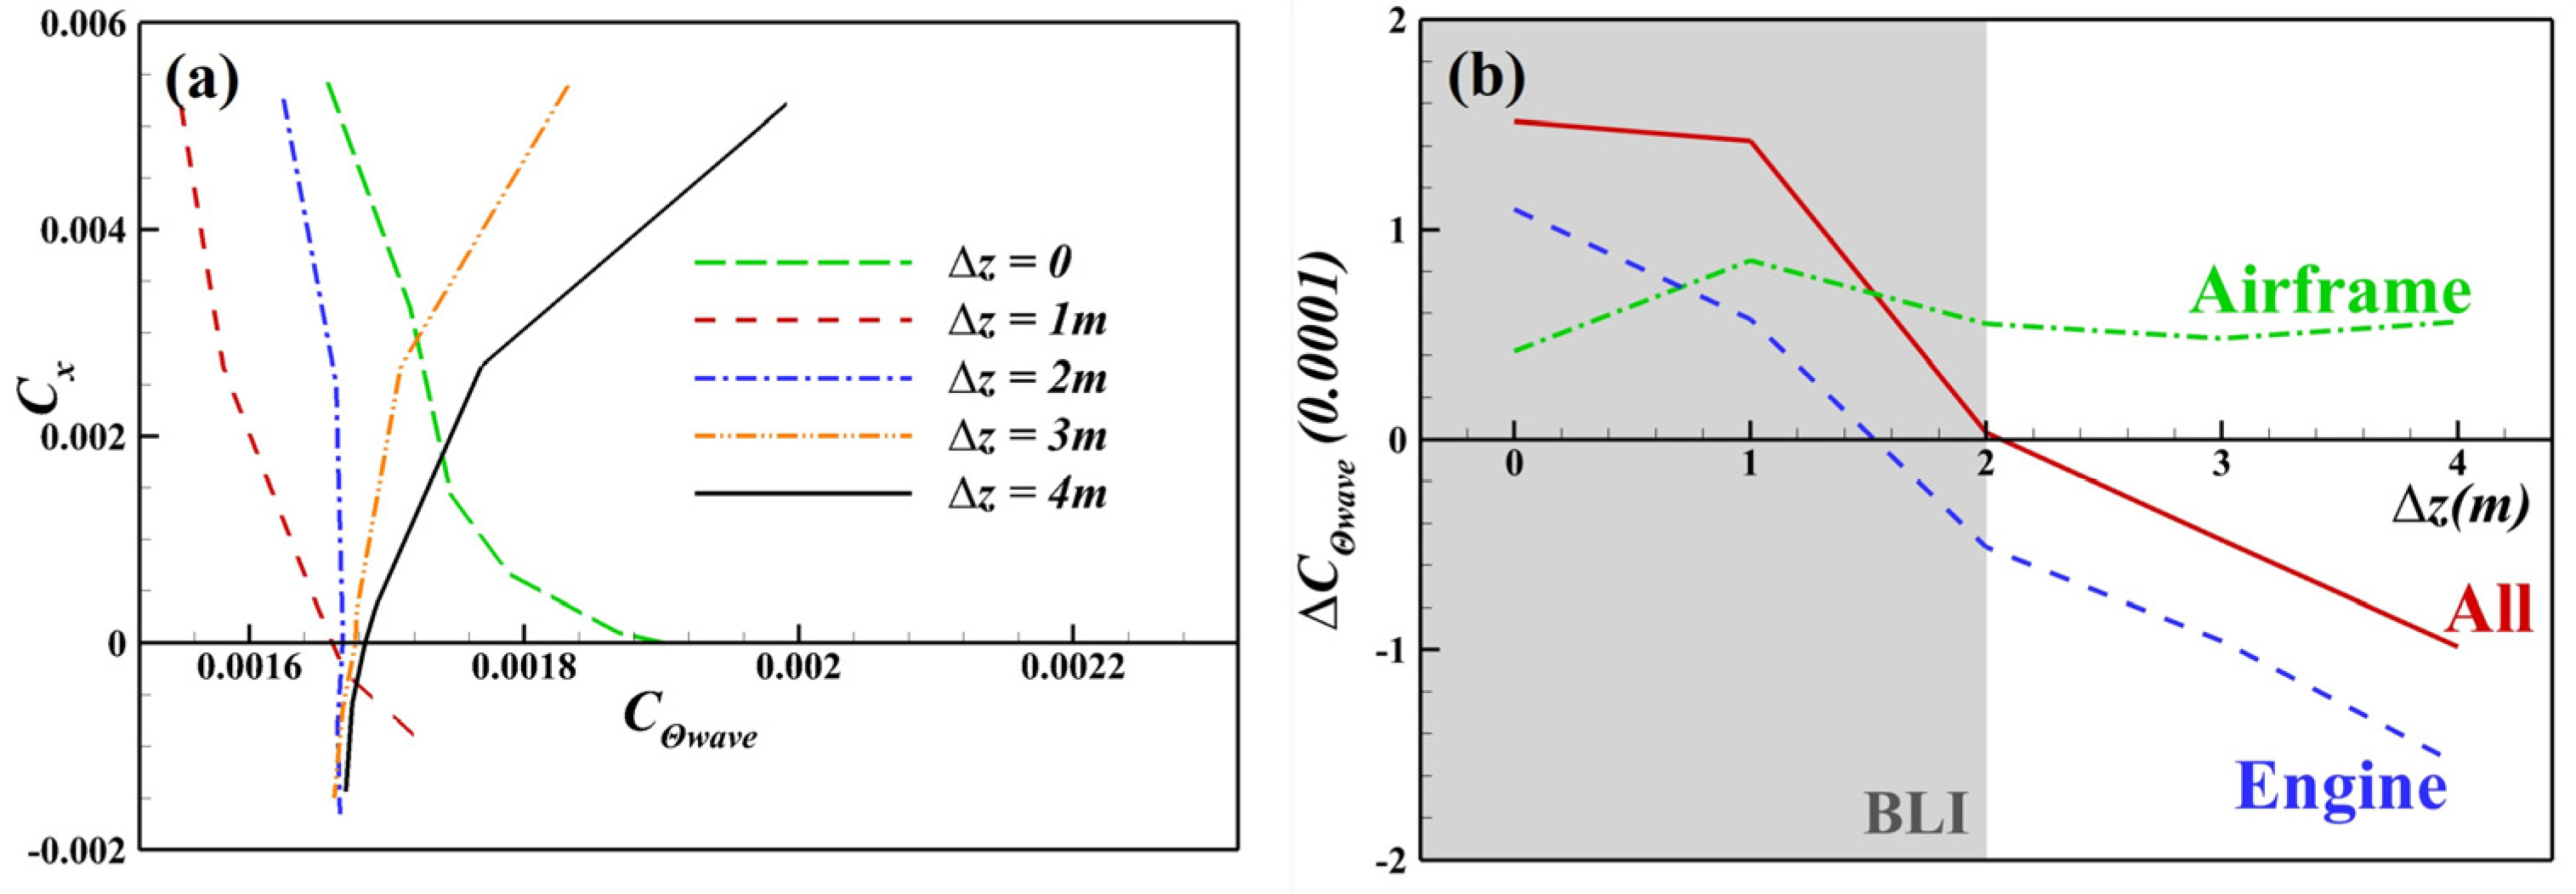
Figure 24a shows the variation in the shock wave dissipation coefficient CΘwave with CX. A complex relationship is observed. As Δz decreases from 4 m to 1 m, the slope of C Θ wave / C X gradually decreases and changes from positive to negative, but the change in CΘwave under the cruise condition (CX = 0) is small, with an average of 0.0017. At Δz = 0 state, a noticeable increase in CΘwave is observed compared to the Δz = 1 m state, with a rise of about 0.0002 under cruise conditions, whereas the variation in C Θ wave / C X is limited.
To quantify the effect of engine rotational speed, the change in CΘwave due to increasing NL from 82% to 94% is defined as ΔCΘwave:
Δ C Θ wave = C Θ wave , N L = 94 % C Θ wave , N L = 82 %
Figure 24b shows the variation of ΔCΘwave with Δz. The “engine” curve, which includes the cowl and inlet shock waves, dominates the overall ΔCΘwave trend. For the airframe, ΔCΘwave remains consistently positive, suggesting that increasing the engine rotational speed strengthens the shock wave due to the enhanced suction effect on the upper surface of the airframe. For the engine, ΔCΘwave is negative in the non-BLI stage, indicating that the shock wave weakens with an increased engine rotational speed. In contrast, it becomes positive in the BLI stage, where higher engine rotational speed enhances the engine shock wave.
Figure 25 shows the engine shock wave regions for different Δz states. In a non-BLI state (Δz = 4 m), the engine shock wave appears on the cowl, and an increase in the engine rotational speed weakens it. In the BLI state (Δz = 1 m and 0), the shock wave moves into the inlet, and increasing the engine rotational speed enhances it. This change in shock wave location and the opposite response to the engine rotational speed variation explain the trend of engine ΔCΘwave in Figure 24b, which also contributes to the variation in C Θ wave / C X in Figure 24a. The different shock wave responses under BLI and non-BLI states originate from the expansion of the capture streamtube and the outward shift in the inlet stagnation point, caused by the integration between the airframe and engine, as illustrated in Figure 8. This reflects the significant influence of the PAI effects on shock wave dissipation, which must be carefully considered in the BLI layout design.

4.3.7. Benefit Compositions

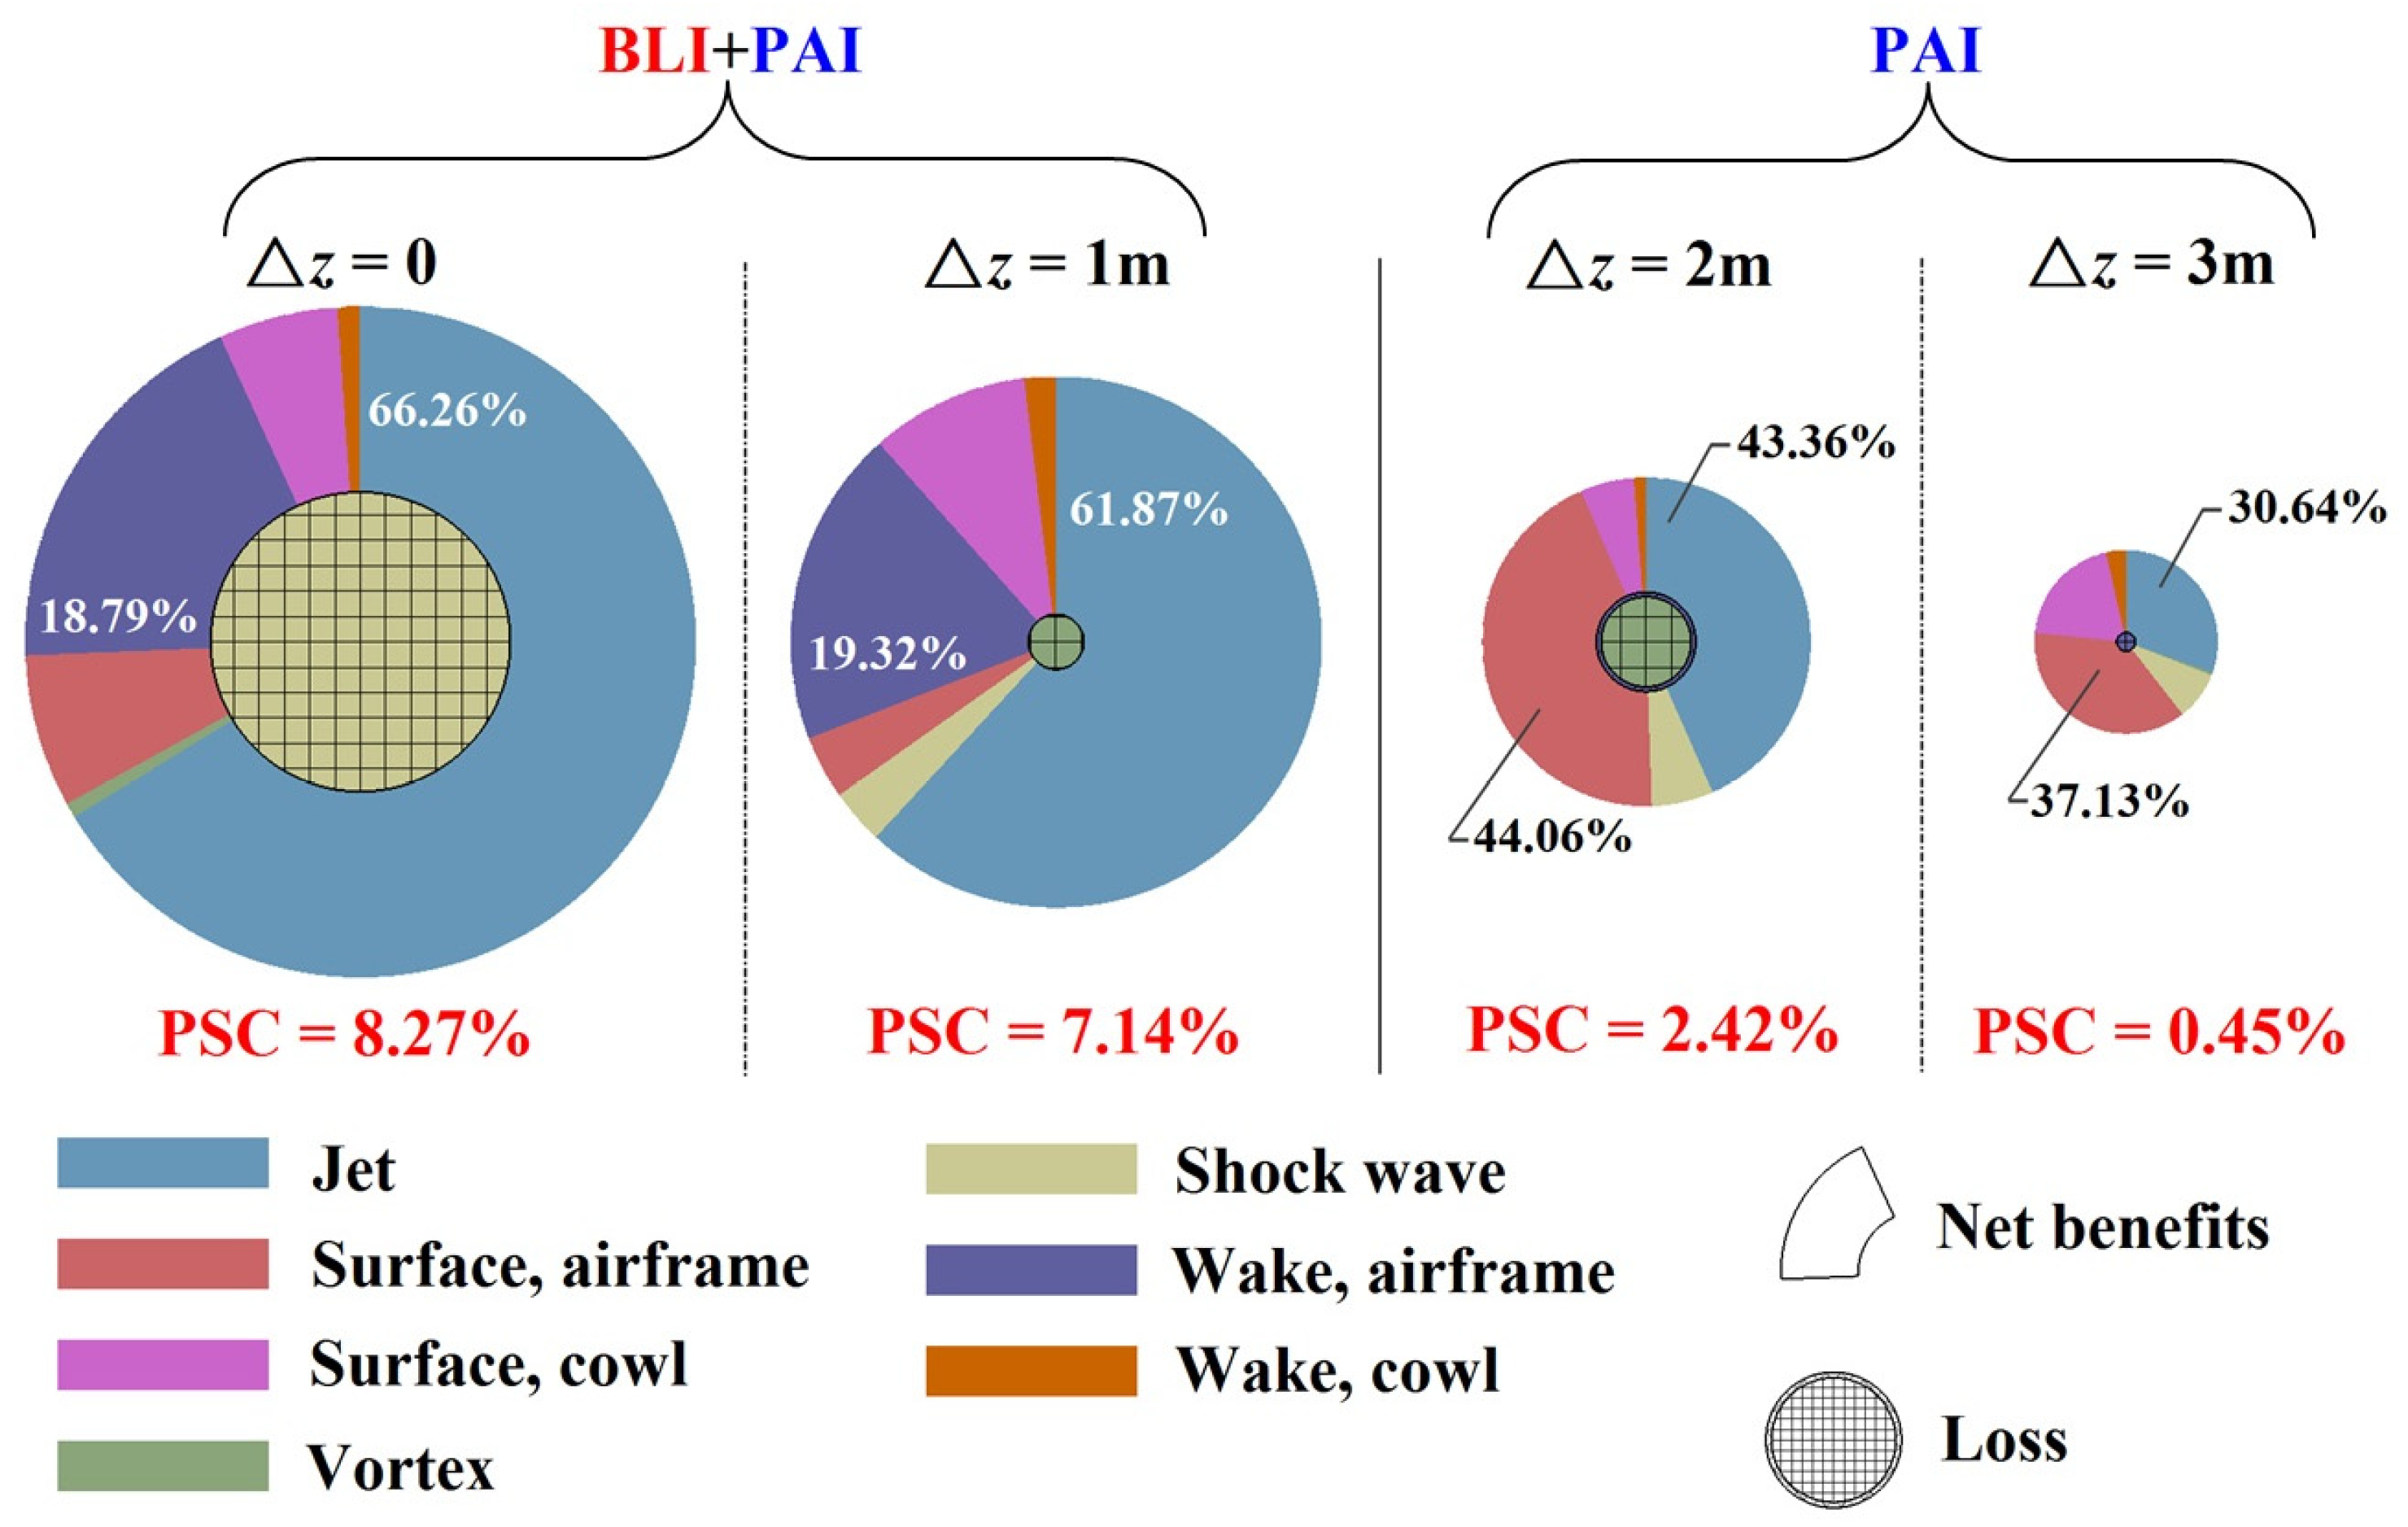
Figure 26 presents the percentage contribution of each dissipation component to the total benefit, referenced to the Δz = 4 m state. The area of the pie chart represents the gross benefit, i.e., the sum of dissipation reductions across all components. The central grid-filled circle indicates the loss, which is defined as dissipations that exceed the benchmark value. The annular area, obtained by subtracting the loss from the gross benefit, represents the net benefit, which is further subdivided based on the relative contributions of each dissipation type.
For non-BLI states, the PSC benefit, which is driven primarily by the PAI effect, arises mainly from reductions in airframe boundary layer dissipation and jet dissipation, which together contribute approximately 67–87% of the net benefit. However, the net benefit in these cases remains lower than that in the BLI states. For the BLI states, jet dissipation reduction is the dominant contributor to PSC improvement, with a share of approximately 62–66%, followed by a reduction in airframe wake dissipation, contributing approximately 19%. The remaining contributions arise primarily from reductions in boundary layer dissipation on the airframe and cowl, which are also influenced by the PAI effect.

5. Discussion

5.1. Comparison with Prior Works

Table 1 summarizes the representative prior BLI studies, covering theoretical, experimental, numerical, optimization, and integrated system analyses. In comparison, the present study investigates a non-integrated BWB–turbofan configuration, quantifying both the lift-to-drag improvement and the PAI trade-off. The obtained PSC gains fall within the widely accepted theoretical range and approach the upper bounds reported for integrated layouts. The relative contributions from jet dissipation align well with prior studies, whereas the fixed wetted area highlights the key role of wake dissipation in BLI gains.

5.2. Limitations and Design Relevance

The primary source of uncertainty in this study—as is common to most BLI research to varying degrees—arises from the limited knowledge of real engine response to distorted BLI inflow. Specific factors include geometric differences between the simulated and the actual fan, discrepancies between the simulated and actual distortion patterns, and the unknown core performance response under distorted inlet conditions. Nevertheless, these limitations mainly affect the quantitative accuracy of the results, while the overall trends and insights remain valid for early-stage design evaluation.
Among all the tested configurations, the Δz = 0 case results in the greatest deviation in distortion pattern and severity relative to the reference distortion state. Accordingly, the performance gains (in lift-to-drag ratio and PSC) observed at Δz = 1 m are considered more instructive and representative.
Notably, the non-integrated airframe–engine setup examined here does not correspond to any specific design. Rather, it serves as an analytical framework to explore the transition from non-BLI to BLI layouts in BWB aircraft. As such, detailed design considerations—such as pitch moment trimming or cruise-takeoff and landing coordination—were not included in this study. To extend the analytical framework presented in this study to specific design configurations, uncertainty-based optimization should be adopted. When performing optimization without considering uncertainty, the potentially severe estimates of the adverse effects of BLI may lead to overly conservative design decisions and a restricted design space. Uncertainty optimization offers promising potential for addressing design challenges in models where uncertainties are present.

6. Conclusions

In this study, a closely coupled but non-integrated blended wing body (BWB)–turbofan configuration that enables a continuous transition from clean to boundary layer ingestion (BLI) intake conditions was investigated numerically via momentum- and energy-based analyses. A drag decomposition formulation was developed by introducing an idealized capture streamtube–airframe interaction force, and the engine boundary conditions incorporate an estimate of performance loss due to inlet distortion. The aerodynamic benefits of BLI were systematically quantified and decomposed. Special attention has been given to the competing effects between the BLI and the propulsion–airframe integration (PAI). These findings support early-stage performance assessment and design decisions for BWB aircraft and offer insights into the mechanisms behind BLI effectiveness and its interaction with the PAI.
(a)
Transitioning from the non-BLI to the BLI intake yields a 9.0–13.5 counts drag reduction with a negligible change in lift, resulting in a 1.7–2.6 improvement in the lift-to-drag ratio. In the BLI stage, competition emerges between the BLI-induced benefits and the PAI-induced penalties. The additional drag decreases by up to 28 counts, which is attributed primarily to the inlet total pressure reduction. In contrast, the external drag increases by up to 14.5 counts, primarily because the PAI alters the cowl pressure gradient direction via the expansion of the capture streamtube and the outward shift in the inlet stagnation point.
(b)
During cruising, the PSC benefits in the BLI stage reach 7.14–8.27%, with the jet dissipation contributing more than 60% and the wake dissipation nearly 20%. As the engine moves closer to the airframe, the PAI has a favourable impact on boundary layer dissipation, while the BLI itself exerts little direct influence. For the portion of the cowl immersed in the airframe wake, both the boundary layer and wake dissipation are significantly suppressed, owing to the reduced edge velocity in the local boundary layer. The reduction in jet dissipation is attributed ultimately to the lower required thrust under the BLI, both of which are governed by the same nozzle flow parameters. The shock wave dissipation exhibits a nonlinear trend with the engine position, as the PAI causes the shock waves to alternately appear on the cowl and within the inlet. The vortex dissipation, dominated by the lift-induced vortices, remains nearly constant across all cases.
Future work will focus on the aerodynamic optimization of BWB configurations integrated with BLI high-bypass-ratio turbofans, using a dedicated BLI-aware gas-turbine performance tool coupled with CFD, as well as performance comparisons and benefit assessments relative to podded-on layouts.

Author Contributions

Conceptualization, G.W., D.L. and B.Z.; Data curation, G.W.; Formal analysis, G.W.; Funding acquisition, G.W. and D.L.; Investigation, G.W. and D.L.; Methodology, G.W., D.L., P.L. and B.Z.; Resources, D.L.; Software, G.W. and P.L.; Supervision, D.L.; Validation, G.W. and P.L.; Visualization, G.W.; Writing—original draft preparation, G.W.; Writing—review and editing, D.L., P.L. and B.Z. All authors have read and agreed to the published version of the manuscript.

Funding

This research was funded by the National Natural Science Foundation of China (No. 12402396), the China Postdoctoral Science Foundation (No. 2024M753318), the Postdoctoral Fellowship Program (Grade C) of the China Postdoctoral Science Foundation (No. GZC20241784), and the “1-0” Major Engineering Science Problem project of the Northwestern Polytechnical University (No. G2024KY0613).

Data Availability Statement

The data that support the findings of this study are available from the corresponding author upon reasonable request.

Conflicts of Interest

The authors declare no conflicts of interest.

Nomenclature

Symbol
AArea [m2]
aspeed of sound [m/s]
CD, CLDrag and lift coefficients [-]
CDadd, CDpAdditional drag and pressure drag coefficients [-]
CFThrust coefficient [-]
Cp, Cp*Pressure coefficient and critical pressure coefficient [-]
CPKMechanical power coefficient [-]
CXAxial force coefficient [-]
CΦ, CΘViscosity and volume dissipation coefficients [-]
crefReference chord [m]
D(Total) drag [N]
Dadd, DBLI, Dduct, DramAdditional drag, idealized BLI drag, internal drag, and ram drag on the streamtube control volume [N]
Dairframe, Dcowl, DscrubDrag on airframe, nacelle cowl, and nozzle fairing cone [N]
Dairframe_BLI, Dairframe_restForce on airframe due to capture streamtube interaction and on airframe excluding capture streamtube region [N]
Dadd_BLI, Dout_BLIBLI additional drag and BLI external drag [N]
DoutExternal drag, including cowl and airframe drag [N]
dTPStreamwise distance from engine to Trefftz plane [m]
E ˙ ,   e ˙ Kinetic energy deposited of a certain line [kg m/s3] and per unit length [kg/s3]
FThrust [N]
FG, Fduct, FnetTotal thrust, internal thrust, and installed net thrust [N]
FxNet axial force [N]
fdDynamic distortion correction factor [-]
HAltitude [m]
hWall distance or height [m]
hLHeight of the low–total-pressure zone [m]
KLift-to-drag ratio [-]
K , kKinetic energy defect of a certain line [kg m/s3] and per unit length [kg/s3]
MMach number [-]
m ˙ Mass flow rate [kg/s]
NLEngine rotational speed [%]
nUnit normal vector to the wall [-]
PKMechanical power [W]
p, ptStatic pressure and total pressure [Pa]
PRminMinimum total-pressure ratio within the low-pressure zone [-]
RSpecific gas constant [J/(kg K)]
RA1, RFRadius of inlet face and fan face [m]
SrefReference area [m2]
S Boundary surface [m2]
T, TtStatic temperature and total temperature [K]
TRf, TRcFan and core temperature ratio [-]
TRf,ηmaxFan temperature ratio at peak efficiency [-]
u, v, wVelocities along x-, y- and z-axis [m/s]
V, Vvelocity vector and scalar [m/s]
V wave Shock wave region [m3]
x0Freestream direction [-]
Greek Symbols
αAngle of attack [°]
γIsentropic exponent [-]
ΔCDChanges in drag coefficient [-]
ΔCΘwaveChange in shock-wave dissipation coefficient from NL = 82% to 94% [-]
ΔTRfLoss in the fan temperature ratio at peak efficiency [-]
ΔVVelocity deficit [m/s]
Δy, Δy+Wall-normal height [m] and nondimensional wall-normal height [-] of the first-layer mesh
ΔzVertical offset between the airframe trailing edge and the engine axis [m]
εAverage total pressure loss [-]
ζShock wave sensor [-]
ηPPropulsion efficiency [-]
θCircumferential angle [°]
ΘwaveShock wave dissipation [W]
νKinematic viscosity [m2/s]
ρDensity [kg/m3]
τc, τfCore and fan temperature ratio loss factor [-]
τwWall stress [Pa]
τViscous stress tensor [Pa]
Φjet, Φsurf, Φvortex, ΦwakeJet dissipation, boundary layer dissipation, vortex dissipation, and wake dissipation [W]
Subscripts and Superscripts
airframeAirframe
BBody surface
cEngine core
cleanClean inlet condition
coutBoundary condition at core exit
cowlCowl
disDistorted inlet condition
edEdge of the boundary layer
fFan
finBoundary condition at fan face
foutBoundary condition at bypass fan exit
oOuter boundary
outQuasi-one-dimensional nozzle
refReference distortion condition
TETrailing edge
TPTrefftz plane
0Undisturbed freestream
1Inlet
2Fan face
9fBypass nozzle exit
9cCore nozzle exit
Baseline condition
Abbreviations
AVICAviation industry corporation of China
BCBoundary condition
BLIBoundary layer ingestion
BPRBypass ratio [-]
BWBBlended wing body
CFDComputational fluid dynamics
PAIPropulsion–airframe integration
PRTotal pressure ratio [-]
PSCPower saving coefficient [-]
RANSReynolds-averaged Navier–Stokes
SSTShear–stress transport
TRTotal temperature ratio [-]

Appendix A. Reference Distortion State and Effect on Fan Performance

To assess the impact of BLI-type inlet distortion on fan performance, we first analysed the boundary layer characteristics on the rear fuselage of the BWB aircraft, as shown in Figure A1a. The circular cross-sections have the same area as the fan face of the GE-nx engine. The distortion pattern exhibits a bottom-located, bow-shaped region of reduced total pressure, as sketched in Figure A1b. Along the vertical centreline of the fan face, the total-pressure-ratio profile is prescribed by the segmented function:
P R h = 1 P R min h L h + P R min h 0 , h L 1 h h L , 2 R F
where h is the height measured upward from the lowest point of the fan face, hL is the total height of the low–total-pressure zone, RF is the fan-face radius, and PRmin is the minimum total-pressure ratio within the low-pressure zone. The profile extracted from the fuselage trailing-edge flowfield, with PRmin = 0.74 and hL = 0.5RF, was used as the inlet boundary condition in a full-annulus CFD simulation of Rotor67, as illustrated in Figure A1c. This case is referred to as the reference distortion state.
Rotor67 was selected because it is a transonic axial-flow compressor similar to the fan of GE-nx, with comparable blade count and aerodynamic performance characteristics. In the absence of detailed fan geometry and performance data for the GE-nx engine, Rotor67 was scaled and operated under equivalent conditions by applying Mach number similarity in both the diameter and the rotational speed.
Figure A1d shows the variation in the fan temperature ratio TRf with the mass flow rate under both distorted and clean inlet conditions at different engine rotational speeds. BLI-type distortion causes a consistent reduction in TRf, indicating performance degradation and a reduced stall margin.
To quantify this effect, the loss in the fan temperature ratio at peak efficiency due to distortion is defined as ΔTRf. The fan temperature ratio loss factor τf at a given NL is expressed as:
τ f = Δ T R f N L T R f , η max
where TRf,ηmax is the temperature ratio at peak efficiency. The value of τf under the reference distortion state is denoted as τf,ref. Table A1 summarizes the quantitative impact of BLI on TRf under reference distortion, and Figure A2 provides a fitted correlation for the variation in τf,ref with NL, given by:
τ f   , ref N L = 0.003459 × e 0.058904 N L %
In CFD simulations where the distortion pattern or severity deviates from the defined reference state, the actual fan temperature ratio loss factor τf is determined by proportionally scaling the reference loss factor τf,ref according to the computed average total pressure loss ε. Furthermore, since inlet distortion in real flight conditions typically consists of both steady and dynamic components—while the present CFD simulations of the isolated fan account for only the steady-state distortion—a dynamic distortion correction factor fd is introduced. The final loss factor is thus computed as:
τ f N L , ε = f d ε ε ref 0.003459 × e 0.058904 N L %
Based on the experimental results presented in refs. [59,60], the ratio of total distortion to steady-state distortion is typically estimated to range from 1.5 to 2. The dynamic component of inlet distortion is potentially influenced by unsteady turbulence or upstream flow separation. In the present study, however, the BLI configuration is evaluated under cruise conditions, where the upstream flow remains largely attached and free from significant unsteadiness. Therefore, a conservative correction factor of fd = 1.5 is adopted to account for the dynamic effect, and the total temperature ratio of the fan is given by:
T R f = 1 τ f N L , ε T R f , clean
Under the quasi-one-dimensional assumption, the ratio of distorted to clean intake mass flow rates can be expressed as:
m ˙ dis m ˙ clean = p t , dis p t , clean f ( M dis ) f ( M clean )
where the function f(M) is defined as:
f ( M ) = M 1 + γ 1 2 M 2 γ + 1 2 ( γ 1 )
Figure A3 shows the variation in f(M) with the intake mass flow rate under distorted and clean inlet conditions based on CFD results, along with the ratio f ( M dis ) / f ( M clean ) . The case corresponds to the most aerodynamically degraded condition (NL = 100%). The ratio f ( M dis ) / f ( M clean ) remains between 0.99925 and 0.99950, indicating a negligible effect on m ˙ dis / m ˙ clean . Thus, the distorted intake mass flow is approximated as:
m ˙ fin 1 ε m ˙ clean
Figure A1. Quantitative assessment of fan performance degradation under BLI inlet distortion: (a) Total pressure ratio PR contours on the rear fuselage of the BWB aircraft. (b) BLI distortion pattern, where hL is the height of the low–total-pressure zone, RF is the fan-face radius, and pt is total pressure. (c) PR distribution at the fuselage trailing edge, with the minimum total-pressure ratio within the low-pressure zone PRmin = 0.74 and hL = 0.5RF, mapped onto the fan face as the inlet boundary condition for the full-annulus simulations of Rotor67. (d) Variation in the fan temperature ratio TRf under distorted and clean inlet conditions across different engine rotational speeds NL; ΔTRf denotes the loss in the fan temperature ratio at peak efficiency due to distortion, as a function of NL. (e,f) Total pressure and total temperature distributions in the aero section downstream of the fan at NL = 100%. Significant total pressure distortion is observed near the hub region and combined total pressure and total temperature distortion appears near the casing region.
Aerospace 12 00846 g0a1
Table A1. Total temperature ratio loss under the reference distortion state.
NL (%)ΔTRfTRfmaxτf,ref (%)
1000.014671.165541.258
900.007981.118590.713
800.003881.086560.357
700.002371.066660.222
Figure A2. Fitted exponential correlation between the fan temperature ratio loss factor τf,ref and engine rotational speed NL under the reference BLI-type distortion condition.
Aerospace 12 00846 g0a2
Figure A3. Variation in the function f(M) with the intake mass flow rate under distorted and clean inlet conditions at NL = 100%, along with the ratio f ( M dis ) / f ( M clean ) .
Aerospace 12 00846 g0a3

References

  1. Liebeck, R.H. Design of the blended wing body subsonic transport. J. Aircr. 2004, 41, 10–25. [Google Scholar] [CrossRef]
  2. Qin, N.; Vavalle, A.; Le Moigne, A.; Laban, M.; Hackett, K.; Weinerfelt, P. Aerodynamic considerations of blended wing body aircraft. Prog. Aerosp. Sci. 2004, 40, 321–343. [Google Scholar] [CrossRef]
  3. Okonkwo, P.; Smith, H. Review of evolving trends in blended wing body aircraft design. Prog. Aerosp. Sci. 2016, 82, 1–23. [Google Scholar] [CrossRef]
  4. Chen, Z.; Zhang, M.; Chen, Y.; Sang, W.; Tan, Z.; Li, D.; Zhang, B. Assessment on critical technologies for conceptual design of blended-wing-body civil aircraft. Chin. J. Aeronaut. 2019, 32, 1797–1827. [Google Scholar] [CrossRef]
  5. Xin, Z.; Chen, Z.; Gu, W.; Wang, G.; Tan, Z.; Li, D.; Zhang, B. Nacelle-airframe integration design method for blended-wing-body transport with podded engines. Chin. J. Aeronaut. 2019, 32, 1860–1868. [Google Scholar] [CrossRef]
  6. Diamantidou, D.E.; Hosain, M.L.; Kyprianidis, K.G. Recent advances in boundary layer ingestion technology of evolving powertrain systems. Sustainability 2022, 14, 1731. [Google Scholar] [CrossRef]
  7. Moirou, N.G.M.; Sanders, D.S.; Laskaridis, P. Advancements and prospects of boundary layer ingestion propulsion concepts. Prog. Aerosp. Sci. 2023, 138, 100897. [Google Scholar] [CrossRef]
  8. Smith, L.H. Wake ingestion propulsion benefit. J. Propuls. Power 1993, 9, 74–82. [Google Scholar] [CrossRef]
  9. Drela, M. Power balance in aerodynamic flows. AIAA J. 2009, 47, 1761–1771. [Google Scholar] [CrossRef]
  10. Arntz, A.; Atinault, O.; Merlen, A. Exergy-based formulation for aircraft aeropropulsive performance assessment: Theoretical development. AIAA J. 2015, 53, 1627–1639. [Google Scholar] [CrossRef]
  11. Lv, P.; Rao, A.G.; Ragni, D.; Veldhuis, L. Performance analysis of wake and boundary-layer ingestion for aircraft design. J. Aircr. 2016, 53, 1517–1526. [Google Scholar] [CrossRef]
  12. Lv, P.; Zhang, M.; Cao, F.; Lin, D.; Mo, L. 2D numerical study on the flow mechanisms of boundary layer ingestion through power-based analysis. Aerospace 2022, 9, 184. [Google Scholar] [CrossRef]
  13. Mutangara, N.E.; Smith, L.; Craig, K.J.; Sanders, D.S. Potential for energy recovery from boundary-layer ingesting actuator disk propulsion. J. Aircr. 2024, 61, 611–624. [Google Scholar] [CrossRef]
  14. Kim, H.; Felder, J. Control volume analysis of boundary layer ingesting propulsion systems with or without shock wave ahead of the inlet. In Proceedings of the 49th AIAA Aerospace Sciences Meeting Including the New Horizons Forum and Aerospace Exposition, Orlando, FL, USA, 4–7 January 2011; p. 222. [Google Scholar]
  15. Habermann, A.L.; Bijewitz, J.; Seitz, A.; Hornung, M. Performance bookkeeping for aircraft configurations with fuselage wake-filling propulsion integration. CEAS Aeronaut. J. 2019, 11, 529–551. [Google Scholar] [CrossRef]
  16. Hendricks, E.S. A Review of Boundary Layer Ingestion Modeling Approaches for Use in Conceptual Design. NASA/TM—2018-219926; NASA Glenn Research Center: Cleveland, OH, USA, 2018. [Google Scholar]
  17. Menegozzo, L.; Benini, E. Boundary layer ingestion propulsion: A review on numerical modeling. J. Eng. Gas Turbines Power 2020, 142, 120801. [Google Scholar] [CrossRef]
  18. Budziszewski, N.; Friedrichs, J. Modelling of a boundary layer ingesting propulsor. Energies 2018, 11, 708. [Google Scholar] [CrossRef]
  19. Goldberg, C.; Nalianda, D.; MacManus, D.; Pilidis, P.; Felder, J. Method for simulating the performance of a boundary layer ingesting propulsion system at design and off-design. Aerosp. Sci. Technol. 2018, 78, 312–319. [Google Scholar] [CrossRef]
  20. de Vega, L.L.; Dufour, G.; Rosa, N.G. Fully coupled body force–engine performance methodology for boundary layer ingestion. J. Propuls. Power 2021, 37, 192–201. [Google Scholar] [CrossRef]
  21. Hall, D.K.; Lieu, M. Propulsor models for computational analysis of aircraft aerodynamic performance with boundary layer ingestion. In Proceedings of the AIAA Scitech 2021 Forum, Virtual, 11–15 & 19–21 January 2021; American Institute of Aeronautics and Astronautics: Orlando, FL, USA, 2021; p. 0991. [Google Scholar]
  22. Blumenthal, B.T.; Elmiligui, A.A.; Geiselhart, K.A.; Campbell, R.L.; Maughmer, M.D.; Schmitz, S. Computational investigation of a boundary-layer-ingestion propulsion system. J. Aircr. 2018, 55, 1141–1153. [Google Scholar] [CrossRef]
  23. Tse, T.; Hall, C. Aerodynamics and power balance of a distributed aft-fuselage boundary layer ingesting aircraft. Aerospace 2023, 10, 122. [Google Scholar] [CrossRef]
  24. Chen, Z.; Galbraith, M.C.; Spakovszky, Z.S.; Greitzer, E.M.; Sabnis, J.S. Tail-integrated boundary layer ingesting propulsion systems for turbo-electric aircraft. J. Turbomach. 2023, 146, 021004. [Google Scholar] [CrossRef]
  25. Fernández, A.M.; Smith, H. Effect of a fuselage boundary layer ingesting propulsor on airframe forces and moments. Aerosp. Sci. Technol. 2020, 100, 105808. [Google Scholar] [CrossRef]
  26. Machado, L.M.; Chau, T.; Duensing, J. Toward the development of an underwing boundary layer ingesting distributed propulsion system for the SUSAN electrofan. In Proceedings of the AIAA SCITECH 2024 Forum, Orlando, FL, USA, 8–12 January 2024; p. 1327. [Google Scholar]
  27. Seitz, A.; Habermann, A.L.; Peter, F.; Troeltsch, F.; Pardo, A.C.; Corte, B.D.; van Sluis, M.; Goraj, Z.; Kowalski, M.; Zhao, X.; et al. Proof of concept study for fuselage boundary layer ingesting propulsion. Aerospace 2021, 8, 16. [Google Scholar] [CrossRef]
  28. Zhao, X.; Van Hoorn, P.; Yao, H.-D.; Alderman, J. Parameter sensitivity study on inflow distortion of boundary layer ingested turbofans. Aerospace 2022, 9, 426. [Google Scholar] [CrossRef]
  29. Battiston, A.; Magrini, A.; Ponza, R.; Benini, E. Design optimization of rear-fuselage boundary-layer ingestion shrouded propulsor. J. Aircr. 2024, 62, 602–612. [Google Scholar] [CrossRef]
  30. Chau, T.; Anibal, J.L.; Lowe, B.M.; Machado, L.M.; Duensing, J.C. High-fidelity aeropropulsive assessment of distributed electric propulsion and boundary layer ingestion for the SUSAN electrofan. In Proceedings of the AIAA SCITECH 2025 Forum, Orlando, FL, USA, 12–16 January 2025; p. 1275. [Google Scholar]
  31. Chan, D.T.; Jones, G.S.; Langston, S.L.; Kwok, A.K. Experimental investigation of a boundary layer ingesting tailcone thruster configuration at the national transonic facility. In Proceedings of the AIAA Aviation Forum and ASCEND 2024, Orlando, FL, USA, 29 July–2 August 2024; p. 3515. [Google Scholar]
  32. Lengyel-Kampmann, T.; Karboujian, J.; Koc, K.; Schnell, R.; Winkelmann, P. Experimental investigation on a lightweight, efficient, counter-rotating fan with and without boundary layer ingestion. CEAS Aeronaut. J. 2024, 15, 207–226. [Google Scholar] [CrossRef]
  33. Uranga, A.; Drela, M.; Greitzer, E.M.; Hall, D.K.; Titchener, N.A.; Lieu, M.K.; Siu, N.M.; Casses, C.; Huang, A.C.; Gatlin, G.M.; et al. Boundary layer ingestion benefit of the D8 transport aircraft. AIAA J. 2017, 55, 3693–3708. [Google Scholar] [CrossRef]
  34. Uranga, A.; Drela, M.; Hall, D.K.; Greitzer, E.M. Analysis of the aerodynamic benefit from boundary layer ingestion for transport aircraft. AIAA J. 2018, 56, 4271–4281. [Google Scholar] [CrossRef]
  35. Hall, D.K.; Huang, A.C.; Uranga, A.; Greitzer, E.M.; Drela, M.; Sato, S. Boundary layer ingestion propulsion benefit for transport aircraft. J. Propuls. Power 2017, 33, 1118–1129. [Google Scholar] [CrossRef]
  36. Gray, J.S.; Mader, C.A.; Kenway, G.K.W.; Martins, J.R.R.A. Modeling boundary layer ingestion using a coupled aeropropulsive analysis. J. Aircr. 2018, 55, 1191–1199. [Google Scholar] [CrossRef]
  37. Yildirim, A.; Gray, J.S.; Mader, C.A.; Martins, J.R.R.A. Boundary-layer ingestion benefit for the STARC-ABL concept. J. Aircr. 2022, 59, 896–911. [Google Scholar] [CrossRef]
  38. Leifsson, L.; Ko, A.; Mason, W.H.; Schetz, J.A.; Grossman, B.; Haftka, R.T. Multidisciplinary design optimization of blended-wing-body transport aircraft with distributed propulsion. Aerosp. Sci. Technol. 2013, 25, 16–28. [Google Scholar] [CrossRef]
  39. Kim, H.; Liou, M.-S. Flow simulation and optimal shape design of N3-X hybrid wing body configuration using a body force method. Aerosp. Sci. Technol. 2017, 71, 661–674. [Google Scholar] [CrossRef]
  40. Zhao, W.; Zhang, Y.; Wu, J. Energy-based aerodynamic analysis on the blended-wing-body aircraft with boundary layer ingestion. Int. J. Aerosp. Eng. 2022, 2022, 6452099. [Google Scholar] [CrossRef]
  41. Ochs, S.S.; Tillman, G.; Joo, J.; Voytovych, D.M. Computational fluid dynamics-based analysis of boundary layer ingesting propulsion. J. Propuls. Power 2017, 33, 522–530. [Google Scholar] [CrossRef]
  42. Hardin, L.; Tillman, G.; Sharma, O.; Berton, J.; Arend, D. Aircraft system study of boundary layer ingesting propulsion. In Proceedings of the 48th AIAA/ASME/SAE/ASEE Joint Propulsion Conference & Exhibit, Orlando, FL, USA, 30 July–1 August 2012; p. 3993. [Google Scholar]
  43. Li, Z.; Lu, Y.; Pan, T. Conceptual design of layered distributed propulsion system to improve power-saving benefit of boundary-layer ingestion. Aerospace 2024, 11, 141. [Google Scholar] [CrossRef]
  44. Sabo, K.M.; Drela, M. Benefits of boundary layer ingestion propulsion. In Proceedings of the 53rd AIAA Aerospace Sciences Meeting, Orlando, FL, USA, 5–9 January 2015; p. 1667. [Google Scholar]
  45. Carrier, G.; Atinault, O.; Grenon, R.; Verbecke, C. Numerical and experimental aerodynamic investigations of boundary layer ingestion for improving propulsion efficiency of future air transport. In Proceedings of the 31st AIAA Applied Aerodynamics Conference, Orlando, FL, USA, 5–9 January 2013; p. 2406. [Google Scholar]
  46. Bilyaz, I.S.; Percin, Ö.B. Aerodynamic measurements and benefit quantification of a boundary layer ingested propulsion system. In Proceedings of the AIAA SCITECH 2024 Forum, Orlando, FL, USA, 8–12 January 2024; p. 1199. [Google Scholar]
  47. Menter, F.R. Two-equation eddy-viscosity turbulence models for engineering applications. AIAA J. 1994, 32, 1598–1605. [Google Scholar] [CrossRef]
  48. Wang, G.; Zhang, M.; Tao, Y.; Li, J.; Li, D.; Zhang, Y.; Yuan, C.; Sang, W.; Zhang, B. Research on analytical scaling method and scale effects for subscale flight test of blended wing body civil aircraft. Aerosp. Sci. Technol. 2020, 106, 106114. [Google Scholar] [CrossRef]
  49. Niu, X.; Li, J.; Zhang, H.; Yang, Z. Investigation of improvement design on aileron surface flow state of high lift configuration in BWB. Aerospace 2022, 9, 842. [Google Scholar] [CrossRef]
  50. Zhang, Y.; Zhou, J.; Shi, L.; Cui, B. Design optimization for the entire aircraft structure of civil aircraft with blended-wing-body layout. Struct. Multidiscip. Optim. 2024, 67, 106. [Google Scholar] [CrossRef]
  51. Zhang, Y.; Wang, H. Crashworthiness analysis of PRSEUS-based blended-wing-body civil aircraft. Aerosp. Sci. Technol. 2024, 146, 108927. [Google Scholar] [CrossRef]
  52. Strazisar, A.J.; Wood, J.R.; Hathaway, M.D.; Suder, K.L. Laser Anemometer Measurements in a Transonic Axial-Flow Fan Rotor (No. NAS 1.60: 2879); NASA: Washington, DC, USA, 1989. [Google Scholar]
  53. Adjei, R.A.; Fan, C. Multi-objective design optimization of a transonic axial fan stage using sparse active subspaces. Eng. Appl. Comput. Fluid Mech. 2024, 18, 2325488. [Google Scholar] [CrossRef]
  54. Da, L.; Hanan, L.; Zhe, Y.; Tianyu, P.; Hai, D.; Qiushi, L. Optimization of a transonic axial-flow compressor under inlet total pressure distortion to enhance aerodynamic performance. Eng. Appl. Comput. Fluid Mech. 2020, 14, 1002–1022. [Google Scholar] [CrossRef]
  55. Farokhi, S. Aircraft Propulsion, 2nd ed.; John Wiley & Sons: Hoboken, NJ, USA, 2014. [Google Scholar]
  56. Sanders, D.S.; Laskaridis, P. Full-aircraft energy-based force decomposition applied to boundary-layer ingestion. AIAA J. 2020, 58, 4357–4373. [Google Scholar] [CrossRef]
  57. Lovely, D.; Haimes, R. Shock detection from computational fluid dynamics results. In Proceedings of the 14th Computational Fluid Dynamics Conference, Norfolk, VA, USA, 1–5 November 1999; p. 3285. [Google Scholar]
  58. Debogdan, C.E.; Dicus, J.H.; Evans, D.G.; Soeder, R.H. Effect of a 180 Deg-Extent Inlet Pressure Distortion on the Internal Flow Conditions of a TF30-P-3 (No. E-8206); NASA: Washington, DC, USA, 1975. [Google Scholar]
  59. Cheng, B.Q.; Tao, Z.Y.; Li, J. Aerodynamic stability analysis of inlet total pressure distortion for turbofan. J. Propuls. Technol. 2003, 24, 22. [Google Scholar]
  60. Wang, Z.; Shen, X.; Hu, J. Prediction and evaluation of aerodynamic stability of high bypass ratio turbofan engine deployed with thrust reverser. Acta Aeronaut. Astronaut. Sin. 2017, 38, 120192. [Google Scholar]
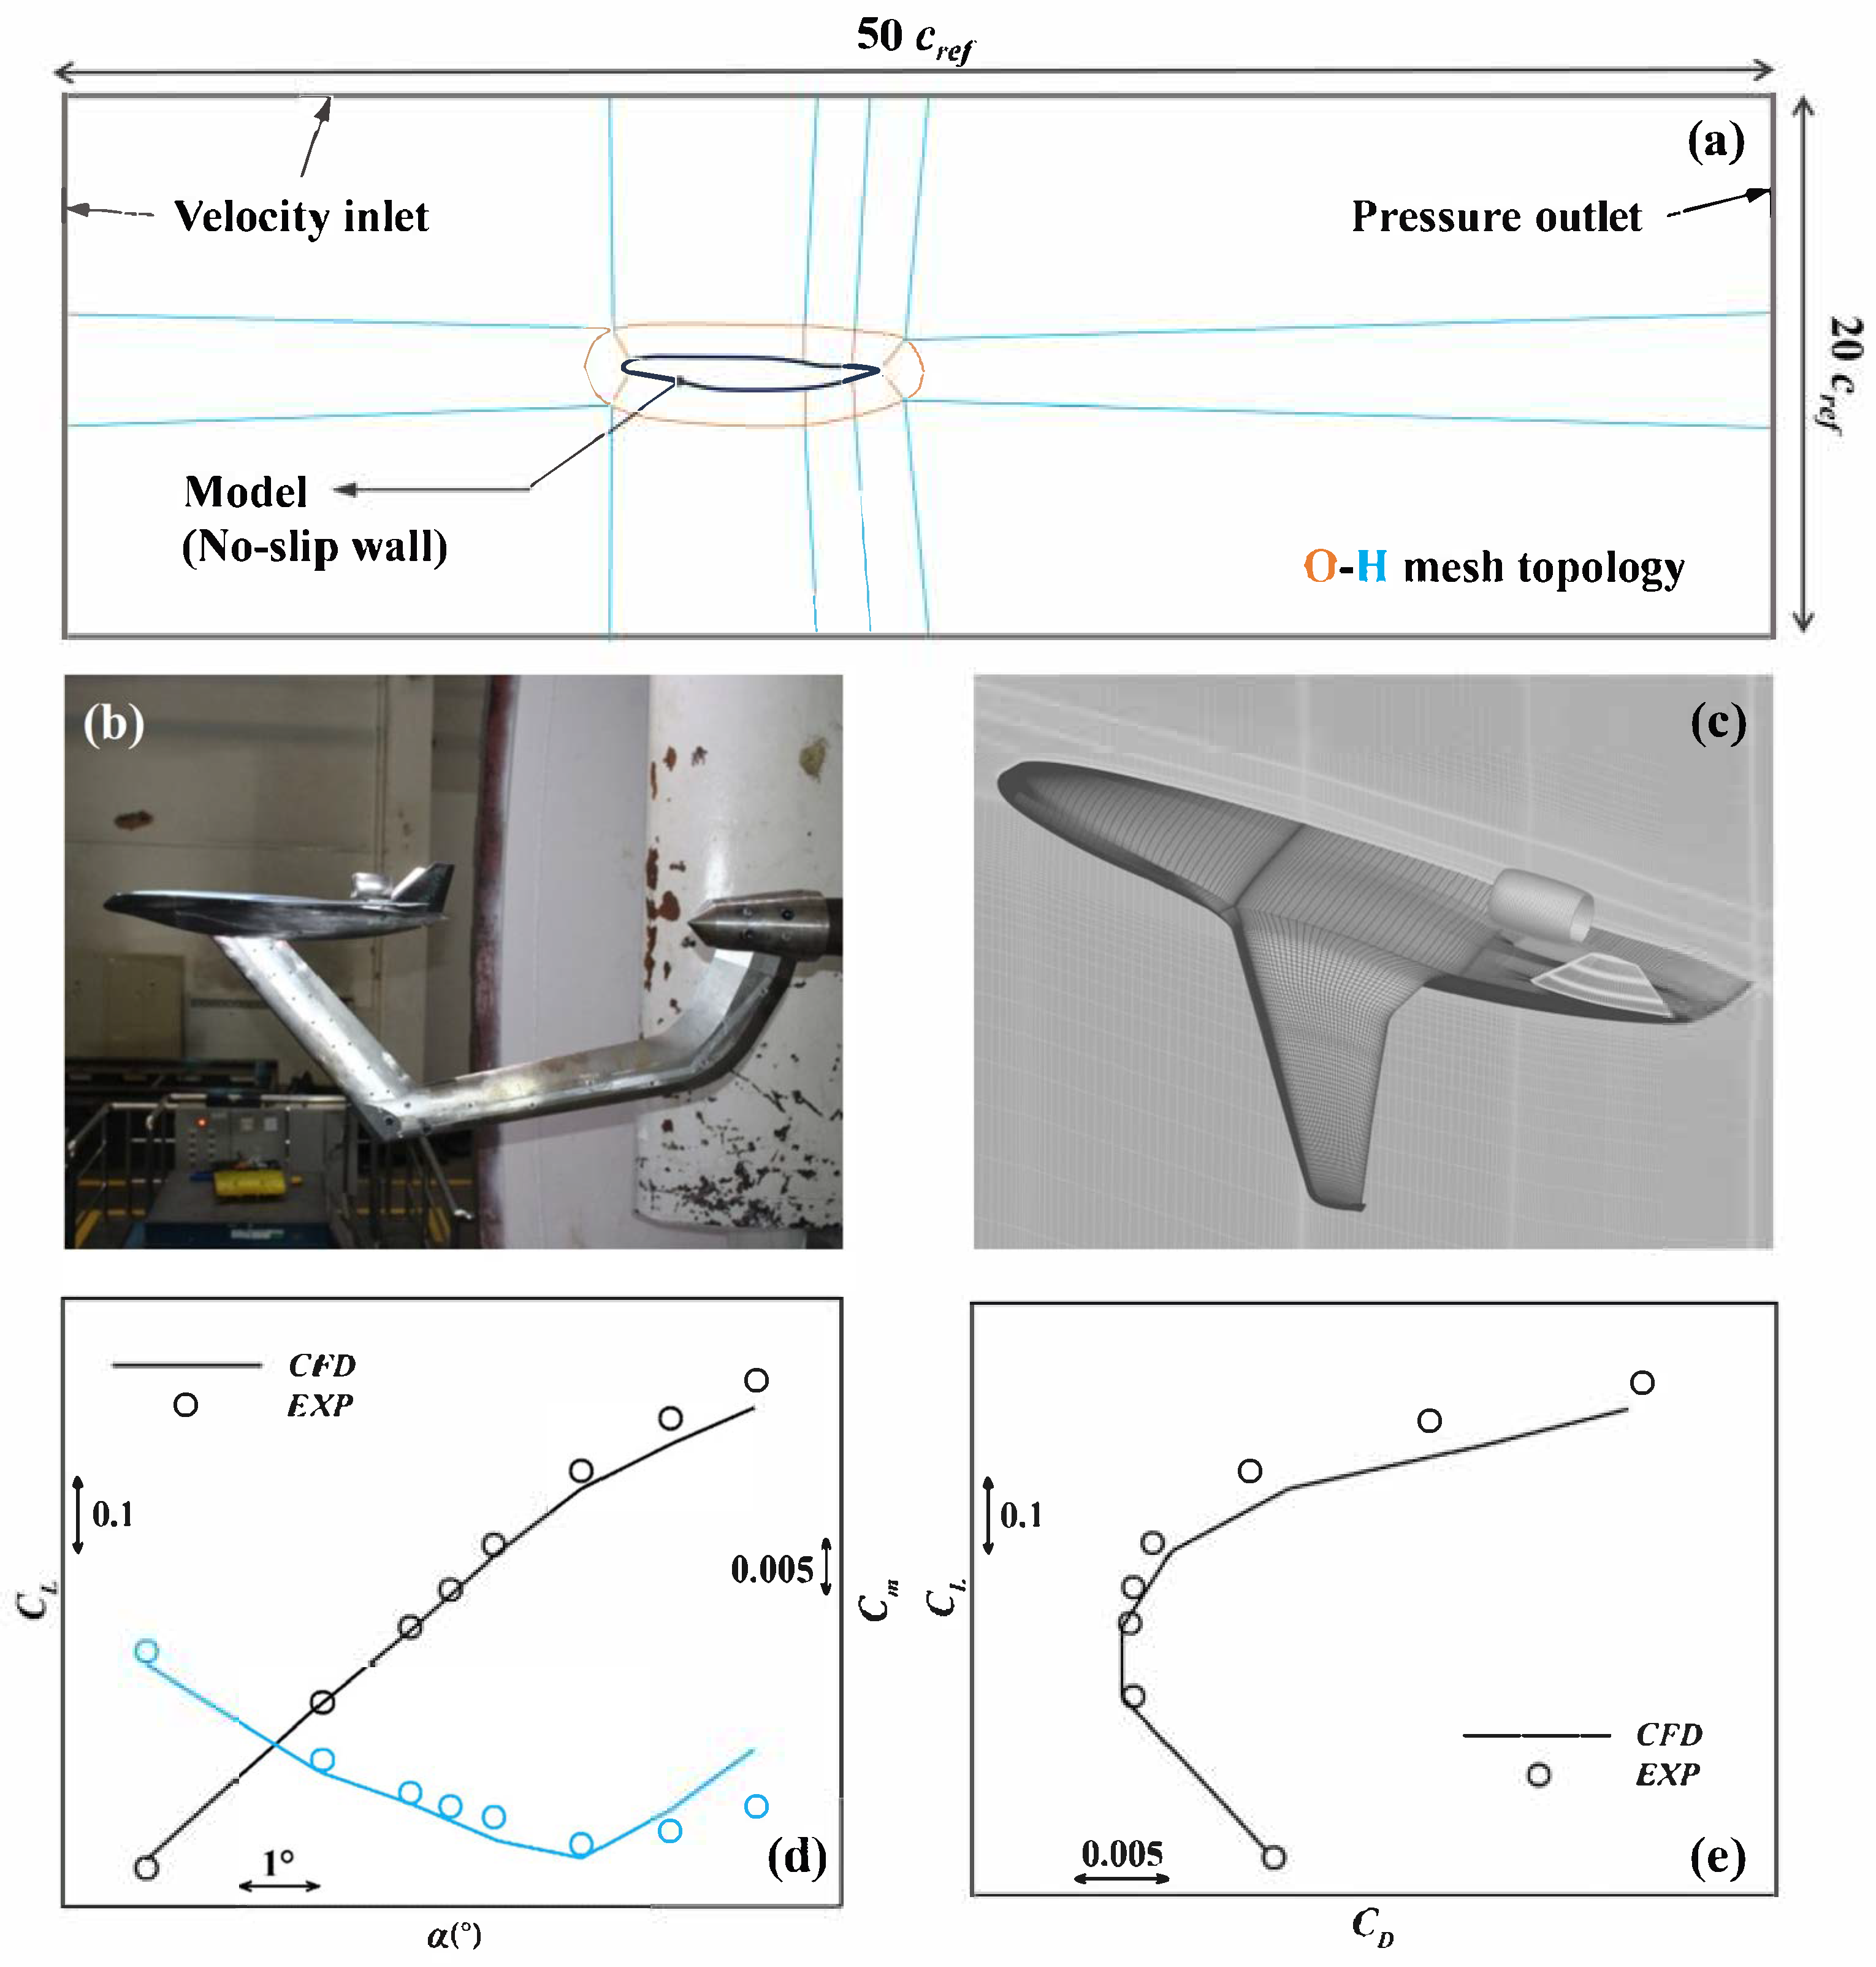
Figure 1. (a) Computational domain, boundary conditions, and O–H mesh topology; cref denotes the model’s reference chord length. (b) A 1/72-scale wind tunnel model of the NPU-300 installed in the FL-3 transonic tunnel; the test Mach number was 0.85. (c) Corresponding computational mesh. (d) Comparison of lift and pitching moment coefficients between simulation and experiment; black curves/symbols denote lift and blue denote pitching moment. (e) Comparison of drag coefficient.
Aerospace 12 00846 g001
Figure 2. (a) Global and (b,c) local views of the computational mesh for NASA Rotor-67, containing approximately 1.12 × 10⁷ elements. Comparison of numerical and experimental results for NASA Rotor-67: (d) isentropic efficiency versus dimensionless mass flow rate; (e) total pressure ratio versus dimensionless mass flow rate.
Aerospace 12 00846 g002
Figure 3. Definition of the streamtube control volume used for BLI drag analysis. The control volume is bounded by the far-field upstream section, and downstream by the engine exhaust plane. The lateral boundaries of the control volume include the surface interacting with the airframe and the internal surface of the engine duct. The boundary surfaces are colour-coded, with matching labels indicating the applied forces on each surface. The total thrust is denoted by FG; Dram, Dadd, and Dduct represent the ram drag, additional drag, and internal drag, respectively. DBLI denotes the idealized BLI drag imposed by the airframe on the ingested flow. Station 0 denotes the undisturbed freestream, 1 denotes the engine inlet, 2 denotes the fan face, and 9f and 9c denote the bypass and core nozzle exits, respectively.
Aerospace 12 00846 g003
Figure 4. Definition of the wall-based control volume used for BLI drag analysis. The boundary surfaces are colour-coded, with matching labels indicating the applied forces on each surface. The forces shown include the internal thrust Fduct, nacelle cowl drag Dcowl, scrubbing drag Dscrub, airframe drag due to the capture streamtube Dairframe_BLI, and drag from the remaining airframe surfaces Dairframe_rest.
Aerospace 12 00846 g004
Figure 5. Fluid control volume for the power balance analysis method. S o , S B , and S TP denote the outer boundary, body surface, and Trefftz-plane boundary, respectively. The internal dissipation terms include boundary layer dissipation Φsurf, wake dissipation Φwake, and shock wave dissipation Θwave. The downstream dissipation terms include jet dissipation Φjet and vortex dissipation Φvortex.
Aerospace 12 00846 g005
Figure 6. Iterative procedure for determining engine boundary conditions (BC) in the BLI layout. The framework adjusts the inlet mass flow rate m ˙ fin , fan temperature ratio TRf, and core temperature ratio TRc based on the total pressure loss ε. The BCs are applied at three locations: the fan face (fin), the bypass fan exit (fout), and the core exit (cout). Subscripts f and c denote the fan and core, respectively. NL and α represent the engine rotational speed and angle of attack, respectively. Under clean inlet conditions, m ˙ fin , TRf, and TRc are all treated as functions of NL. Bypass ratio (BPR) is expressed as a function of TRf to reflect the effect of ε.
Aerospace 12 00846 g006
Figure 7. Computational model for the BWB configuration with a separate turbofan engine: (a) Geometric model of the BWB airframe and isolated turbofan engine. (b) Side view showing the relative position between the airframe and engine; Δz indicates their vertical offset. (ce) Multiblock structured mesh for the coupled system, including close-up views of the engine inlet (d) and nozzle (e). (f,g) The computational domain is divided into an airframe domain and an engine domain. Interface 1 and 2 define the downstream boundary of the airframe domain and the upstream boundary of the engine domain, respectively.
Aerospace 12 00846 g007
Figure 8. Mach number contours on the engine symmetry plane for different vertical positions: (a) Δz = 3 m; (b) Δz = 2 m; (c) Δz = 1 m; (d) Δz = 0.
Aerospace 12 00846 g008
Figure 9. Variations in the lift coefficient CL (a), drag coefficient CD (b), and lift-to-drag ratio K (c) as functions of the dimensionless mass flow rate m ˙ 1 / ρ 0 V 0 S ref at different vertical positions. The cruise point (CX = 0) is marked, and the arrows indicate the downward movement of the engine. Sref denotes the total projected reference area of the BWB airframe.
Aerospace 12 00846 g009
Figure 10. Variations in the drag coeficient CD (a), additional drag coefficient CDadd (b), airframe pressure drag coefficient CDp,airframe (c), and cowl pressure drag coefficient CDp,cowl (d) as functions of the dimensionless mass flow rate m ˙ 1 / ρ 0 V 0 S ref at different vertical positions. The cruise point (CX = 0) is marked, and the arrows indicate the downward movement of the engine. Sref denotes the total projected reference area of the BWB airframe.
Aerospace 12 00846 g010
Figure 11. Changes in the drag components relative to the Δz = 4 m condition during cruising. ΔCD is the change in drag coefficients. The total drag reduction in BLI states is mainly driven by the decrease in additional drag.
Aerospace 12 00846 g011
Figure 12. Distributions of D add / A and total pressure pt along the intersection line between the engine symmetry plane and Section 1 (b). The lines indicate D add / A and the symbols denote total pressure. h/RA1 denotes the relative height, and all the x-coordinate variables are nondimensionalized using the far-field total pressure pt0. Subfigure (a) shows the location of the monitoring line and the definition of geometric parameters.
Aerospace 12 00846 g012
Figure 13. Pressure distributions under cruise conditions: (b) on the airframe airfoil upstream of the engine, and (cf) on the cowl at different circumferential positions. Cp* denotes the critical pressure coefficient used to identify supersonic regions. Subfigure (a) shows the locations of the corresponding cross-sections, and θ is the circumferential angle.
Aerospace 12 00846 g013
Figure 14. (a) Relationship between the axial force coefficient CX and the engine mechanical power coefficient CPK; (b) Variation in the power saving coefficient (PSC) calculated relative to the Δz = 4 m configuration with engine position at cruise. The shaded area represents the BLI stage.
Aerospace 12 00846 g014
Figure 15. Relationship between the boundary layer dissipation coefficients and axial force coefficient CX: (a) for the airframe (CΦsurf,airframe), and (b) for the cowl (CΦsurf,cowl).
Aerospace 12 00846 g015
Figure 16. Velocity profiles and distributions of kinetic energy defect per unit length kTE along the monitoring line at the cowl trailing edge under cruise conditions. The circles depict the engine schematics (colors denote different Δz). The short pink line segments indicate the monitoring lines at the nacelle trailing edge. The grey region indicates the integral difference in kTE, quantifying the kinetic energy defect K T E variation due to the effect of airframe wake. (a) Comparison between Δz = 1 m and Δz = 4 m; (b) comparison between Δz = 0 and Δz = 4 m.
Aerospace 12 00846 g016
Figure 17. (a) Schematic of the wake dissipation integration region. (bd) Spanwise distribution of the trailing-edge kinetic energy deposited E ˙ TE for different engine positions under cruise conditions: (b) Δz = 4 m; (c) Δz = 1 m; (d) Δz = 0. The circles depict the engine schematics (colors denote different Δz). The shaded area represents the airframe wake dissipation Φwake,airframe, excluding the portion of the wake ingested into the engine.
Aerospace 12 00846 g017
Figure 18. Relationship between the wake dissipation coefficients and axial force coefficient CX: (a) for the airframe (CΦwake,airframe), and (b) for the cowl (CΦwake,cowl).
Aerospace 12 00846 g018
Figure 19. Velocity profiles and distributions of kinetic energy deposited per unit length e ˙ TE along the monitoring line at the cowl trailing edge under cruise conditions. The circles depict the engine schematics (colors denote different Δz). The short pink line segments indicate the monitoring lines at the nacelle trailing edge. The grey region indicates the integral difference in e ˙ TE , quantifying the kinetic energy deposited E ˙ TE variation due to the effect of airframe wake. (a) Comparison between Δz = 1 m and Δz = 4 m; (b) comparison between Δz = 0 and Δz = 4 m.
Aerospace 12 00846 g019
Figure 20. (a) Variation in the jet dissipation coefficient CΦjet and (b) propulsion efficiency ηP with the axial force coefficient CX.
Aerospace 12 00846 g020
Figure 21. Variation in CΦjet and −(CFGCDram) with engine position under the cruise conditions. The shaded area represents the BLI stage.
Aerospace 12 00846 g021
Figure 22. (a) Variation in the vortex dissipation coefficient CΦvortex with the streamwise position of the Trefftz plane (TP). (b) Variation in CΦvortex with the axial force coefficient CX. dTP is the streamwise distance from the engine tail cone to the TP, and cref is the reference chord length of the BWB airframe based on the full projected area.
Aerospace 12 00846 g022
Figure 23. Surface pressure distributions and shock wave regions for two engine positions and rotational speeds: (a) Δz = 4 m and NL = 82%; (b) Δz = 1 m and NL = 94%.
Aerospace 12 00846 g023
Figure 24. (a) Variation in the shock wave dissipation coefficient CΘwave with the axial force coefficient CX. (b) Variation in at an altitude with the engine position. ΔCΘwave denotes the change in CΘwave due to an increase in engine rotational speed NL from 82% to 94%. The shaded area represents the BLI stage.
Aerospace 12 00846 g024
Figure 25. Engine shock wave regions under different combinations of vertical positions Δz and engine rotational speeds NL: Subfigures (ac) correspond to NL = 82%, and (df) to NL = 94%, with Δz = 4 m, 1 m, and 0, respectively.
Aerospace 12 00846 g025
Figure 26. Contribution of each dissipation component to the PSC benefit relative to the Δz = 4 m state. The total pie area represents the gross benefit, the central grid-filled circle indicates the losses, and the annular area corresponds to the net benefit, subdivided by the contributions of each dissipation type.
Aerospace 12 00846 g026
Table 1. Comparison with representative prior BLI studies.
WorkFocusKey Findings
Smith [8]Theoretical analysis using the energy-based method20% gains under idealized conditions (high propulsor loading, high wake form factor, flattened wake profiles)
Sabo & Drela [44]Experiment with blunt body and downstream fan>26% fan power saving, validating the theoretical benefit by Smith [8]
Uranga et al. [33,34]Experimental and numerical analysis on D88.2% PSC gain with >60% from jet and >30% from boundary layer dissipation due to reduced wetted area
Yildirim et al. [37]Optimization of aft-mounted BLI layout>10% PSC gain by ingesting a large portion of the fuselage boundary layer
Zhao et al. [40]Energy-based analysis on BWB with integrated BLI engine5% power saving under current design; >18% theoretical PSC with full fuselage boundary layer ingestion
Present studyMomentum- and energy-based analyses of non-integrated BWB–turbofan configuration1.7–2.6 lift-to-drag gain; 7.1–8.3% PSC with >60% from jet and ~20% from wake dissipation. Despite nonnegligible PAI and BLI trade-offs, PAI contributes >2% PSC for non-BLI states
Disclaimer/Publisher’s Note: The statements, opinions and data contained in all publications are solely those of the individual author(s) and contributor(s) and not of MDPI and/or the editor(s). MDPI and/or the editor(s) disclaim responsibility for any injury to people or property resulting from any ideas, methods, instructions or products referred to in the content.