Article

Experimental Investigation of Hydrogen Peroxide and Nitrous Oxide in a 1-Newton Catalyst-Based Monopropellant Research Thruster †

1
German Aerospace Center (DLR), Institute of Space Propulsion, 74239 Hardthausen am Kocher, Germany
2
European Space Research and Technology Centre (ESA-ESTEC), 2200 Noordwijk, The Netherlands
*
Author to whom correspondence should be addressed.
This paper is extended version of Merz, F.; Hörger, T.; Steelant, J.; Lauck, F.; Kirchberger, C. Results of Esa-Greenraim test Activities Part 1: Experimental Investigation of a 1 Newton Hydrogen Peroxide Monopropellant Research Thruster. In Proceedings of the Space Propulsion 2024, 20–23 May 2024, Glasgow, UK. Also of paper Hörger, T.; Merz, F.; Steelant, J.; Werling, L.; Kirchberger, C. Result of Esa-Greenraim Test Activities Part 2: Experimental Investigation of a 1 Newton Nitrous Oxide Monopropellant Research Thruster. In Proceedings of the Space Propulsion 2024, 20–23 May 2024, Glasgow, UK.
These authors contributed equally to this work.
Aerospace 2025, 12(9), 835; https://doi.org/10.3390/aerospace12090835 (registering DOI)
Submission received: 25 July 2025 / Revised: 5 September 2025 / Accepted: 10 September 2025 / Published: 17 September 2025

Abstract

As part of the GreenRAIM activity of the European Space Agency (ESA), an extensive test campaign involving various monopropellants was undertaken. In this work, design and test results of an additively manufactured 1-Newton monopropellant thruster are shown. The detailed design of the thruster and the experimental setup are presented. The first part of the test campaign was conducted with 98 wt.% hydrogen peroxide as the propellant and a commercially available Pt/Al2O3 catalyst. The second part was carried out with the same thruster but using nitrous oxide as the propellant and an iridium-based catalyst. The test data acquired was used to validate a comprehensive, generic model for monopropellant thrusters within the simulation software EcosimPro/ESPSS v3.7, which was developed within the activity.

1. Introduction

Propulsion systems play an important role in every spacecraft. The tasks of the propulsion system can be divided into two categories: Firstly, inserting the device into orbit, and secondly, controlling the attitude and orientation of the device. These two tasks are usually performed by two separate subsystems known as the main engine (ME) and the reaction control system (RCS). If the spacecraft uses chemical propellants, a distinction is usually made between a bipropellant and a monopropellant system. Depending on the requirements, different architectures are pursued, which either provide only a bipropellant or monopropellant system, or even use both [1]. The advantage of a monopropellant system is its simplicity. As the name suggests, only one propellant component is used, which is usually catalytically decomposed in an engine, and the resulting gases are expelled through a nozzle, generating thrust. In terms of I sp , these systems have a lower performance compared to bipropellant systems. When these propulsion systems are used in satellites, probes, or landers, it is usually desirable to have good storability of the propellants. Since the 1960s, hydrazine has mainly been used to power monopropellant systems. Due to its hypergolic property with Nitrogen TetrOxide (NTO), hydrazine or its derivatives (usually MonoMethylHydrazine (MMH)) can also be found in many bipropellant systems. However, as good as hydrazine’s performance is, its components are highly toxic, carcinogenic, corrosive, and dangerous for the environment [2]. Numerous alternative propellants, referred to as “green propellants,” are being studied. While the term “green” is vaguely defined, the aim is to develop propellants that are less toxic, non-carcinogenic, and cost-effective while still maintaining comparable performance levels to hydrazine. Among the most promising alternative monopropellants are ADN (Ammonium Dinitramide)-based propellants, HAN (Hydroxylammonium Nitrate)-based propellants, highly concentrated hydrogen peroxide (high-test peroxide, HTP), nitrous oxide as a monopropellant (or premixed with a fuel), and nitromethane. Detailed information on the specific propellants can be found in several overview papers on green propellants [3,4,5].
The ESA activity GreenRAIM aims to implement a universal simulation model for catalytic monopropellant thrusters, enhancing understanding of pressure dynamics, thermal behavior, and finite rate chemistry. Enhanced modelling capabilities of all kinds of green monopropellants are needed in the future. Therefore, validation experiments with H2O2, LMP-103S, and N2O are conducted during the activity. This paper presents the results of the hydrogen peroxide and nitrous oxide tests. The acquired test data will be used to validate the simulation models that are implemented in EcosimPro/ESPSS.
Since 2017, research in the field of hydrogen peroxide has been conducted at the German Aerospace Center (DLR) in Lampoldshausen [6]. A 1-Newton hydrogen peroxide monopropellant thruster was successfully fired together with ArianeGroup at the high-altitude test bench M11.2 [7,8]. A sputtered iridium catalyst was developed together with Hochschule Aschaffenburg [9]. The catalyst was tested in a 5-Newton monopropellant thruster under high-altitude conditions. Current research with hydrogen peroxide focuses on the development of hypergolic fuels. Therefore, DLR has identified a number of thiocyanate-based ionic liquids (ILs). The most promising and already demonstrated combinations are HIP_11 [10,11] and HIM_30 [12].
Due to its simple handling and high specific impulse, nitrous oxide has gained attention in start-ups and academic research as a potential green propellant. At room temperature, nitrous oxide is a colorless gas with a slightly sweet smell [13]. It is typically stored as a liquefied gas. In the space sector, N2O can be used in various ways: It can serve as an oxidizer in hybrid rocket engines [14] or in liquid or gaseous feed bipropellant systems [15]. Furthermore, nitrous oxide can be used as a monopropellant [16], with the use of a heated catalyst, or in cold gas drives [17]. When exposed to a catalyst, it exothermally decomposes into N2 and O2 [4]. In this way, it can be used as a gas generator [18] or as an ignitor for bipropellant systems. In combination with bipropellant thrusters, its application as a monopropellant also enables multi-mode propulsion. Moreover, N2O has already been used as fuel for a Resistojet engine on the small satellite UoSAT-12 [19]. Furthermore, nitrous oxide can be used in monopropellant-like fuel blends [20]. Due to its high vapor pressure (50.8 bar at 20 °C) [13], nitrous oxide enables the design of self-pressurized systems, offering a potential weight and system complexity advantage compared to the use of external pressurization. A significant amount of research and development into nitrous oxide bipropellants and monopropellant fuel blends has been conducted at DLR [21]. A fuel blend called premixed HyNOx, a mixture of N2O and C2H6/C2H4, was developed. The propellant blend offers bipropellant-like performance (specific impulse I sp 300 s ) while using a simplified, self-pressurized fluid system. Additionally, the components are relatively inexpensive and non-toxic. In contrast to these benefits, the main challenges in using HyNOx are high combustion temperatures, high catalyst pre-heating temperatures, and the risk of flame flashbacks across the injection system in the tank structure [6,21,22]. To avoid these flashbacks, flame arresters were successfully developed and tested in experimental thrusters at DLR [23]. In the frame of ESA HPPD activity, studies on propellant miscibility, thermal stability, adiabatic compression behavior, and material compatibility were conducted [22]. Successful thruster tests were described under vacuum and atmospheric conditions with different mixture ratios and chamber pressures. Combustion efficiencies of up to 95.6% were achieved [22]. Pulse-mode and long-time operation were demonstrated, and it was shown that the premixed propellant mixture can also be used as a coolant for regenerative cooling [21].

2. Hydrogen Peroxide as Monopropellant

Hydrogen peroxide (H2O2) is a chemical compound consisting of hydrogen and oxygen. As a low-concentrated aqueous solution, it is mainly used as an oxidizing agent for the bleaching of paper and textiles or as an agent for water treatment [24]. It has been used in high concentrations as an oxidizer in propellant combinations for almost 90 years. The first application in an engine dates back to 1938. At that time, 80 wt.% hydrogen peroxide was used as a monopropellant by means of the catalyst permanganate [25]. As hydrazine and its derivatives became increasingly important in the 1960s, hydrogen peroxide faded into the background [2]. Hydrazine achieves a high specific impulse I sp of 230 s , with catalysts such as Shell405 and HKC-12GA. However, due to its high toxicity and carcinogenicity, a replacement has been sought for years [2]. Today, hydrogen peroxide is considered one of the most promising green rocket fuels in monopropellant systems [26], as its exothermic decomposition releases only water, steam, and oxygen:
2 H 2 O 2   ( l ) 2 H 2 O   ( g ) + O 2
The decomposition of highly concentrated hydrogen peroxide, also known as high-test peroxide (HTP), is achieved either by use of a catalytic material or thermally at temperatures over 400 °C. The latter is less known and is currently being investigated [27]. The 98 wt.% hydrogen peroxide version has a significantly high density of 1444 k g m 3 . While the specific impulse is 20% lower (189 s ) than the specific impulse of hydrazine (230 s ), the density specific impulse ρ I sp is about 17% higher. Calculations were carried out with NASA-CEA [28] at 10 bar for chamber pressure and a nozzle expansion ratio of ϵ = 81 . The most significant technological challenge in the realization of hydrogen peroxide monopropellant thrusters is the development of effective, reliable, and durable catalytic beds providing fast and reproducible performance that is insensitive to poisoning by stabilizers and impurities contained in the propellant [29]. In recent years, intensive research has been conducted to investigate the catalytic decomposition of H2O2 [29,30,31]. The conventional catalyst for the decomposition of H2O2 is metallic silver. However, its relatively low melting point temperature of 961 °C makes it unsuitable for decomposing 98 wt.% HTP, as the adiabatic decomposition temperature is at 950 °C. Alternatively, other precious metals such as Pt, Pd, Rh, Ru, and Ir are potential catalysts and have been studied in detail, as well as manganes oxides. A final consensus on the most effective metal for decomposing HTP has yet to be reached. According to Casu et al. [32], the most effective combination currently was found to be 5 wt.% Pt/Al2O3, a ceramic microporous pellet. The Institute of Aviation (IoA) developed a metal foam based on NiCrAl/MnxOy that performs similarly to the platinum alumina pellets [31].

3. Nitrous Oxide as Monopropellant

Nitrous oxide, N2O, is a widely used chemical compound. In mixture with oxygen, it is known as laughing gas and applied as an anesthetic for surgery and dentistry. In the food industry, it is used to neutralize bacteria growth in food, and in car racing, it is used to increase the engine’s power output [33]. The theoretical specific impulse I sp (all values calculated with NASA CEA [34], frozen at throat, pressure p = 10 bar ; expansion ratio ε = 81 ) of N2O monopropellant is I sp = 202 s ; therefore, it is not as high as that of hydrazine ( I sp = 235 s ) but is higher than monopropellant H2O2 ( I sp = 189 s ). Furthermore, it has a wider range of possible storage temperatures than hydrazine. N2O can be stored as a liquid at room temperature and a moderately high pressure of about 50 bar [33]. However, its storage density is about 25% lower than that of hydrazine.
Its high vapor pressure makes self-pressurization of the tanks possible. In this case, the nitrous oxide is stored in two phases in the tank. The propellant is drained from the gaseous or liquid phase, depending on the design of the draining system. The remaining volume is filled with vaporized liquid. Through the enthalpy of vaporization, the propellant inside the tanks cools down while draining propellant from the tank. As a result, the pressure inside the tank decreases. Tank pressure control, and therefore also thrust control, could be achieved via temperature control of the tank. By controlling the tank temperature, a constant thrust level through blowdown could be maintained.
Accompanying the positive effects of self-pressurization, heavier tanks suitable for the high pressures are required to store the propellant [35]. Alternatively, COPV (composite overwrapped pressure vessels) can be used to decrease the tank’s structural weight. Due to the propellant’s ability to “self-pressurize,” a straightforward feed system configuration without pumps or helium pressurization may be possible. Tank and feedline materials can be chosen from a range of materials, like stainless steel or Inconel. However, for seals in valves or pressure reducers, the choice of materials is limited [22].
It should be mentioned that the greenhouse potential of nitrous oxide is approximately 300 times higher than that of CO2. Additionally, the residence time of nitrous oxide in the atmosphere is about 120 years, which is comparably long [36]. Therefore, the release of large amounts of unburned nitrous oxide into Earth’s atmosphere has a potential impact on global warming.
In a monopropellant system, nitrous oxide is decomposed under the release of heat, mainly into nitrogen and oxygen, with small amounts of nitric oxide [37]. Due to the high amount of activation energy needed to initiate this reaction, a catalyst is used to reduce the activation energy. Without a catalyst, the decomposition does not start below 850 K at appreciable rates [37]. The global decomposition reaction of N2O is given in Equation (2) [37]:
N 2 O N 2 + 1 2 O 2 Δ H R 0 = 82 kJ / mol
The reaction rate of this reaction is relatively low compared to other unimolecular exothermic decomposition reactions, such as the decomposition of H2O2 [37]. One reason for the slow reaction rate is identified as the required change in the multiplicity of the atomic oxygen in the given reaction, from triplet to singlet state, which is quantum-mechanically forbidden [37]. Below approximately 40 bar, the reaction follows second-order kinetics, while above 40 bar, it follows first-order kinetics [37].
Karabeyoglu shows that for a pressure of 40 bar, no substantial decomposition takes place below 577 °C [37], which makes nitrous oxide a comparably safe and thermally insensitive oxidizer. The adiabatic flame temperature is 1640 °C [38], which is substantially higher than that of hydrogen peroxide, which is 950 °C [39]. The high adiabatic flame temperature demands special materials for both the thrust chamber and the catalyst itself.
Through the use of catalysts, the required activation energy for initiating the decomposition reaction can be reduced. In the literature, values around 250 °C are given as lower limits for successful decomposition [16]. Different noble metals, including Rh, Ru, Pd, Pt, Au, and Ir, are described in the literature as possible catalyst materials for nitrous oxide [40].
Typically, two mechanisms are involved in noble metal catalytic N2O decomposition: the Kondratenko mechanism and the Hinshelwood mechanism [41]. The Kondratenko mechanism [42] describes that, first, N2O is decomposed into N2, and oxygen is adsorbed on the surface. Subsequently, the adsorbed oxygen reacts with N2O, forming N2 and O2. The Hinshelwood mechanism [43] suggests that O2 is produced from adsorbed oxygen. Here, N2O is adsorbed on the noble metal surface. The adsorbed N2O is decomposed into N2 and adsorbed oxygen, which is then combined to form O2. The catalytic activity of noble metal catalysts may be inhibited by the presence of impurity gases [41]. The following order of reactivity was found for different noble metals by Doi et al. [44]:
Rh/Al2O3 > Pd/Al2O3 > Pt/Al2O3
Further, it was found by Pachatouridou et al. that Ir/Al2O3 performs better than Pt/Al2O3 and Pd/Al2O3 [45].
The experiments with nitrous oxide were performed using the H-KC12GA catalyst with 32 wt.% Iridium on Al2O3 support from Heraeus [46]. The particle size is stated to be between 0.6 and 0.7 mm. The thruster itself was originally designed for use with hydrogen peroxide. For testing with hydrogen peroxide, a 5 wt.% platinum catalyst on Al2O3 support was used in the same thruster [47].
The characteristic velocity c * and the specific impulse I sp are widely used parameters to evaluate the performance of a rocket propellant. For NASA CEA [34], assuming a frozen reaction at the throat, p = 10 bar chamber pressure, T = 20 °C, and ε = 81 , a theoretical c * of c * = 1105.4 m / s and the already mentioned I sp = 202 s are calculated for operation with nitrous oxide.

4. Design of the Monopropellant Thruster “MoCa”

The “MoCa” thruster is a Monopropellant thruster with a Catalytic bed. The thruster’s design was based on the specifications of the ESA GreenRAIM project and the literature review that was carried out previously in the project [3]. Within the project, it is intended to provide important experimental data required for the subsequent simulation of the decomposition processes in EcosimPro/ESPSS v3.7. The design of the thruster allows for a comparison of injection, decomposition processes, temperature, and pressure profiles, as well as efficiencies in the simulation. In order to compare the results with existing data from a 1-Newton hydrogen peroxide thruster and the test being conducted in parallel with a 1-Newton LMP-103S thruster, a thrust target of 1 N was set. It was inspired by the work of numerous studies of similarly sized thrusters [7,8,29,48,49,50,51,52]. The final design is shown in Figure 1.
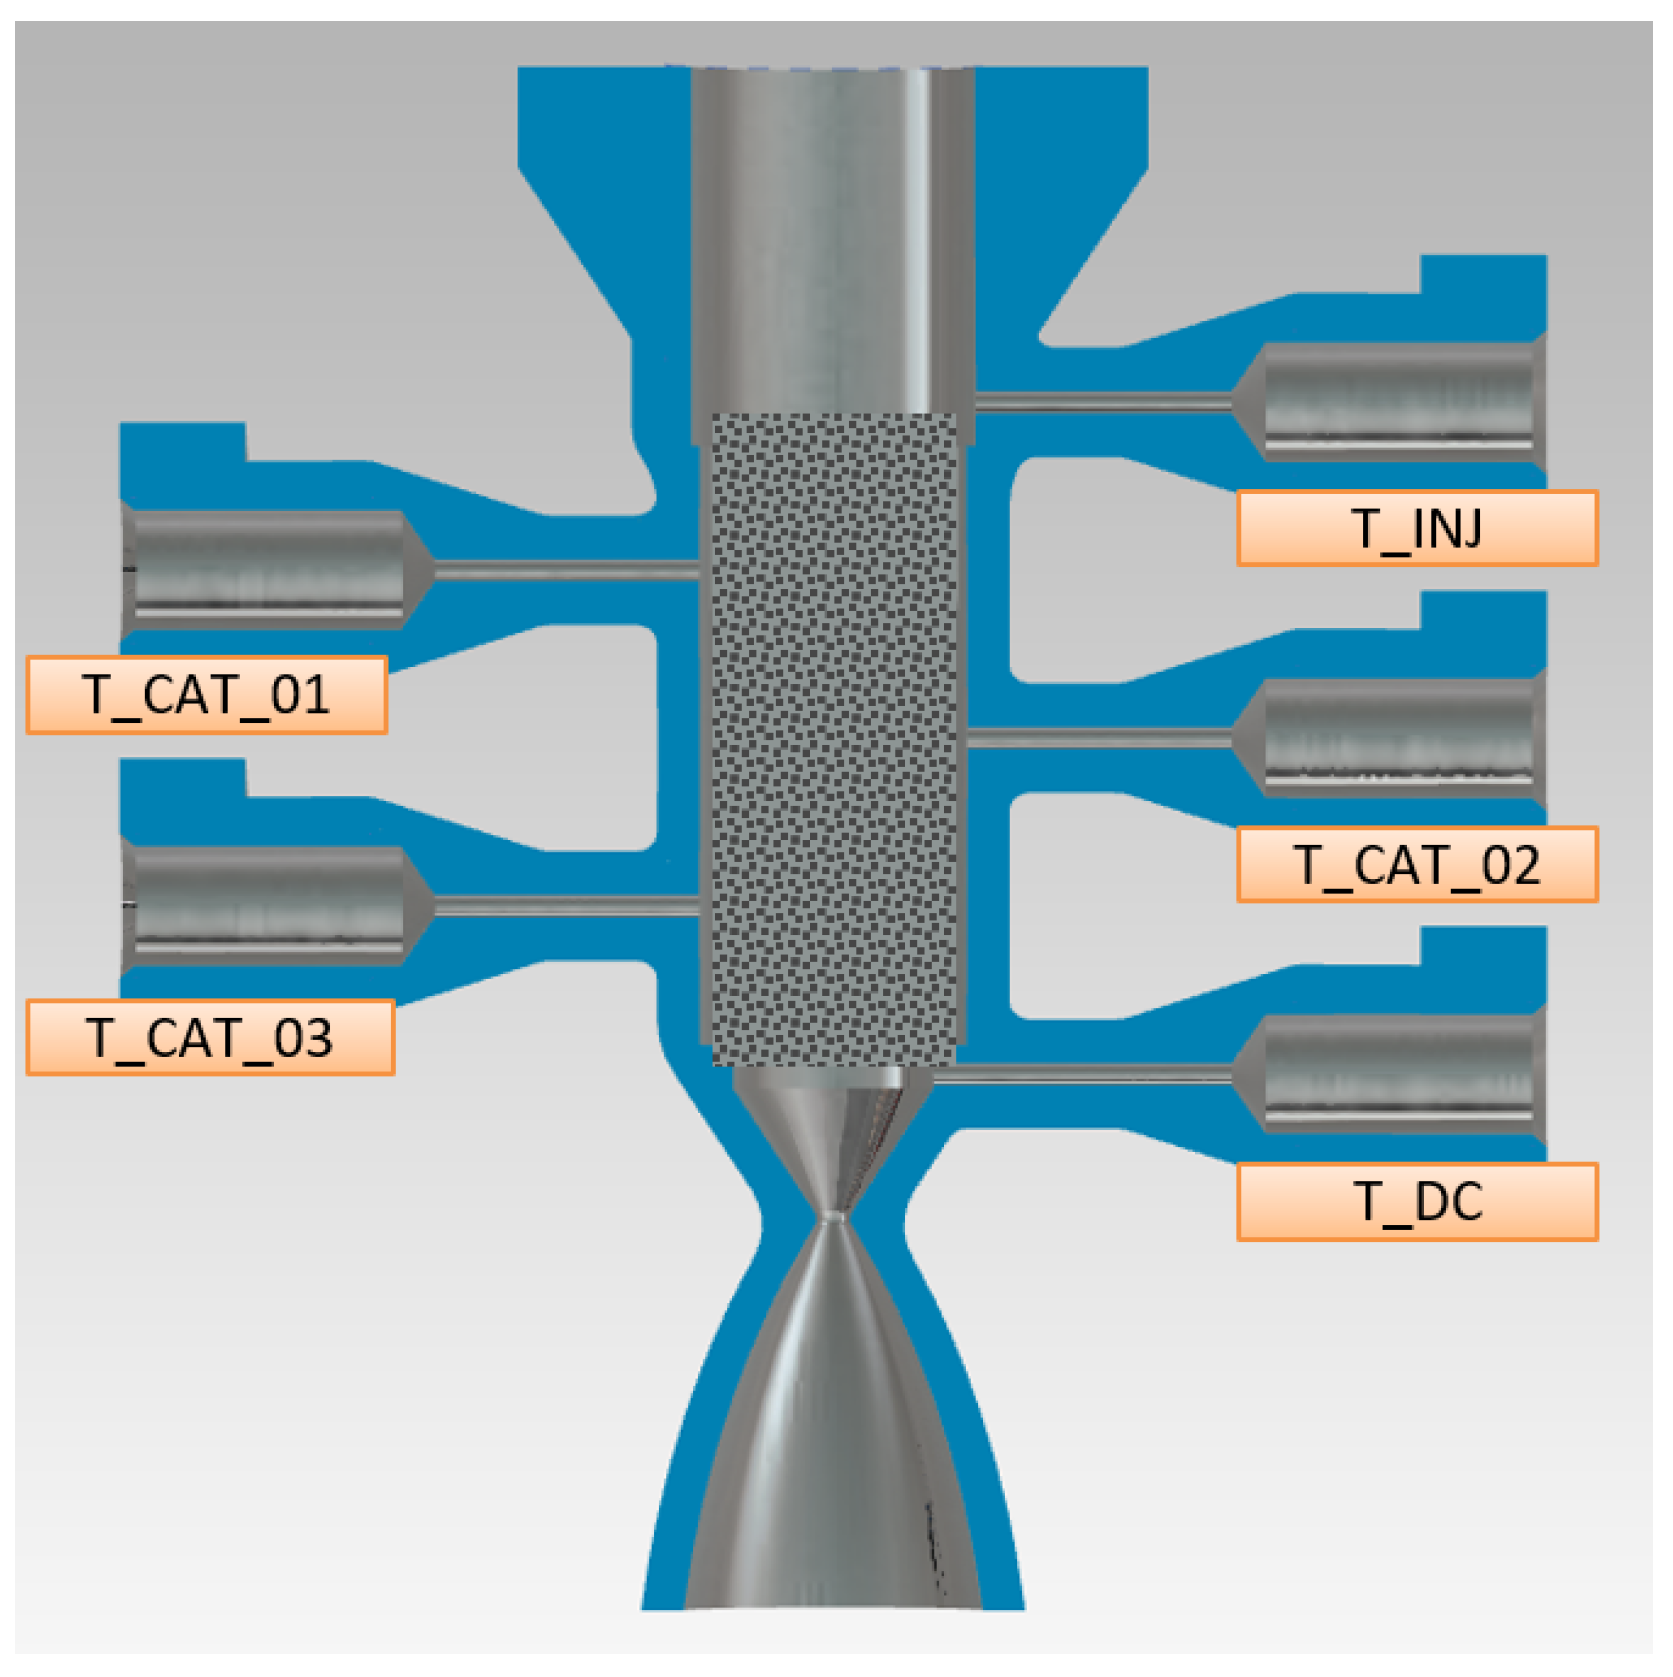
To compare with simulations in EcosimPro, static pressure measurements were provided downstream of the injector ( P INJ ) and within the chamber ( P DC ). These strategically placed pressure sensors enable the monitoring of pressure differences both in the injector and in the catalyst bed. To effectively track the progress and extent of decomposition, multiple temperature measurements are placed directly in the center of the decomposition chamber along the direction of flow. The first measuring point is put next to the injector pressure sensor ( P INJ ) and named T INJ . Downstream, three measurements are taken in the catalyst bed ( T CAT _ 01 , T CAT _ 02 , and T CAT _ 03 ). Like at the injector, the chamber’s temperature is taken at the same geometrical point as the chamber pressure ( P DC ) and named T DC . The measuring ports need to be as small as possible to minimize the gas volume in front of the pressure sensors and to minimize the capacity’s cooling effect. The five temperature ports and their locations are displayed in Figure 2.
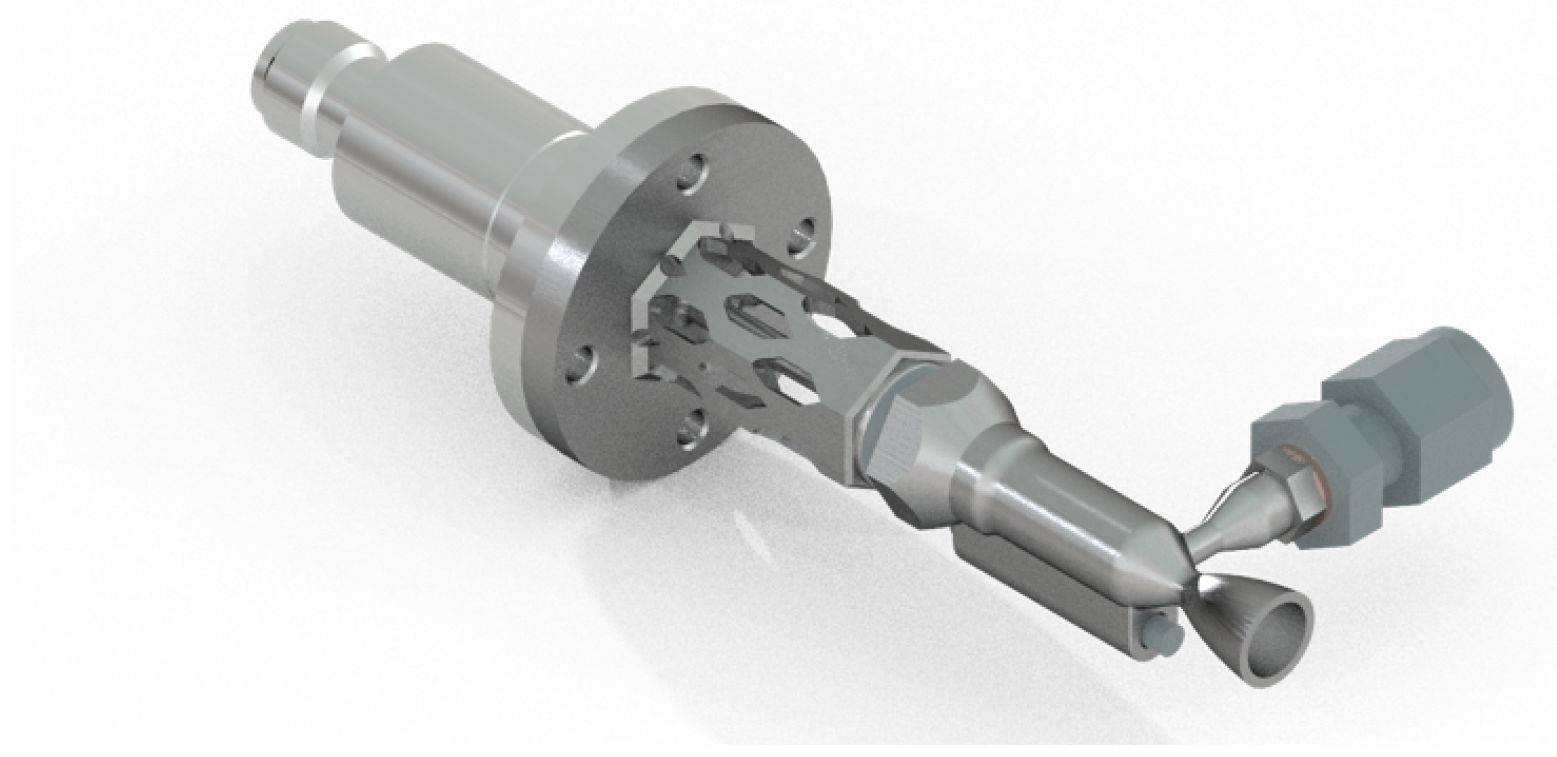
A thermal standoff was designed to protect the valve from the heat released by the decomposition process. It was additive manufactured from stainless-steel 316L. The thermal standoff is connected to the thruster by use of a thread to reduce the mass that is inherent with a flange. This design allows for changing the catalyst between tests or to investigate degradation afterwards. The hexagon shape was designed to withstand the torque introduced by the tools to seal it. The full setup is shown in Figure 3. A compartment for a heater along the chamber walls was needed to investigate the effect of an already pre-heated catalyst bed compared to a cold catalyst bed.
To attach all the sensors and the heater, enable easy access to the chamber’s catalyst bed, and minimize the volume of the measuring ports, additive manufacturing was chosen. Since hydrogen peroxide’s compatibility with other materials is limited and the decomposition temperature is lower than 950 °C, stainless steel (316L) was selected. Materials such as Inconel 718 and similar nickel-based alloys, which have a higher application temperature, have also been considered. A compatibility study is currently being carried out within DLR. A first hot fire test with IN718 as a chamber material has already been conducted [12]. Due to manufacturing reasons and uncertainties with material compatibility, stainless steel was chosen instead of nickel-based alloys.
To achieve a thrust of 1 N at 10 bar with 98 wt.% hydrogen peroxide, the oxidator mass flow rate was calculated via the specific impulse ( I sp ) of Equation (3). The I sp was calculated with NASA CEA frozen at the throat at
I sp = F g 0 · m ˙ = 189   s ,
with an expansion ratio (throat area A t to exit area A e ) of ϵ = 81 . A mass flow rate of m ˙ = 0.5 g s−1 results from the calculation. The theoretical characteristic velocity c * theo = 1019.2 m s−1 is calculated with NASA CEA as well. The experimental c * exp can be calculated by the chamber pressure P C , the mass flow rate m ˙ , and the throat area of the nozzle A t :
c * exp = p C · A t m ˙
The nozzle throat area has a resulting diameter of d t = 0.8 mm. The combustion efficiency η c * is the ratio of c * exp to c * theo :
η c * = c * exp c * theo
The characteristic velocity c * depends on the propellant, the injector design, the mixture ratio, the chamber pressure, and the combustion chamber size [53]. In contrast to the specific impulse I sp , c * is independent of the nozzle shape and expansion ratio. By means of c * , different propellant and injector combinations, as well as combustion chamber designs, can be compared to each other [53]. A reduction in η c * is caused by heat losses to the chamber walls and incomplete decomposition, as well as boundary layer effects [53].
The characteristic length L * was set to be 1 m , calculated using Equation (6)
L * = V chamber A t = 1   m .
The catalyst chosen for operation with hydrogen peroxide is the pellet-shaped 5 wt.% Pt/Al2O3 manufactured and sold by Hereaus. A total amount of 0.43   g fits in the chamber. Figure 2 shows the CAD model cross-section with the five measurement ports for the thermocouples and their positions along the chamber. Three measurements were carried out directly in the center of the catalyst bed.
It was found in the literature that a sufficient cat-bed loading ( C B L ) ranges from 7–28 kg s−1 m−2 [51,52]. The cat-bed loading describes the mass flow rate m ˙ over the cat-bed’s cross-sectional area ( A catbed ):
C B L = m ˙ A catbed = 15   k g   s 1   m 2
The diameter of the catalytic bed and, therefore, also the resulting cross-sectional area A catbed are a result of the chosen L * and the ratio of the length and diameter that was chosen for the catalytic bed.
To investigate the influence of the measuring ports (dead volume and heat capacity), a thruster with only the P DC port (shown in Figure 3) was tested as well.
The heater and the valve are commercial, off-the-shelf parts. The heater is a Watlow Firerod electrical cartridge heater with a maximum power of 40 W at 48 V , the valve being a Parker Series 9 pulse valve with an orifice of 1 mm. It is powered by 24 V DC.

5. Experimental Test Setup

5.1. Facility and P&ID

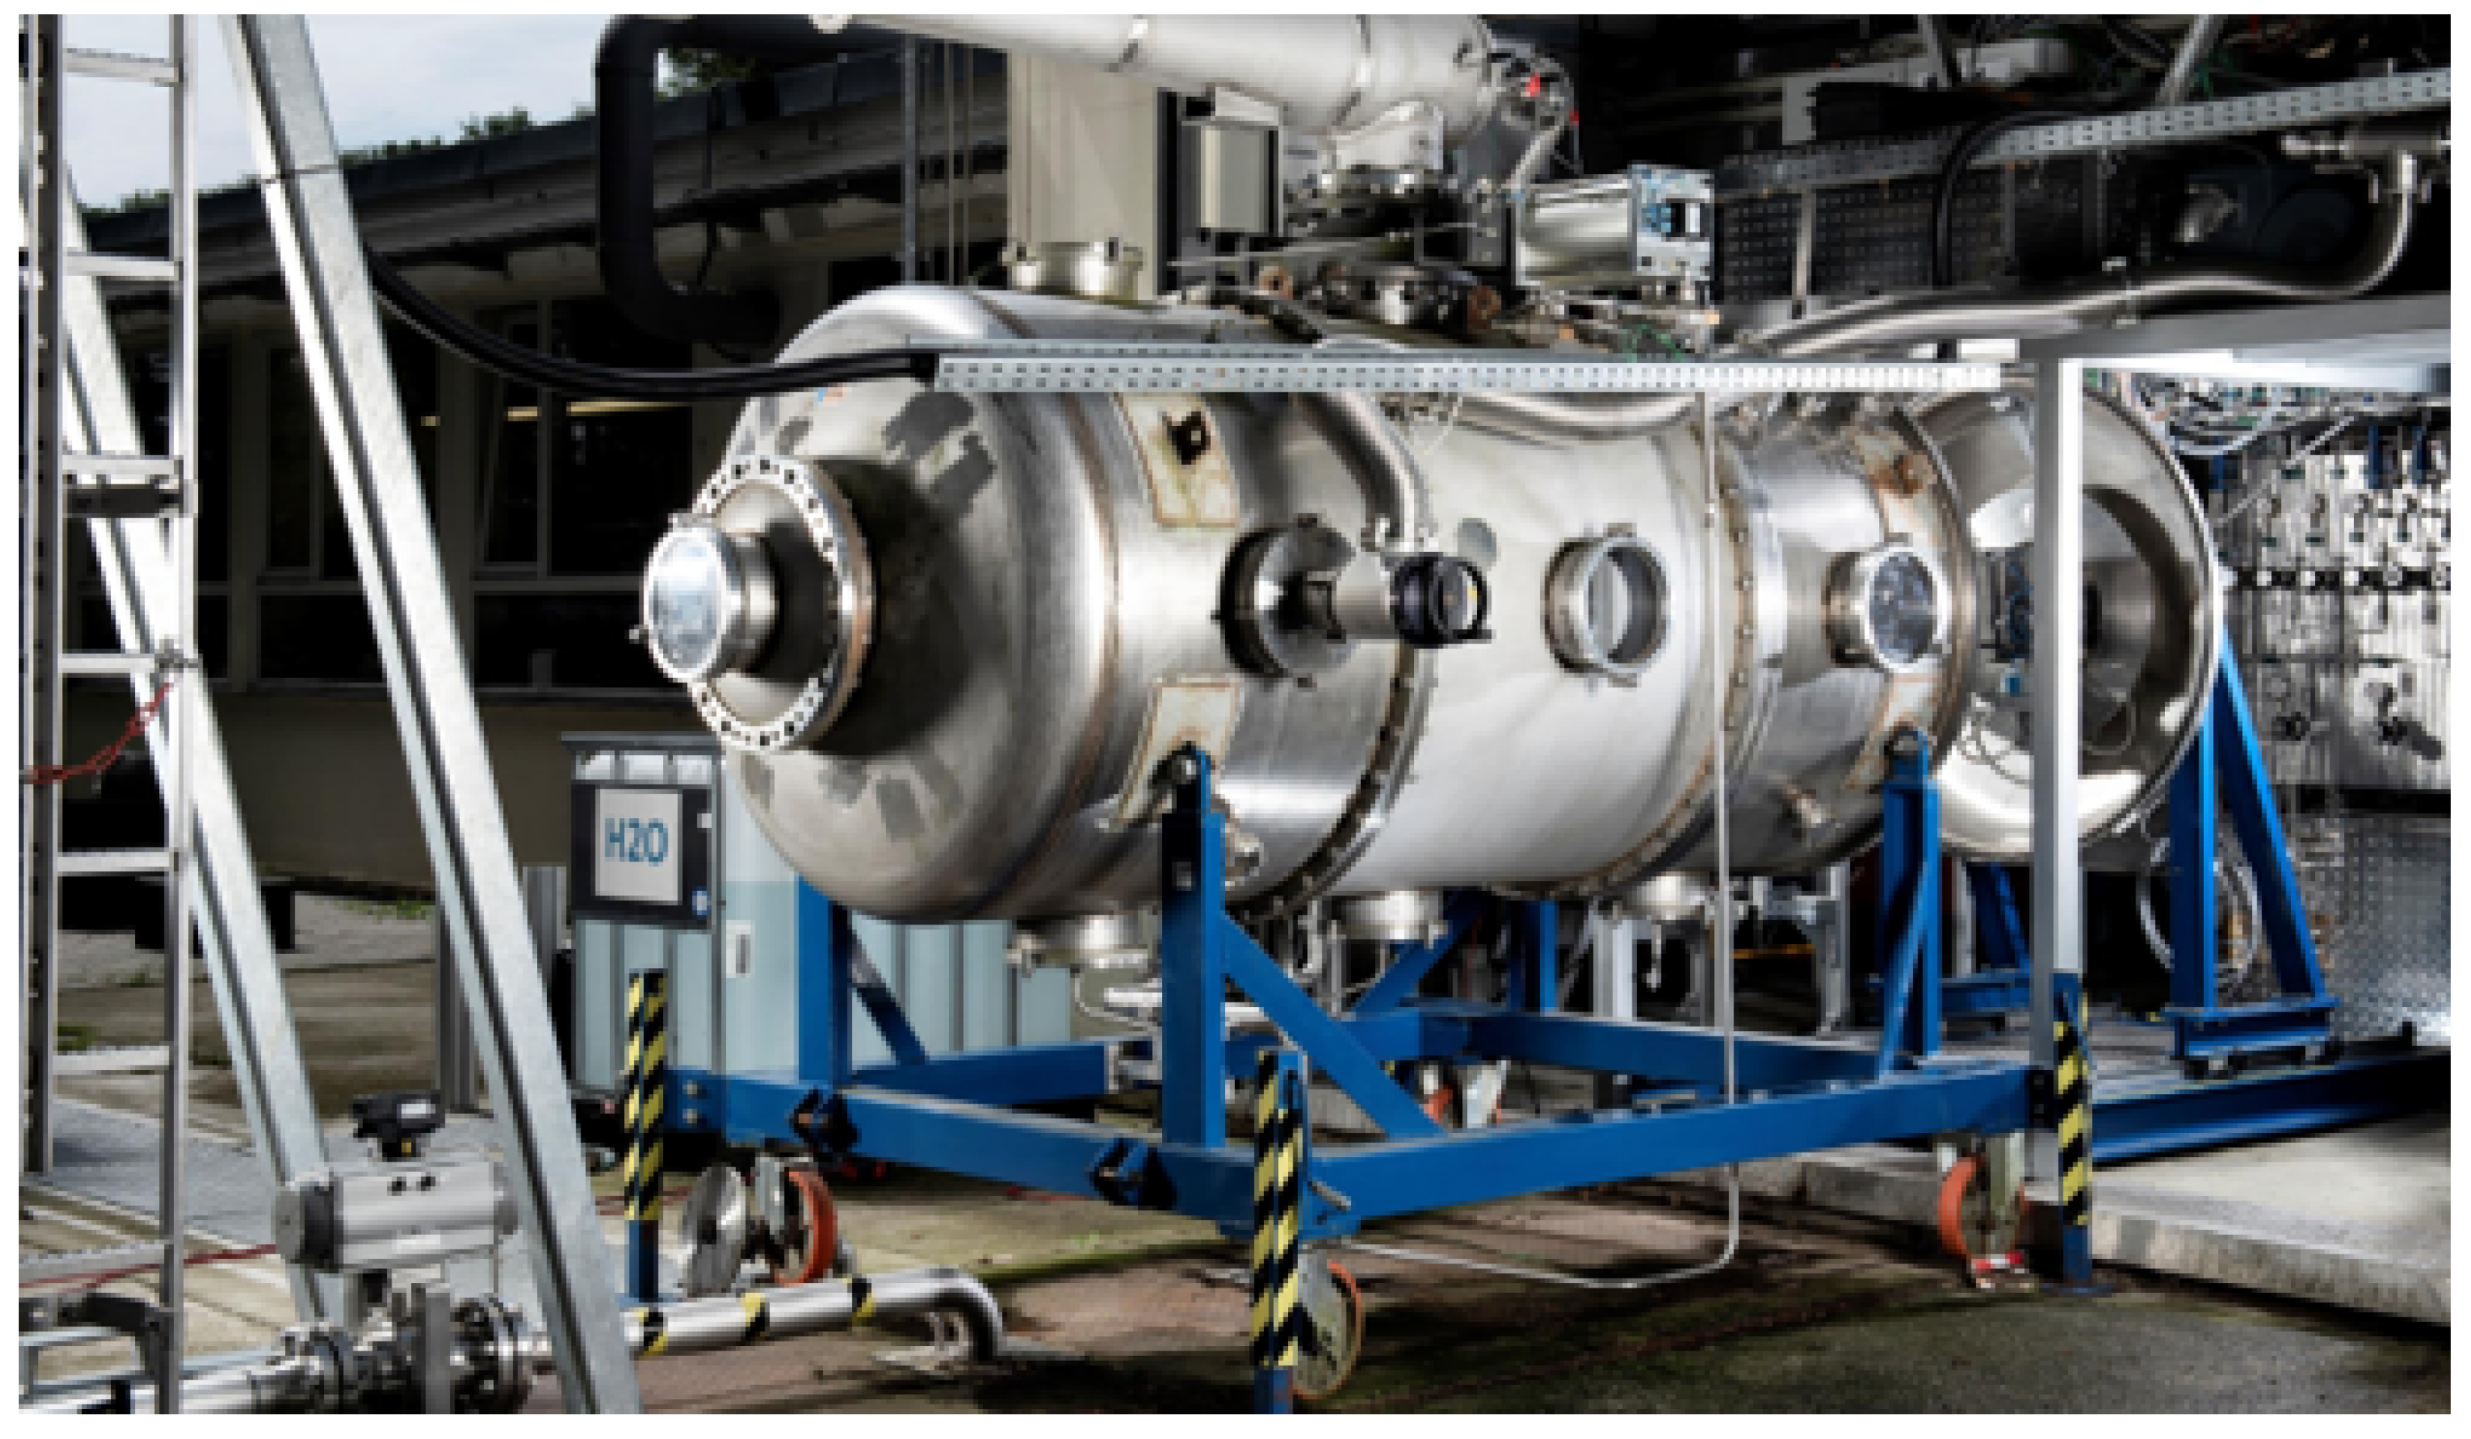
The hot firing tests were conducted at the M11.2 high-altitude test facility at the German Aerospace Center (DLR) in Lampoldshausen. A 4 m 3 vacuum chamber (shown in Figure 4) provides an initial pressure P VAC of below 3 m bar. The pressure in the vacuum chamber is monitored by a CMR 363 sensor, provided by Pfeiffer Vacuum GmbH, 35614 Aßlar, Germany The M11.2 uses the data acquisition system ADwin Pro II from Jäger Messtechnik. The signals of the pressure transducers are amplified by Dewetron single-channel measuring amplifiers of type DEWE-30-16 DAQP-STG (0.1–1000 mV/V), provided by DEWETRON GmbH, 8074 Grambach, Austria [54]. The test bench was operated with an in-house developed control program.
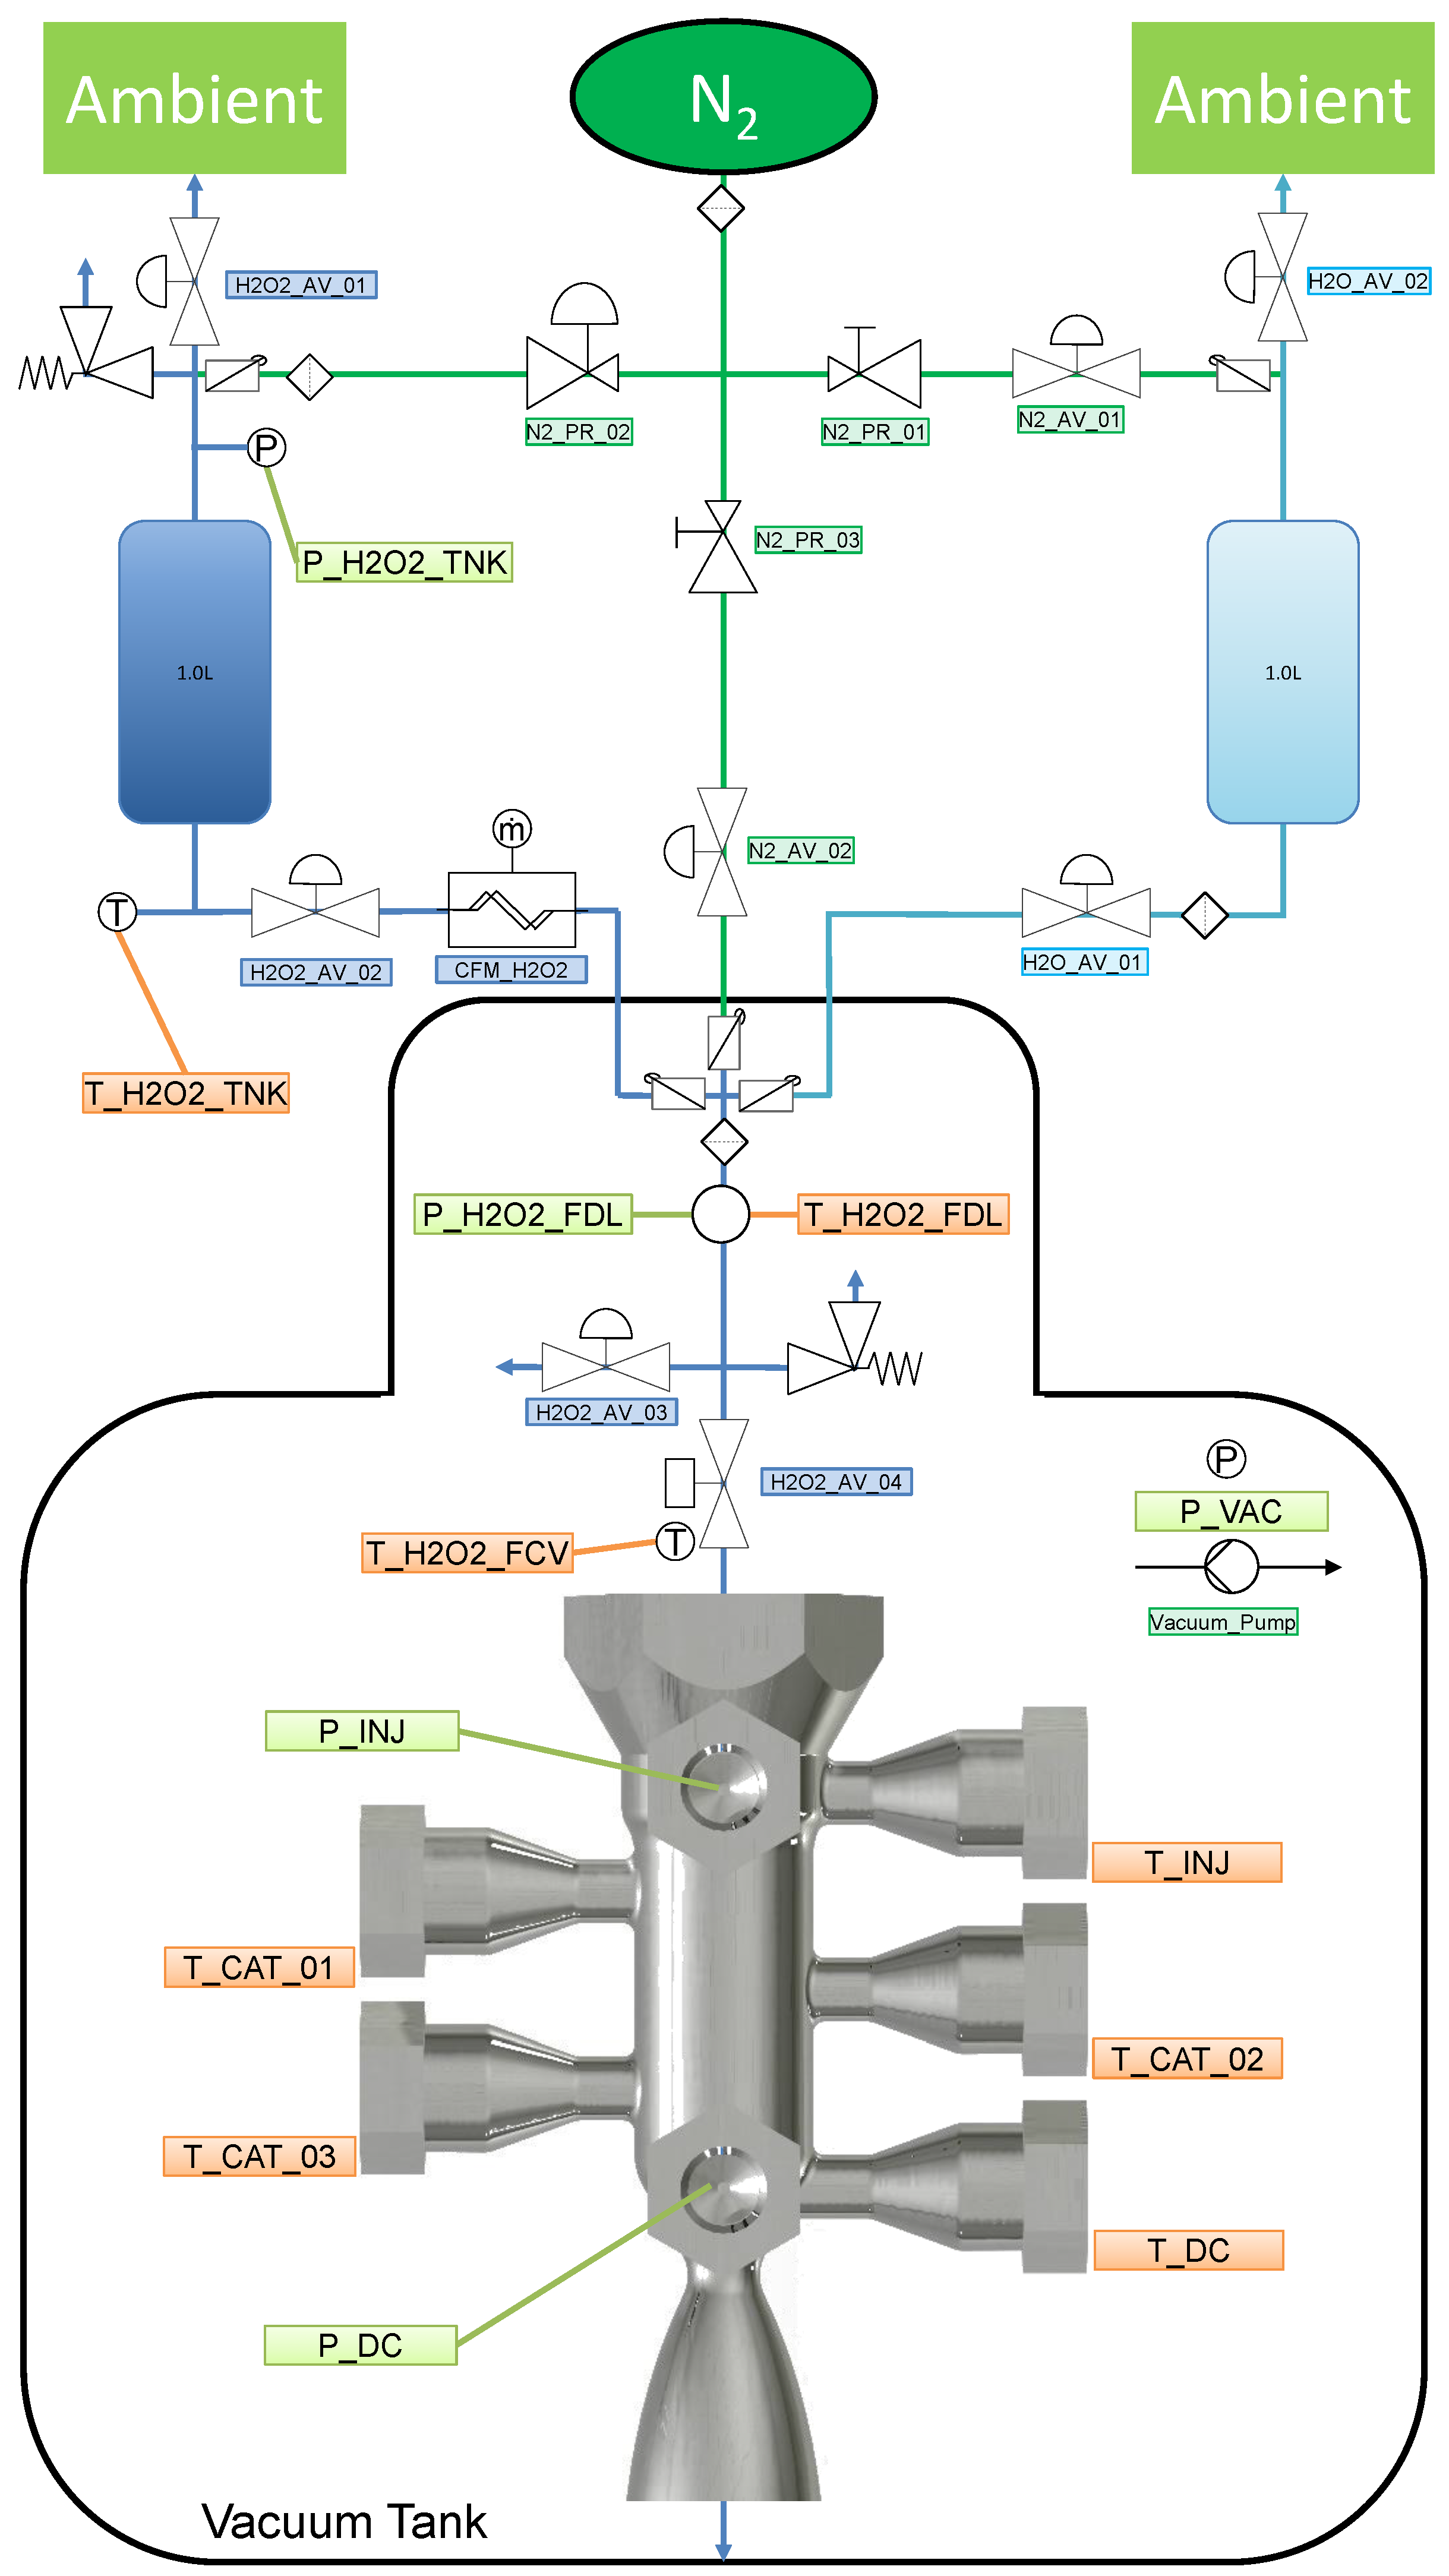
The majority of the components utilized are off-the-shelf parts. The tubing, which is shown in Figure 5, consists of stainless steel (1.4404 and 1.4571) with an outer diameter of 6 m m and an inner diameter of 4 m m . The HTP is stored in a 1 L stainless steel tank. All components are specifically chosen for compatibility with HTP and have been suitably cleaned and passivated to prevent uncontrolled decomposition. A total of four static pressure transducers of STS were used. One on top of the tank ( P TNK ), one in the feeding line ( P FDL ) in front of the thrusters valve, and the previously mentioned two sensors at the thrusters injector and chamber ( P INJ , P DC ). Eight thermocouples of Type-K were used. One close to the tank ( T TNK ), one in the feeding line ( T FDL ), one on the thrusters valve ( T FCV ), and five inside the thruster ( T INJ , T CAT _ 01 , T CAT _ 02 , T CAT _ 03 , T DC ). The mass flow was acquired by an M14 Coriolis mass flow meter of Bronkhorst (CFM_H2O2). All measurement devices are listed in Table 1 alongside the acquisition rate and corresponding uncertainties. In addition, a camera was placed outside the vacuum chamber to capture high-quality videos. To operate the thruster, the tank was pressurized with gaseous nitrogen. A PID pressure regulator, N2_PR_02, was controlled to set the tank pressure. A relief valve (H2O2_AV_01) and a safety release valve (set to 45 bar) helped to handle the pressure safely. The main valve (H2O2_AV_02) was closed during the fueling process and was only to be opened to fill the feed line for priming and before a hot fire test. The dump valve (H2O2_AV_03) was used to prime the feeding line in front of the thruster valve (H2O2_AV_04) to ensure the thruster is only operated with liquid HTP. For cleaning and safety reasons, nitrogen and water flushing were installed. For testing with nitrous oxide, a simplified P&ID was used, as the propellant was fed from a gas bottle instead of the tank, and no pressurization was needed. The instrumentation was identical to the test with hydrogen peroxide.

5.2. Design of Experiments

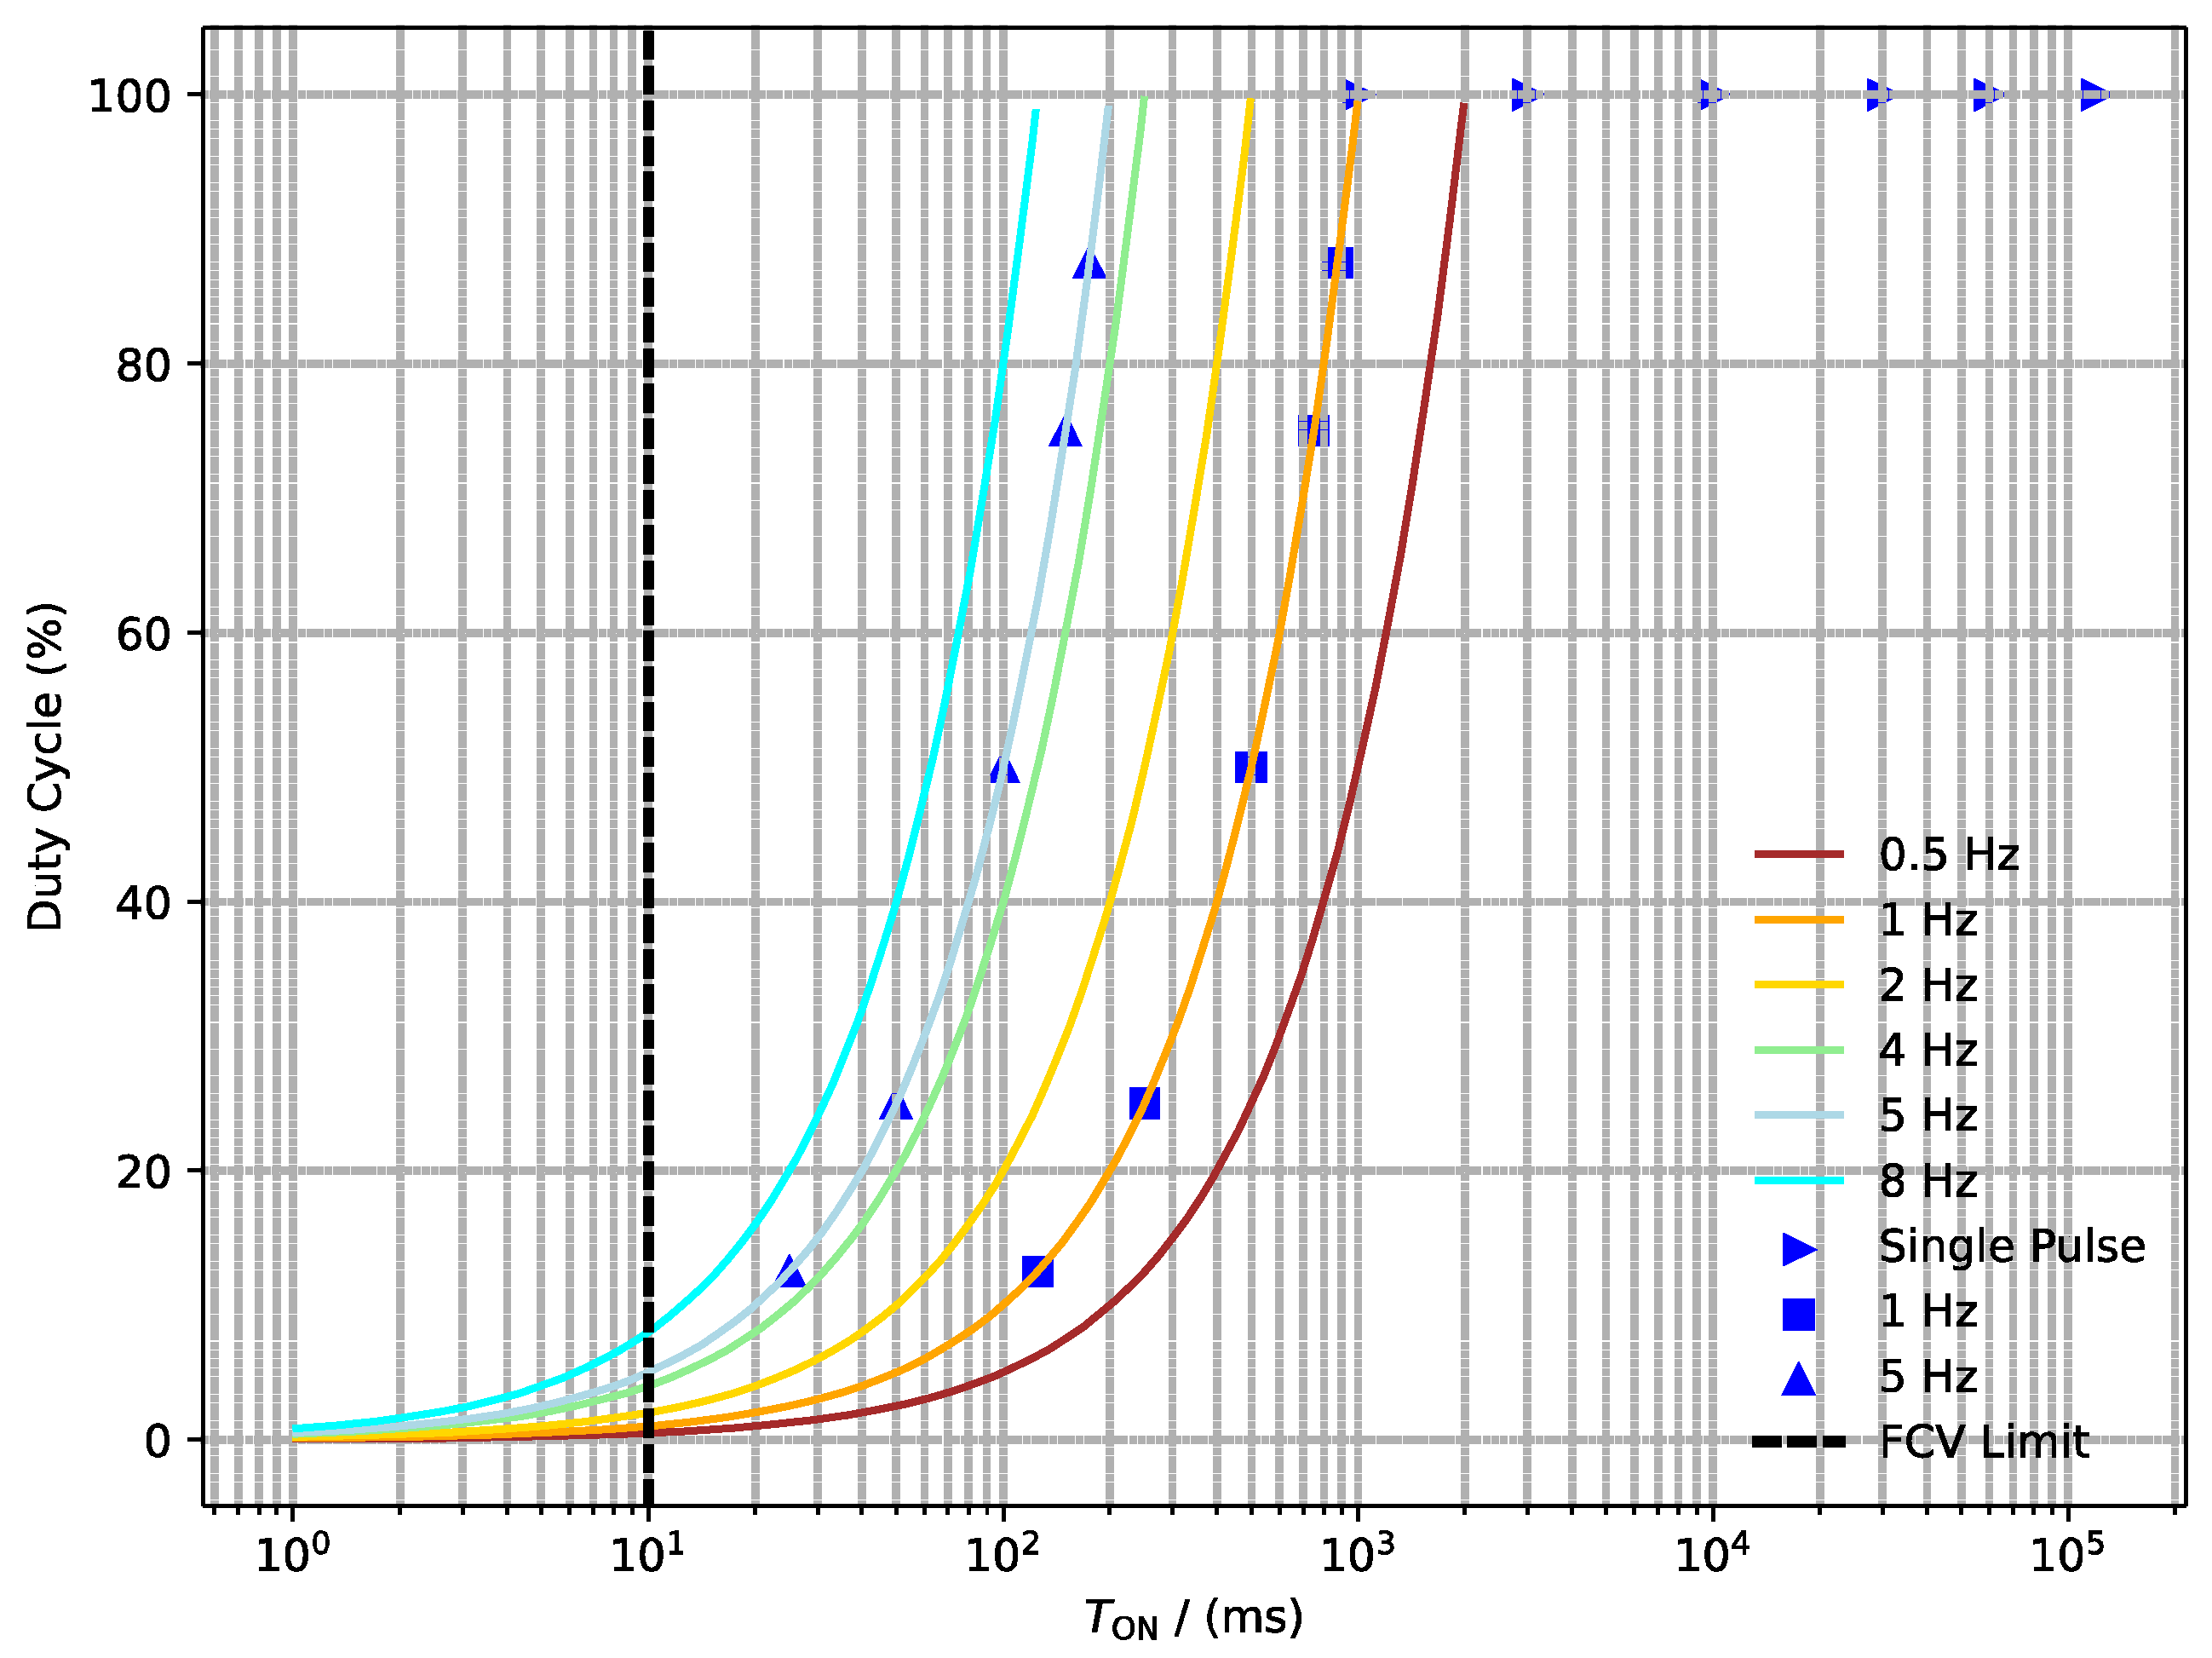
The testing of the “MoCa” thruster covers a comprehensive range of conditions to thoroughly evaluate its performance. In the typical operating range of satellite systems (22–5.5 bar), both steady-state and pulsating operation are examined. To achieve this, three different pressures in the feeding line were chosen: 6, 12, and 24 bar to ensure a variety of operating scenarios. All the intended operating points are listed in detail in Table 2 and shown visually in Figure 6.
The catalyst bed in the engine was carefully prepared and packaged in the M3 laboratory at DLR Lampoldshausen. Using a precision balance and a vibrating plate, the packing density of the pellets was standardized to ensure the repeatability of the experiments. This careful approach to preparation is critical in order to maintain consistency and reproducibility throughout the testing process.
A logarithmic representation was chosen to display the operating points, with the duty cycle on the y-axis and the time on the x-axis. The black dashed line indicates the limit of the valve, as it cannot be pulsed any faster.

5.3. Estimation of Errors

Error propagation is applied, ensuring that uncertainties in input parameters are properly accounted for in the final result. These uncertainties of every measurement device are summarized in Table 1.
For every measured diameter ( d i ), an uncertainty of 10% is assumed. This uncertainty directly affects the calculation of area ( A i ) according to the formula
Δ A = A d · Δ d 2 ,
where Δ A represents the uncertainty in area, and Δ d represents the uncertainty in diameter.
Subsequently, the uncertainty in the discharge coefficient ( Δ c D ) is determined using the uncertainties in area ( Δ A ), mass flow rate ( m ˙ ), and pressure drop ( Δ d p ):
Δ c D = c D A · Δ A 2 + c D m ˙ · Δ m ˙ 2 + c D d p · Δ d p 2
The c D value is calculated during steady-state tests and used to calculate mass flow rates for pulse tests since the responding time of the Coriolis is too slow. The uncertainties in mass flow rate ( m ˙ ) are calculated using the uncertainties in area Δ A , the discharge coefficient Δ c D , and pressure drop Δ d p :
Δ m ˙ = m ˙ A · Δ A 2 + m ˙ c D · Δ c D 2 + m ˙ d p · Δ d p 2
Lastly, the characteristic velocity ( c * ) and the combustion efficiency η c * are determined for both steady-state and pulse firing tests:
Δ η c * = Δ c * = c * A · Δ A 2 + c * m ˙ · Δ m ˙ 2 + c * p · Δ p 2
These equations allow for systematically propagating uncertainties from the input parameters to the final calculated values, ensuring the reliability of the results is appropriately characterized.

6. Results and Discussion

6.1. Hydrogen Peroxide Testing

Over three test days, over 90 tests were conducted, with an operational duration of >30 min and an H2O2 throughput of >1 k g . Between each testing day, the catalyst pellets were replaced to examine degradation and minimize their influence between tests. A picture of the hot firing is shown in Figure 7. The catalyst bed was pre-heated to 70 °C before each test. A concentration of 97.3 wt.% HTP was measured in the laboratory ahead of the hot fire testing.
Three pressure levels (6, 12, and 24 bar) were applied to the tank to give an impression of a typical operating range of 22–5.5 bar chamber pressure. The “MoCa” thruster underwent two steady-state experiments lasting 60 s each, as well as pulsed experiments at frequencies of 1 Hz at each pressure level. The pulsed experiments comprised duty cycles of 12.5 %, 25%, 50%, 75%, and 87.5 %, totaling 100 consecutive pulses.
The steady-state test measurements are shown in Table 3. The first two tests (1 and 2) were conducted with a feeding line pressure P FDL of 6 bar, tests 3 and 4 with 12 bar, and tests 5 and 6 with 24 bar. Tests 7 and 8 were conducted at 12 bar with the simplified thruster and only the pressure sensor P DC attached. This was carried out to examine the influence of the gas volume in front of the pressure sensors and the heat capacity of the seven measurement ports.
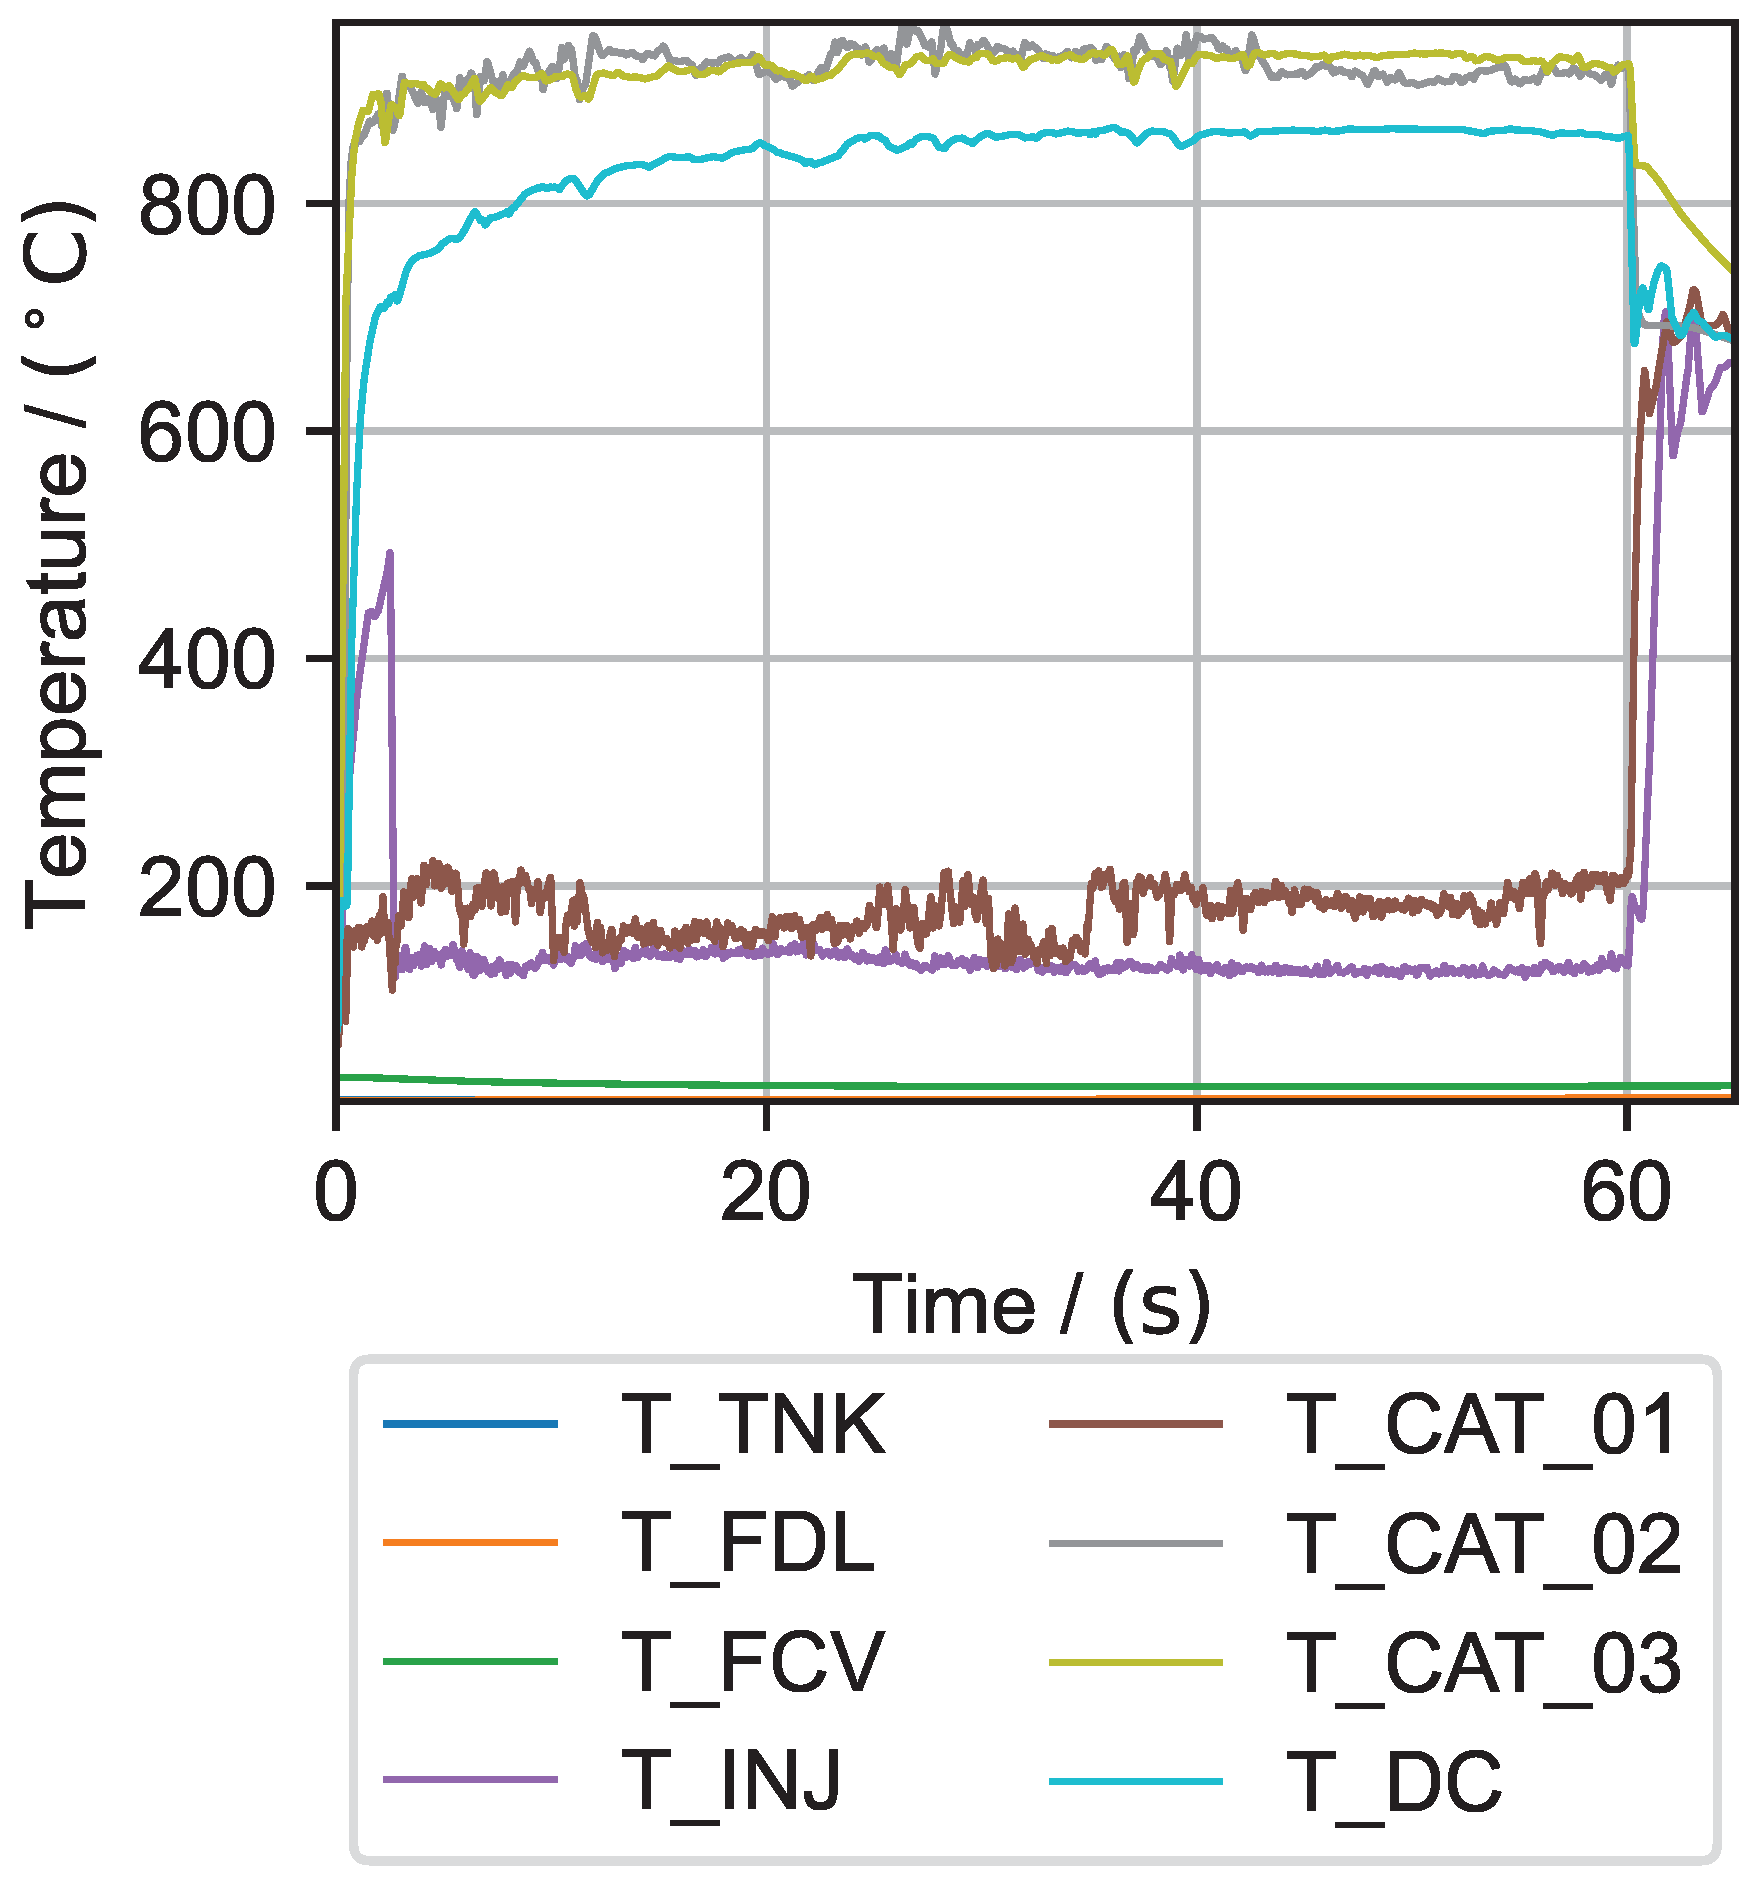
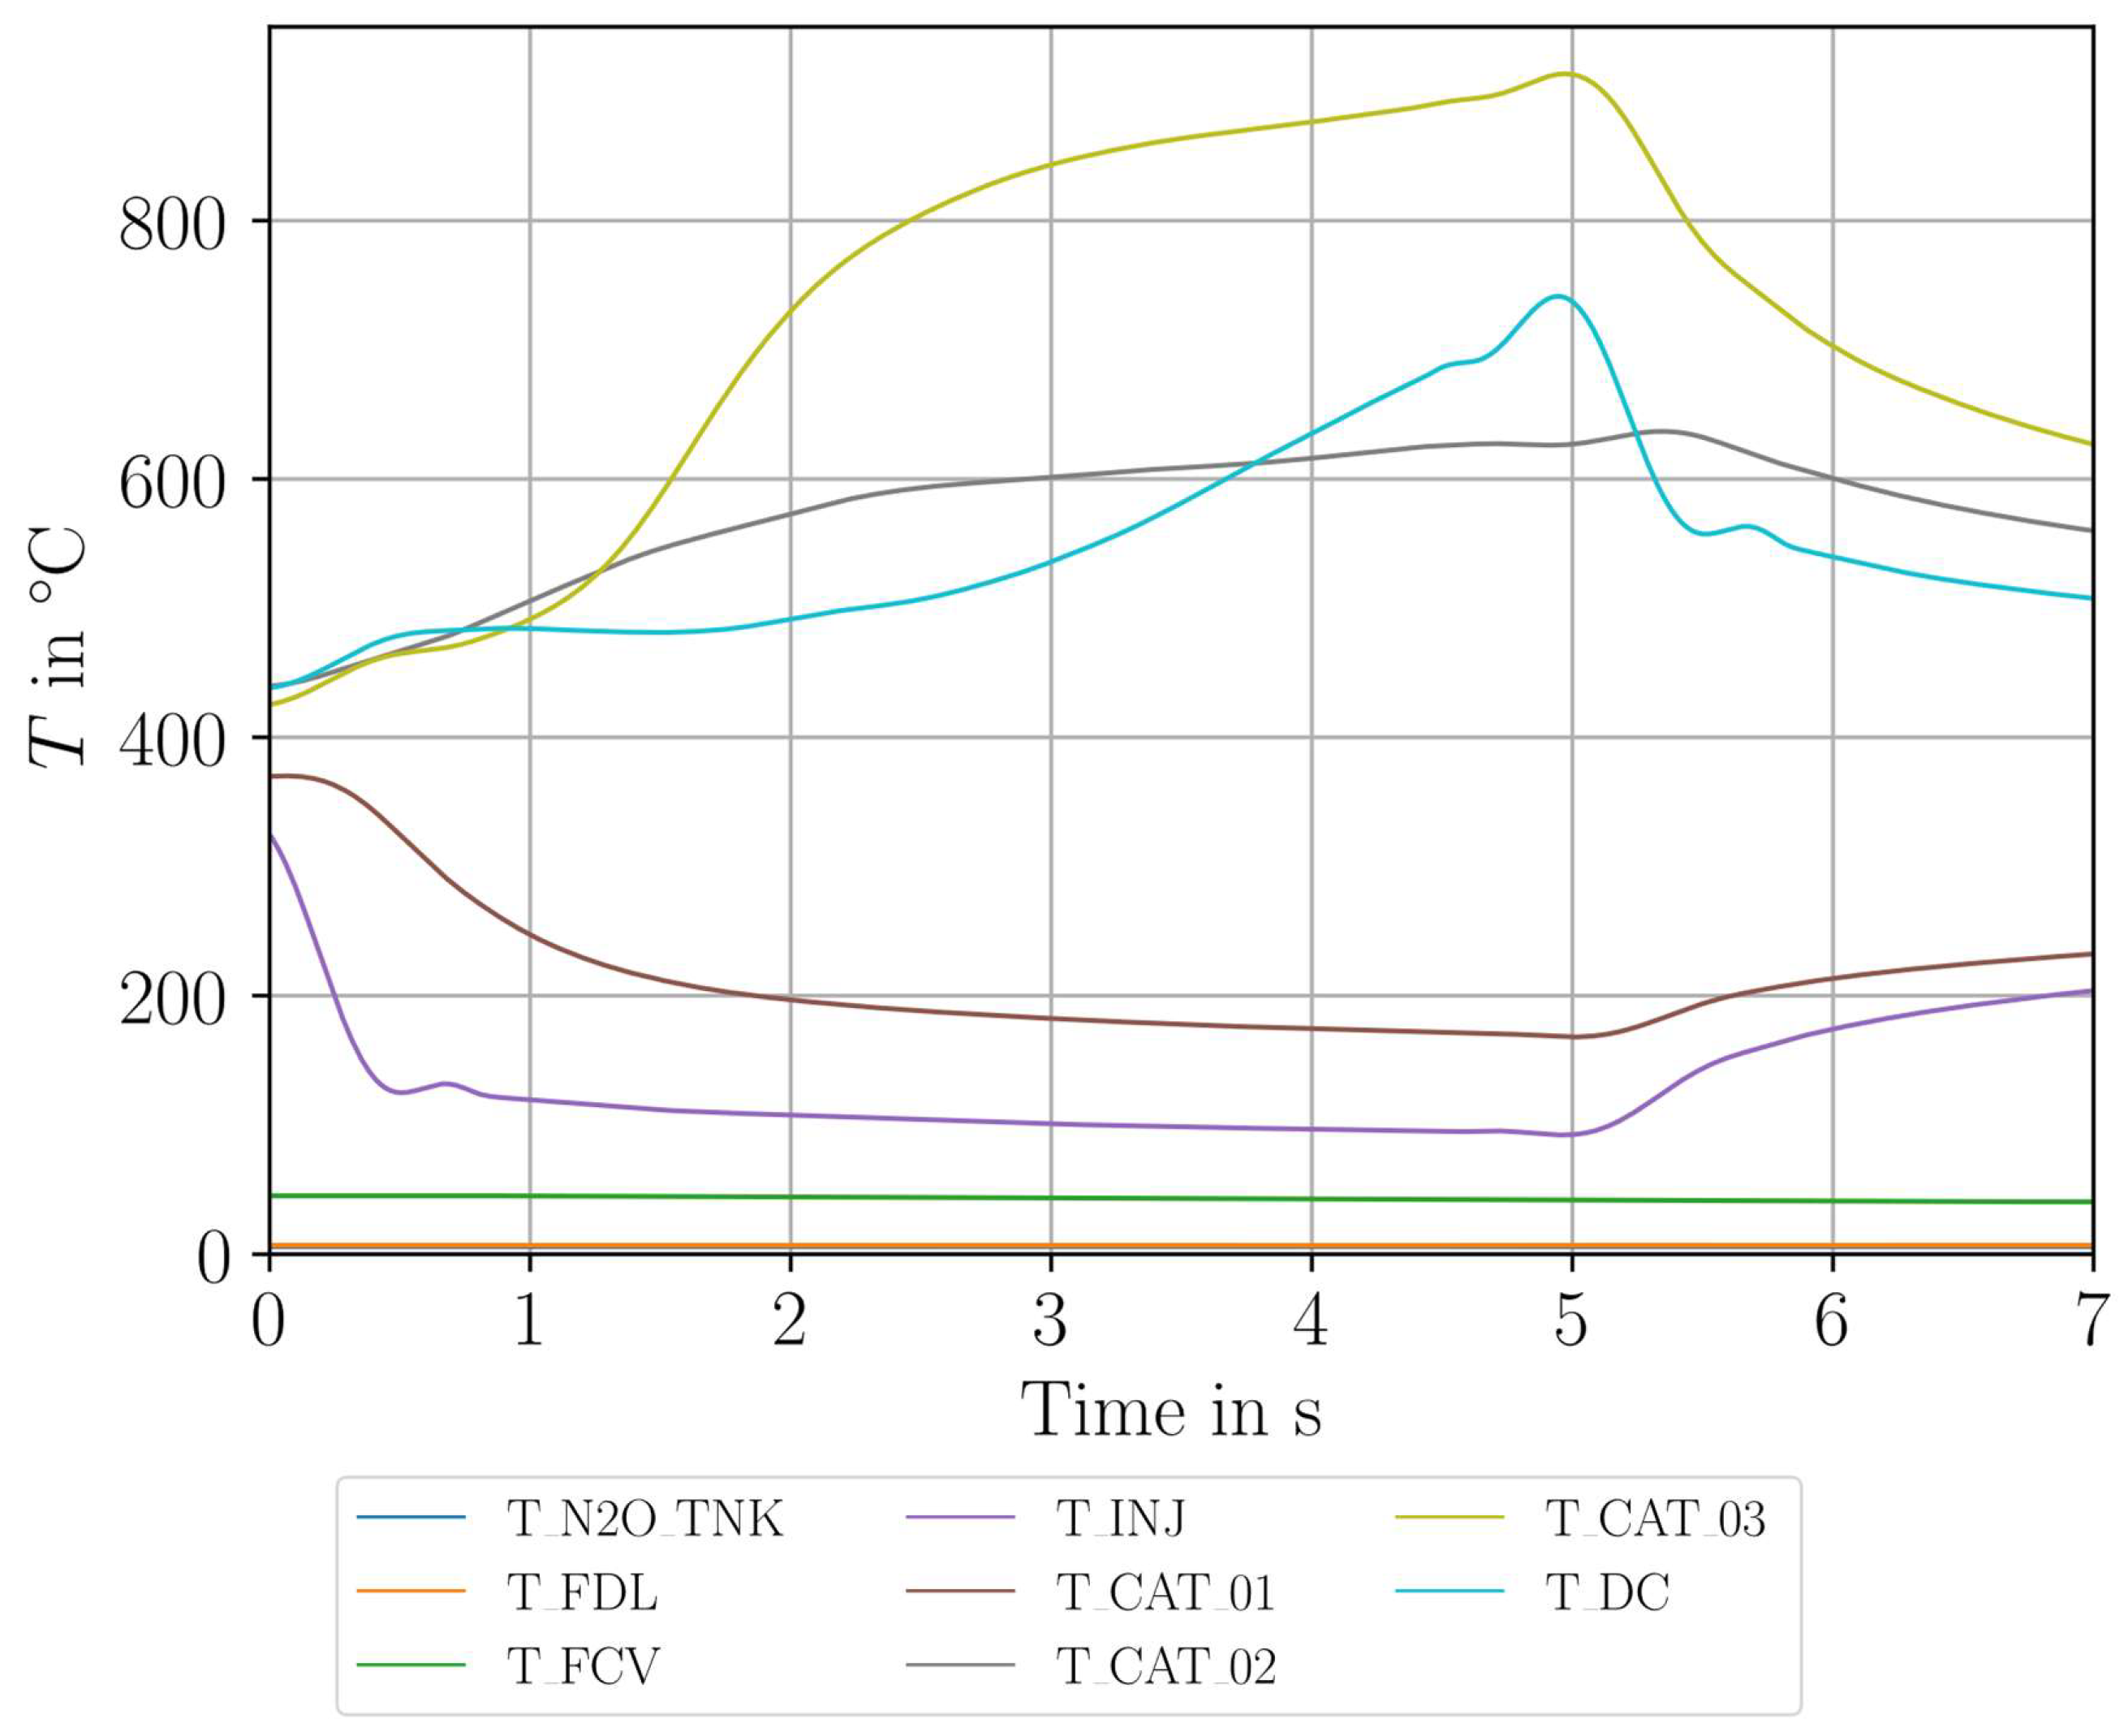
The temperature profile of Test No. 5 is shown in Figure 8. The temperatures T CAT _ 02 and T CAT _ 03 reach their terminal temperature roughly after 10 s , which makes this test thermally steady-state. The maximum temperature was measured at the second thermocouple in the catalytic bed, which was T CAT _ 02 = 959.26 °C, indicating that a full decomposition was achieved. The maximum temperature in the chamber was measured at T DC = 867.86 °C. A cooling effect could be investigated behind the injector. The temperatures behind the injector T INJ and at the first cat-bed position T CAT _ 01 stayed below 200 °C. After the thruster’s valve was closed, the temperatures increased due to the heat-soak-back up to 650 °C before cooling down.
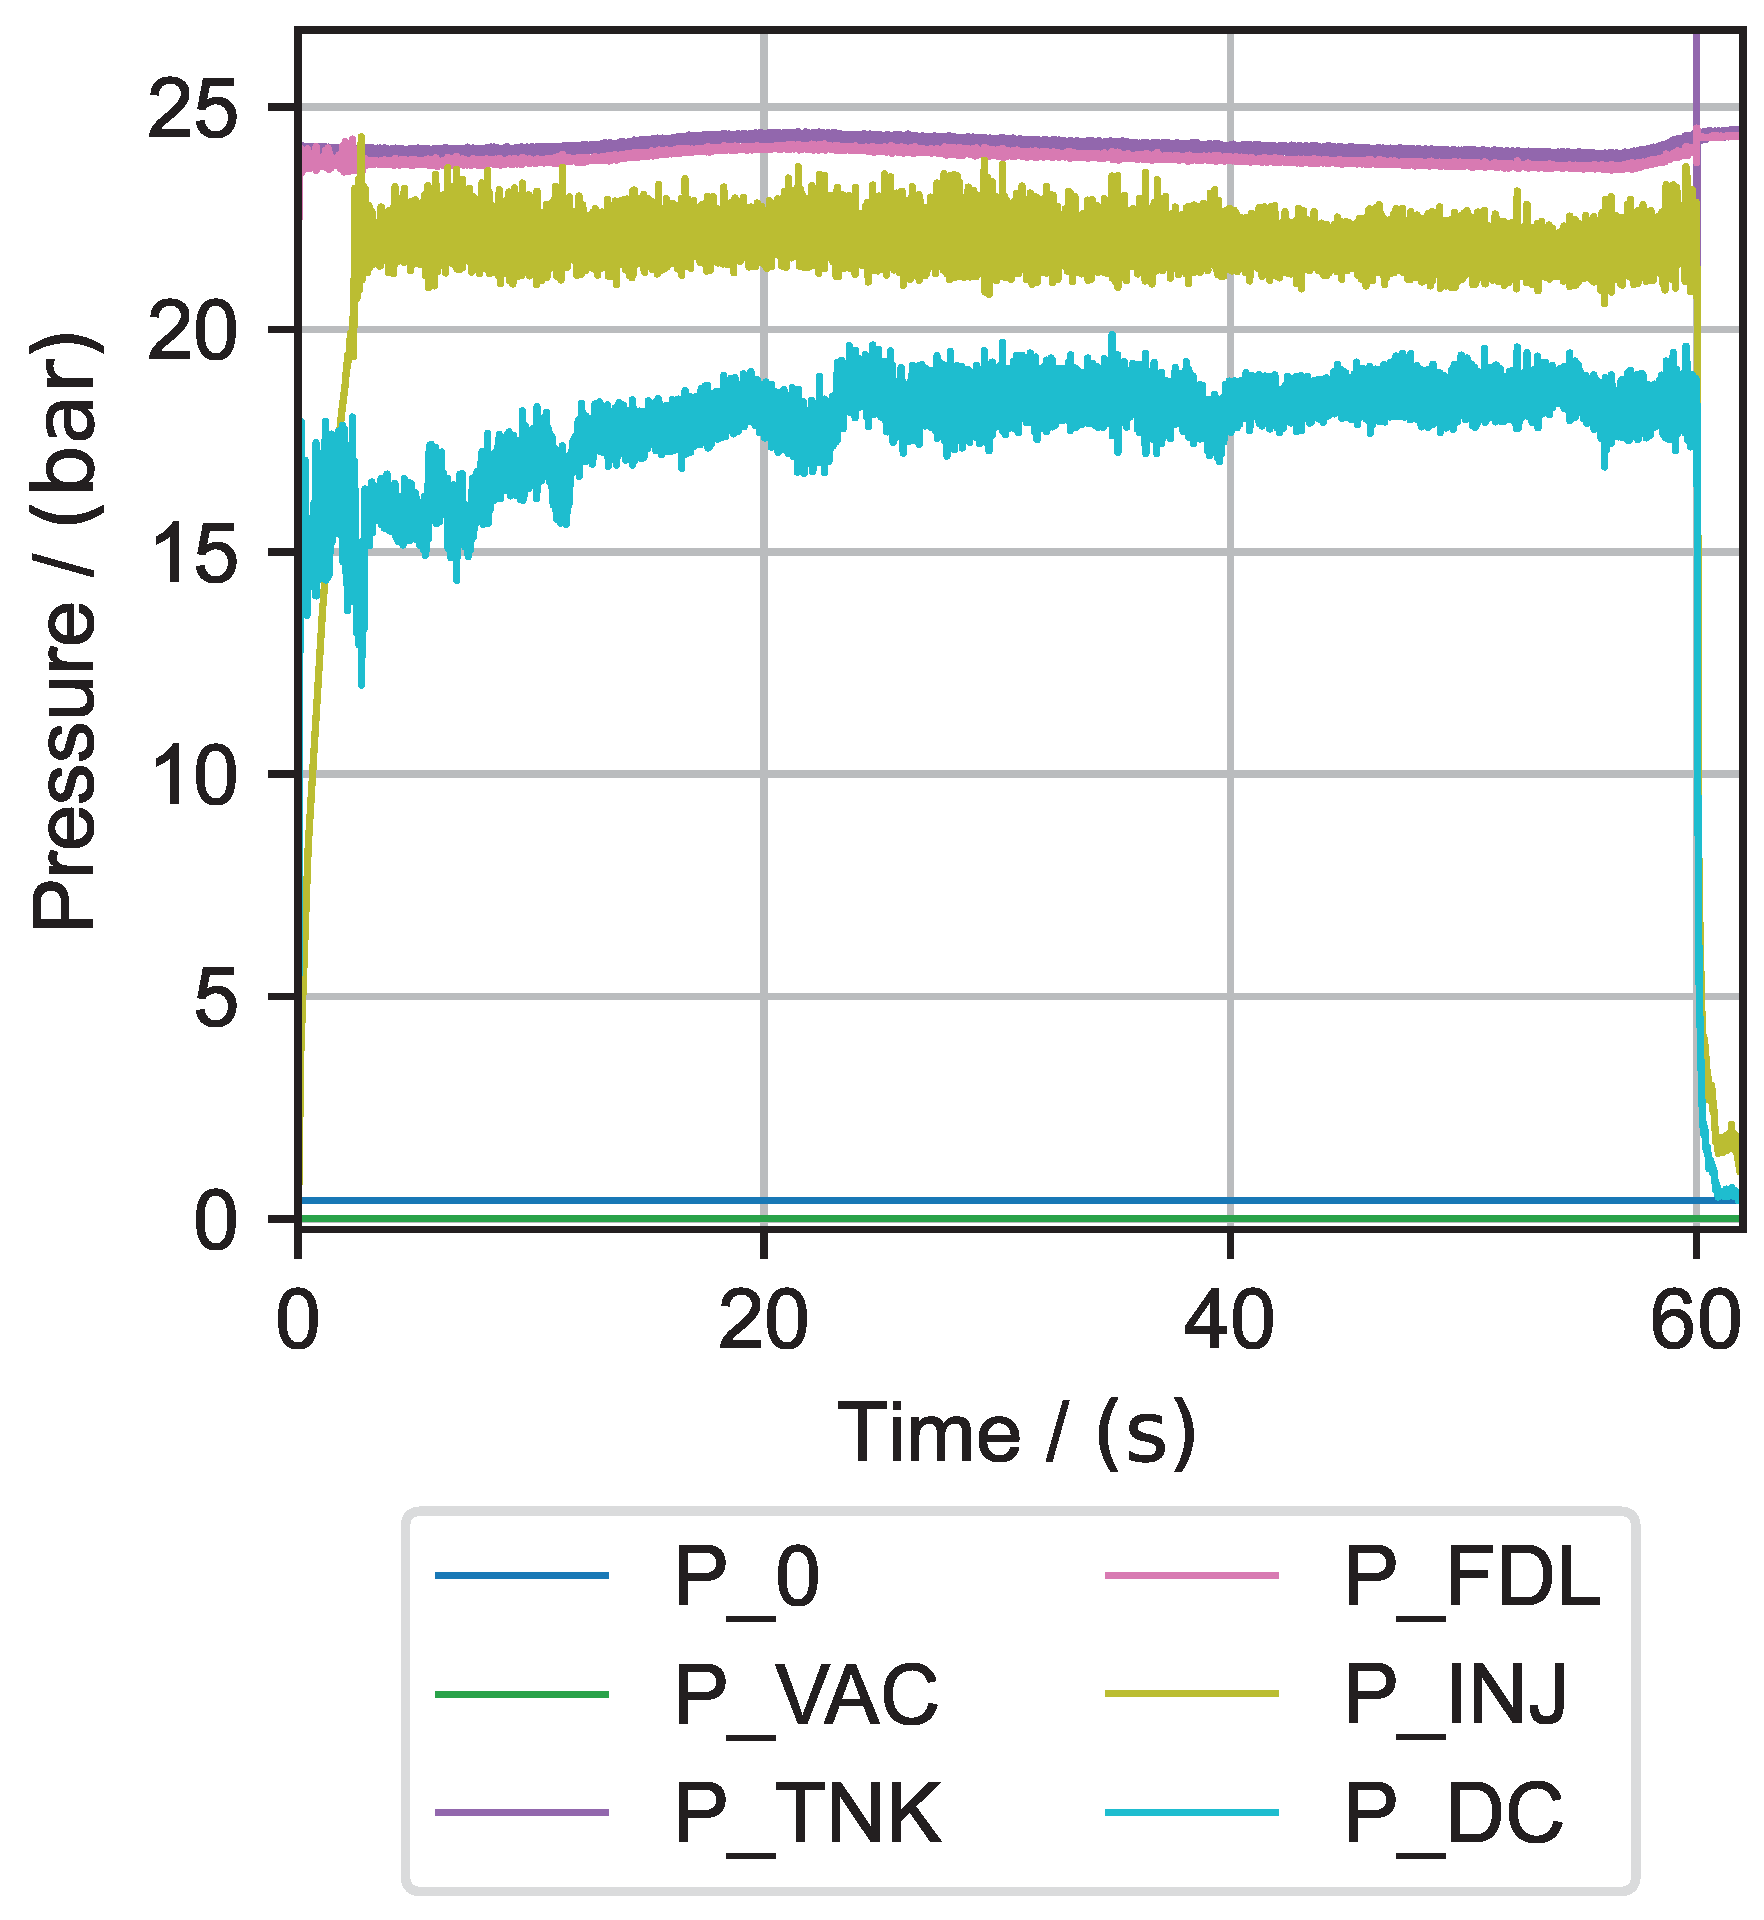
Figure 9 displays the acquired pressure data. This test was conducted at the end of a test day. Compared to the beginning of the test day, the pressure drop across the catalyst bed did increase. It was found that the catalyst mass was reduced, and the pellets were almost pulverized, explaining the change in the pressure drop. However, one of the highest combustion efficiencies was achieved in this test. It was calculated over the interval from 44 s –54 s and resulted in η c * = 92 %.
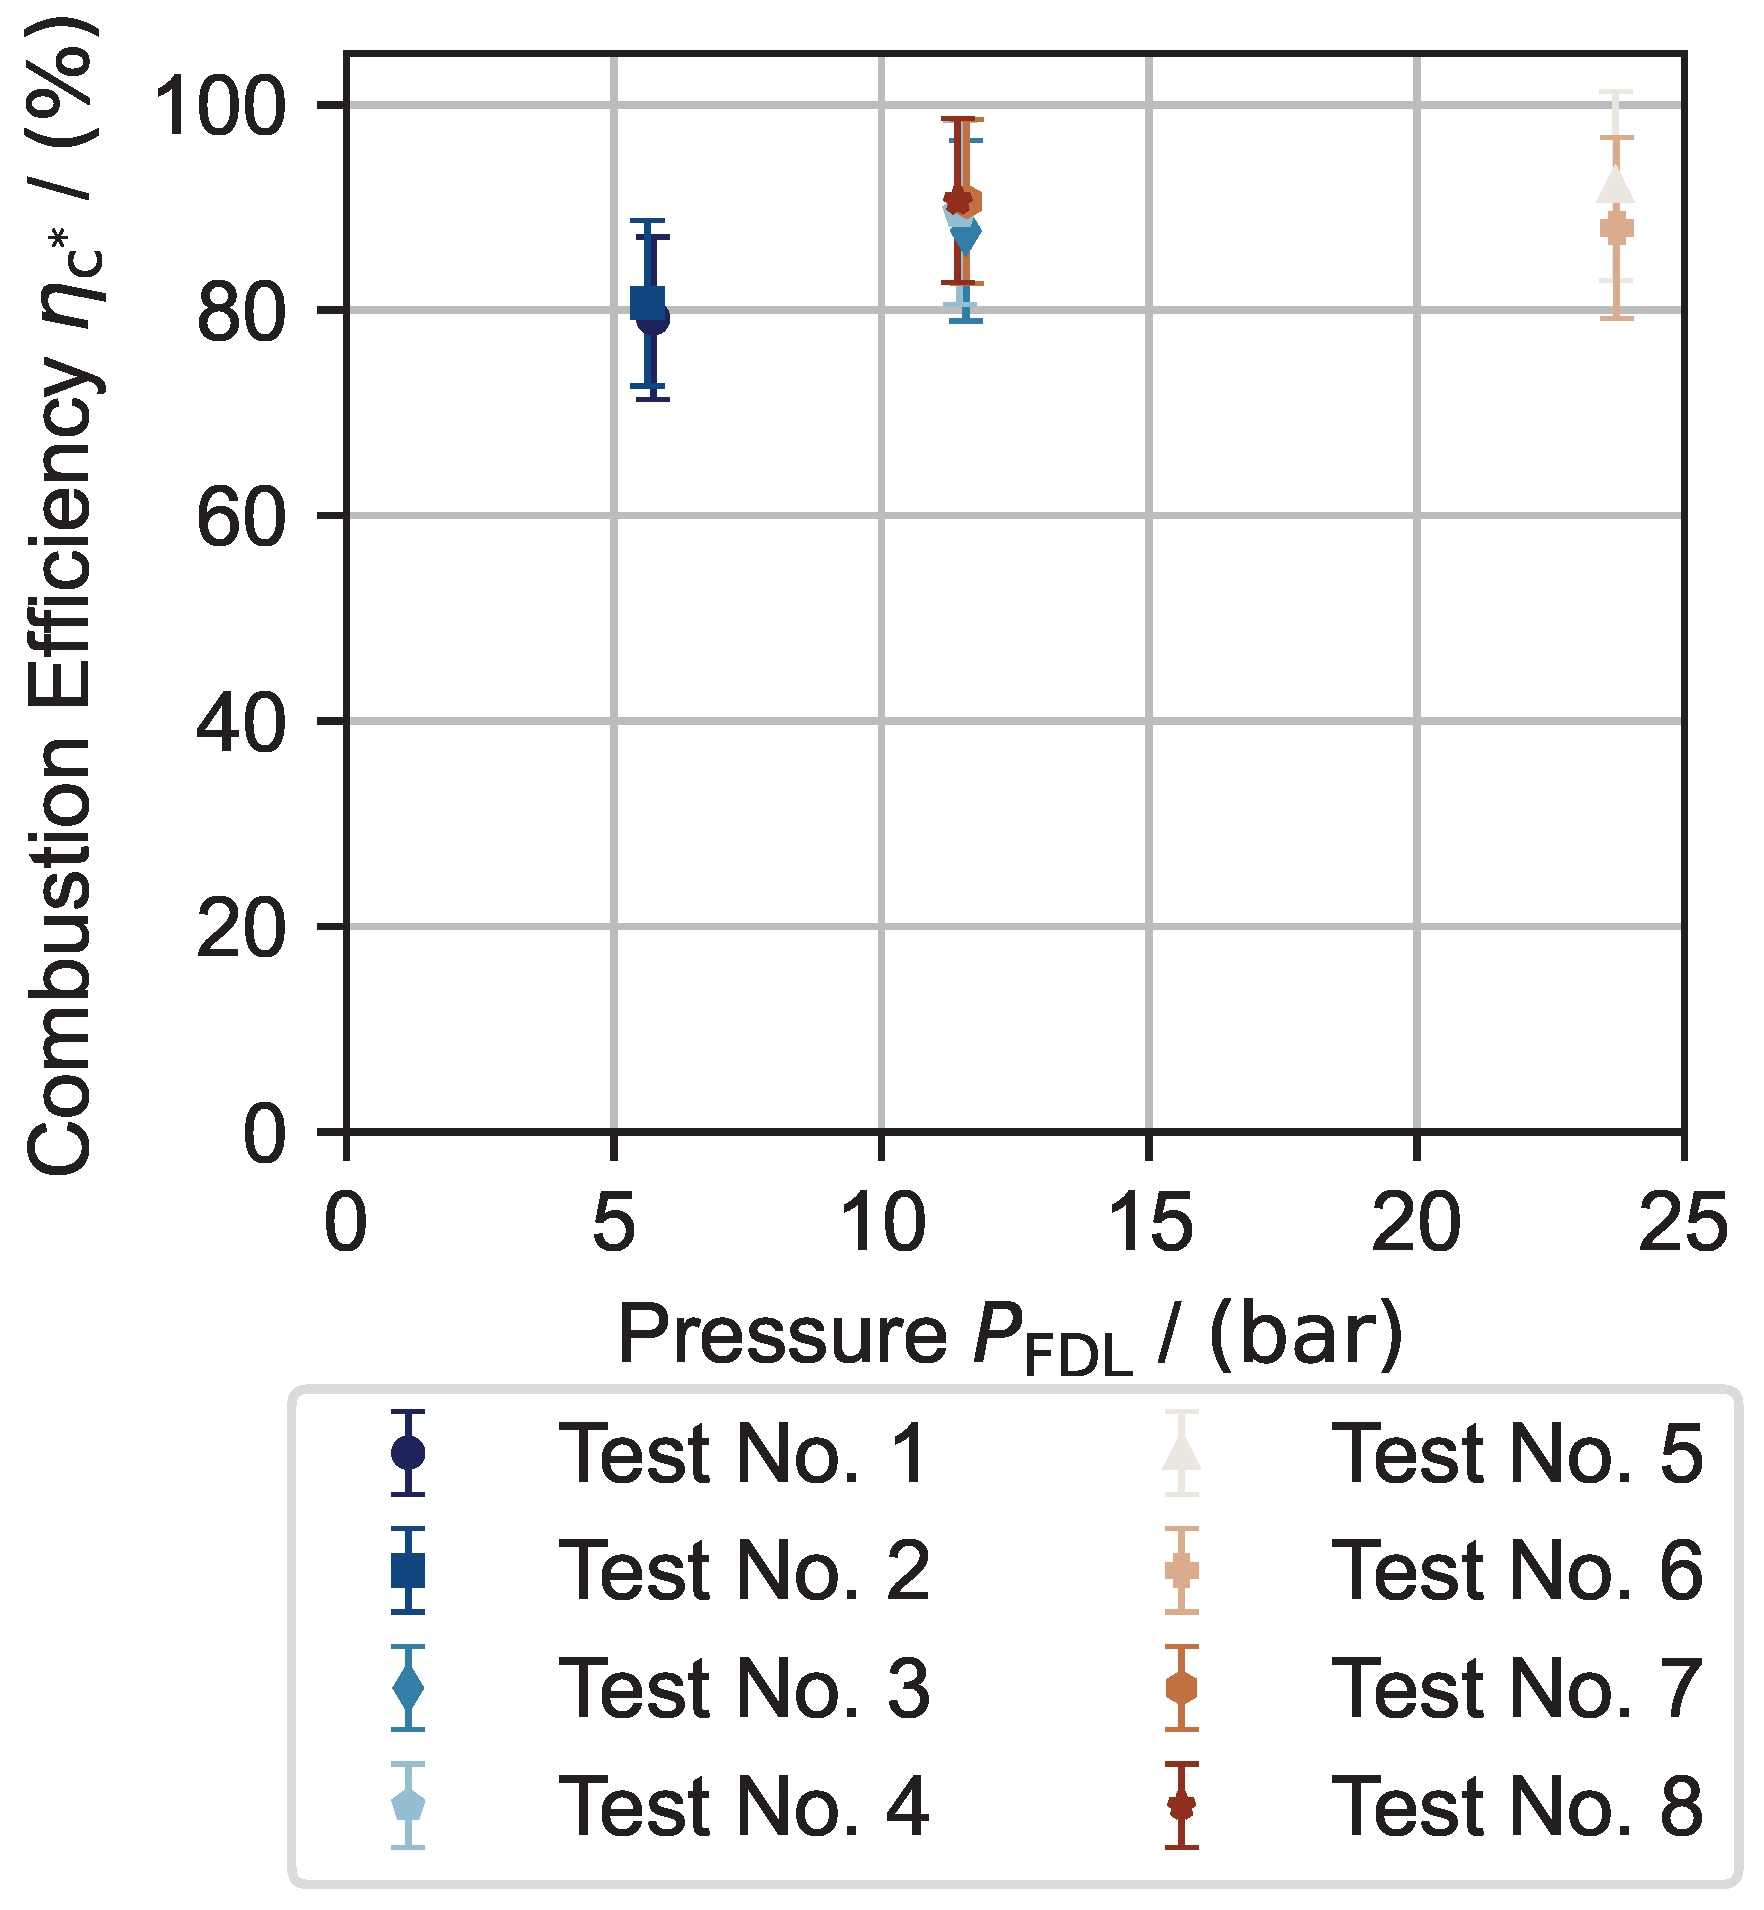
Table 3 indicates the maximum temperatures in the chamber and catalyst bed position two ( T CAT _ 02 ). It can be seen that the temperature reaches around 950 °C, with feeding line pressures greater than 12 bar. The conclusion is that tests with a feeding line pressure of 6 bar did not reach full decomposition. The hottest temperature was measured in all tests at T CAT _ 02 . This indicates that the catalyst bed might be slightly too long. In Figure 10, the combustion efficiency η c * of all steady-state tests is displayed. The tests with a feeding pressure of 6 bar did reach about 80% while the efficiency of the higher pressure levels reached about 90%, which corresponds to the temperature reached.
Test No. 7 and 8 operated using the simplified thruster. They show a slightly higher efficiency (within the uncertainty) compared to the tests with the fully equipped thruster at the same pressure level of 12 bar.
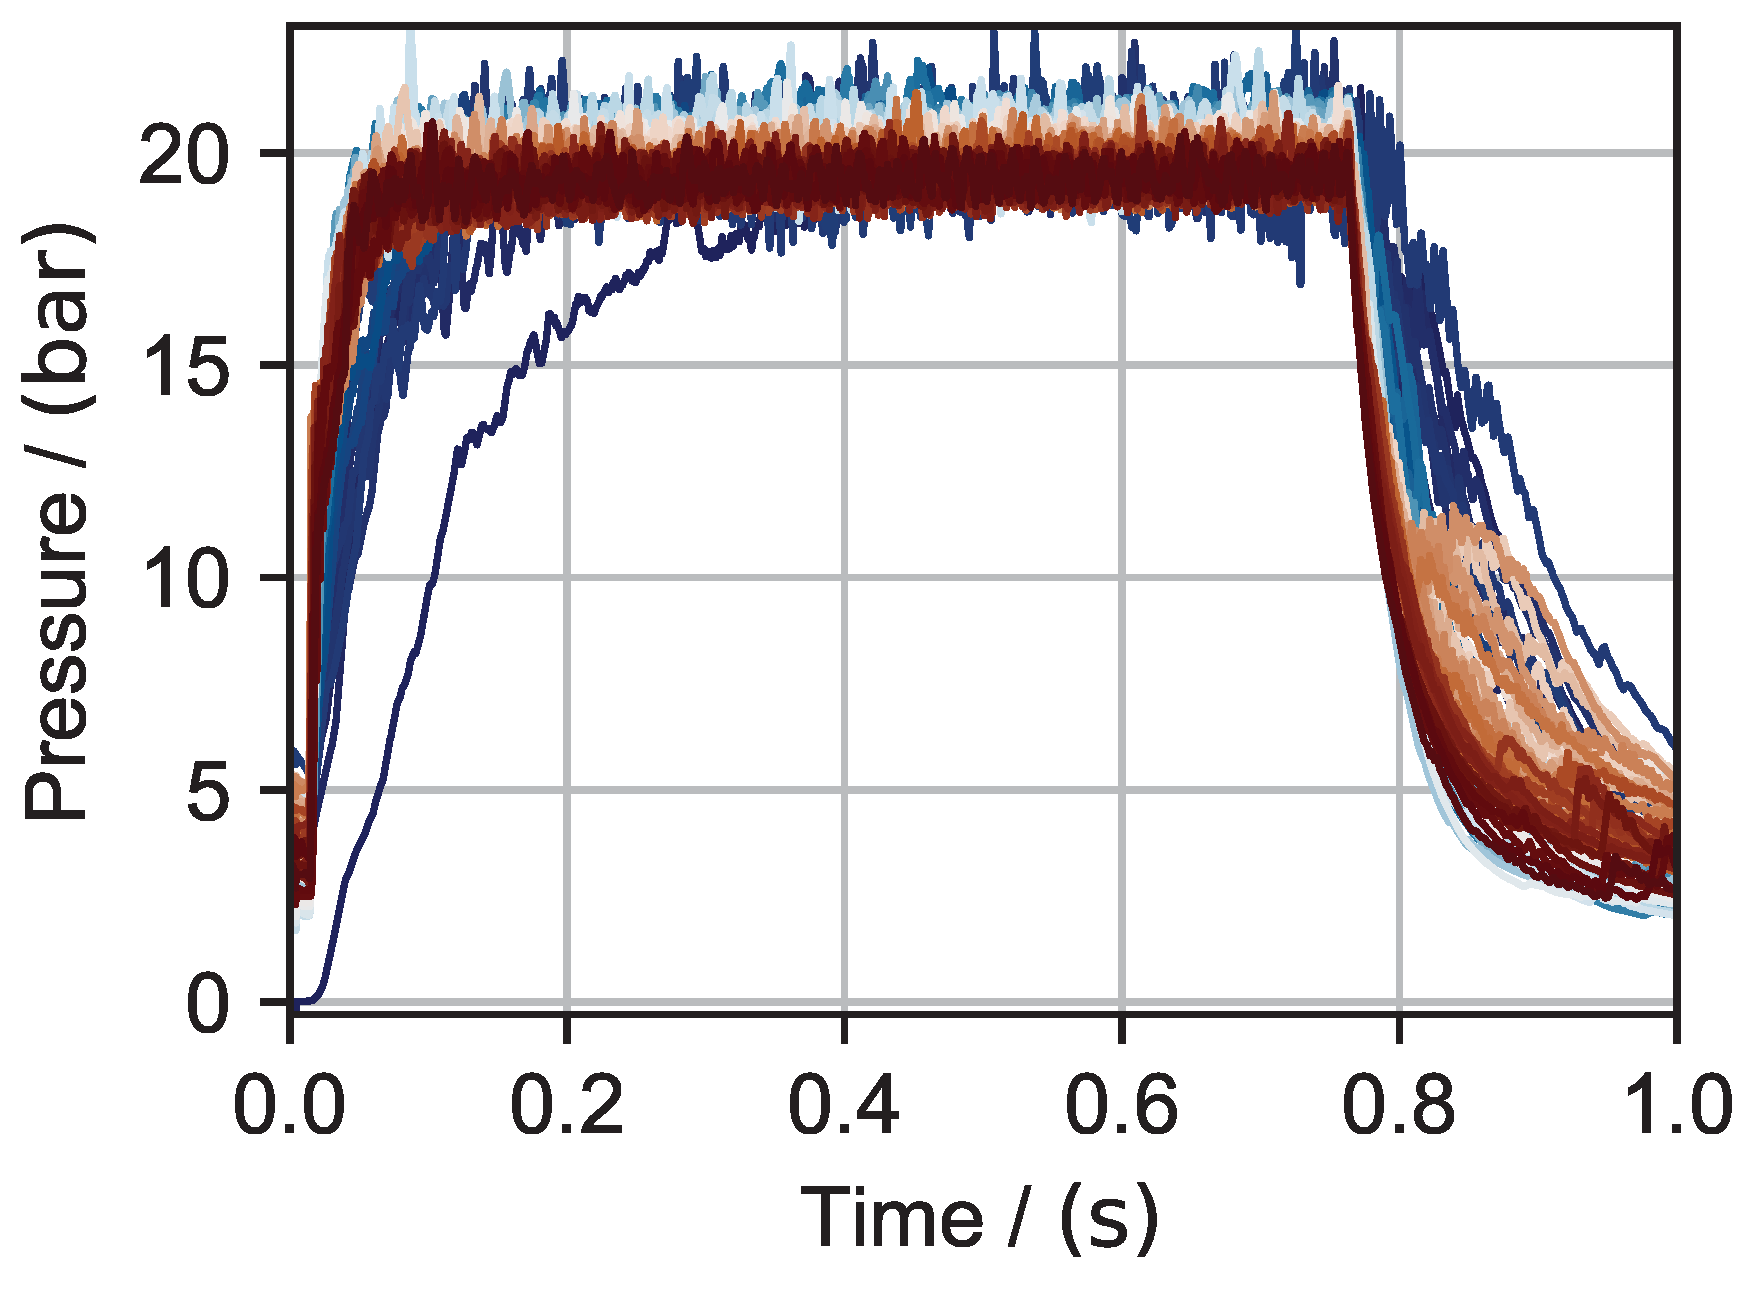
In Figure 11, a 1 Hz pulse test with a duty cycle of 75% and an FDL pressure of 24 bar is shown. The initial pulse is shown in deep blue, which gradually changes to light blue and light red tones until it takes on a deep red color at pulse number 100.
The 100 pulses were, besides the first pulse, almost identical. With shorter duty cycles or a lower inlet pressure, more than one pulse was needed to reach repeatability. Control of the valve actuation had a delay of 4.5   m s , and the valve itself had a delay of < 10 m s . Taking this into account, the rise time from valve opening to 95% of the operating pressure is t rise < 50   m s . This increases for lower input pressures as well.
Figure 12 displays the corresponding temperature profile. The temperatures T CAT _ 02 and T CAT _ 03 reach their terminal temperature in a similar timeframe, similar to the steady-state test in Figure 8. In comparison with the steady test, the T OFF time can clearly be seen from the temperature gradient. However, most certainly, it is observed that the temperature T CAT _ 01 fluctuates between 800 °C and 200 °C.
This behavior was only observed in the 12 bar and 24 bar tests in stead- state firing and pulsing tests. In correlation with this, the pressure had a greater roughness at the same time the temperature T CAT _ 01 rose and fell, and the pressure drop over the catalyst bed increased/decreased. With a feeding pressure of 6 bar, the temperature T CAT _ 01 rose directly at the beginning and stayed high. After the pulsing tests, the catalyst was almost pulverized, and only 0.31   g remained in the chamber. The thermal shocks are suspected to significantly reduce the catalyst’s lifespan.
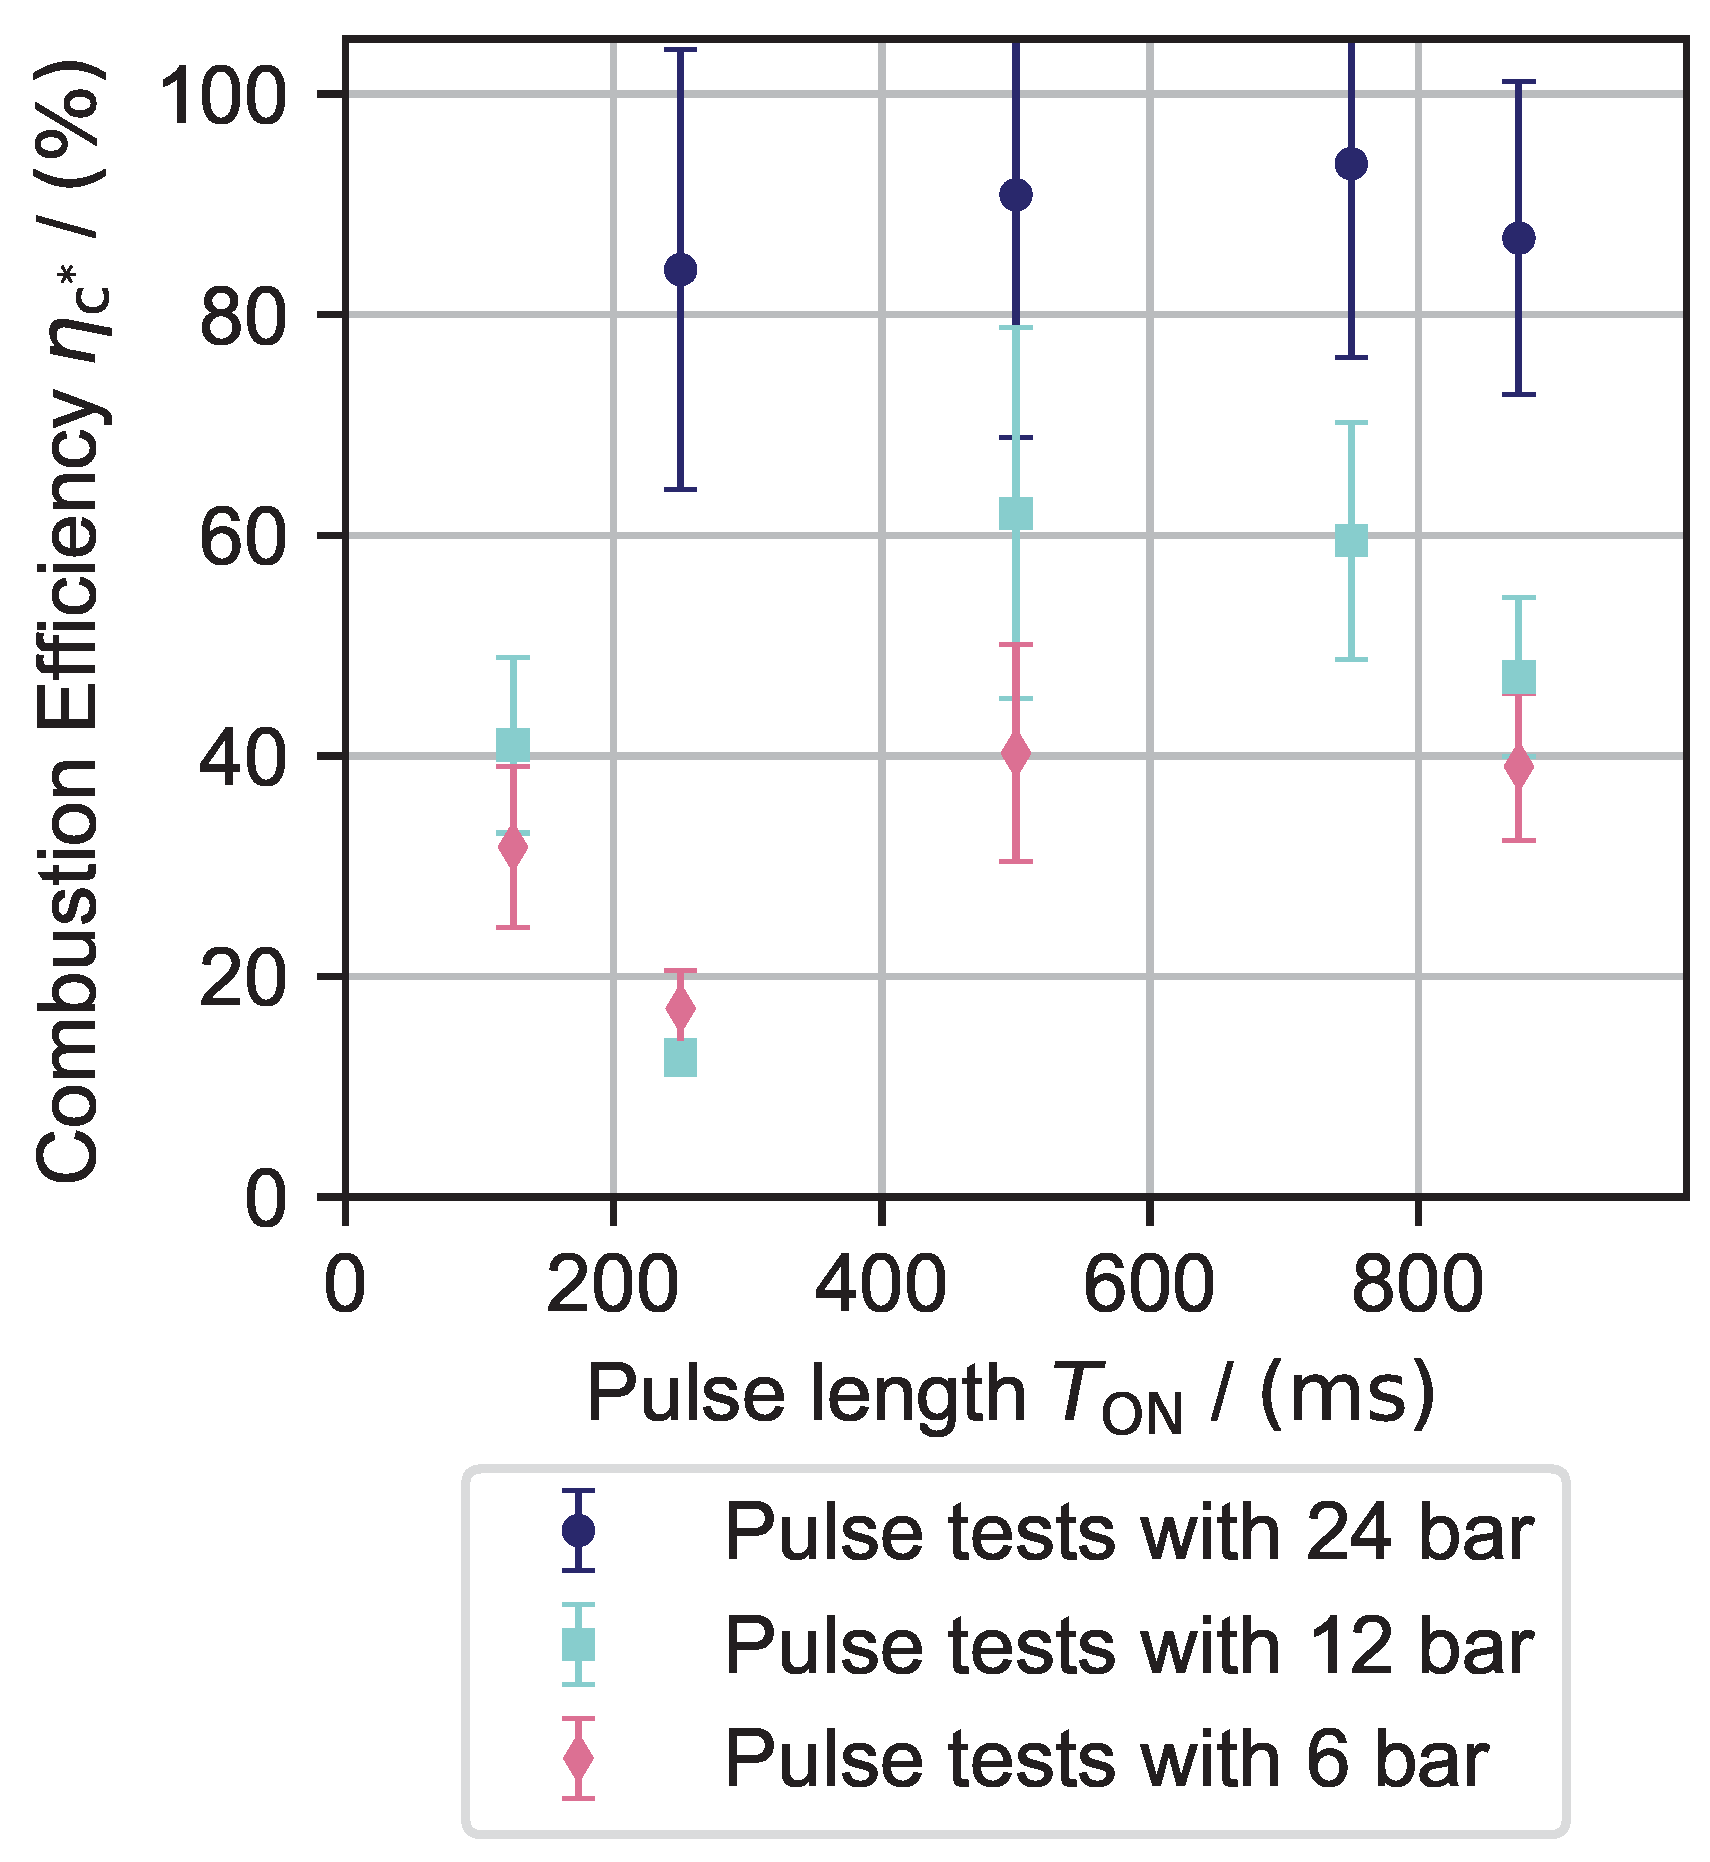
Figure 13 displays the combustion efficiency η c * over T ON of the 1 Hz pulse mode firing tests with all three pressure levels. The calculation of η c * was carried out using Equation (4), with the mass flow rate m ˙ determined using the discharge coefficient c D . The error bar indicates the higher uncertainty that is inherent with this method. However, it can be seen that the pulses with the highest feeding pressure reached the highest efficiency, similar to the steady-state operation.

6.2. Nitrous Oxide Testing

Steady-state and pulse-mode tests were conducted with the “MoCa” thruster with nitrous oxide in the same manner as with hydrogen peroxide. In total, 90 tests were performed, of which 32 tests saw a significant temperature increase (>20 K). During the experiments, with the given setup, it was hard to reach the desired pre-heating temperatures to achieve thermal decomposition. In the 58 tests where no temperature increase was observed, the initial catalyst temperature was too low to initiate a reaction. In the first part of this section, exemplary tests with successful decomposition are shown and discussed. In total, four tests are described in more detail in the following. Table 4 gives an overview of these tests. At the end of this section, an evaluation of the needed conditions for decomposition in this setup is given.
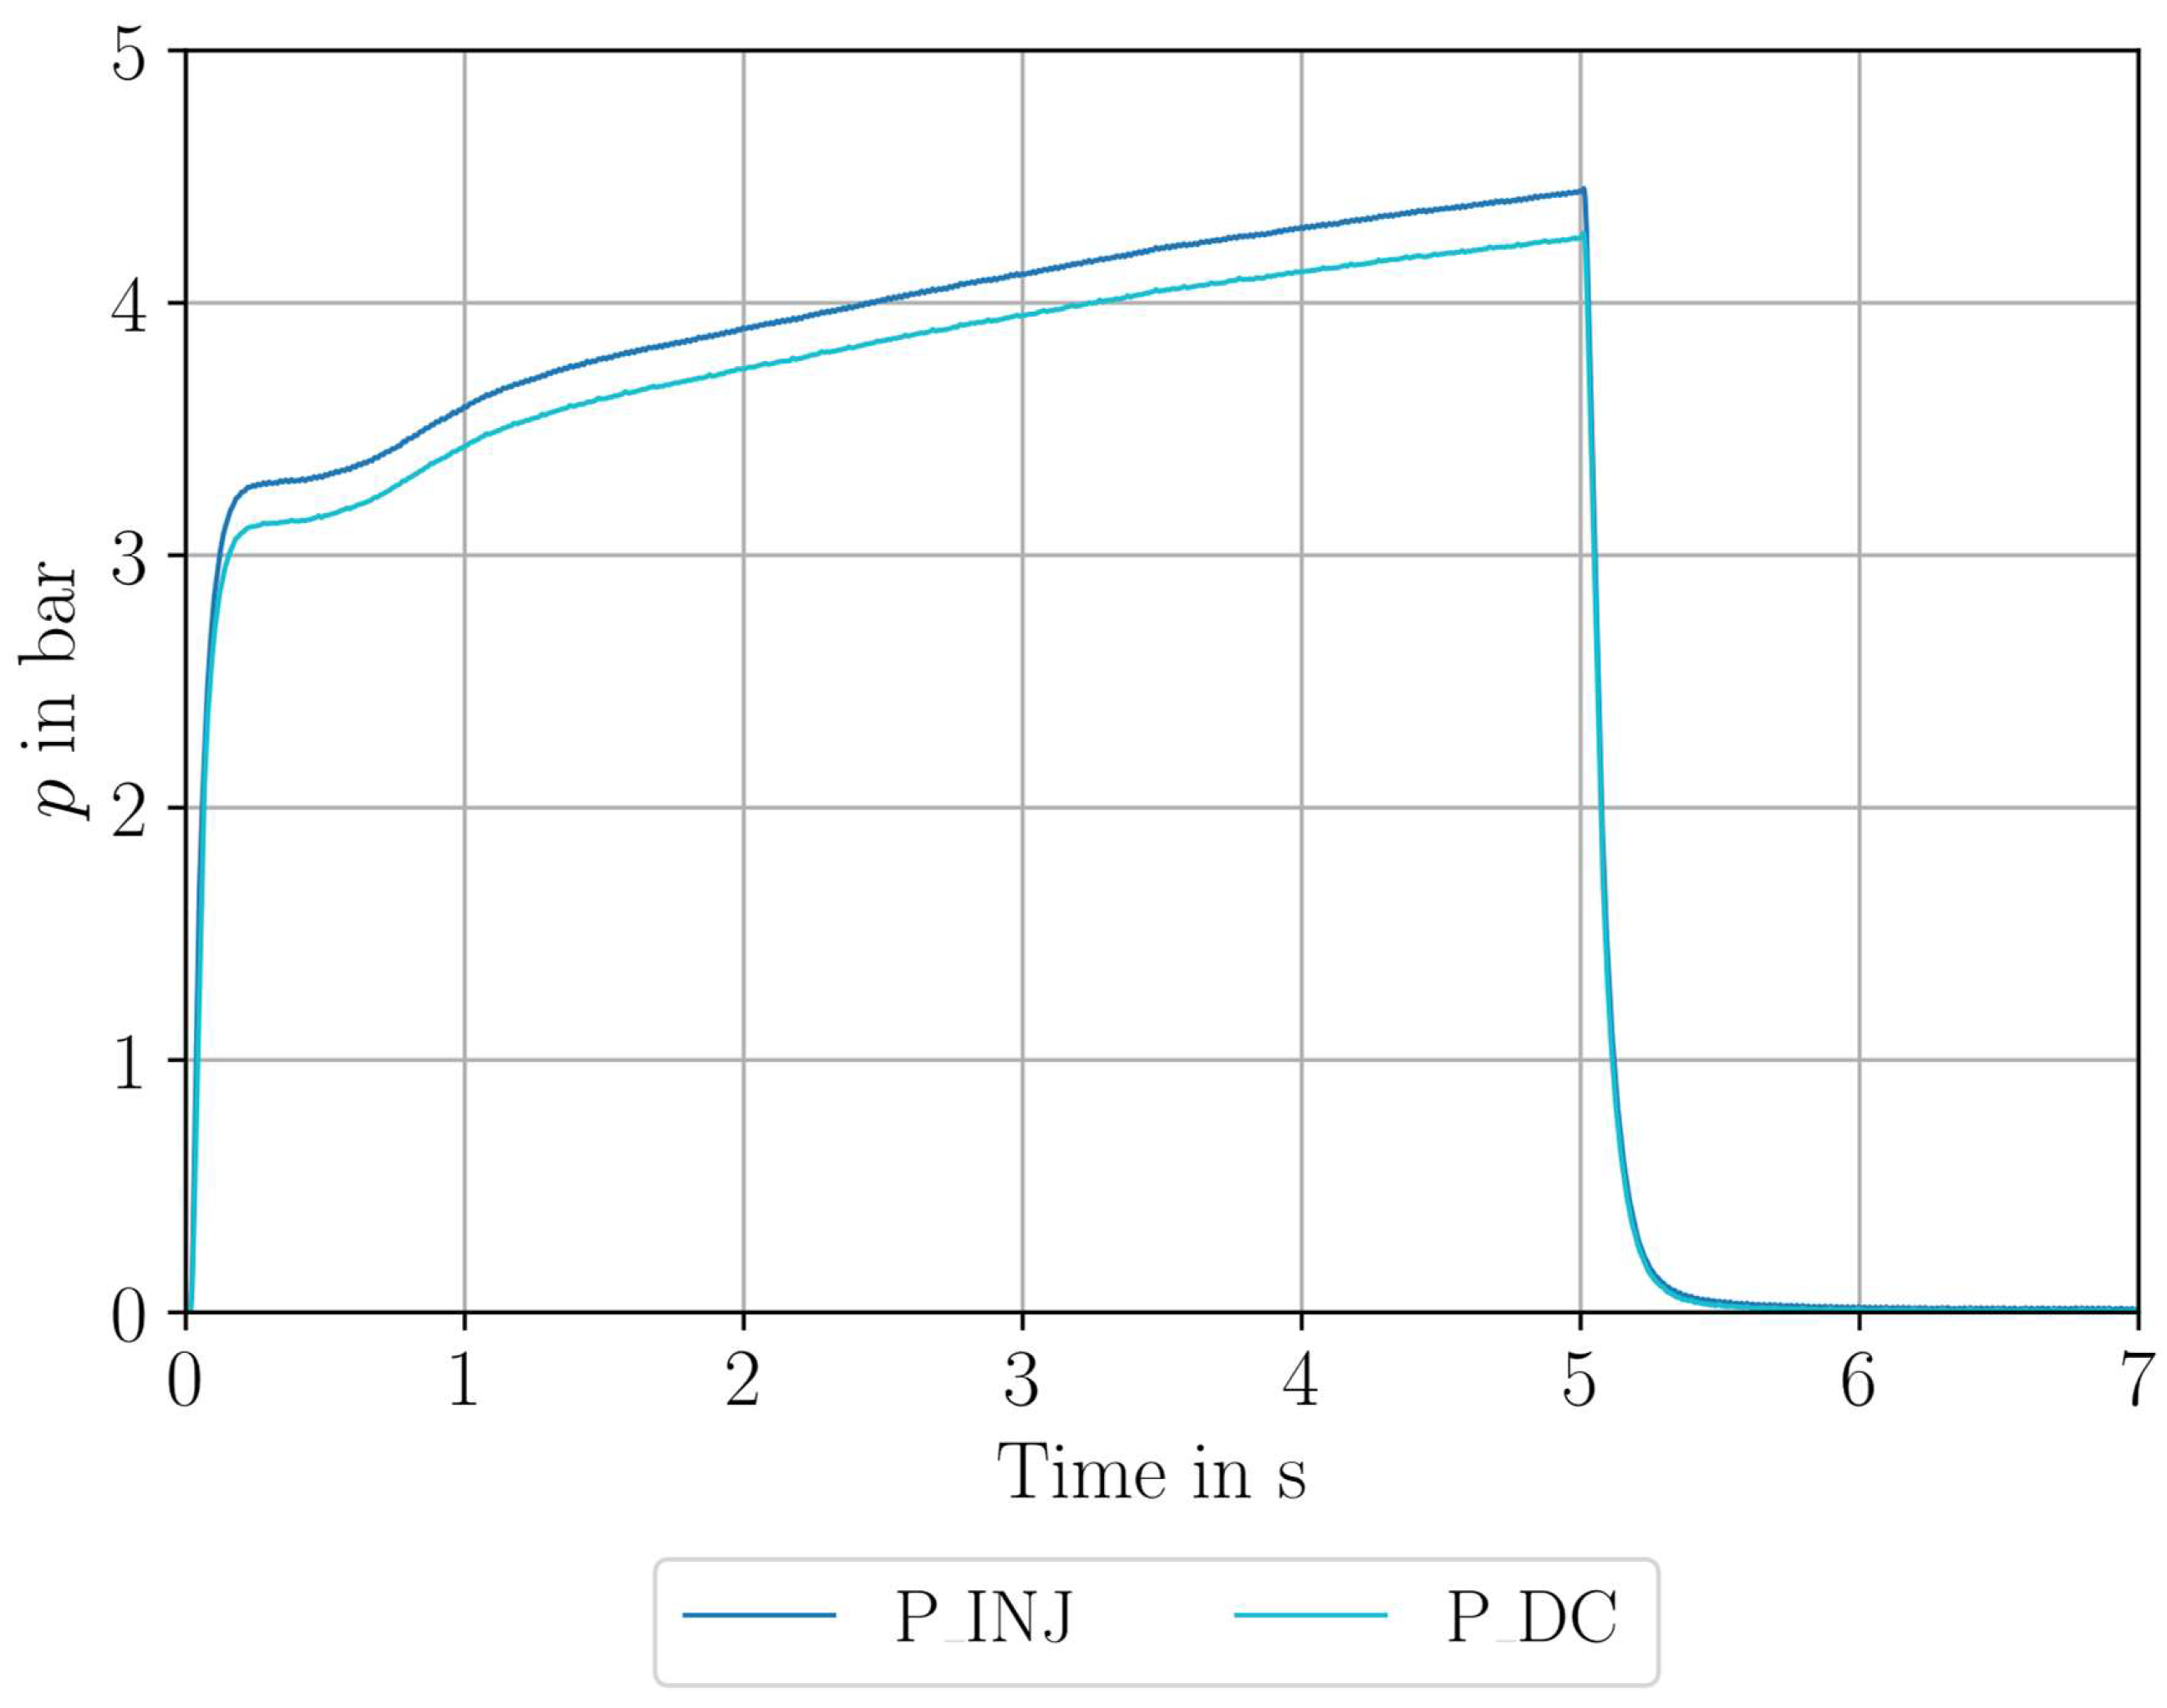
Figure 14 and Figure 15 show the pressure and temperature plot of a 5-s steady test. It can be seen that, before ( P I N J ) and after the catalyst ( P D C ), the chamber pressure rises slowly over the 5 s experiment duration. P I N J increases from 3.3 bar to 4.3 bar. The mass flow, however, was nearly constant during the test. The increase in chamber pressure is connected with an increase in chamber temperature and, therefore, with a slow increase in decomposition efficiency during the experiment. The experimental c * value was calculated according to Equation (4) using the pressure measured after the catalyst ( P D C ) and the mass flow overserved by the Coriolis mass flow meter. For the chosen evaluation interval from 3.3–4.9 s, the mean values are shown in Table 5.
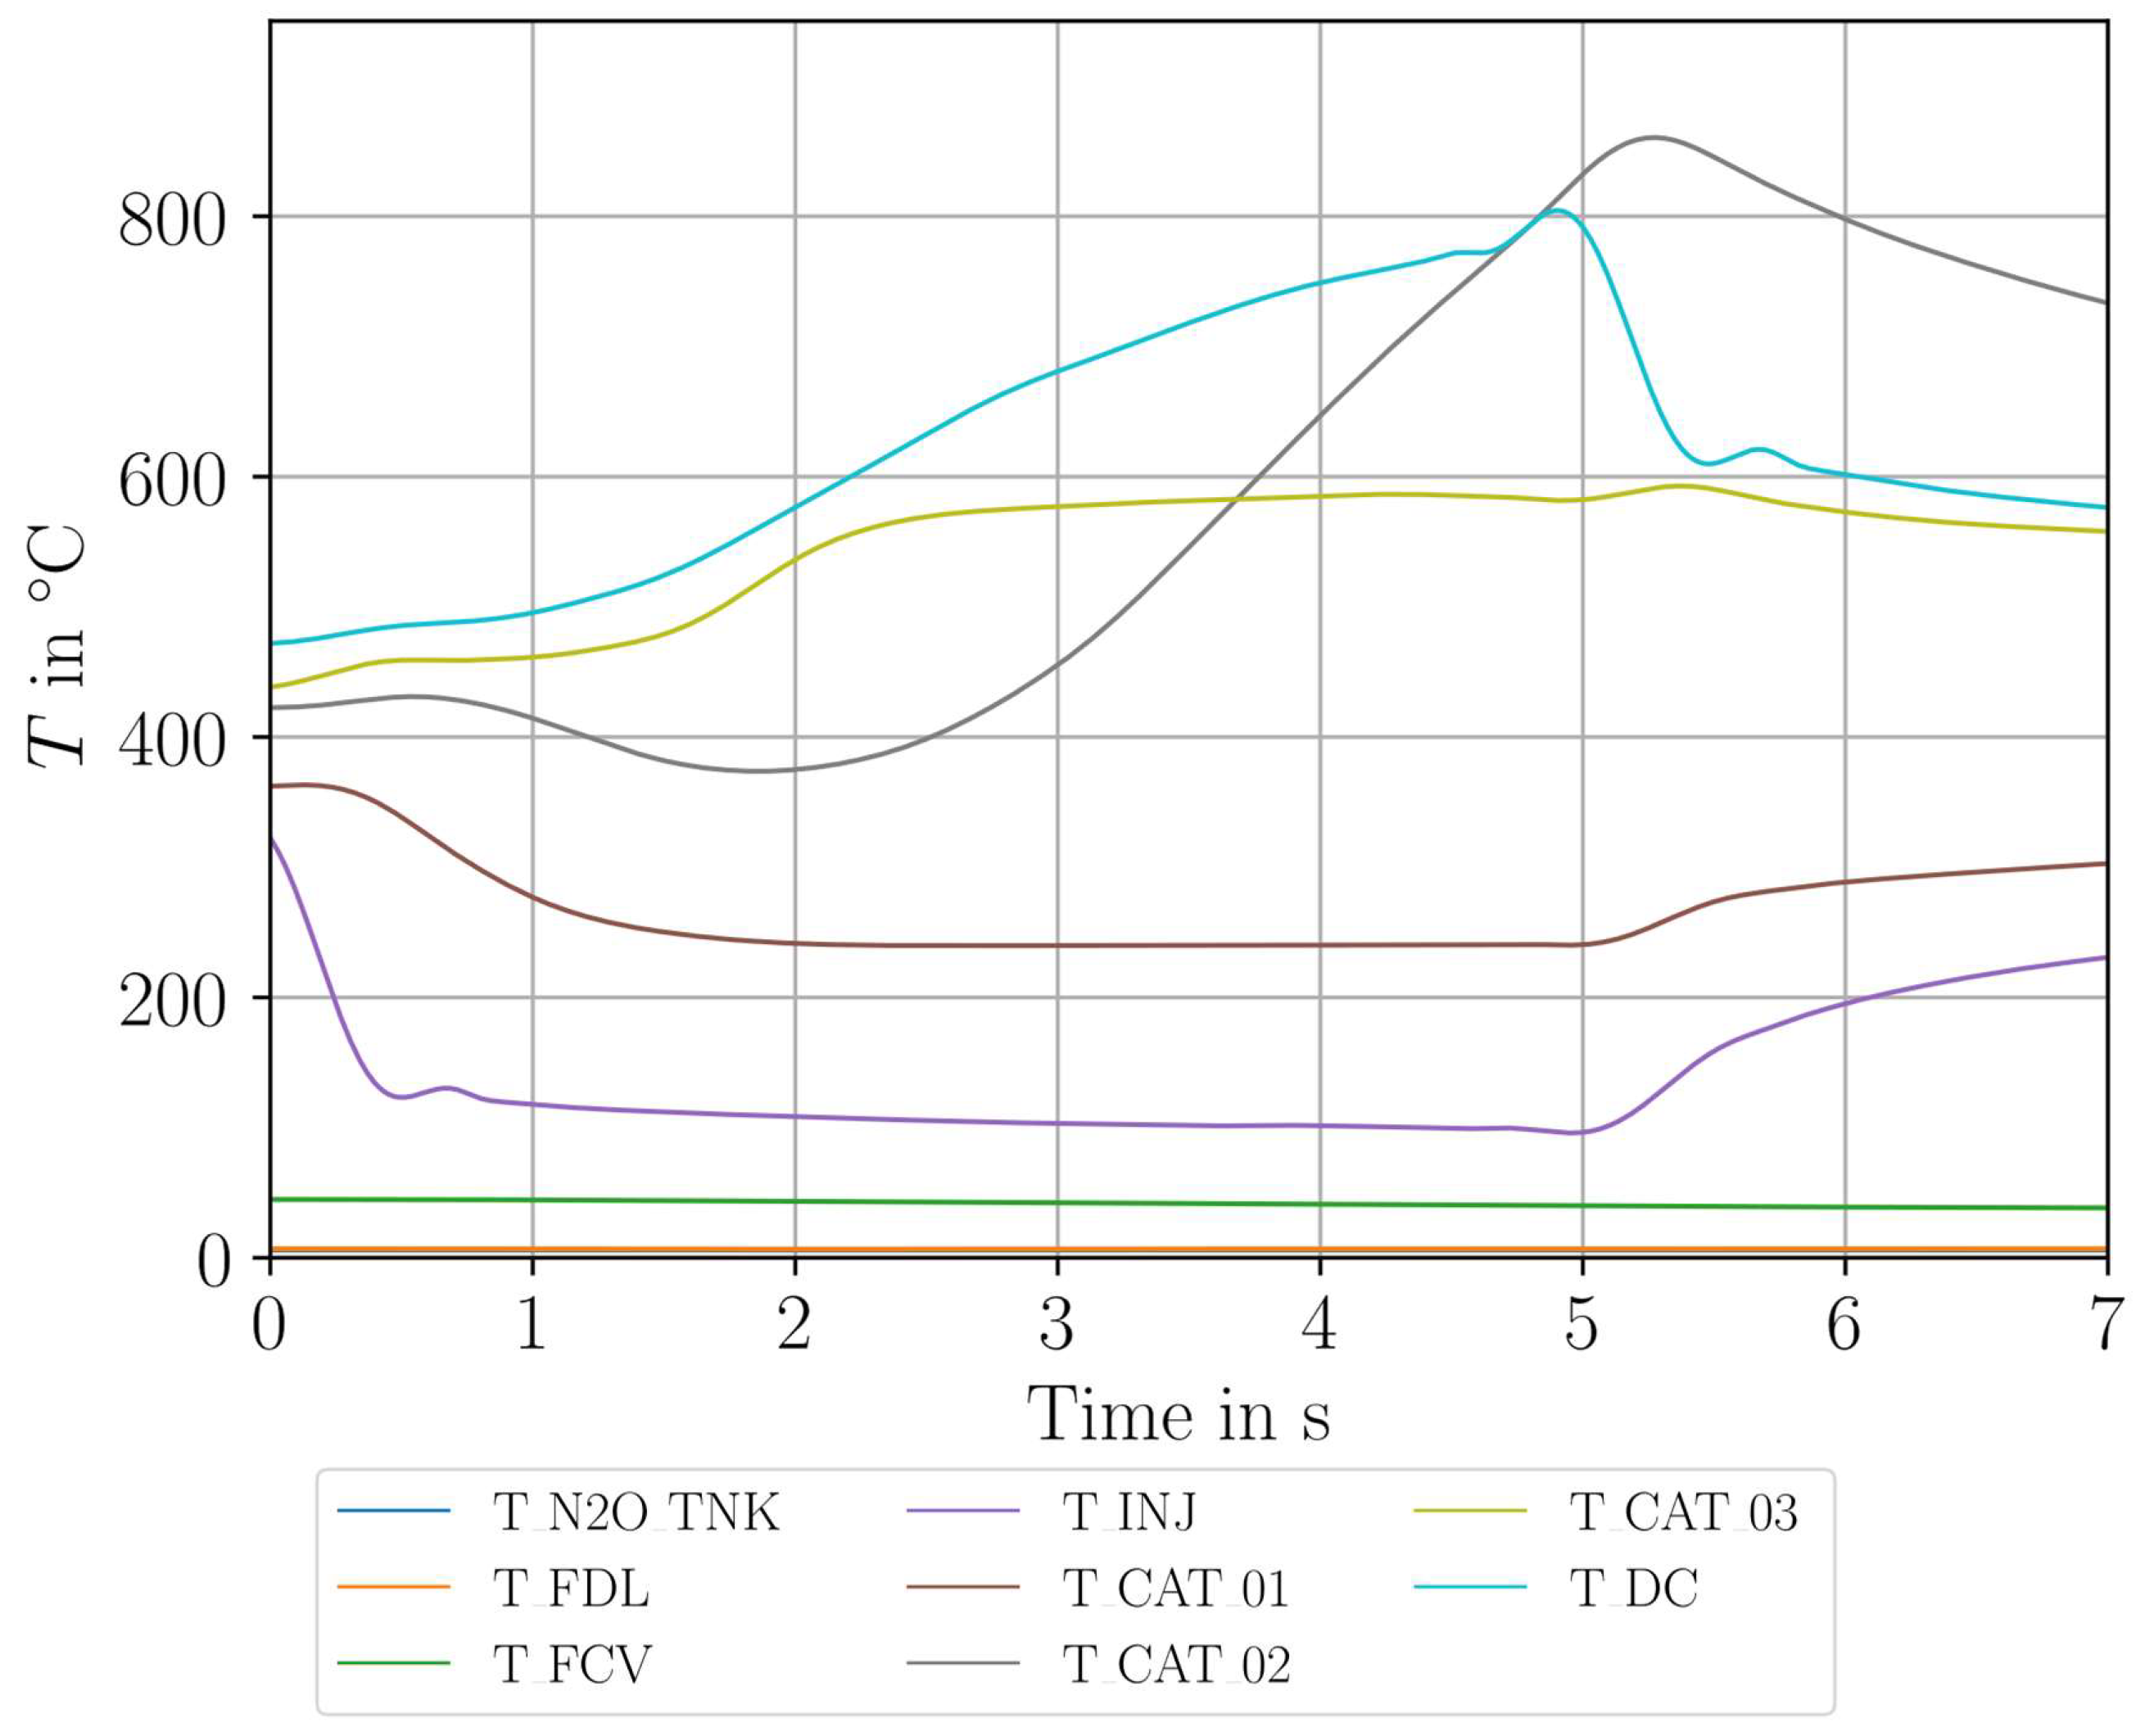
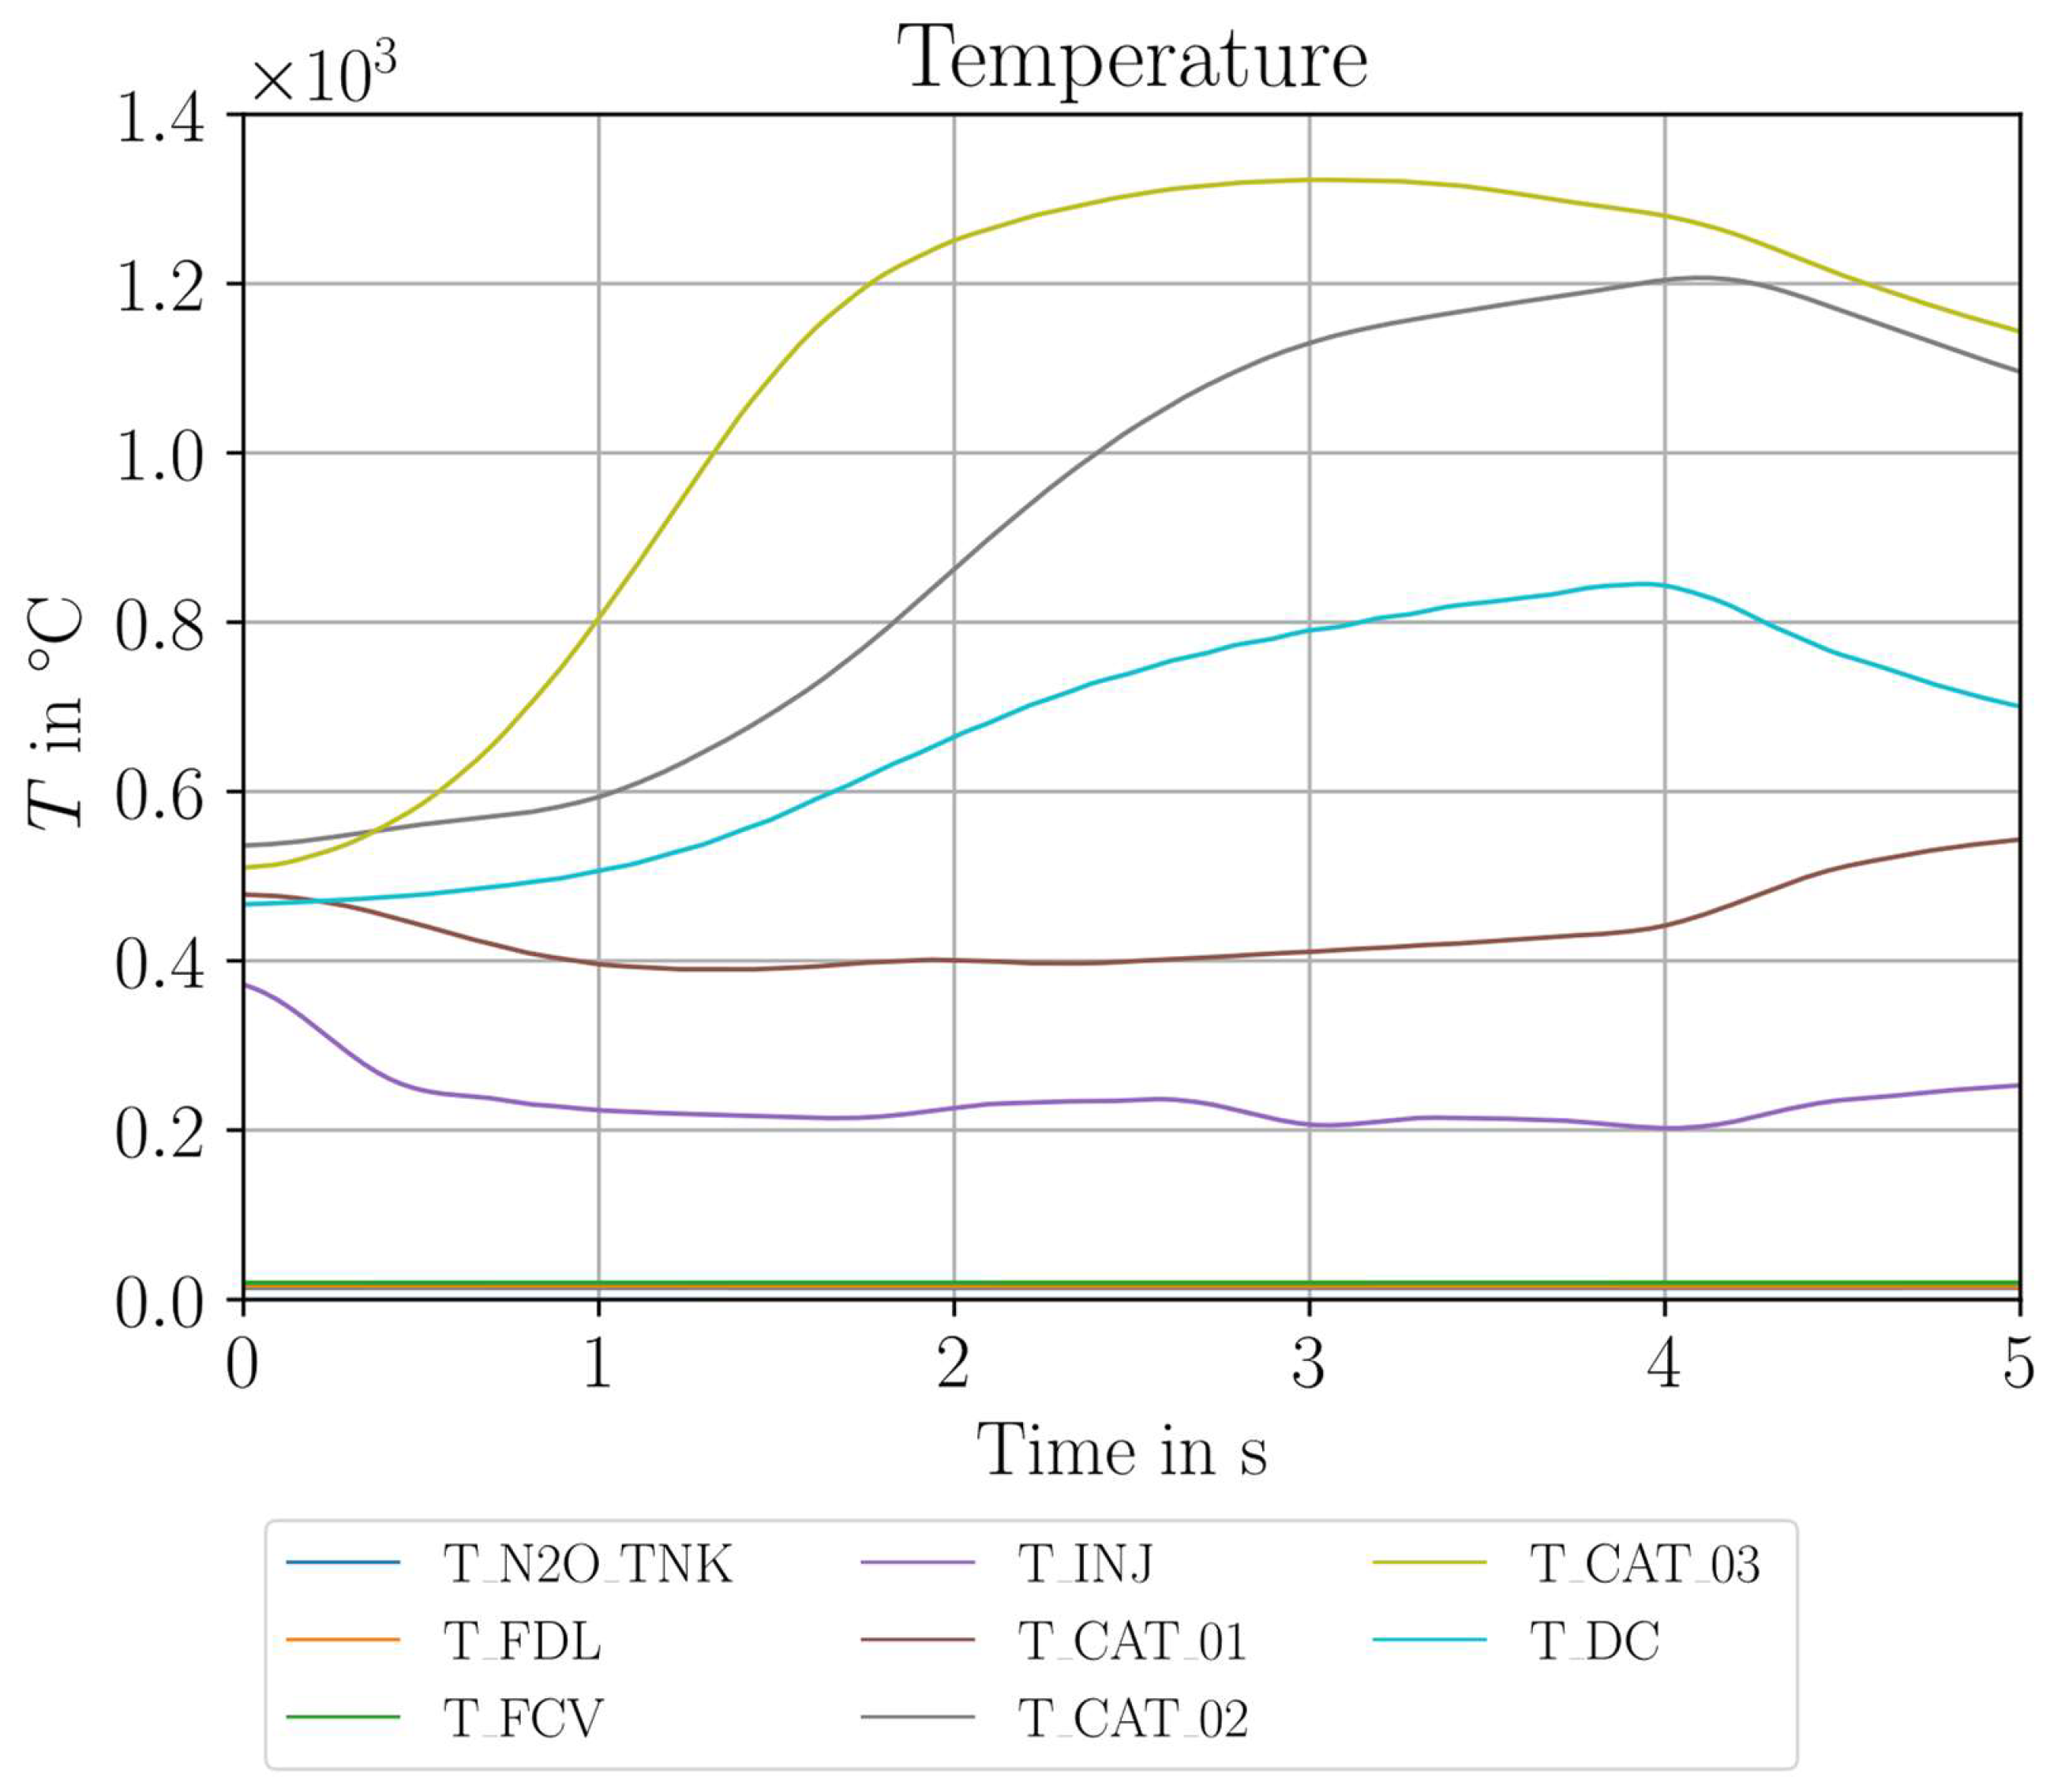
The theoretical value given in Table 5 was calculated using NASA CEA, assuming frozen flow after throat, using the inflow temperature and chamber pressure from the respective experiment. The mean pressure loss across the catalyst bed is 0.17 bar. The catalyst bed pre-heat temperature measured at thermocouple T CAT _ 02 is 420 °C. T CAT _ 02 was taken as a reference for the pre-heating temperature, as it is positioned in the center of the catalyst bed. The trajectory of the measured temperature inside the catalyst distinguishes the different positions. During the experiment, the temperature measured after the catalyst ( P D C ) is the highest. For the first 2.5 s, the T CAT _ 03 temperature increases nearly at the same rate as T D C . However, 2.5 s after opening the valve, the temperature at T CAT _ 03 nearly stagnates, whereas T CAT _ 02 , which occurred before, rather than decreasing, starts to increase drastically to temperatures over 800 °C and also surpasses T D C right after the closing of the valve. This indicates a displacement of the main reaction zone after about 2.5 s of operation to more upstream parts of the catalyst. The exact reason for this phenomenon cannot be clearly identified from the measurement data; maybe it is a result of heat conduction inside the catalyst during the operation.
Figure 16 presents a temperature plot of a 5 s test with nearly identical feedline conditions to the test before. The mass flow was reduced by 0.03 g/s compared to Test No. 1. The pre-heating temperature was slightly higher, at 445 °C. In this test, a temperature increase can be seen as well, which indicates decomposition. Interestingly, the measured temperature distribution in the catalyst bed and the decomposition chamber is different from the experiment shown above. In this case, the T CAT _ 03 thermocouple registers 913 °C, the highest value, whereas in the test above, T CAT _ 02 shows the highest temperature. The absolute value of the maximum temperature is also more than 100 °C higher than in the experiment shown before. In this experiment, the zone of reaction was stable, located around the last thermocouple T CAT _ 03 in the catalyst. The measured c * efficiency is nearly 9% higher compared with the experiment before (see Table 6).
In both tests, the temperature in the catalyst that was closest to the injector T CAT _ 01 shows lower temperatures for the pre-heating values. Moreover, the temperature measured after the injector drops instantly after opening the valve. This indicates that, at this position in the catalyst bed, no reaction took place.
In both cases, the temperature in the decomposition chamber after the catalyst bed is lower than in the catalyst, which may be a result of heat losses.
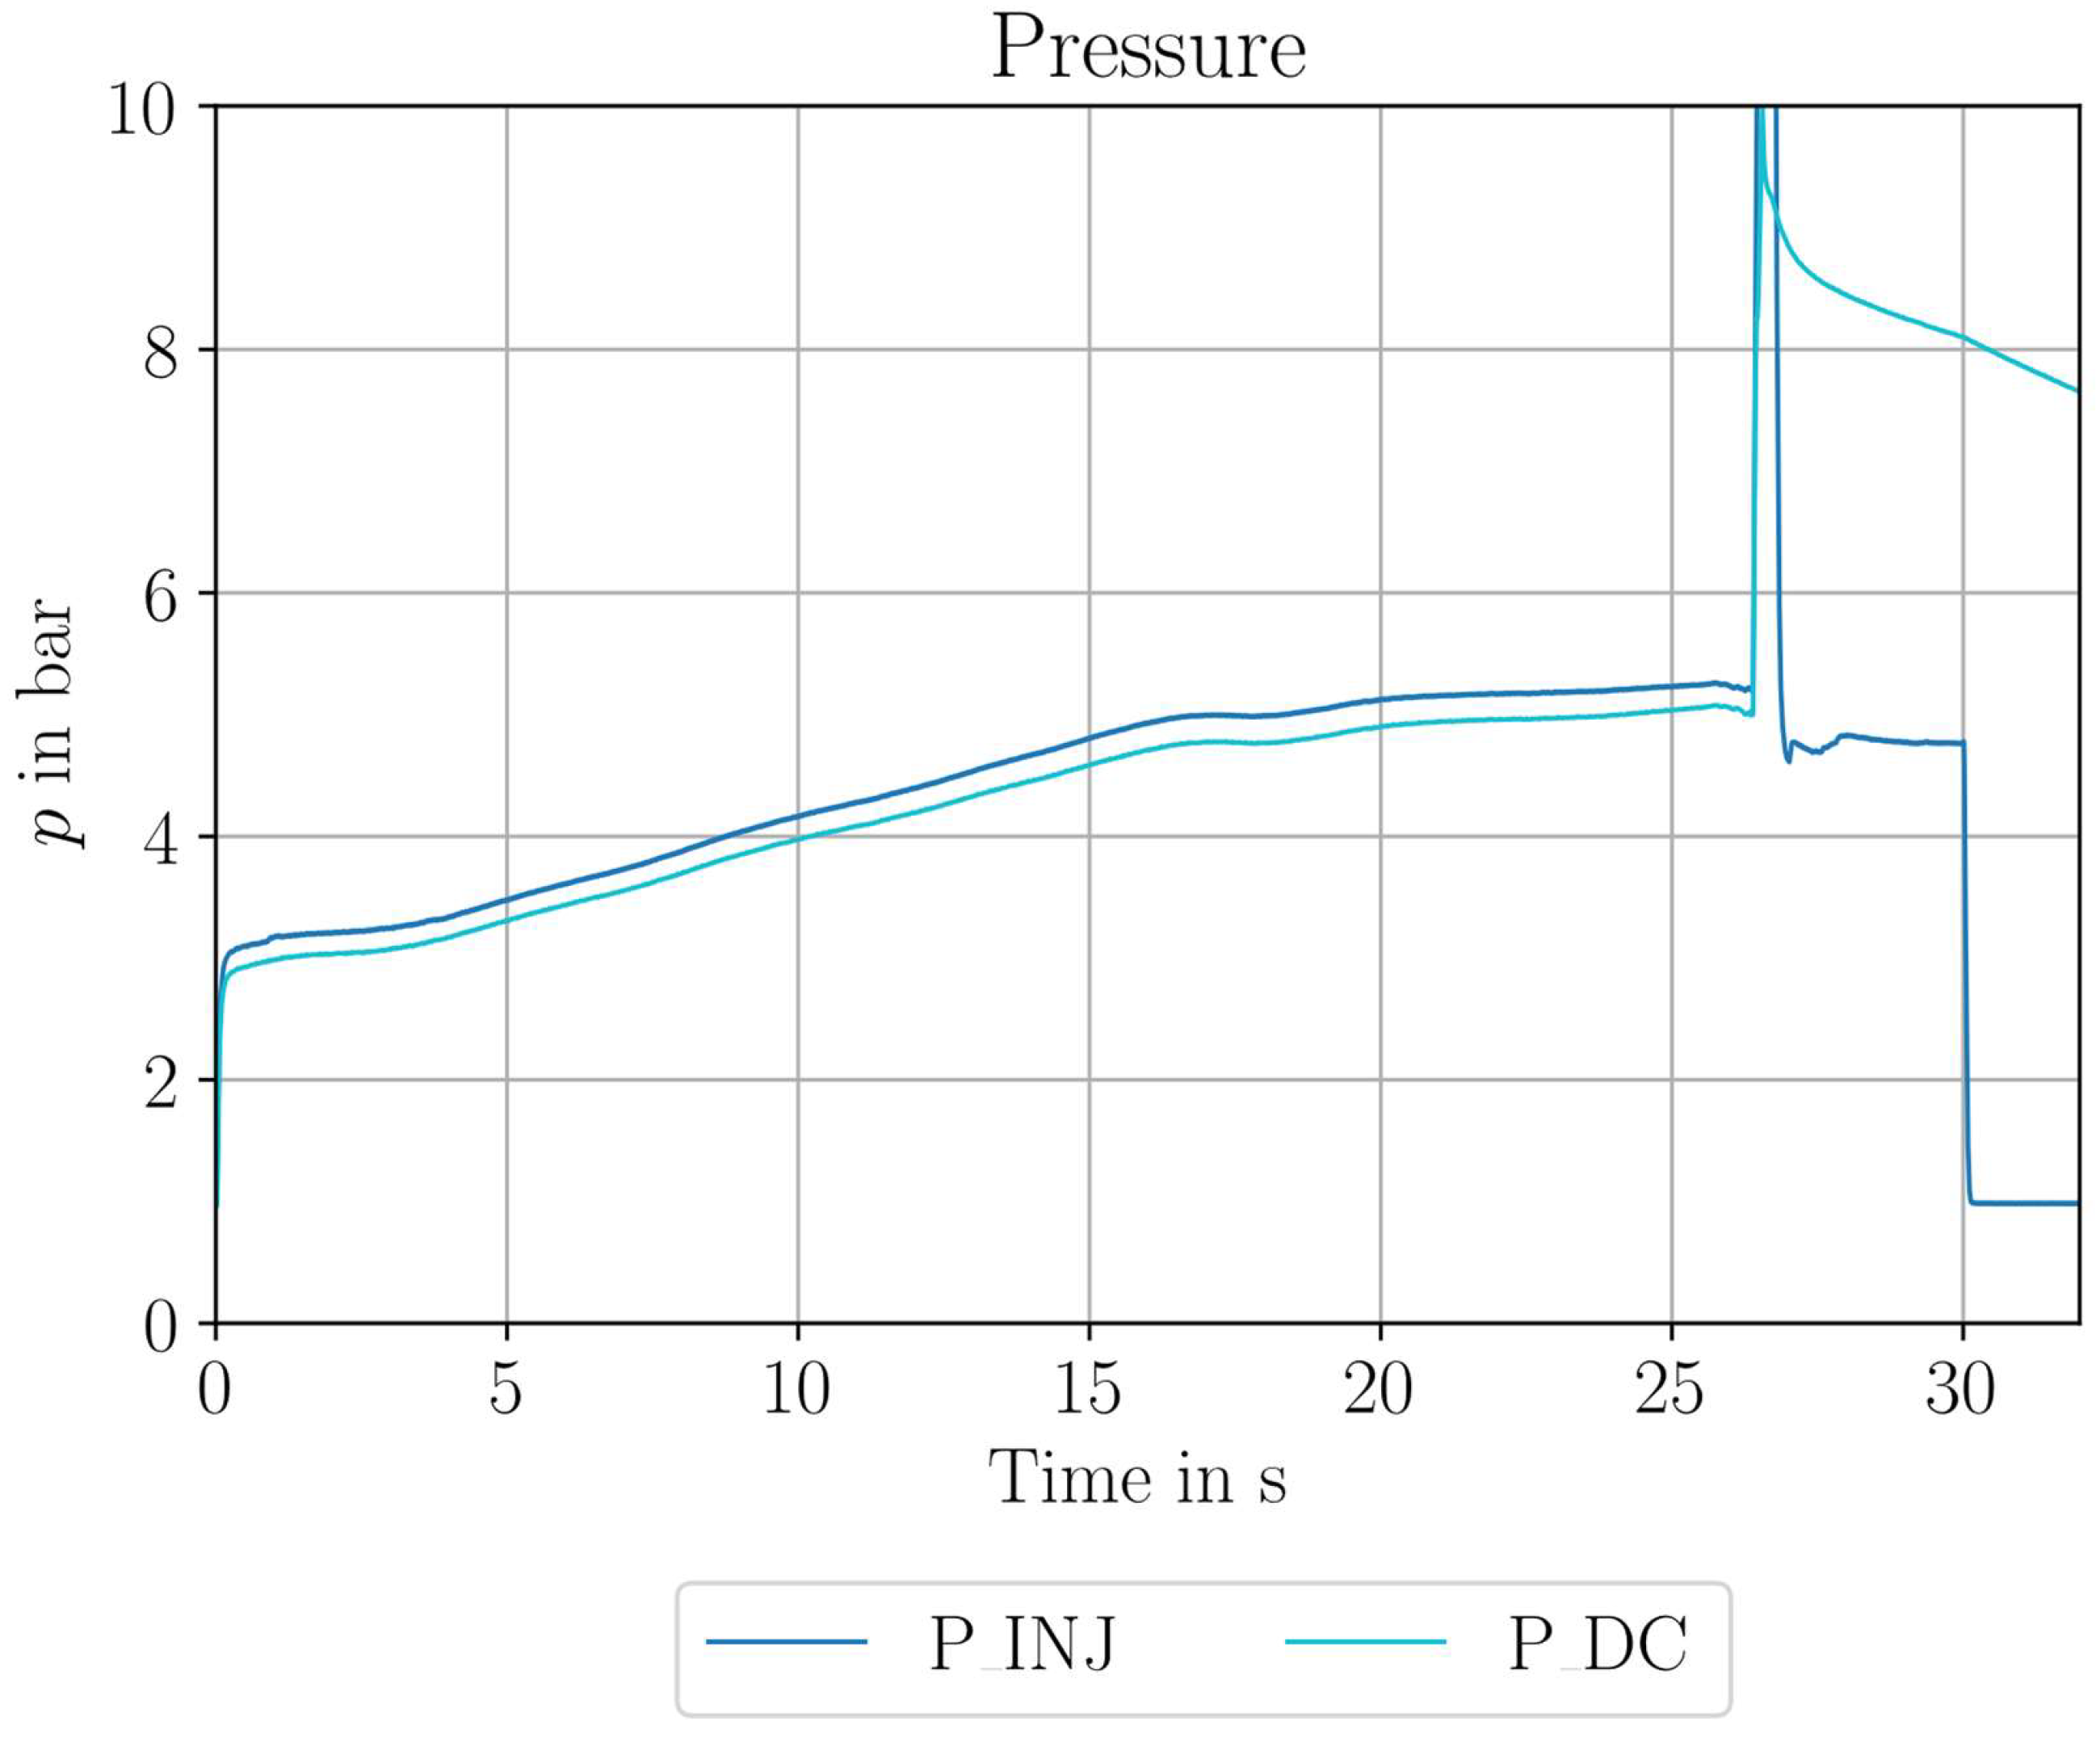
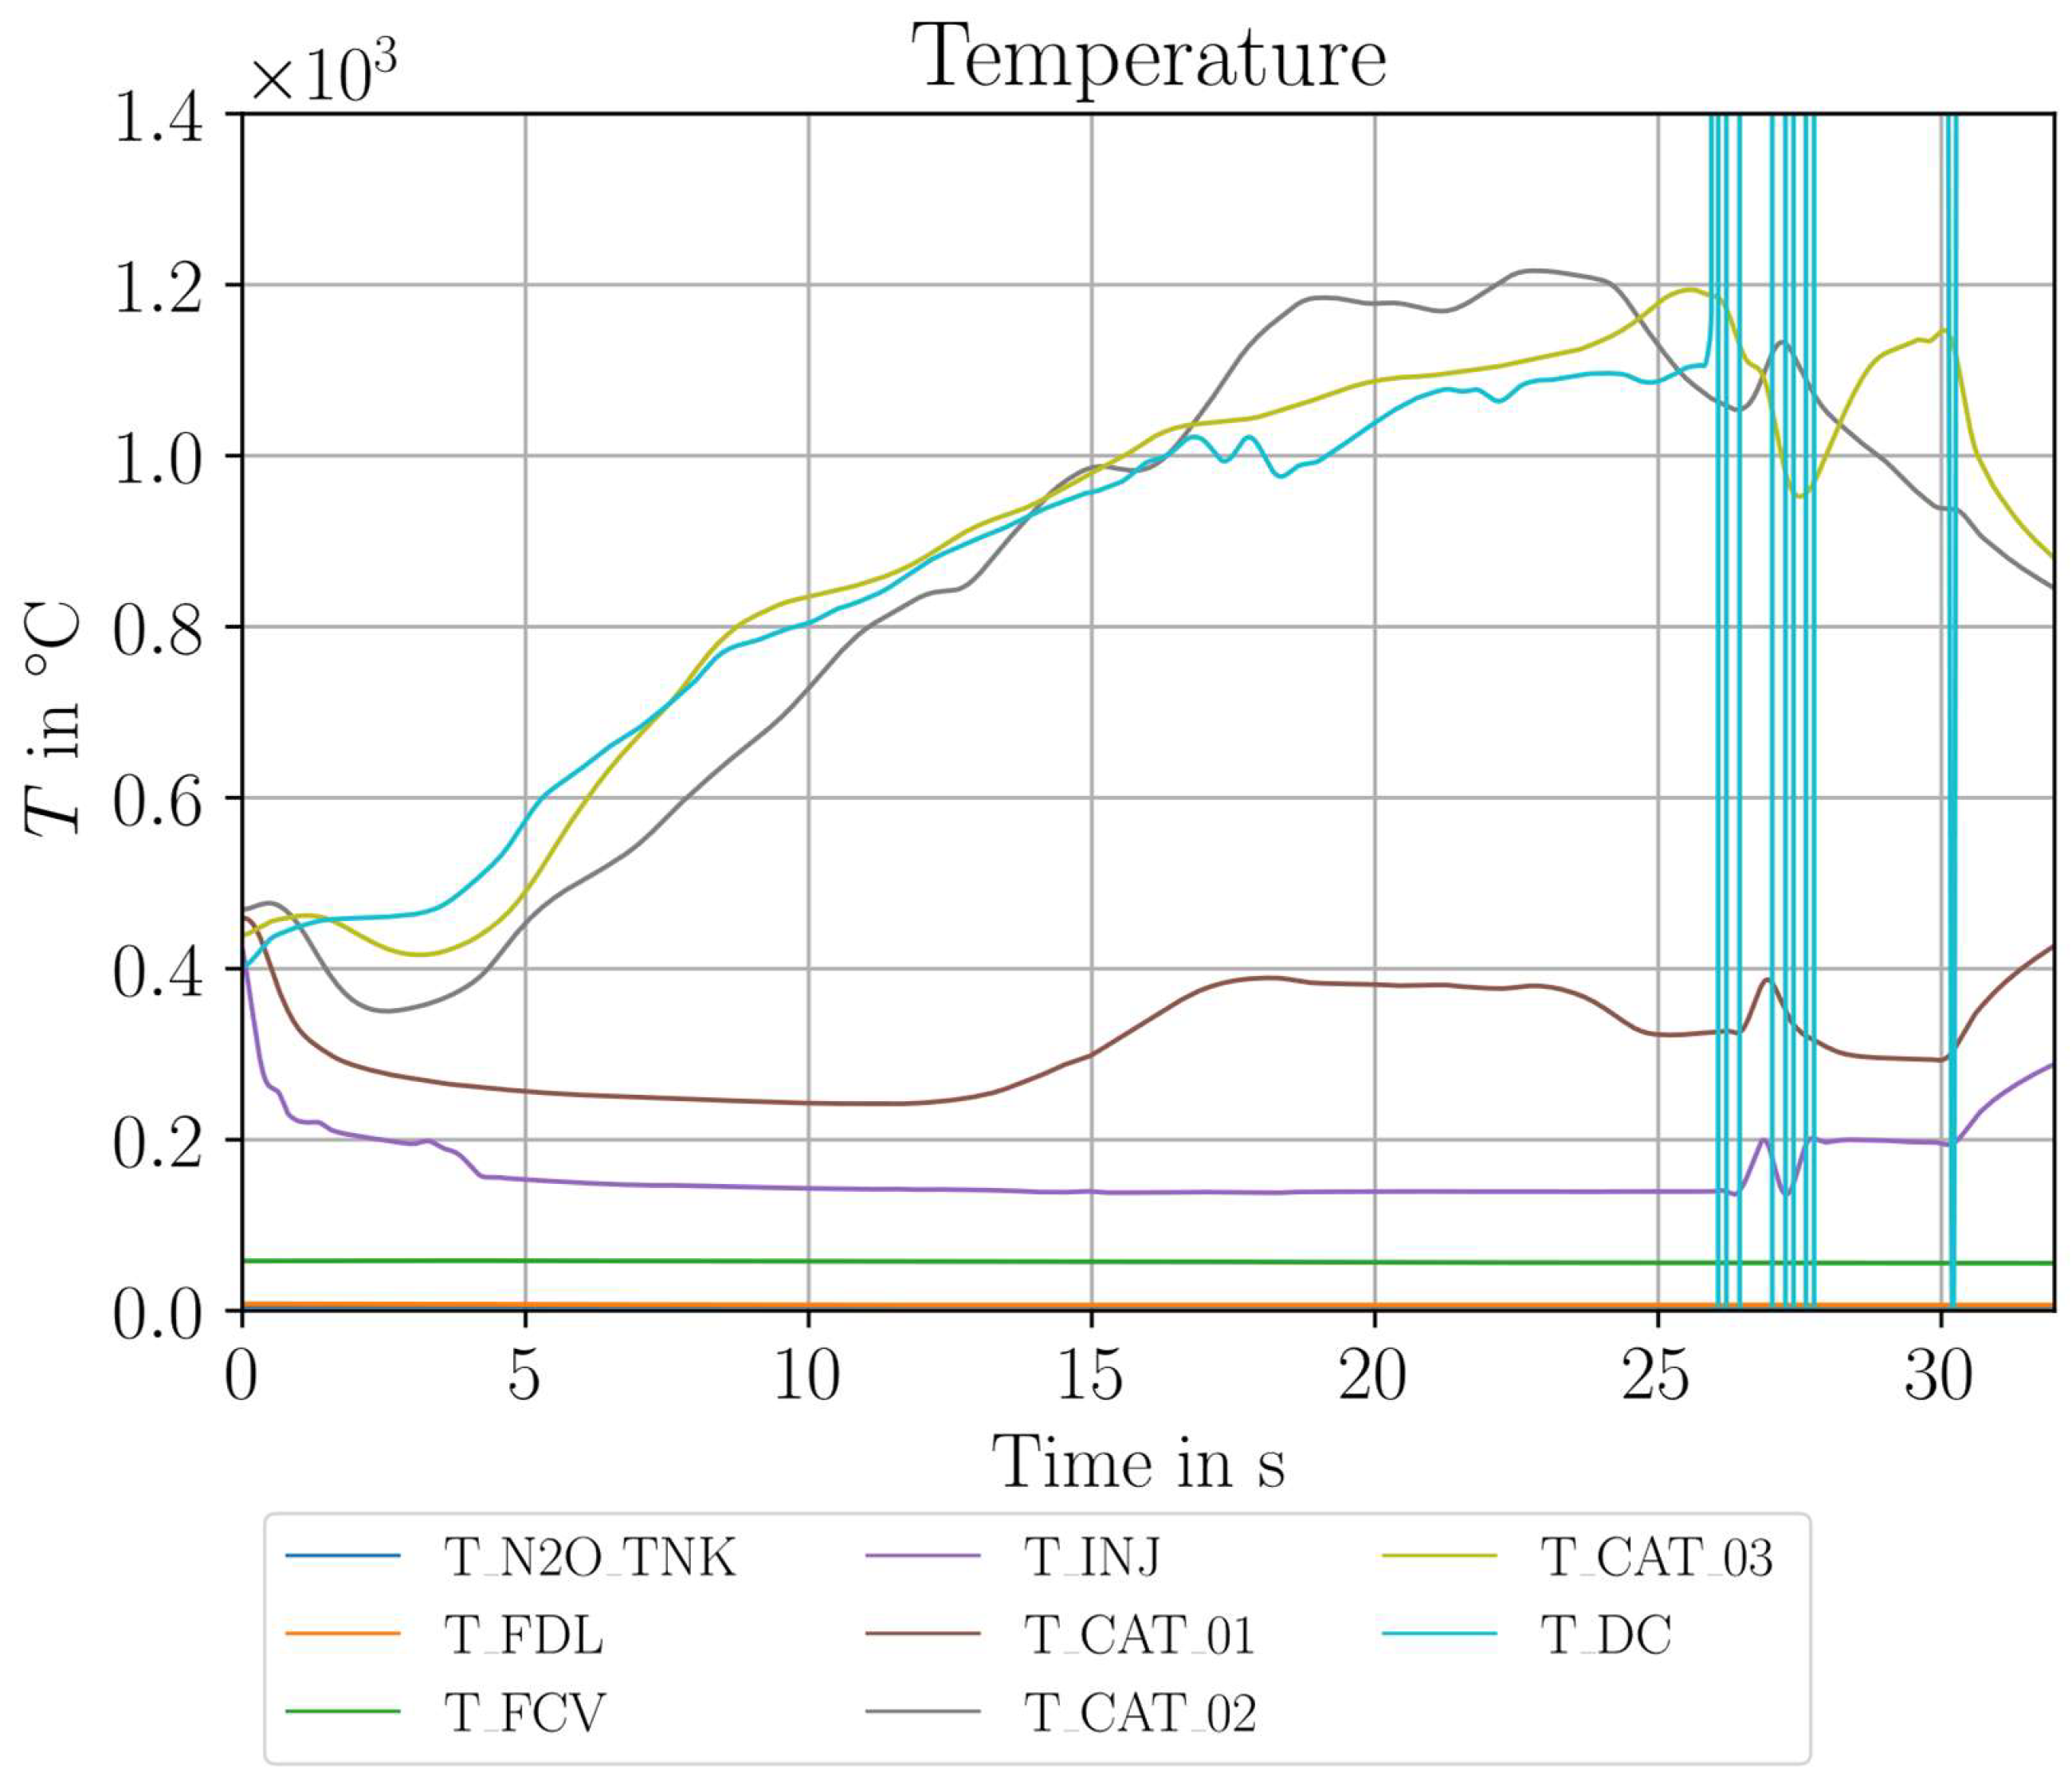
Figure 17 and Figure 18 show an experiment with a total firing time of 25 s . In the pressure plot, it can be seen that between 20 and 25 s, nearly stationary operation in terms of chamber pressure is given. The efficiency between 20 and 25 s was 88.2%. After 26 s , a destructive event happened that led to a sharp increase at the chamber and injector pressure sensors and the signal loss of thermocouple T CAT _ 03 .
It was found that, due to the hot temperature of around 1000–1200 °C, the retainer plate of the catalyst bed broke down and led to a partial blocking of the nozzle with the catalyst material. This caused the sharp pressure increase at second 26. After this spike, P D C decreases significantly more slowly than P I N J . This is probably induced by a blocking of the respective measurement port with catalyst material.
Interestingly, in Test No. 3, the three thermocouples T CAT _ 02 , T CAT _ 03 , and T D C do not show such significant temperature differences as in the 5-s tests. At about 15 s of operation, T CAT _ 02 shows higher values than T CAT _ 03 , and at the same time, the temperature at T CAT _ 01 increases as well. This indicates, once again, a shift in the zone of reaction during the hot run of the thruster. The performance data of Test No. 3 is given in Table 7.
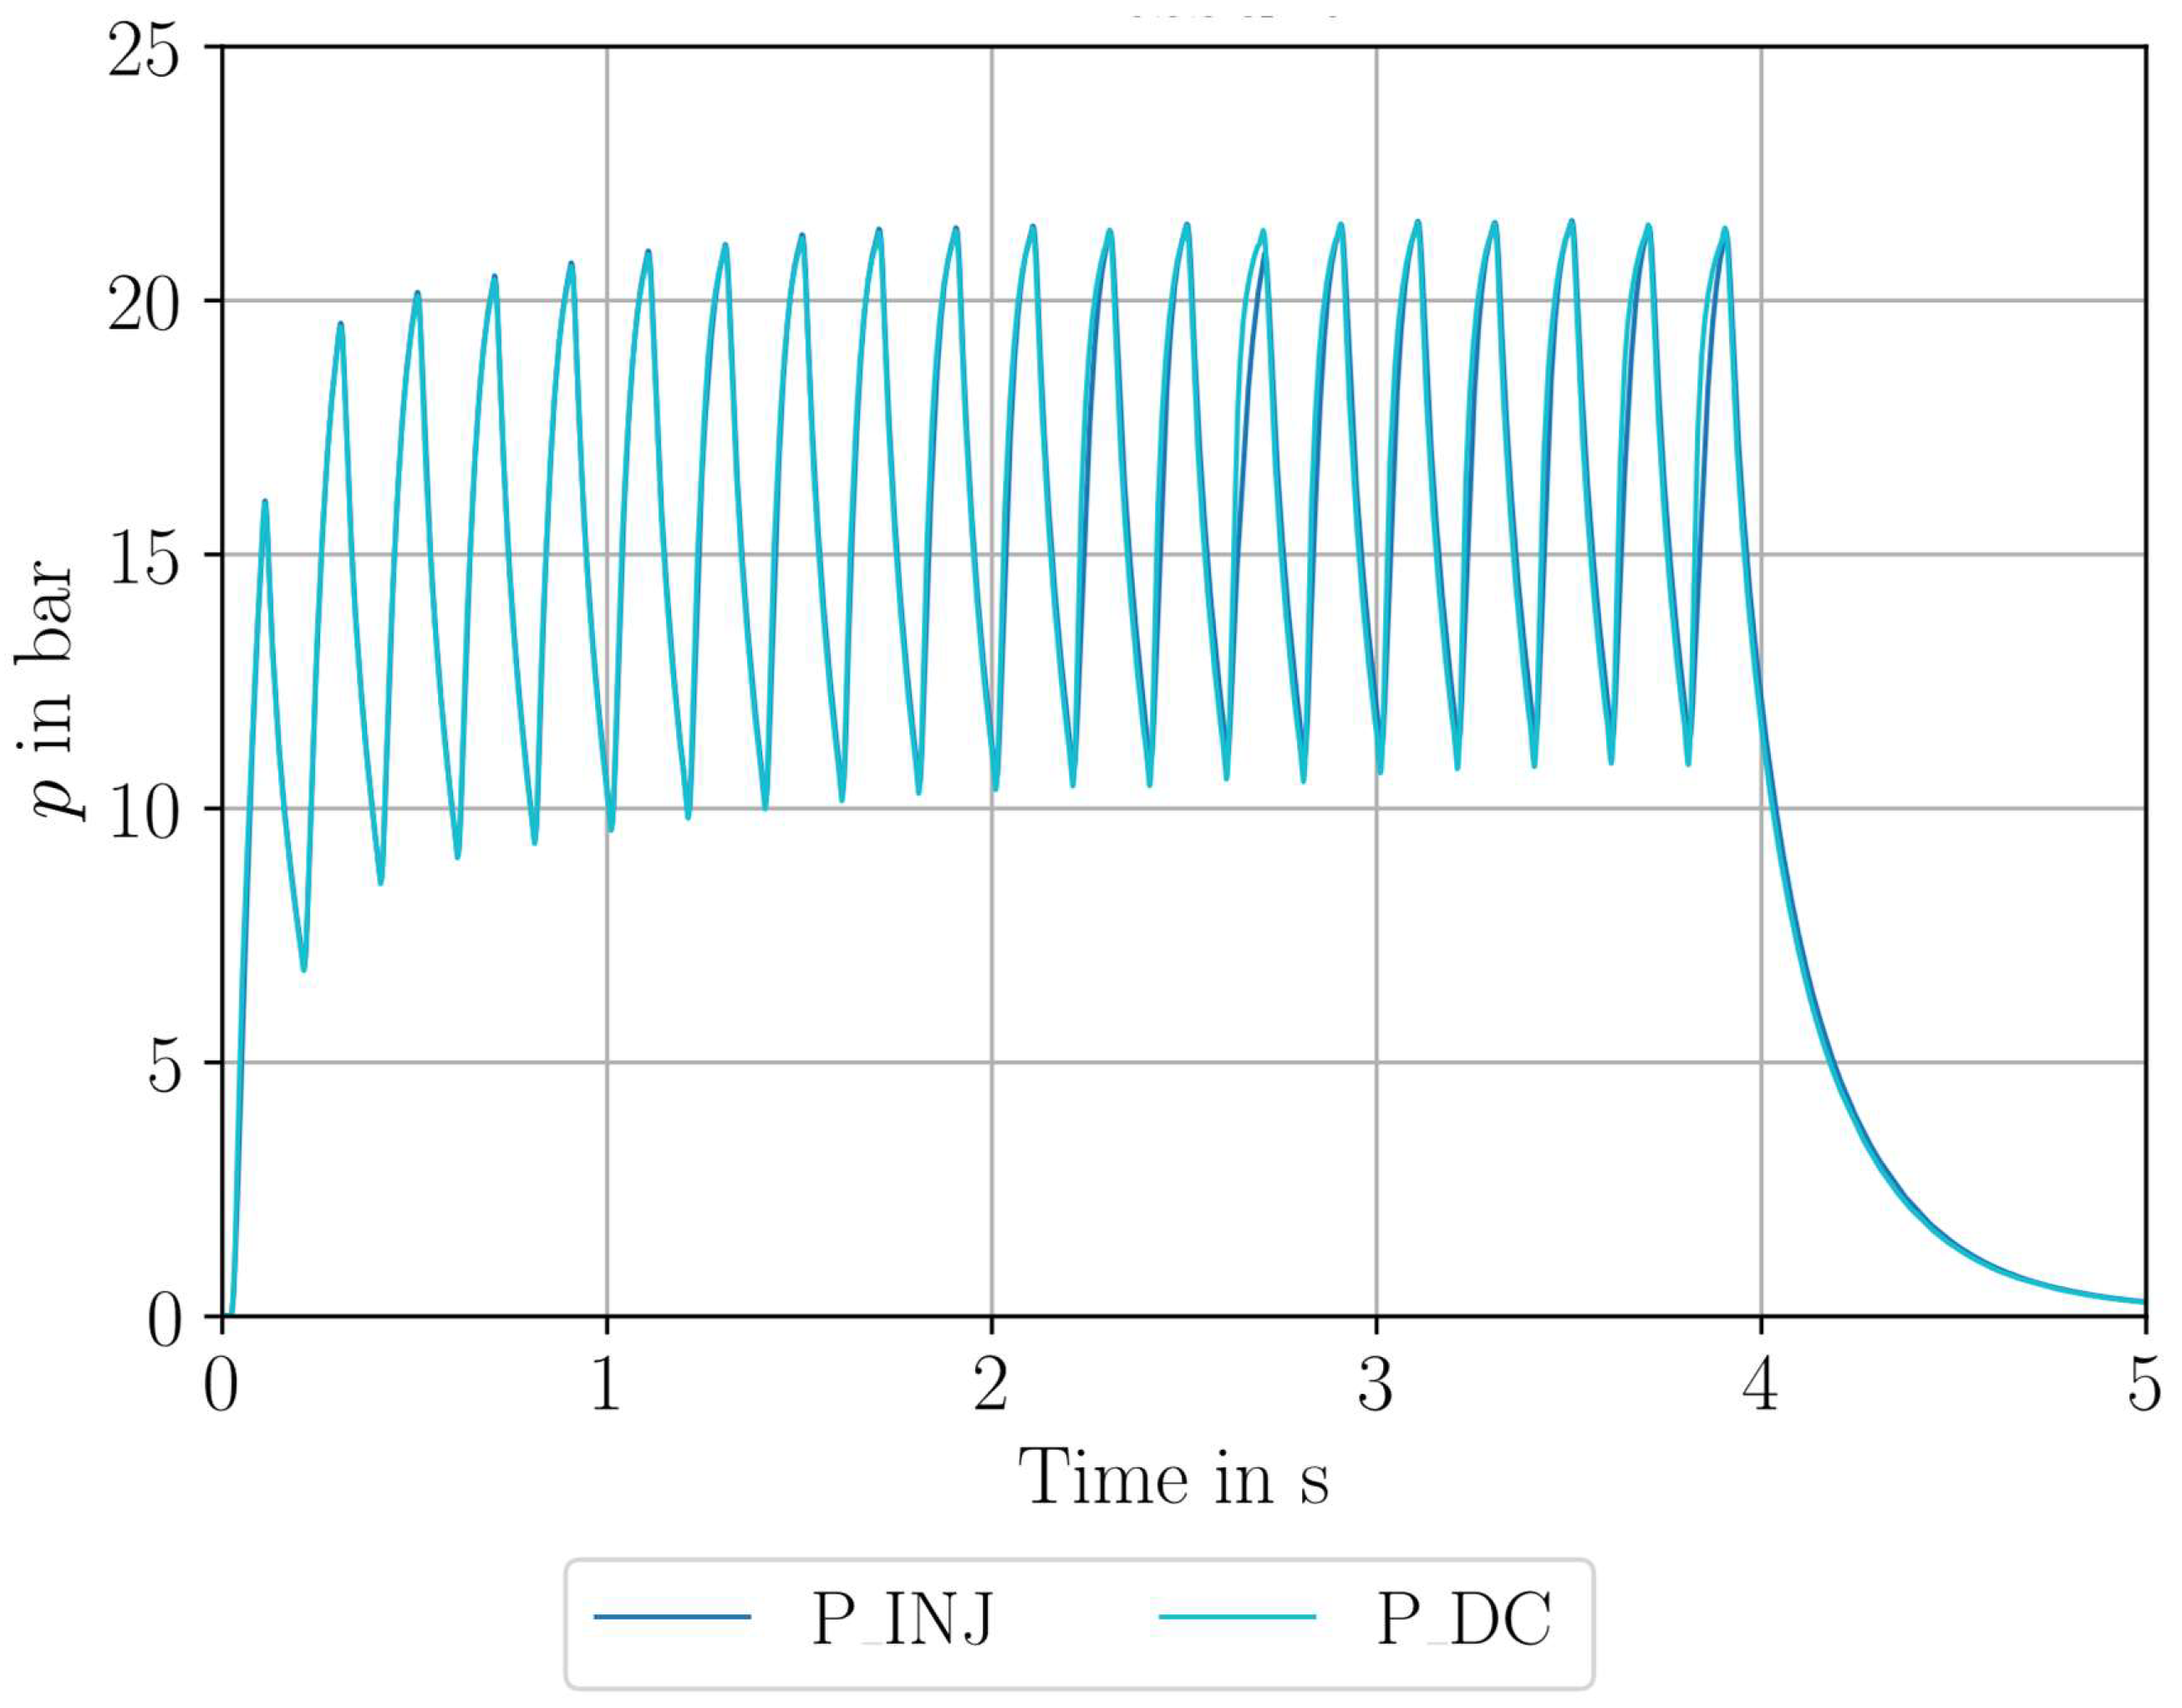
The following Figure 19 and Figure 20 show a pulse experiment. A total of 20 pulses with a frequency of 5 Hz and a duty cycle of 50% were fired. This means the valves were opened for 100 m s each and closed subsequently for 100 m s . Due to the destruction of the retainer plate in the previous experiment, the nozzle was blocked partially in this series of experiments, and therefore, the exact throat diameter is not known to the authors. However, it can be assumed that it is substantially less than the unblocked nozzle diameter. A hypothetically calculated diameter with an assumed efficiency of η c * = 80% and the measured mass flow and pressure values results in D t 0.08 mm and, therefore, L * = 100 . The mass flow rate in this experiment decreased, and therefore the CBL also decreased, whereas the pressure inside the chamber, due to the blocked nozzle, was higher than before.
In Figure 19, it can be seen that it takes about 2 s to reach a constant pressure level. After this start time, the pulses are repeatable. The closing time of the valve was too short to lower the pressure completely before the next pulse started. It has to be mentioned here that the fitting, tube, and mounting adapter of the chamber pressure transducers (compare Figure 1) may have influenced the dynamic pressure measurement.
In Figure 20, it can be seen that, at position three inside the catalyst bed, high temperatures were measured, which indicates a high rate of decomposition. However, the temperature in the decomposition chamber downstream of the catalyst is much lower. This is probably due to heat loss effects at low cat-bed loadings, as described by Lohner [56].
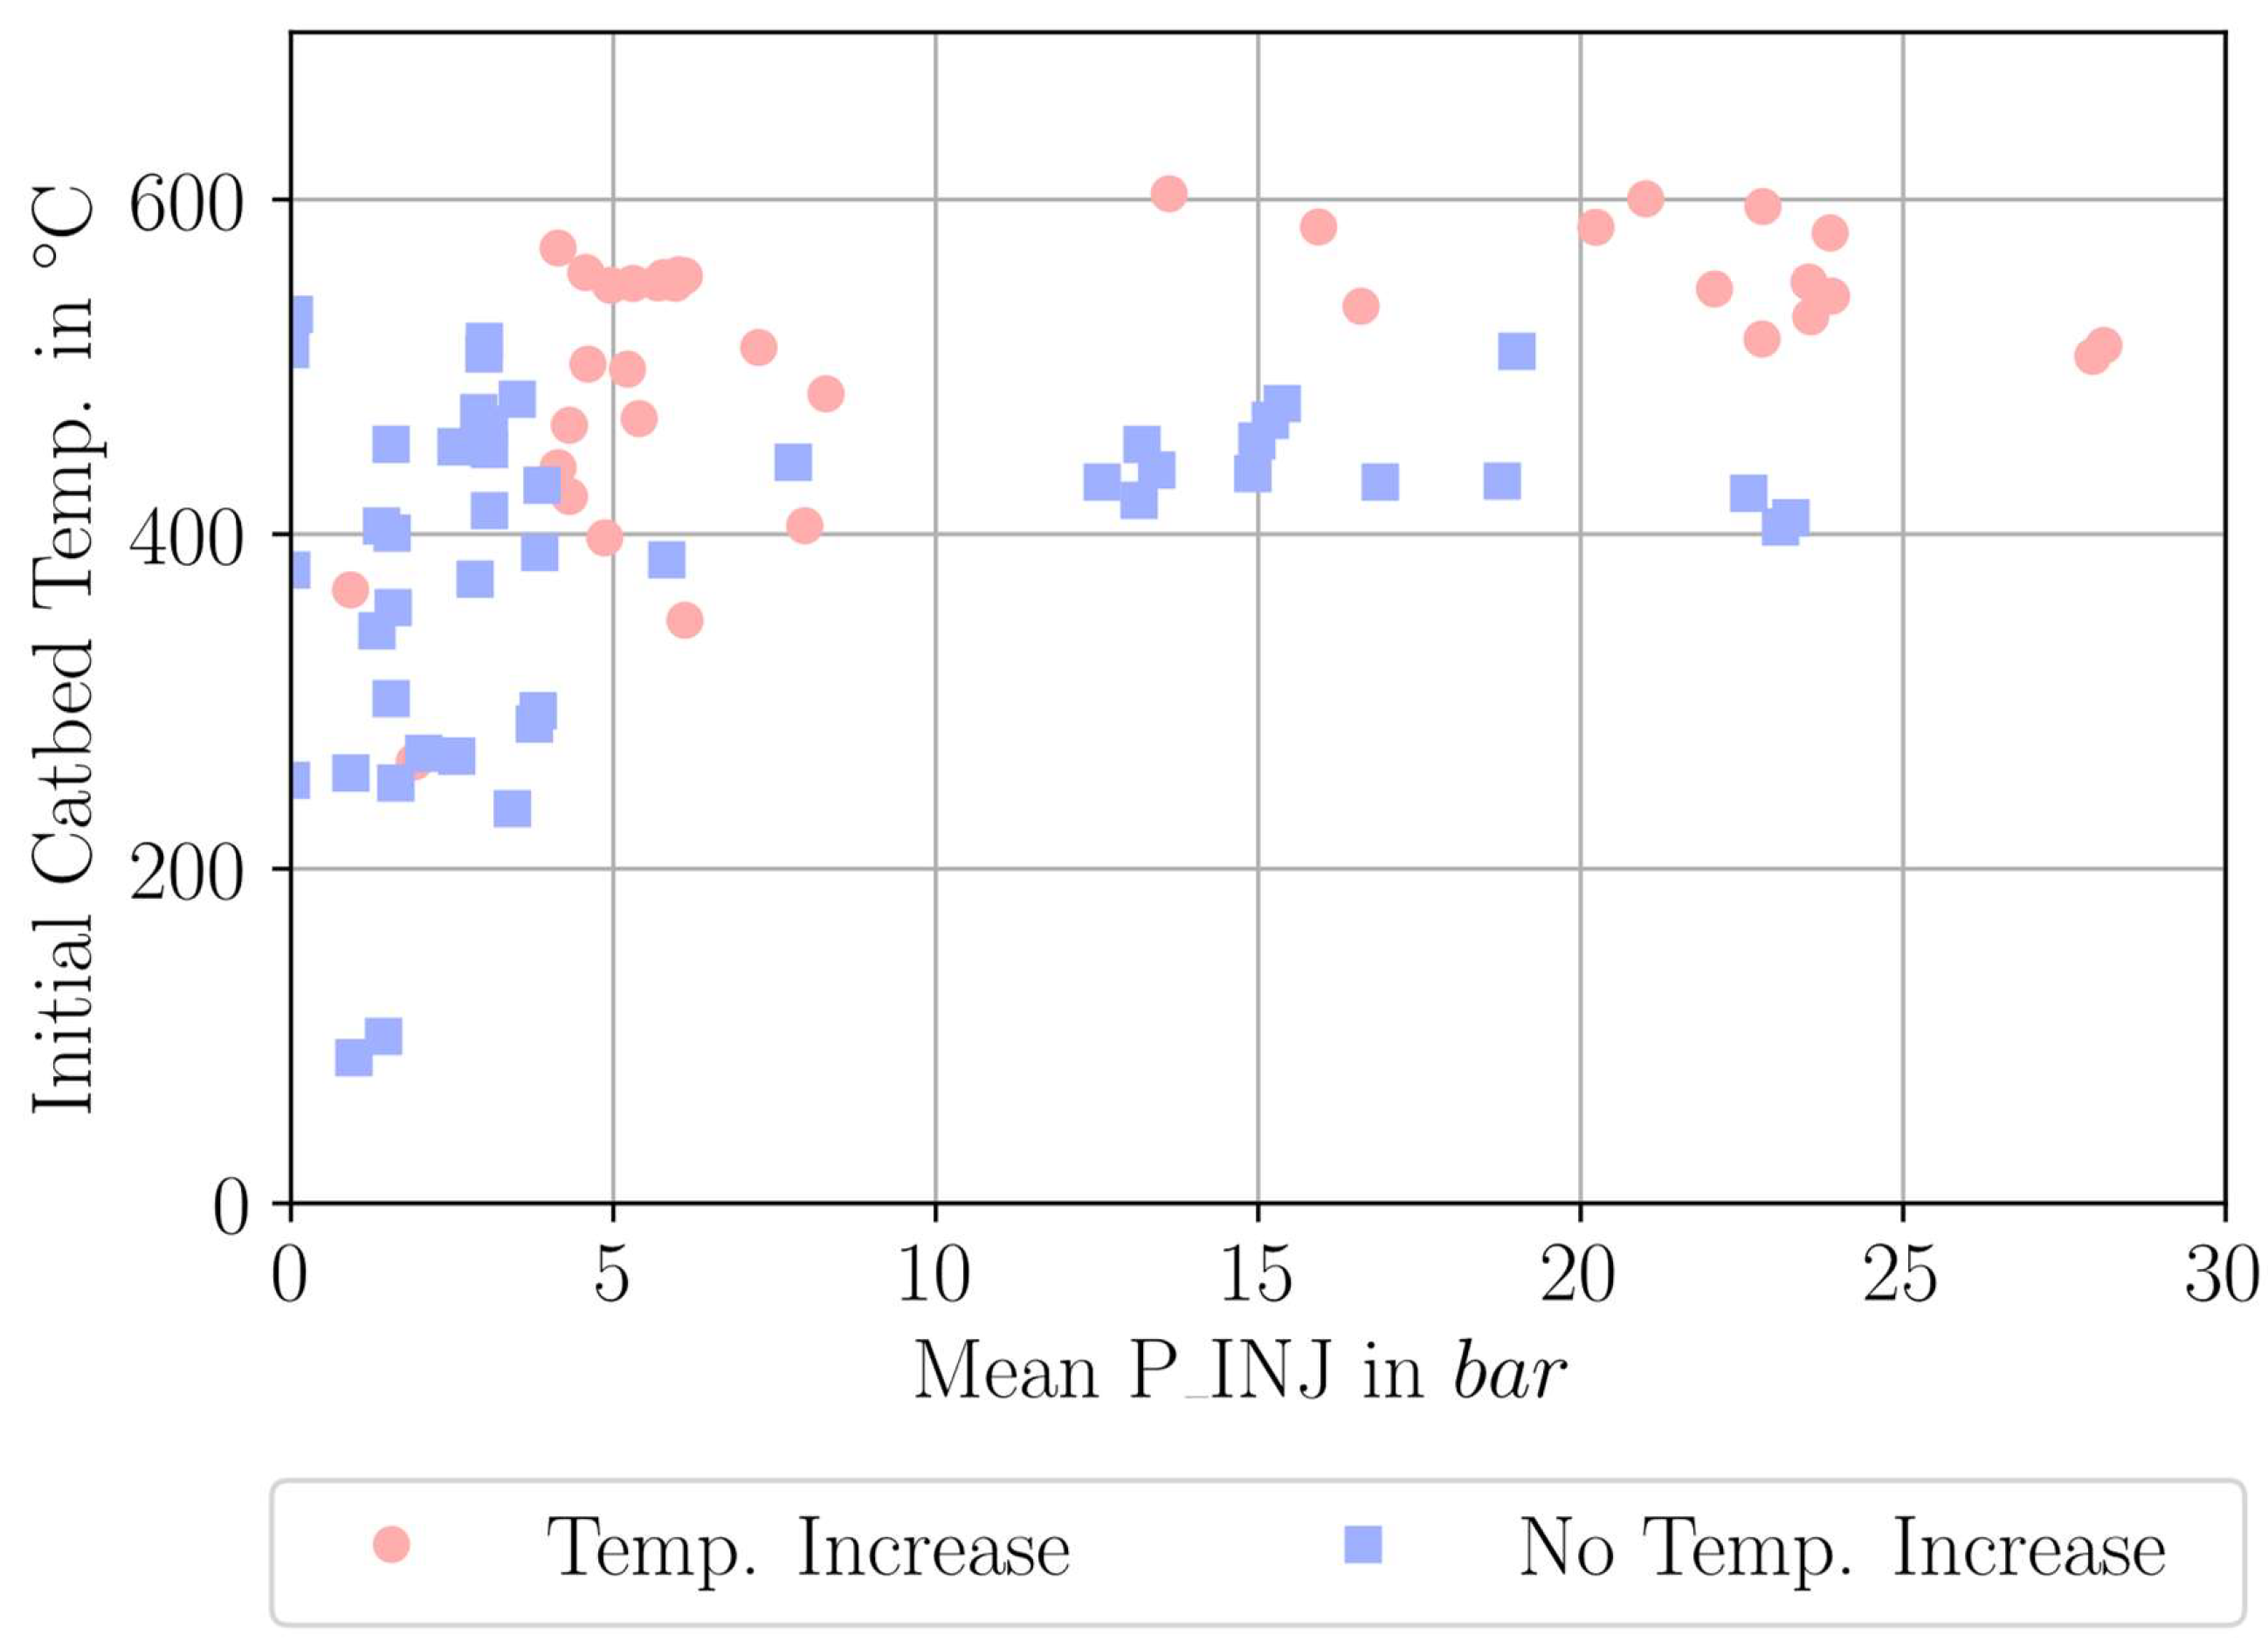
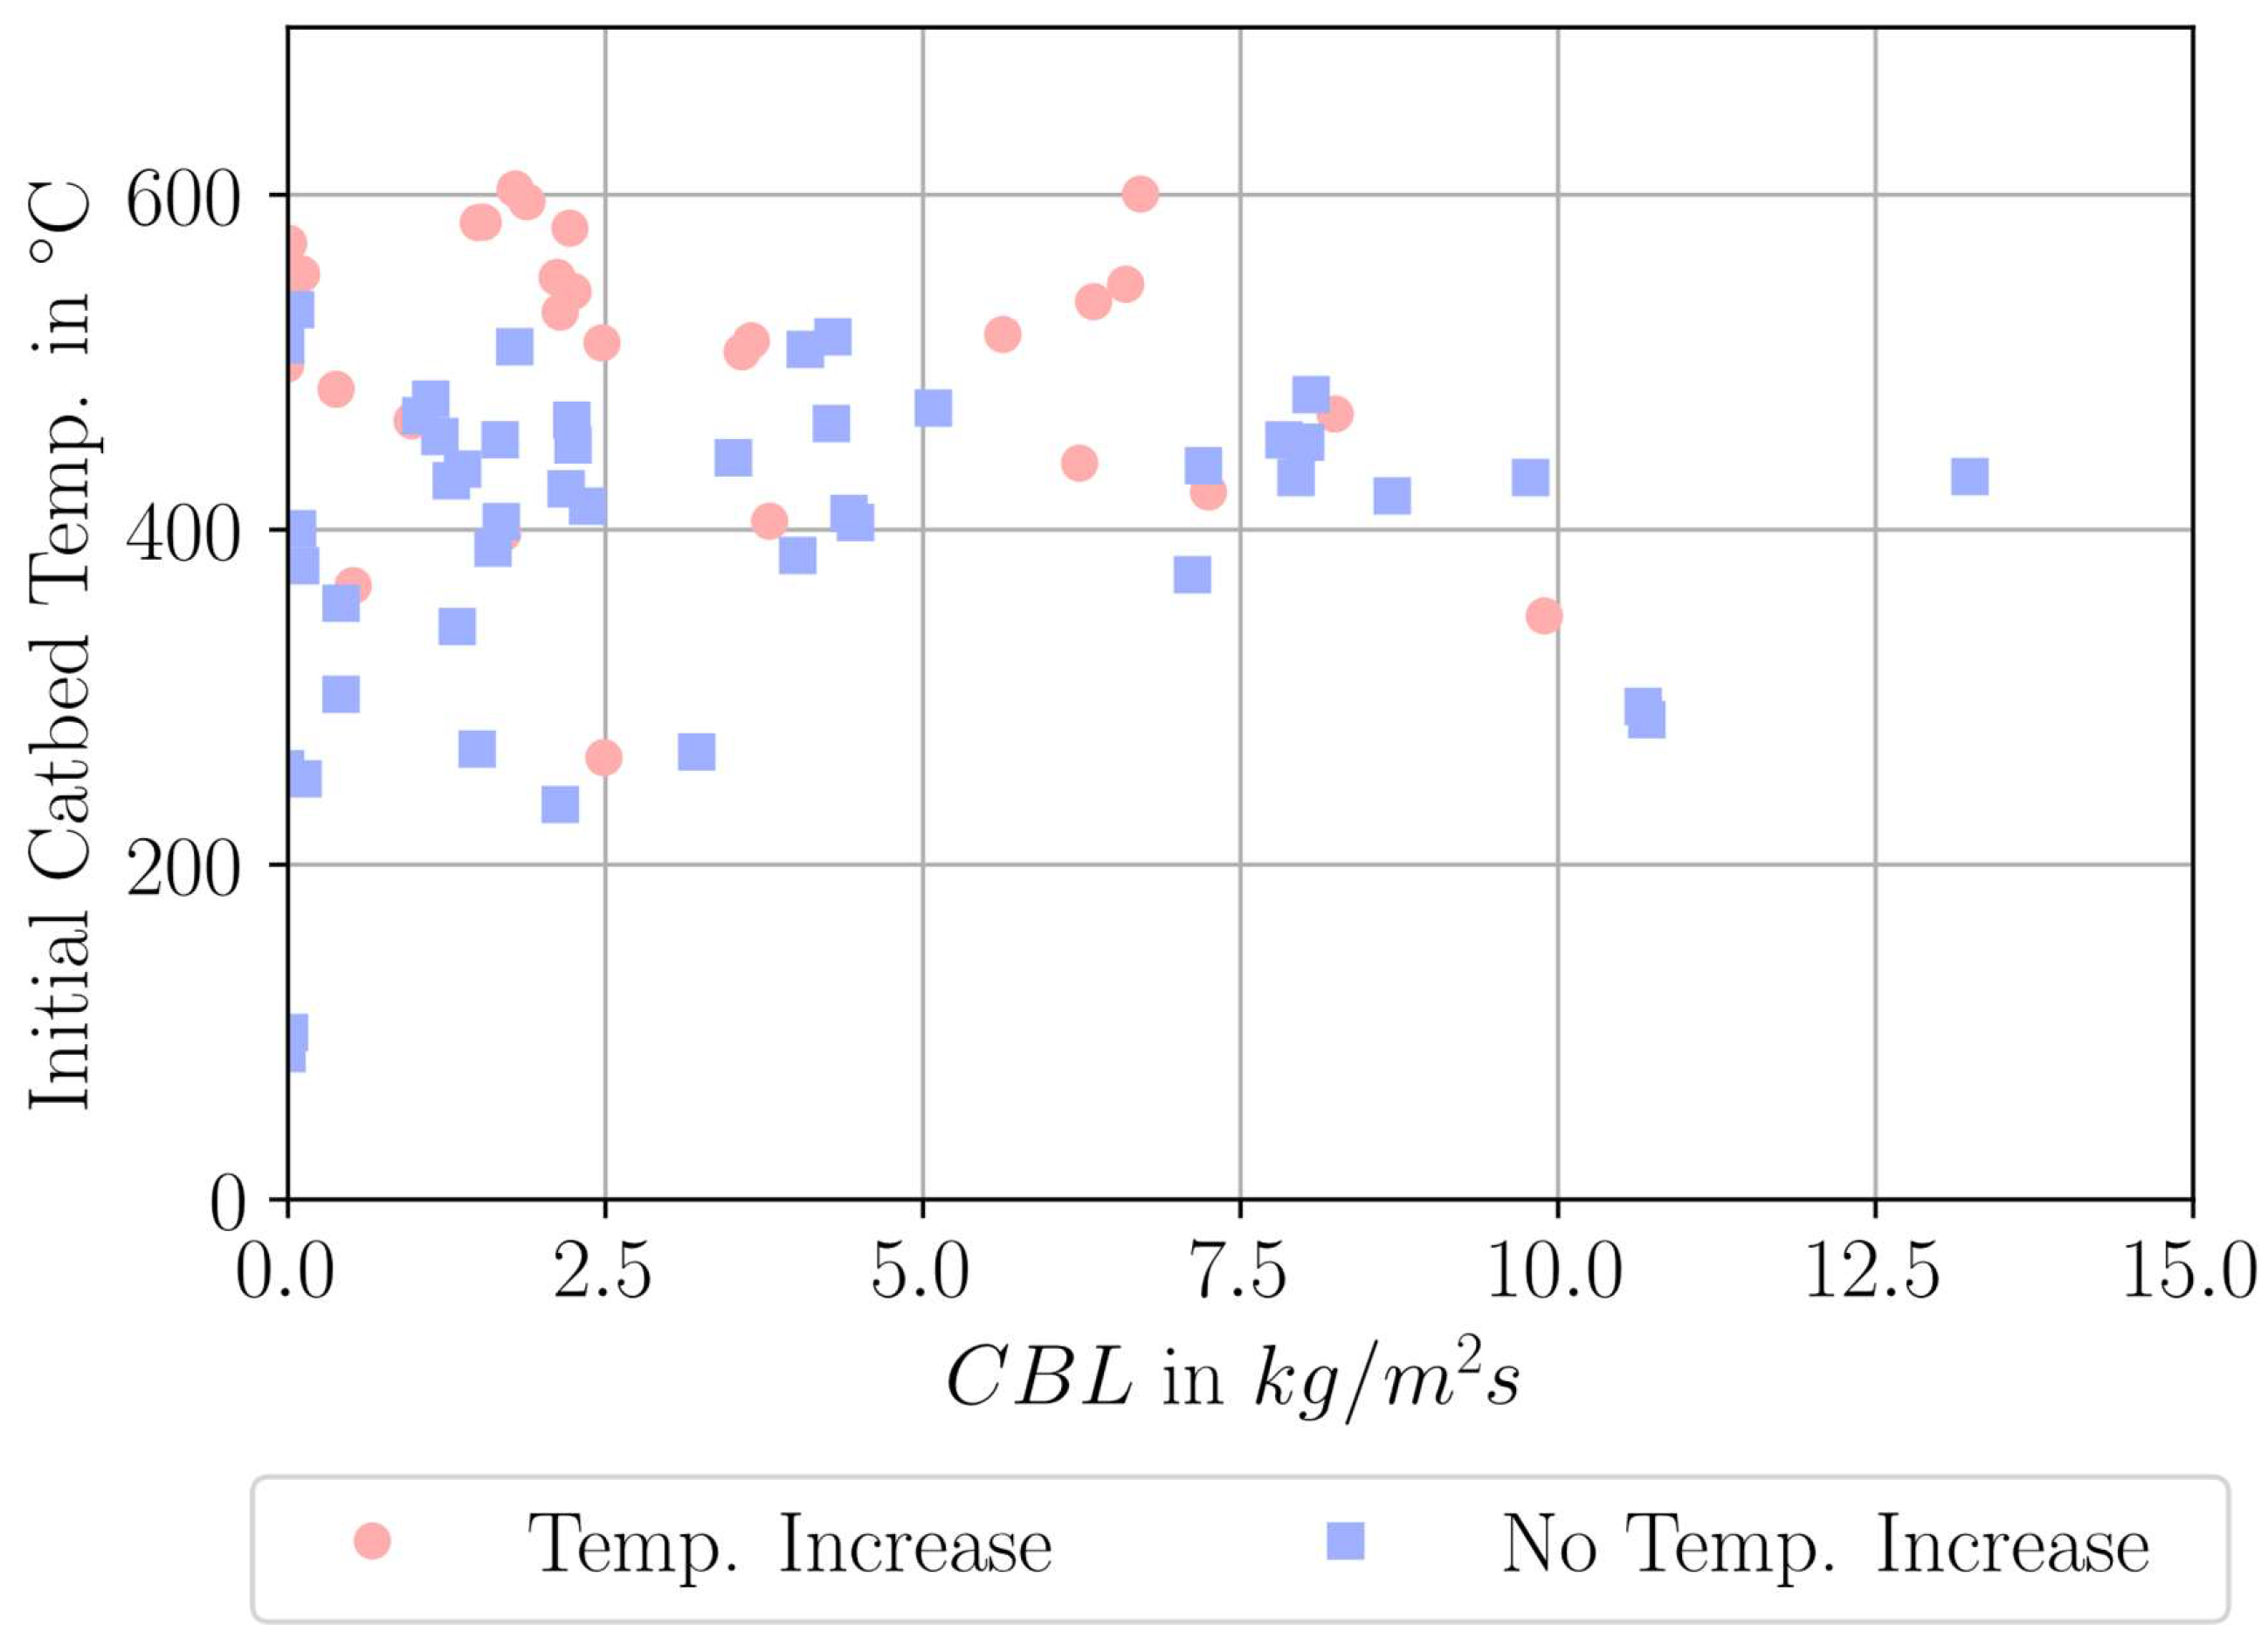
In Figure 21 and Figure 22, all experiments are marked with the information about whether there was a temperature increase in any of the thermocouples inside the thruster of more than 20 K during the experiment. The experiments with such an increase are marked as red circles, and the others without temperature increases are marked as blue squares. The increase in temperature is assumed to be a hint, at least partially, of successful decomposition. It can be seen that in the presented experiments, there is no exposed pressure or CBL/mass flow dependence on whether there was decomposition or not. The main influence parameter for successful decomposition is a high pre-heating temperature. For all experiments with pre-heating higher than 500 °C, decomposition was observed. Some tests with pre-heating between 400–500 °C showed decomposition; however, this was not repeatable.
For the experiments with a blocked nozzle and, therefore, a drastically increased L * , it is observed that decomposition was easier to achieve. This may be a result of the comparably low reaction speed and the longer residence time in contact with the catalyst, leading to better decomposition. However, this does not directly correspond to a high η c * efficiency, as the heat losses for small catalyst bed loadings are high. As for some of the tests, the nozzle throat area is not known, and no statement about the influence of chamber pressure or catalyst bed loading on the decomposition efficiency is possible from this test series. Other parameters may influence the decomposition characteristic as well. For example, the age of the catalyst, the inflow temperature of nitrous oxide, or impurities.
Compared to the experiments with hydrogen peroxide in the same thruster, the following observations can be made:
  • Higher pre-heating temperatures are needed to achieve decomposition (room temperature for H2O2 and >500 °C for N2O).
  • Only efficiencies below 90% can be observed for N2O experiments; for H2O2, the observed efficiencies were mostly above 90%.
  • The increase in c * efficiency during operation is much slower than with H2O2. This may be a result of the decreased reaction rate.
  • Through the higher adiabatic decomposition temperature of N2O in comparison with H2O2, other thrust chamber materials should be considered.
  • The storage of N2O is relatively uncomplicated. A wide range of materials is available, and, unlike H2O2, there is no need to worry about the decomposition of the propellant inside the tank.
  • Catalyst bed loading should be optimized for the given thruster and the specific catalyst/propellant combination to achieve better performance.
  • The position of the hottest point inside the catalyst bed is not stable and can be nonlinearly influenced, for example, by the mass flow, chamber pressure, pre-heating temperature, or the age of the catalyst.
  • Pre-heating to temperatures above 500 °C is challenging in the given setup. The temperature must be equally distributed in the catalyst bed, and the overheating of the cartridge heater must be avoided. Moreover, an effective thermal standoff is needed to avoid temperature loss through heat conduction into the feedline system on the one hand, and to prevent the pulse valve from too-high temperatures on the other hand. Heating to such high temperatures required long pre-heating times; in this setup, it was over 30 min.
  • A cold start is not possible or will only deliver cold gas performance.

7. Conclusions and Outlook

In this work, parts of the test campaign within the ESA project GreenRAIM are presented. An extensive test campaign with 98 wt.% hydrogen peroxide was carried out in the vacuum chamber on the M11.2 test bench. The primary goals of collecting temperature, pressure, and mass flow data for the development of the ESPSS/EcosimPro simulation model were successfully achieved, with over 90 tests demonstrating decomposition. In addition, the design of a 1-Newton hydrogen peroxide thruster is described, and the selection of a suitable catalyst is discussed.
Building on prior research conducted in Europe, the design of the thruster and the selection of the catalyst are meticulously determined. Using additive manufacturing, the thruster and its thermal standoff were manufactured to meet the requirements of the sensors and operational implementations. Stainless steel 316L was chosen as the material due to its compatibility with hydrogen peroxide and ease of post-processing. Higher-temperature-resistant materials such as Inconel 718 or other nickel-based alloys were also considered and will be investigated in future tests. The pellet-shaped Pt/Al2O3 catalyst from Hereaus was selected because it is commercially available and ranks among the most suitable catalysts for hydrogen peroxide thrusters.
The results with hydrogen peroxide indicate a combustion efficiency of over 90% with the designed thruster. The temperature data recorded in the thruster showed complete decomposition for inlet pressures greater than 10 bar. It was observed that fluctuations in pressure, changes in pressure loss across the catalyst bed, and variations in mass flow result in significant temperature fluctuations in the front catalyst area. These thermal shocks are suspected to significantly reduce the lifespan of the catalyst material. This effect requires further investigation.
In addition, the decomposition of nitrous oxide (N2O) was investigated using the “MoCa” thruster in a subsequent campaign. In 32 of the total of 90 tests, decomposition was observed via a temperature increase. For the used H-KC12GA 32 wt.% Iridium Al2O3 support catalyst, a pre-heating temperature of over 500 °C was needed to achieve reliable decomposition of nitrous oxide. A maximum c * of 976 m / s and c * efficiencies of up to 88% were observed. In future developments, a study on the ideal cat-bed loading CBL and characteristic chamber length L * for nitrous oxide monopropellants has to be performed. Different catalyst materials should be screened in a thruster-like setup in order to reduce the needed pre-heating temperature.
Overall, this study not only contributes to a better understanding of hydrogen peroxide and nitrous oxide monopropellant propulsion systems but also lays the foundation for accelerated and improved development processes through improved simulation models.

Author Contributions

Methodology, F.M. and T.H.; Investigation, F.M. and T.H.; Data curation, F.M. and T.H.; Writing—original draft, F.M. and T.H.; Supervision, F.L., J.S. and C.K.; Project administration, J.S. All authors have read and agreed to the published version of the manuscript.

Funding

This research was funded by European Space Agency (ESA) grant number 4000137305/22/NL/MG.

Data Availability Statement

The datasets presented in this article are not readily available because they belong to ESA. Requests to access the datasets should be directed to ESA.

Acknowledgments

The authors would like to thank ESA/ESTEC for funding the GreenRAIM activity and for valuable cooperation in the project. Further, we acknowledge Heraeus for providing the catalyst material used in the tests. A special thanks goes to the M11 test facility team and the chemical lab team for supporting the experiments. Any view expressed in this paper can in no way be taken to reflect the official opinion of the European Space Agency.

Conflicts of Interest

The authors declare no conflicts of interest.

References

  1. Sarritzu, A.; Pasini, A. Performance comparison of green propulsion systems for future Orbital Transfer Vehicles. Acta Astronaut. 2024, 217, 100–115. [Google Scholar] [CrossRef]
  2. Marshall, W.M.; Deans, M.C. Recommended figures of merit for green monopropellants. In Proceedings of the 49th AIAA/ASME/SAE/ASEE Joint Propulsion Conference, San Jose, CA, USA, 15–17 July 2013; p. 3722. [Google Scholar]
  3. Hörger, T.; Krishti, D.; Koopmanns, R.J.; Lauck, F.; Merz, F.; Werling, L.; Kirchberger, C.; Steelant, J. Green Propellants for Satellite Propulsion: An Updated Literature Survey in the Frame of the ESA Project GreenRAIM. In Proceedings of the 13th ISICP-International Symposium on Special Topics in Chemical Propulsion, Gjovik, Norway, 30 May–2 June 2023. [Google Scholar]
  4. Nosseir, A.E.S.; Cervone, A.; Pasini, A. Review of state-of-the-art green monopropellants: For propulsion systems analysts and designers. Aerospace 2021, 8, 20. [Google Scholar] [CrossRef]
  5. Kirchberger, C.U.; Hörger, T.; Scholl, J.; Merz, F.; Teuffel, P.; Kurilov, M.; Lauck, F.; Werling, L.; Scholl, R.; Ricker, S.; et al. Green Propellants for Satellite Propulsion: Status of Research and Developments at DLR Lampoldshausen. In Proceedings of the AIAA SCITECH 2024 Forum, Orlando, FL, USA, 8–12 January 2024; p. 1789. [Google Scholar]
  6. Werling, L.; Freudenmann, D.; Ricker, S.C.; Wilhelm, M.; Lauck, F.; Strauss, F.; Manassis, K.; Kurilov, M.; Petrarolo, A.; Hörger, T.; et al. Research and Test Activities on Advanced Rocket Propellants at DLR’s Institute of Space Propulsion in Lampoldshausen. In Proceedings of the 9th European Conference for Aeronautics and Space Sciences (EUCASS), Lille, France, 27 June–1 July 2022. [Google Scholar]
  7. Lauck, F.; Negri, M.; Wilhelm, M.; Freudenmann, D.; Schlechtriem, S.; Wurdak, M.; Gotzig, U. Test bench preparation and hot firing tests of a 1N hydrogen peroxide monpropellant thruster. In Proceedings of the Space Propulsion Conference, Seville, Spain, 14–18 May 2018; Volume 14. [Google Scholar]
  8. Gotzig, U.; Wurdak, M.; Lauck, F. Development of a Flight Type 1N Hydrogen Peroxide Thruster. In Proceedings of the Space Propulsion Conference, Seville, Spain, 14–18 May 2018; pp. 14–18. [Google Scholar]
  9. Stollenwerk, M.; Schäfer, T.; Stadtmüller, J.; Döhring, T.; Freudenmann, D.; Röcke, N. Sputtered highly effective iridium catalysts: A new approach for green satellite propulsion. J. Mater. Sci. 2021, 56, 9974–9984. [Google Scholar] [CrossRef]
  10. Negri, M.; Lauck, F. Hot firing tests of a novel green hypergolic propellant in a thruster. J. Propuls. Power 2022, 38, 467–477. [Google Scholar] [CrossRef]
  11. Sarritzu, A.; Pasini, A.; Merz, F.; Werling, L.; Lauck, F. Experimental investigation of combustion performance of a green hypergolic bipropellant based on hydrogen peroxide. Acta Astronaut. 2024, 219, 278–290. [Google Scholar] [CrossRef]
  12. Ricker, S.; Lauck, F.; Teuffel, P.; Merz, F.; Freudenmann, D.; Kirchberger, C. HIM_30: Hot-Firing Tests and Characterisation of a Green Hypergolic Propellant Based on Ionic Liquids and Hydrogen Peroxide. In Proceedings of the Space Propulsion Conference Glasgow, Glasgow, UK, 20–23 May 2024. [Google Scholar]
  13. GESTIS-Stoffdatenbank Entry Distickstofftetroxid/Dinitrogen Tetraoxide. 2022. Available online: https://gestis.dguv.de/data?name=001950 (accessed on 9 September 2025).
  14. Kobald, M.; Fischer, U.; Tomilin, K.; Petrarolo, A.; Schmierer, C. Hybrid Experimental Rocket Stuttgart: A Low-Cost Technology Demonstrator. J. Spacecr. Rocket. 2018, 55, 484–500. [Google Scholar] [CrossRef]
  15. Werling, L.; Lauck, F.; Dobusch, J.; Gritzka, M.A.; Stratmann, V.; Merz, F.; Hörger, T.; Teuffel, P.J.; Braune, L. From Lampoldshausen to Space: DLR Spin-off InSpacePropulsion Technologies and the Development Status of Green Propellant Thrusters Based on H2O2 and N2O. In Proceedings of the Aerospace Europe Conference 2023–10th EUCASS–9th CEAS, Lausanne, Switzerland, 9–13 July 2023. [Google Scholar]
  16. Hennemann, L.; Andrade, J.C.; Costa, F.d.S. Experimental investigation of a monopropellant thruster using nitrous oxide. J. Aerosp. Technol. Manag. 2014, 6, 363–372. [Google Scholar] [CrossRef]
  17. Zakirov, V.; Sweeting, M.; Lawrence, T.; Sellers, J. Nitrous oxide as a rocket propellant. Acta Astronaut. 2001, 48, 353–362. [Google Scholar] [CrossRef]
  18. Scherson, Y.; Lohner, K.; Lariviere, B.; Cantwell, B.; Kenny, T. A monopropellant gas generator based on N2O decomposition for “green” propulsion and power generation. In Proceedings of the 45th AIAA/ASME/SAE/ASEE Joint Propulsion Conference & Exhibit, Denver, CO, USA, 2–5 August 2009; p. 4875. [Google Scholar]
  19. Haag, G.; Sweeting, M.; Richardson, G. Low cost propulsion development for small satellites at the surrey space centre. In Proceedings of the 13th AIAA/USU Conference on Small Satellites, Logan, UT, USA, 23–26 August 1999. [Google Scholar]
  20. Werling, L.; Hörger, T.; Manassis, K.; Grimmeisen, D.; Wilhelm, M.; Erdmann, C.; Ciezki, H.; Schlechtriem, S.; Richter, S.; Methling, T. Nitrous Oxide Fuels Blends: Research on premixed Monopropellants at the German Aerospace Center (DLR) since 2014. In Proceedings of the AIAA Propulsion and Energy Forum, New Orleans, LA, USA, 24–26 August 2020. [Google Scholar]
  21. Werling, L.; Hörger, T. Experimental analysis of the heat fluxes during combustion of a N2O/C2H4 premixed green propellant in a research rocket combustor. Acta Astronaut. 2021, 189, 437–451. [Google Scholar] [CrossRef]
  22. Werling, L.; Lauck, F.; Negri, M.; Goos, E.; Wischek, J.; Besel, Y.; Valencia-Bel, F. High Performance Propellant Development-Overview of Development Activities Regarding Premixed, Green N2O/C2H6 Monopropellants. In Proceedings of the 8th Space Propulsion Conference, Estoril, Portugal, 9–13 May 2022. [Google Scholar]
  23. Werling, L. Entwicklung und Erprobung von Flammensperren für Einen Vorgemischten, Grünen Raketentreibstoff aus Lachgas (N2O) und Ethen (C2H4). Ph.D. Thesis, Universität Stuttgart, Stuttgart, Germany, 2020. [Google Scholar]
  24. Musker, A.; Rusek, J.; Kappenstein, C.; Roberts, G. Hydrogen peroxide-From bridesmaid to bride. In Proceedings of the 3rd ESA International Conference on Green Propellants for Space Propulsion, Poitiers, France, 17–20 September 2006. [Google Scholar]
  25. Walter, H. Experience with the Application of Hydrogen Peroxide for production of Power. J. Jet Propuls. 1954, 24, 166–171. [Google Scholar] [CrossRef]
  26. Scharlemann, C.; Winborg, N.; Roberts, G.; Kappenstein, C.; Musker, A.; Russor, A.; Haidn, O.; Walzer, E.; Muszynski, M.; Delbianco, N.; et al. General Assessment of Green Propellants. GRASP Report. 2009. Available online: https://cordis.europa.eu/project/id/218819/reporting (accessed on 9 September 2025).
  27. Mezyk, L.; Gut, Z.; Mohan, K.; Kindracki, J.; Rarata, G. Initial research on thermal decomposition of 98% concentrated hydrogen peroxide in thruster-like conditions. Eng. Sci. Technol. Int. J. 2022, 31, 101054. [Google Scholar] [CrossRef]
  28. McBride, B.J. Computer Program for Calculation of Complex Chemical Equilibrium Compositions and Applications; NASA Lewis Research Center: Cleveland, OH, USA, 1996; Volume 2.
  29. Dolci, S.; Dell’Amico, D.B.; Pasini, A.; Torre, L.; Pace, G.; Valentini, D. Platinum catalysts development for 98% hydrogen peroxide decomposition in pulsed monopropellant thrusters. J. Propuls. Power 2015, 31, 1204–1216. [Google Scholar] [CrossRef]
  30. Koopmans, R.J.; Shrimpton, J.S.; Roberts, G.T.; Musker, A.J. A one-dimensional multicomponent two-fluid model of a reacting packed bed including mass, momentum and energy interphase transfer. Int. J. Multiph. Flow 2013, 57, 10–28. [Google Scholar] [CrossRef]
  31. Surmacz, P.; Gut, Z. The Experimental Investigation of a 98% Hydrogen Peroxide Monopropellant Thruster Comprising the Metal-Foam-Supported Manganese Oxide Catalyst. Aerospace 2023, 10, 215. [Google Scholar] [CrossRef]
  32. Casu, S.; Kiemel, R.; Casu, S.; Geiger, B.; Kiemel, R.D.; Anthoine, J.; Geiger, B.; Anthoine, J.; Lestrade, J.Y.; Lestrade, J.Y. Development and characterization of a catalyst for the decomposition of hydrogen peroxide. In Proceedings of the AIAA Propulsion and Energy 2019 Forum, Indianapolis, IN, USA, 19–22 August 2019. [Google Scholar] [CrossRef]
  33. Kosdauletov, A.; Jung, E.; Jin, J.; Kwon, S. Catalytic Decomposition of N2O Using Noble Metals to Develop Monopropellant Thruster. In Proceedings of the International Astronautical Congress 2010, Prague, Czech Republic, 27 September–1 October 2010. [Google Scholar]
  34. McBride, B.; Gordon, S. Chemical Equilibrium and Applications; NASA: Washington, DC, USA, 2004.
  35. Gotzig, U. Development and Test of a 3D printed Hydrogen Peroxide Flight Control Thruster. In Proceedings of the 51st AIAA/SAE/ASEE Joint Propulsion Conference, Orlando, FL, USA, 27–29 July 2015; American Institute of Aeronautics and Astronautics: Orlando, FL, USA, 2015. [Google Scholar]
  36. Thompson, R.L.; Lassaletta, L.; Patra, P.K.; Wilson, C.; Wells, K.C.; Gressent, A.; Koffi, E.N.; Chipperfield, M.P.; Winiwarter, W.; Davidson, E.A.; et al. Acceleration of global N2O emissions seen from two decades of atmospheric inversion. Nat. Clim. Chang. 2019, 9, 993–998. [Google Scholar] [CrossRef]
  37. Karabeyoglu, A.; Dyer, J.; Stevens, J.; Cantwell, B. Modeling of N2O decomposition events. In Proceedings of the 44th AIAA/ASME/SAE/ASEE Joint Propulsion Conference & Exhibit, Hartford, CT, USA, 21–23 July 2008; p. 4933. [Google Scholar]
  38. Zakirov, V.; Zhang, H.y. A model for the operation of nitrous oxide monopropellant. Aerosp. Sci. Technol. 2008, 12, 318–323. [Google Scholar] [CrossRef]
  39. Pasini, A.; Pace, G.; Torre, L. Propulsive performance of a 1 N 98% hydrogen peroxide thruster. In Proceedings of the 51st AIAA/SAE/ASEE Joint Propulsion Conference, Orlando, FL, USA, 27–29 July 2015; American Institute of Aeronautics and Astronautics: Orlando, FL, USA, 2015; p. 4059. [Google Scholar]
  40. Miao, M.; Zhang, M.; Kong, H.; Zhou, T.; Yang, X.; Yang, H. Progress in catalytic decomposition and removal of N2O in fluidized bed. Energies 2021, 14, 6148. [Google Scholar] [CrossRef]
  41. Zhang, Y.; Tian, Z.; Huang, L.; Fan, H.; Hou, Q.; Cui, P.; Wang, W. Advances in Catalytic Decomposition of N2O by Noble Metal Catalysts. Catalysts 2023, 13, 943. [Google Scholar] [CrossRef]
  42. Kondratenko, V.A.; Baerns, M. Effect of different oxygen species originating from the dissociation of O2, N2O and NO on the selectivity of the Pt-catalysed NH3 oxidation. Catal. Today 2007, 121, 210–216. [Google Scholar] [CrossRef]
  43. Hinshelwood, C.N.; Prichard, C.R. LI.—A comparison between the homogeneous thermal decomposition of nitrous oxide and its heterogeneous catalytic decomposition on the surface of platinum. J. Chem. Soc. Trans. 1925, 127, 327–336. [Google Scholar] [CrossRef]
  44. Doi, K.; Wu, Y.Y.; Takeda, R.; Matsunami, A.; Arai, N.; Tagawa, T.; Goto, S. Catalytic decomposition of N2O in medical operating rooms over Rh/Al2O3, Pd/Al2O3, and Pt/Al2O3. Appl. Catal. B Environ. 2001, 35, 43–51. [Google Scholar] [CrossRef]
  45. Pachatouridou, E.; Papista, E.; Iliopoulou, E.F.; Delimitis, A.; Goula, G.; Yentekakis, I.V.; Marnellos, G.E.; Konsolakis, M. Nitrous oxide decomposition over Al2O3 supported noble metals (Pt, Pd, Ir): Effect of metal loading and feed composition. J. Environ. Chem. Eng. 2015, 3, 815–821. [Google Scholar] [CrossRef]
  46. Hörger, T.; Merz, F.; Steelant, J.; Werling, L.; Kirchberger, C. Results of Esa-Greenraim Test Activities Part 2: Experimental Investigation of a 1 Newton Nitrous Oxide Monopropellant Research Thruster. In Proceedings of the Space Propulsion 2024, Glasgow, UK, 20–23 May 2024. [Google Scholar]
  47. Merz, F.; Hörger, T.; Steelant, J.; Lauck, F.; Kirchberger, C. Results of Esa-Greenraim Test Activities Part 1: Experimental Investigation of a 1 Newton Hydrogen Peroxide Monopropellant Research Thruster. In Proceedings of the Space Propulsion 2024, Glasgow, UK, 20–23 May 2024. [Google Scholar]
  48. Fonda-Marsland, E.A.P.; Ryan, C.; Roberts, G.; Lear, A.; Fletcher, E.; Gibbon, D.; Palmer, M. Towards flight qualification of a 1 Newton hydrogen peroxide thruster. In Proceedings of the Space Propulsion 2018, Seville, Spain, 14–18 May 2018. [Google Scholar]
  49. Pasini, A.; Pace, G.; Valentini, D. Experimental Campaign on a 98% H2O2 Pulsed Thruster. In Proceedings of the ESA Space Propulsion 2018 Conference, Bilbao, Spain, 29–31 October 2018; European Space Agency: Paris, France, 2018; pp. 1–13. [Google Scholar]
  50. Amri, R.; Gibbon, D.; Rezoug, T. The design, development and test of one newton hydrogen peroxide monopropellant thruster. Aerosp. Sci. Technol. 2013, 25, 266–272. [Google Scholar] [CrossRef]
  51. Barley, S.; Palmer, P.; Coxhill, I. Evaluating the miniaturisation of a monopropellant thruster. In Proceedings of the 42nd AIAA/ASME/SAE/ASEE Joint Propulsion Conference & Exhibit, Sacramento, CA, USA, 9–12 July 2006; p. 4549. [Google Scholar]
  52. Surmacz, P.; Kostecki, M.; Gut, Z.; Olszyna, A. Aluminum Oxide–Supported Manganese Oxide Catalyst for a 98% Hydrogen Peroxide Thruster. J. Propuls. Power 2019, 35, 614–623. [Google Scholar] [CrossRef]
  53. Sutton, G.P.; Biblarz, O. Rocket Propulsion Elements; John Wiley & Sons: Hoboken, NJ, USA, 2016. [Google Scholar]
  54. Wilhelm, M.; Werling, L.; Strauss, F.; Lauck, F.; Kirchberger, C.; Ciezki, H.; Schlechtriem, S. Test complex M11: Research on future orbital propulsion systems and scramjet engines. In Proceedings of the 70th International Astronautical Congress, IAC 2019, Washington, DC, USA, 21–25 October 2019. [Google Scholar]
  55. Deutsches Zentrum für Luft-und Raumfahrt e.V. (DLR), Institute of Space Propulsion, M11.2 Test Bench (2019). Available online: https://www.dlr.de/en/images/institutes-1/institute-of-space-propulsion/m11-2-test-bench (accessed on 9 September 2025).
  56. Lohner, K.; Dyer, J.; Doran, E.; Dunn, Z.; Krieger, B.; Decker, V.; Wooley, E.; Sadhwani, A.; Cantwell, B.; Kenny, T. Design and development of a sub-scale nitrous oxide monopropellant gas generator. In Proceedings of the 43rd AIAA/ASME/SAE/ASEE Joint Propulsion Conference & Exhibit, Cincinnati, OH, USA, 8–11 July 2007; p. 5463. [Google Scholar]
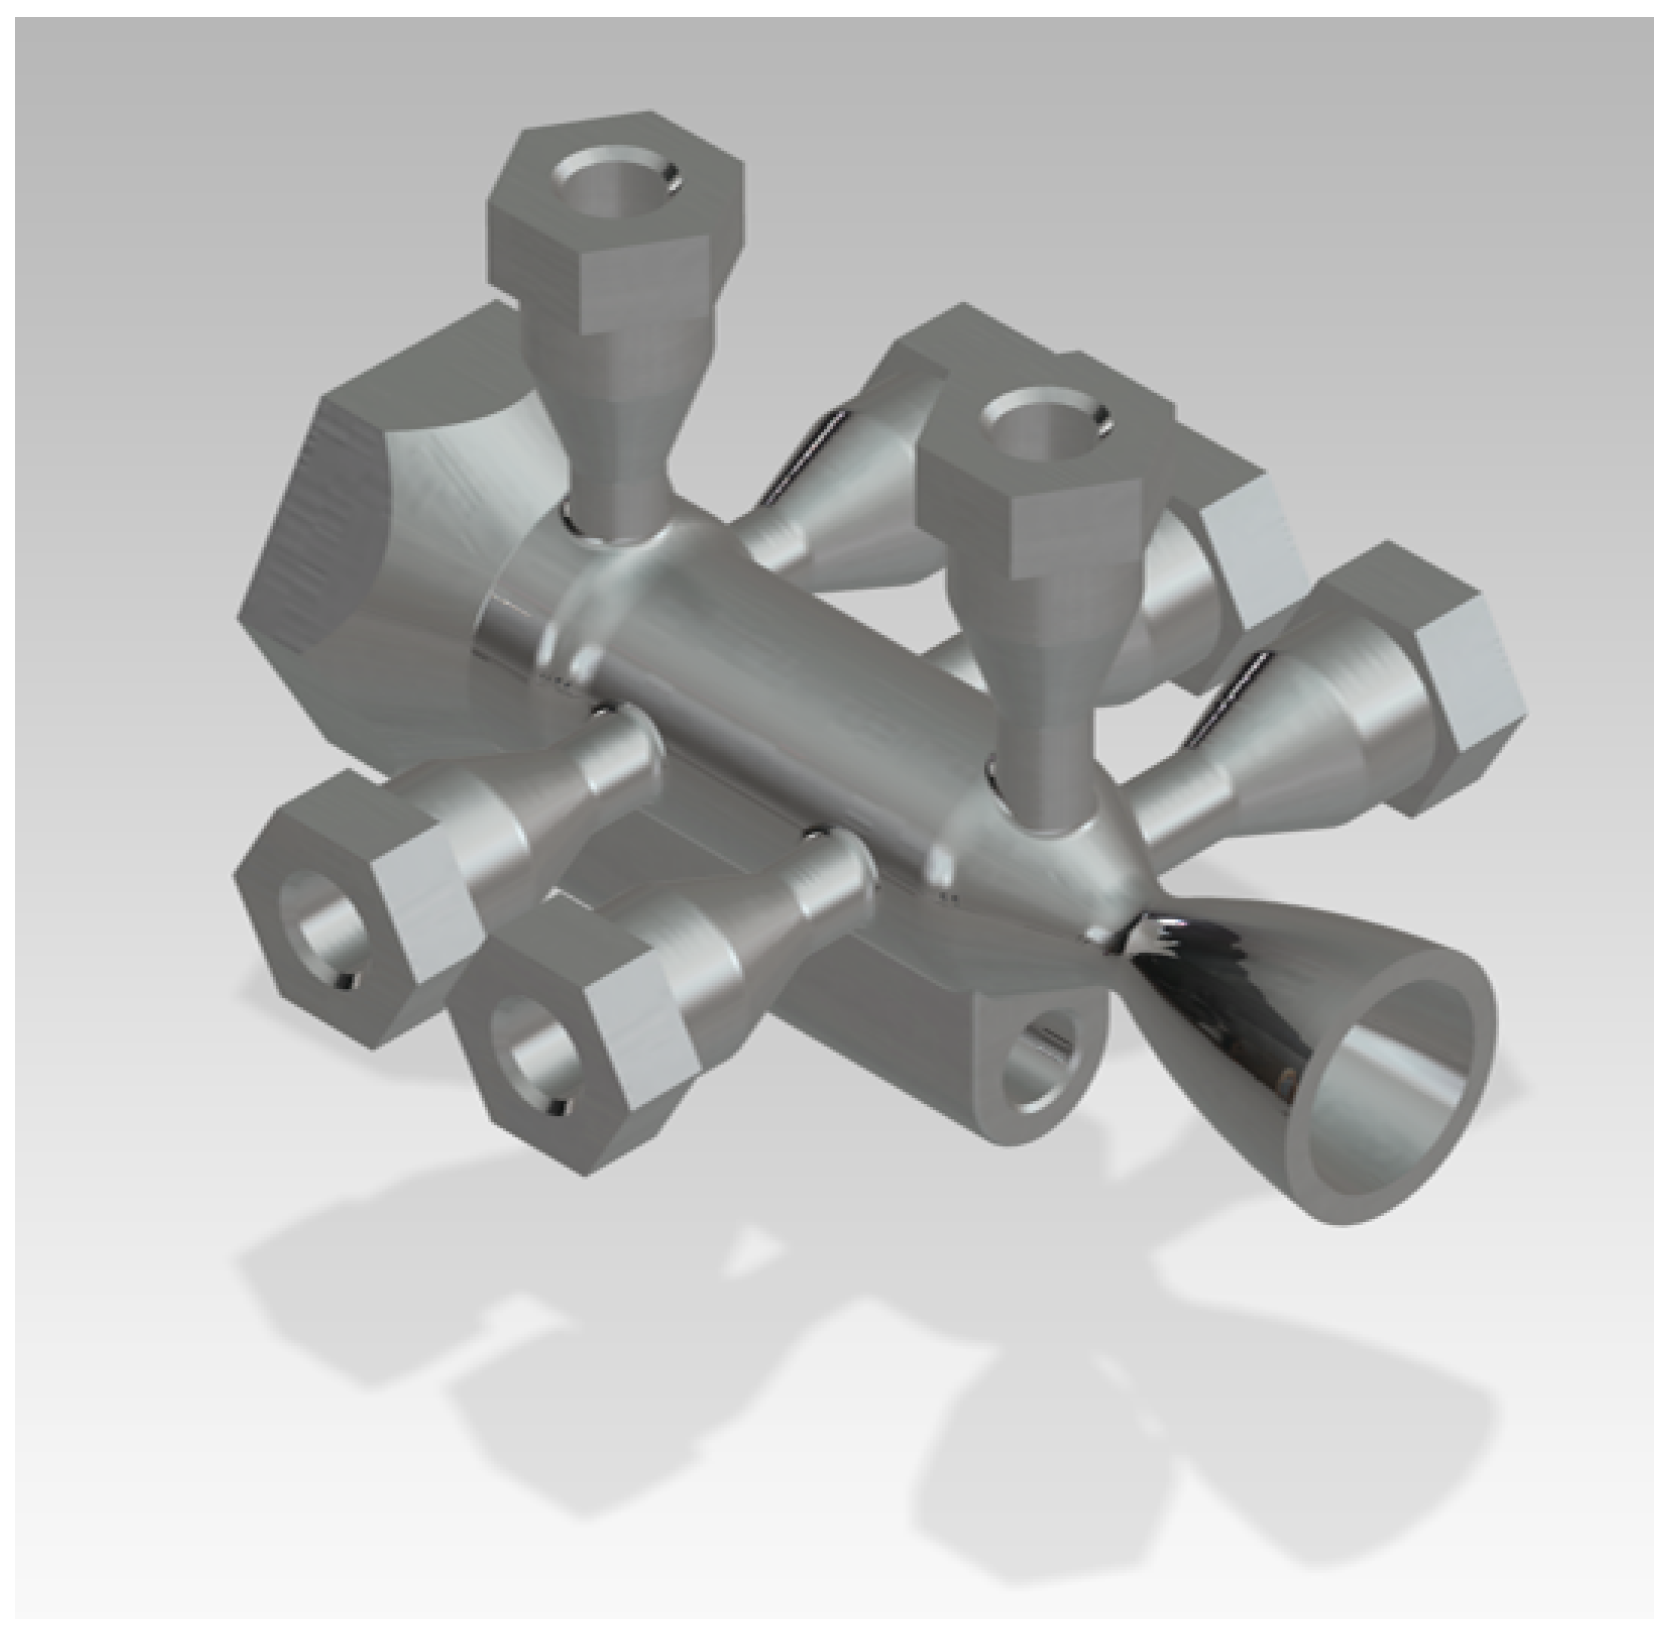
Figure 1. Computer-aided design (CAD) rendering of the “MoCa” thruster, with all measurement ports.
Aerospace 12 00835 g001
Figure 2. Cross-section of the “MoCa” thruster, with placements of the thermocouples in the catalyst bed.
Aerospace 12 00835 g002
Figure 3. Computer-aided design (CAD) of the simplified “MoCa” thruster, with thermal standoff and valve.
Aerospace 12 00835 g003
Figure 4. Vacuum chamber at the DLR test bench M11.2 [55].
Aerospace 12 00835 g004
Figure 5. P&ID schematics of the experimental setup.
Aerospace 12 00835 g005
Figure 6. Logarithmic visualization of the operating points.
Aerospace 12 00835 g006
Figure 7. Picture of the “MoCa” thruster during a steady-state firing test inside the vacuum chamber.
Aerospace 12 00835 g007
Figure 8. Temperature profile of steady-state test 5, with a feeding line pressure of 24 bar.
Aerospace 12 00835 g008
Figure 9. Pressure profile of steady-state test 5, with a feeding line pressure of 24 bar.
Aerospace 12 00835 g009
Figure 10. Combustion efficiencies for different pressure levels are presented.
Aerospace 12 00835 g010
Figure 11. Pressure profile of a 1 Hz operated pulse test with a duty cycle of 75% and 100 repetitions.
Aerospace 12 00835 g011
Figure 12. Temperature profile of a 1 Hz operated pulse test with a duty cycle of 75%.
Aerospace 12 00835 g012
Figure 13. Combustion efficiency of 1 Hz pulse tests at three pressure levels and different duty cycles.
Aerospace 12 00835 g013
Figure 14. Pressure plot of test 1.
Aerospace 12 00835 g014
Figure 15. Temperature plot of test 1.
Aerospace 12 00835 g015
Figure 16. Temperature plot of test 2.
Aerospace 12 00835 g016
Figure 17. Pressure plot of test 3.
Aerospace 12 00835 g017
Figure 18. Temperature plot of test 3.
Aerospace 12 00835 g018
Figure 19. Pressure plot of test 4.
Aerospace 12 00835 g019
Figure 20. Temperature plot of test 4.
Aerospace 12 00835 g020
Figure 21. Visualization of temperature increase with dependence on mean injection pressure and pre-heat temperature.
Aerospace 12 00835 g021
Figure 22. Visualization of decomposition with dependence on CBL and pre-heat temperature.
Aerospace 12 00835 g022
Table 1. List of sensors, manufacturer, acquisition rates, and measurement uncertainties, referring to full scale (FS).
Parameter MeasuredSensor TypeSensor Manufacturer and ModelSampling RateSensor Uncertainty
Pressure ChamberPiezo-Resistive–Passive TransmitterSTS–Type TM (0–30 bar)5 k Hz ± 0.2 % FS
Pressure TNK/FDLPiezo-Resistive–Passive TransmitterSTS–Type TM (0–100 bar)5 k Hz ± 0.5 % FS
TemperatureThermocoupleStainless Steel Sheathed–Type K110 Hz ± 1.5 °C
Mass Flow RateCoriolisBronkhorst–M14 (FS: 8.333 g s−1)5 k Hz ± 0.2 % FS
Table 2. Operating points of the test campaign.
Feeding Pressure6 bar12 bar nominal24 bar
Single Pulse2 × 60 s 2 × 60 s 2 × 60 s
Pulse mode
1 Hz
ON/OFF in
ms
125/875125/875125/875
250/750250/750250/750
500/500500/500500/500
750/250750/250750/250
875/125875/125875/125
Table 3. Steady-state tests at three different feeding pressures.
Test No.Mean P FDL in barMean P DC in barMax. T CAT _ 02 in °CMax. T DC in °CMean m ˙ in g s−1Discharge Coefficient c D FCV Combustion Efficiency η c * in %Mean Interval in s
15.733.89751.33573.370.2480.68 ± 0.06 79.20 ± 3.96 54–58
25.632.39834.79584.150.1360.47 ± 0.04 80.69 ± 4.03 50–55
311.589.98947.16791.950.5360.80 ± 0.07 87.72 ± 4.39 49–59
411.469.66950.44798.200.5060.74 ± 0.06 89.51 ± 4.48 49–59
523.7218.46959.26867.860.9380.70 ± 0.07 92.06 ± 4.60 44–54
623.7415.73954.68858.560.8350.80 ± 0.06 88.02 ± 4.40 40–50
711.9210.55--0.578-90.62 ± 4.53 45–55
811.9210.39--0.569-90.44 ± 4.52 45–55
Table 4. Overview of the described tests.
Test No.Mean m ˙ in g/sMean P DC in barMean P FDL in barCBL in kg/(m2s)Max T in °CMean Interval in s
10.234.1423.357.4860.53.3–4.9
20.203.9823.106.2913.73.3–4.9
30.274.9723.688.21216.420–25
40.2016.8423.466.31322.72.6–3.8
Table 5. c * Evaluation of test 1.
Evaluation Interval c Exp * c Theo * η c *
3.3–4.9 s840.6 m/s1105.6 m/s76.0%
Table 6. c * Evaluation of test 2.
Evaluation Interval c Exp * c Theo * η c *
3.3–4.9 s938.9 m/s1105.6 m/s84.9%
Table 7. c * Evaluation of test 3.
Evaluation Interval c Exp * c Theo * η c *
20–25 s976.0 m/s1106.4 m/s88.2%
Disclaimer/Publisher’s Note: The statements, opinions and data contained in all publications are solely those of the individual author(s) and contributor(s) and not of MDPI and/or the editor(s). MDPI and/or the editor(s) disclaim responsibility for any injury to people or property resulting from any ideas, methods, instructions or products referred to in the content.