Abstract
Large-area membrane spacecraft, such as solar sails, must be tightly stowed before launch. However, excessive folding readily induces plastic creases that impede full on-orbit deployment and degrade membrane surface accuracy. To overcome this challenge, this study aims to quantify the mechanical response of Kapton films during folding and to establish a reliable welding process for post-fold sail membranes. Based on the theory of linear elastic engineering, an S-shaped folding model was theoretically simplified to obtain the relationship between the rebound force P of adjacent contact thin films and the thin-film spacing h. Then, the Kapton film folding process was numerically simulated based on the implicit static method by using ABAQUS. The stress–strain curves and mechanical parameters of the thin films measured through uniaxial tensile tests are applied to theoretical and numerical results. It is found that the P-h curves obtained by the theoretical, numerical, and experimental method have good consistency. Step-loaded creep tests show that, after 6 h, the mean spacing reductions Δh are 0.43 mm for 50 µm thin films and 1.05 mm for 125 µm thin films, matching simulation results within 3%. Finally, uniaxial tensile tests are conducted on the welded thin films to measure the strength of the thin-film welds under different welding temperatures and pressures. The tensile force and elongation required to eliminate weld wrinkles are also measured to explore the welding connection of Kapton film. Further, for 50 µm thin films with a 10 mm weld width, eliminating welding-induced wrinkles requires a tensile force of 9.61 N and an elongation of 0.43%.
1. Introduction
The thin-film structures in aerospace need to be folded before launch, whereas excessive folding causes creases on the thin films, called as plastic deformation, which cause a solar sail not to be fully deployed and restrict the accuracy of the shape surface. Therefore, it is of great significance to study the mechanical behavior of membrane folding during the research and development of membrane spacecraft folding technology, such as solar sail. Core performance of solar sails as a spacecraft propelled by solar pressure in space directly depends on the structural design of large-area reflective thin films and their reliable deployment capability in orbit [1,2]. Due to the strict limitations of load space imposed by launch vehicle, solar sails must adopt a highly compact and deployable configuration. However, the neglect of geometric effects in traditional folding designs often leads to plastic deformation and the irreversible wrinkling of thin films. Therefore, a reflective surface cannot be fully unfolded, and its surface accuracy is also seriously restricted, which has become a key bottleneck restricting its engineering application [1]. Therefore, an efficient folding methods and highly reliable connection technologies should be developed to achieve the practical mission of solar sails.
During orbital operation, solar sails are primarily subjected to the subtle solar radiation pressure generated by electromagnetic fluctuations, the magnitude of which is determined by both the reflectivity and absorptivity of the sail material [3,4]. Simultaneously, the continuous absorption of solar irradiation and the subsequent thermal emission in the form of infrared radiation lead to significant temperature non-uniformity across the sail: larger incidence angles result in more pronounced temperature differences on the shadowed side [3,5]. This thermal gradient induces differential material expansion at the microscale through thermo-structural coupling, which macroscopically compromises the sail’s flatness and generates residual stress [5]. The combined effect of residual stress and geometric nonlinearity causes the vibration frequency of the solar sail to decrease as its size increases, with nonlinear behavior becoming more prominent under high-frequency conditions [6]. Furthermore, thermal loading can slightly reduce the reflectivity, thereby diminishing propulsion efficiency [3]. At the orbital dynamics level, Monte Carlo simulations have demonstrated that the robust stability of solar sails is highly sensitive to disturbances in radiation pressure, particularly in strong gravitational fields such as those near Venus, where external perturbations exacerbate structural vibrations and instability risks [4]. Therefore, a comprehensive evaluation of the in-orbit performance of solar sails must take into account the combined effects of radiation pressure, thermo-structural coupling, and external perturbations. In recent years, advances in numerical simulation techniques have significantly supported research on solar sails. For instance, the development of models such as the infinitesimal element radiation pressure model and the wrinkle occlusion model has effectively addressed challenges in force analysis under complex boundary conditions [7]. The accuracy of these models has been validated through comparisons between experimental data and simulation results [7].
In the field of membrane folding technology, to enhance the deployment reliability of thin-film structures, it should minimize permanent damage during the folding process of thin-film structures. Currently, a plenty of researchers focus on the folding of thin films. The current mainstream folding strategies include spiral folding, parallel crease folding, Z-shaped folding, and Z+ wavy-shaped folding, etc. [1,2]. The comparative study of finite element modeling and dynamic simulation shows that spiral folding, owing to its superior fatigue resistance and long-term structural integrity, is more suitable for high-precision deep-space exploration missions. Conversely, although Z-shaped folding has an advantage in initial deployment speed, it may present safety hazards such as interface failure under continuous space environmental loads [1,2]. High-performance membrane materials are the material foundation to support folding technologies. Among them, polyimide is regarded as the primary material choice due to its exceptional high-temperature resistance (>400 °C), chemical inertness, and high mechanical strength [8,9]. However, the inherent brittleness of traditional polyimide and its elongation at break of less than 5% make it difficult to meet the strict requirements of repeated folds [10,11]. It is worth noting that, with the development of flexible electronic devices, wearable devices, and space optical systems, lightweight and high-strength flexible thin films have become a research hotspot in multiple fields [12,13]. To address the limitations of polyimide, bio-based polyimide (BPI) thin films developed through copolymer modification significantly enhance material toughness, with their elongation at break increasing by over 300%. At the same time, they maintain dimensional stability in extreme environments; therefore, they are considered as a new option for space-expandable structures [14]. The dynamic folding behavior of membranes is influenced by coupled multi-physics fields, including key parameters such as membrane thickness distribution, substrate interfacial constraint strength, and space environmental loads [15,16]. Systematic experiments reveal a strong nonlinear correlation between delamination length and membrane morphology evolution, and it is found that, when delamination length is lower than the critical threshold, the thin film tends to maintain optical-grade flatness. However, once the critical value is exceeded, local buckling triggers a global folding mode [15]. To accurately predict such complex behavior, researchers have proposed a dynamic reverse folding model based on target configurations and a residual gas-driven unfolding method [17]. Numerical simulations, particularly transient nonlinear finite element analysis, have become essential tools to characterize stress evolution and displacement fields. Vacuum environment experiments have confirmed that only a trace residual air pressure of 0.05 MPa is needed to drive a spherical thin film with a diameter of 1 m to reach a nominal unfolded volume of 90.2% within 0.34 s, which reveals the high efficiency of gas expansion in spatial expansion [17]. The mechanical properties of membranes, such as flexibility and strength, directly determine their functional stability after repeated folding, which is particularly critical for multifunctional devices like foldable electrochromic thin films [16,17].
Mierunalan et al. [12] proposed an efficient numerical simulation technique for thin films. By introducing a rotating spring element, there is no need to use ultra-fine elements near the crease to capture the deformation and related curvature of the thin-film crease, providing a new method for predicting the folding behavior of the thin film, which provides a novel approach to predict folding behavior. To predict the overall response of thin-film folding, it is necessary to understand the mechanical behavior of the folds. Satou [18] et al. found that loading of Z-shaped folded thin films could be successfully predicted by using the elastoplastic finite element model, but the model failed to capture the unloading of the thin films. Xia et al. [19] found that a model considering the relationship between Poisson’s ratio and power hardening could predict folding behavior more reliably. This model shows a critical force could be used to predict wrinkles, but this is not compared with the occurrence of wrinkles in experiments. Through numerical simulation, it was found that the maximum plastic effect length for the thin film with a thickness of 0.05 mm was 1.64 mm. Notably, membrane thickness significantly affects folding behavior. In these two studies, the time dependence of the thin-film materials was not taken into account. However, polymers exhibit time dependence, which can affect wrinkling and recovery [20,21,22]. Thiria et al. [20] observed the Mylar thin film (another commonly used polymer thin film for solar sails) has a relaxation effect under wrinkled conditions. From a modeling perspective, existing studies represent wrinkling on the model as either beams [23] or hinges with rotational stiffness [24,25]. At present, the process of wrinkle formation in polymer thin films and the initiation of wrinkle occurrence are not very clear. Specifically, the stress level caused by wrinkles has not been fully studied, and the effect of time dependence of material on the occurrence of wrinkling has also not been fully explored. It is also important to distinguish permanent deformation from recoverable viscoelastic deformation.
To prepare large-area solar sail thin films, they need to be obtained through welding. Therefore, in order to ensure that solar sail thin films after welding have excellent mechanical properties, it is particularly important to study the welding methods of the thin films. In the context of direct thin-film welding, Wang et al. [26] discovered that MXene thin films exhibit a “time-sensitive welding” phenomenon with the assistance of water. Within a specific time window, MXene thin films possess connection performance comparable to that of traditional engineering materials such as metals. Javier et al. [27] then proposed a novel method by utilizing chemical welding to modify carbon nanotube thin films. Experiments demonstrated that this welding process significantly enhanced the properties of single-walled carbon nanotube (SWCNT) thin films and increased their ultimate tensile strength to 22 MPa. Additionally, Bing et al. [28] developed a novel resistance welding method for fiber-reinforced thermoplastics. Compared to mechanical welding and adhesive bonding, optimal resistance welding can increase the average flexural strength of plastic fibers to 1.6 Mpa, a 31% increase. However, existing studies predominantly concentrate on thin-film composite systems. For instance, Chan et al. [29] employed ultrasonic welding to uniformly embed PMMA into a PDMS matrix to fabricate a composite thin film. Under an ultrasonic energy input of 1 kJ, a 32 mm × 32 mm specimen achieved a welding strength of approximately 35 kPa. Wang et al. [30] introduced 100 µm PA6 thin films as an intermediate layer in the cold-rolled steel and carbon fiber thin film system. Through the ultrasonic–preheating synergistic process, the micro-mechanical interfacial locking was enhanced. When the preheating temperature was raised from 20 °C to 240 °C, the joint cracks were significantly reduced, and the strength value of the welded part in the shear test jumped from less than 400 N to approximately 1300 N. Ran et al. [31] proposed a double-layer thin-film solder and investigated the influence of different temperatures on the structure and mechanical properties of the welded joint. The test results show that, with the increase in temperature, the shear strength of joint increases from 70.6 MPa to 107.8 MPa, and the fracture surface changes from a brittle to a ductile plastic morphology. In this paper, the direct welding of thin films is experimentally studied to explore the tensile force required to eliminate weld wrinkles.
Based on the above analysis, plastic creases induced by extreme folding conditions during the launch phase of solar sails directly lead to incomplete orbital deployment and optical surface distortion. Therefore, buckling instability mechanism, plastic evolution law of thin films, and highly reliable connection technology (such as two-step joining and welding, molecular-level interface regulation, etc.) should be deeply studied as core paths to break through the technical bottlenecks of space thin-film structures and achieve the application of next-generation solar sail engineering. In this paper, the folding tests of 50 μm and 125 μm Kapton films were conducted by the continuous loading and weight loading methods, respectively, and the corresponding mechanical property of the thin films were tested, and then, a fine numerical simulation and an engineering theoretical analysis of the thin film folding process were carried out. Also, this paper performs a series of uniaxial tensile tests on the welded thin films to measure the strength of the thin film welds under different welding temperatures and pressures. Tensile force and elongation required to eliminate weld wrinkles were also measured. Furthermore, this study concentrates on the mechanical behavior of the Kapton substrate. The influence of multilayer film structures will be addressed in future work.
2. Folding Model
2.1. One-Dimensional Approximation Theory
Thin films can be folded in different ways. Miura [32] described two folding methods: one is the Miura-Ori method, which is widely used in two-dimensional solar wing folding and map folding, and the other is S-shaped folding, which is used for solar sail folding. The folding mechanism is composed of a guide grid and a central hub (prismoid or cylinder). S-shaped folding can be repeatedly made through the guide gate, and then, thin films can be wound by rotating the central hub. The folding and winding process of thin-film folding mechanism is shown in Figure 1. A thin film can be divided into a folded part and a transition part, and the geometry and mechanical behavior of folded part could determine the folding design.

Figure 1.
Thin-film folding mechanism with guide grid.
For the folded part of thin films, radial profile can be simplified as shown in Figure 2a, and the thin film can be repeatedly folded into an S shape along the radial direction. The S-shaped folding spacing is h, and the contact rebound force between adjacent thin films is P.
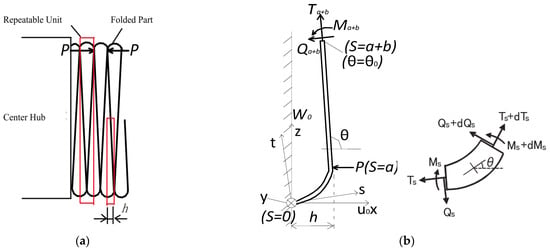
Figure 2.
Simplified model of S-shaped-folded thin film: (a) cross-section of S-shaped-folded thin film and (b) one-dimensional approximation theoretical model.
Based on the repeatability and symmetry of the ideal S-shaped folding, a unit width and 1/4 repeatable unit can be taken as a base analysis model, as shown in Figure 2b. o-xyz represents the overall rectangular coordinate system, and o-st is the follow-up coordinate system along the neutral axis of the thin film unit. s is the tangent direction, and t is the normal direction. θ is the angle between s direction and horizontal axis x, and s is length of neutral axis of the thin-film unit (0 ≤ s ≤ a + b).
It is assumed that a rebound force point P of the adjacent contact thin film is considered as dividing point; thus, the simplified thin-film model could be divided into a bending section (0 ≤ s ≤ a) and a straight section (a < s ≤ a + b). A force analysis on the whole thin-film model is carried out, ignoring the self-weight effect. The lower end of the thin-film model at s = 0 is fixed, where θ = 0; the thin-film model at s = a is subjected to a rebound force P from the adjacent contact thin film, where θ = π/2. The internal force of upper section at s = a + b is Ta+b, Qa+b, and Ma+b, and this structure is centrosymmetric at s = a + b and is the midpoint of straight-line segment, so Ma+b = 0. It is assumed that the thin-film model remains in an elastic state throughout its folding process. According to the Bernoulli beam theory, the derivation is as follows [33].
According to Figure 2b, taking one micro-element, the displacement equations of u and w can be obtained.
As elongation of the neutral axis is neglected, therefore, Equation (2) can be obtained:
The strain along the s-axis can be obtained as Equation (3):
Therefore, Equation (4) can be obtained based on Equations (1)–(3).
The in-plane equilibrium equation can be obtained.
In the folding and bending region , boundary conditions can be obtained due to repeatability of the structure.
The equilibrium equations, i.e., Equation (9) along the X-axis and Z-axis directions, can be obtained.
At s = 0, Equation (10) can be obtained.
The integration of Equations (5), (6), and (11) can be obtained by combining Equations (9) and (10) based on the boundary condition in Equation (8).
The bending moment is obtained by integrating Equation (4).
Equation (13) can be derived by solving the simultaneous Equations (7) and (12).
By solving Equations (5), (6), and (13) simultaneously, the differential equation of thin-film deformation can be derived into Equation (14).
The following Equation (15) can be obtained by substituting Equation (11) into Equation (14).
According to the repeatability of the structure, Equation (16) can be obtained.
Equation (17) can be obtained by integrating Equation (15) and solving it simultaneously with Equation (16).
Equation (18) can be obtained by integrating the displacement Equation (2) of the neutral axis in the range from 0 to s.
The boundary conditions are given in Equation (19).
Equation (20) can be obtained by solving Equations (18) and (19) simultaneously.
The thin-film spacing h in Equation (22) and Mises yield stress σMises in Equation (23) can be obtained by simultaneously solving Equations (17) and (20).
where σMises represents the Mises yield stress, and θ0 denotes the rotation angle at s = a + b. E is the elastic modulus. I is the moment of inertia of the cross-section of the thin film. t denotes the thin-film thickness. B is the width of the thin film, and B is equal to 1. The contact force P between adjacent thin films dominates the bending deformation of the thin films. Ta+b and Qa+b are decided to be zero. As thin-film spacing h is far less than the length b of the straight section of the thin film, θ0 is decided to be π/2. Equations (22) and (23) can be simplified as Equations (24) and (25):
Based on Equations (22) and (23), for any adjacent contact thin-film rebound force P, the corresponding thin-film spacing h and σMises can be calculated. If σMises is greater than the thin-film yield strength σy, called as the proportional limit, the thin film undergoes plastic deformation; therefore, a crease appears.
2.2. Numerical Simulation Analysis
2.2.1. Simplified Model
A 1/4 repeatable unit (S-shaped folding) is taken as the simplified model, ans the straight-line segment of the thin film is extended to the y–z plane, as shown in Figure 3a. The lower end of the thin film is fixed, and its upper end is supported by a sliding hinge. For the finite element model, folding loads are applied by using a thin-plate rigid body. An analytical rigid body is parallel to the y–z plane and moves along the negative direction of X-axis. The plate and thin film firstly have a line contact and then gradually expand to a surface contact. The thin-film rebound force P at any thin-film spacing h can be obtained by applying displacement to the thin-plate rigid body. Figure 3b shows the finite element analysis model of the S-shaped folding thin film.
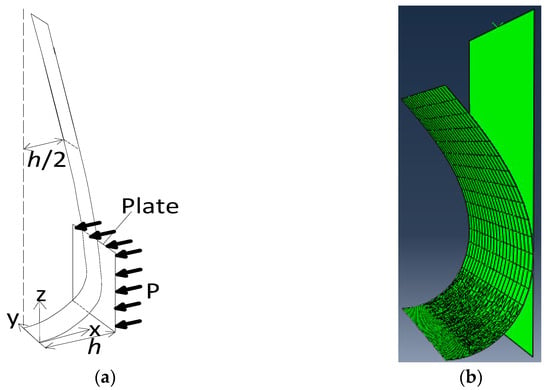
Figure 3.
Simplified FEM model. (a) Geometric simplified model. (b) Numerical model.
2.2.2. Folding Simulation
The initial state of the thin film is in the form of straight strips. Firstly, a small uniform line load (1.0 × 10⁻⁶ N/mm) is applied along the positive Z-axis direction at the right edge of the thin film to create an initial bending of the thin film model. Then, displacements along the positive Z-axis and the negative X-axis direction to the right edge of the thin film are applied to bend the thin film, so that the right edge of the thin film reaches the y–z plane. The displacement constraint of upper edge (right edge) of the thin film along the z direction is removed, and the displacement constraint in the x direction is maintained, so that the upper edge can move freely along the Z-axis direction in the y–z plane. The minimum distance between the thin film and the rigid body of thin plate is determined, and the displacement is applied to the thin plate to contact with the thin film. Finally, the thin-film rebound force P at any thin-film spacing h is obtained by moving the thin plate. The numerical simulation analysis process is shown in Figure 3a.
The folding simulation was carried out by ABAQUS 6.22. The shell element S4R was used to consider geometric nonlinearity and contact nonlinearity between the thin film and thin plate. The finite element is meshed, as shown in Figure 3b. The curved section adopts a denser quadrilateral element, whereas meshed elements in the straight section are sparser, and the middle transition section adopts a triangular element. The Kapton film strips with thicknesses of 50 μm and 125 μm were used for analysis. Material parameters and nonlinear constitutive were measured in Section 2.3.3.
Grid independence was verified by comparing four mesh densities: coarse (0.25 mm), medium (0.125 mm), fine (0.0625 mm), and extra-fine (0.03125 mm). Figure 4 shows that P converges between the fine and extra-fine meshes, with ΔP < 0.01 N mm−1. However, the extra-fine mesh increases the CPU time by 310%. Therefore, the fine mesh is adopted for all analyses. This verification was performed under continuous loading with a fold spacing h = 2.0 mm. Figure 5 shows finite element mesh of numerical model.
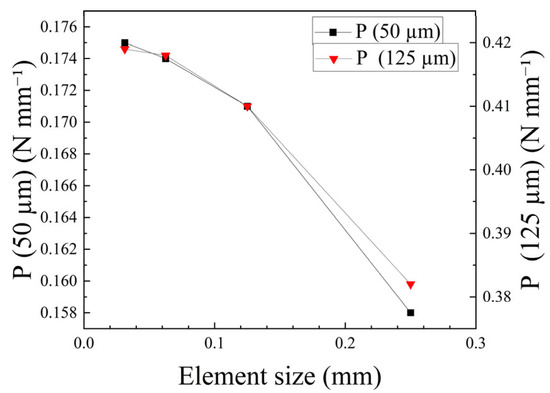
Figure 4.
Grid-convergence analysis.

Figure 5.
Finite element mesh of numerical model.
2.3. Folding Test
2.3.1. Continuous Loading
The Kapton® 200HN thin film (American Dupont Company, Wilmington, DE, USA) with two thicknesses was selected for performing the folding test. The specimen size is shown in Figure 6, and the dotted lines indicate bent and folded areas. The test scheme is shown in Figure 7. The upper and lower plates are loaded by a high-precision uniaxial compression testing machine to measure the elastic recovery force of the folded thin film between two adjacent parallel plates and the distance between the two adjacent plates considering the self-weight of the upper plate.
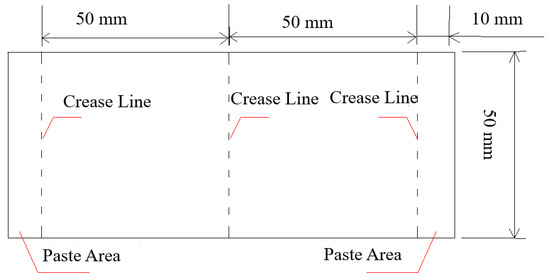
Figure 6.
Size of thin-film specimen.

Figure 7.
Front view and side view of folding test. (a) Front view; (b) side view.
The first stage is test preparation. The thin-film specimens can be made according to Figure 6. The adhesive zones at both ends of the 50 μm thin film are adhered and fixed to two pieces of plexiglass, each weighing 15 g. The adhesive zones at both ends of the 125 μm thin film are adhered and fixed to two pieces of plexiglass, each weighing 60 g, as shown in Figure 8a. To reduce friction, contact surface between the thin film and the plate should be wiped clean with acetone. There are three test specimens of each group named as M50-2, which represent the thin-film specimen with a thickness of 50 μm for the specimen No. 2.

Figure 8.
Experiment of folding loading. (a) Experimental setup; (b) local view of loading.
The 50 µm and 125 µm thicknesses were selected because they bracket the typical range employed in current solar sail missions and ground prototypes; both gauges of Kapton 200HN are commercially available, ensuring that our findings are directly relevant to the ongoing engineering practice.
The test loading is considered as the second stage. The folding thin-film test was carried out by continuous loading with a high-precision testing machine. For the specimens of 50 μm thick Kapton® 200HN, a force sensor with a measuring range of 50 N was used, with an error of less than 0.25 N and a loading speed of 9 mm/min. For the 125 μm thick Kapton® 200HN, the force sensor had a measuring range of 500 N and an error of less than 2.5 N, and a loading speed of 9 mm/min. The concentricity of the test machine fixture and parallelism of upper and lower planes are strictly controlled. The test specimens are loaded by the controlled displacement method. The folded thin film in each specimen is subjected to three cycles of loading within an elastic range, followed by three cycles of loading within an elastoplastic range The test loading process is shown in Figure 8b and Figure 9 that show the crease after the plastic deformation test.
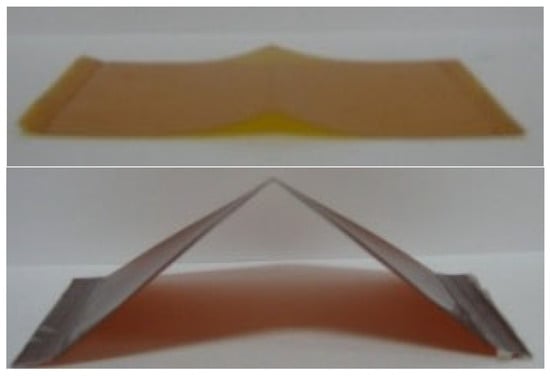
Figure 9.
Plastic deformation of fold line.
The curves of thin-film rebound force P and thin-film spacing h in the folding test of thin films with a thickness of 50 μm and 125 μm, as shown in Figure 10a,b. Equation (25) gives P∝1/h2, so P rises sharply as the plate spacing h decreases, providing theoretical support for the trends observed in Figure 11. It could be found that, as the distance between upper and lower plates decreases, the rebound force of folded thin film increases. The three loading cycles within the elastic range basically overlap. However, for the three loading cycles within the elastoplastic range, as the crease (i.e., known as plastic deformation) occurs at the thin film’s folding and bending points, the loading and unloading paths do not overlap. As the curves obtained from the three specimens with each thickness are basically consistent, and the repeatability of the test is good. The slight horizontal difference might be caused by the error in measuring the initial distance between upper and lower plates at the beginning of compression. The thin-film folding test curve can be roughly divided into two steps. The first step is the beginning of folding and compressing. As the thin-film spacing decreases, the increase in the rebound force of thin film is relatively small. The spacing changes in 50 μm and 125 μm thin films were 4.7 mm to 2.0 mm and 14.0 mm to 5.0 mm, respectively. The second stage is the bending stage with a small radius of curvature, where t/R < 1/40, and R is the radius of curvature. As the thin-film spacing decreases, the rebound force of thin film increases significantly.
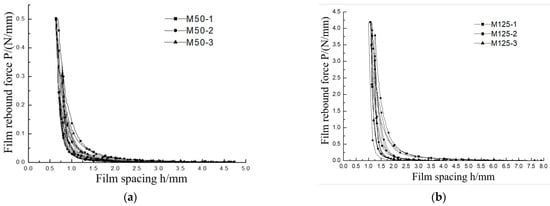
Figure 10.
P-h curve of Kapton® 200HN (50 and 125 denote thicknesses (μm); 1–3 label the three replicates). (a) 50 μm Kapton® 200HN; (b) 125 μm Kapton® 200HN.

Figure 11.
Experimental setup of folding creep.
2.3.2. Stepwise Loading
The Kapton film is a kind of polymer polyimide thin film with viscoelastic and viscoelastoplastic characteristics. As the continuous loading folding test was conducted with a relatively short duration, therefore, creep did not occur, and the creep effect was tested by the stepwise weight loading folding test. The thin-film specimen is the same as that in Figure 6, and the basic test device is the same as that in Figure 8a. Weights are applied by stepwise loading, and the distance between the two plates is measured every 6 h. The 50 μm thick thin films were loaded with weights of 50 g and 100 g, respectively, while the 125 μm thick thin films were loaded with weights of 200 g and 500 g, respectively, as shown in Figure 11.
To keep the bending moment per unit width comparable between the two thicknesses, we conducted pilot tests. Applying 200 g and 500 g to 50 µm films caused immediate plastic creasing, whereas 50 g and 100 g on 125 µm films produced negligible creep. Consequently, only the load combinations reported were adopted.
Table 1 displays the folding creep displacement of thin-film specimens (Δh), Δh is the difference between the thin-film spacing at each moment and the initial moment, and the initial moment refers to the thin-film spacing h0 measured immediately after the weights are loaded. It can be seen from Table 1 that the creep has occurred completely after 6 h. The thin films with the same thickness basically have the same creep variable from the initial moment to when the complete creep occurs under different loads. However, the thin films with different thicknesses have a great difference in their creep variable from the initial moment to when the complete creep occurs. The creep variable of folding spacing h of thin films with thickness of 50 μm and 125 μm was 0.43 mm and 1.05 mm, respectively.

Table 1.
Creep displacement of thin-film folding (in mm).
2.3.3. Thin-Film Material Property Test
In the room-temperature environment test, a high-precision tensile testing machine was used. The force sensor has a measuring range of 50 N with a precision of 1 N and a loading speed of 10 mm/min, and the preload is 0.5 N. The specimen is dumbbell-shaped, with a width of 6 mm and an effective length of 40 mm, as shown in Figure 12, the number of each group is 3, and the specimen number of T50-2 represents the tensile test thin film with a thickness of 50 mm for specimen No. 2.
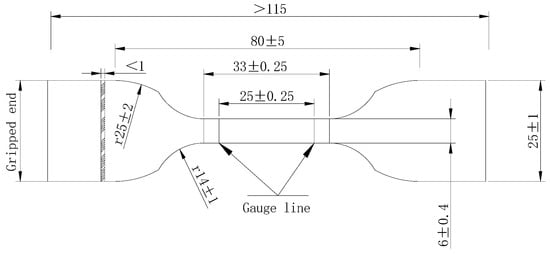
Figure 12.
Dumbbell-shaped Kapton® 200 specimen (in mm).
Table 2 show the equation of σ-ε curves of 50 μm and 125 μm Kapton® 200HN thin films measured by experiments. According to the curves, elastic modulus E, yield strength σy (proportional limit), and yield strain εy can be obtained. The stress–strain curve of the thin film represents nonlinear characteristics. There is a relatively low elastic stage, then it manifests as elastoplastic and elastoplastic strengthening phenomena. The σ-ε curves are divided into three segments: straight-line segments y1, y2, and y3. Equation of each segment can be obtained by using the least square method, as shown in Table 2.

Table 2.
Mechanical properties of Kapton® 200HN.
2.4. Comparison of Results
2.4.1. Analysis of One-Dimensional Approximation Theory
According to the one-dimensional approximation theory, the mathematical expression between thin-film rebound force P and thin-film spacing h can be obtained using Equation (22). Table 3 shows the parameters of one-dimensional approximate theory, and the P-h curve can be obtained by the P-h function, as shown in Figure 13 and Figure 14.

Table 3.
Parameters based on one-dimensional approximation theory.
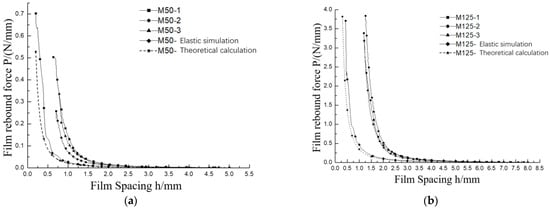
Figure 13.
P-h curve of M50 and M125 under continuous load. (a) M50; (b) M125.
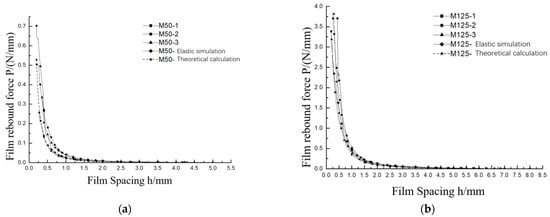
Figure 14.
P-h curves of M50 and M125 step load with creep correction. (a) M50; (b) M125.
2.4.2. Comparative Analysis of Test
According to the numerical simulation method of thin-film folding described in Section 2.2, thin-film material parameters and nonlinear functions measured in Section 2.3.3 are applied to the thin-film model. An elastic analysis and an elastic–plastic analysis of thin-film folding are carried out by the ABAQUS software, and the P-h curve can be obtained, as shown in Figure 13.
Figure 14a,b present a comparison among folding tests under the continuous loading of thin films with thicknesses of 50 μm and 125 μm and theoretical results based on one-dimensional approximate theory and numerical results. According to Figure 14a,b, it could be shown that the curves return to their original position after three elastic folds, and then, they can be loaded again until plastic deformation occurs. It can be seen from the figures that theoretical results based on the one-dimensional approximate method are in good agreement with the numerical simulation analysis. All the test results are consistent. However, test deformations were all smaller than the corresponding numerical deformations.
According to the folding test under stepwise loading in Section 2.3.2, the creep displacements of the thin-film spacing h in the 50 μm and 125 μm thick thin-film folding tests were 0.43 mm and 1.05 mm, respectively. The P-h curve of folding test under continuous loading in Figure 14 was offset against the X-axis by the corresponding amount to obtain the P-h curve considering the creep effect. It was found that the experimental, numerical, and theoretical results were basically the same, as shown in Figure 14a,b.
To more clearly demonstrate three elastic cyclic loading and elastoplastic cyclic loading, a logarithmic coordinate system is adopted. Specimens of M50-1 and M125-2 were selected, and the creep effect was considered for correction. Figure 15 presents the P-h curves of thin-film folding test including theoretical results based on one-dimensional approximate theory and the numerical results of elastic analysis and elastoplastic analysis.
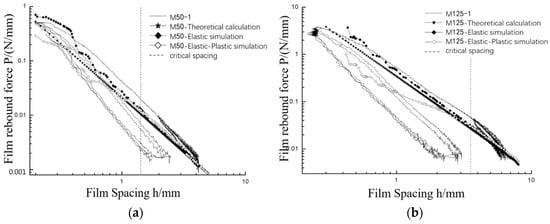
Figure 15.
P-h curve of M50 and M125 folding experimental, numerical, and theoretical results. (a) M50; (b) M125.
According to Figure 15, it can be seen that the P-h curve deduced by the one-dimensional approximation theory is a straight line, and the P-h curve of numerical results in elastic analysis is approximately linear. At the same time, the P-h curve of numerical results in elastic and elastic–plastic analyses is linear and smooth when the thin-film spacing h is large. However, as the thin-film spacing decreases, the curve “oscillates”. The main reason is that, as the thin-film spacing decreases, warping distortion occurs on the thin-film element in the bending section, and the element size has a significant effect on the numerical results. The P-h curve obtained from the thin-film folding test basically overlaps with the curve in the three elastic loading ranges, while the loading curve does not overlap in the three elastic–plastic ranges.
By comparing the P-h curves of theoretical results based the on one-dimensional approximate theory and the numerical results of elastic analysis, it can be seen that, for the same thin-film spacing h, the thin-film rebound force P obtained by the elastic analysis of numerical simulation is slightly larger than that obtained by using one-dimensional approximate theory. The main reason is that numerical analysis takes into account geometric nonlinear factors. In numerical simulation analysis, P is a surface load, while in theoretical analysis, P is a linear load. By comparing the P-h curves obtained from numerical results in elastic analysis and first elastoplastic loading test, thin film folding test curves are basically above numerical simulation elastic analysis curves. The main reason is that there is friction between thin film and upper or lower plates, which restricts the horizontal movement of the thin film and enhances the vertical stiffness of folded thin film.
According to the P-h curves of elastic and elastic-plastic analysis of numerical simulation, the curves obtained by elastic and elastic-plastic analysis on the right side of the dividing line coincide. Whereas the elastic analysis curve on the left side of the dividing line is above the elastic-plastic analysis. The corresponding h to the dividing line is called as critical spacing of thin film. The critical load P of thin film is calculated according to Equation (22), and σMises of the thin film is calculated according to Equation (23). Compared with the tensile yield strength of the material, as shown in Table 4, it is proved that the thin film model based on one-dimensional approximate theory can effectively predict the mechanical behavior of thin-film folding.

Table 4.
Comparison of σMises and tensile yield strength.
3. Welding Performance Test
3.1. Test Preparation
To manufacture large-area thin-film solar sails, it is necessary to weld the thin films. Therefore, in this paper, uniaxial tensile tests were conducted on the welded thin films to measure the strength of the thin-film welds under different welding temperatures and pressures. The tensile force and elongation required to eliminate weld wrinkles were also measured.
In the room-temperature environment, the strength of Kapton film specimen as the base material and welded Kapton film was tested by uniaxial tensile test, which was characterized by failure stress. The tensile testing machine (Figure 16) has high precision, its error is less than 1 N, loading tensile speed is 5 cm/min, and preload is 1 N. The preload and concentricity of the testing machine are strictly controlled. The clamp should not damage the thin-film material.
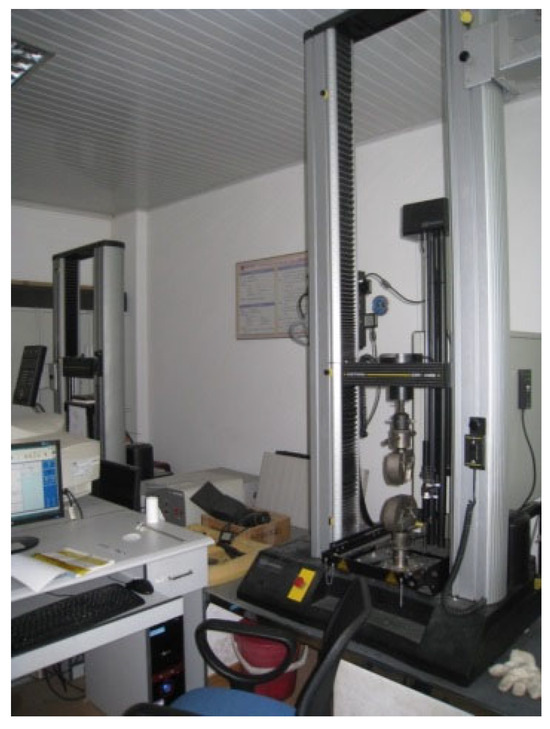
Figure 16.
INSTRON 33R-4465-type test machine.
A strip specimen with a length of 180 mm and a width of 20 mm was adopted. The geometric error was less than 0.1 mm. The strip specimen should be measured by a steel ruler and be cut by a scalpel. The cutting should be uniform and smooth without flaws. Each group should contain three specimens numbered as M1, M2, and M3. Specimens are shown in Figure 17a below.

Figure 17.
Thin-film specimen and welded specimen. (a) Base thin-film specimen; (b) T290F0 welded specimen.
For the welded Kapton specimen, the weld seam is in the width direction of specimens and located in the middle of the length of specimens, and the rest of the parameters are same as those of the base material. Each specimen should be numbered, and a photo of the entire thin film should be taken before cutting. The 25 µm thick Kapton was welded under different welding parameters by a welding machine. The running speed of welding machine was 10 mm/s. DSC of 25 µm Kapton 200HN shows softening at ~285 °C and a melting peak at 340 °C, so welding must exceed 285 °C for full fusion yet remain below 315 °C to prevent thermal degradation. Preliminary shear tests further revealed that pressures below 50 N produced porous seams, whereas pressures above 200 N caused edge squeeze-out and thickness reduction. Welding was carried out at welding temperatures of 290 °C, 295 °C, 300 °C, 305 °C, and 310 °C and welding pressures of 0 N, 50 N, 100 N, 150 N, and 200 N, respectively. This parameter set precisely spans the process window that secures full melt bonding while minimizing thermal and mechanical damage. Each welding should be performed until welding temperature is stable. The welding process is displayed in Figure 18a, and welded specimens of Kapton film are shown in Figure 18b. There are a total of 25 groups of weld specimens with a weld width of 8 mm, with three specimens are grouped together. The specimens were numbered according to the welding temperature and welding pressure. For example, T300F100-1 represents the specimens welded at a temperature of 300 °C and under a pressure of 100 N, and the number 1 indicates the first specimen in this group. The welded specimens named as T290F0 are shown in Figure 17b.
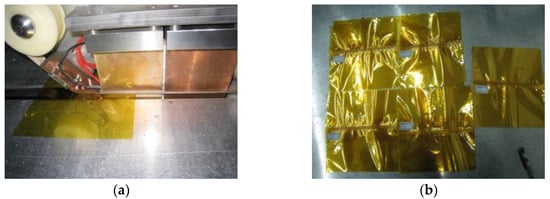
Figure 18.
Welding specimens. (a) Process of welding; (b) welded specimens.
The failure process of base material specimen and welded specimen are, respectively, shown in Figure 19a,b. According to behavior of specimen failure, failure of all specimens can be divided into two types of failure. The first type of damage is that thin-film specimen does not undergo obvious plastic deformation with a small elongation and suddenly breakage occurs after stress reaches its maximum value. The second type of damage is that a considerable length of thin film in the specimen (in some specimens, it is almost the entire length of the thin film) undergoes obvious plastic deformation with a relatively large elongation.
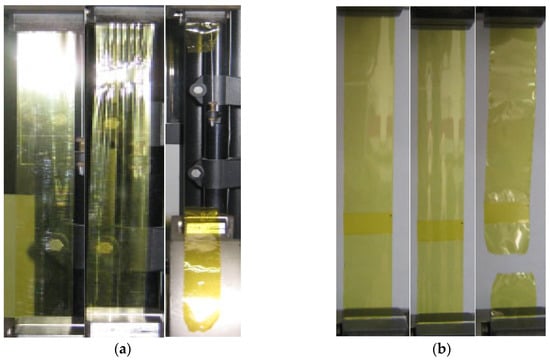
Figure 19.
Failure of specimens under uniaxial tensile test. (a) Base specimens; (b) welded specimens.
3.2. Test Results
The failure results of base material specimens are shown in Figure 20a. Taking T290F0 as an example, failure results of the specimens are shown in Figure 20b. The failure strength of base and welded thin-film specimens is shown in Table 5. According to Figure 20a,b, most welded specimens experienced breakage in the base material section and only a few welded specimens broke at the middle welding point. According to Table 5, their strength also meets the requirements, so the welding is also qualified. By comparing the failure strength of the welded specimens under different temperatures and pressures, it can be seen that, after the temperature reaches 290 °C, the weld seams under various welding pressures are all qualified, which is not related to the pressure.

Figure 20.
Test result of thin film specimens. (a) Base thin film; (b) welded thin film of T290F0.

Table 5.
Failure strength of base and welded thin films (in MPa).
3.3. The Tension and Elongation Required to Eliminate Weld Wrinkles
To eliminate wrinkles of thin film due to welding and improve the flatness of the membrane surface, a certain tensile force needs to be applied along the weld seam. The measurement is carried out using a force gauge with high precision. The tensile length could be obtained from uniaxial testing machine and elongation rate can be calculated. The welded specimen was prepared at 300 °C and 50 N. Figure 21 shows the process of this tensile test.
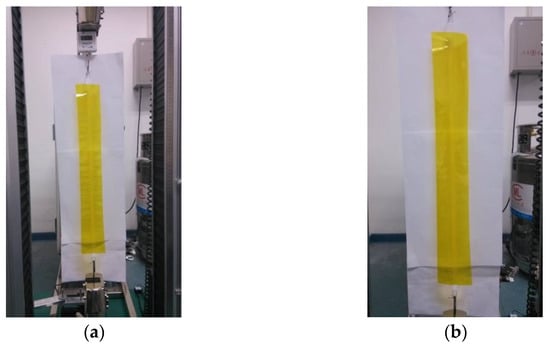
Figure 21.
Test of eliminating wrinkles. (a) Before tensile; (b) after tensile.
Due to relatively low precision of the sensor in the testing machine, a force gauge with a precision of 0.01 N was used to measure the tensile force. The movement distance of chuck of testing machine could be read from testing machine. The tensile force and elongation when wrinkling of thin film due to welding is eliminated is shown in Table 6. According to Table 6, tensile force under welding wrinkle disappearance along the weld is 9.61 N and elongation is 0.43%.

Table 6.
Tension and elongation rate when wrinkles disappear.
4. Conclusions
In this paper, the Kapton film folding process is studied by engineering theory, numerical simulation, and experiment, respectively. The P-h curves of the thin-film folding rebound force P and the thin-film spacing h obtained by the three methods are basically consistent with each other; therefore, a simplified folding model is validated by comparing the theoretical, numerical, and experimental results. To manufacture a large area of solar sail thin film, it is necessary to weld the thin film. This paper also introduces uniaxial tensile test results of the welding thin film for the manufacture of solar sail.
- (1)
- During the process of folding and compressing of thin film, the rebound force of bent thin film increases as the thin-film spacing decreases. When the thin-film spacing h is large, the increase in the rebound force is not obvious. However, when the spacing is less than a certain value, rebound force increases significantly; meanwhile, compression speed has an impact on the rebound force of the thin films. During film folding, the σMises values for 50 µm and 125 µm films deviate from their tensile yield strengths by only 1.6% and 1.7%, respectively, validating the one-dimensional model’s predictive accuracy.
- (2)
- The stress–strain curves and mechanical properties of the commonly used solar sail thin film named as Kapton® 200NH were measured by experiments. As creep phenomenon of Kapton film under load is obvious, it should be fully considered in structural design and analysis.
- (3)
- By comparing the failure strength of the welded specimens under different temperatures and pressures, it can be seen that the weld seams are qualified under various welding pressures after the temperature reaches 290 °C. Therefore, it is indicated that welding temperature of Kapton film is approximately 290 °C, and welding effect has little to do with the pressure. For 50 µm Kapton film with a 10 mm weld, wrinkle elimination required a tensile force of 9.61 N and an elongation of 0.43%.
The limitations of this study are as follows: (1) Only 20 mm wide Kapton strips were used to examine the effects of thickness and welding on folding–recovery and joint strength, without addressing the likely worsening of wrinkles when the actual solar-sail area expands to tens or hundreds of square meters due to cumulative length mismatch, global out-of-plane modes, and amplified thermal gradients. (2) All experiments and modeling in this study were conducted on bare Kapton 200HN film, without the aluminum or silver reflective layers and heat-dissipation coatings required for actual solar sails; consequently, the conclusions apply directly only to the Kapton substrate.
Author Contributions
Conceptualization, Y.H.; methodology, Y.H.; software, E.Q.; validation, Y.H.; formal analysis, H.L.; investigation, H.L.; resources, E.Q.; data curation, W.C.; writing—original draft preparation, Y.H.; writing—review and editing, Y.H.; visualization, H.L.; supervision, W.C.; project administration, W.C.; funding acquisition, Y.H. All authors have read and agreed to the published version of the manuscript.
Funding
The first author acknowledges with thanks the research financial support provided by the Wuhan Talent Project for Excellent Youth (No. 45222071) and Hubei Province government for oversea youth talent project. All authors also would like to thank the anonymous reviewers for their constructive comments to improve the quality of the paper.
Data Availability Statement
Data are contained within the article.
Conflicts of Interest
The authors declare no conflicts of interest.
Nomenclature
| θ | Angle between s direction and horizontal axis x |
| u,w | Neutral-axis displacement |
| Rx, Rz | Reaction force |
| κ | Curvature |
| v | Poisson’s ratio |
| h | Fold spacing |
| ε | Strain |
| σMises | Mises yield stress |
| t | Thin-film thickness |
| y1 | Linear segment |
| σy | Yield strength |
| s | Length of neutral axis of the thin film unit |
| Ms | Bending moment |
| I | Second moment of area |
| Ts | Axial force |
| E | Elastic modulus |
| P | Contact reaction force |
| σ | Stress |
| B | Membrane width |
| θ0 | Rotation angle at s = a + b |
| y2 | Curved segment |
| y3 | Linear segment |
| εy | Yield strain |
| Δh | Difference between the thin-film spacing at each moment and the initial moment |
References
- Liyanage, P.M.; Gangasudan, N.; Mallikarachchi, H.M.Y.C. Modified spiral folding pattern for deployable membranes. Aerosp. Sci. Technol. 2021, 117, 106926. [Google Scholar] [CrossRef]
- Yuan, L.; Song, R.; Wang, F.; Wei, J.; Liu, J. Comparison of two folded methods of solar sails. Aerospace 2022, 9, 746. [Google Scholar] [CrossRef]
- Amodio, A.M.; Visser, P.; Heiligers, J. Dynamical modelling of NASA’s ACS3 solar sail mission. Aerosp. Sci. Technol. 2025, 161, 110146. [Google Scholar] [CrossRef]
- Chen, J.; Shi, A.; He, Y.; Dai, H.; Pei, Y. Nonlinear nonmodal analysis of solar sail orbit robust stability. Acta Astronaut. 2025, 236, 755–769. [Google Scholar] [CrossRef]
- Boni, L.; Quarta, A.A.; Mengali, G. Thermal-structural analysis of a square solar sail. Acta Astronaut. 2019, 154, 268–277. [Google Scholar] [CrossRef]
- Zhang, Y.F.; Zhang, W.; Zhang, Y.F.; Amer, A. Nonlinear waves in solar sail telescopic mast under temperature effect. Aerosp. Sci. Technol. 2025, 166, 110614. [Google Scholar] [CrossRef]
- Zou, J.; Li, D.; Wang, J. High-precision numerical calculation method of solar radiation pressure force for wrinkled solar sails. Proc. Inst. Mech. Eng. G J. Aerosp. Eng. 2022, 236, 2463–2471. [Google Scholar] [CrossRef]
- Seefeldt, P.; Dachwald, B. Temperature increase on folded solar sail membranes. Adv. Space Res. 2021, 67, 2688–2695. [Google Scholar] [CrossRef]
- Fu, B.; Sperber, E.; Eke, F. Solar sail technology—A state of the art review. Prog. Aerosp. Sci. 2016, 86, 1–19. [Google Scholar] [CrossRef]
- Kucukdeger, E.; Tong, Y.; Singh, M.; Zhang, J.; Harding, L.K.; Salado, A.; Ellingson, S.W.; Johnson, B.N. Conformal 3D printing of non-planar antennas on wrinkled and folded Kapton films using point cloud data. Flex. Print. Electron. 2021, 6, 044002. [Google Scholar] [CrossRef]
- Ouyang, J.; Liu, Y.; Liu, J.; Wang, M.; Feng, J. Research on a folded Blumlein line using Kapton film as dielectrics. Plasma Sci. Technol. 2008, 10, 231–234. [Google Scholar] [CrossRef]
- Mierunalan, S.; Dassanayake, S.P.; Mallikarachchi, H.M.Y.C.; Upadhyay, S.H. Simulation of ultra-thin membranes with creases. Int. J. Mech. Mater. Des. 2023, 19, 73–94. [Google Scholar] [CrossRef]
- Kamaliya, P.K.; Upadhyay, S.H.; Mallikarachchi, H.M.Y.C. Investigation of wrinkling behaviour in creased thin-film laminates. Int. J. Mech. Mater. Des. 2021, 17, 899–913. [Google Scholar] [CrossRef]
- Shin, H.; Wang, S.; Tateyama, S.; Kaneko, D.; Kaneko, T. Preparation of a ductile biopolyimide film by copolymerization. Ind. Eng. Chem. Res. 2016, 55, 8761–8766. [Google Scholar] [CrossRef]
- Colin, J. Buckling and folding of a ductile thin film on a rigid substrate. Mech. Res. Commun. 2024, 135, 104237. [Google Scholar] [CrossRef]
- Su, X.; Tu, Z.; Ji, L.; Wu, H.; Xu, H.; Liu, C. Foldable electrochromic NiO films. J. Vac. Sci. Technol. A 2023, 41, 043414. [Google Scholar] [CrossRef]
- Wang, X.; Xiao, Z.; Ren, H.; He, Z.; Li, H.; Fu, D. Dynamical reverse folding and residual gas expansion models of flexible thin films. J. Vac. Sci. Technol. A Vac. Surf. Film. 2024, 42, 013403. [Google Scholar] [CrossRef]
- Satou, Y.; Furuya, H. Mechanical properties of Z-fold membrane under elasto-plastic deformation. J. Space Eng. 2011, 4, 14–26. [Google Scholar] [CrossRef]
- Xia, Z.M.; Wang, C.G.; Tan, H.F. Elastoplastic folding behavior of membrane ribbon based on plane strain beam theory. Int. J. Solids Struct. 2018, 143, 167–174. [Google Scholar] [CrossRef]
- Thiria, B.; Adda-Bedia, M. Relaxation mechanisms in the unfolding of thin sheets. Phys. Rev. Lett. 2011, 107, 025506. [Google Scholar] [CrossRef]
- Benusiglio, A.; Mansard, V.; Biance, A.L.; Bocquet, L. The anatomy of a crease, from folding to ironing. Soft Matter 2012, 8, 3342–3347. [Google Scholar] [CrossRef]
- Jules, T.; Lechenault, F.; Adda-Bedia, M. Local mechanical description of an elastic fold. Soft Matter 2019, 15, 1619–1626. [Google Scholar] [CrossRef]
- Nishizawa, T.; Sakamoto, H.; Okuma, M.; Furuya, H.; Sato, Y.; Okuizumi, N.; Shirasawa, Y.; Mori, O. Evaluation of crease effects on out-of-plane stiffness of solar sails. Trans. JSASS Aerosp. Technol. Jpn. 2014, 12, 107–113. [Google Scholar] [CrossRef]
- Liu, K.; Paulino, G.H. Nonlinear mechanics of non-rigid origami: An efficient computational approach. Proc. R. Soc. A MPES 2017, 473, 2206. [Google Scholar] [CrossRef]
- Xia, Z.M.; Wang, C.G.; Tan, H.F. Quasi-static unfolding mechanics of a creased membrane based on a finite deformation crease–beam model. Int. J. Solids Struct. 2020, 207, 104–112. [Google Scholar] [CrossRef]
- Wang, J.; Liu, Y.; Yang, Y.; Wang, J.; Kang, H.; Yang, H.; Zhang, D.; Cheng, Z.; Xie, Z.; Tan, H.; et al. A weldable MXene film assisted by water. Matter 2022, 5, 1042–1055. [Google Scholar] [CrossRef]
- Ramirez, J.A.B.; Krasnikov, D.V.; Butt, H.A.; Dmitrieva, V.A.; Serebrennikova, S.I.; Trepalin, O.R.; Vildanova, A.R.; Kondrashov, V.A.; Goldt, A.E.; Dzhurinskiy, D.V.; et al. Ethylene-induced welding of single-walled carbon nanotube films to enhance mechanical and optoelectronic properties. Carbon 2025, 238, 120230. [Google Scholar] [CrossRef]
- Du, B.; Chen, L.; Liu, H.; He, Q.; Qin, W.; Li, W. Resistance welding of glass fiber reinforced thermoplastic composite: Experimental investigation and process parameter optimization. Chin. J. Aeronaut. 2020, 33, 3469–3478. [Google Scholar] [CrossRef]
- Chan, W.X.; Ng, S.H.; Li, K.H.H.; Park, W.-T.; Yoon, Y.-J. Micro-ultrasonic welding using thermoplastic-elastomeric composite film. J. Mater. Process. Technol. 2016, 236, 183–188. [Google Scholar] [CrossRef]
- Wang, T.; Yasuda, K.; Nishikawa, H. Study on the SPCC and CFRTP hybrid joint performance produced with additional Nylon-6 interlayer by ultrasonic plastic welding. Polymers 2022, 14, 5235. [Google Scholar] [CrossRef]
- Ran, Z.; Shang, H.; Ma, B.; Li, R.; Shangguan, F.; Yu, D. Microstructure and mechanical properties of AlN/Al joints brazing by a sputtering Al/Cu bilayer film solder. Materials 2022, 15, 2674. [Google Scholar] [CrossRef] [PubMed]
- Miura, K. Method of packaging and deployment of large membranes in space. In Proceedings of the 31st International Astronautical Federation Congress, Tokyo, Japan, 1–10 September 1980; Available online: https://api.semanticscholar.org/CorpusID:137872225 (accessed on 5 September 2025).
- Satou, Y.; Furuya, H. FEM analyses for wrapping fold model of membrane retracted by guided-pin mechanics. In Proceedings of the 51st AIAA/ASME/ASCE/AHS/ASC Structures, Structural Dynamics, and Materials Conference, Orlando, FL, USA, 12–15 April 2010. [Google Scholar] [CrossRef]
Disclaimer/Publisher’s Note: The statements, opinions and data contained in all publications are solely those of the individual author(s) and contributor(s) and not of MDPI and/or the editor(s). MDPI and/or the editor(s) disclaim responsibility for any injury to people or property resulting from any ideas, methods, instructions or products referred to in the content. |
© 2025 by the authors. Licensee MDPI, Basel, Switzerland. This article is an open access article distributed under the terms and conditions of the Creative Commons Attribution (CC BY) license (https://creativecommons.org/licenses/by/4.0/).