Abstract
The stress corrosion cracking (SCC) susceptibility of 2195-T8 Al-Li alloy in N2O4 medium was evaluated using slow strain rate testing (SSRT). The electrochemical corrosion behavior and morphological evolution of the alloy under different conditions were further examined through potentiodynamic polarization measurements. The results indicate that with the increase in electrochemical corrosion rate, the corrosion morphology of the alloy extends from localized pitting and intergranular corrosion to severe exfoliation corrosion. In the N2O4 medium, the alloy exhibits significant susceptibility to SCC at tensile rates of ε ≥ 5 × 10⁻⁶ s−1. However, when strained at ε = 10−6 s−1, a sudden increase in ISCC is observed accompanied by a transition to brittle intergranular fracture mediated by anodic dissolution. At the same stretch rate (ε = 10−6 s−1), the susceptibility to SCC of the alloy in N2O4 medium increased with higher water content ω(H2O). This trend is attributed to enhanced generation of HNO3 and HNO2, as well as increased diffusion of hydrogen—produced by the cathodic reaction—to the crack tip. The synergistic interaction between anodic dissolution and hydrogen embrittlement ultimately promotes the initiation and propagation of SCC in the alloy.
1. Introduction
N2O4 is widely employed as an oxidizer in two-component liquid propulsion systems for both the first and second stages of launch vehicles, owing to its high density, high specific impulse, and strong oxidizing properties [1]. However, under long-term storage conditions, N2O4 tends to absorb moisture from the ambient environment, forming a N2O4(H2O)n system. This hydration process facilitates the generation of corrosive species such as HNO3 and HNO2 [2], which accelerate the corrosion of the storage tank materials. Such degradation can lead to structural failures, potentially resulting in propellant leakage and associated safety incidents.
Since their introduction in 1958, aluminum–lithium alloys have been recognized as advanced aerospace materials owing to their low density, high specific strength, and superior fatigue crack resistance [3,4]. For instance, NASA has employed 2195 aluminum–lithium alloys in the construction of propellant storage tanks [5]. As the lightest metallic element, lithium contributes significantly to property enhancements: each 1 wt% addition of Li increases the elastic modulus of aluminum alloys by approximately 6% and reduces density by about 3%. In third-generation aluminum–lithium alloys, the copper content is elevated to approximately 3.3 wt%, whereas the lithium content is typically limited to 1.3 wt%. According to the chemical composition, the main reinforcing phases in these alloys consist of T1 phase (Al2CuLi), θ phase (Al2Cu), S phase (Al2CuMg), and δ′ phase (Al3Li). Additionally, elements such as Ag, Zr, etc., are commonly incorporated into the alloys to form dispersed particles. These particles facilitate the precipitation kinetics of the reinforcing phases, thereby enhancing the mechanical properties, corrosion resistance, and microstructural stability of the alloys [6,7]. However, Al-Li alloys remain susceptible to localized corrosion—including pitting, intergranular corrosion, and exfoliation corrosion—primarily due to the electrochemical inhomogeneity caused by the enhanced precipitation of intermetallic compounds. Under applied stress, such corrosion-induced defects act as stress concentration sites, which significantly promote SCC. This effect is particularly critical in higher-strength aluminum alloys, which exhibit greater sensitivity to stress concentrators [8,9]. Cracks produced by stress corrosion first appear at the defective locations within the material’s surface layer. Stress corrosion cracks typically initiate at defect sites within the material’s surface layer. These cracks often propagate abruptly without obvious macroscopic precursors, thereby posing significant safety risks to both the liquid tank storage and its crew.
A variety of mechanisms have been proposed to account for environmentally induced cracking, including slip-dissolution models, membrane-induced dissolution, surface mobility models, and various hydrogen embrittlement mechanisms [10]. For aluminum alloys, which are susceptible to intergranular stress corrosion cracking, two primary mechanisms have been proposed: anodic dissolution and hydrogen embrittlement. It is widely established that SCC in 2XXX series aluminum alloys predominantly occurs via an intergranular mechanism, wherein corrosion is localized and accelerated by the application of tensile stress. Anodic paths are formed along the copper depleted zones at the grain boundaries, leading to a measurable potential difference between the grain boundaries and the interior of the grains. Similarly, the occurrence of hydrogen embrittlement has been observed in several special environments, mainly in the form of a reduction in the plastic elongation of the alloy. The SSRT technique was developed by R. N. Perkins in the 1970s [11]. In this method, a uniaxially loaded tensile specimen, either smooth or notched, is strained until fracture at a very low crosshead speed under controlled environmental conditions. For a given metal/environmental system, there exists a critical strain rate range within which stress corrosion cracking occurs. For aluminum alloys, the strain rates range from 10−8 s−1 to 10−5 s−1. The decrease in the key parameters of the stress–strain curves measured in corrosive media compared to the reference values determined in inert environments indicate susceptibility to environmentally induced cracking. Ghosh et al. [12], Hu et al. [13] and Goebel et al. [14] have carried out the SSRT method for Al-Li alloys in NaCl solution. The results of the tests show that stress corrosion cracking in Al-Li alloys originates from corrosion pits and eventually leads to brittle fracture of the alloy.
Due to the toxicity and extreme volatility of N2O4, conducting experimental tests in this medium presents significant challenges. As a result, there are limited reports on stress corrosion testing of Al-Li alloys in propellant environments. This study investigates the SCC susceptibility of 2195-T8 Al-Li alloy in N2O4 via SSRT, complemented by electrochemical measurements. The findings offer valuable insights into the SCC mechanisms of Al-Li alloys in oxidizer environments, which are of critical importance for ensuring the long-term service safety of propellant storage tanks and the secure handling of propellants.
2. Experimental Section
2.1. Sample Preparation
The test material was a domestically produced 2195-T8 Al-Li alloy plate, the chemical composition of which meets the national requirements for manufacturing aluminum–lithium alloy storage tanks. The basic mechanical properties of the material at room temperature are presented in Table 1. Figure 1a illustrates the SSRT experimental setup. The SSRT tests were conducted using a CORMET C2001 model (Corrosion Testing Systems, Vantaa, Finland) slow strain rate tensile machine. During the test, the tensile specimen was connected at both ends to the machine’s grips. Furthermore, a glass container for holding the corrosive medium was fabricated according to the specimen dimensions. This container was designed to completely enclose the gauge section of the specimen, thereby enabling stress–corrosion coupled test conditions. SSRT specimens were manufactured in accordance with ASTM G129-00 (2013). A plate was machined into a dog-bone geometry by wire electrical discharge machining (EDM), with the specific dimensions illustrated in Figure 1b. All specimens were subsequently ground, polished, cleaned, dried, and stored in a desiccator prior to use.

Table 1.
Basic mechanical properties of 2195-T8 AL-Li alloy.

Figure 1.
(a) Stress corrosion experimental state; (b) shape and dimensions of SSRT specimen.
2.2. Microstructure
The surface microstructure of the specimen surface was examined using by a Hitachi SU8010 scanning electron microscope (Hitachi High-Tech Corporation, Tokyo, Japan), with particular emphasis on morphological features including grain shape, grain boundary orientation, and secondary phase particles. In addition, typical areas marked by SEM observations were sampled using the micro-sectioning method, and the type and distribution of precipitated phases in 2195-T8 Al-Li alloy were subsequently characterized using a Talos200S scanning (Thermo Fisher Scientific, Waltham, MA, USA) transmission electron microscope (STEM).
2.3. Polarization Curve Test
Under conventional storage conditions, N2O4 exists primarily in the liquid phase. However, electrochemical testing of as-delivered N2O4 is challenging due to its low initial water content. Furthermore, the partial reaction between N2O4 and H2O results in a multiphase system, which prevents the establishment of a stable current loop necessary for reliable electrochemical measurements. Therefore, based on previous work conducted by the research group and with reference to the GJB1673-93 standard [15], which confirms the suitability of N2O4 as a test medium, an improved electrochemical testing method was employed to obtain polarization curves of the 2195-T8 Al-Li alloy in N2O4 containing varying water contents: ω(H2O) = 0.6%, 1.0%, 2.0%, 4.0%, 6.0%, and 8.0%.
A conventional three-electrode electrochemical setup was employed for the experiments. The electrolytic cell featured a PTFE liner with an outer shell made of 304 L stainless steel. In contrast to commonly used encapsulation techniques such as epoxy potting or welding, the working electrode (Figure 2) was fabricated integrally from the Al–Li alloy base material, with dimensions of 5 cm × 5 cm, and incorporated seamlessly connected wiring from the same material. A platinum wire and a platinum mesh were used as the reference electrode and counter electrode, respectively. Electrochemical measurements were conducted using an Ivium-Stat multichannel electrochemical workstation (Ivium Technologies, Eindhoven, The Netherlands), housed within a Wuhan Koster Faraday shielding chamber (25 cm × 30 cm × 25 cm) to minimize external electromagnetic interference. Prior to each potentiodynamic scan, the open-circuit potential was monitored until a stable value was obtained. Polarization curves were then measured at a scan rate of 1 mV/s. Following electrochemical testing, the specimens were examined using SEM to characterize the surface corrosion morphology.
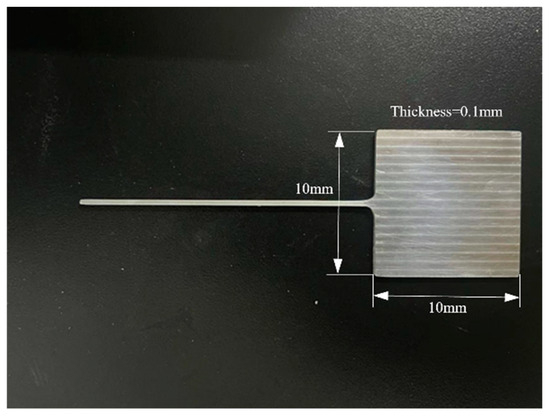
Figure 2.
Working electrode.
2.4. SSRT
SSRT tests were conducted on a CORMET C2001 testing system (Corrosion Testing Systems, Vantaa, Finland) designed for corrosion-resistant materials. The tests were performed on 2195-T8 Al-Li alloy specimens in both air and N2O4 environments, employing tensile rates of 10−5 s−1, 5 × 10⁻⁶ s−1, 10−6 s−1, and 10−7 s−1. Based on the polarization curve results, two additional groups of tests were carried out in N2O4 media with different water contents [denoted as ω(H2O)] at a strain rate of 10−6 s−1. Prior to each test, a preload of approximately 100 N was applied to ensure uniform stress distribution across the specimen. After fracture, the fracture surfaces and adjacent regions were examined to analyze the failure morphology.
3. Results and Analysis
3.1. Micro-Morphology
Figure 3 illustrates the microstructure of the 2195-T8 Al-Li alloy surface. As depicted by the polygonal outlines in Figure 3a, the grains exhibit elongation along the rolling direction. A higher-magnification view of the region marked by the orange rectangle in Figure 3b reveals that the microstructure consists of both original coarse grains and equiaxed recrystallized grains. In the color-marked recrystallized grains, micron-sized Cu-rich or Fe-rich precipitates (indicated by arrows) exhibit selective enrichment or depletion, resulting in a heterogeneous distribution. As shown in the backscattered electron (BSE) images (Figure 3c–e), bright clusters of intermetallic particles are aligned along the rolling direction within the region marked by the dashed box. Elemental analysis of the intermetallic particles indicated by the yellow arrows was conducted using energy-dispersive spectroscopy (EDS). The results revealed that the particles were composed of 78.51% Al, 12.42% Cu, 6.59% Fe, 1.92% Ag, and 0.56% Mg. Notably, the content of heavy metal elements is relatively high. The distribution and chemical composition of such intermetallic particles significantly influence the corrosion resistance of the alloy, and may induce various forms of localized corrosion, thereby degrading the mechanical properties of the 2195-T8 Al-Li alloy.
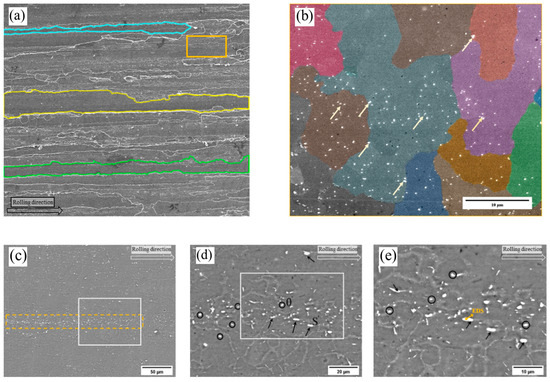
Figure 3.
(a) SE image of 2195 Al-l alloy; (b) higher magnification of the area enclosed in the solid box shown in (a); (c) BSE image of 2195 A-li alloy; (d) higher magnification of the area enclosed in the solid box shown in (c); (e) higher magnification of the area enclosed in the solid box shown in (d).
Figure 4a,b present the high-angle annular dark-field scanning transmission electron microscopy (HAADF-STEM) images of Al-Li alloys, demonstrating the distribution characteristics of various precipitated phases within grains and along grain boundaries. As shown in Figure 4a, a typical triple junction of grain boundaries is observed. The T1 phase is present both intragranularly and at the grain boundaries; however, its density is notably lower along the boundaries compared to the interior of the grains. This inhomogeneous distribution is likely attributable to the effects of the thermal treatment and cold-working processes applied to the plates [16]. By comparing the three grain boundaries, it can be observed that grain boundary 1 exhibits a higher density of T1 phases compared to grain boundaries 2 and 3. This suggests a greater dislocation density at grain boundary 1, as T1 phases are known to preferentially nucleate at sites with elevated dislocation densities and increased crystal defects.
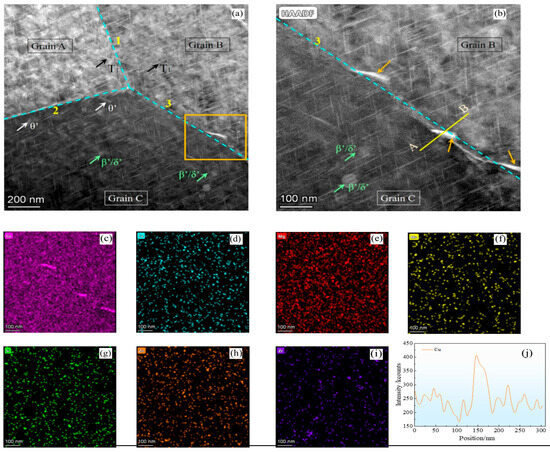
Figure 4.
(a) TEM-HADF image depicting the precipitate distribution in the alloy; (b) higher magnification of the area enclosed in the orange box shown in (a); (c–i) EDX mapping of the various elements in (b); (j) Cu distribution along the line A-B shown in (b).
Based on the contrast variations in the micrographs, grain A exhibits higher brightness compared to grains B and C, indicating distinct crystallographic orientations among these grains. This brightness discrepancy suggests the widespread presence of dislocations within the 2195-T8 Al-Li alloy, which are associated with the observed orientation differences. In addition, θ′ phases partially embedded at grain boundaries 2 and 3 are observed. As shown in high-magnification image of the rectangular region in Figure 4a (Figure 4b), larger secondary phases are dispersedly precipitated on grain boundary 3, and this feature affects the corrosion behavior of Al-Li alloys. Figure 4c–j present the energy-dispersive X-ray spectroscopy (EDX) elemental maps and line scan profiles corresponding to the region displayed in Figure 4b. Among all trace elements analyzed, Cu exhibits the highest concentration, followed by Mg, Fe, Zn, Si, Mn, and Zr in descending order of intensity. As shown in the line profile across A–B in Figure 4j, the intensity of Cu peaks notably at the grain boundary, indicating significant segregation of Cu in these regions.
The intensity peak observed at the grain boundary suggests significant enrichment of Cu in this region compared to the grain interior, whereas Zr is predominantly distributed within the grains. Due to its low atomic mass, Li is not detectable by EDX; however, the disc-shaped co-precipitates of the β′/δ′ phases (Al3Zr/Al3Li) can still be identified based on the distribution of Zr. Although these β′/δ′ phases do not directly affect the corrosion performance of Al-Li alloys, their presence causes discontinuities in the oxides formed on the surface of the alloys, which affects the corrosion resistance of Al-Li alloys [17].
3.2. Electrochemical Test Results
Figure 5 presents the potentiodynamic polarization curves of 2195-T8 Al-Li alloy in N2O4 media with different water contents, denoted as ω(H2O). The corresponding corrosion current densities, derived from curve fitting, are summarized in Table 2. Notably, the polarization curve measured at ω(H2O) = 0.6% exhibits significant instability, and no well-defined open-circuit potential can be observed under this condition.
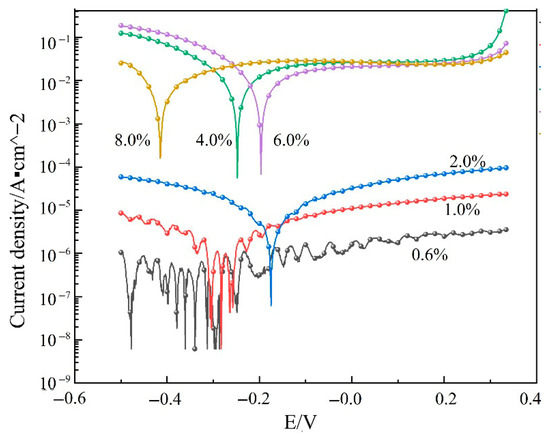
Figure 5.
Polarization curves of 2195-T8 Al-Li alloy in different ω(H2O)N2O4 contents.

Table 2.
Corrosion current density of 2195-T8 Al-Li alloy in different ω(H2O)N2O4 contents.
Since N2O4 is not conductive, this also leads to the uneven distribution of the generated ions in the solution, which are in a free state and cannot form a stable current loop. Since N2O4 itself is non-conductive, the ions generated in the solution distribute unevenly and remain in a free state, preventing the formation of a stable current loop. When ω(H2O) exceeds 1.0%, the polarization curve exhibits a more regular behavior: the current initially decreases and then increases with rising potential, indicating that sufficient ions are now present in the solution to establish a stable current loop. In the cathodic region, the corrosion potential of the specimen shows a sharp decline in the trend. At this time, the cathodic area of the specimen surface is predominantly characterized by hydrogen precipitation reaction:
2H+ + 2e− → H2↑
In the anodic region, the corrosion current exhibited a three-stage evolution: an initial rapid increase, followed by a slow growth phase, and a subsequent further rapid rise. This behavior suggests the occurrence of a consistent corrosion process on the specimen surface during the early immersion period, specifically the dissolution reaction of aluminum:
Al − 3e− → Al3+
As corrosion progresses, a dense layer of corrosion products gradually forms on the specimen surface, providing a protective effect on the underlying matrix and resulting in a slow increase in corrosion current. When the electrode potential further increases beyond a certain critical value—specifically under conditions where ω(H2O) > 2.0%, as summarized in Table 2—a sharp transition in corrosion current density is observed. Compared to the polarization curve obtained at ω(H2O) = 2.0%, the curve under higher water content exhibits a distinct passivation region and a pitting potential of approximately 0.3 V. At this point, the protective corrosion product film is ruptured, allowing the corrosive medium to penetrate directly to the substrate. Consequently, the corrosion current increases rapidly once again.
Following electrochemical testing, the specimens were carefully cleaned and dried in preparation for SEM analysis. Representative corrosion morphologies are presented in Figure 6. As shown in Figure 6a–c, the extent of corrosion is observed to increase significantly with rising water content, denoted as ω(H2O). At ω(H2O) = 0.6%, the specimen surface exhibits severe localized corrosion characterized by distinct groove-like features, as indicated by the arrows in Figure 6a. These grooves are typically associated with the dealloying of Cu-rich phase particles, where preferential dissolution leads to the formation of trenching structures around the periphery of the particles. Following the preferential corrosion of the T1 phase, the S′ phase becomes susceptible to dissolution. The transformation into Cu-rich residues and the subsequent formation of corrosion grooves suggest that these regions temporarily function as cathodic sites, owing to the higher electrochemical potentials of Cu and Al–Cu compounds relative to the alloy matrix. Eventually, the isolated intermetallic particles within the grooves become inert and electrochemically protected, ceasing to act as active cathodes.
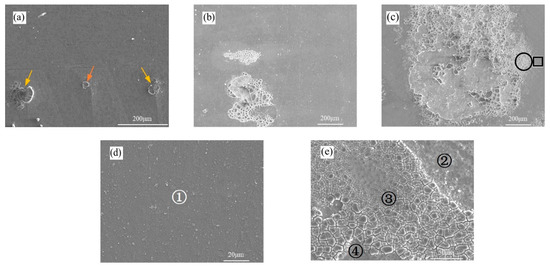
Figure 6.
Typical surface morphology of electrochemical specimens after test: (a) ω(H2O) = 0.6%; (b) ω(H2O) = 2.0%; (c) ω(H2O) = 6.0%; (d) enlarged view of the square area in (c); (e) enlarged view of the circular area in (c).
In addition, the regions indicated by the black arrows exhibit a clear correlation between the occurrence of corrosion and the presence of intermetallic compound particles, with subsequent propagation along grain boundaries leading to intergranular attack. This phenomenon is further illustrated in Figure 6b,c. As shown in Figure 6b, the increased density of fine pits is likely attributable to ongoing intergranular corrosion [18].
Moreover, localized exfoliation corrosion is evident on the specimen surface, accompanied by the detachment of a small fragment of the matrix. As shown in Figure 6c, both the corroded region and the area of substrate detachment expanded with the progression of corrosion. The severely corroded zone (indicated by the circle in Figure 6c) and its adjacent region (marked by the square in Figure 6c) were magnified for detailed examination. Figure 6d reveals a granular lattice morphology on the specimen surface, with numerous precipitated products dispersed throughout, denoted as zone ①.
As shown in Figure 6e, the exposed region can be divided into three distinct zones: ②, ③, and ④. In zone ②, the grain boundaries become clearly visible, accompanied by slight swelling of a limited number of grains. Zone ③ exhibits separation between adjacent grains, indicating a state of imminent spallation. Zone ④ corresponds to the exposed substrate after exfoliation, where the freshly revealed surface continues to corrode upon contact with the medium, resulting in a morphology similar to that of zone ①. This progression from ① to ④ illustrates a cyclic mechanism of corrosion propagation via repeated exfoliation. Given that N2O4 itself is non-corrosive, the introduction of H2O leads to the formation of HNO2 and HNO3, with HNO2 further decomposing into HNO3 [19]. The predominant corrosion reaction in this system is the nitrate formation resulting from the interaction between Al and HNO3. Previous work by our group has confirmed the presence of nitrate compounds, providing direct evidence of the corrosive role of HNO3 on these alloys [20].
NO3− exhibits a corrosive effect on intermetallic compounds, and similarly induces severe localized corrosion in aluminum alloys. Intergranular corrosion in aluminum alloys originates from microstructural heterogeneities at or adjacent to grain boundaries. These regions, characterized by high densities of vacancies, dislocations, and solute atoms, usually act as non-homogeneous nucleation sites for precipitates in polycrystalline materials [21]. In 2195-T8 Al–Li alloy, Mg—the second most abundant alloying element after aluminum and lithium—participates actively in electrochemical reactions, further influencing the corrosion behavior of the alloy.
The susceptibility of aluminum alloys to IGC is strongly associated with the presence of continuously distributed electrochemical couples along grain boundaries [22]. A study by Zhang et al. [23] revealed that the addition of Mg promotes the precipitation of intermetallic compounds at grain and subgrain boundaries, which in turn facilitates the initiation and propagation of intergranular corrosion.
Integrating the findings from Figure 3 and Figure 4, it can be concluded that the T1 phase present at the grain boundaries exhibits a more negative electrochemical potential than the Al matrix under corrosive conditions. This potential difference, combined with the presence of the Al-Mg phase, promotes preferential anodic dissolution along the grain boundaries, thereby initiating intergranular corrosion. Simultaneously, the precipitation of θ′ phase at the grain boundaries accelerates the dissolution of the Al matrix along the grain boundaries, thus triggering the intergranular corrosion of the alloy, and the large and continuous Cu-rich particles along the grain boundary structure is one of the main reasons for the rapid expansion of IGC. Finally, the presence of NO2− should not be ignored, as it also enhances the susceptibility to intergranular corrosion (IGC). As the process of IGC progresses, intergranular compounds act as active pathways for anodic dissolution, enabling the corrosion to propagate inward along directions parallel to the metal surface. The volume of insoluble corrosion products formed exceeds that of the metal consumed, resulting in a “wedge effect.” These products exert an outward pressure on the underlying uncorroded metal, inducing tensile stresses along grain boundaries. This process facilitates grain boundary separation and accelerates crack initiation and propagation. Ultimately, the accumulation of corrosion products leads to the lifting and detachment of the metal surface from the substrate, manifesting as exfoliation corrosion [24].
3.3. SSRT Tests
3.3.1. Different Strain Rates
Figure 7 presents the stress–strain curves of 2195-T8 Al-Li alloy tested in air and in N2O4 at various strain rates. The results indicate that fracture occurs in a ductile manner under both environmental conditions. In air, the tensile strength and elongation at break of the alloy exhibit minimal variation with decreasing strain rate. In contrast, exposure to the N2O4 environment leads to a pronounced reduction in both tensile strength and elongation at break when the strain rate is decreased to ε = 10−6 s−1.
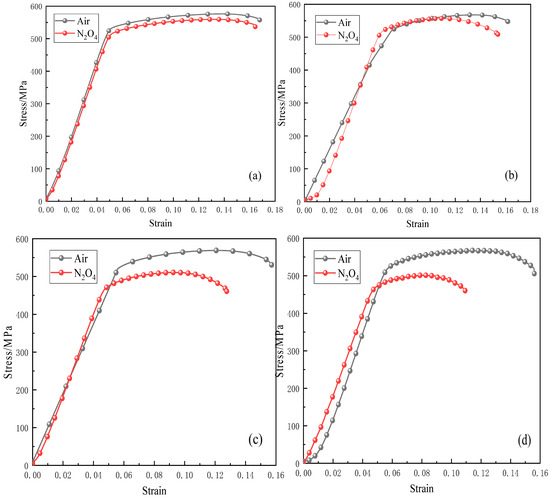
Figure 7.
Stress–strain curves of 2195-T8 Al-Li alloy tested at different strain rates in air and N2O4: (a) ε = 10−5 s−1; (b) ε = 5 × 10⁻⁶ s−1; (c) ε = 10−6 s−1; (d) ε = 10−7 s−1.
Figure 8 illustrates the variation trends of yield strain, ultimate strain, yield stress, and ultimate stress of the aluminum–lithium alloy under different strain rates and media conditions. As can be seen from Figure 8a, under stress–corrosion coupling conditions, both the yield strain and ultimate strain of the aluminum–lithium alloy are reduced compared to those in an air environment. The yield strain values of the aluminum–lithium alloy in N2O4 remain relatively stable. However, the ultimate strain shows a more pronounced reduction as the strain rate decreases, indicating that the deformability of the aluminum–lithium alloy is weakened due to N2O4 corrosion. Furthermore, Figure 8b reflects the variation trends of the yield stress and ultimate stress of the aluminum–lithium alloy under stress–corrosion coupling conditions. Under the influence of N2O4 corrosion, the yield strength and ultimate strength values of the aluminum–lithium alloy decrease with increasing corrosion time. This suggests that N2O4 has a significant impact on the basic mechanical strength of the aluminum–lithium alloy during the long-term storage of loaded propellants in liquid propellant tanks.
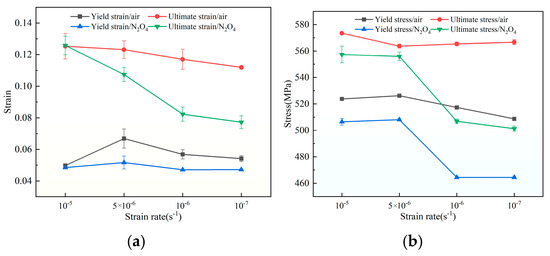
Figure 8.
(a) Changes in the alloy’s yield strain and ultimate strain under varying strain rates and media conditions; (b) changes in the alloy’s yield stress and ultimate stress under varying strain rates and media conditions.
Figure 9 presents the macroscopic port morphology of the specimens after SSRT tests conducted in air and N2O4 environment. As shown in Figure 9, narrow notches are visible at both ends of the fracture surface, and the number of these notches tended was observed to decrease as the tensile rate decreased.
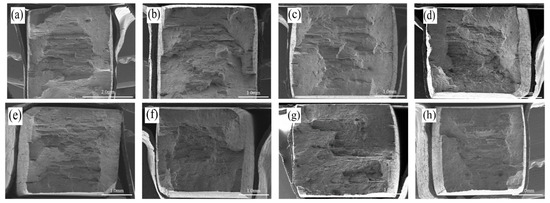
Figure 9.
Fracture morphology (macroscopic) of 2195-T8 Al-Li alloy in two environments: (a) Air/ε = 10−5 s−1; (b) Air/ε = 5 × 10⁻⁶ s−1; (c) Air/ε = 10−6 s−1; (d) Air/ε = 10−7 s−1; (e) N2O4/ε = 10−5 s−1; (f) N2O4/ε = 5 × 10⁻⁶ s−1; (g) N2O4/ε = 10−6 s−1; (h) N2O4/ε = 10−7 s−1.
This behavior is attributed to the intrinsic microstructural characteristics of the 2195-T8 alloy, particularly the presence of grain boundary precipitates and the intergranular crack path deflection induced by the zigzag morphology of the grain boundaries under a load. These features collectively contribute to the observed layered fracture morphology [25]. Furthermore, the central region of the fracture surface, often referred to as the fibrous zone, exhibits a distinctly rough and undulating morphology. This characteristic topography suggests the occurrence of extensive plastic deformation during crack propagation in this area.
On the other hand, the peripheral region (shear fracture zone) exhibits a relatively flatter fracture surface. The fracture morphology of the specimen was further magnified and examined; representative features are presented in Figure 10. Figure 10a–c display typical fracture characteristics of the 2195-T8 Al-Li alloy tested in an air environment, revealing a predominantly transgranular fracture mode. As shown in Figure 10a, the fracture surface near the delamination notch exhibits extensive quasi-cleavage features with a pronounced laminar morphology. This fracture behavior is attributed to the high stress concentration in this region, which results in relatively lower fracture toughness compared to other areas of the specimen. Figure 10b,c present the morphological features of the fiber zone and shear fracture zone, respectively, both of which exhibit numerous dimples, characteristic of ductile fracture. The dimples in the fiber zone are notably larger and deeper, whereas those in the shear fracture zone appear relatively shallow and small. The initiation of SCC results from the synergistic interaction between mechanical tensile stress and a corrosive environment. This process involves an incubation period where the combined action progressively deteriorates the material at susceptible microstructural sites until a critical threshold for crack nucleation is attained. During plastic deformation, cracks tend to nucleate preferentially at interfaces. Under low strain rate conditions, the alloy undergoes prolonged deformation, allowing sufficient time for inclusions or second-phase particles at the interfaces to facilitate the nucleation, growth, and coalescence of microvoids. This process leads to the development of localized internal necks between these particles and the base metal. Subsequently, these microvoids coalesce and link with macroscopic crack initiation sites, resulting in shear or tear fractures. The accumulation and interconnection of these voids ultimately form a typical dimpled fracture morphology, characteristic of ductile failure [26].
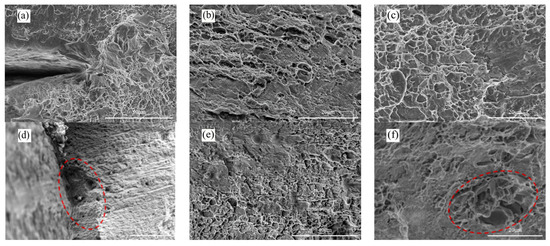
Figure 10.
Typical fracture morphology of 2195-T8 Al-Li alloy tested in the two different environments: (a) Air/ε = 10−6 s−1; (b) Air/ε = 10−6 s−1; (c) Air/ε = 10−6 s−1; (d) N2O4/ε = 10−6 s−1; (e) N2O4/ε = 10−6 s−1; (f) N2O4/ε = 10−6 s−1.
As shown in Figure 10d, corrosion pits are evident on the surface of the sample exposed to the N2O4 medium. Meanwhile, Figure 10e reveals distinct features of localized corrosion. Furthermore, Figure 10f exhibits a cleavage step characteristic of intergranular fracture, suggesting the occurrence of brittle fracture in this region. The observed phenomenon further corroborates reduction in both tensile strength and elongation at break of the specimens in Figure 7c. Therefore, at the tensile rate of ε ≤ 10−6 s−1, the fracture behavior of 2195-T8 Al-Li alloy in N2O4 medium remains predominantly transcrystalline, albeit with a concomitant presence of intergranular fracture.
Figure 11 presents the typical fracture side morphology of 2195-T8 Al-Li alloy tested in both environments. A comparison between Figure 11a–c reveals the amount of white particulate matter on the surface of the specimen is significantly higher. EDS analysis results are presented in Figure 11e,f. The particulate matter deposited on the specimen surface primarily consists of Al, Cu, and O. The Cu content in these particulates is significantly higher than that in the alloy matrix, indicating that the particles are likely corrosion products.

Figure 11.
Typical fracture lateral morphology of 2195-T8 Al-Li alloy tested in the two different environments: (a,b) N2O4 and ε = 5 × 10⁻⁶ s−1; (c,d) N2O4/ε = 10−6 s−1; (e) Spot1; (f) Spot2.
The reduced strain rate prolongs the exposure time of the specimen to N2O4, leading to the corrosion morphology depicted in Figure 11b,d. As a result, the alloy exhibits more severe corrosion at a strain rate of ε = 1 × 10⁻⁶ s−1 compared to ε = 5 × 10⁻⁶ s−1. In Figure 11d, the surface layer of the corrosion crater has spalled off and shows a tendency to propagate further into the depth, whereas in Figure 11b, only localized corrosion is initiated on the specimen surface.
3.3.2. Different ω(H2O)N2O4 Contents
Based on the test results presented in Section 3.2 and Section 3.3.1, a strain rate of ε = 10−6 s−1 was selected to perform slow strain rate tensile (SSRT) tests on 2195-T8 Al-Li alloy in N2O4 environments with water mass fractions of ω(H2O) = 1.0%, 2.0%, and 6.0%. The corresponding stress–strain curves are shown in Figure 12. Both the yield strength and elongation at break of the alloy decreased progressively with increasing ω(H2O) in the N2O4 medium.
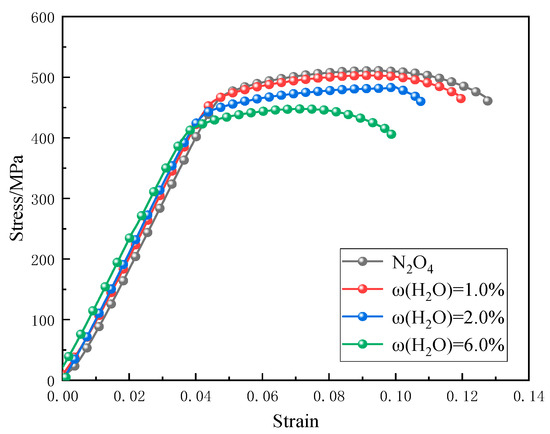
Figure 12.
Stress–strain curves of 2195-T8Al-Li alloy in different ω(H2O)N2O4 contents.
Figure 13 shows the macroscopic fracture morphology of 2195-T8 Al-Li alloy after testing in N2O4 media with different water contents, labeled as ω(H2O). With reference to Figure 9g, the fracture surface was severely corroded, particularly in the fibrous region. Despite this corrosion, this region retained an undulating morphology and a cracked appearance. At higher magnification (Figure 14), although the fracture morphology exhibits varying degrees of corrosion, features characteristic of intergranular brittle fracture remain identifiable. Figure 15 illustrates the typical fracture side morphology of 2195-T8 Al–Li alloy exposed to N2O4 with varying water contents, labeled as ω(H2O). As indicated by the red dashed lines in Figure 15a–c, the fracture surfaces can be divided into two distinct zones. Zone ① exhibits a honeycomb-like corrosion morphology. Based on comparative analysis with the control sample in Figure 11c, it is inferred that the corrosion is likely initiated by the precipitated phases within the alloy. Moreover, as the water content ω(H2O) increases, the severity of corrosion in zone ① is observed to intensify progressively. However, as shown in Figure 15c, the extent of surface corrosion appears less severe than that observed in Figure 15b. The presence of lumpy corrosion residues (indicated by red arrows) in Figure 15c, which resemble those identified in Figure 6, suggests the occurrence of exfoliation corrosion in this region. Meanwhile, as shown in Figure 15c, secondary cracks are observed within the region marked by the elliptical dashed line. A magnified view of these cracks, provided in Figure 15d, reveals that they originate from corrosion pits, as indicated within the circular dashed line. In zone ② of Figure 15a–c, clear intergranular fracture facets are observed, confirming the brittle fracture behavior of the alloy.

Figure 13.
2195-T8 Al-Li alloy fracture morphology of different ω(H2O)N2O4: (a) ω(H2O) = 1.0%; (b) ω(H2O) = 2.0%; (c) ω(H2O) = 6.0%.

Figure 14.
Fracture morphology of 2195-T8 Al-Li alloy in containing different ω(H2O)N2O4 contents: (a) ω(H2O) = 1.0%; (b) ω(H2O) = 2.0%; (c) ω(H2O) = 6.0%.

Figure 15.
Typical fracture side morphology of 2195-T8 Al-Li alloy in containing different ω(H2O)N2O4: (a) ω(H2O) = 1.0%; (b) ω(H2O) = 2.0%; (c) ω(H2O) = 6.0%; (d) enlargement of the elliptical region in (c).
3.4. Stress Corrosion Susceptibility
To evaluate the effects of strain rate and water content (ω(H2O)) in N2O4 on the SCC behavior of the alloy, its susceptibility was quantified using the fracture energy loss, ISCC(FE), and the plasticity loss, ISCC(δ).
where FEmedium and FEair represent the fracture energy of the specimen in corrosive medium and air, respectively; δmedium and δair represent the fracture elongation of the specimen in corrosive medium and air, respectively. The fracture energy and fracture elongation of the 2195-T8 Al-Li alloy under different corrosive medium and tensile rates are presented in Figure 16 and Figure 17, respectively. In Figure 16 and Figure 17, the bar chart represents fracture energy, and the line graph represents fracture elongation.
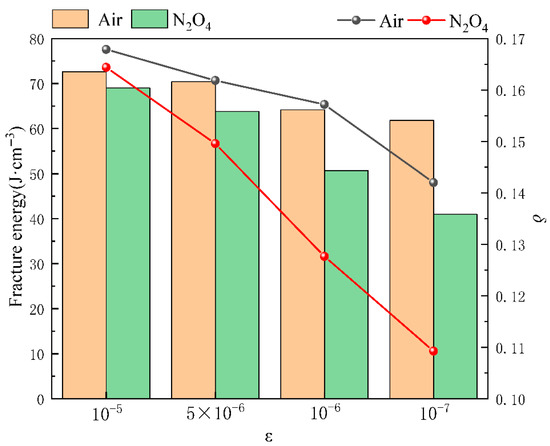
Figure 16.
FE and δ of 2195-T8 Al-Li alloy with different tensile rates in air and N2O4.
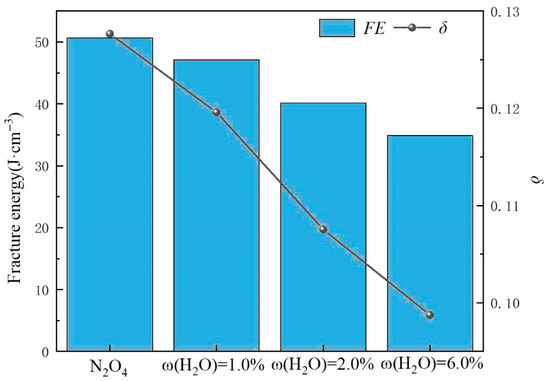
Figure 17.
FE and δ of 2195-T8 Al-Li alloy in N2O4 containing different ω(H2O).
Figure 18 illustrates the variation trends of ISCC(FE) and ISCC(δ) for the 2195 aluminum–lithium alloy under different media and loading conditions. It can be observed that in the N2O4 medium, the stress corrosion sensitivity of the aluminum–lithium alloy increases with longer corrosion time (i.e., lower strain rate). Furthermore, in an environment where N2O4 and water coexist, the stress corrosion sensitivity of the Al-Li alloy is even stronger. This indicates that during the long-term storage of propellants in liquid propellant tanks, the presence of water in N2O4 will cause more severe damage to the tank’s structural material.
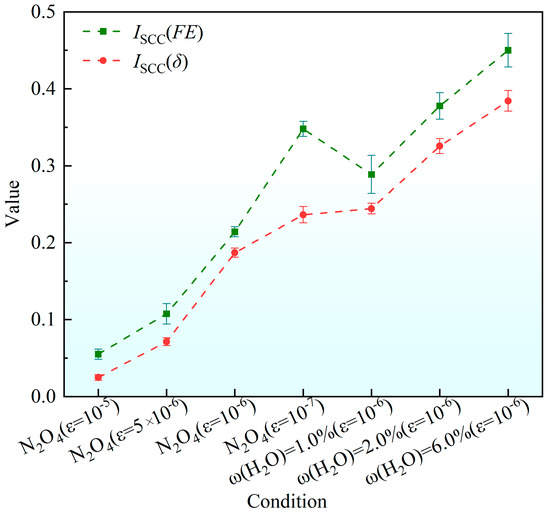
Figure 18.
Variation in Iscc of 2195 Al-Li alloy under different media and loading conditions.
3.4.1. Effect of Tensile Rate on ISCC
As shown in Figure 16, even in an air environment, both the fracture FE and the reduction in area δ of the alloys exhibit a slight decrease with diminishing tensile rate. This observation is consistent with the findings reported by Cui et al. [27], which indicate that SCC can occur in high-strength aluminum alloys exposed to air, albeit at a very low crack propagation rate. In the N2O4 environment, the ISCC values of both alloys remain below 0.1 at tensile rates of 10−6 s−1 and 5 × 10⁻⁶ s−1, indicating that they retain considerable susceptibility to stress corrosion cracking under these conditions. A further reduction in the tensile rate to 1 × 10⁻⁶ s−1 resulted in a marked increase in the ISCC of the alloy. This lower strain rate prolongs the duration of exposure to the corrosive environment under load, thereby promoting more severe corrosion damage, as evidenced by the morphological characteristics shown in Figure 11b,d. Consequently, a higher density of corrosion defects forms at lower tensile rates, which further promotes crack initiation and propagation, as evident in Figure 10d. This phenomenon is further corroborated by the increased oxide formation observed in Figure 11c compared to Figure 11a. Additionally, the influence of tensile deformation on alloy grain characteristics must also be considered. The plastic deformation of aluminum alloys is governed by intragranular deformation and the coordinated motion of grains. At the microscopic scale, this process is accommodated through vacancy diffusion, directional atomic migration, and the slip and climb of dislocations within grains and across grain boundaries. During uniaxial tensile deformation, an aluminum alloy undergoes irreversible plastic deformation once the applied stress exceeds its yield point. This deformation is facilitated by dislocation-mediated mechanisms, often characterized by an associated activation volume, which accommodates strain within grains and across grain boundaries. As a result, along the tensile axis, vacancy diffusion and stress-directed atomic migration promote grain elongation. Concurrently, the size, distribution, and morphology of strengthening precipitates within the original microstructure evolve accordingly. Most of these reinforcing phases are solidly dissolved in the matrix and exhibit a diffuse distribution, which effectively inhibits synergistic deformation of the grains. Under higher strain rates, the shorter deformation time restricts grain reorientation and slip, leading to premature fracture before significant grain co-deformation can occur. Consequently, specimens deformed at lower strain rates exhibit more uniform deformation near the fracture surface, characterized by greater grain elongation and a higher density of precipitated phases. The increased presence of these phases, including both T1 and θ′, promotes the formation of localized galvanic couples, thereby accelerating galvanic corrosion and facilitating corrosion initiation.
3.4.2. Effect of ω(H2O) on ISCC
At the same strain rate, the ISCC values—evaluated both by fracture energy (FE) and critical crack opening displacement (δ)—exhibited an increasing trend with rising water content ω(H2O) in the N2O4 environment. Prolonged immersion in N2O4 promotes the formation of a substantial oxide layer on the alloy surface, which provides a certain degree of corrosion inhibition.
On the one hand, the tensile stress will affect the bonding force between the oxides and the matrix, which will make these oxides more easily detached from the matrix. On one hand, tensile stress weakens the bonding force between the oxides and the matrix, promoting the detachment of these oxides. On the other hand, according to our previous study [28], an increase in the H2O content (ω(H2O)) in N2O4 significantly accelerates the reaction between N2O4 and H2O, leading to increased production of HNO3 and HNO2. These acidic products enhance localized corrosion, facilitate the formation of corrosion defects, and induce stress concentration. This process is further supported by the electrochemical corrosion rates presented in Table 2.
Simultaneously, the substantial generation of H+ ions promotes the accelerated detachment and spallation of the surface oxides (Figure 15), resulting in a degradation of the specimen’s strength. As discussed in Section 3.2, NO3− and NO2− ions also play a significant role in the corrosion process, further aggravating intergranular corrosion and ultimately leading to localized brittle fracture of the specimen [29].
3.5. Stress Corrosion Rupture Mechanism
As shown in Figure 19, the general process of stress corrosion rupture is divided into three main stages: (i) the formation of a passive film on the metal surface; (ii) localized rupture of this film, leading to pitting and the initiation of microcracks; and (iii) propagation of these cracks into the metal substrate. In N2O4 environments, a protective oxide layer forms on the surface of the 2195-T8 Al-Li alloy, which effectively shields the substrate from corrosion. However, under tensile stress and in the presence of H+ in the corrosive medium, this oxide layer may undergo gradual fracture and spallation, resulting in localized exposure of the alloy matrix. Once the bare matrix is re-exposed to the corrosive environment, a microcell can form between the intact oxide regions and the newly uncovered alloy surface, accelerating localized corrosion. As the electronegativity of these oxides is higher than that of the alloy matrix, the matrix acts as a preferential anode and undergoes corrosion. The exposed alloy surface subsequently forms new oxides. When the rate of oxide fracture exceeds the rate of oxide reformation, stress corrosion cracks initiate and propagate. Similarly, once the alloy reaches its yield strength and plastic deformation occurs, slip steps generated by dislocation motion can also cause rupture of the oxide layer [30].
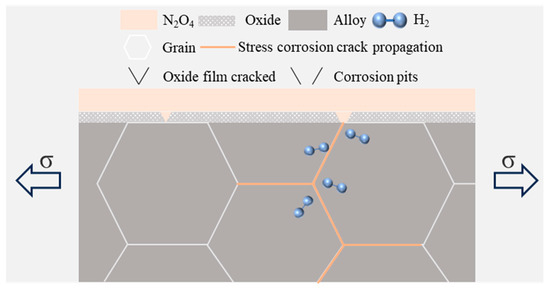
Figure 19.
Schematic diagram of stress corrosion rupture process.
Under the influence of stress, a localized “occlusion zone” forms at the crack tip or rupture site, where the dissolution of metal occurs and anions accumulate, leading to a decrease in local pH and accelerated corrosion. Concurrently, hydrogen generated by the cathodic reaction diffuses toward the crack tip, resulting in embrittlement. As shown in Figure 15, the intergranular fracture surface exhibits a “chicken claw” pattern, which is characteristic of hydrogen embrittlement.
4. Conclusions
- (1)
- The electrochemical corrosion rate of the 2195-T8Al-Li alloy in N2O4 increased with the water content ω(H2O) rising from 2% to 4%. Correspondingly, the corrosion morphology evolved from localized pitting and intergranular corrosion to widespread exfoliation corrosion over the surface.
- (2)
- The alloy exhibits significant SCC susceptibility in N2O4 medium at a tensile rate of ε ≥ 5 × 10⁻⁶ s−1. However, when the tensile rate is reduced to ε = 10−6 s−1, the susceptibility to ISCC decreases markedly. Under these conditions, extensive surface oxidation is observed, and the fracture morphology exhibits intergranular characteristics. These findings suggest that the SCC mechanism is primarily attributable to anodic dissolution.
- (3)
- When the strain rate is 10−6 s−1, the SCC susceptibility of the alloy in N2O4 media containing varying water concentrations (ω(H2O)) increases progressively with rising ω(H2O). This enhanced SCC susceptibility is attributed to the combined effects of anodic oxidation and hydrogen embrittlement. As the production of HNO3 and HNO2 increases, it accelerates anodic dissolution. Concurrently, hydrogen generated from the cathodic reaction diffuses to the crack tip, leading to embrittlement and further promoting SCC initiation and propagation.
- (4)
- To enhance the long-term storage safety and stability of liquid propellant tanks, ensure the operational performance of liquid-fueled missiles, and effectively prevent safety incidents such as propellant leakage caused by stress corrosion cracking in liquid propellant tanks, it is crucial during the long-term storage process to maintain the storage environment at room temperature and dry, preventing an increase in the water content of the propellant. Additionally, anti-corrosion treatment should be applied to the surface of aluminum–lithium alloys to effectively isolate them from corrosive medium.
Author Contributions
Y.Z. (Yilin Zhao): Investigation, Conceptualization, Formal analysis, Visualization, Writing—original draft, Writing—review and editing. G.T. and D.L.: Supervision, Project administration, Conceptualization, Formal analysis, Investigation, Visualization, Writing—original draft, Writing—review and editing, Funding acquisition. B.R.: Supervision, Conceptualization, Writing—review and editing, Formal analysis. Y.Z. (Yafeng Zhu) and W.Z.: Project administration, Visualization, Conceptualization, Formal analysis, Writing—review and editing. All authors have read and agreed to the published version of the manuscript.
Funding
This research was funded by [National Natural Science Foundation of China] grant number [52272446], [Projects for Key—Discipline Development in Guangdong Province] grant number [2024ZDJS096], [Natural Science Foundation of Shaanxi Province] grant number [2025JC-YBQN-654], [China Postdoctoral Science Foundation] grant number [2025M774471], [Fundamental Research Funds for the Universities] grant number [2025-QYCX-YB-07-039], [University Young Scholars Fund Project] grant number [2023QN-B036]. The APC was funded by [National Natural Science Foundation of China].
Data Availability Statement
The data that support the findings of this study are available from the corresponding author, upon reasonable request.
Conflicts of Interest
The authors declare that they have no known competing financial interests or personal relationships that could have appeared to influence the work reported in this paper.
References
- Dai, W.; Jiang, Y.; Yao, J.; Wang, Y.; Cao, F. Simultaneously improving the strength and ductility of an Ag-free 2195 Al-Li alloy by T8 treatment with cryogenic pre-rolling. J. Alloys Compd. 2024, 976, 173214. [Google Scholar] [CrossRef]
- Chen, Q.; Zhu, X.; Jiang, Y.; Yang, L.; Liu, H.H.; Song, Z. Development and characterization of MAO/PLA-nHA nanocomposite coatings on pure zinc for orthopedic applications. Surf. Coat. Technol. 2024, 478, 130452. [Google Scholar] [CrossRef]
- Dursun, T.; Soutis, C. Recent developments in advanced aircraft aluminum alloys. Mater. Des. 2014, 56, 862–871. [Google Scholar] [CrossRef]
- Guo, Y.; Chang, X.; Tian, G.; Liu, D.J.; Pang, C.; Wu, W. Pre-corrosion fatigue behavior of 2195-T8 Al-Li alloy in N2O4 under tension-tension loading. Rare Met. Mater. Eng. 2022, 51, 3459–3465. [Google Scholar]
- NASA. Spacecraft Polymers Atomic Oxygen Durability Handbook: NASA-HDBK-6024; NASA: Washington, DC, USA, 2022. [Google Scholar]
- European Space Agency. Material Compatibility Testing of AA2195 with N2O4 for Vega-E Upper Stage: ESA-TR-2022–007; ESA: Noordwijk, The Netherlands, 2022. [Google Scholar]
- Yao, X.Q.; Wen, L.; Yu, Z.G.; Guo, W.; Huang, F.; Qiang, Y.; Jin, Y. Study on corrosion behavior and mechanism of 5A06 aluminum alloy in N2O4 medium. J. Alloys Compd. 2023, 931, 167544. [Google Scholar] [CrossRef]
- Li, J.F.; Ning, H.; Liu, D.Y.; Zheng, Z.Q. Alloying and micro-alloying in Al-Cu-Li series alloys. Chin. J. Nonferrous Met. 2021, 31, 258–279. [Google Scholar]
- Ma, Y.L.; Li, J.F.; Zhang, R.Z.; Ning, H.; Liu, D.Y.; Xiong, B.Q. Correlation of mechanical properties and microstructure of 2195 Al-Li alloy with hot extrusion and cold rolling processes. Trans. Nonferrous Met. Soc. China 2020, 30, 835–849. [Google Scholar] [CrossRef]
- Zhang, X.; Gong, Z.; Huang, J.; Yu, B. Thermal shock resistance of tungsten with various deformation degrees under transient high heat flux. Mater. Res. Express 2020, 7, 066503. [Google Scholar] [CrossRef]
- Henthorne, M. The slow strain rate stress corrosion cracking test—A 50 year retrospective. Corrosion 2016, 72, 1488–1518. [Google Scholar] [CrossRef]
- Ghosh, R.; Venugopal, A.; Narayanan, P.R.; Sharma, S.C.; Venkitakrishnan, P.V. Environmentally assisted cracking resistance of Al-Cu-Li alloy AA2195 using slow strain rate test in 3.5% NaCl solution. Trans. Nonferrous Met. Soc. China 2017, 27, 241–249. [Google Scholar] [CrossRef]
- Hu, W.S.; Meletis, E.I. Corrosion and Environment-Assisted Cracking Behavior of Friction Stir Welded Al 2195 and Al 2219 Alloys. Mater. Sci. Forum 2000, 331−337, 1683–1688. [Google Scholar] [CrossRef]
- Goebel, J.; Ghidini, T.; Graham, A.J. Stress-Corrosion cracking characterization of the advanced aerospace Al-Li 2099-T86 alloy. Mater. Sci. Eng. A 2016, 673, 16–23. [Google Scholar] [CrossRef]
- Commission of Science, Technology and Industry for National Defense. Specification for Nitrogen Tetroxide; Commission of Science, Technology and Industry for National Defense: Beijing, China, 1994. [Google Scholar]
- Philips, N.R.; Carl, M.; Cunningham, N.J. New Opportunities in Refractory Alloys. Metall. Mater. Trans. A 2020, 51, 3299–3310. [Google Scholar] [CrossRef]
- Li, J.F.; Huang, J.L.; Liu, D.Y.; Ning, H.; Zhang, J.S.; Xiong, B.Q. Distribution and evolution of aging precipitates in Al-Cu-Li alloy with high Li concentration. Trans. Nonferrous Met. Soc. China 2019, 29, 15–24. [Google Scholar] [CrossRef]
- Araujo, J.V.d.S.; Milagre, M.X.; Ferreira, R.O.; Machado, C.A.S.C.; Bugarin, A.F.S.; Machado, I.F.; Costa, I. Exfoliation and intergranular corrosion resistance of the 2198 Al-Cu-Li alloy with different thermomechanical treatments. Mater. Corros. 2020, 71, 1957–1970. [Google Scholar] [CrossRef]
- Guo, Y.; Huang, Z.Y.; Tian, G.; Liu, D.J.; Jin, G.F.; Guo, X.W. Isomerization and reaction process of N2O4(H2O)n. RSC Adv. 2023, 13, 12469–12475. [Google Scholar] [CrossRef]
- Liu, D.J.; Tian, G.; Jin, G.F.; Guo, Y.; Guo, X.W.; Chang, X.T. Characterization of localized corrosion pathways in 2195-T8 Al-Li alloys exposed to acidic solution. Def. Technol. 2023, 25, 152–165. [Google Scholar] [CrossRef]
- Lin, Y.; Lu, C.; Wei, C.; Zhender, Z. Effect of aging treatment on microstructures, tensile properties and intergranular corrosion behavior of Al-Cu-Li alloy. Mater. Charact. 2018, 141, 163–168. [Google Scholar] [CrossRef]
- Wang, B.; Wang, Z.; Yuan, J.; Yin, Z. Effect of (Ti,W)C/TaC addition on the early oxidation behavior of surface layer of WC-Co cemented carbides. Corros. Sci. 2020, 176, 108857. [Google Scholar] [CrossRef]
- Zhang, A.A.; He, J.J.; Liu, T.J.; Zhang, W.F. Electrochemical features of corrosion of 5A06 Al-Mg alloy in seawater. Acta Aeronaut. Astronaut. Sin. 2015, 36, 3147–3154. [Google Scholar]
- Huang, X.M.; Zang, Y.; Guan, B. Research progress on hot forming of aeronautical Al-Li alloys. Rare Met. Mater. Eng. 2022, 51, 4745–4756. [Google Scholar]
- De, P.S.; Mishra, R.S.; Baumann, J.A. Characterization of high cycle fatigue behavior of a new generation aluminum lithium alloy. Acta Mater. 2011, 59, 5946–5960. [Google Scholar] [CrossRef]
- Li, H.R.; Zou, Z.T.; Li, J.F.; Ning, H.; Liu, D.Y.; Xiong, B.Q. Relationship between grain structure and tensile properties of Al-Li alloys. Trans. Nonferrous Met. Soc. China 2023, 33, 3597–3611. [Google Scholar] [CrossRef]
- Qin, M.; Su, H.; Wu, W.; Wu, J.; Liu, H.; Tan, Y.; Yan, M. Comparison of H2S high-temperature corrosion characteristics of three kinds of low-alloy and heat-resistant-steel tubes. Corros. Eng. Sci. Technol. 2021, 56, 289–298. [Google Scholar] [CrossRef]
- Brown, L.B.; Jones, R.E. Effect of low temperature, low water vapor pressure environments on the fatigue behavior of an Al-Li aerospace alloy. Int. J. Fatigue 2021, 148, 106215. [Google Scholar] [CrossRef]
- Li, W.; Xiang, L.; Wu, G.H.; Si, H.P.; Chen, J.; Jin, Y.; Su, Y.; Tao, J.; Huang, C. Predict the evolution of mechanical property of Al-Li alloys in a marine environment. Def. Technol. 2022, 31, 557–566. [Google Scholar] [CrossRef]
- Liu, Z.; Zhang, L.-M.; Liu, C.C.; Tan, K.D.; Ma, A.L.; Zheng, Y.G. Understanding of tribocorrosion and corrosion characteristics of 304L stainless steel in hot concentrated nitric acid solution. J. Central South Univ. 2024, 31, 3657–3673. [Google Scholar] [CrossRef]
Disclaimer/Publisher’s Note: The statements, opinions and data contained in all publications are solely those of the individual author(s) and contributor(s) and not of MDPI and/or the editor(s). MDPI and/or the editor(s) disclaim responsibility for any injury to people or property resulting from any ideas, methods, instructions or products referred to in the content. |
© 2025 by the authors. Licensee MDPI, Basel, Switzerland. This article is an open access article distributed under the terms and conditions of the Creative Commons Attribution (CC BY) license (https://creativecommons.org/licenses/by/4.0/).