Article

Research on the Influence of Cracked Control Surface on the Gust Response of High-Aspect-Ratio Flying Wing

1
School of Mechanics and Aerospace Engineering, Dalian University of Technology, Dalian 116023, China
2
State Key Laboratory of Structural Analysis, Optimization and CAE Software for Industrial Equipment, Dalian University of Technology, Dalian 116023, China
3
Advanced Technology for Aerospace Vehicles of Liaoning Province, Dalian University of Technology, Dalian 116023, China
4
Beijing Institute of Spacecraft System Engineering, Beijing 100094, China
*
Author to whom correspondence should be addressed.
Aerospace 2025, 12(9), 807; https://doi.org/10.3390/aerospace12090807 (registering DOI)
Submission received: 31 May 2025 / Revised: 29 August 2025 / Accepted: 30 August 2025 / Published: 8 September 2025
(This article belongs to the Special Issue Advances in Thermal Fluid, Dynamics and Control)

Abstract

Flying-wing aircraft based on high-aspect-ratio wings are a popular configuration for many aerospace engineering applications. Cracked (or cross) control surface structures can adjust the aerodynamic characteristics of flying-wing aircraft. Deep investigations into the effects of such a control surface can provide a helpful design foundation. This paper investigates the mass distribution influences of cracked control surfaces on gust responses of high-aspect-ratio flying wings. Validated finite element modelling, revised by detailed ground vibration test (GVT) with a frequency error of less than 10%, reveals that root boundary conditions significantly affect the natural modes and frequencies of present wings with cracked control surfaces. Changes in control surface (CS) mass have a critical impact on gust response: a 150 g increase in CS mass results in a 15–22% increase in peak response acceleration and a 25–30% increase in response duration, while redistributing mass to the outboard CS reduces the peak response by 18–26% while keeping the total mass consistent. The results can provide an effective suppression strategy for the gust responses of flying-wing configurations without redesigning the main structure.

1. Introduction

Gusts, defined as abrupt variations in wind speed perpendicular to an aircraft’s flight trajectory, are categorized into vertical gusts (acting within the vertical plane) and lateral gusts (acting within the horizontal plane). Under the influence of gust, an aircraft’s angle of attack and altitude can change abruptly, generating transient aerodynamic forces that induce structural vibration. These unpredictable aerodynamic disturbances induce substantial unsteady loads on airframes. The primary hazards stem from their potential to cause structural fatigue damage over repeated encounters, significantly impacting the operational lifespan of components like wings and empennages [1]. Vertical and lateral gusts induce uncomfortable aircraft motions, leading to motion sickness, reduced perceived safety, and so on.
Experimental methodologies provide essential validation for gusts. Yu et al. [2] developed a high-capability gust generator and modelled the support device. Taking a full-scale model of an elastic civil aircraft as the research object, a control strategy using wingtip load feedback to drive the deflection of the auxiliary wing to slow down the load and vibration of the model was adopted, followed by a wind tunnel test of gust load alleviation. Nguyen et al. [3] studied a gust field generated by a gust generator in a low-speed wind tunnel. Zhao et al. [4] developed a set of large-scale GLA test systems in a low-speed wind tunnel that included a gust generator, a five-degree-of-freedom suspension system, a full elastic aircraft model with a control system, and gust load measuring devices. Some researchers designed a gust alleviation system based on PID control principles and superimposed it onto the original aircraft’s stabilization system for flight tests; it achieved a reduction in acceleration [5]. Shu et al. [6] introduced a gust load alleviation technique utilizing passive ventilation through porous surfaces, achieving measurable reductions in aerodynamic loads.
Two critical gust response assessments are required in aircraft design: acceleration response analysis to evaluate the vibration environment of airframe components, and structural load analysis involving bending moments, shear forces, and torsion to assess the strength of the structure. Therefore, accurate determination of the dynamic response of gusts is an important basis for structural design. Some studies have evaluated the effects of gusts on aircraft dynamics, including aerodynamic interactions and structural vibration response suppression strategies. Sasidharan et al. [7] proposed realizable k-epsilon CFD modelling to study the effect of wind gusts on the aerodynamic characteristics of an aerostat. Masrour et al. [8] proposed that the dynamic response of a system to different discrete gust excitations could be obtained by using numerical simulations, in which the wing is considered flexible, and other parts are considered rigid. Yang et al. [9] presented a time-domain calculation method for gust aerodynamics in flight simulation; it only required current and previous gust information to calculate the aerodynamic force and was suitable for different configurations of aircraft and different kinds of gusts. Wu and Hölling [10] pointed out that wind gusts are a common atmospheric turbulence in nature; however, they have very complex physical characteristics, including scale, velocity profile, and power spectral density. Some related gust influences have also been investigated, e.g., the flow characteristics of a tiltrotor aircraft engine inlet in a gust environment [11]. Numerical simulation methods have been developed, such as high-fidelity CFD using field velocity methods or mesh deformation techniques, to compute complex gust-induced vortices and unsteady pressure distribution problems [12]. Although this method is highly developed, the computational cost is relatively high, whereas reduced-order methods (ROM) using linear potential flow theory or machine learning based on a large number of datasets have relatively short computational time, which can make up for the above shortcomings [13]. Li et al. [14] validated the efficacy of Circulation Control in gust load alleviation for three-dimensional wings through coupled aerodynamic-structural simulations. Zhang et al. [15] proposed a multi-input multi-output adaptive feedforward control scheme for gust load reduction in semi-span flying-wing configurations. Gust load alleviation has received much attention in experimental and numerical studies [16,17,18,19,20,21,22,23]. Yang et al. [24] pioneered hybrid methods for analyzing the dynamic responses of flexible aircraft under two-dimensional gust excitation, subsequently designing an active control system for bending load mitigation. The analytical results indicated that the development of gust load alleviation schemes should be based on effective vibration mode analysis and gust excitation modeling [25].
For high-aspect-ratio flying-wing configuration vehicles, the vibration of a vehicle under gust loading can adversely affect the strength and durability of the structure. Based on the principle of structural elasticity–aerodynamics–control force coupling, modification of the CS configuration can change the aerodynamic aero-servo elasticity of the structure, which is critical for gust alleviation. These changes may induce elastic vibrations, thereby ensuring structural integrity and improving dynamic performance. Junaid et al. [26] developed a predictive method for optimizing trailing-edge and leading-edge flap deflections, demonstrating the effective mitigation of gust-induced wing bending and torsional moments, respectively. Gao et al. [27] established a model predictive control framework tailored to flexible flying wings. Zhou et al. [28] established a simplified calculation method for obtaining gust information when an aircraft is flying with an arbitrary attitude and achieved a reduction in wing root bending moment and wingtip acceleration. Cheung et al. [29] conducted an experimental study on the implementation of folded wingtips for highly elastic, high-aspect-ratio airfoils; the results showed that the gust loads could be significantly reduced, which fully demonstrated the necessity of the design.
Novel flying-wing aircraft have seen significant applications in recent years [30,31]. Different structural characteristics can lead to different aeroelastic responses, which are significant for flying-wing aircraft, e.g., gust response. A cracked CS is a possible configuration designed for next-generation flying-wing aircraft, in which a long control surface is divided into two or more short control surface parts. Such cracked control surfaces can make one surface rotate in a different direction from the other (e.g., CS1 and CS2 are a group of cracked control surfaces, but they are independent). But the gust response of a main wing with cracked CS has scarcely been studied. A high-aspect-ratio flying-wing model with cracked CS is designed in this paper. This paper mainly focuses on different mass distributions of the present CS configuration with different structural dynamic characteristics, including natural frequencies and modes. Detailed GVT experiments were proposed to analyze the structural dynamic characteristics of the wing with different cracked CS cases. The mass distribution of the cracked CS is mainly investigated, and the dynamic characteristics of the wing model are evaluated and discussed.

2. Model Design

2.1. Design Formulation

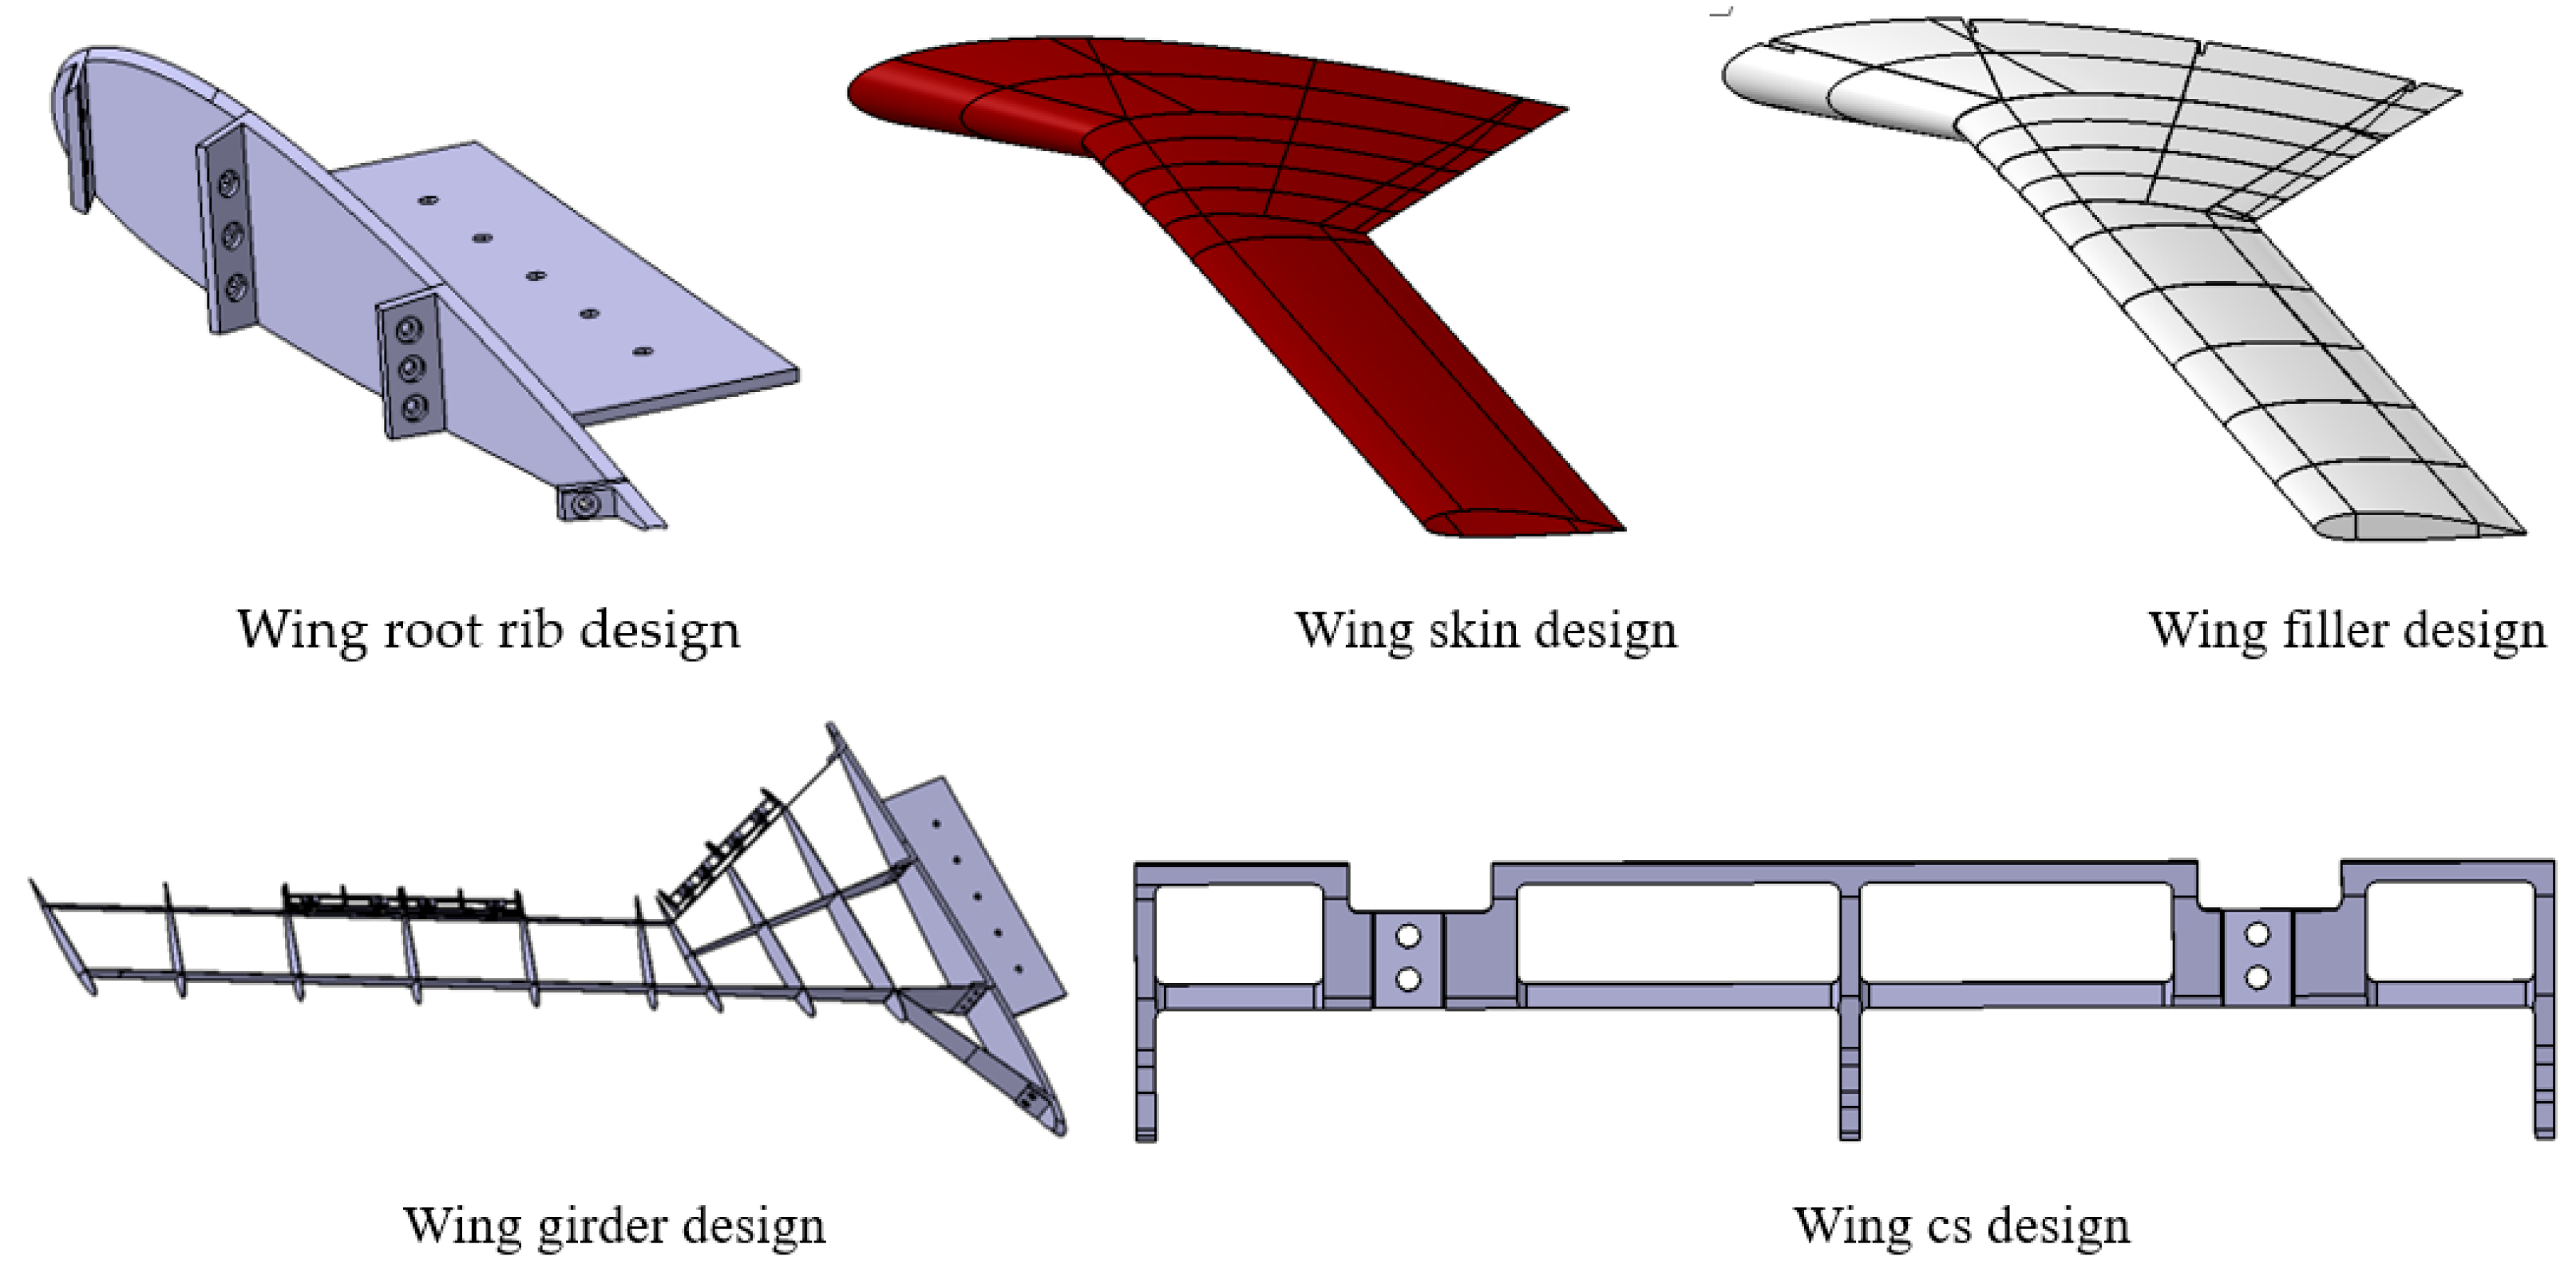
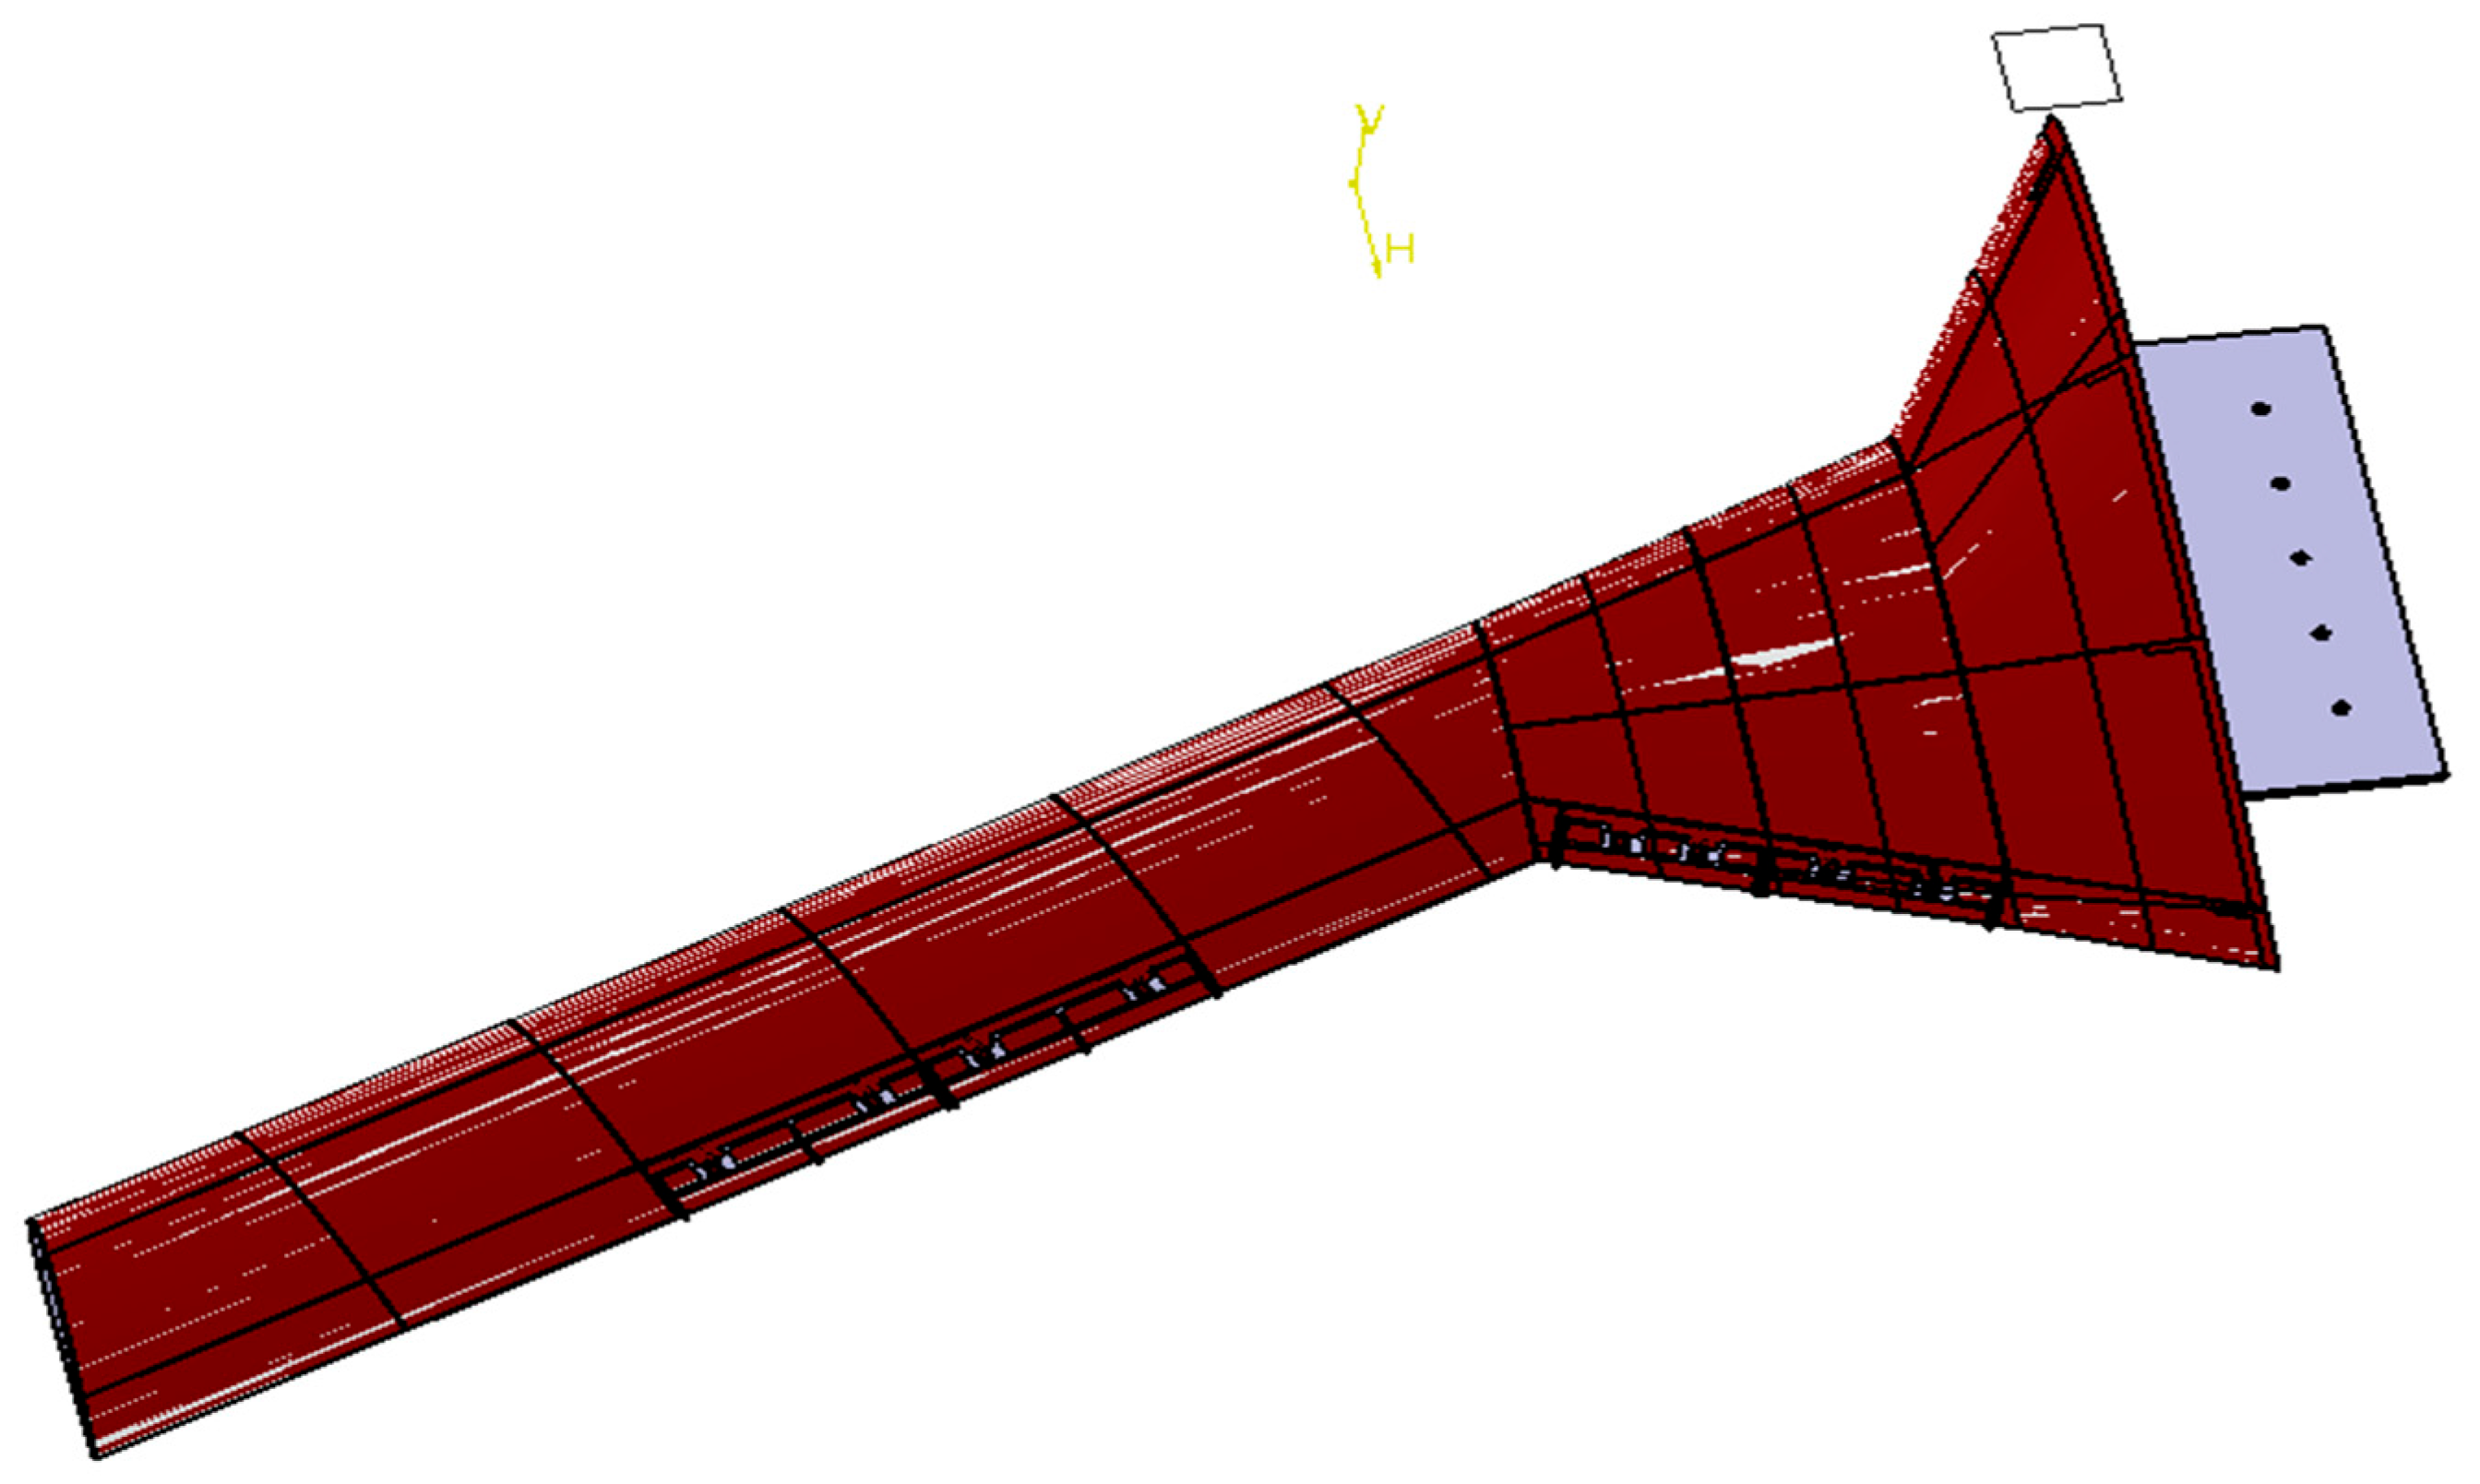
A high-aspect-ratio flying-wing model was designed with five main structural components: root rib, CS, girder, skin, and filler, as shown in Figure 1. The critical design parameters, including mass distribution and material specifications of the finalized configuration (see Figure 2), are shown in Table 1.

2.2. Model Manufacture

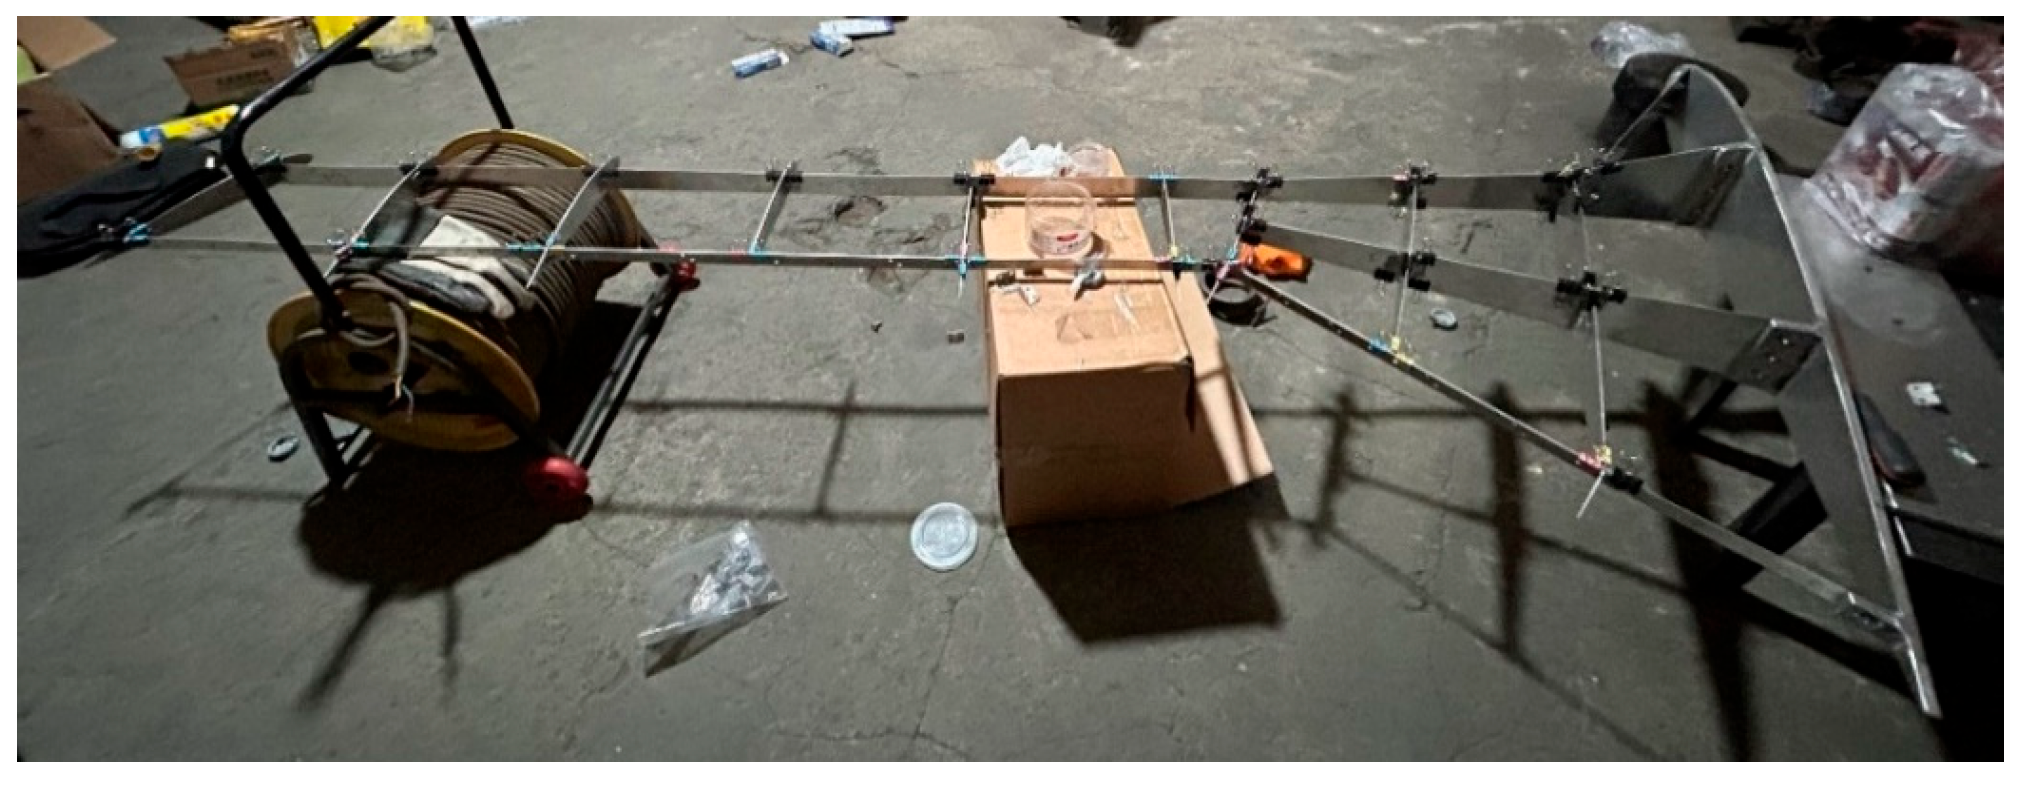
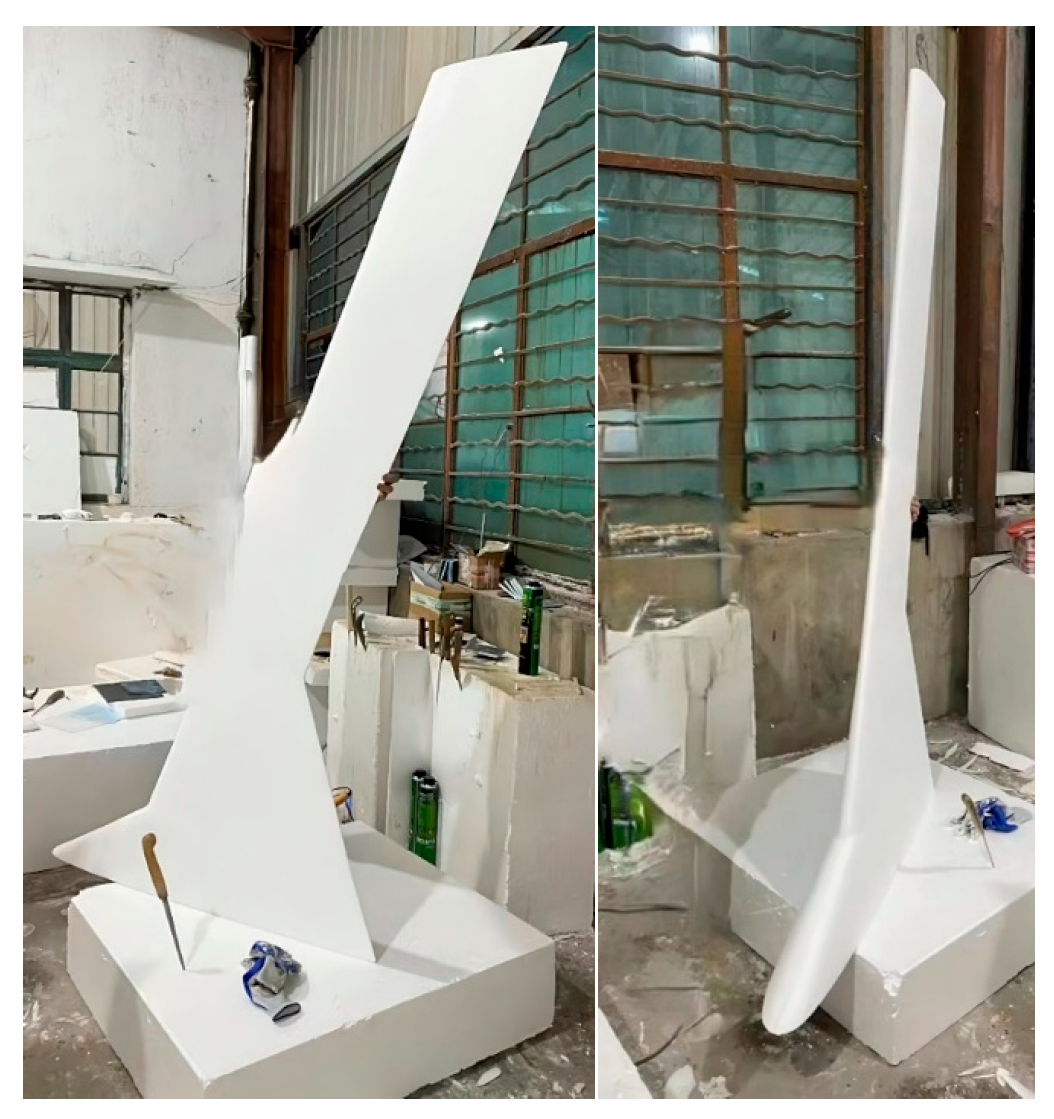
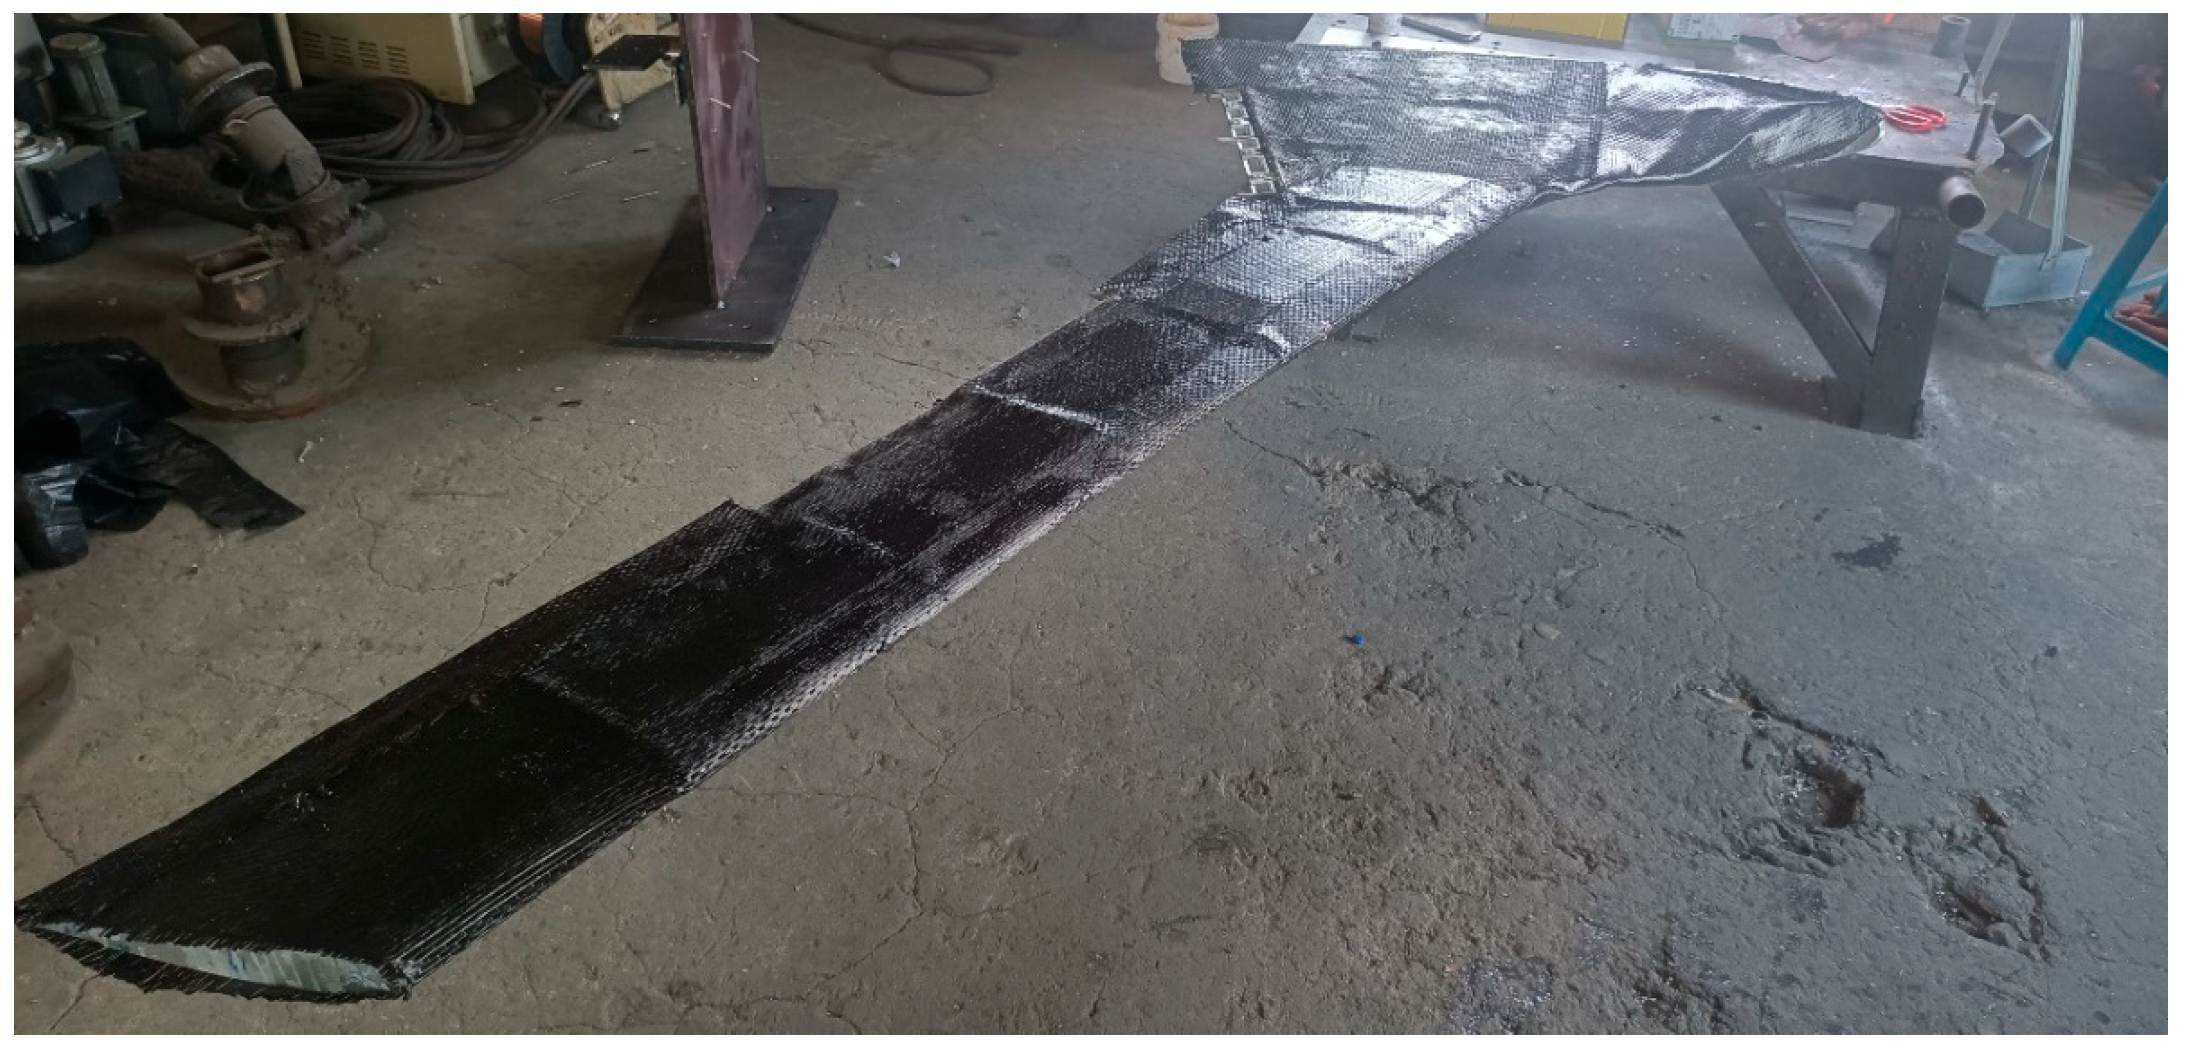
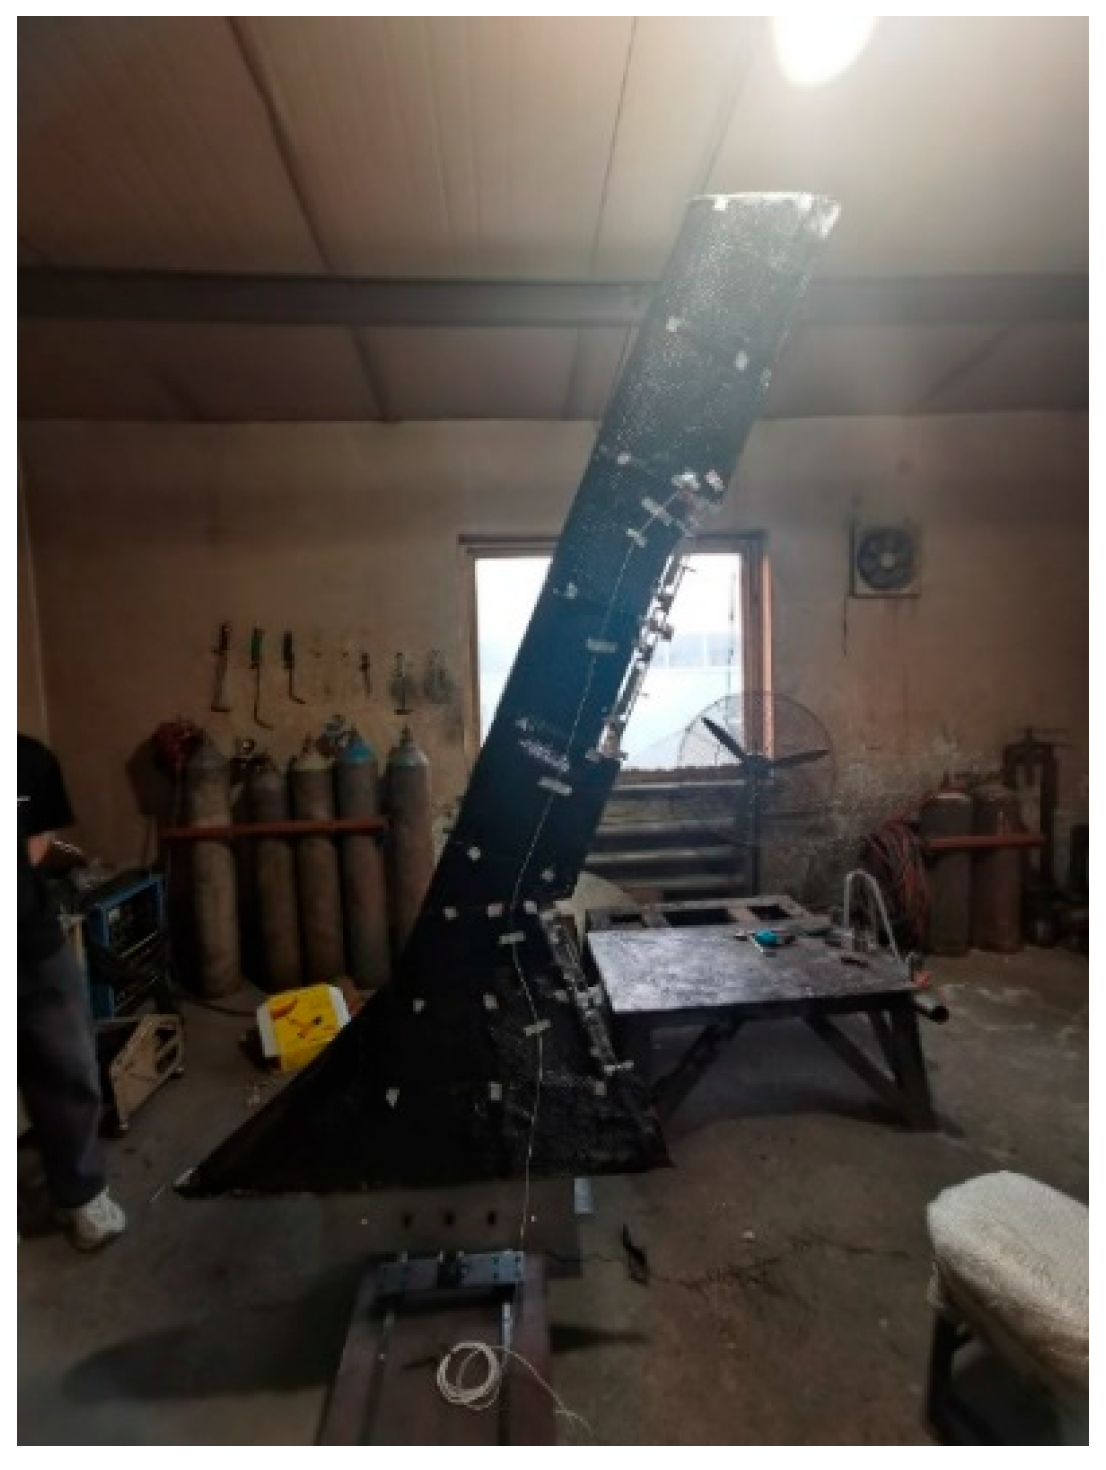
To validate the structural finite element model, a high-aspect-ratio wing experimental model was manufactured. The main load-bearing framework, which is detailed in Figure 3, consists of CNC-machined aluminum alloy girders and ribs. High-density EPS foam molded by CNC 3D molding (see Figure 4) was filled between the girder–rib structure to ensure the stability of the structure and the smoothness of the surface. The aerodynamic surfaces consist of epoxy-bonded carbon-fiber-reinforced polymer (CFRP) skins, which form a composite structure with an internal structure, enhancing structural rigidity. The full structural assembly is presented in Figure 5.

3. Finite Element Modeling and GVT Experiment Validation

3.1. Finite Element Modelling

The dynamic finite element modelling was categorized by structural components: skin, girder and rib, filler, and CS. Shell elements were employed for discretizing the skin, girder, rib, and CS, while solid elements were employed for discretizing the filler. The corresponding element types, mesh number, and assembled finite element model configuration are shown in Table 2 and Figure 6, respectively.
The dynamic governing equation for the high-aspect-ratio flying wing is expressed as:
M x ¨ + C x ˙ + K x = f
where M , C , and K represent the mass, damping, and stiffness matrices, respectively; x denotes the nodal displacement vector; and f corresponds to the external load vector. A fully fixed boundary condition was applied at the root of the model. By solving the generalized eigenvalue problem formulated in Equation (2), natural frequencies and modes of the high-aspect-ratio configuration were derived.
K Φ = M Φ Λ Λ = λ 1 0 0 λ N Φ = φ 1 φ N
Here, Φ represents the eigenvector matrix, Λ represents the eigenvalue matrix, λ j and φ j are the jth-order eigenvalues and eigenvectors, and N is the number of degrees of freedom of the structure.

3.2. GVT Experiments

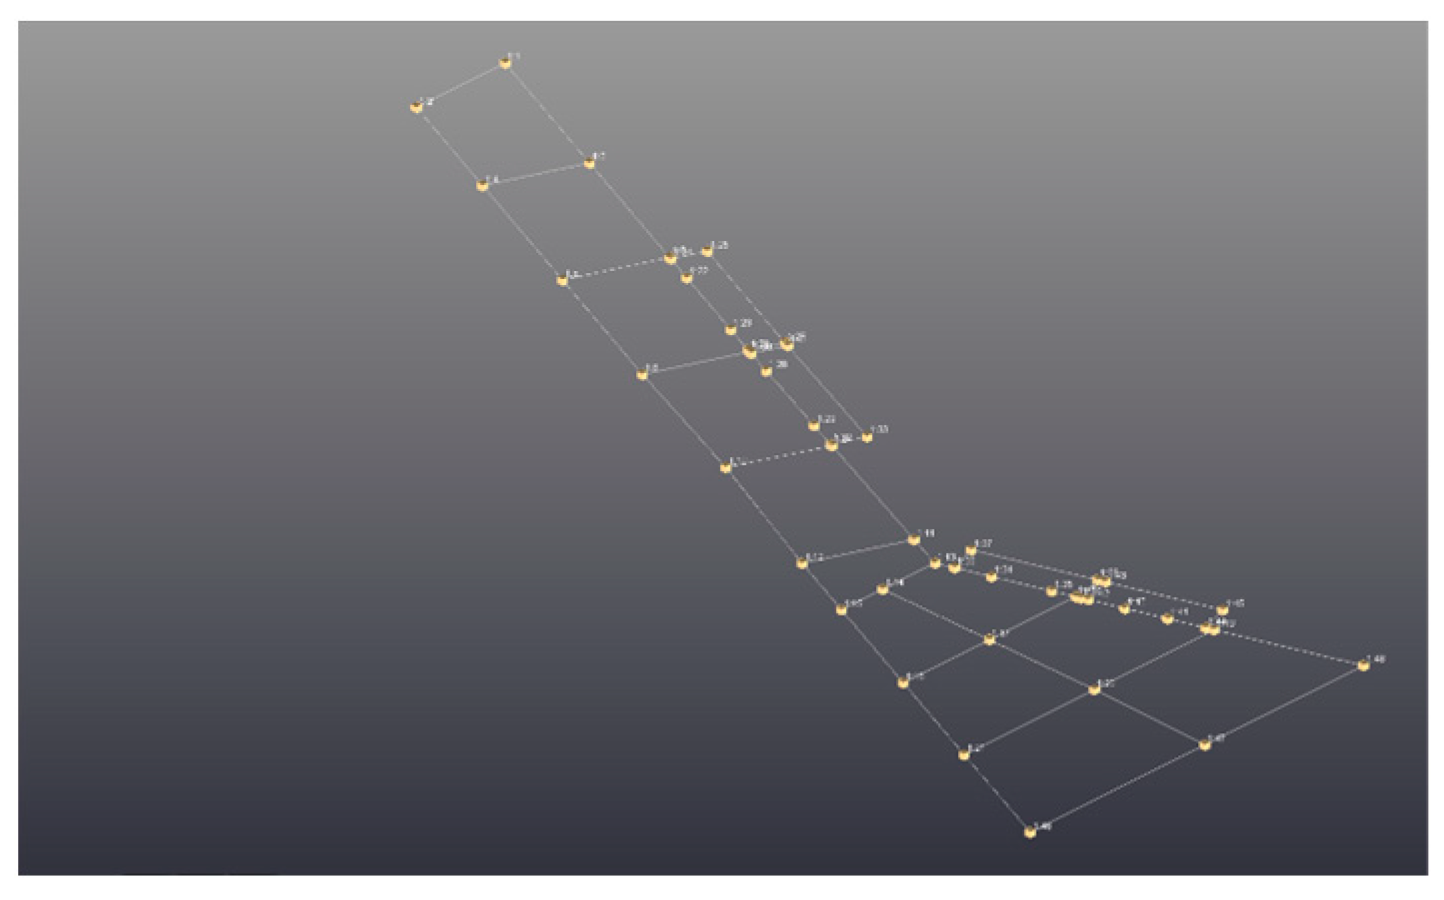
GVT is an essential experimental methodology in structural dynamics research. To validate the finite element numerical simulation model, this study conducted GVT utilizing SIEMENS LMS ground-based testing equipment, a widely recognized industrial-standard system. Due to the small mass of the experimental model, the hammering method with a fixed accelerometer was used to measure the natural frequencies and modes. As shown in Figure 7, the principle of the modal test is that a hammer is used to excite the structure with an impact at an appropriate location, and a fixed accelerometer collects the structural response and transmits it to a digital data collection system. Subsequent computational analysis extracts parameters such as frequency spectra and modes from the acquired vibration data.
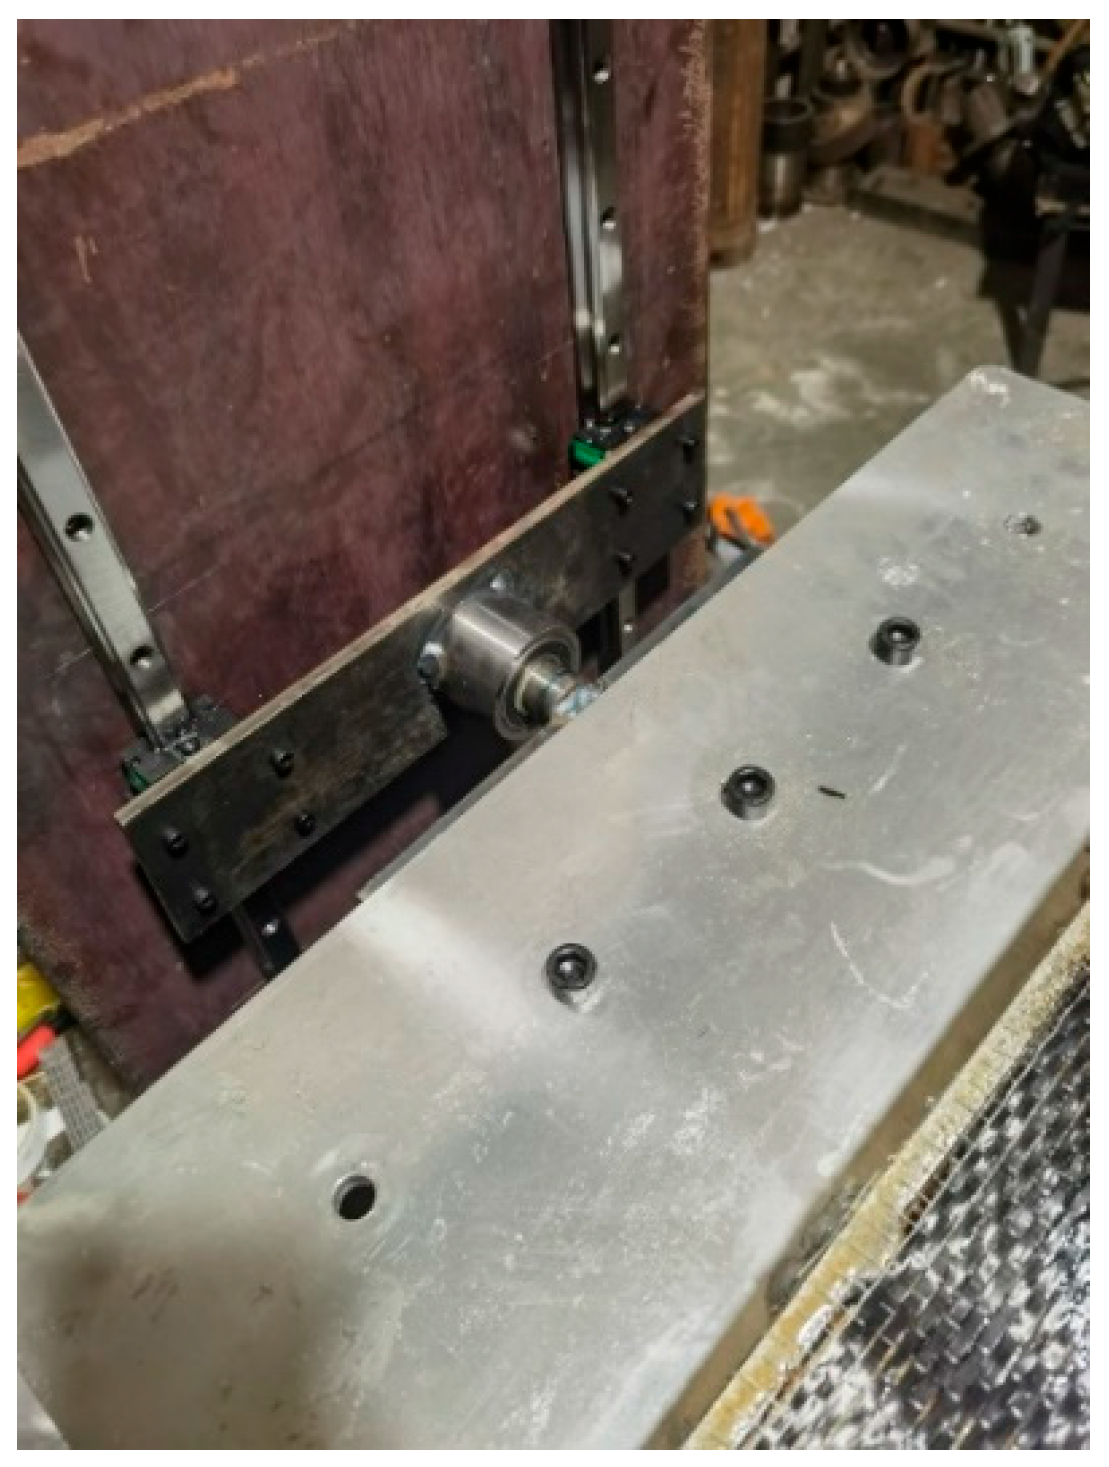
During the experiments, the wing model was mounted on a test platform with two different boundary conditions: a fixed boundary condition achieved by bolting to the ground test platform, and a two-degree-of-freedom released boundary condition using a specialized ground-mounted mechanism to achieve independent pitch and roll motions.
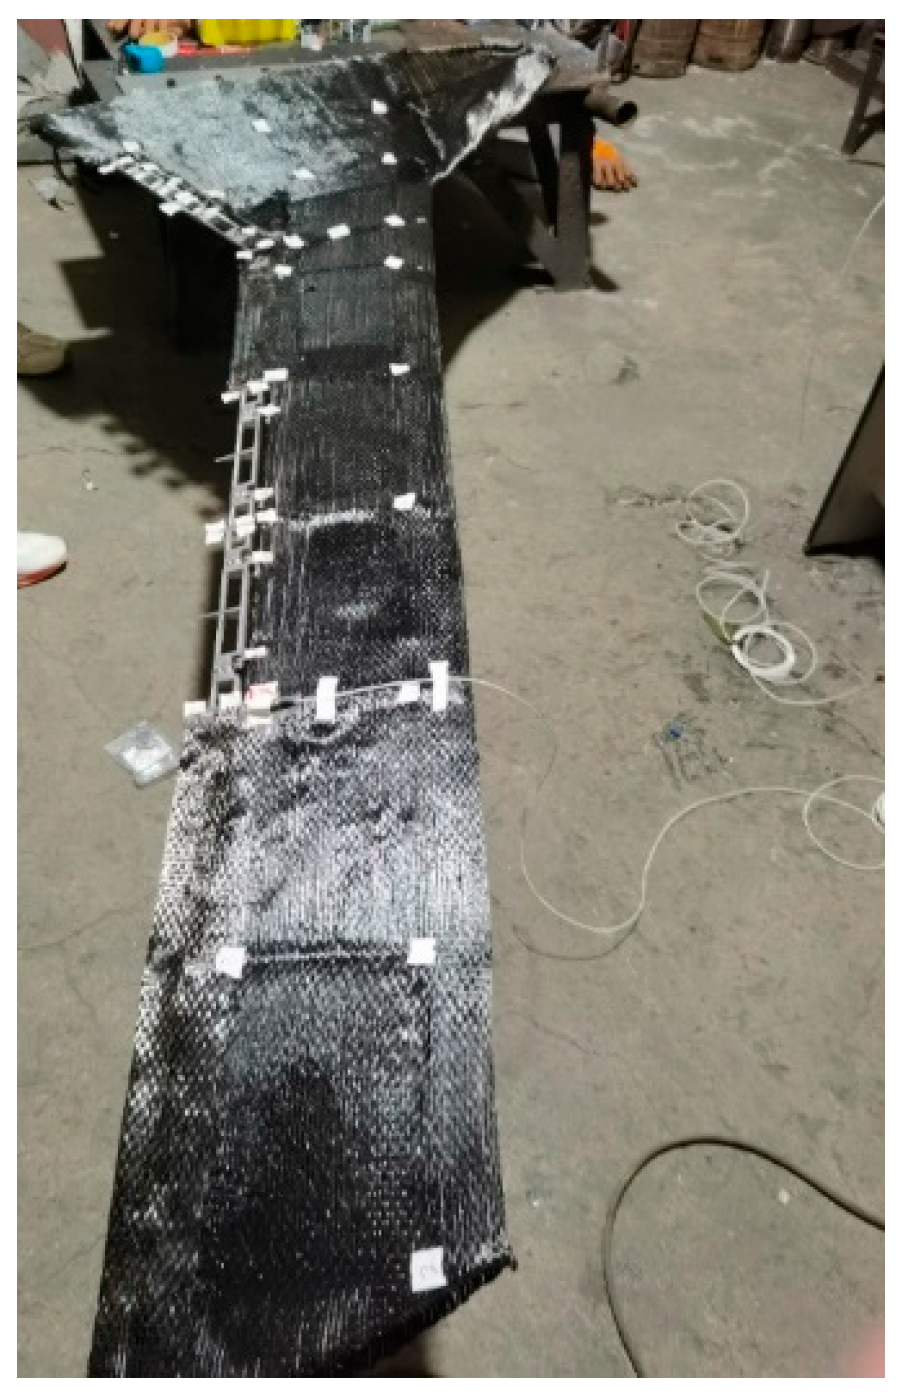
The experimental procedure includes the following steps: (1) Install the high-aspect-ratio aircraft experimental model in the predefined test platform. (2) Mount the accelerometer at structural girder–rib intersections and avoid arranging at points where the modal displacement is 0. (3) Connect the accelerometers and impact hammer to dedicated channels on the data collector. (4) Confirm the operating parameters of the data collection software. (5) Control impact excitation at specified measurement points and monitor vibration curves to assess the validity of the data. As shown in Figure 8 and Figure 9, forty-eight measurement points under the first boundary condition were arranged in this experiment, with duplicate impact excitation applied at each point to exclude other influences.
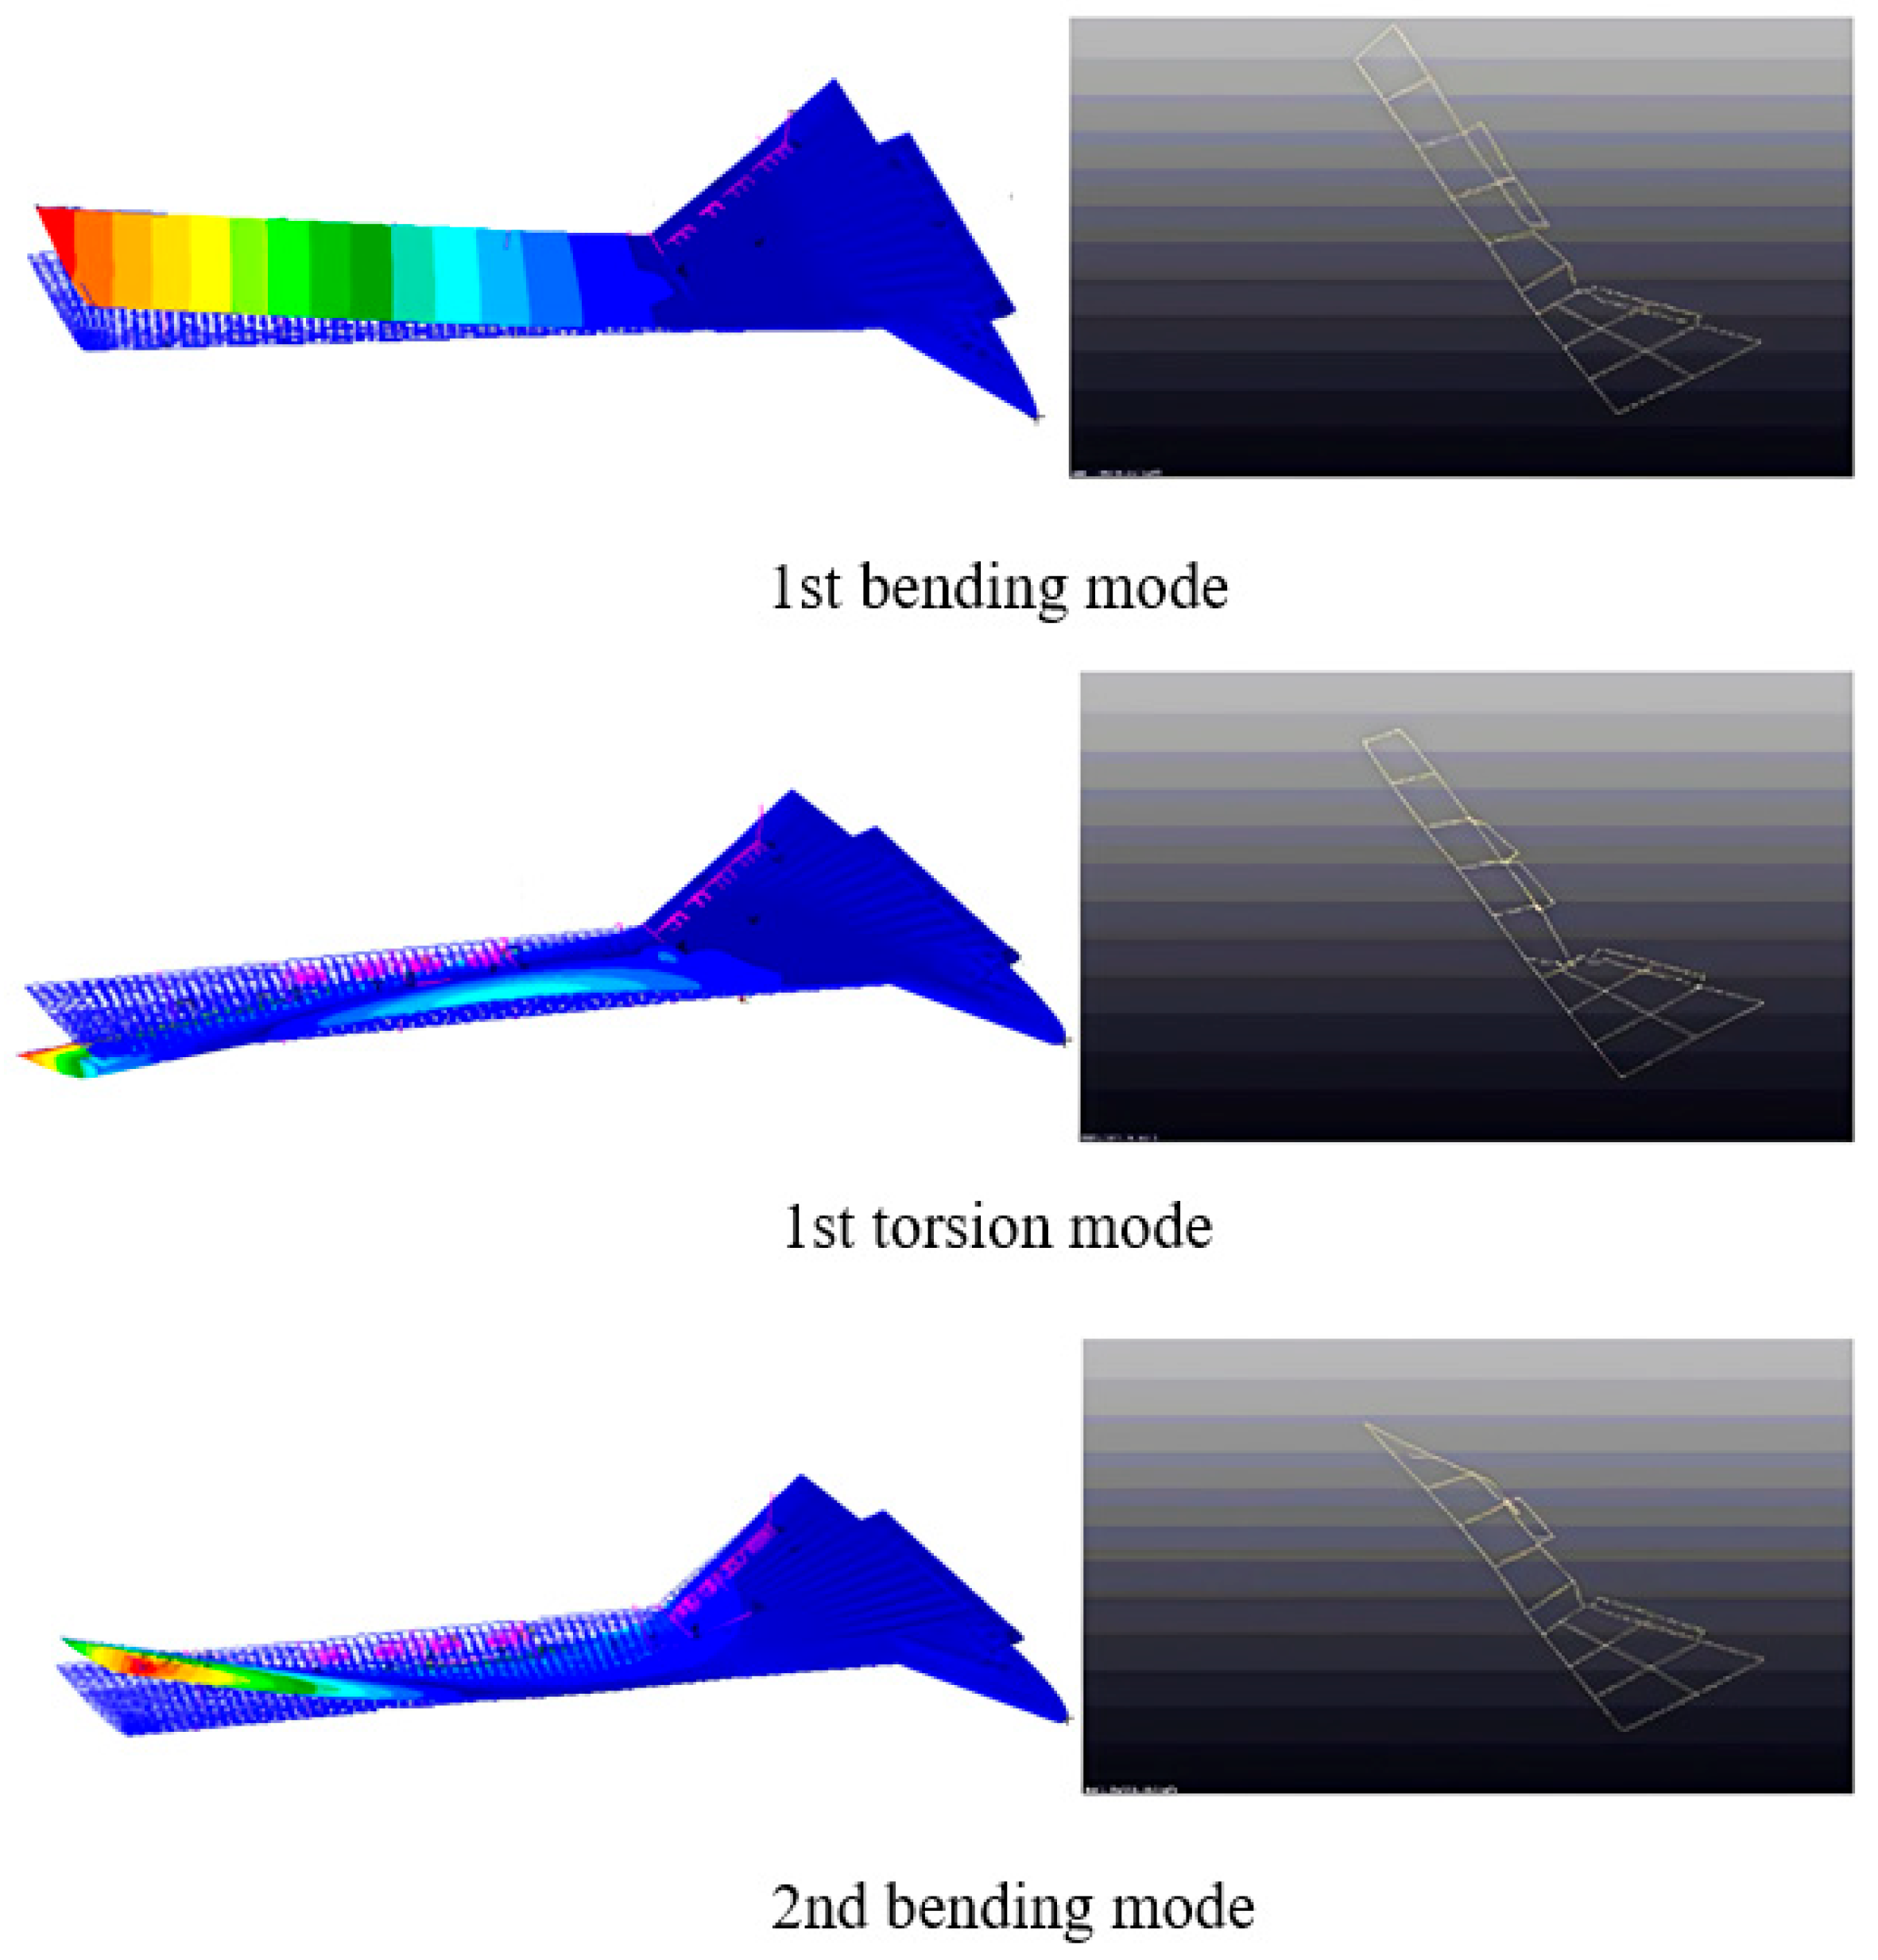
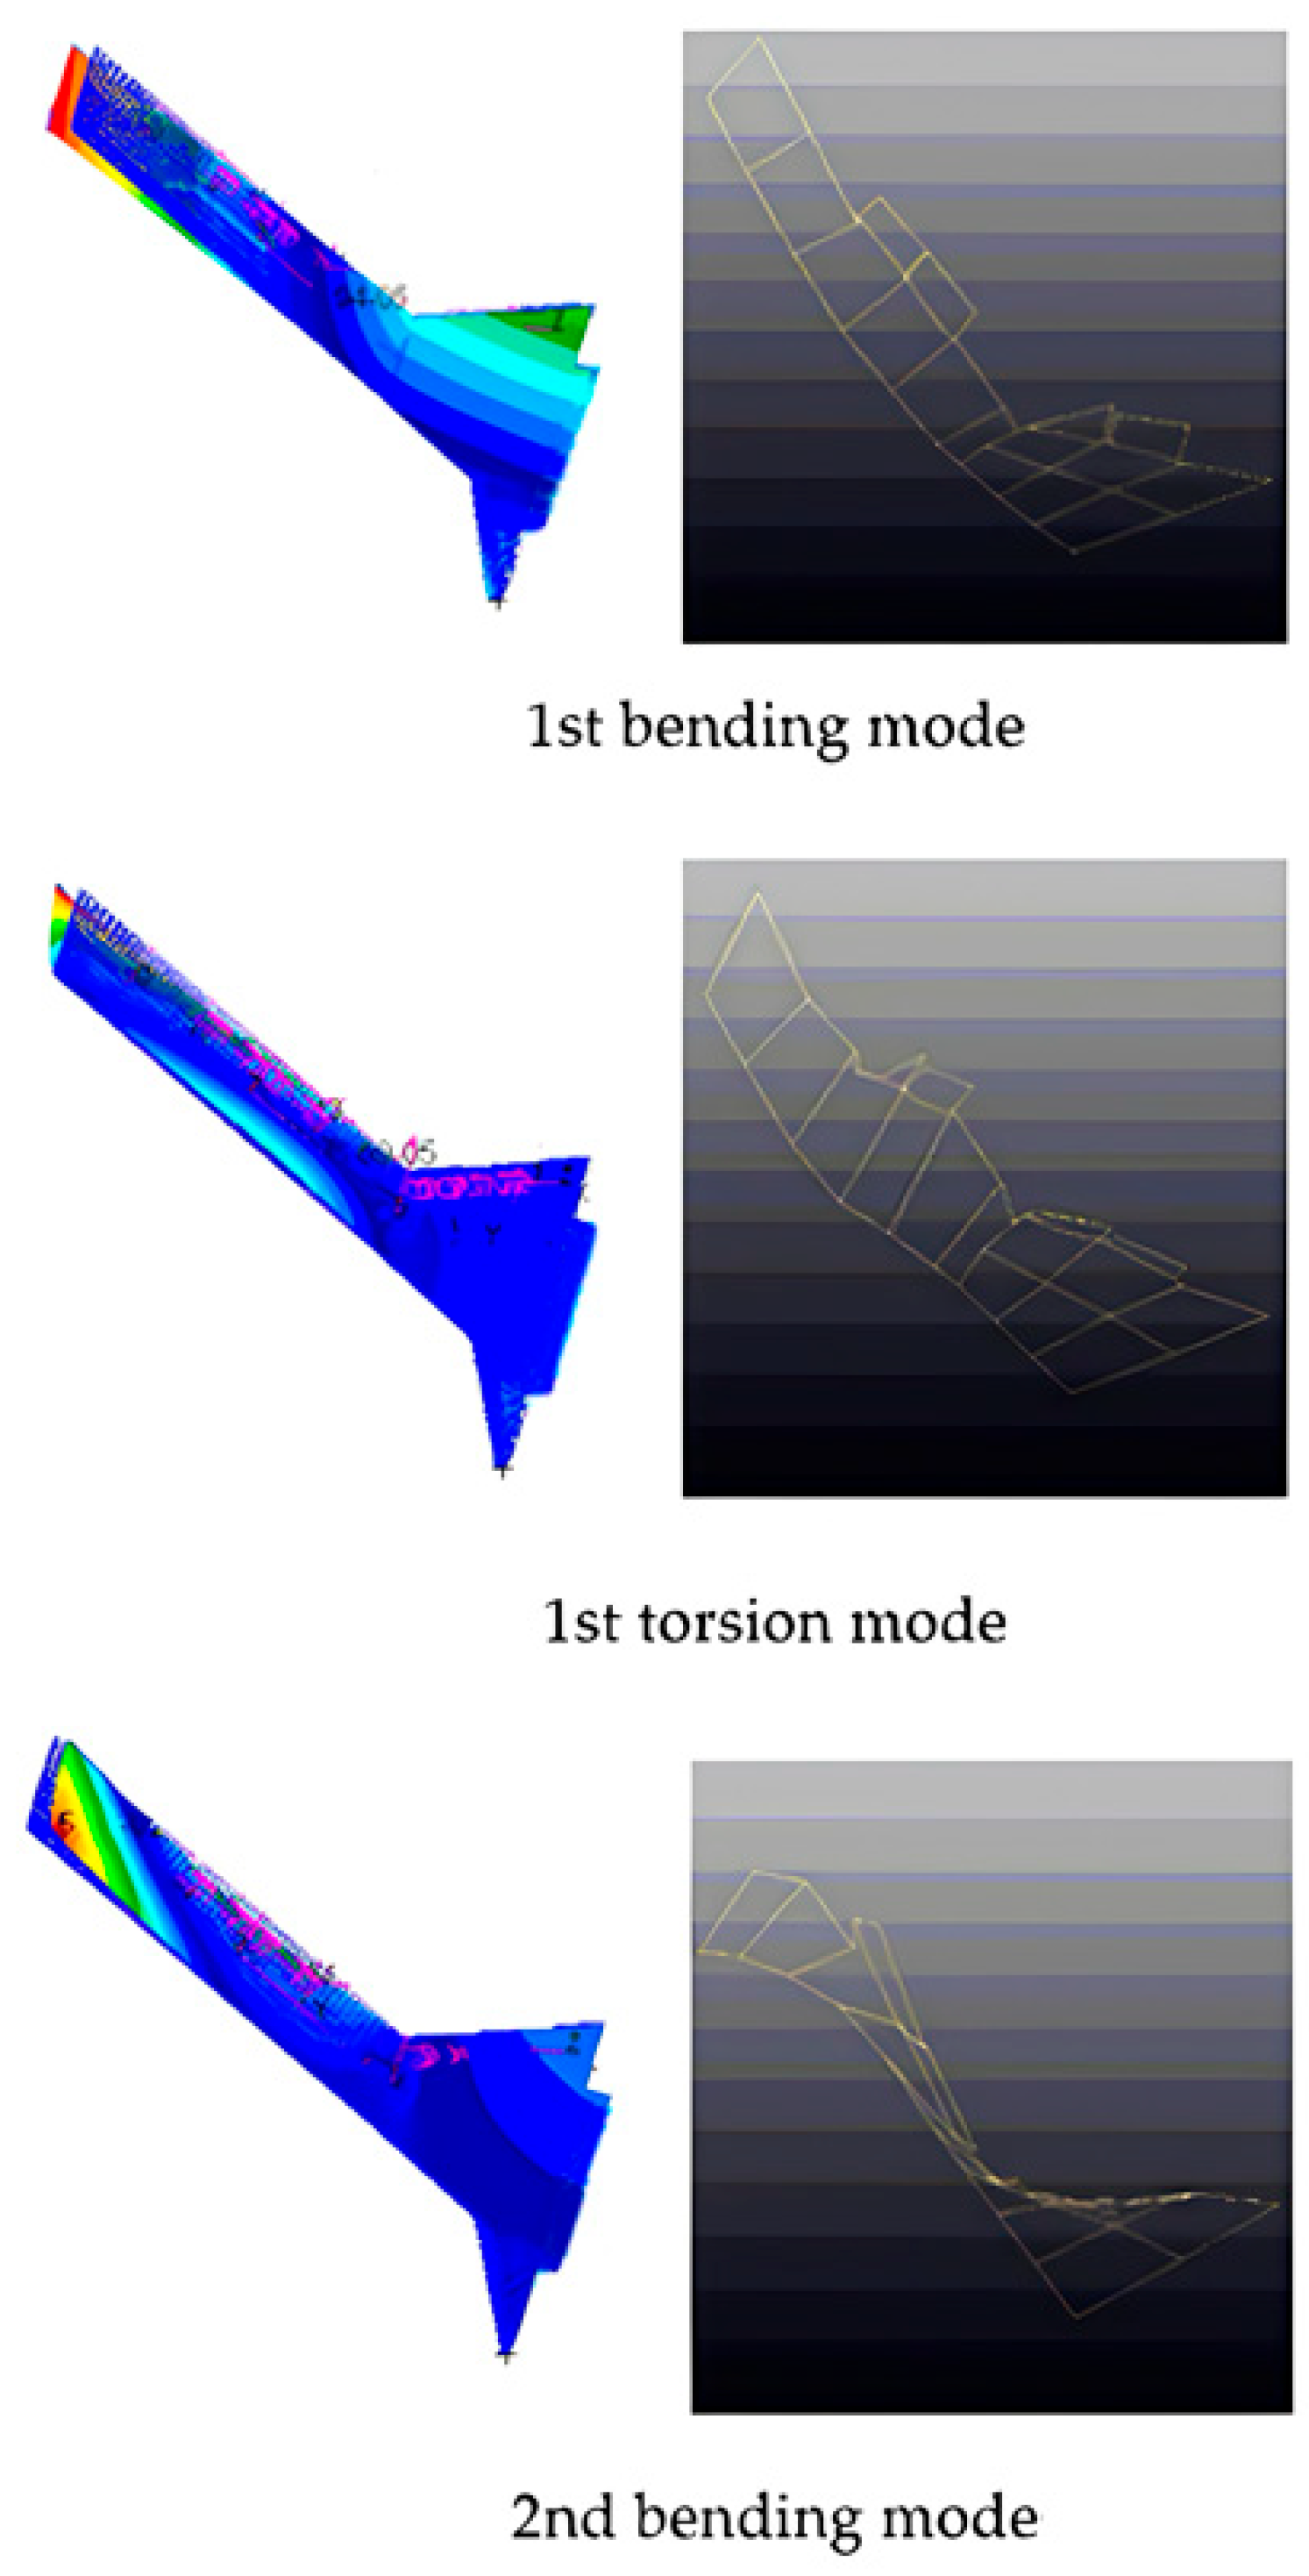
A comparison of the first three orders of natural frequencies and modes obtained by numerical calculation with those obtained by ground vibration test (GVT) is shown in Table 3 and Figure 10, respectively. The GVT results show good agreement with the finite element simulations, with relative errors in the first three natural frequencies all remaining within 7%, as shown in Figure 10 and Table 3.
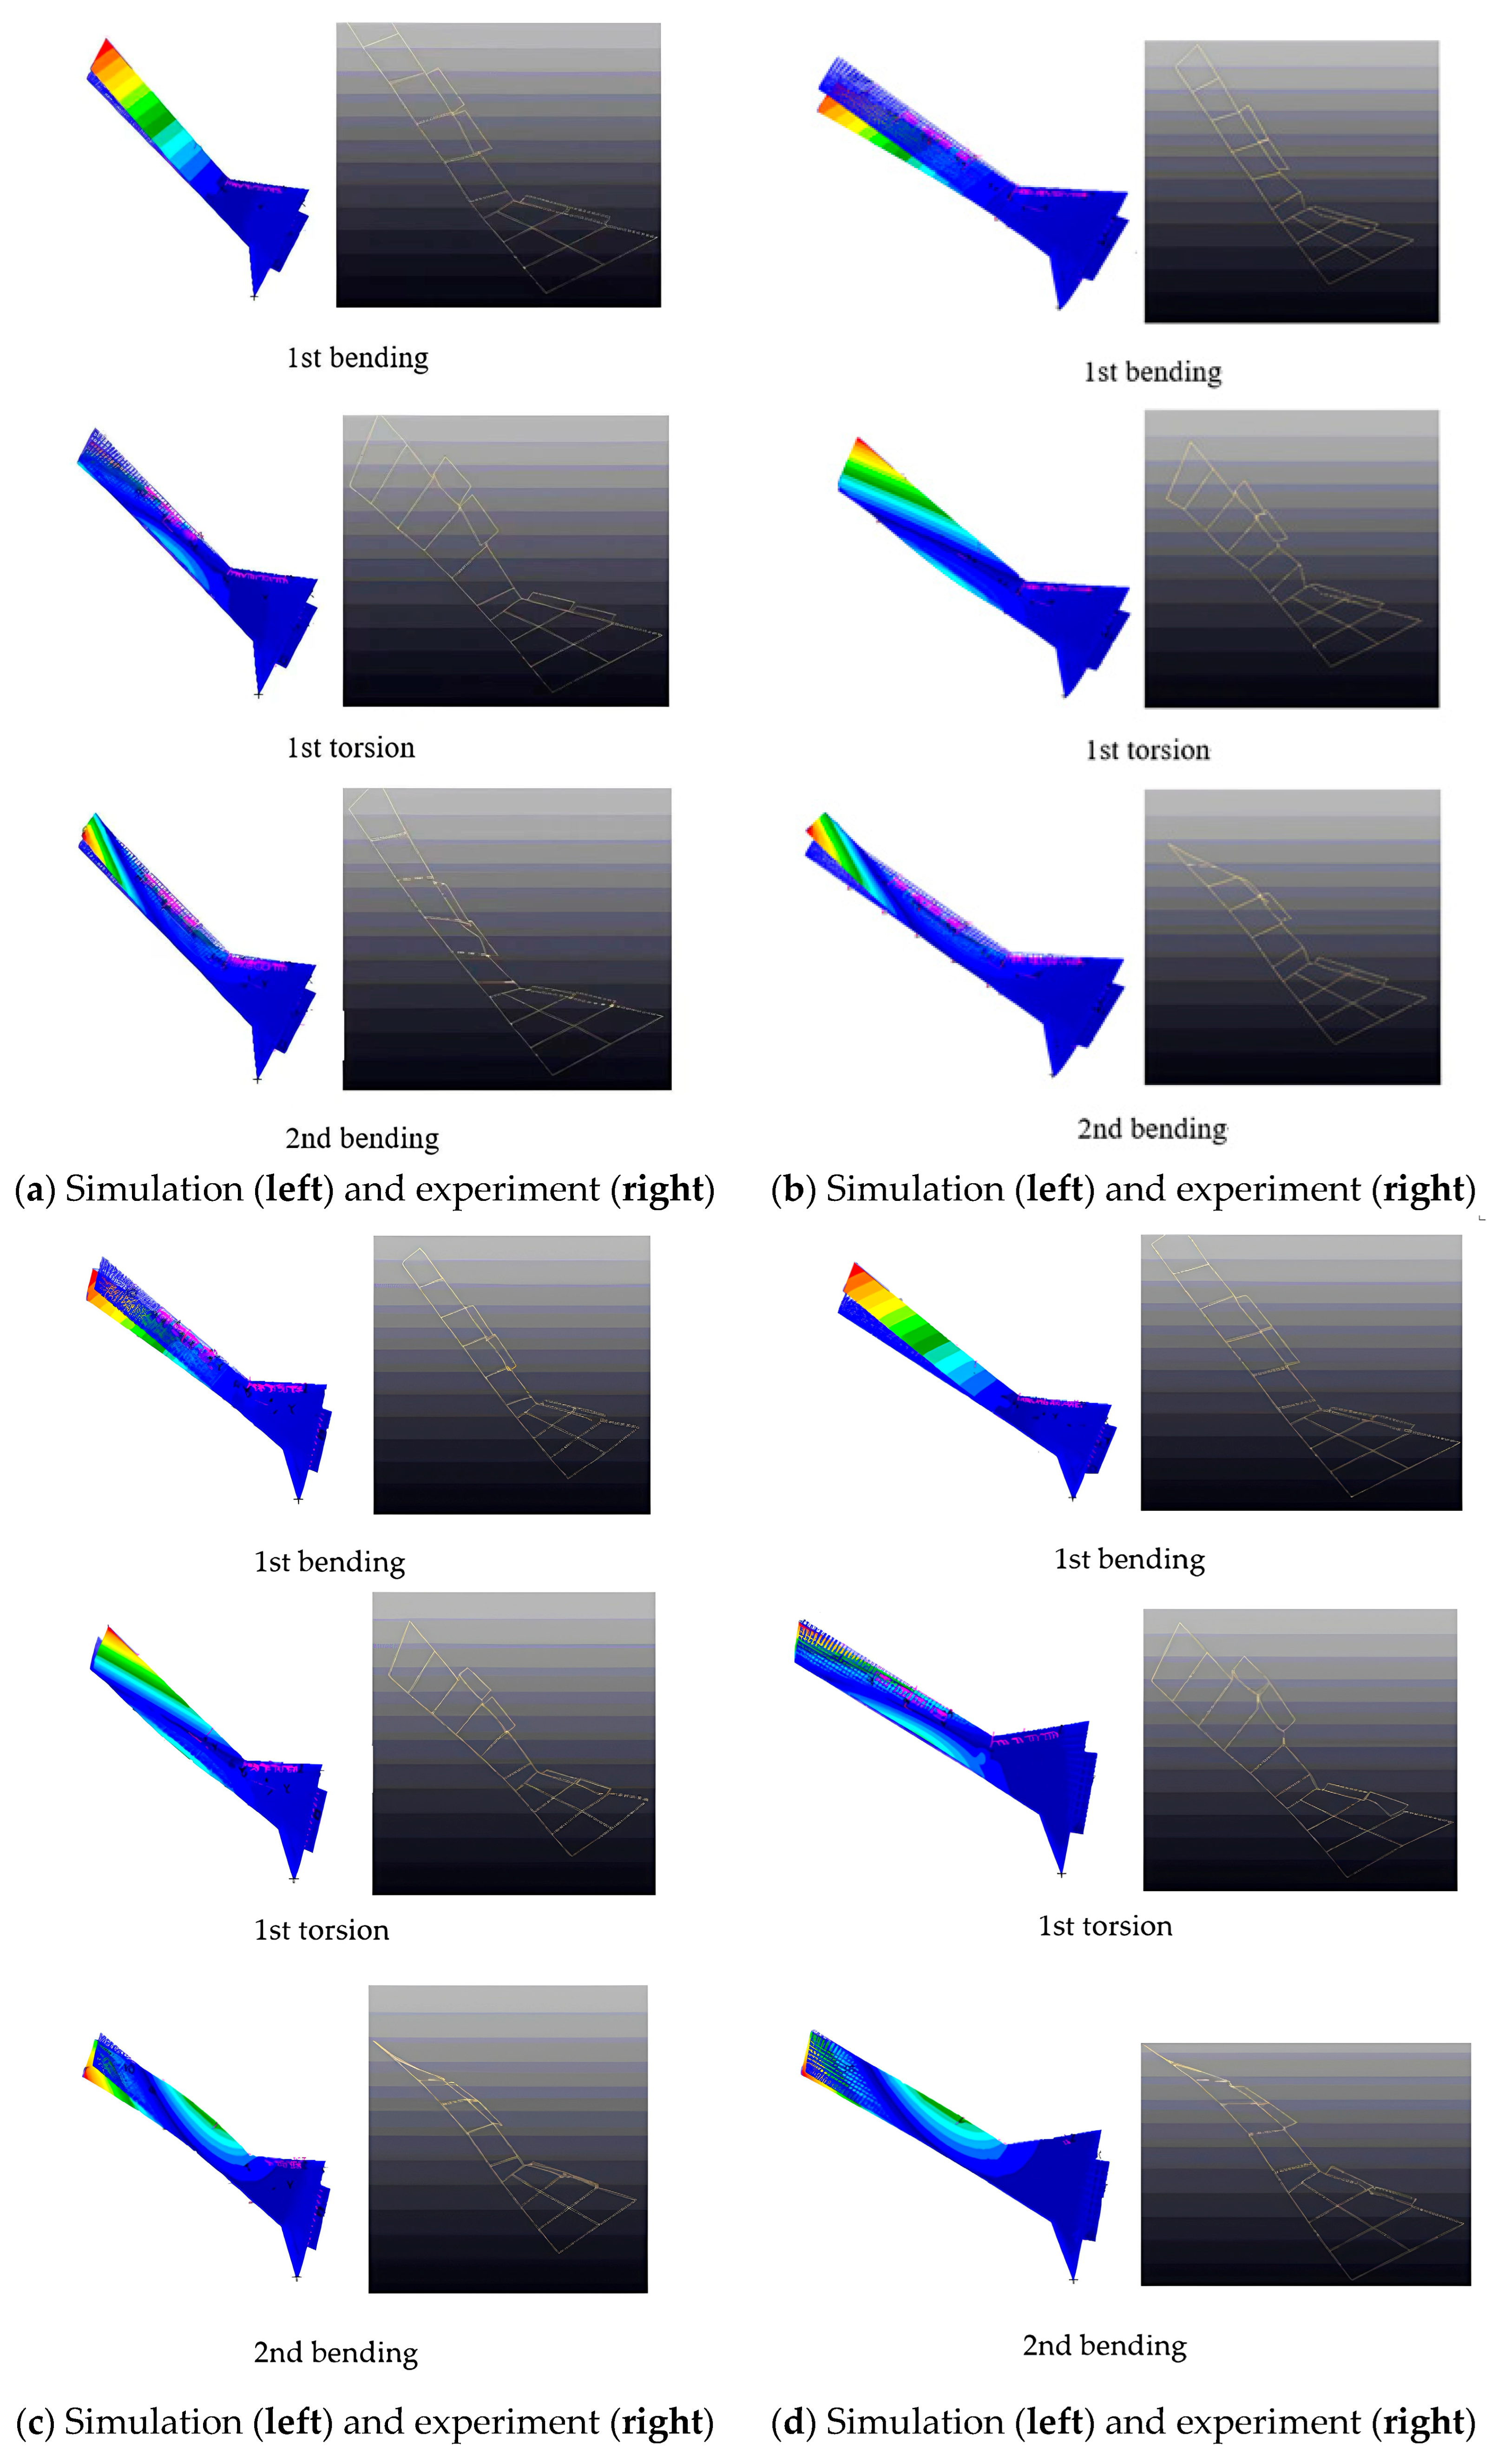
According to the flight condition, the root mounting mechanism was designed to release the pitch and yaw degrees of freedom (see Figure 11). Accelerometer placement and measurement point layout are shown in Figure 12. The first three natural frequencies and corresponding modes were simulated for the wing under the boundary with released degrees of freedom and then compared with GVT-measured dynamic characteristics, as presented in Figure 13 and Table 4.
It can be seen that numerical modelling of structural dynamics achieves consistent results with those of experiments under different boundary conditions.

4. Results on Different CS Mass Distributions

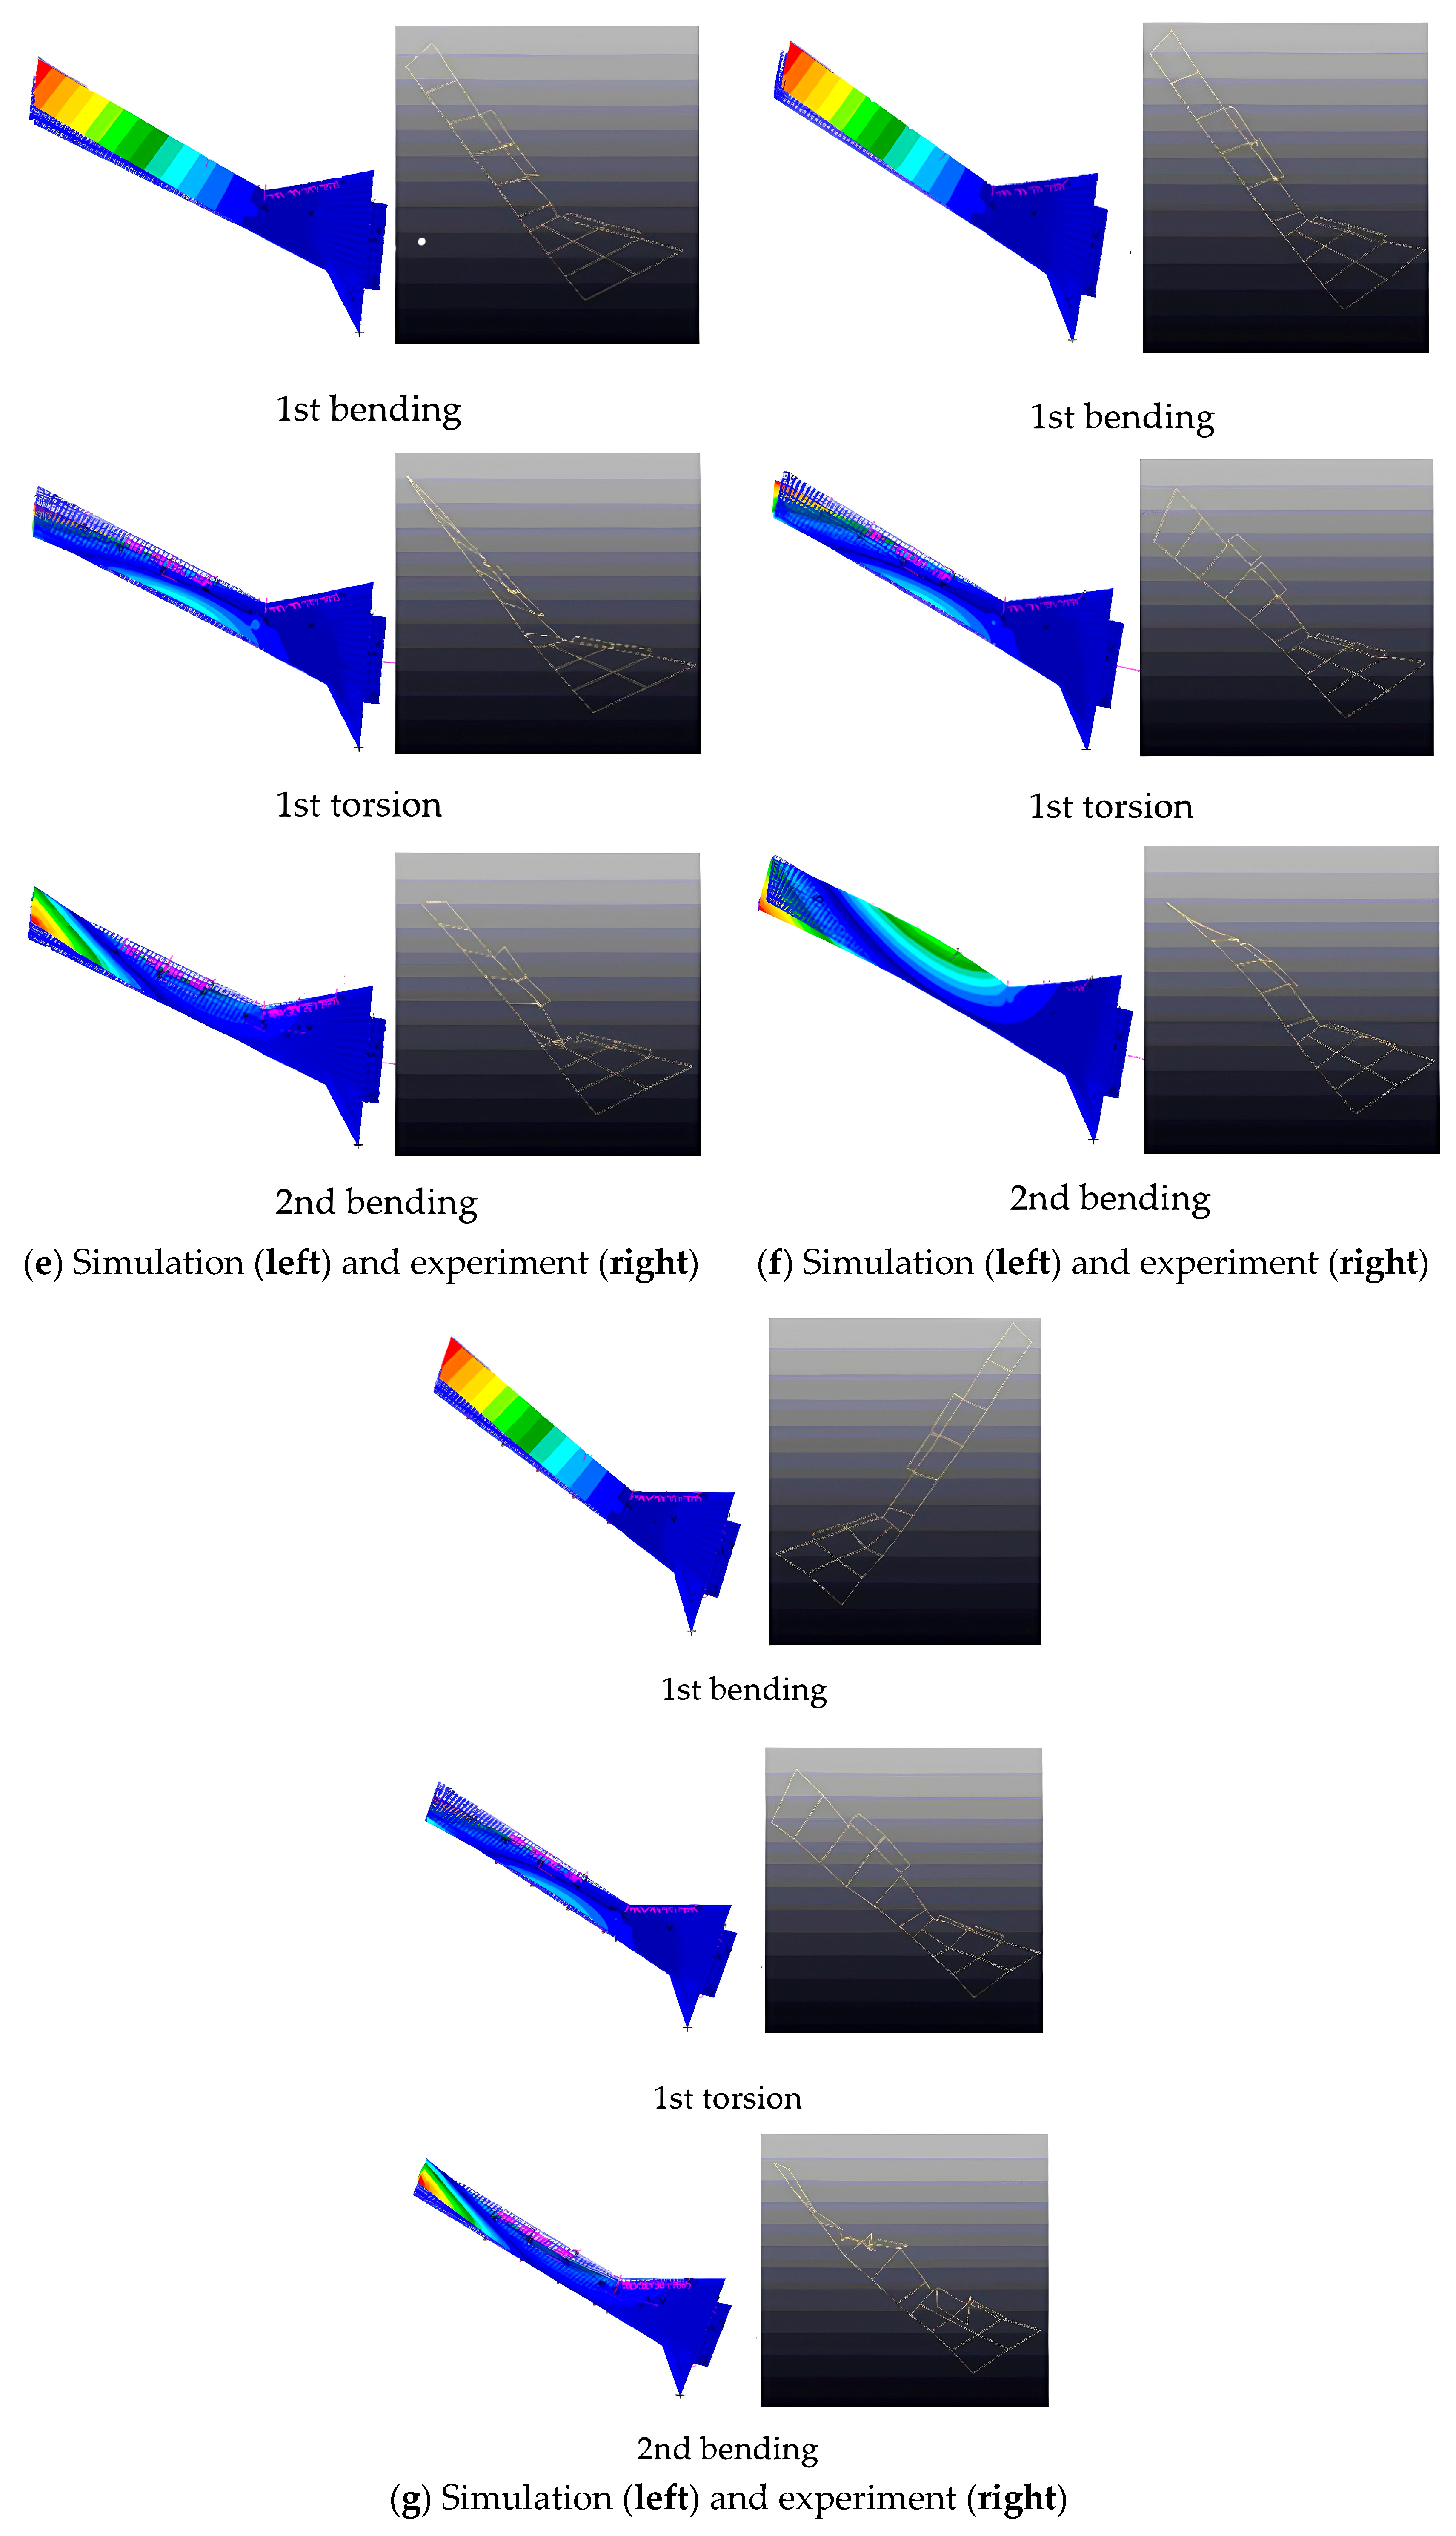
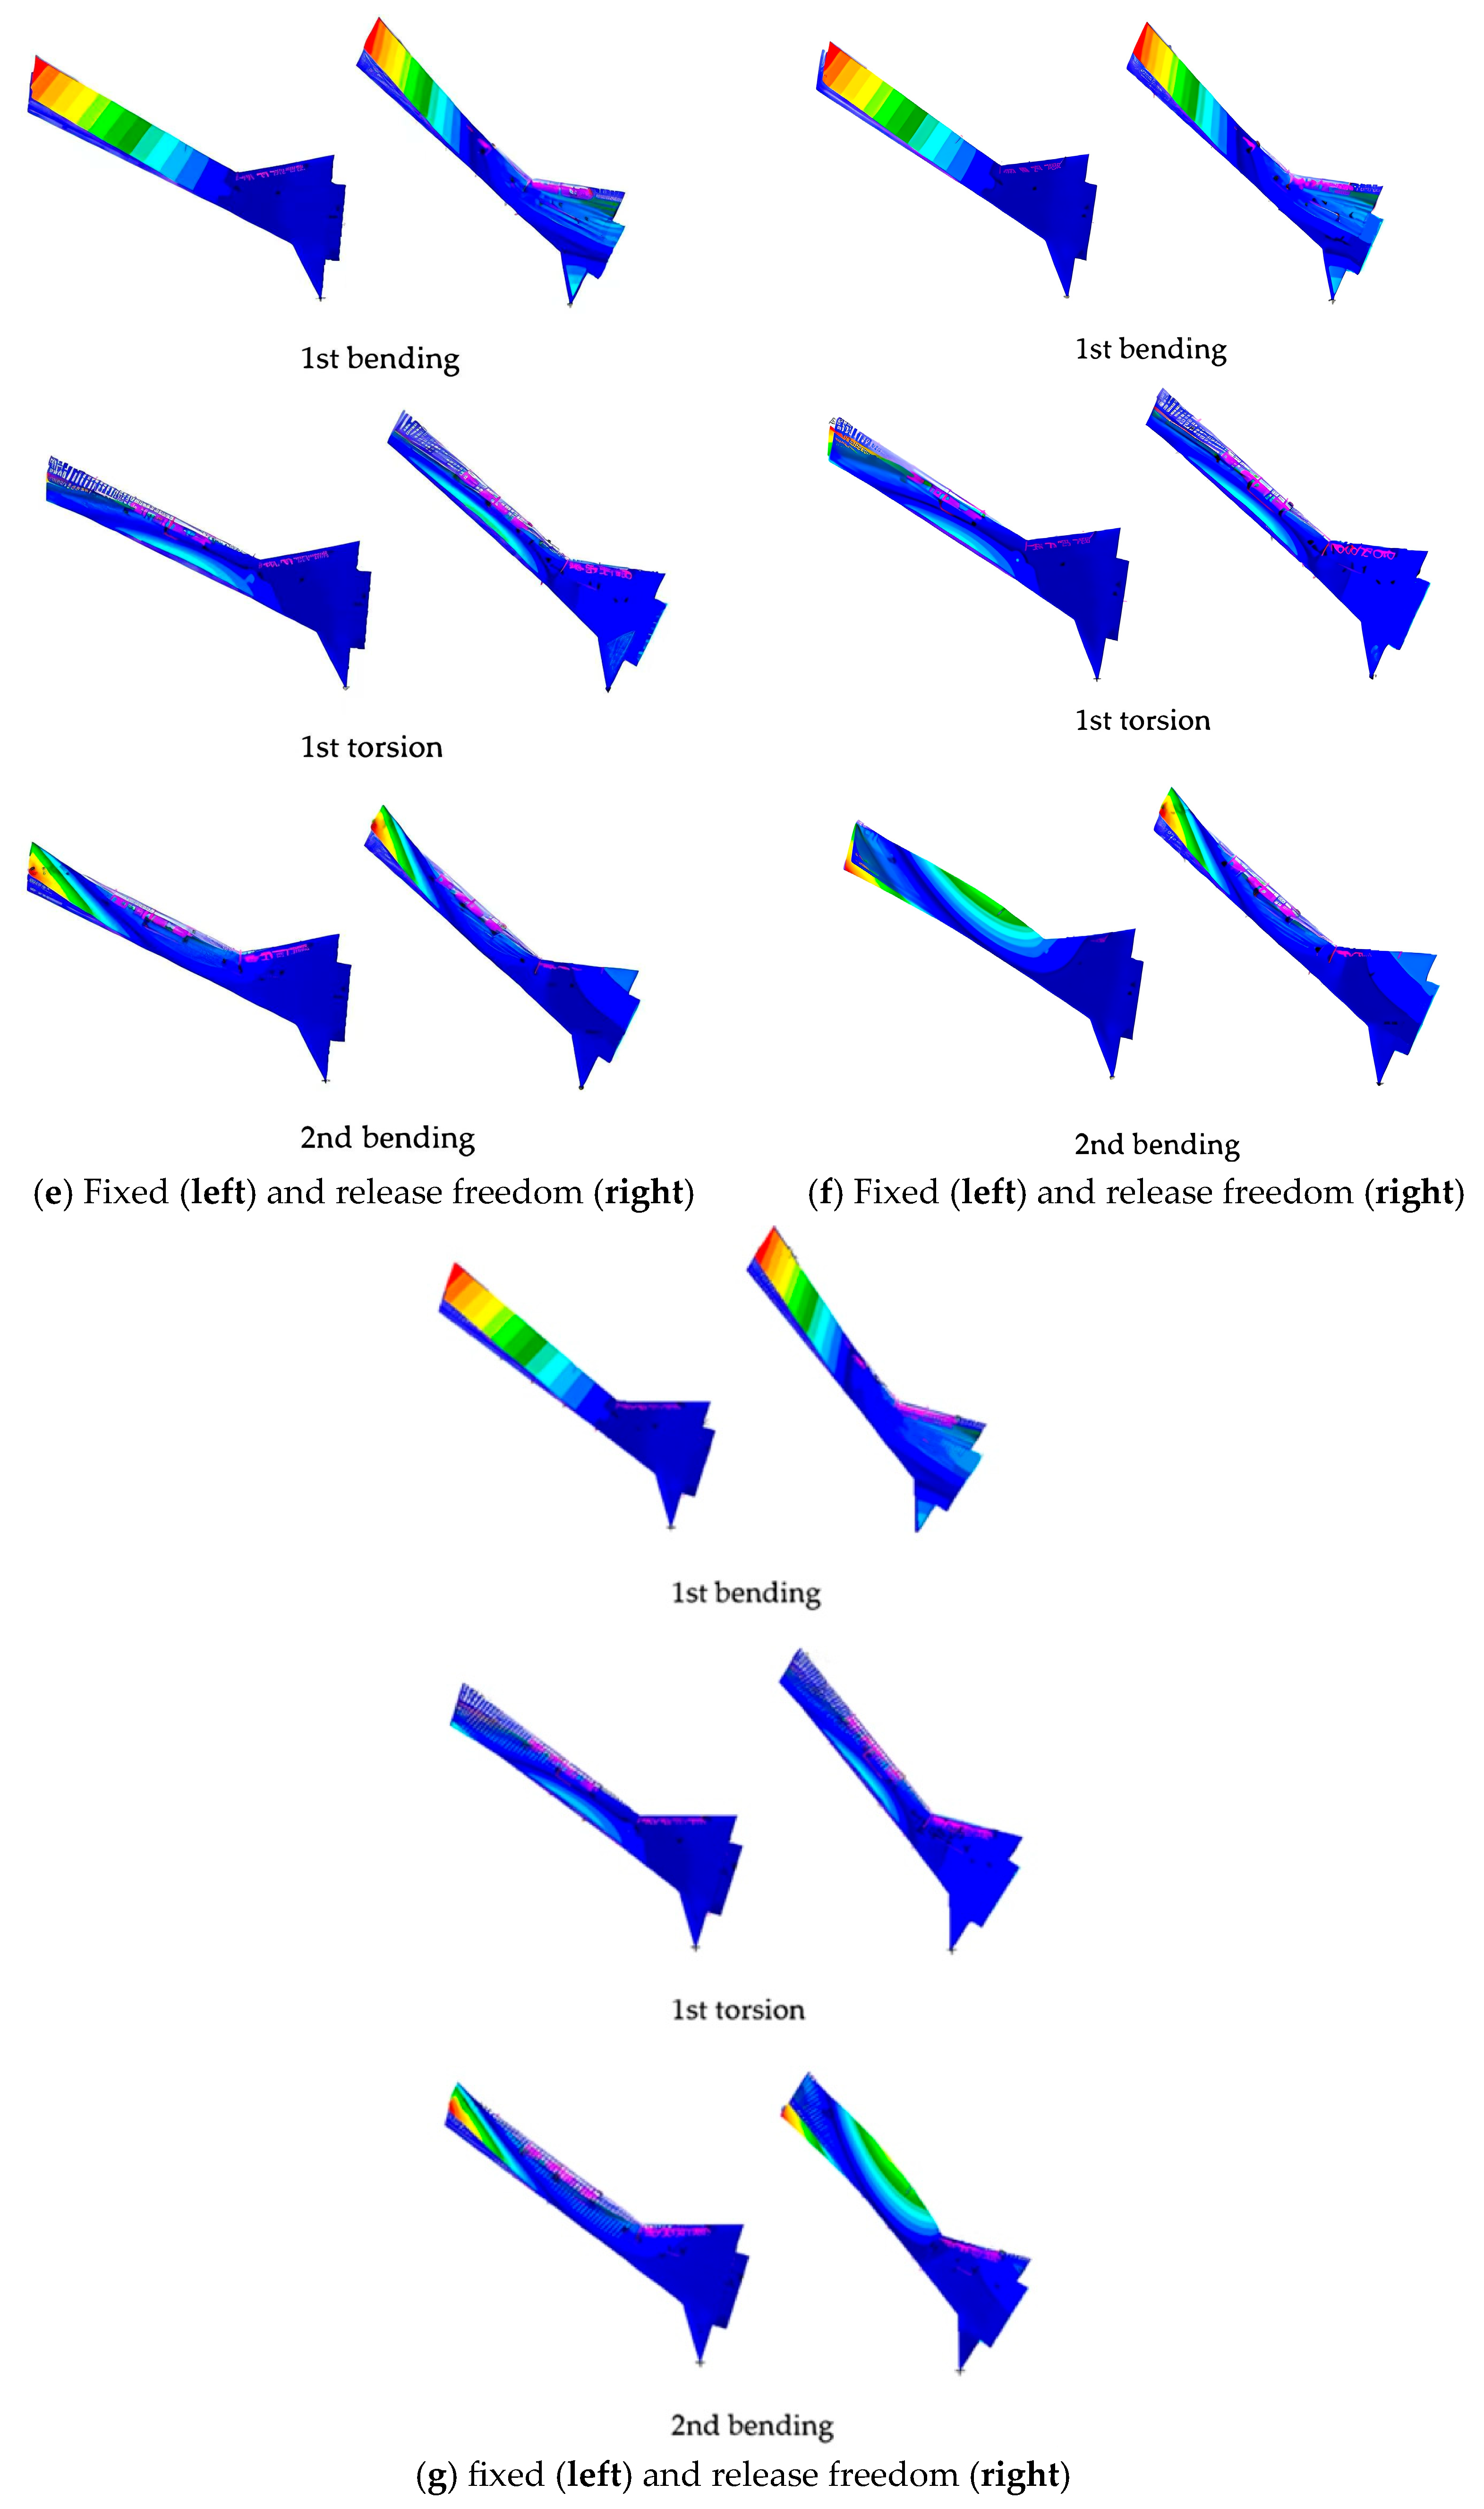
Using the strategy of increasing and decreasing mass from CS1 to CS4 (see Figure 14, here CS1 and CS2 are a pair, and CS3 and CS4 are the other pair), seven different CS mass distribution configurations were implemented to evaluate the effect of CS weight on the dynamic characteristics of the flying wing, with the base configuration (State 2) representing the nominal mass condition. In State 1, the masses of all CS were decreased, while the masses of all CS were increased in State 3. State 4 implemented mass addition on CS 1 and CS 2 and applied mass reduction on CS 3 and CS 4. In State 5, the masses CS 1 and CS 3 were increased, and the masses of CS 2 and CS 4 were decreased. Conversely, State 6 applied mass addition to CS 2 and CS 4, while reducing the masses of CS 1 and CS 3. State 7 completed the parametric variations through mass addition on CS 3 and CS 4 and mass reduction on CS 1 and CS 2. The above CS mass distribution states are detailed in Table 5.

4.1. Different States Under Fixed Boundary Conditions

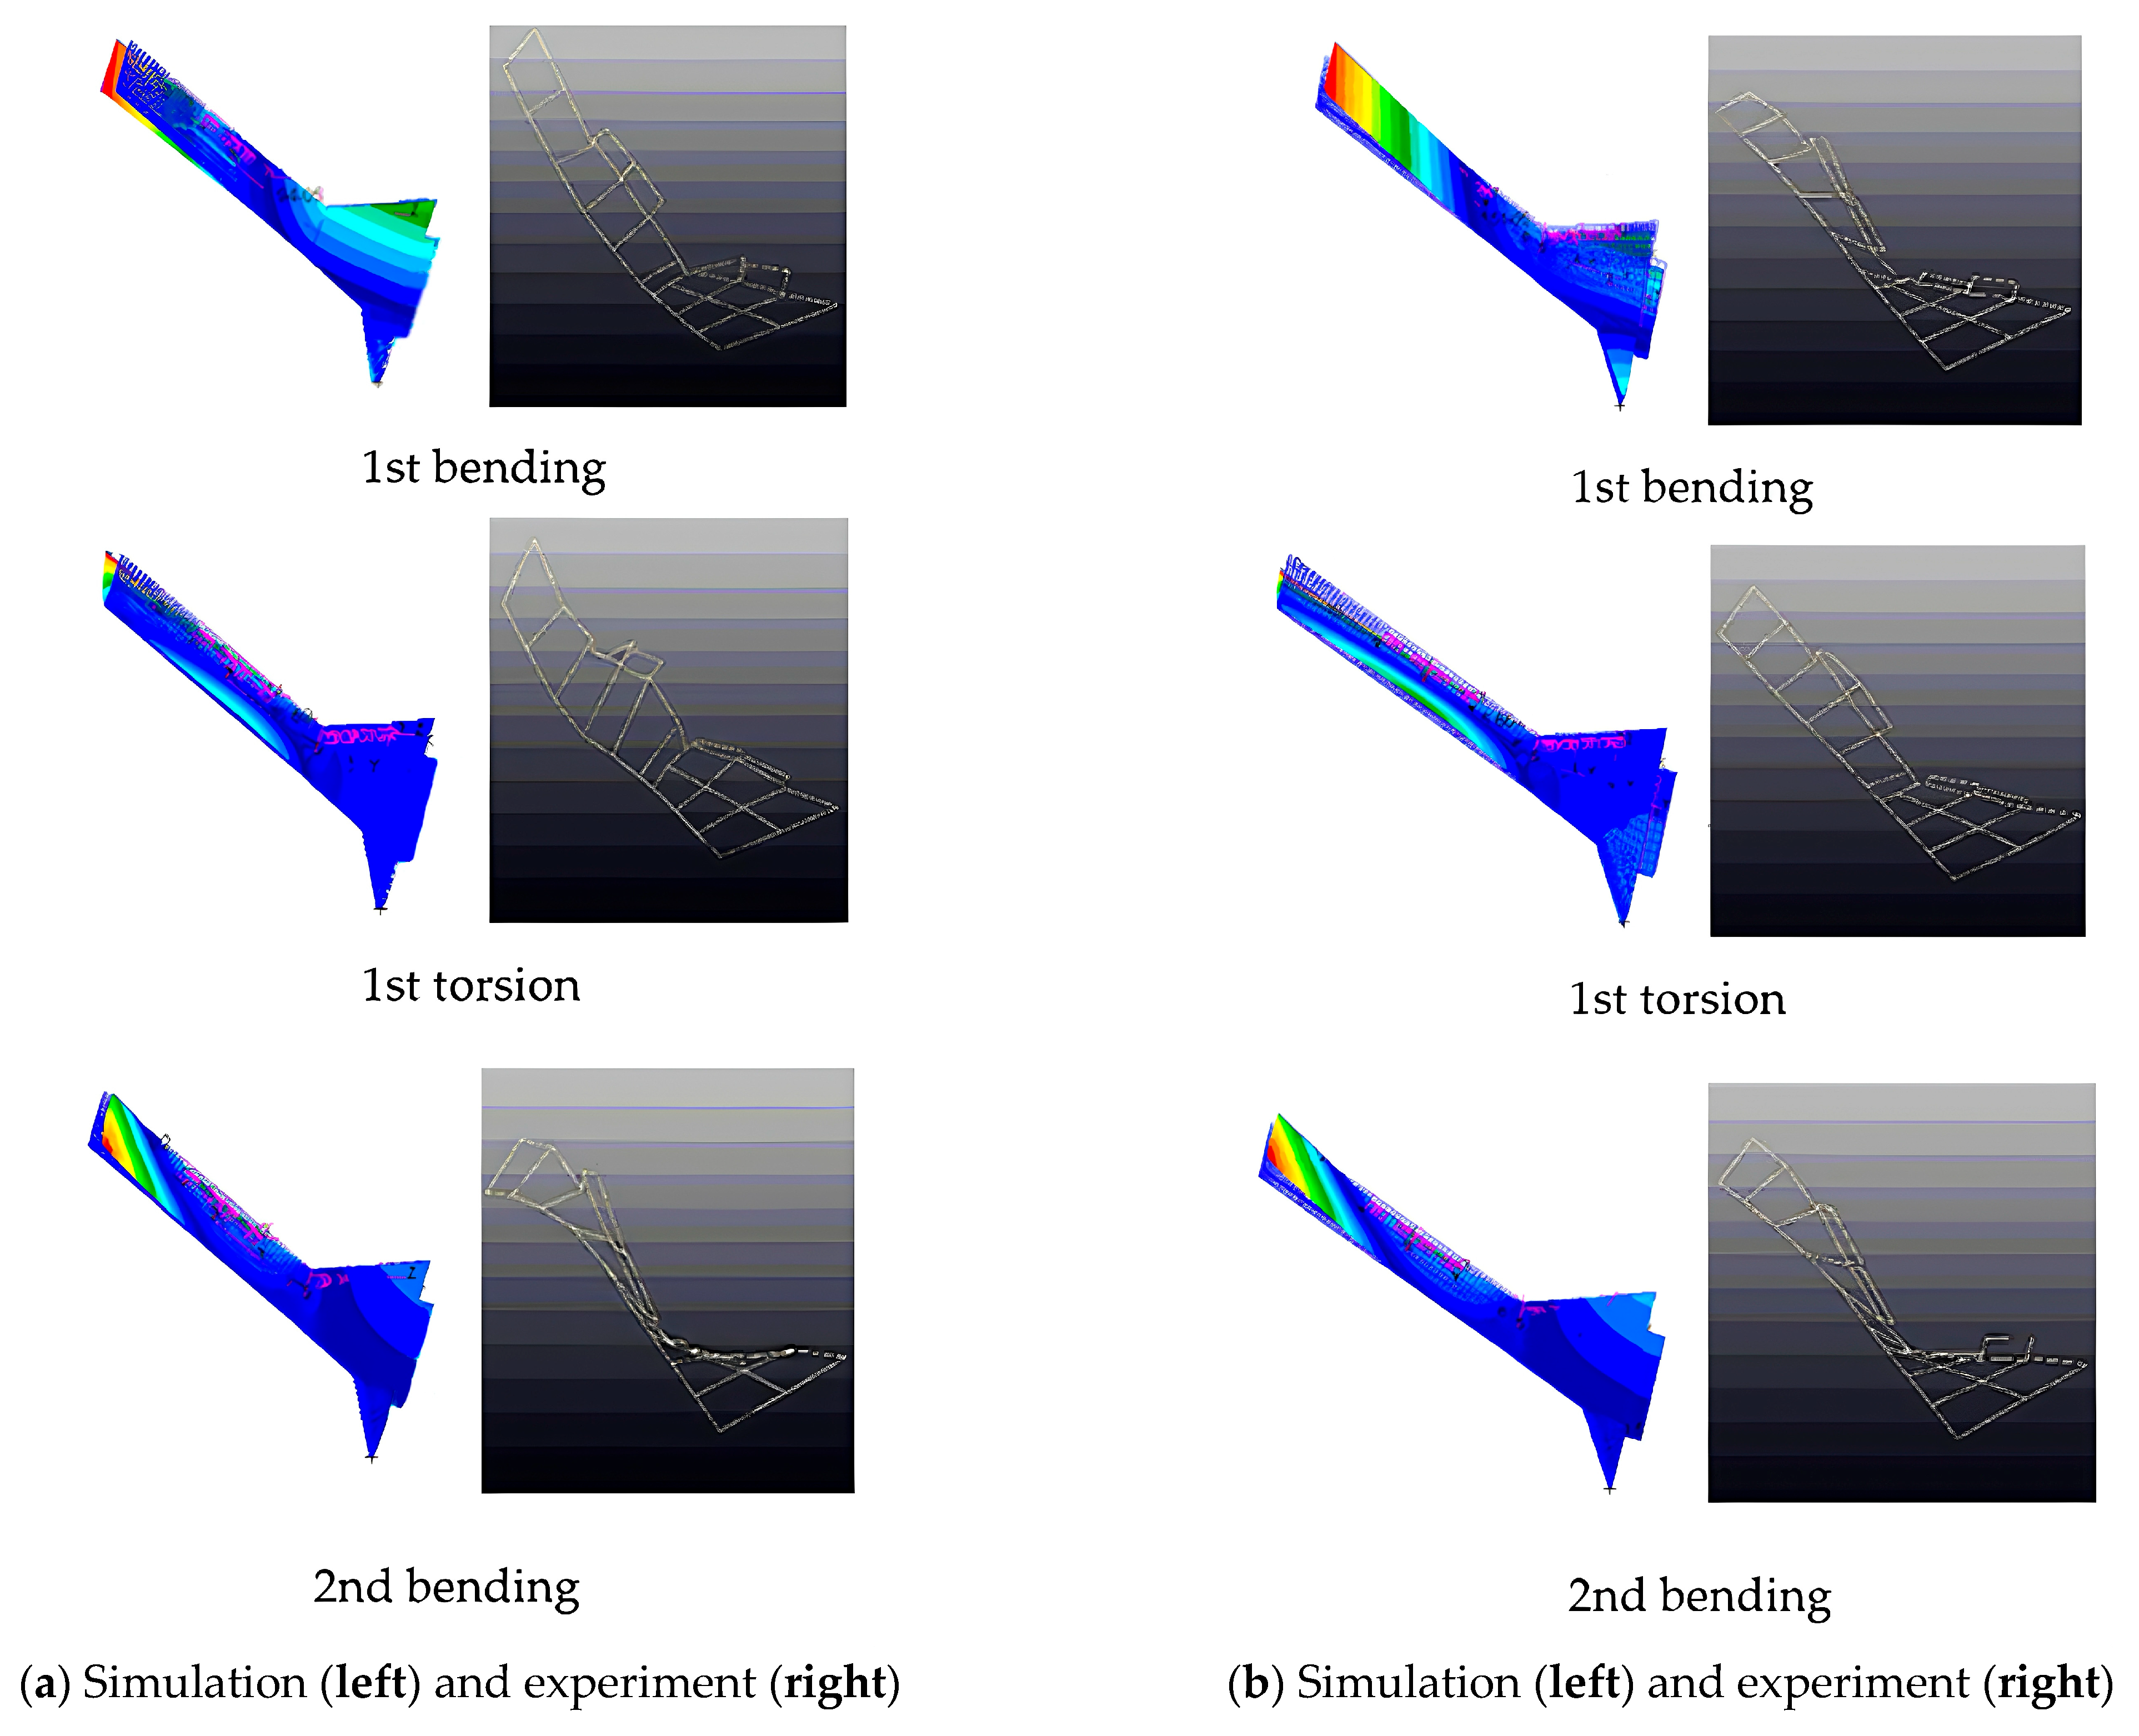
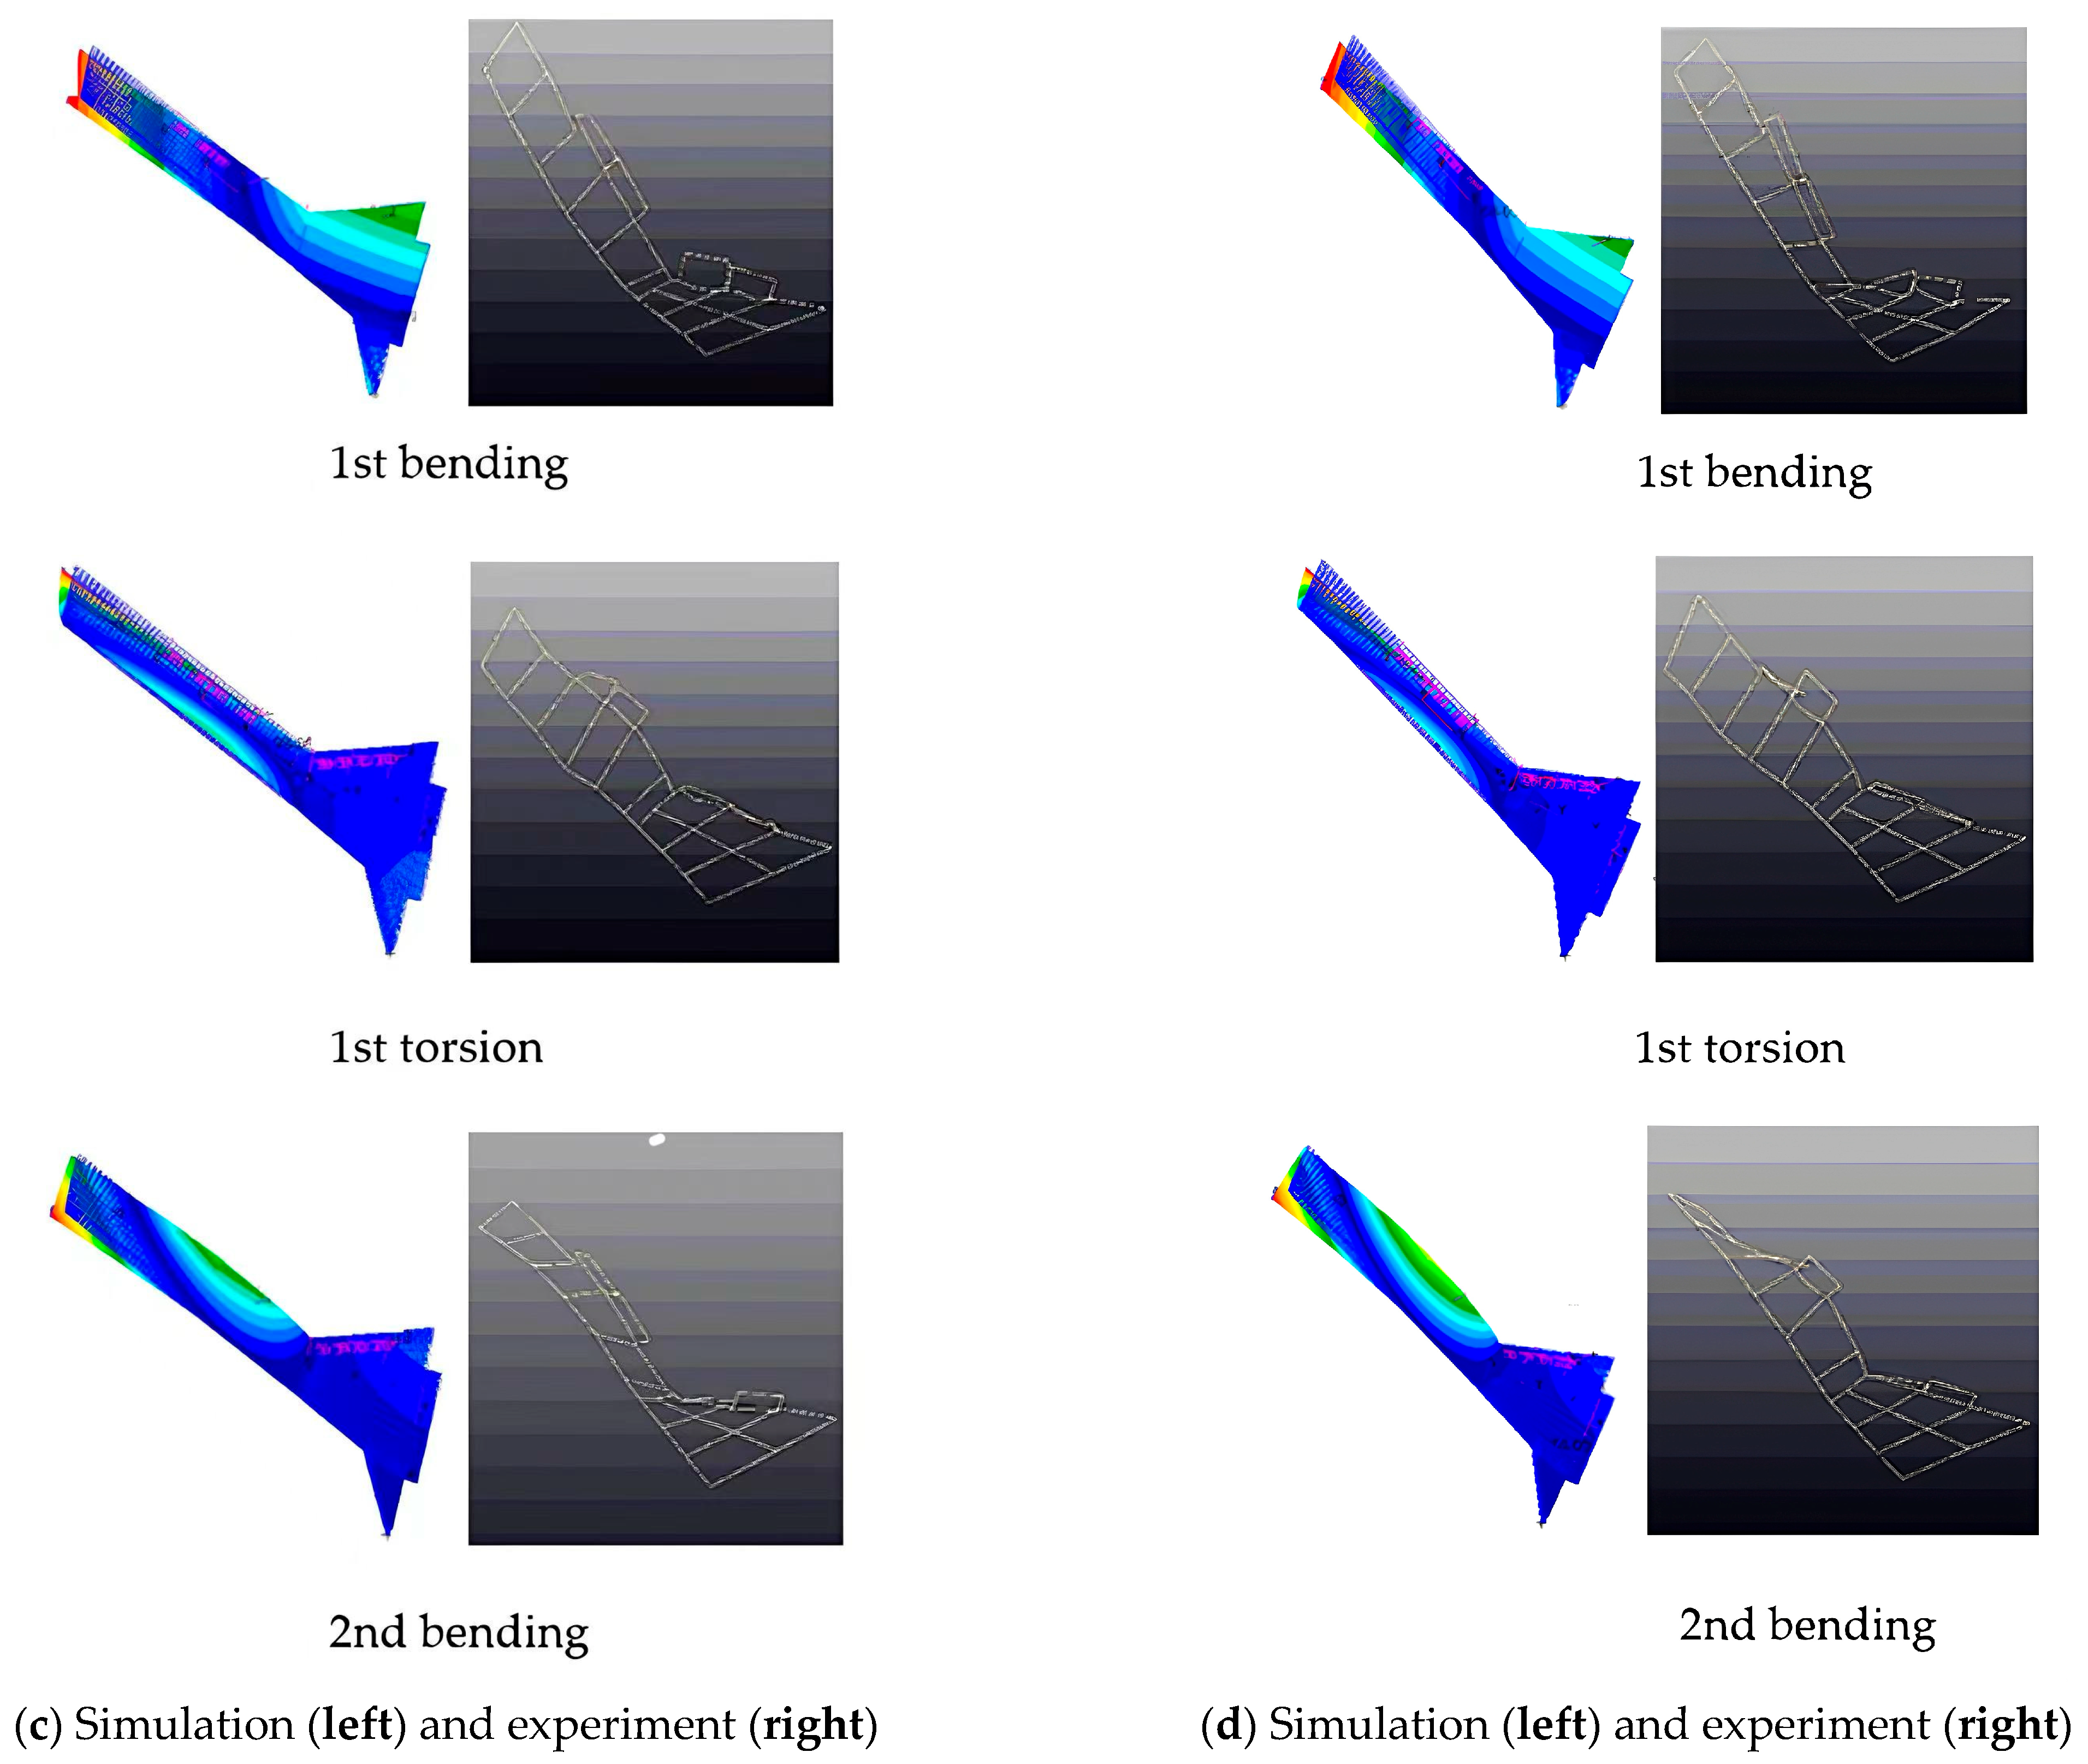
Computational analysis of structural dynamic characteristics of the flying wing was conducted for seven CS mass configurations, with GVT under fixed boundary conditions providing experimental validation. Comparisons of the modes and frequencies obtained by simulation and experiment are shown in Table 6 and Figure 15, respectively.
It can be seen from Figure 16 that total mass addition does not raise the frequencies, whereas total mass reduction does not reduce the frequencies; Mass addition on the CS 3 and 4 pair can achieve higher frequencies than the other pair, and different distributions inside different pairs can present different frequencies when each pair preserves the same mass.

4.2. Different States Under the Released Two-Degrees-of-Freedom Condition

In order to analyze the influence of different root boundary conditions, another four CS mass states (i.e., State 2+, State 4+, State 5+, and State 7+) were arranged (see Table 7). The symbol ‘+’ means the boundary with two-degrees-of-freedom release. The CS mass distribution of these new states was the same as the states with the same id, respectively. Comparisons of the frequencies obtained by simulation and experiment are shown in Table 8 and Figure 16.
It can be seen from Table 7 and Figure 16 that when CS1 and CS2 are added to the mass stages, the wing can achieve higher bending and torsion frequencies, and different mass distributions inside each pair can present different bending and torsion frequencies. By analyzing the dynamic characteristics of the structure under different CS mass distributions, it can be found that all states have different dynamic behaviors. Although the natural frequency values vary significantly, the modes are basically the same. It can be seen that the structural parameters chosen for modification are reasonable, and the proposed finite element modelling is effective enough to capture the dynamic characteristics of the present wing with different cracked CS. The numerical model can thus be employed to analyze the influence of these structural parameters on the gust response.

4.3. Comparison of Structural Dynamics Under Different Root Boundary Conditions

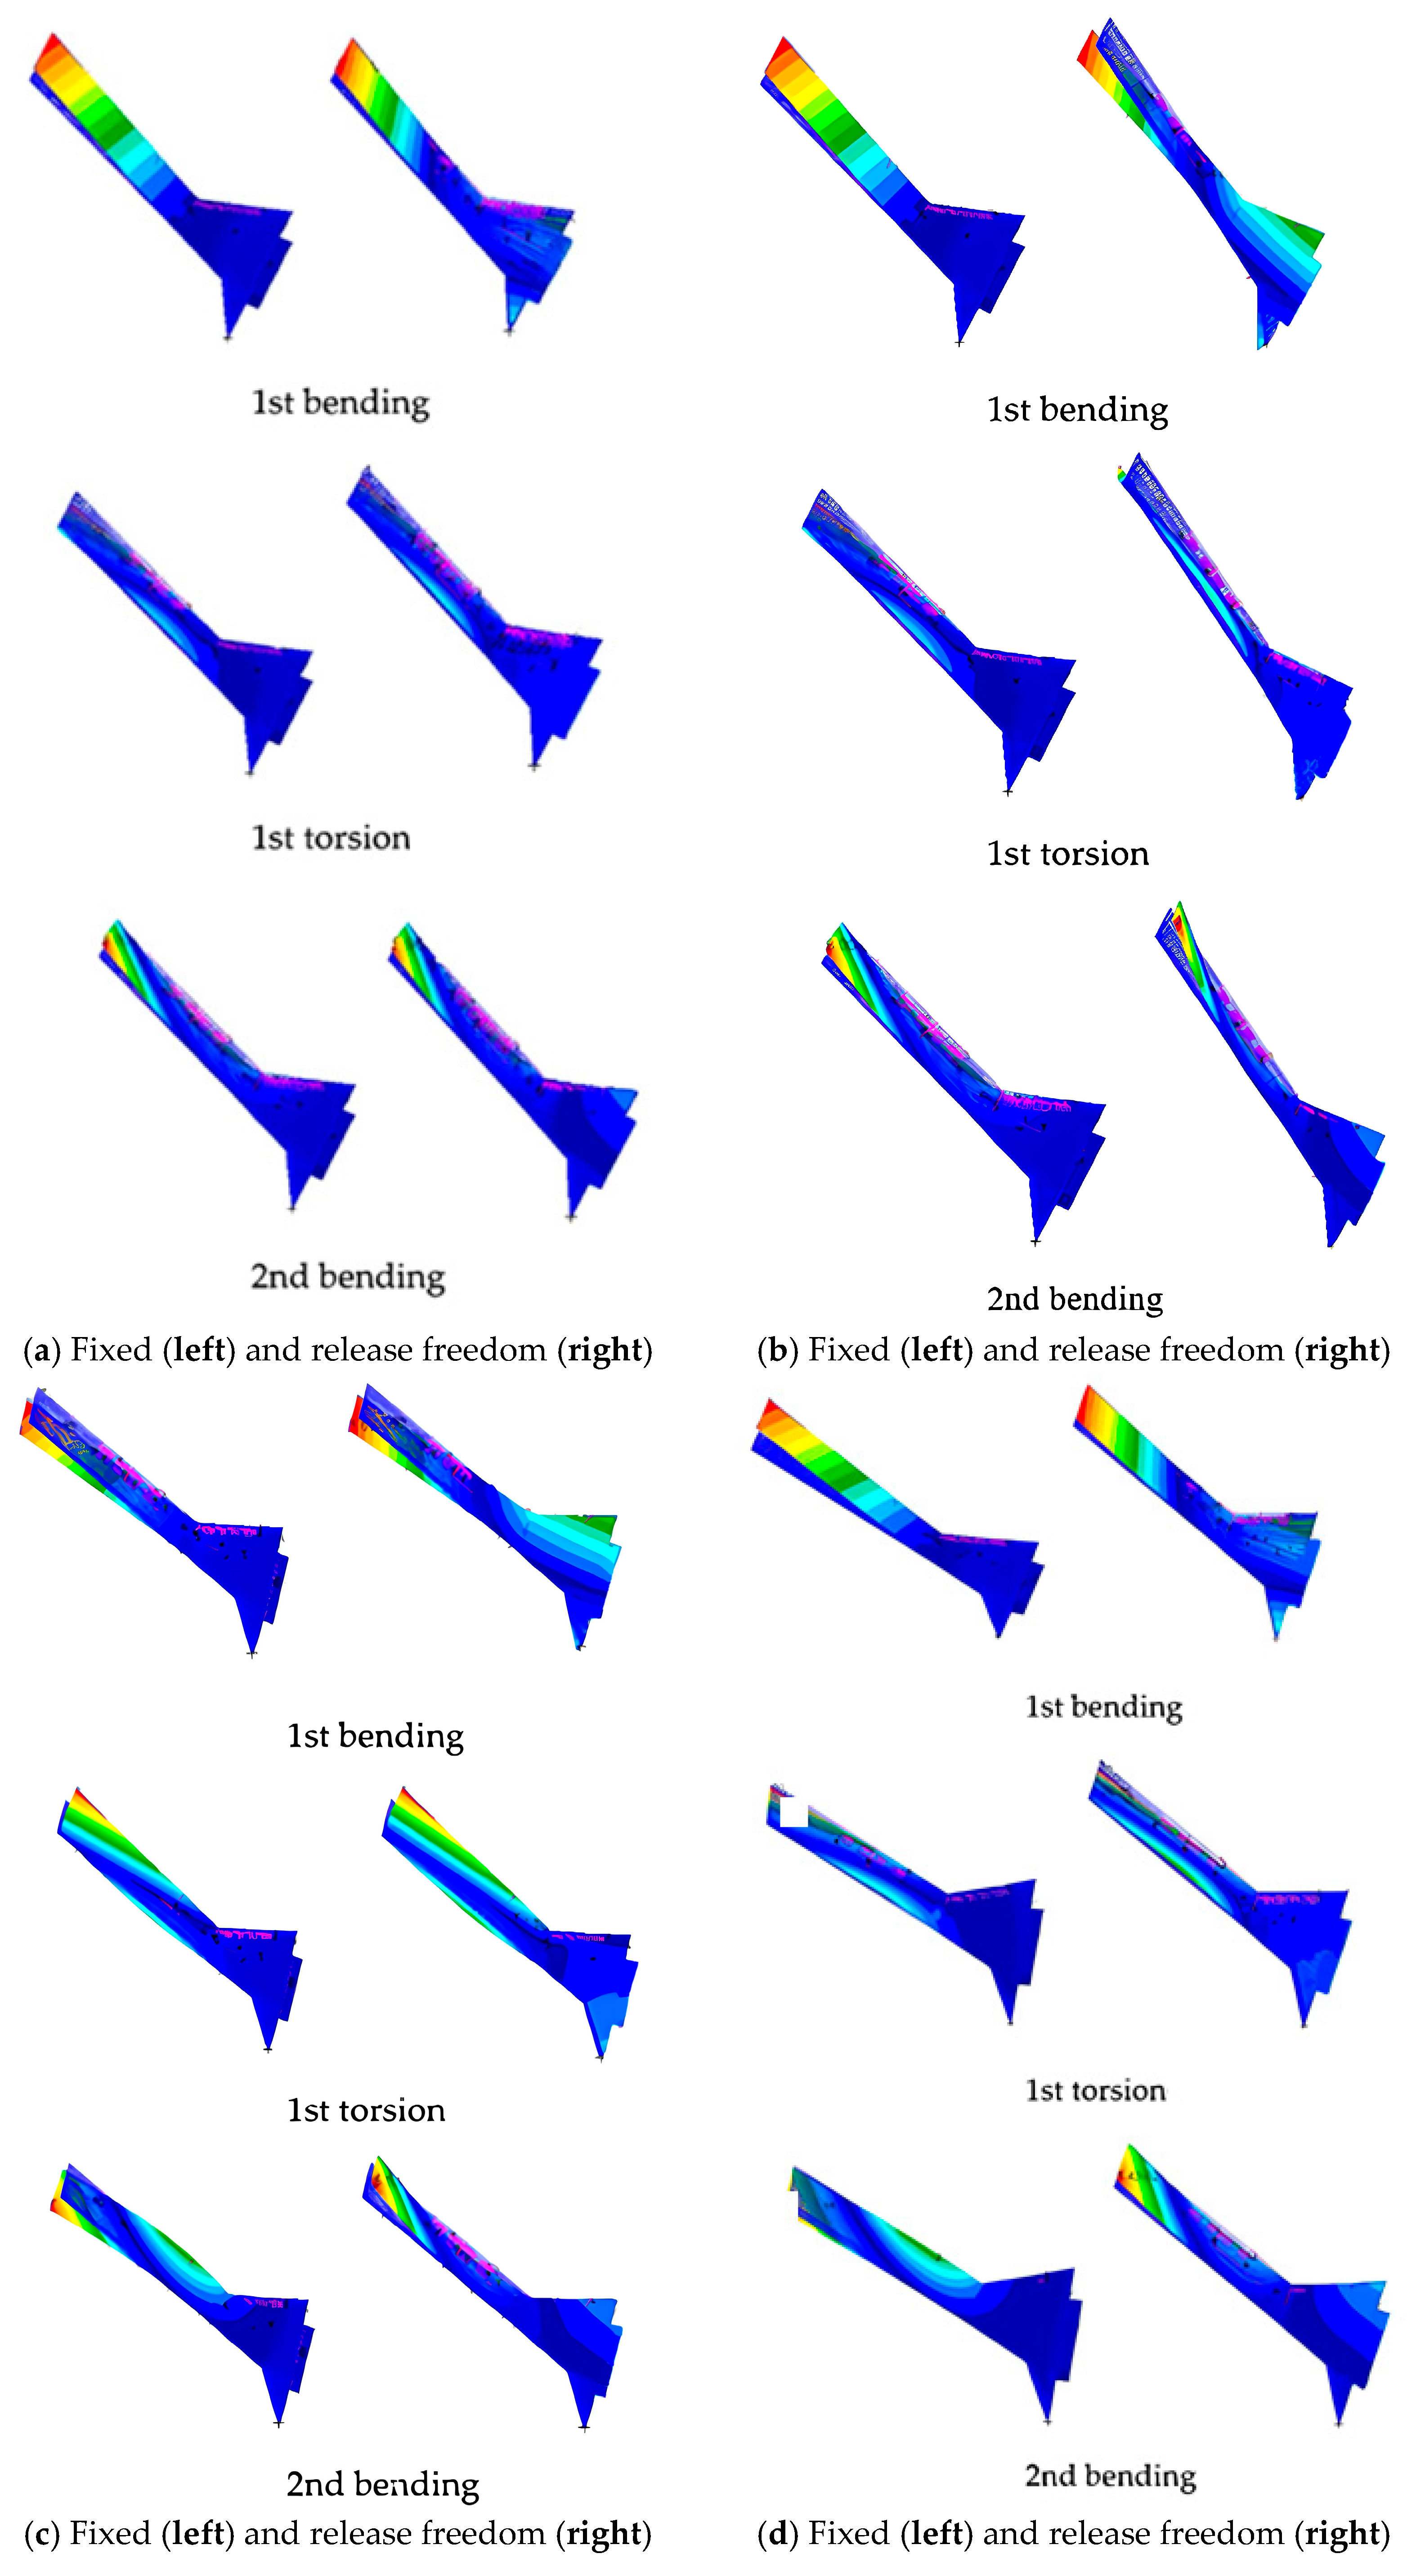
The dynamic characteristics of the structure were analyzed under the different root boundary conditions (fixed support and two-degrees-of-freedom release) of seven different CS mass states, and the mode calculation results are presented in Figure 17.
The comparative analysis shows that the two root boundary conditions have a significant impact on the structural modes, and at the same time, the natural frequency is significantly different, as shown in Table 9. Release of the two degrees of freedom via pitch and yaw is more similar to the actual flight conditions.

5. Gust Response with Different Cracked CS Conditions

5.1. Computational Method of Gust Response

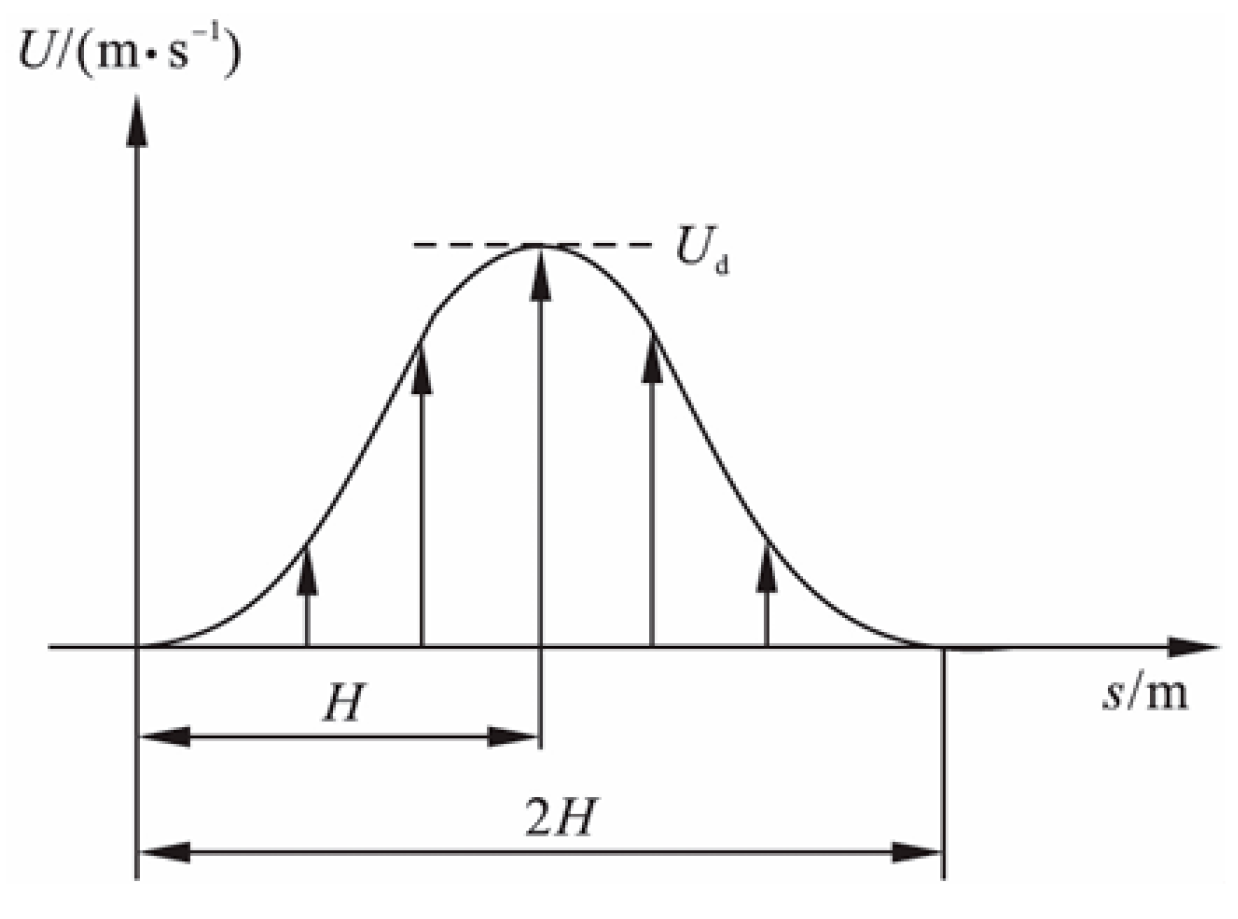
Gusts are classified as discrete gusts and continuous gusts. The discrete gust is modeled as a 1-cos profile, with its specific mathematical expression given in Equation (3), and the velocity profile is shown in Figure 18 [32].
        U s =         0                                                                                                                                 s < 0   o r   s > 2 H U d 2 1 cos π s H                                                                                         0 s 2 H                                            
where U is the discrete gust velocity, U d is the design gust velocity expressed in equivalent airspeed, s is the distance penetrated into the gust, and H is the gust gradient.
In aeroelastic dynamic response analysis, the equations of motion can be expressed as:
M i q ¨ i + ω i 2 M i q i = f i M + f i G , i = 1,2 , , n
Here, M i is the generalized mass corresponding to the i generalized coordinate, ω i is the frequency of the ith mode, ω i = 0 ,   and   f i M and f i G represent the generalized aerodynamic forces induced by aircraft motion and gusts, respectively, calculated as follows:
f i M = l + l   L M y ϕ i y d y
f i G = l + l   L G y ϕ i y d y  
Here, l denotes the aircraft semi-span; L M and L G represent the lift per unit span induced by aircraft motion and gusts, respectively [1]; and b R is the reference semi-chord length. Upon introducing non-dimensional time τ = V t / b R , Equation (4) reduces to:
V 2 b R 2 M i q i + ω i 2 M i q i = f i M + f i G , i = 1,2 , , n
Aerodynamic forces due to gusts
L G y = ρ V C L a b R a y 0 τ   Ψ τ σ w g σ d σ
Here, b R a y denotes the semi-chord length at spanwise position y . For aerodynamic forces due to aircraft motion, quasi-steady aerodynamics is adopted for simplification,
L M y = ρ V C L a b R a y u ˙ = ρ V 2 C L a a y u = ρ V 2 C L a a y j = 1 n   ϕ j y q j
Substituting Equations (8) and (9) into Equations (5) and (6), respectively, yields:
f i M = ρ V 2 C L a j = 1 n   q j l + l   a y ϕ i y ϕ j y d y
f i G = ρ V 2 C L q b R l + l   a y ϕ i y d y 0 r   Ψ τ σ w g σ V d σ
Substituting Equations (10) and (11) into Equation (7), respectively:
λ i q i τ + j = 1 n   B i j q i τ + λ i Ω i 2 q i τ = b R B 1 i 0 τ   Ψ τ σ w g σ V d σ , i = 1,2 , , n
where
λ i = M i 1 2 ρ S b R C L α , Ω i = ω i b R V , S = 4 b R l
B i j = 2 b R S l + l a y ϕ i y ϕ j y d y
The gust response of the aircraft can be obtained by solving Equation (12) using either Laplace transform or numerical methods [33]. The gust-induced incremental acceleration and wing root bending moment are calculated as follows:
u ¨ 0 = i = 1 n   ϕ i 0 q ¨ i = V 2 b R 2 i = 1 n   ϕ i 0 q i τ  
M B = 0 l   L G y + L M y V 2 b R 2 μ y i = 1 n   ϕ i y q i τ y d y
where μ y denotes the mass per unit span of the wing.

5.2. Results of Gust Response

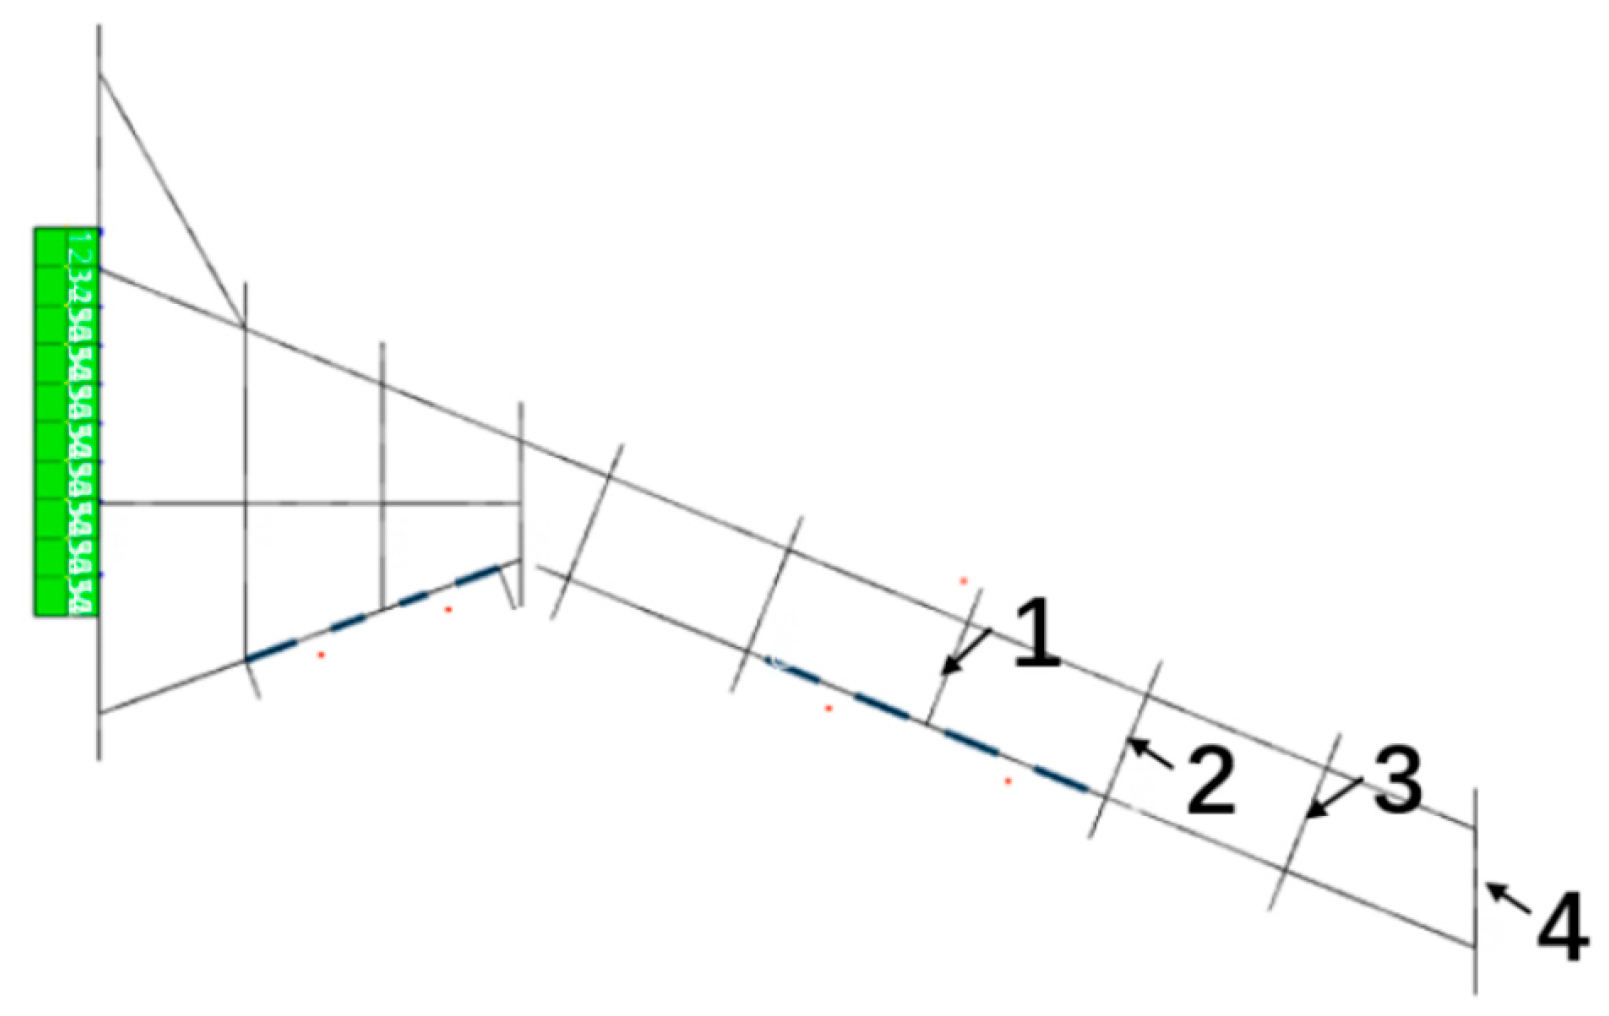
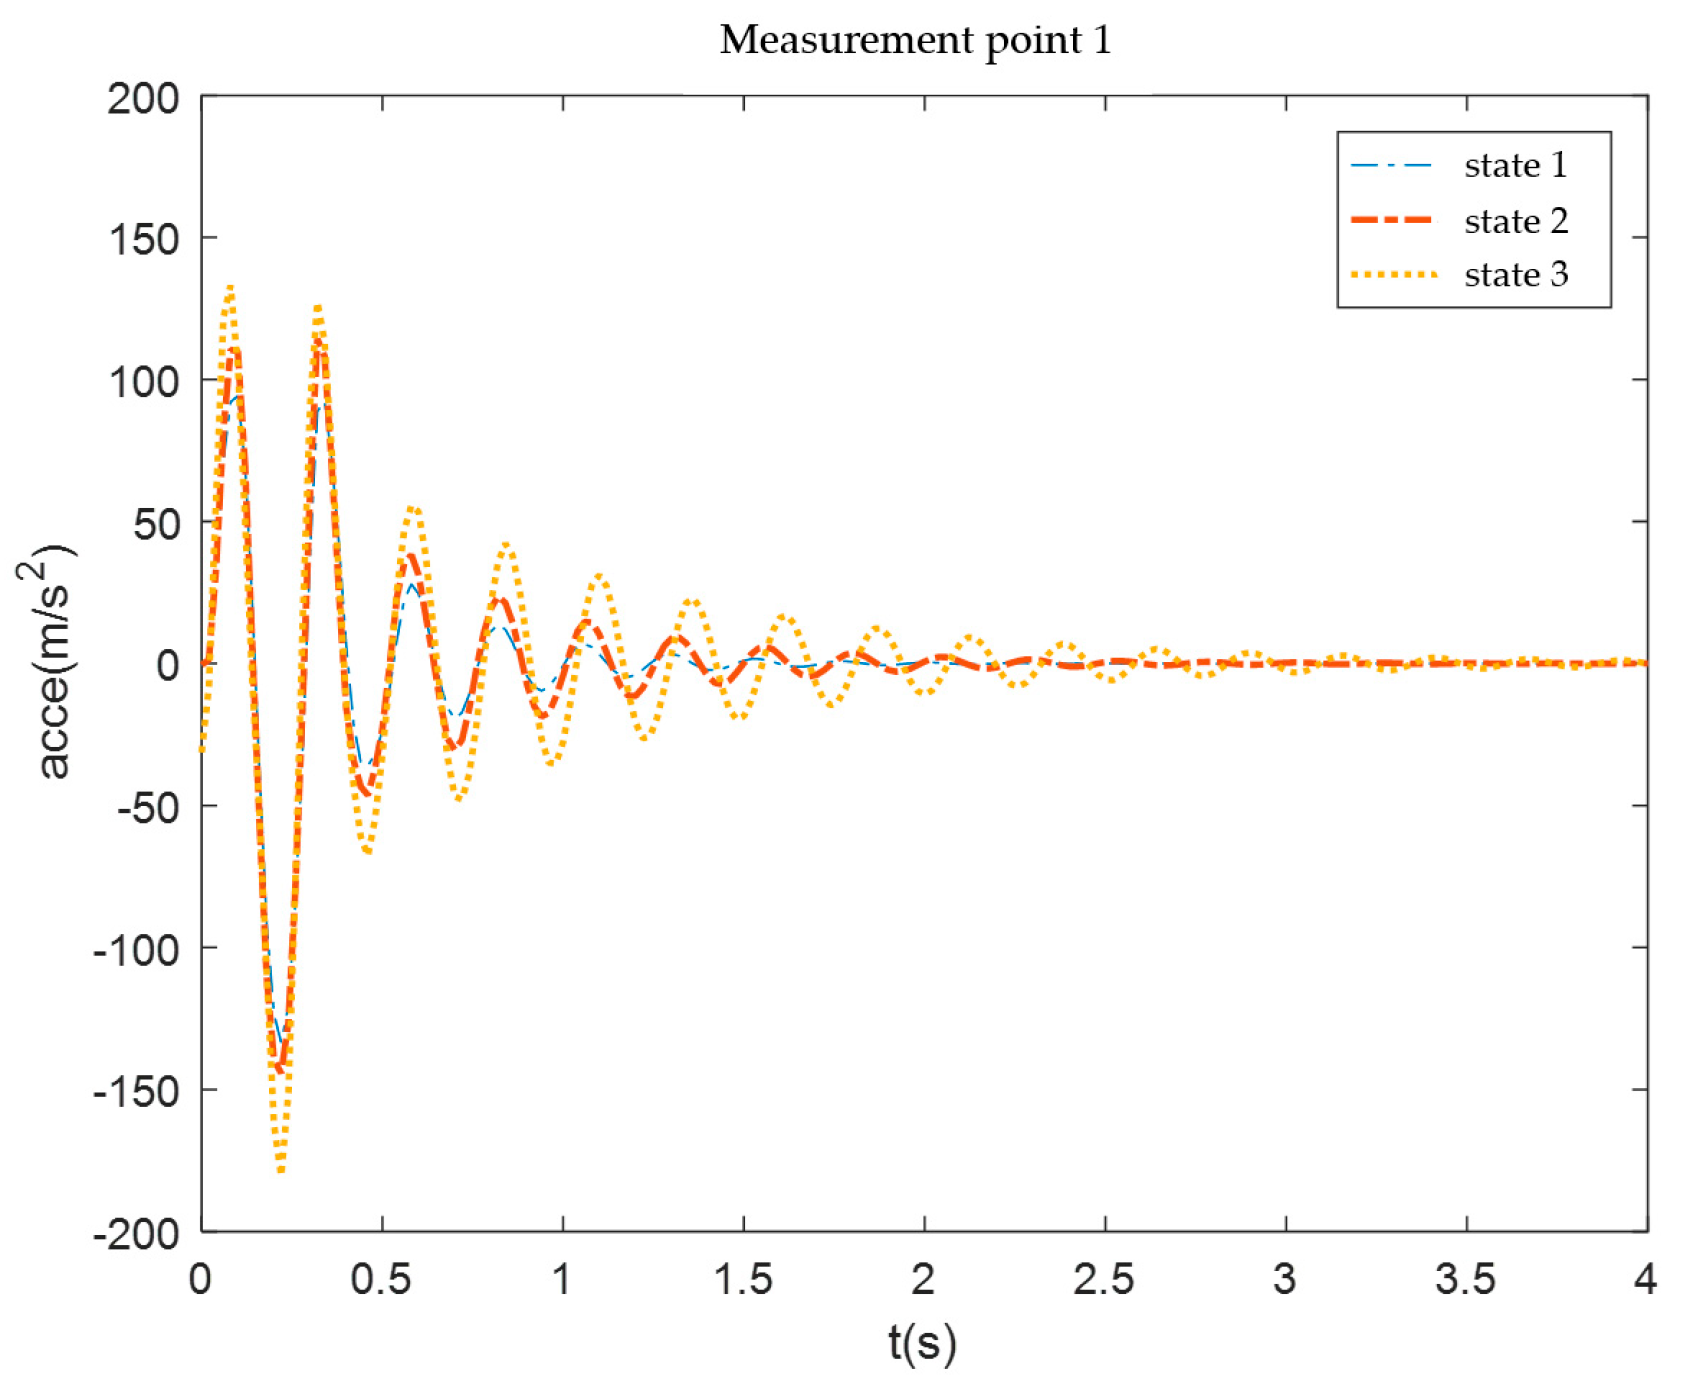
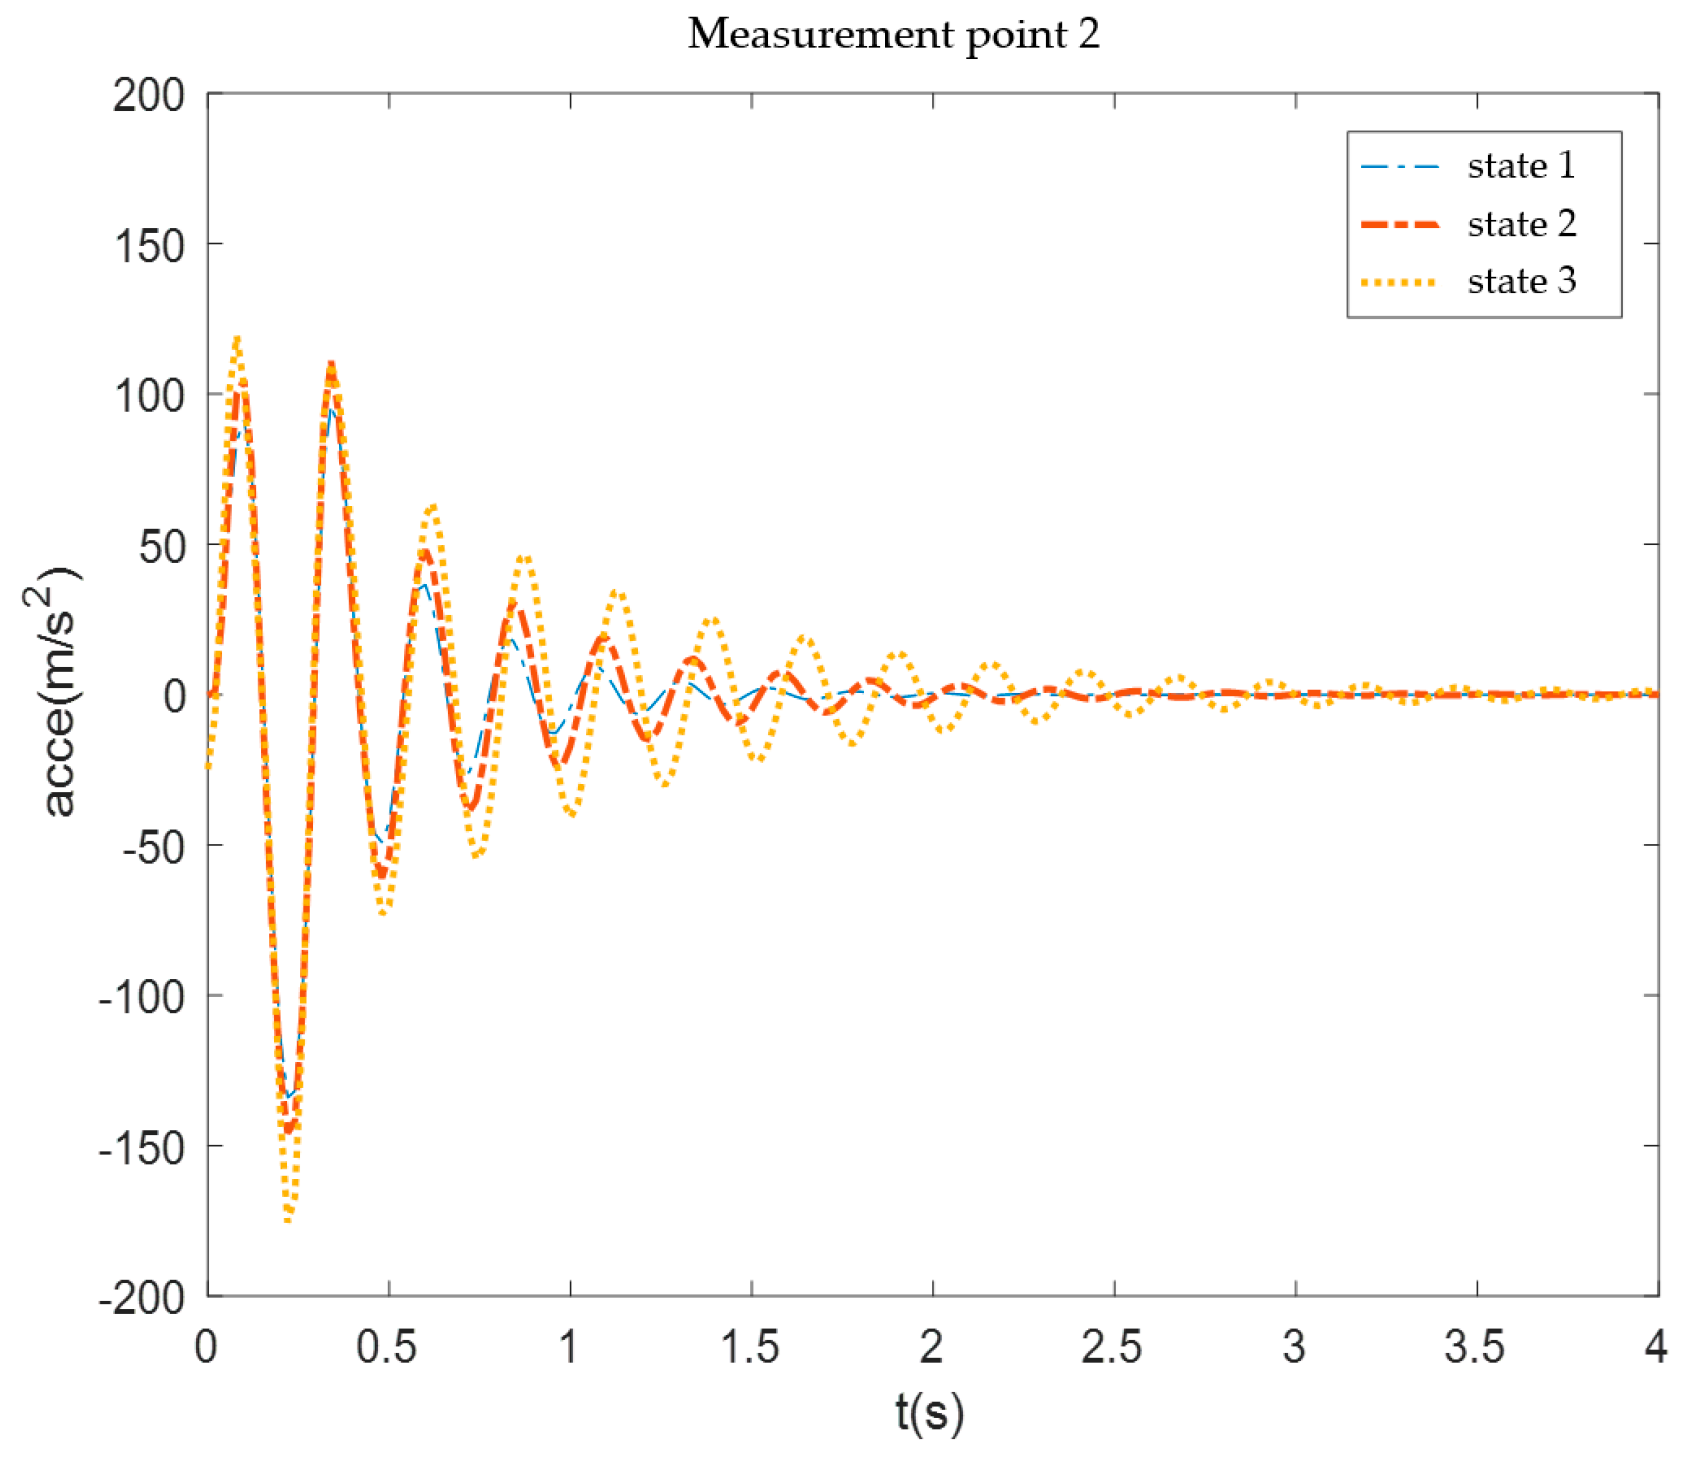
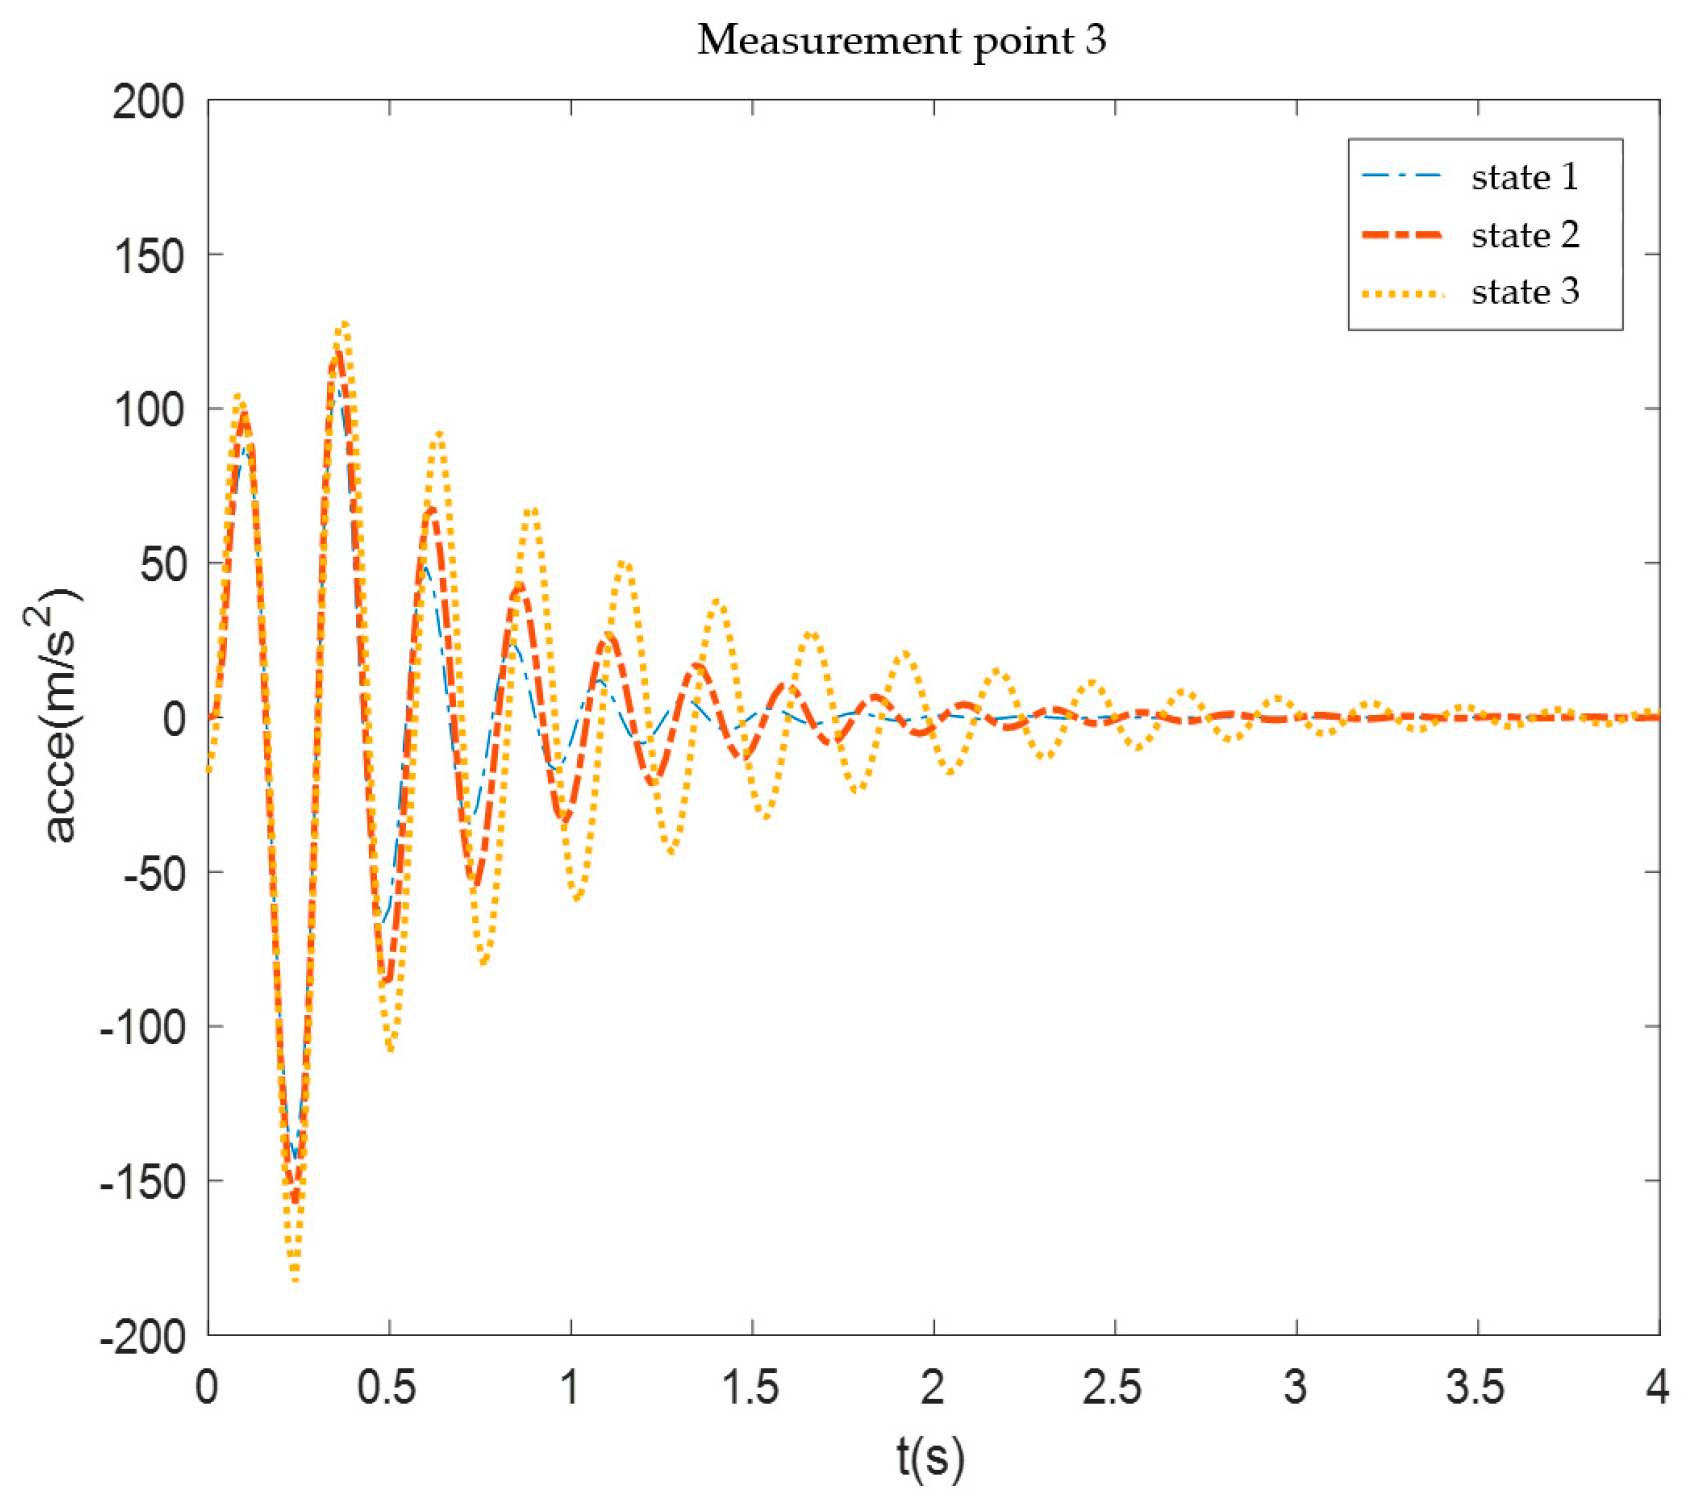
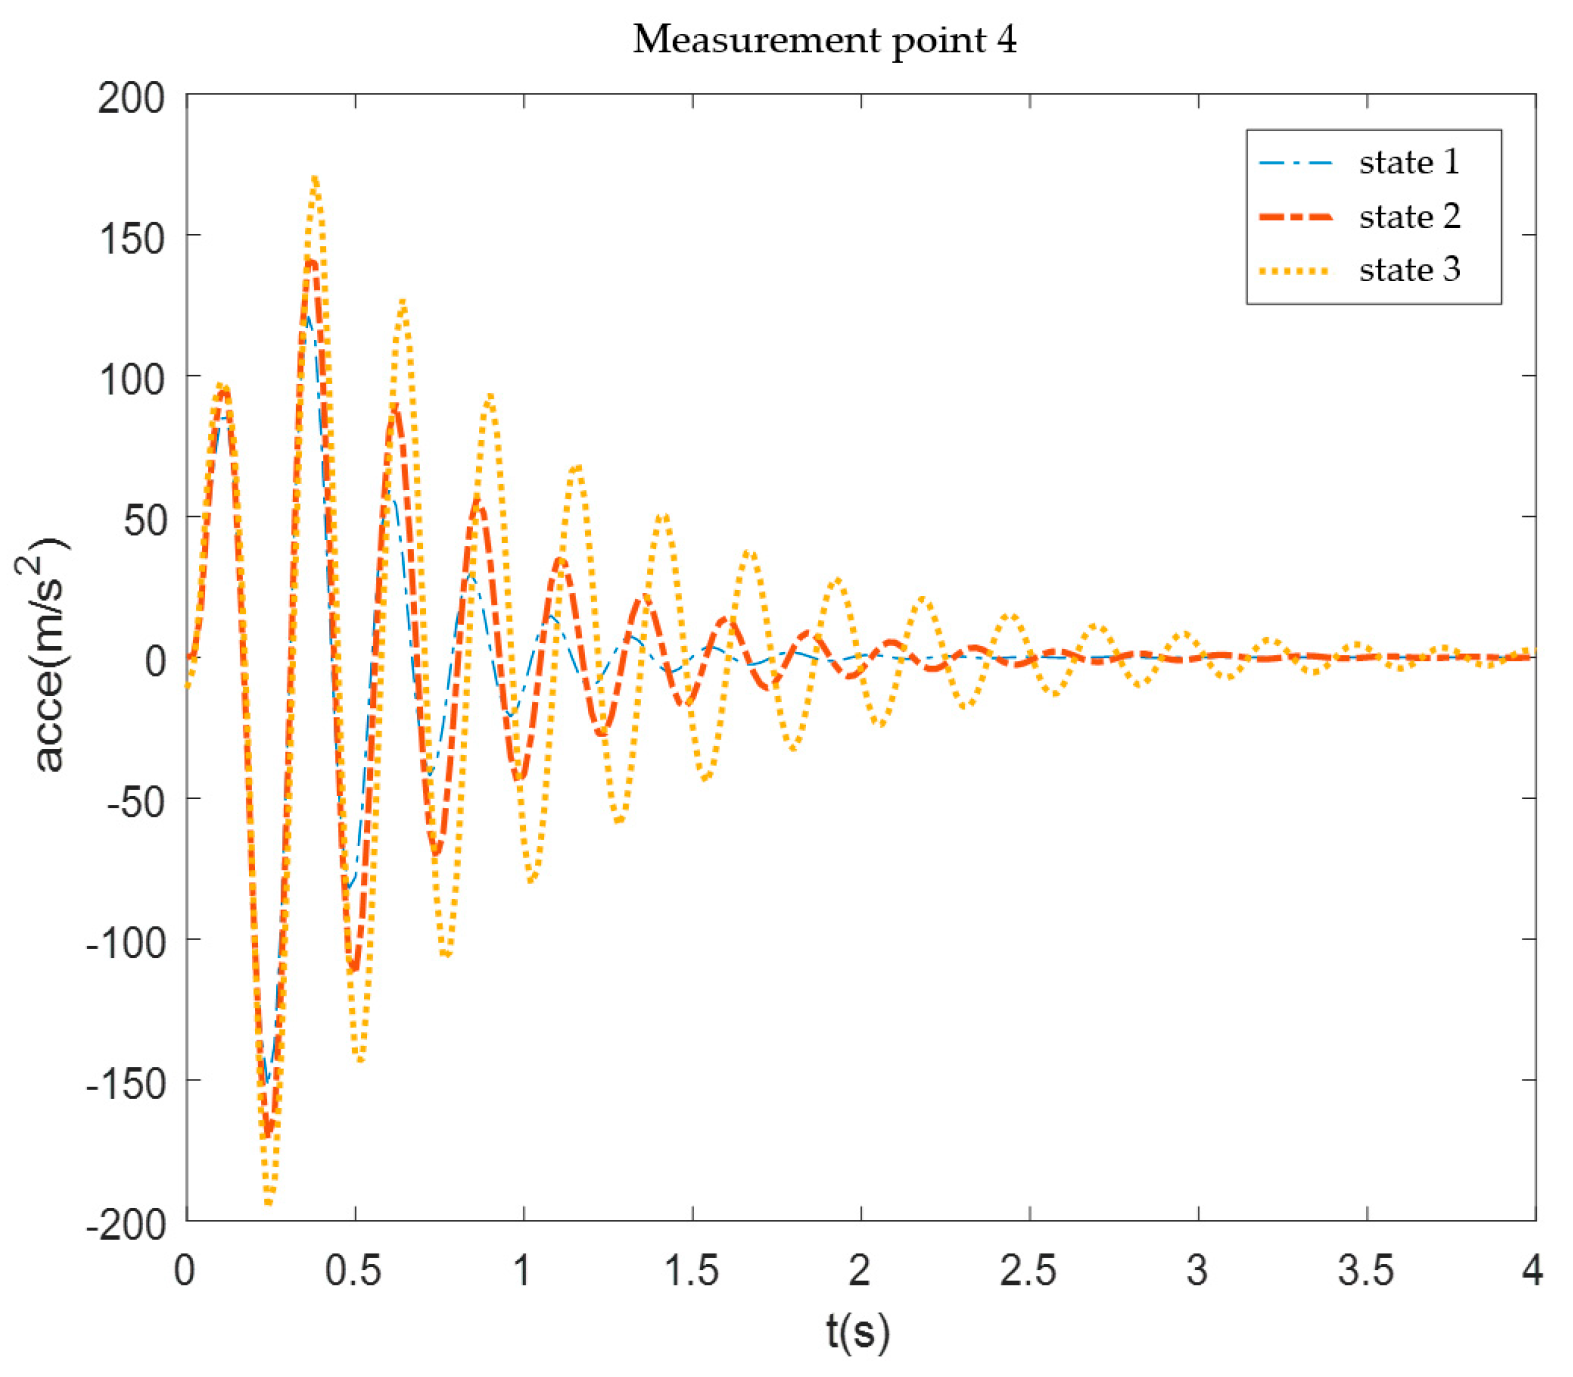
Gust responses of the present flying-wing configuration were analyzed under three CS mass states (States 1–3), with acceleration responses at designated measurement points compared (i.e., points 1–4), as shown in Figure 19. The gust excitation parameters employed in these simulations are documented in Table 10. The results of the calculation are shown in Figure 20, Figure 21, Figure 22 and Figure 23.
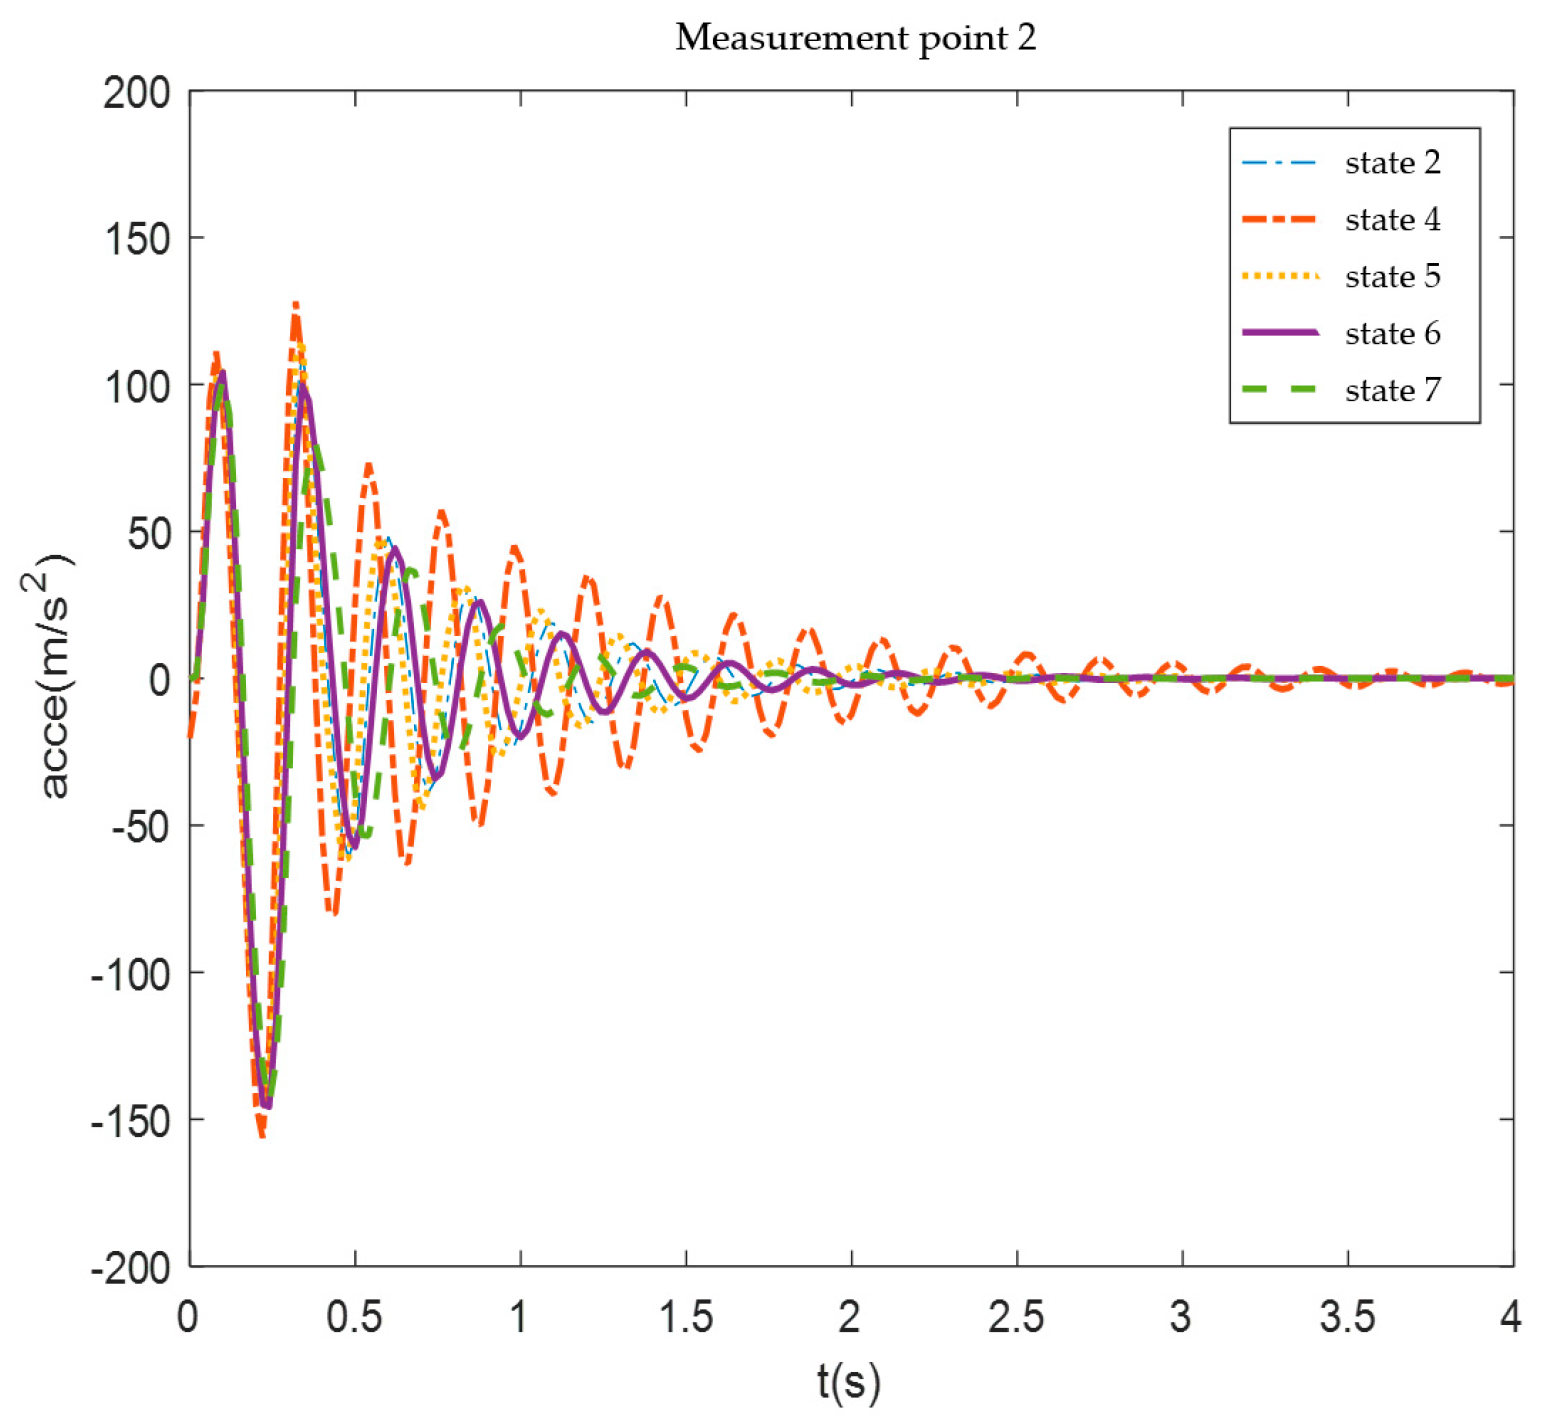
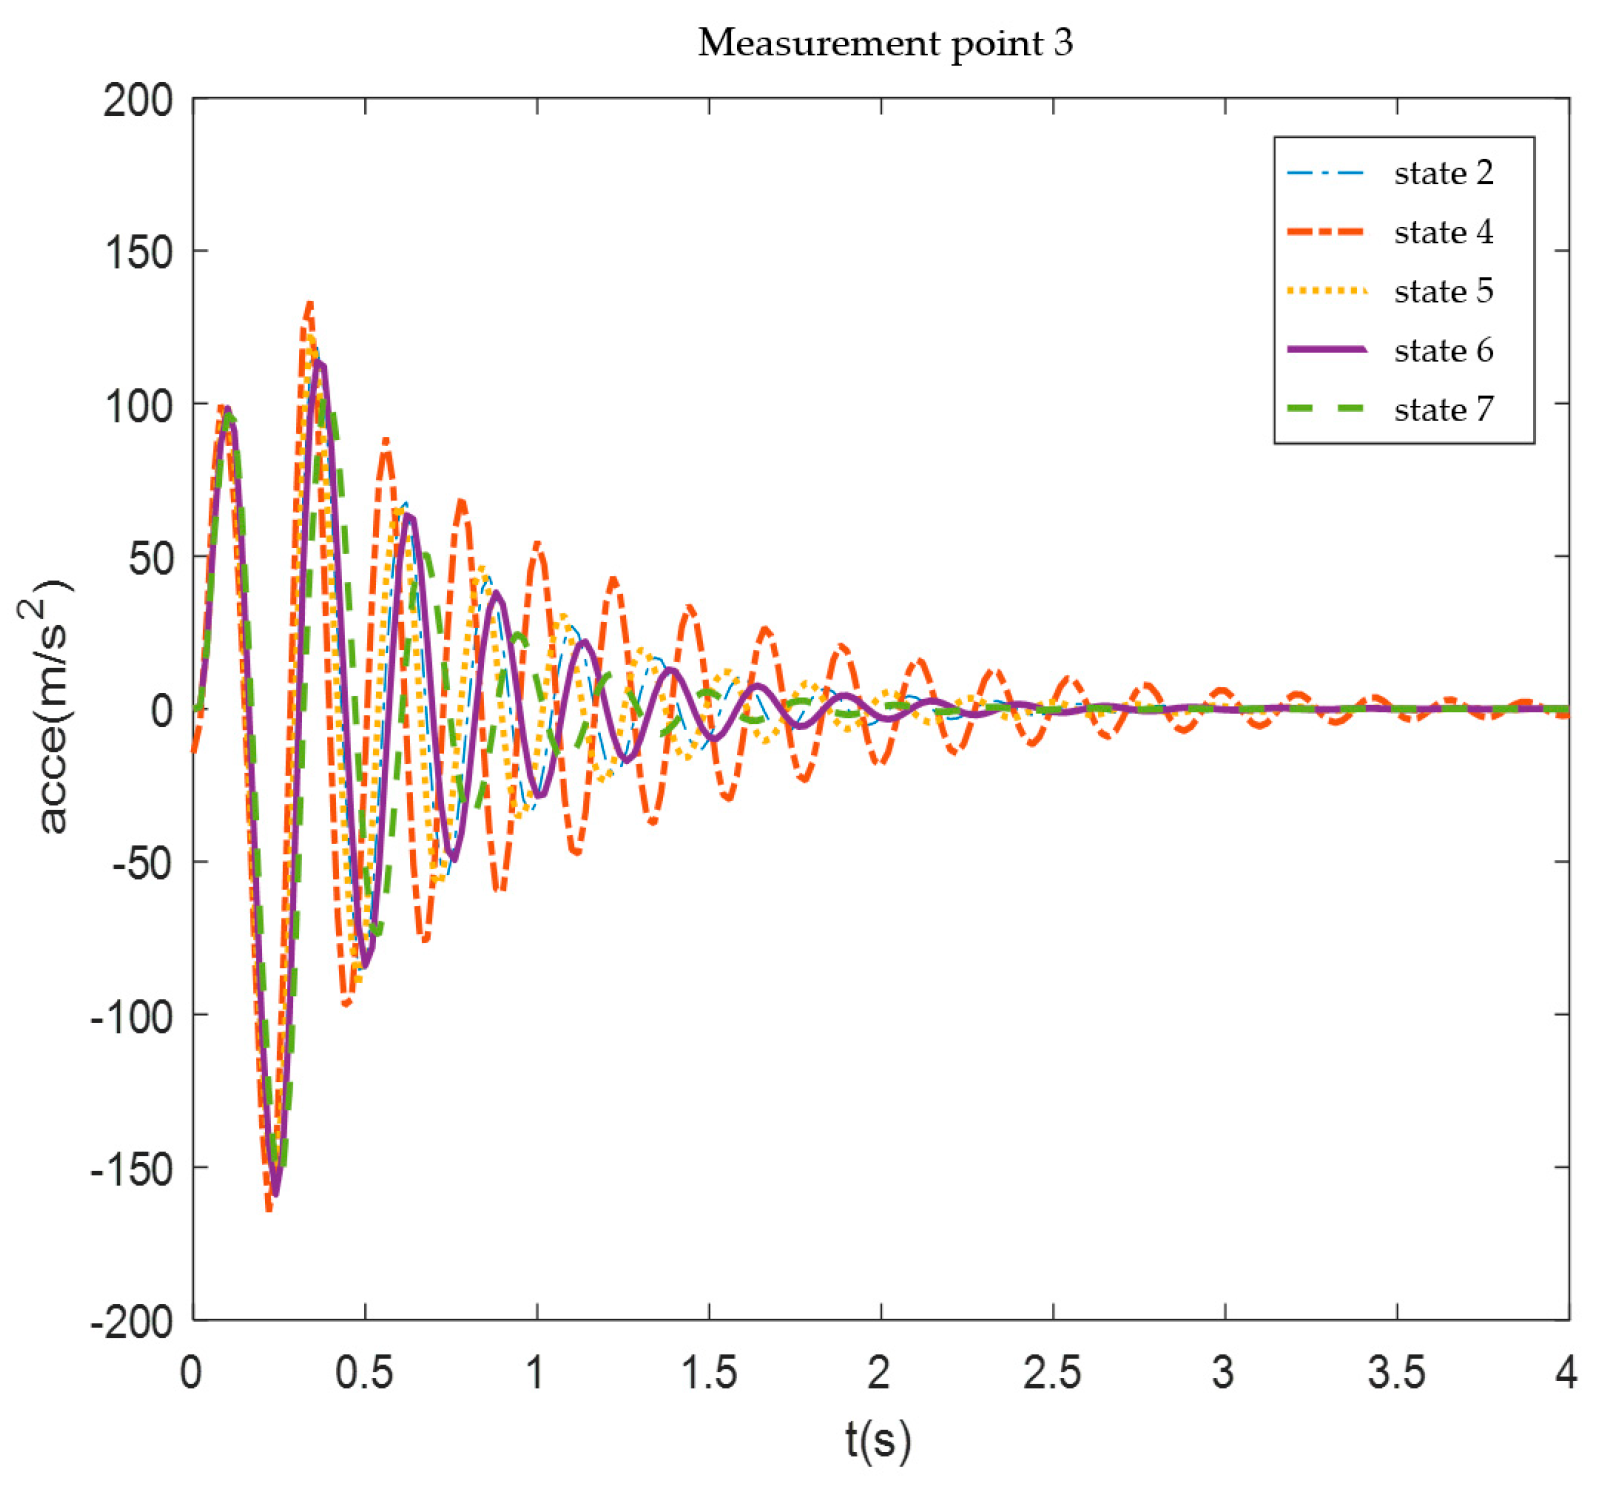
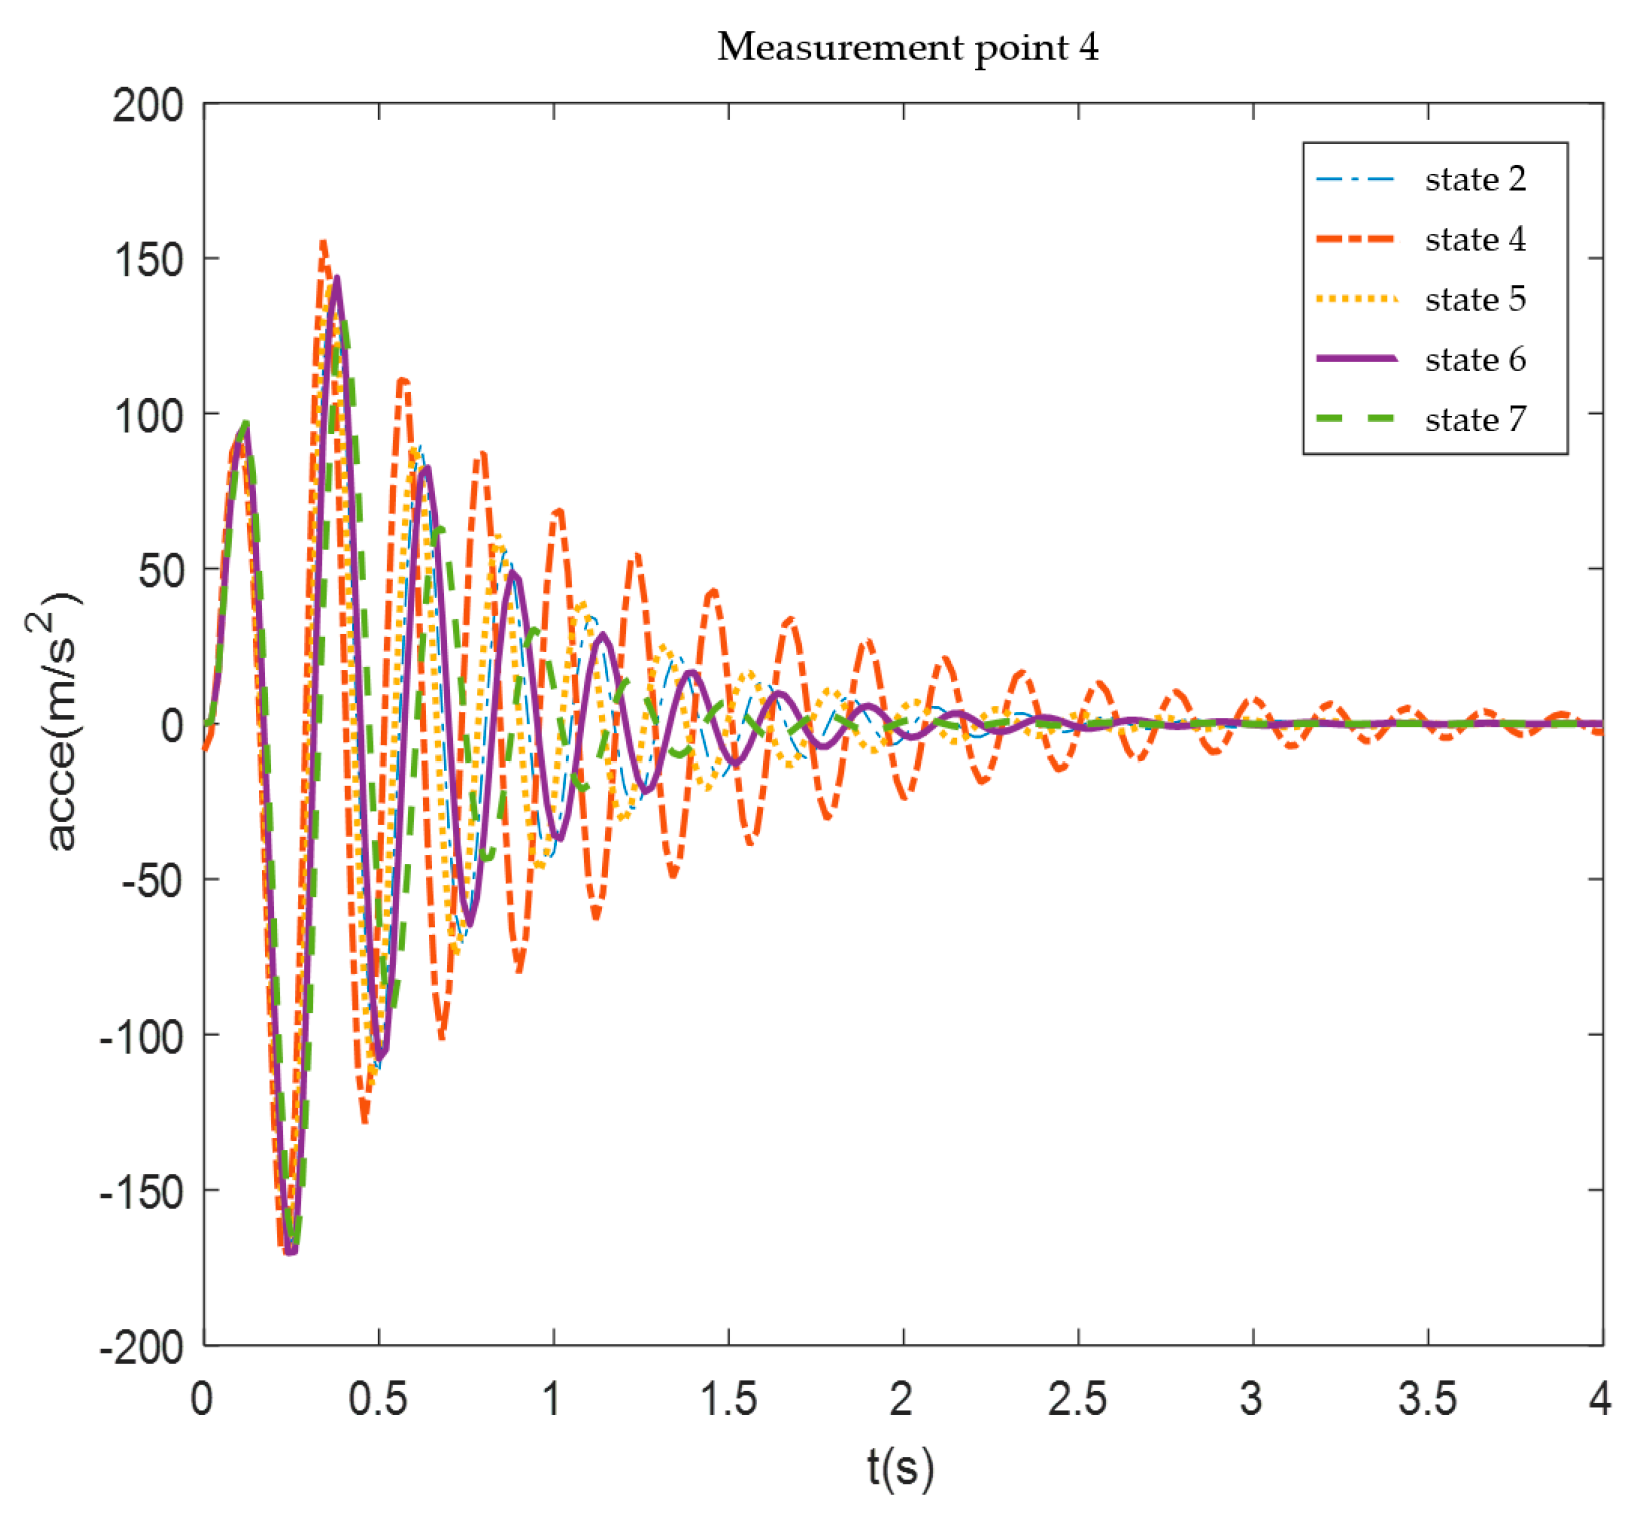
It can be seen from Figure 20, Figure 21, Figure 22 and Figure 23 that increasing the CS mass results in an increase in the total peak gust acceleration response of the structure, with the peak appearing later and the response lasting longer. For the existing high-aspect-ratio aircraft flying-wing design, the total mass increase or decrease requires the redesign of the existing scheme, so the next consideration is to adjust the mass distribution of the four CS masses (States 2, 4, 5, 6, and 7), while keeping the total mass unchanged, and observe its effect on the gust response. The results of the calculations are shown in Figure 24, Figure 25, Figure 26 and Figure 27.
It can be found that the CS mass distribution has a significant effect on the gust response, with an increase in the mass of State 3 and State 4 significantly reducing the peak gust response of the structure without affecting the total mass. A 150 g increase in CS mass results in a 15–22% increase in peak response acceleration and a 25–30% increase in response duration, while redistributing mass to the outboard CS reduces the peak response by 18–26% while keeping the total mass consistent.

6. Conclusions

A flying-wing model with two pairs of cracked CS was designed in this paper. Dynamic characteristics of the present model were investigated using both GVT experiments and numerical simulations. Different boundary conditions were employed, and different mass distributions of CS in the wing were discussed. The following conclusions can be made:
(1)
To address the structural geometric characteristics of high-aspect-ratio aircraft, a finite element model was developed for dynamic analysis of the wing structure. The model was validated and refined through integration with GVT results, demonstrating enhanced simulation accuracy;
(2)
For the high-aspect-ratio wing configuration, variations in root boundary conditions substantially influence structural mode truncation and induce notable discrepancies in natural frequency distributions;
(3)
Increased CS mass elevates the global peak gust-induced acceleration response, delays the peak response occurrence, and prolongs response duration. The distribution of CS mass significantly affects the gust response characteristics of the flying-wing configuration. Under constant total mass conditions, increasing mass allocations to inside CS (i.e., CS 3 and CS 4 in Figure 14) substantially reduces the peak gust response of the present wing.
Cracked control surfaces can be optimized using many concepts for different design targets of flying-wing aircraft. The results in this paper provide a methodological foundation for cracked control surfaces in flying-wing configurations. If control surface optimization could be used in future designs of novel flying-wing aircraft, expensive wind tunnel experiments can be conducted for actual aircraft products.

Author Contributions

Conceptualization, Y.B. and M.W.; methodology, M.W. and Y.B.; software, X.H.; validation, M.W. and X.H.; writing—review and editing, Y.B. and S.Z. All authors have read and agreed to the published version of the manuscript.

Funding

This research received no external funding.

Data Availability Statement

The original contributions presented in the study are included in the article, further inquiries can be directed to the corresponding author.

Conflicts of Interest

The authors declare no conflict of interest.

References

  1. Hoblit, F. Gust Loads on Aircraft: Concepts and Applications. AIAA 1988, 2, 1–6. [Google Scholar] [CrossRef]
  2. Yu, J.; Zhao, D.; Sun, L.; Yang, X.; Zhang, P.; Wu, S. Research on the Test Technology of Gust Load Alleviation in Large Low-Speed Wind Tunnel. CASTC 2024, 1, 179–188. [Google Scholar] [CrossRef]
  3. Nguyen, N.T.; Xiong, J.; Cramer, N.B. Simulation and Modeling of Flow Generated by Gust Generator in a Wind Tunnel. AIAA SciTech. 2020, 34. [Google Scholar] [CrossRef]
  4. Zhao, D.; Yang, Z.; Zeng, X.; Yu, J.; Gao, Y. Wind tunnel test of gust load alleviation for a large-scale full aircraft model. Chin. J. Aeronaut. 2023, 36, 201–216. [Google Scholar] [CrossRef]
  5. Yi, Z.; Yang, Y.; Zhi, W.; Chao, Y. Flight test for gust alleviation on a high aspect ratio UAV platform. Acta Aeronaut. Astronaut. Sin. 2022, 43, 319–330. [Google Scholar] [CrossRef]
  6. Shu, S.; Yasuhiro, T.; Shigeru, A. An Experimental Study on Passive Ventilation Wing with Porous Surfaces for Gust Load Alleviation. AIAA SciTech. 2019, 9. [Google Scholar] [CrossRef]
  7. Sasidharan, A.; Ratna, V.; Venkata, O. Aerodynamic characteristics of an aerostat under unsteady wind gust conditions. Aerosp. Sci. Technol. 2021, 113, 106684. [Google Scholar] [CrossRef]
  8. Masrour, J.; Sadati, H.; Shahravi, M. Gust response analysis based on a nonlinear structural model and the unsteady aerodynamics of a flexible aircraft. Aircr. Eng. Aerosp. Technol. 2023, 95, 899–911. [Google Scholar] [CrossRef]
  9. Yang, Z.; Yang, C.; Wen, D.; Zhou, W.; Wu, Z.A. Time-Domain Calculation Method for Gust Aerodynamics in Flight Simulation. Aerospace 2024, 11, 583. [Google Scholar] [CrossRef]
  10. Wu, Z.; Hölling, M. Special Issue Gust Influences on Aerospace. Aerospace 2024, 11, 696. [Google Scholar] [CrossRef]
  11. Zhu, H.; He, X.; Zhang, Y.; Cheng, D.; Wang, Z.; Huang, Y.; Tan, H. Investigation of the Internal Flow Characteristics of a Tiltrotor Aircraft Engine Inlet in a Gust Environment. Aerospace 2024, 11, 342. [Google Scholar] [CrossRef]
  12. Majumdar, D.; Bose, C.; Sarkar, S.S. Capturing the dynamical transitions in the flow-field of a flapping foil using Immersed Boundary Method. J. Fluids Struct. 2020, 95, 102999. [Google Scholar] [CrossRef]
  13. Nesrin, S.; Martinus, M.; Sarigul, K. Analysis of OH-6A Helicopter Flight Test Data Using Lissajous Figures. J. Aircraft. 1997, 34, 20–22. [Google Scholar] [CrossRef]
  14. Li, Y.; Qin, N. Gust load alleviation on an aircraft wing by trailing edge Circulation Control. J. Fluids Struct. 2021, 107, 103407. [Google Scholar] [CrossRef]
  15. Zhang, L.; Zhao, Y. Adaptive Feed-Forward Control for Gust Load Alleviation on a Flying-Wing Model Using Multiple Control Surfaces. Aerospace 2023, 10, 981. [Google Scholar] [CrossRef]
  16. Qiu, Q.; Wu, Z.; Yang, C. An equivalent emulation method of gust response for flight tests. Aerosp. Sci. Technol. 2023, 142, 108649. [Google Scholar] [CrossRef]
  17. Li, Y.; Qin, N. Airfoil gust load alleviation by circulation control. Aerosp. Sci. Technol. 2020, 98, 105622. [Google Scholar] [CrossRef]
  18. Yue, C.; Zhao, Y. Active disturbance rejection controller design for alleviation of gust-induced aeroelastic responses. Aerosp. Sci. Technol. 2023, 133, 108116. [Google Scholar] [CrossRef]
  19. Hea, T.; Su, W. Robust control of gust-induced vibration of highly flexible aircraft. Aerosp. Sci. Technol. 2023, 143, 108703. [Google Scholar] [CrossRef]
  20. Wu, Z.; Zhang, T.; Gao, Y.; Tan, H. Development of a Novel Small-Scale Gust Generator Research Facility. Aerospace 2024, 11, 95. [Google Scholar] [CrossRef]
  21. Salazar, S.; Flores, J.; González-Hernández, I.; Rosales, Y.; Lozano, R. Robust Control for a Slung-Mass Quadcopter Under Abrupt Velocity Changes. Appl. Sci. 2024, 14, 11592. [Google Scholar] [CrossRef]
  22. Toffol, F. A Comparative Analysis of Active Control vs. Folding Wing Tip Technologies for Gust Load Alleviation. Appl. Sci. 2024, 14, 9883. [Google Scholar] [CrossRef]
  23. Niu, Y.; Yang, W.; Huang, W. Gust response alleviation of the aircraft wing aeroelastic systems in supersonic flows using nonlinear energy sink. Aerosp. Sci. Technol. 2024, 155, 109601. [Google Scholar] [CrossRef]
  24. Yang, Y.; Yang, C.; Wu, Z. Aeroelastic dynamic response of elastic aircraft with consideration of two-dimensional discrete gust excitation. Chin. J. Aeronaut. 2020, 33, 1228–1241. [Google Scholar] [CrossRef]
  25. Yuan, W.; Zhang, X.; Dominique, P.; Alanna, W. Numerical modelling of aerodynamic response to gusts and gust effect mitigation. Aerosp. Sci. Technol. 2024, 154, 109467. [Google Scholar] [CrossRef]
  26. Junaid, U.; Thorsten, L.; Lorenz, K.; Rolf, R.; Jochen, W.; Ralf, H. Approach for Aerodynamic Gust Load Alleviation by Means of Spanwise-Segmented Flaps. J. Aircr. 2023, 60, 835–856. [Google Scholar] [CrossRef]
  27. Gao, W.; Liu, Y.; Li, Q.; Lu, B. Gust load alleviation of a flexible flying wing with linear parameter-varying modeling and model predictive control. Aerosp. Sci. Technol. 2024, 155, 109671. [Google Scholar] [CrossRef]
  28. Zhou, Y.; Wu, Z.; Yang, C. Study of Gust Calculation and Gust Alleviation: Simulations and Wind Tunnel Tests. Aerospace 2023, 10, 139. [Google Scholar] [CrossRef]
  29. Cheung, R.C.M.; Rezgui, D.; Cooper, J.E.; Wilson, T. Testing of Folding Wingtip for Gust Load Alleviation of Flexible High-Aspect-Ratio Wing. J. Aircr. 2020, 57, 876–888. [Google Scholar] [CrossRef]
  30. Versiani, T.d.S.S.; Silvestre, F.J.; Neto, A.B.G.; Rade, D.A.; Silva, R.G.A.d.; Donadon, M.V.; Bertolin, R.M.; Silva, G.C. Gust load alleviation in a flexible smart idealized wing. Aerosp. Sci. Technol. 2019, 06, 762–774. [Google Scholar] [CrossRef]
  31. Nhan, T.; Kelley, E. Multi-Objective Flight Control for Ride Quality Improvement for Flexible Aircraft. AIAA SciTech. 2020, 1623. [Google Scholar] [CrossRef]
  32. Zhiwei, J.; Zhen, T.; Zongtuan, H. Discrete gust load analysis of transport airdrop. Aircr. Des. 2019, 39, 35–38. [Google Scholar] [CrossRef]
  33. Dowell, E.H.; Crawley, E.F.; Curtiss, H.C. A Modern Course in Aeroelasticity; Springer: Dordrecht, The Netherlands, 2005. [Google Scholar] [CrossRef]
Figure 1. Geometry design of the present wing model (i.e., there are four wing cs in the present wing).
Aerospace 12 00807 g001
Figure 2. High-aspect-ratio wing model.
Aerospace 12 00807 g002
Figure 3. Physical drawing of wing girder and rib structure.
Aerospace 12 00807 g003
Figure 4. Physical drawing of wing interior filled with EPS foam.
Aerospace 12 00807 g004
Figure 5. Photograph of the assembled high-aspect-ratio aircraft wing.
Aerospace 12 00807 g005
Figure 6. Finite element model of the high-aspect-ratio aircraft wing. (i.e., different colors mean different skin partitions).
Aerospace 12 00807 g006
Figure 7. Schematic diagram of the impact hammer modal testing principle.
Aerospace 12 00807 g007
Figure 8. Layout of model measurement points.
Aerospace 12 00807 g008
Figure 9. Layout of measurement points on site and installation of the LMS system.
Aerospace 12 00807 g009
Figure 10. Comparison of the modes under the fixed boundary condition obtained by numerical simulation (left) and experiment (right).
Aerospace 12 00807 g010
Figure 11. Ground-mounted mechanism for the release of two degrees of freedom.
Aerospace 12 00807 g011
Figure 12. Sensor mounting and measurement point layout.
Aerospace 12 00807 g012
Figure 13. Comparison of the modes under the boundary with two-degrees-of-freedom release, as obtained by numerical simulation (left) and experiment (right).
Aerospace 12 00807 g013
Figure 14. CS distribution.
Aerospace 12 00807 g014
Figure 15. Comparison of the modes of different CS mass states under fixed boundary conditions: (a) State 1, (b) State 2, (c) State 3, (d) State 4, (e) State 5, (f) State 6, and (g) State 7.
Aerospace 12 00807 g015aAerospace 12 00807 g015b
Figure 16. Comparison of the modes of different CS mass states under the boundary condition with two-degrees-of-freedom release: (a) State 1, (b) State 2, (c) State 3, and (d) State 4.
Aerospace 12 00807 g016aAerospace 12 00807 g016b
Figure 17. Comparison of the modes under different boundary conditions of different mass states: (a) State 1, (b) State 2, (c) State 3, (d) State 4, (e) State 5, (f) State 6, and (g) State 7.
Aerospace 12 00807 g017aAerospace 12 00807 g017b
Figure 18. 1-cos discrete gust velocity profile.
Aerospace 12 00807 g018
Figure 19. Acceleration response measurement points.
Aerospace 12 00807 g019
Figure 20. Acceleration response of point 1.
Aerospace 12 00807 g020
Figure 21. Acceleration response of point 2.
Aerospace 12 00807 g021
Figure 22. Acceleration response of point 3.
Aerospace 12 00807 g022
Figure 23. Acceleration response of point 4.
Aerospace 12 00807 g023
Figure 24. Measurement point 1 acceleration response.
Aerospace 12 00807 g024
Figure 25. Measurement point 2 acceleration response.
Aerospace 12 00807 g025
Figure 26. Measurement point 3 acceleration response.
Aerospace 12 00807 g026
Figure 27. Measurement point 4 acceleration response.
Aerospace 12 00807 g027
Table 1. Main parameters of the high-aspect-ratio wing model.
AssembliesMassMaterial
CS0.6 kg7075 Al
Girder10.4 kg7075 Al
Skin0.184 kgCarbon Fiber-Reinforced Epoxy
Filler0.47 kgEPS
Total mass11.654 kg
Table 2. Types and numbers of mesh in each section.
ComponentsTypeNumber of Mesh
SkinFour-node shell element2196
Girder and ribFour-node shell element577
FillerSolid hexahedral element1887
CSFour-node shell element298
Table 3. Comparison of the natural frequencies obtained by numerical simulation and experiment under the fixed boundary condition.
ModeSimulated Frequency (Hz)Experimental Frequency (Hz)DescriptionRelative Error
13.613.52First bending2.8%
29.919.77First torsion1.5%
317.9519.28Second bending6.8%
Table 4. Comparison of the frequencies under the boundary with two-degrees-of-freedom release obtained by numerical simulation and experiment.
ModeSimulated Frequency (Hz)Experimental Frequency (Hz)Descriptions
13.763.54First bending
210.229.93First torsion
320.4919.82Second bending
Table 5. CS mass adding state.
StateCS 1CS 2CS 3CS 4
State 1−150 g−150 g−150 g−150 g
State 2 (base state)0 g0 g0 g0 g
State 3150 g150 g150 g150 g
State 4150 g150 g−150 g−150 g
State 5150 g−150 g150 g−150 g
State 6−150 g150 g−150 g150 g
State 7−150 g−150 g150 g150 g
Table 6. Comparison of the frequencies of different CS mass states obtained by simulation and experiment frequency under fixed boundary conditions.
StateFirst Bending (Hz)First Torsion (Hz)Second Bending (Hz)
SimulatedExperimentalSimulatedExperimentalSimulatedExperimental
State 13.763.5410.229.9320.4919.82
State 23.613.529.919.7717.9519.28
State 33.493.349.669.5918.5218.43
State 43.503.289.678.5518.6518.39
State 53.563.399.819.1818.1218.95
State 63.683.5110.079.3718.6318.40
State 73.753.6210.2210.4119.2219.12
Table 7. Variable parameter GVT test conditions.
StateCS 1CS 2CS 3CS 4
State 2+0 g0 g0 g0 g
State 4+150 g150 g−150 g−150 g
State 5+150 g−150 g150 g−150 g
State 7+−150 g−150 g150 g150 g
Table 8. Comparison of the frequencies obtained by simulation and experiment under the boundary condition with two-degrees-of-freedom release.
StateFirst Bending (Hz)First Torsion (Hz)Second Bending (Hz)
SimulatedExperimentalSimulatedExperimentalSimulatedExperimental
State 2+3.763.5410.229.9320.4919.82
State 4+3.613.529.919.7717.9519.28
State 5+3.493.349.669.5916.5218.43
State 7+3.503.288.678.5517.6518.39
Table 9. Comparison of the frequency of different states under fixed and released two-degrees-of-freedom conditions.
StateFirst Bending (Hz)First Torsion (Hz)Second Bending (Hz)
FixedRelease Two Degrees of FreedomFixedRelease Two Degrees of FreedomFixedRelease Two Degrees of Freedom
State 13.766.0510.2211.1920.4917.26
State 23.615.859.9110.7817.9519.62
State 33.495.669.6610.4516.5218.43
State 43.505.999.6710.4816.6518.39
State 53.565.859.8110.6918.1219.81
State 63.685.8610.0710.9217.6319.32
State 73.755.7410.2211.1520.2217.25
Table 10. Computational conditions for gust response.
Calculated VariablesValue
Altitude0 km
Mach0.2
Gust speed16.46 m/s
Gust size10.0 m
Disclaimer/Publisher’s Note: The statements, opinions and data contained in all publications are solely those of the individual author(s) and contributor(s) and not of MDPI and/or the editor(s). MDPI and/or the editor(s) disclaim responsibility for any injury to people or property resulting from any ideas, methods, instructions or products referred to in the content.