Article

Effect of Quasi-Static Door Operation on Shear Layer Bifurcations in Supersonic Cavities †

1
Department of Mechanical and Aerospace Engineering, The Ohio State University, Columbus, OH 43210, USA
2
Florida Center for Advanced Aero-Propulsion (FCAAP), FAMU-FSU College of Engineering, Tallahassee, FL 32310, USA
3
AFRL/RQVI, Air Force Research Laboratory, Dayton, OH 45433, USA
4
AFRL/RQVA, Air Force Research Laboratory, Dayton, OH 45433, USA
*
Author to whom correspondence should be addressed.
This paper is an extended version of our paper published in Baugher, S.K.; Outten, B.; Gaitonde, D.V.; Kumar, R. 3D Effects of Quasi-Static Door Opening on Supersonic. In Proceedings of the AIAA SCITECH 2024 Forum, Orlando, FL, USA, 8–12 January 2024.
Aerospace 2025, 12(8), 668; https://doi.org/10.3390/aerospace12080668
Submission received: 28 June 2025 / Revised: 21 July 2025 / Accepted: 22 July 2025 / Published: 26 July 2025
(This article belongs to the Section Aeronautics)

Abstract

Span-wise homogeneous supersonic cavity flows display complicated structures due to shear layer breakdown, flow acoustic resonance, and even non-linear hydrodynamic-acoustic interactions. In practical applications, such as aircraft bays, the cavity is of finite width and has doors, both of which introduce distinctive phenomena that couple with the shear layer at the cavity lip, further modulating shear layer bifurcations and tonal mechanisms. In particular, asymmetric states manifest as ‘tornado’ vortices with significant practical consequences on the design and operation. Both inward- and outward-facing leading-wedge doors, resulting in leading edge shocks directed into and away from the cavity, are examined at select opening angles ranging from 22.5 ° to 90 ° (fully open) at Mach 1.6. The computational approach utilizes the Reynolds-Averaged Navier–Stokes equations with a one-equation model and is augmented by experimental observations of cavity floor pressure and surface oil-flow patterns. For the no-doors configuration, the asymmetric results are consistent with a long-time series DDES simulation, previously validated with two experimental databases. When fully open, outer wedge doors (OWD) yield an asymmetric flow, while inner wedge doors (IWD) display only mildly asymmetric behavior. At lower door angles (partially closed cavity), both types of doors display a successive bifurcation of the shear layer, ultimately resulting in a symmetric flow. IWD tend to promote symmetry for all angles observed, with the shear layer experiencing a pitchfork bifurcation at the ‘critical angle’ ( 67.5 ° ). This is also true for the OWD at the ‘critical angle’ ( 45 ° ), though an entirely different symmetric flow field is established. The first observation of pitchfork bifurcations (‘critical angle’) for the IWD is at 67.5 ° and for the OWD, 45 ° , complementing experimental observations. The back wall signature of the bifurcated shear layer (impingement preference) was found to be indicative of the 3D cavity dynamics and may be used to establish a correspondence between 3D cavity dynamics and the shear layer. Below the critical angle, the symmetric flow field is comprised of counter-rotating vortex pairs at the front and back wall corners. The existence of a critical angle and the process of door opening versus closing indicate the possibility of hysteresis, a preliminary discussion of which is presented.

1. Introduction

Cavity flows arise in a vast array of engineering applications, including landing gear wells, flame holders, weapons bays, and various other commercial and military applications [1,2]. Flow-acoustic interactions are a significant contributor to noise and dynamic loading, which can cause equipment damage [3]. These flows have thus been the subject of research for many decades [4], with various control strategies having been proposed and explored [5], including both passive [6,7] and active techniques [8].
Most studies [9,10] to date have examined nominally 2D cavity dynamics, i.e., of large spanwise extent (or periodic boundary conditions) and without doors [11,12,13]. The primary dynamics of such cavities are summarized in Figure 1 for a supersonic (Mach 1.6 ) open rectangular cavity along a streamwise plane.
The incoming boundary layer separates at the upstream edge of the cavity, forming a shear layer, which breaks down into large-scale vortical structures due to the Kelvin–Helmholtz (K-H) instability. These vortical structures then impinge on the downstream wall and push fluid into the cavity, generating the primary recirculation region (white arrow) and secondary 3D structures such as the front vortex (blue arrow). Upstream traveling acoustic waves are also generated that excite the shear layer; these perturbations then reflect (changing direction) back downstream to yield a self-sustained resonance named the Rossiter tones [4]. The dynamics of the cavity shown in Figure 1 are often discussed in the context of the semi-empirical Rossiter model [4], which highlights the principal dynamics of interest. A commonly used modern modified version of the Rossiter formula, written in terms of Strouhal number, is as follows [14]:
S t L = f L u = n α 1 k c + η , η = M / 1 + 0.5 r ( γ 1 ) M 2
In Equation (1), n is the mode number, the shear layer convection speed is k c , η is a correction for the speed of sound in the cavity with recovery factor r, and α is a phase lag. The expression has proven very successful at predicting the frequencies (but not amplitudes) of possible resonant tones in 2D cavities in a manner that is generally similar to its impinging jet counter part, Powell’s formula [15].
Though useful in characterizing the effects of acoustic feedback mechanisms, the accuracy of the formula degrades under certain circumstances. Even spanwise homogeneous cavity flows at lower speed (and Reynolds number) can display variations from the Rossiter model with under-prediction of pressure fluctuation amplitudes [10,12] as well as spectra [9]. Some acoustic mechanisms are known to be coupled to recirculating structures in the cavity, which can change profoundly depending on flow conditions [16,17] and introduce pertinent changes that are not accounted for in the derivation and reduce accuracy. These include intermittent events, non-linear interactions within and bistability of the shear layer and 3D cavity motions [18]. Other discrepancies arise at higher Mach numbers [19,20], such as the source of upstream and downstream traveling waves that constitute the Rossiter tones [21], and the change in the shear layers’ role as a resonator [22].
Realistic cavities are of finite width ( W c a v ), and of finite length (L) and depth (D), and introduce 3D effects that can vary with aspect ratio, Reynolds number, Mach number, and geometric constrictions. Tone selection is in fact a function of cavity width [23,24]. The temporal [18] and spatial [17,25,26,27] modulation of the tones has been attributed to 3D effects. There is also substantial interest in understanding the genesis of Rossiter tones themselves [19]. Overall, since 3D phenomena substantially alter cavity dynamics, their effects are crucial in applications such as store release [28,29,30].
One phenomenon of particular interest in finite-width cavities is the occurrence of asymmetric patterns even in the mean sense, sometimes characterized by ‘tornado’ vortices [31,32] with axes generally perpendicular to the cavity floor. Note that in a flipped (upside-down) cavity configuration, the cavity floor would be referred to as the cavity ceiling. Though counter-intuitive, asymmetric flow phenomena in a symmetric geometry is actually common across many geometries, and has been addressed in a recent review of asymmetric flow in symmetric configurations [33]. Relatively few studies have explored this behavior, possibly due to the specific required initial conditions or the very low accompanying frequencies [31].
In particular, ultra-low frequency motions over two orders of magnitude lower than the Rossiter tones have been observed. These appear together with spanwise asymmetry attributed to a bistable state of the incoming shear layer. In a simulation of large width and shallow depth (L:D:W → 1:0.2:0.42), the spanwise asymmetry manifested in the shear layer impingement preference on the back wall [13]. Bistablity in shear layers arises in a number of configurations from 3D backward facing steps [34], 3D double back steps [35], bluff bodies [36], channel flows [37], cars [38] and warships [34]. For example, in a 3D backward-facing step, the shear layer switches between two preferential lobes identified with the pressure gradient [34,36]. Similar results were found with a bluff body, where with an increasing Reynolds number, the shear layer became “tristable” and the shear layer switched between three preferred states [36]. A more general terminology assigns successive pitchfork bifurcations at critical parameters. In the double backward facing step [35], the height of the second step can be adjusted to introduce or eliminate asymmetry.
In the present cavity case, the manifestation of bistability and asymmetry, and its effects, change drastically with aspect ratios, including open shallow narrow cavities, such as in the low speed water and air experiments of Crook et al. [31], where a single tornado vortex formed, and higher speed Mach 0.9 simulations of Yong et al. [39], where two tornado vortices formed near the upstream wall, and experience several forms of vortex breakdown and wandering, similar to those in atmospheric tornadoes [40]. At a supersonic Mach numbers, M = 1.5, a third weaker tornado vortex formed, which interacted with the others and displayed slow span-wise wandering [39]. Multiple tornado vortices are frequently observed, depending on both the cavity width and Mach number, similar to the bistable to tristable state transition observed in the 3D backward-facing step [34].
Other studies for larger width cavities have found similar spanwise asymmetry and low frequency spanwise motion ( S t 10 3 ) [41,42,43]; however, there is no report of the formation of a tornado vortex. In these cases, a spanwise to depth ratio of W c a v D > 6 contains a similar spanwise motion in the Taylor–Görtler like vortices near the back wall [41]. The stability analyses performed in the above wide cavities were generally unable to fully capture these low frequencies, in part due to the computational requirements.
A second complication in practical finite-width cavities is the introduction of doors and various associated geometrical aspects such as hinges. Although less commonly studied, partial results are available on cavities with both traditional (doors swing outwards) as well as sliding doors [44,45,46,47]. Doors change both the dominant Rossiter tone frequencies and sound pressure levels. For the present work, we consider both inner wedge doors (IWD) and outer wedge doors (OWD) depending on the form of the leading edge of the door. In the former, IWD, the wedge is arranged so that the shock originating at the leading edge propagates into the cavity, while for OWD, the shock propagates away from them. As an example result, the outer wedge doors (OWD) change the observed tones and increase sound pressure levels by nearly 20 dB [46]. Similar deviations from the Rossiter model have also been measured on sliding door cavities [45] with shifts towards higher or lower frequencies depending on the tone and extent of door opening.
Casper et al. [48] performed a parametric study of cavities at a range of Mach numbers with features found in aircraft by considering shaped inlets, structural intricacy inside the cavity as well as doors. The higher severity of loads was manifest in different regions of the flow, including the downstream walls. Other efforts have also discerned similar behavior. A numerical study using Detached-Eddy Simulations (DES) at Mach 0.85 [49] considered an inclined downstream wall as a form of control as well as doors. The former greatly reduced shear layer instability, tone generation and sound pressure levels in the domain. The results with doors were less distinctive. Recent experimental results [46] are generally consistent with those of Casper et al. [48], in that doors increased the loading and sound levels relative to the no-doors configuration, though the degree to which this happens depends on the actual door opening angle.
The current literature indicates that the dynamics of finite-width cavities, especially with doors, remain relatively poorly understood. The goal of the present work is to build on those of Baugher et al. [50] and examine 3D supersonic cavity dynamics with doors as the door angle is changed such as during the opening or closing process. We use a cavity with L:D:W→ 4.5:1:1 and consider both IWD and OWD geometries with varying door angles to explore the modulation of the bistability and its preferred impingement region on the back wall. The approach is to examine the 3D structures for each studied configuration and to extract any common themes between them in terms of preferred streamline impingement and subsequent upstream convective features on the cavity floor, resulting in an upstream forming tornado vortex system(s) that re-entrains into the shear layer. In particular, we delineate the behavior of the bifurcated shear layer and 3D cavity dynamics associated with doors at different levels of door opening.
Details on the geometries, experimental and simulation inflow conditions are provided in Section 2.1. A one-equation Reynolds Averaged Navier–Stokes (RANS) [51] approach in conjunction with experimental observations [52]. This combination facilitates investigation of 3D structures for various door opening parameters that would otherwise be computationally prohibitive using time-accurate methods, such as those by Turpin et al. [32]. The solution methods, including algorithms, meshes, and boundary conditions, are presented in Section 2.2. For reference, pertinent background information is presented for the no-doors cavity in Section 3.1. Results for IWD and OWD are divided into two regimes based on the angle of door opening. The fully open IWD and OWD (opening angle of 90 ° relative to the fuselage), are presented in Section 3.2. The effect of reducing the door angle (door closing) is presented in Section 3.3, which introduces a ‘critical angle’, on either side of which the flow displays distinctively different behavior. Conclusions and future work are discussed in Section 4.

2. Methodology

2.1. Configurations

The simulations of this work are patterned after the experimental results from Florida State University (FSU) for both the IWD and OWD [46] obtained in the Polysonic Wind Tunnel (PSWT) at the Florida Center for Advanced Aero-Propulsion (FCAAP). Although the PSWT offers a wide range of parameters, here we select the conditions closest to desired flight conditions [52] listed in Table 1: Mach 1.6, with a R e m = 30 × 10 6 and stagnation pressure of 20.6 kPa.
As noted earlier, the leading edges of the doors are comprised of one-sided wedges with OWDs deflecting the shocks outwards, away from the cavity, while IWD shocks deflect inwards, between the doors and interact with the shear layer and cavity region. The geometries of the IWD and OWD configurations in accordance with Table 1 are shown in Figure 2a,b, respectively. X, Y and Z denote the streamwise, spanwise and vertical directions, respectively, with the corresponding velocity components denoted as U, V and W. All geometries were designed with a length-to-depth ratio of L D = 4.5 , and a width-to-depth ratio, W c a v D = 1 . The wedge door height was set to h = 0.5 D and thickness 0.125 D . The cavity leading edge is placed at X / D = 0.0 and the trailing edge is at X / D = 4.5 , with spanwise edges at Y / D = 0.5 (left/port side) and Y / D = 0.5 (right/starboard side). The cavity waterline occurs at Z / D = 0.0 (fuselage), cavity floor at Z / D = 1.0 and the top of the doors at Z / D = 0.5 when fully open. Different door opening angles are considered: examples for the OWD are presented in Figure 2c for four cases corresponding to 90 ° (fully open), 67.5 ° , 45 ° and 22.5 ° used Computer Aided Design (CAD). Note that results are shown only for selected angles, with significant quantitative and qualitative changes to the flow topology at a critical angle.

2.2. Computational Methodology

Simulations were performed using the OVERFLOW code version 2.3d [53,54], which solves the full 3D Navier–Stokes equations in curvilinear coordinates:
τ q J + F ^ ξ + G ^ η + H ^ ζ = 1 R e F ν ^ ξ + G ν ^ η + H ν ^ ζ
for a single gaseous species (air). The conservative state vector can be represented as q = [ ρ , ρ u , ρ v , ρ w , ρ E 0 ] T and J is the Jacobian of the curvilinear transformation given by J = ( ξ , η , ζ , τ ) ( x , y , z , t ) [55]. Reynolds Averaged Navier–Stokes (RANS) computations were performed by calculating an eddy viscosity and constructing the stress tensor:
τ i j R A N S = ρ u i u j ˜ = μ t S i j
where S i j are the known strain rates in the flow obtained from computations, and μ t is the eddy viscosity. The Spalart–Allmaras (SA) turbulence model [51] was employed to calculate the eddy viscosity:
D ν t ˜ D t = C b 1 ( 1 f t 2 ) S ˜ ν t ˜ C w 1 f w C b 1 k 2 f t 2 ( ν t ˜ d ) 2 + 1 σ x i ( ν + ν t ˜ ) ν t ˜ x i + C b 2 ν t ˜ x i ν t ˜ x i
Spatial discretization was performed using a low-dissipative fifth-order WENO5M mapping scheme [56] along with an upwind-biased HLLE++ flux scheme [57] for the inviscid fluxes, while a second-order central scheme is used for the viscous terms. Simulations were initiated with a CFL ramp from 0.5 to 2.5, after which it was held constant. Between 1200 and 2500 cores were used for the nominal and fine meshes, respectively, along with grid sequencing on two levels with 5000 iterations per level to accelerate convergence. After grid sequencing, the simulations were continued until the residual ( L 2 norm of the right-hand side) reached 10 6 or fell below prior to post-processing.
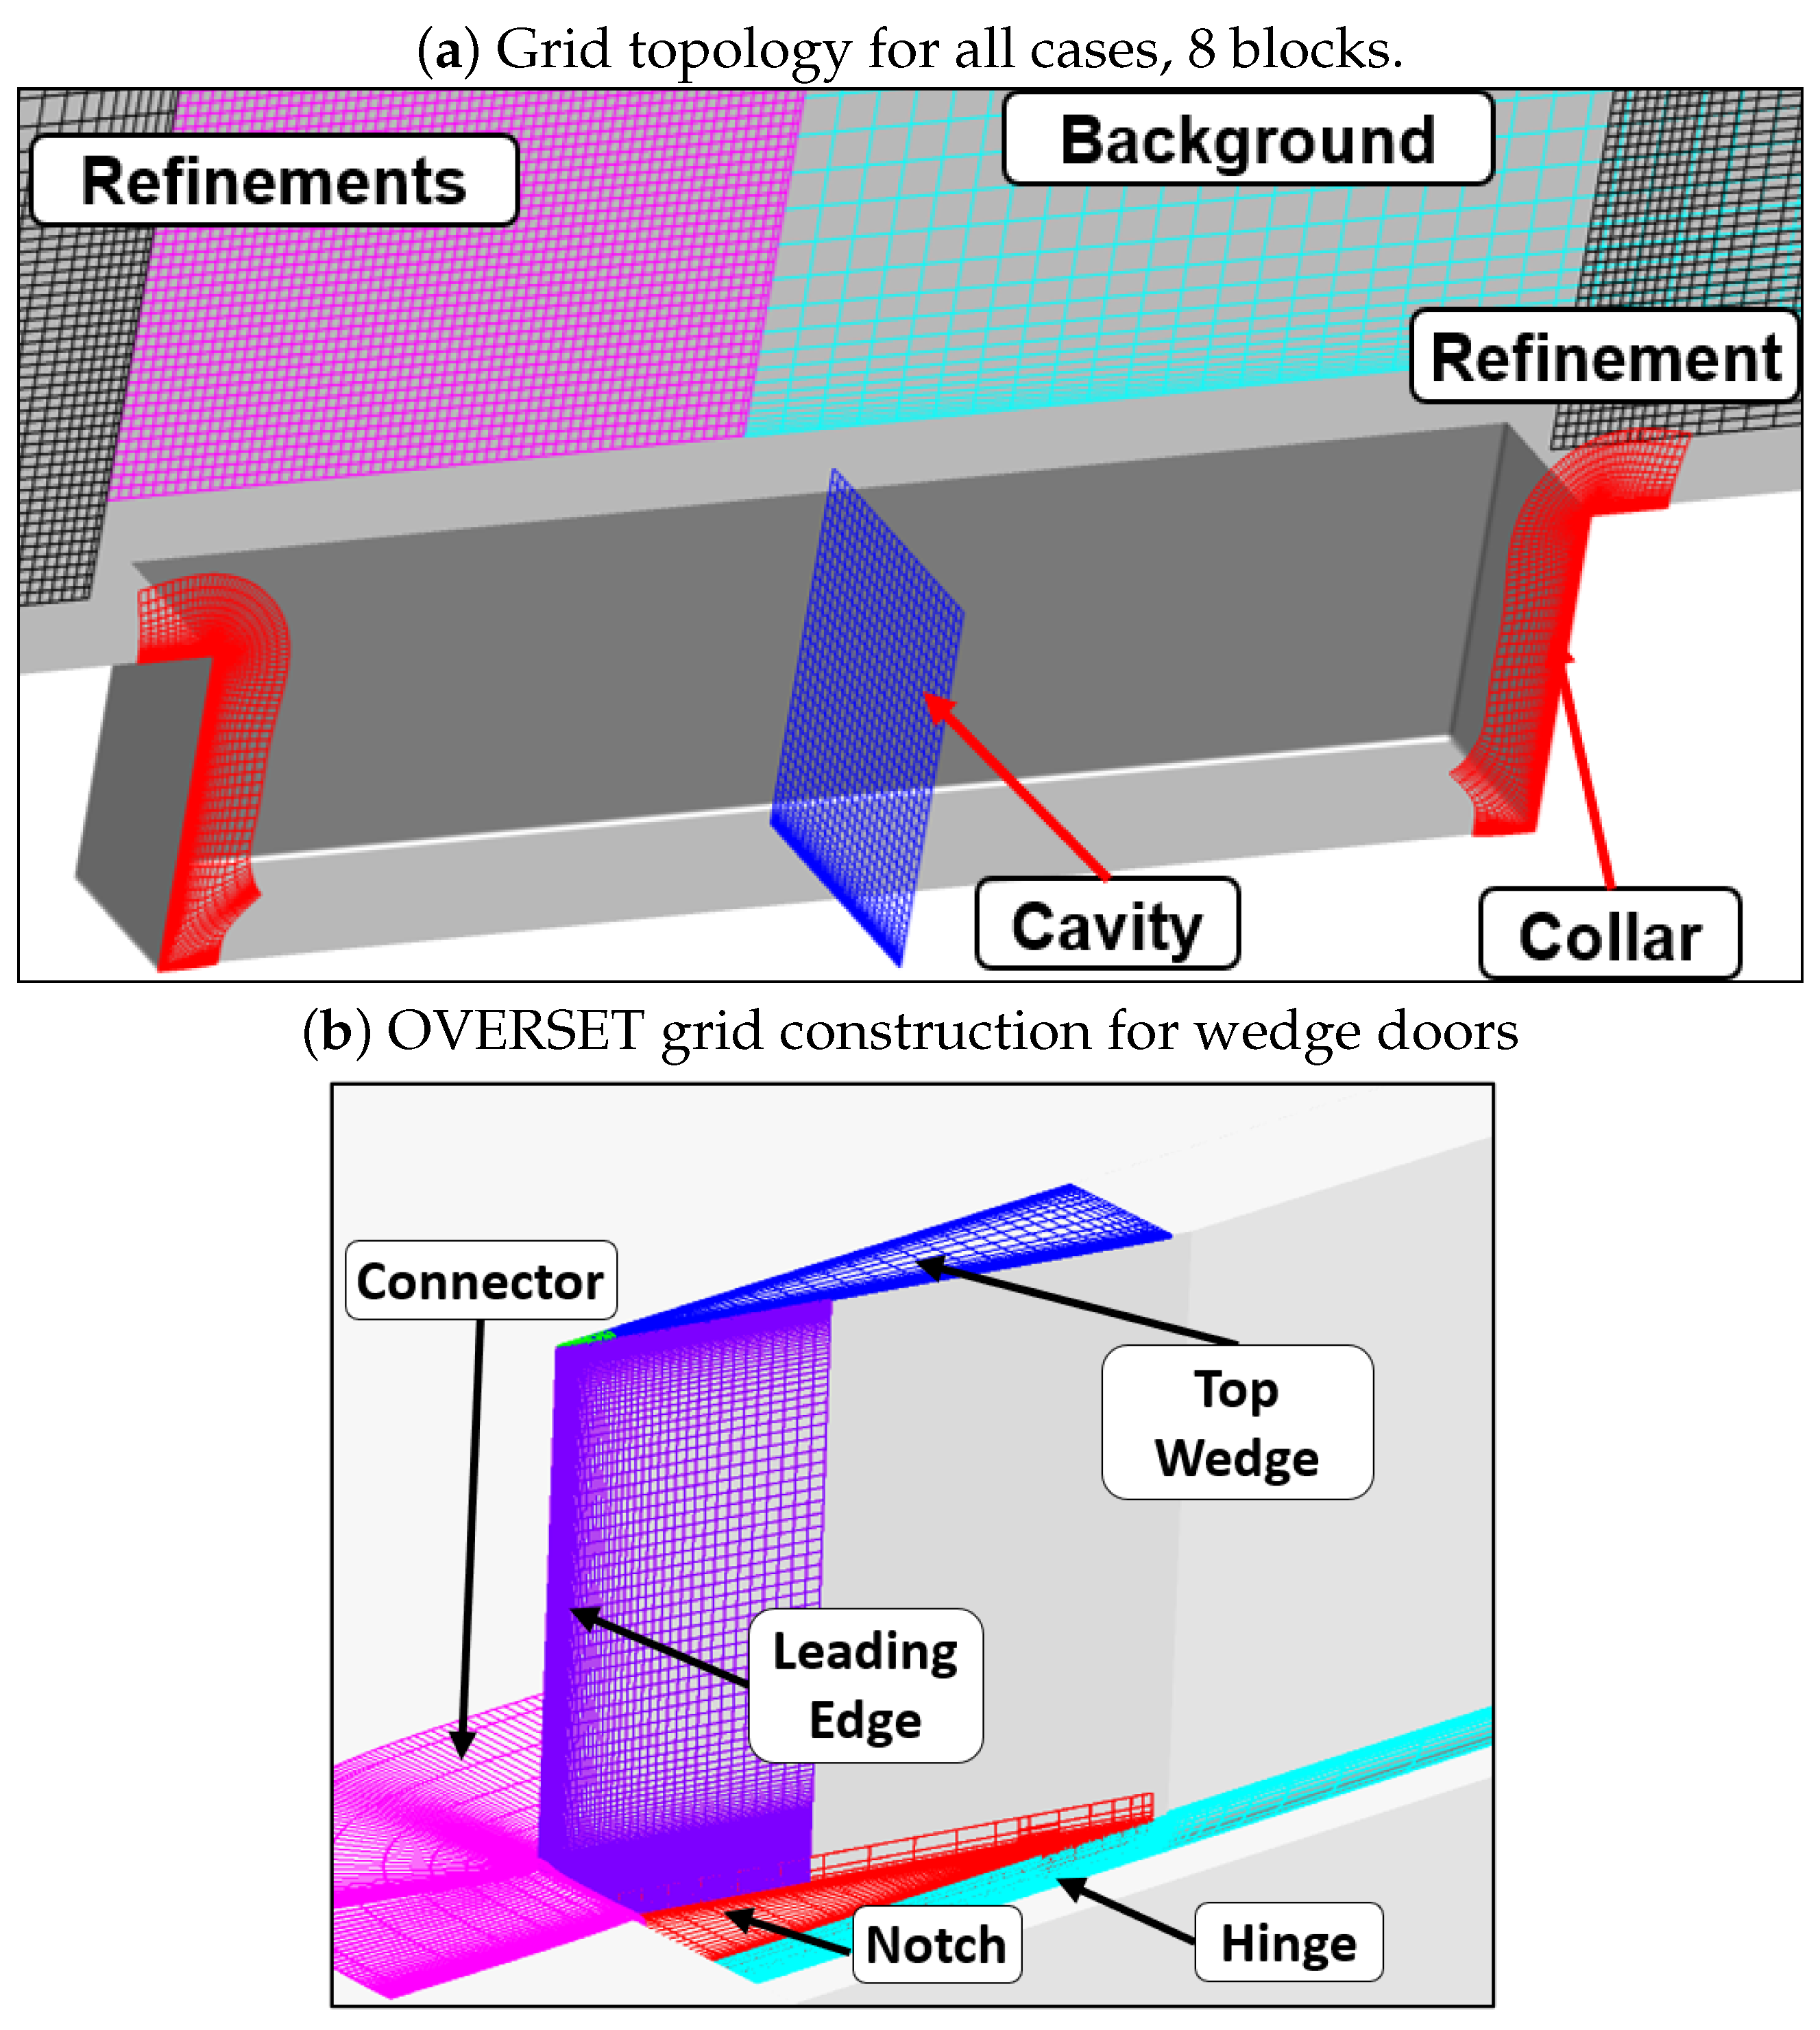
Grids were generated using Chimera Grid Tools (CGT) [58], developed at NASA Langley. The baseline (without doors) configuration consists of eight blocks comprised of background, cavity, and cavity collar grids, with five additional blocks refining above and around the cavity. The wedge door grids consist of 59 blocks, with refinement at the leading edge to provide a suitable geometry definition and add improved resolution in these regions of high gradients. Refinement and mating grids were added to the hinge-to-door and hinge-to-fuselage regions to guarantee an airtight surface and prevent errors in the OVERFLOW grid interpolation and cutting tools. The hinge grids allow for the doors and hinges to rotate while minimizing interpolation error. Further detail of these grids and their construction are shown in Figure 3 for IWD as an example.
Several meshes of increased refinement were used to establish convergence. The baseline nominal and fine grids consisted of 28 and 73 million grid points, respectively (Figure 3a). The total number of grid points with the door grids consisted of 48 and 140 million grid points. Significant refinement was required near the leading edge of the wedge doors to resolve the shocks, particularly with the IWD configuration. It was found that the geometric refinements were sufficient for the doors with the nominal grid. However, grid densities within the cavity were increased to capture 3D features within the shear layer and cavity. It was found that a total grid density of 90 million points was sufficient for the OWD and IWD. Simulations were performed on these over-refined grids in anticipation of DDES in future work. Lastly, each configuration used an extended background grid to allow for boundary layer growth, where the height of the boundary layer near the cavity leading edge was δ = 0.22 D in accordance with experimental measurements. Note that the boundary layer is relatively thick, which can lead to a dampening of the Rossiter tones due to increased shear layer stability. However, the literature suggests that the most important metric is momentum thickness [44]. Some prominent details in mesh construction can be seen in Table 2, where notches and hinges were added to the wedge doors to allow for future grids movement and smoothen grid stretching ratios between blocks. The grid points defining the cavity remain the same for all doors and the no-doors configuration. Every simulation presented was initialized by setting all initial values to the free stream throughout the domain with the doors fully open. The doors were then lowered to their respective angles in 22.5 ° increments.

3. Results

3.1. Cavity Dynamics Without Doors

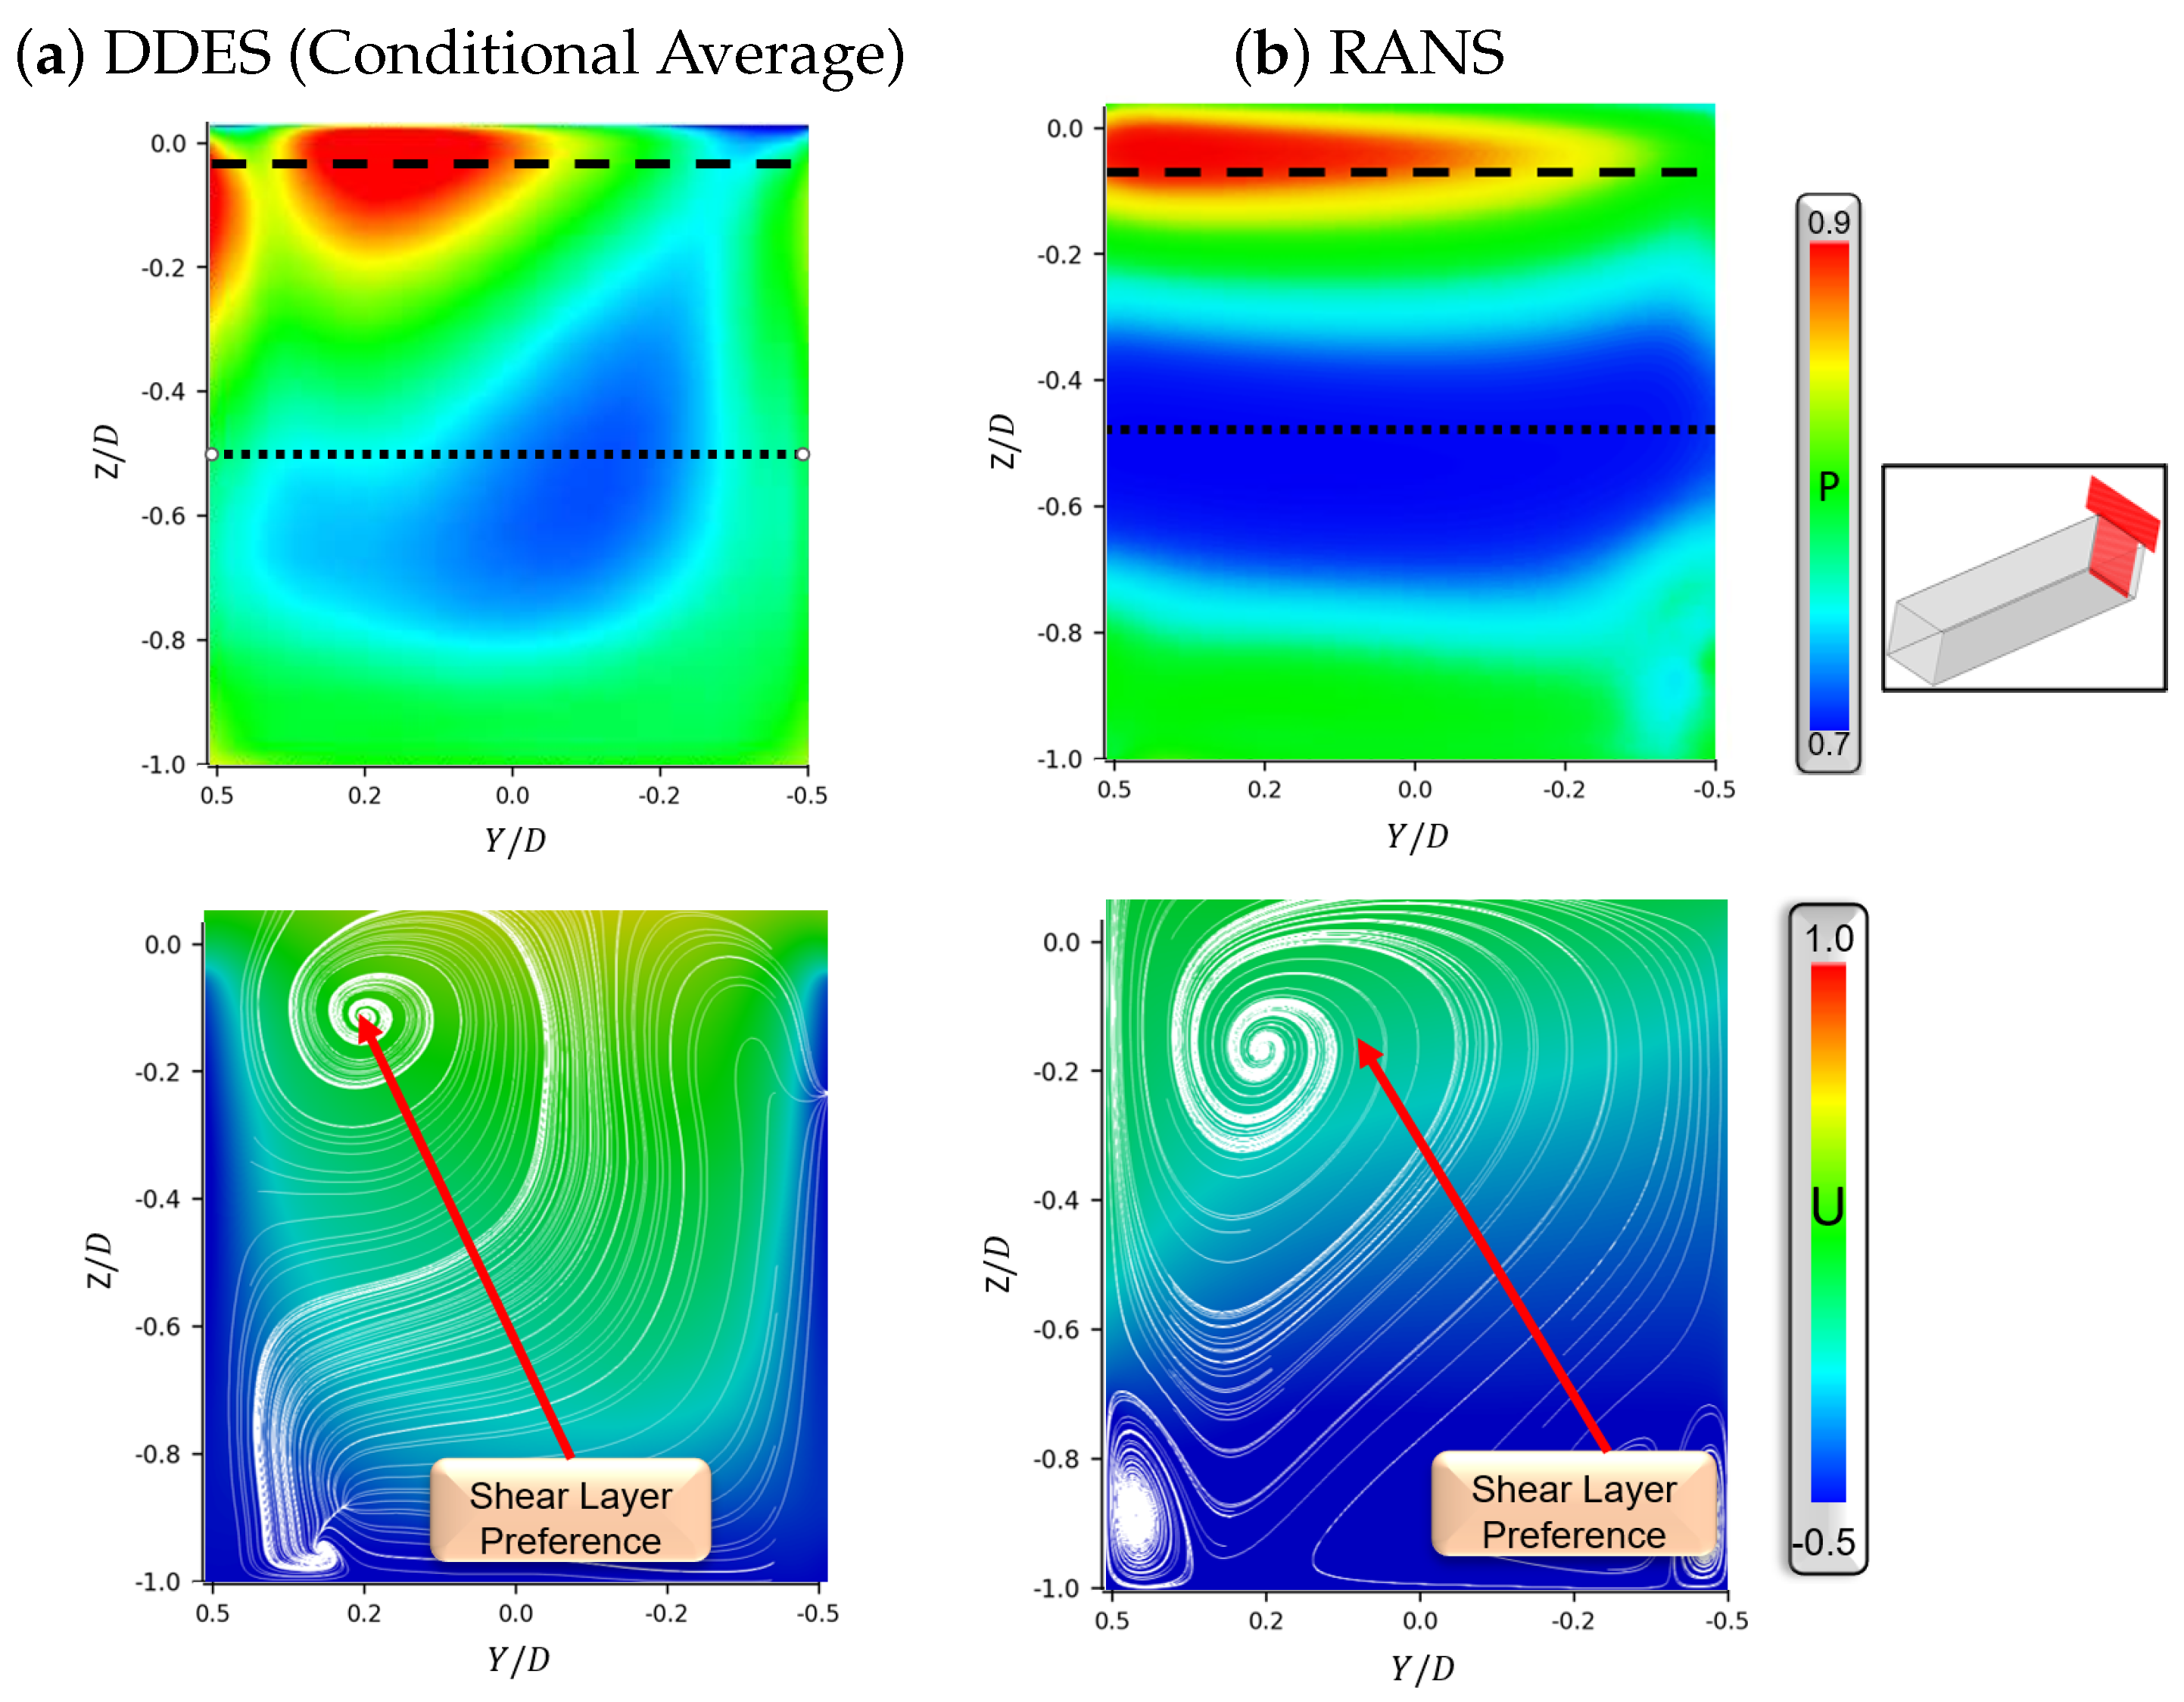
The ability to capture the asymmetric behavior of open cavity flows and shear layer bifurcation using RANS is first established using time accurate DDES results and experimental data from Ref. [32]. In the preceding study [32], experimental manifestations of the tornado were found to match those from computation. Validation data were included from both the WICs database and the NCSU wind tunnel using probe (Kulite) data and Pressure Sensitive Paint (PSP). Pertinent results are now presented to establish RANS as a reliable methodology to capture shear layer bifurcation and to set the stage for the effect of doors. The observed asymmetry in cavity flows is rooted in a quasi-periodic switching between preferential impingement locations on the back wall. Results may be most concisely summarized by analyzing the pressure distributions and near-surface streamlines along the back wall, as shown in Figure 4 from DDES (a) and the RANS solution (b). Since the DDES captures the switch from one side to the other, a conditionally averaged state is presented during a time interval when the impingement is towards the left side, which is the realization obtained by the time-averaged RANS. Although a precise equivalence is not possible between turbulence models, since the specific realizations will differ, the overall similarity of features, including topological structure, is evident. The main features include a relatively high-pressure region on the left side and a corresponding major (stable, or inward spiraling) focus in the streamline pattern. On the bottom figures of Figure 4, these impinging vortex structures (into the page) impinge on the back wall in a topologically identical manner. Some distinctions are also evident. The relatively low C p region near the center is broader for the RANS case, which also shows a pair of critical points on the lower right, whose corresponding feature in the DDES appears as a node at z / D 0.2 on the right wall.
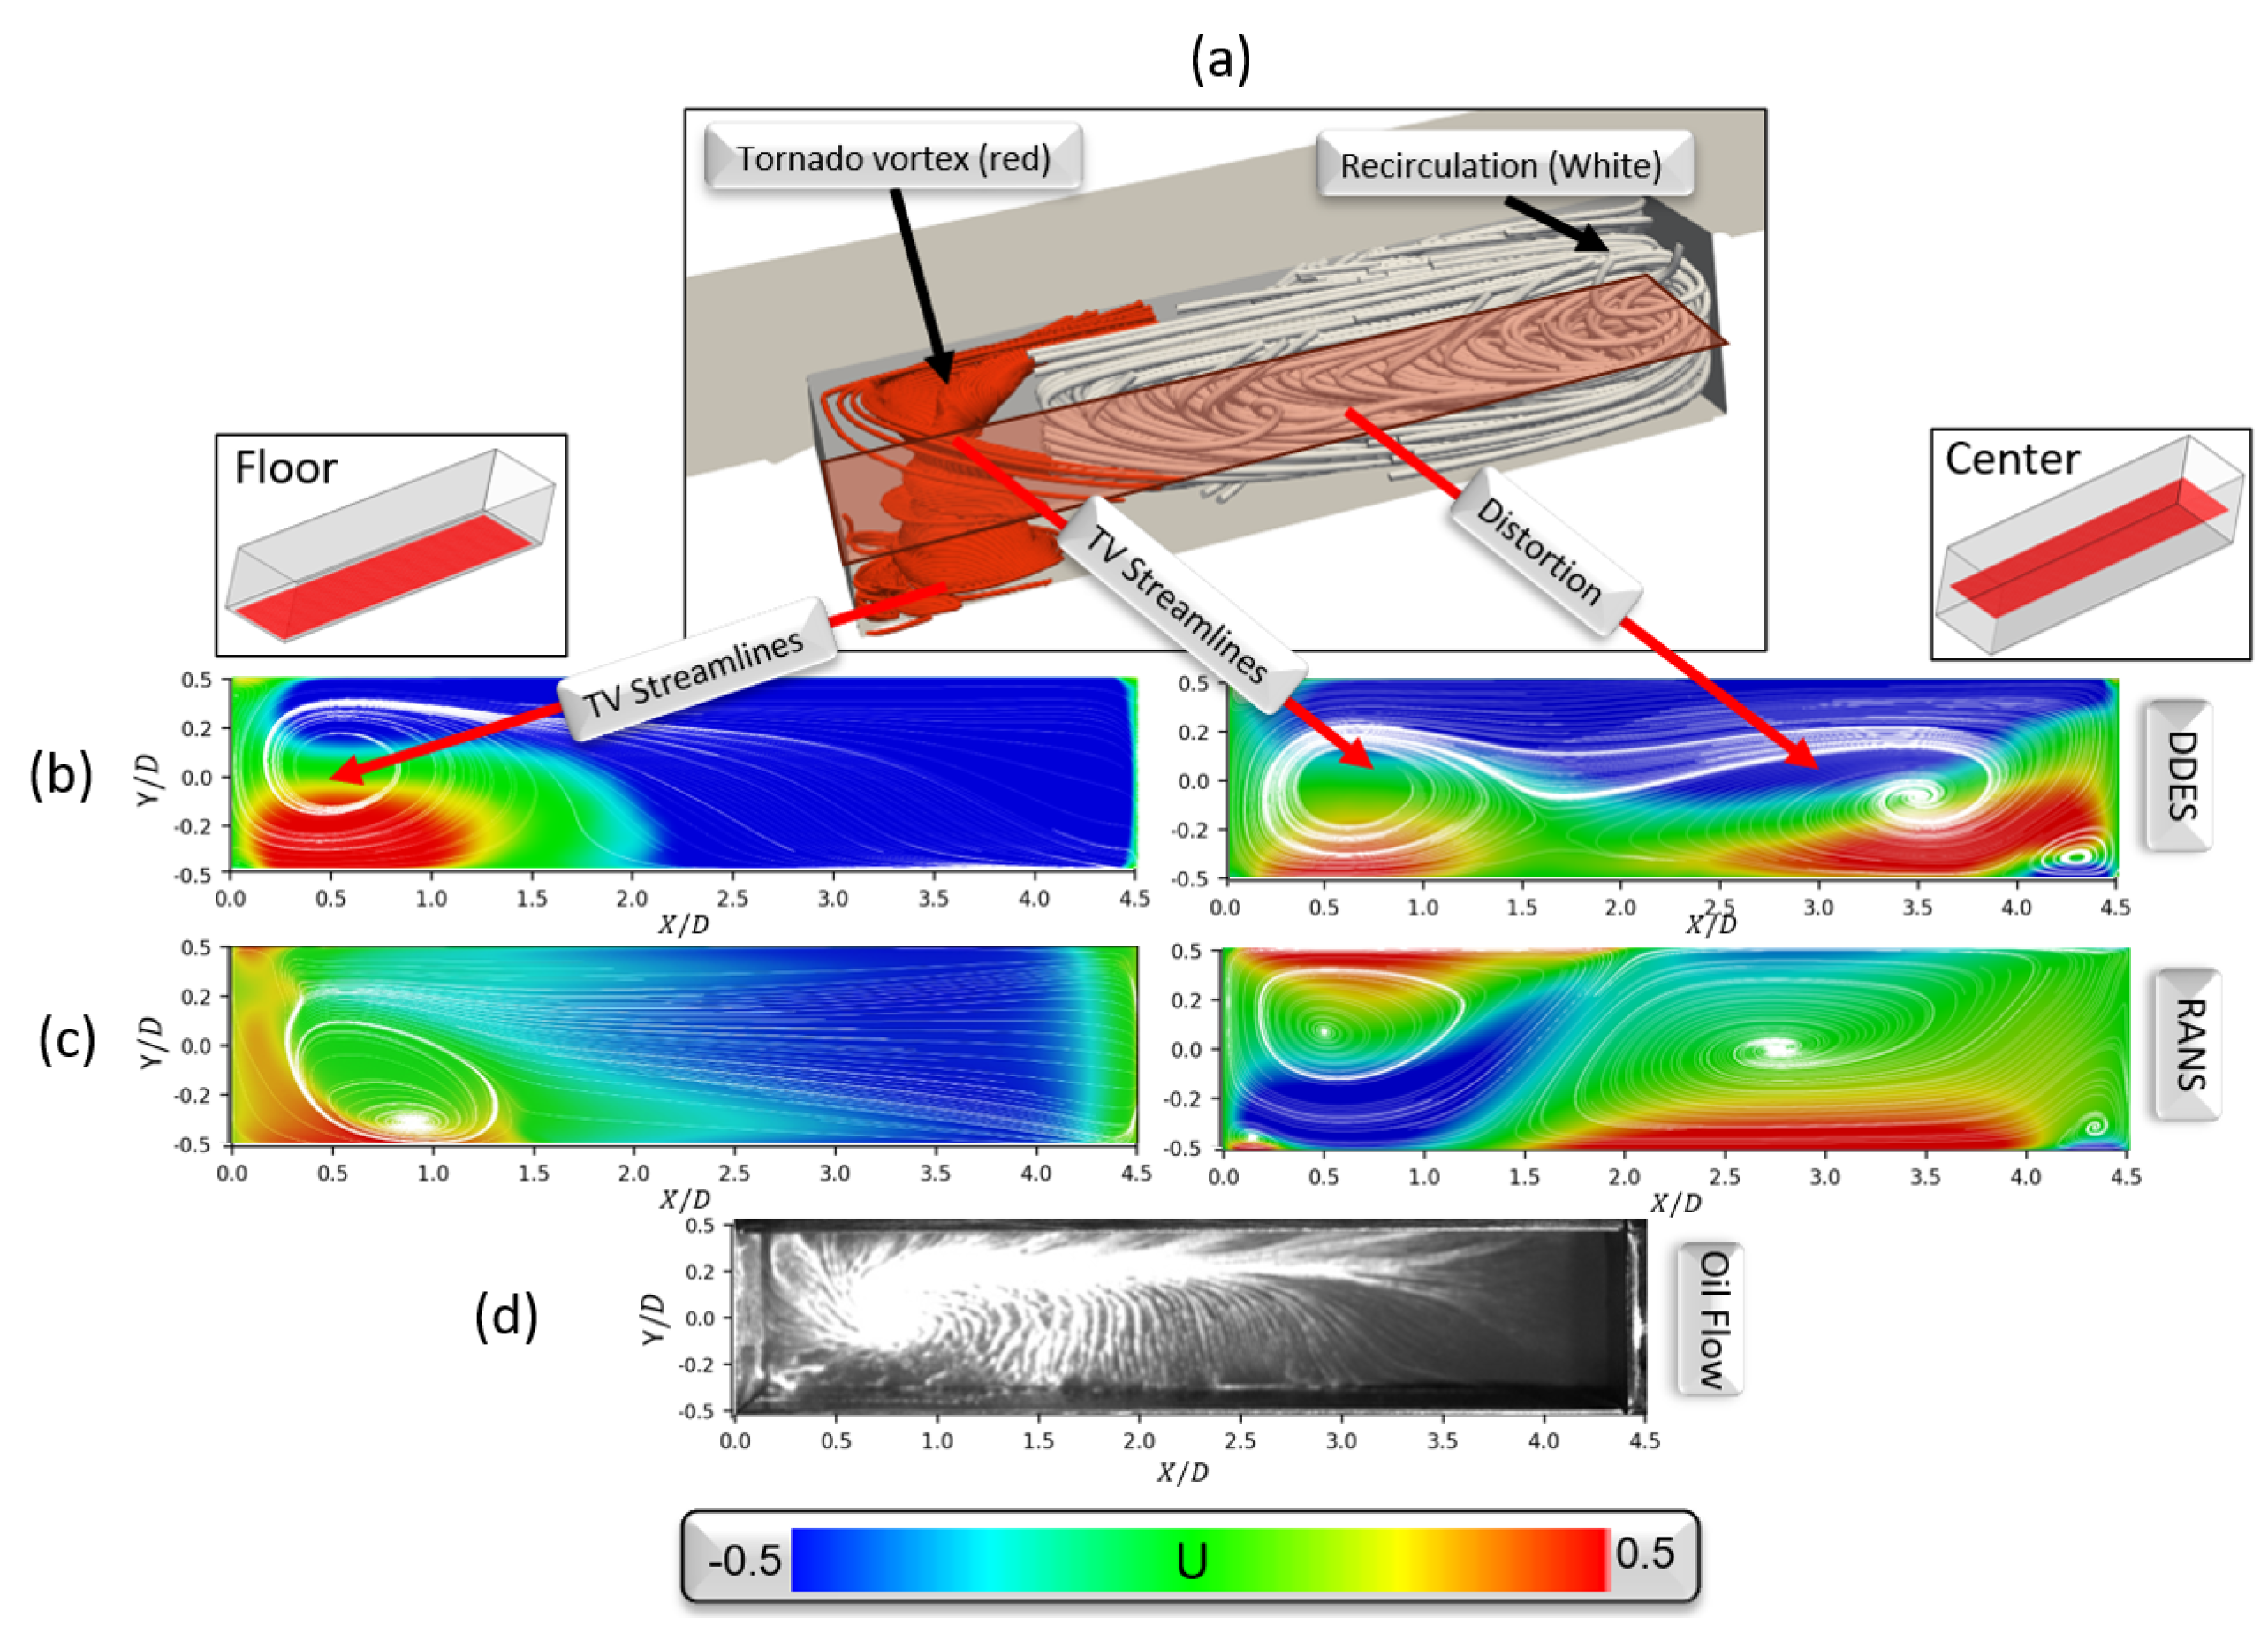
This asymmetry results in the flow structures shown in Figure 5a, which are from the DDES; these are similar to those with RANS, whose results are deferred to the discussion of the with-doors cases. The primary recirculation region is colored white, while the tornado vortex, colored in red, is obtained by releasing particles from the preferred impingement region. These travel upstream, bypass and distort the primary recirculation region, and eventually feed the tornado vortex, in which fluid is swirled back up into the shear layer. This process is more apparent in the restricted 2D planes (Z = constant) in Figure 5b on a plane near the floor (left) and a center plane (right) for DDES, c) for RANS. The streamlines in these 2D planes clearly demonstrate the preferential streamlines moving upstream towards the base of the tornado vortex, which extends nearly the entire span of the upstream portion of the cavity. Furthermore, as the tornado vortex evolves vertically (see mid-plane), the vortex core thins and orients itself closer to one spanwise side of the cavity, as can also be observed in Figure 5b. Lastly, the distortion of the recirculation region can be readily seen in the mid-plane figure (right), where the preferential streamlines feeding the tornado vortex effectively push the core of the recirculation vortex across the cavity. This same pattern was observed in experimental oil flow [32] as seen in Figure 5d. The analyses and flow phenomena presented in this section are now investigated for both the IWD and OWD.

3.2. Fully Open Doors

For the IWD and OWD door simulations, the flow field was initialized with the doors fully open, then closed in 22.5 ° increments to facilitate comparison. Considering first fully open doors (in vertical position), the overall flow field is shown in Figure 6, which displays results for the IWD (a) and OWD (b). Each figure displays several variables. Looking downstream, the right part of the figure plots streamwise velocity along a horizontal (Z = constant) plane approximately halfway between the cavity and the door edge. On the left part, the density gradient is plotted in a similar manner. In addition, X = constant planes are shown with vorticity magnitude.
In the density gradient plots for the IWD, Figure 6a, clear oblique shocks are evident entering the cavity, marked (1), and crossing (2) those from the other door. Further downstream, an expansion forms around the wedge corner (3), followed by a shock wave boundary layer interaction and shock reflection directly downstream (4). As a result of the shape of the wedge, wedge vortices (5) are observed, forming along the top edge of the doors. This feature expands and begins to dissipate as it entrains fluid from the freestream. Lastly, resolved boundary layers are evident on the inner and outer portions of the door (6), where they then separate at the door trailing edges, resulting in a wake shear layer (7).
Analogous features are observed with the OWD in Figure 6b, but the strengths and details are different because the shocks develop outside the cavity. As a result, an oblique shock extends into the freestream (1), followed by an expansion at the wedge corner (2). Similarly, another wedge vortex forms downstream of the door wedge (3), though now facing outside of the cavity due to the OWD. Lastly, similar to the IWD configurations, the door boundary layer (5) separates at the trailing edge (4), causing a vortex shedding instability. The effect of these inward and outward shock waves on shear layer development and pressure levels is now discussed.
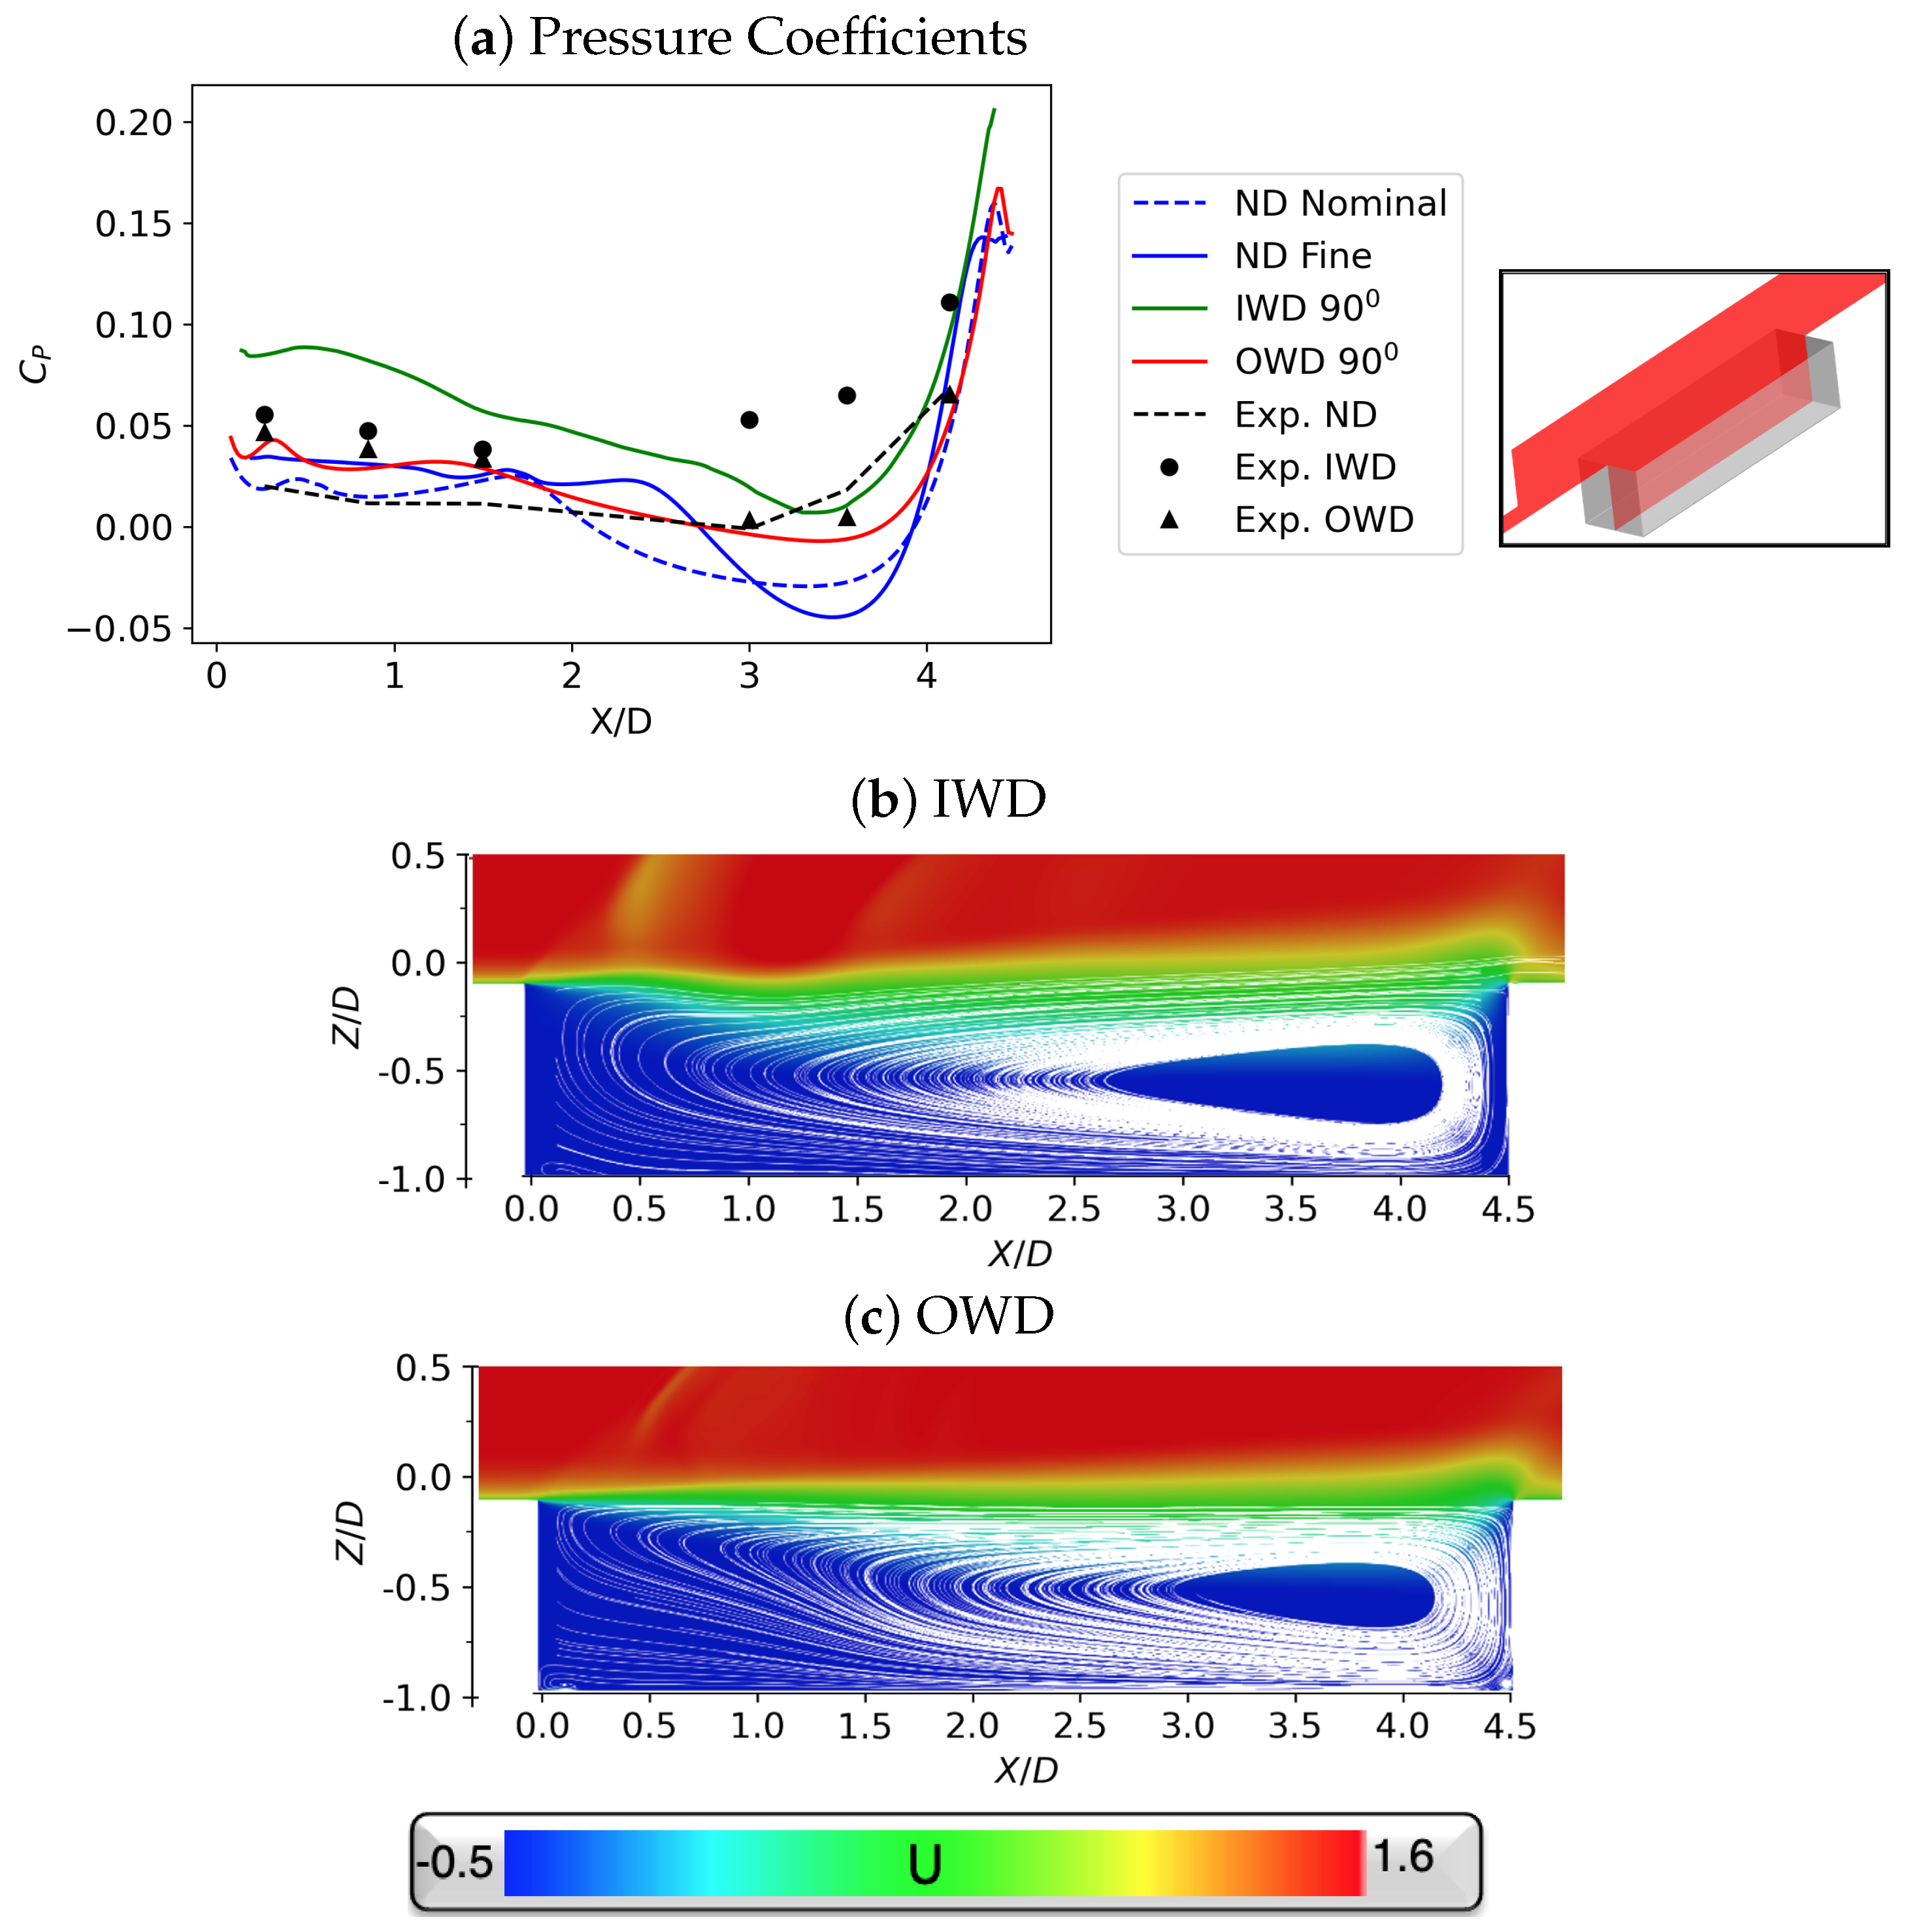
The effect of the shocks on shear layer development is evident in Figure 7a, where pressure measurements along the center of the cavity floor from both computations and experiments are shown. Additionally, flow visualization on centerline planes colored by streamwise velocity overlaid with 2D restricted streamlines is presented in Figure 7b for the IW, and Figure 7c for the OWD. All cases display a peak pressure downstream where the shear layer impinges on the back wall and injects fluid into the cavity. As the fluid moves upstream, forming the primary recirculation, Figure 7b,c, pressure levels initially drop before increasing upstream near the tornado vortex. These trends are consistent between simulations and experiments, reflecting the general agreement with experimental data. The results are quantitatively similar for the no-doors and OWD cases, but some overprediction is evident in the IWD case. Here, the shock shear layer interaction is relatively stronger, and may be associated with turbulence modeling. The lack of a front vortex in the door configurations (compare with Figure 5) may be attributed to an increased strength in the primary recirculation region, consistent with the increased entrainment of fluid and the absence of the sidewall relief effect. Note that this increased shear layer entrainment has been observed with rotating doors previously, where the lack of fluid ejection near the side walls, due to the absence of spillage vortices, increases the fluid entrainment in the shear layer. This result also agrees with an experimental study [59], where similar conclusions were noted as in Ref. [60]. The effect of the inward shocks on the shear layer is evident in Figure 7b, where the shear layer deflects into the cavity, thus thickening the shear layer and increasing the pressure levels. In turn, this also marginally shortens and narrows the recirculation region as the shear layer entrains more fluid from within the cavity. The effect of these doors and the resulting shocks on the formation of 3D structures in the cavity is discussed below.
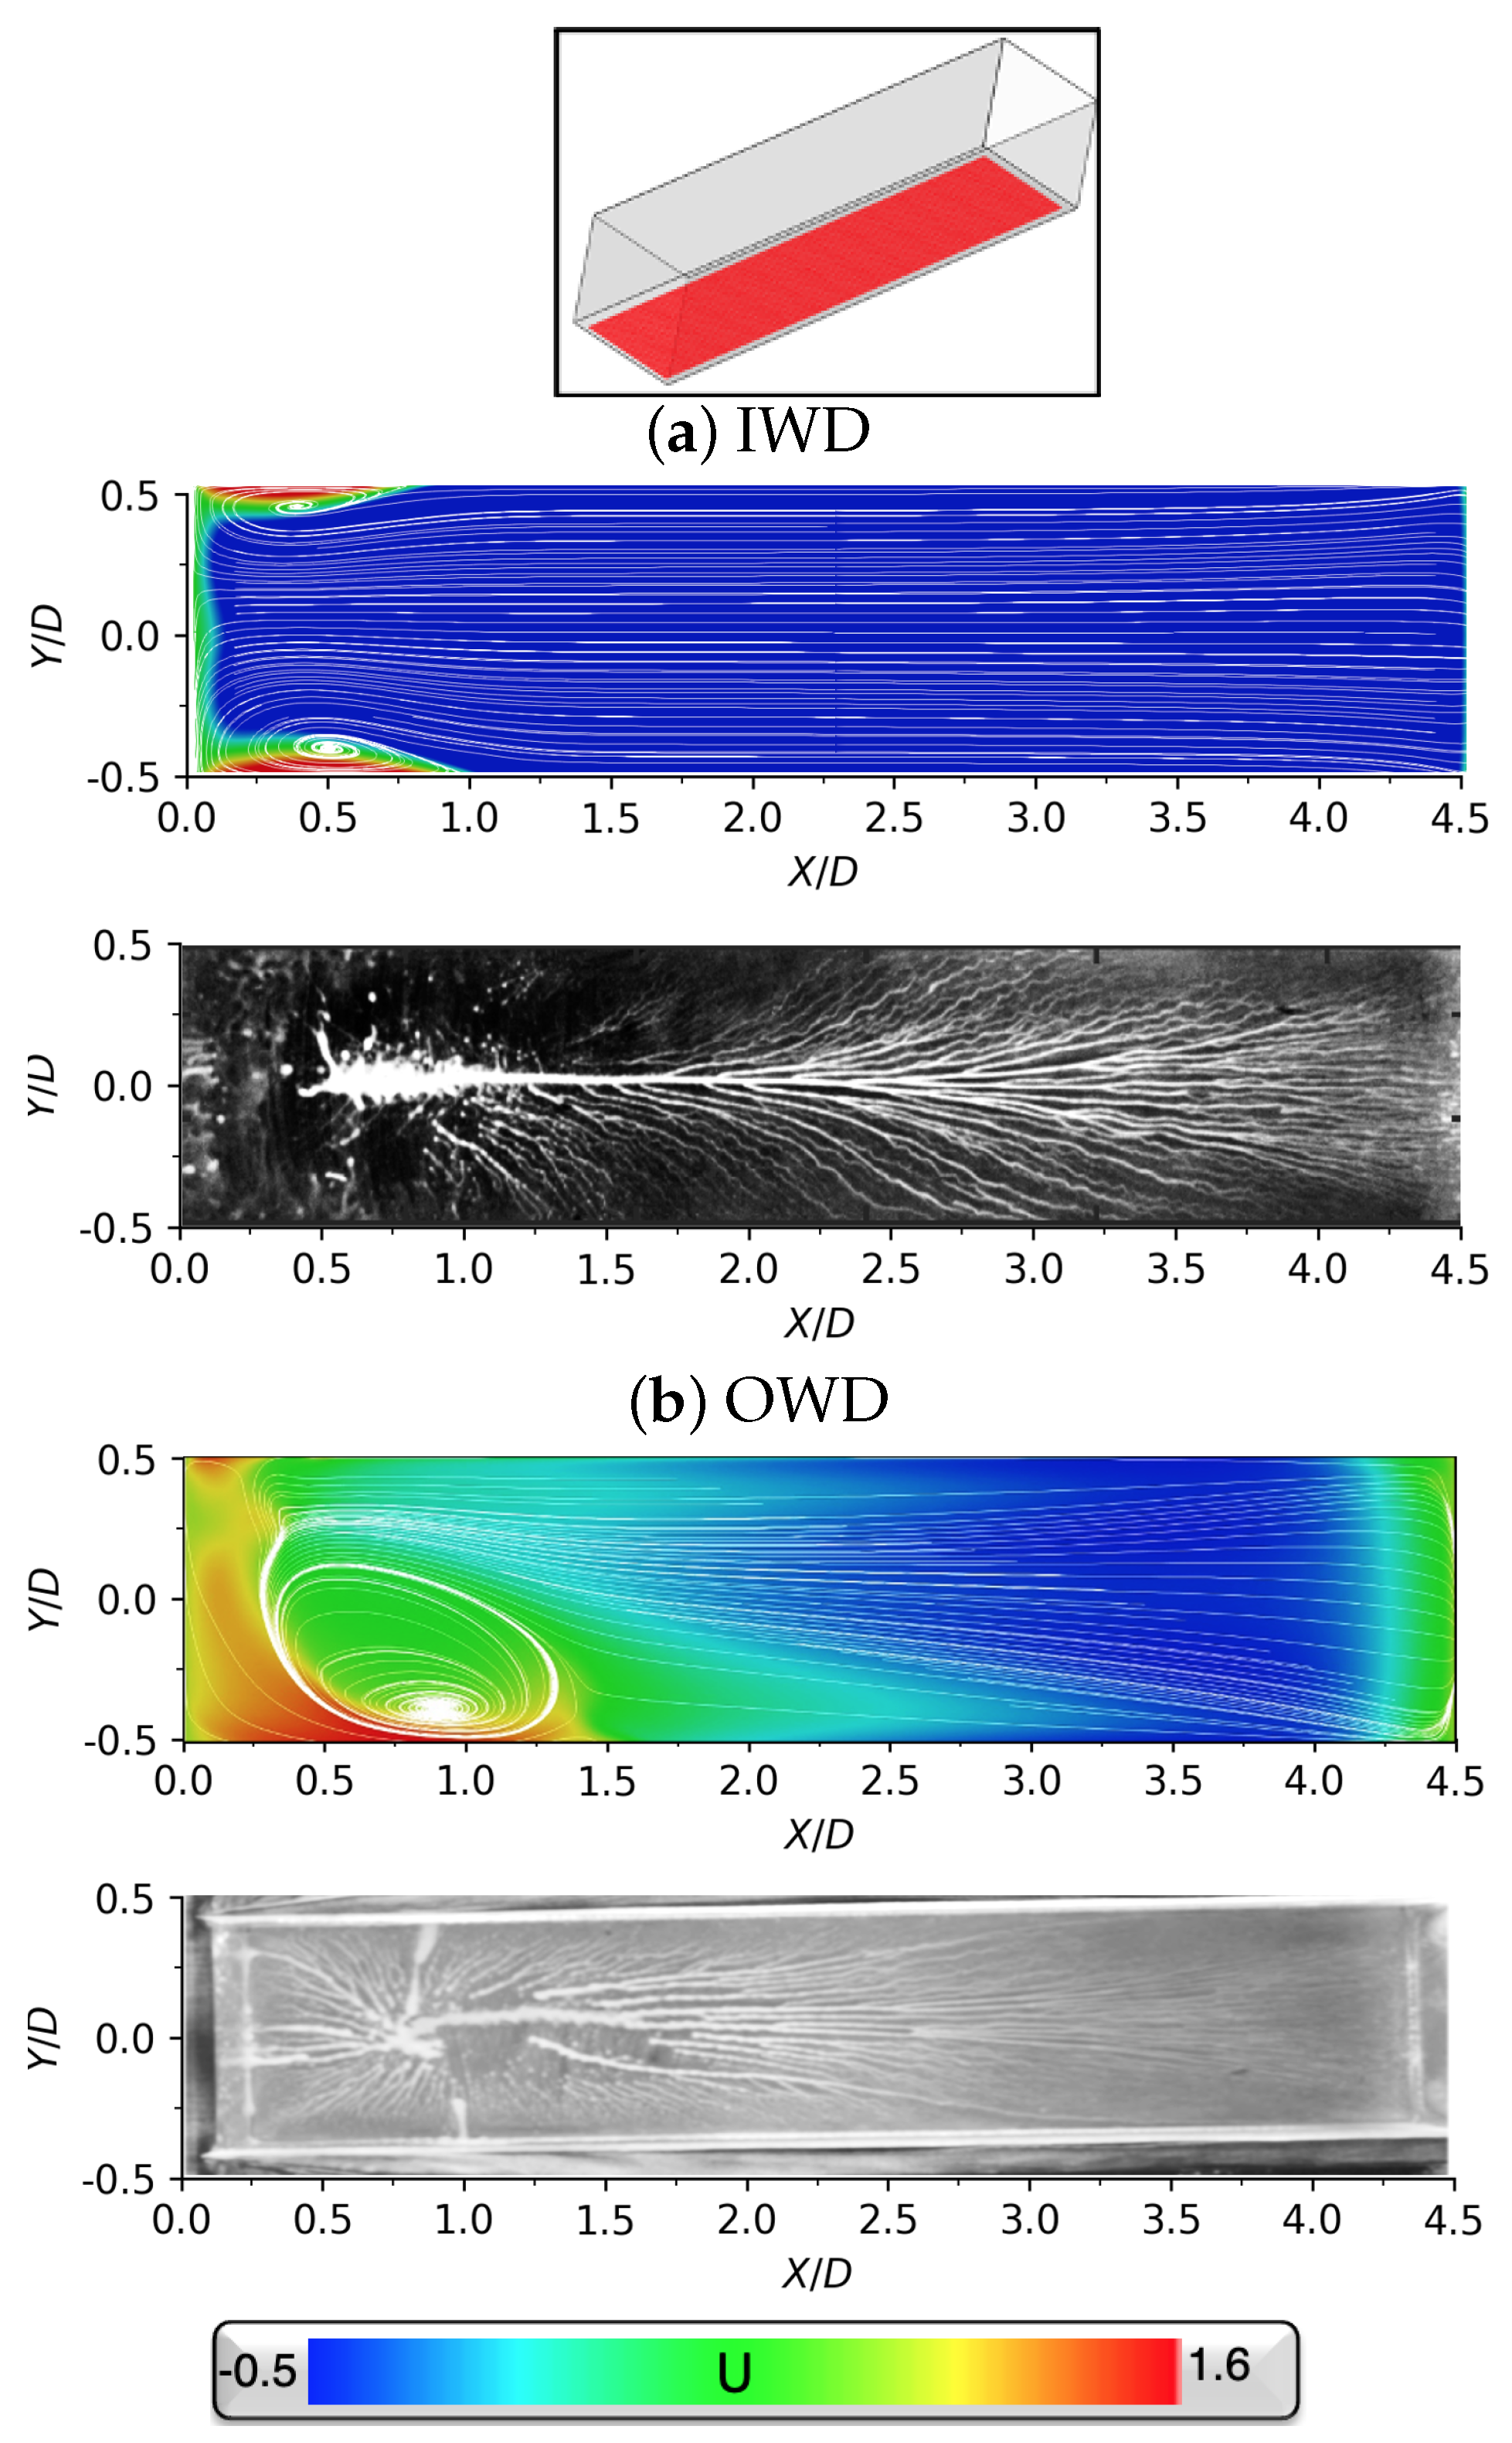
A composite representation of the 3D flow field may be obtained by considering additional planar slices. For this, Z-Constant planes near the cavity floor ( Z / D = 0.95 ) were extracted from the solution and contoured by streamwise velocity overlaid with 2D streamlines as displayed in Figure 8 along with experimental oil flow in black and white. As seen in Figure 8a, the IWD configuration displays generally symmetric behavior, as confirmed by the experimental oil flow, where the streamlines pattern indicates spanwise symmetry with stagnation upstream. However, in the computation, this is accompanied by corner vortices near the upstream wall, similar to the twin tornado vortex system presented in Ref. [61] with sliding doors. The corner vortices are not evident in the experimental oil flow, which displays a dark region—the diagnostic used (oil flow) generally cannot faithfully reproduce such regions with relatively weak recirculation regions. The above observations contrast with the OWD results in Figure 8b, where an asymmetric flow field develops. Although some details remain unclear, the topological structure of a focus is confirmed by experimental oil flow. These OWD results are analogous to those of the baseline cavity, though the tornado vortex is more stretched and displays differences in rotation and size. This system also experiences a much smaller region of reversed flow compared with the IWD, which, for the IWD, can be attributed to the increased shear layer deflection and entrainment as observed in Figure 7a.
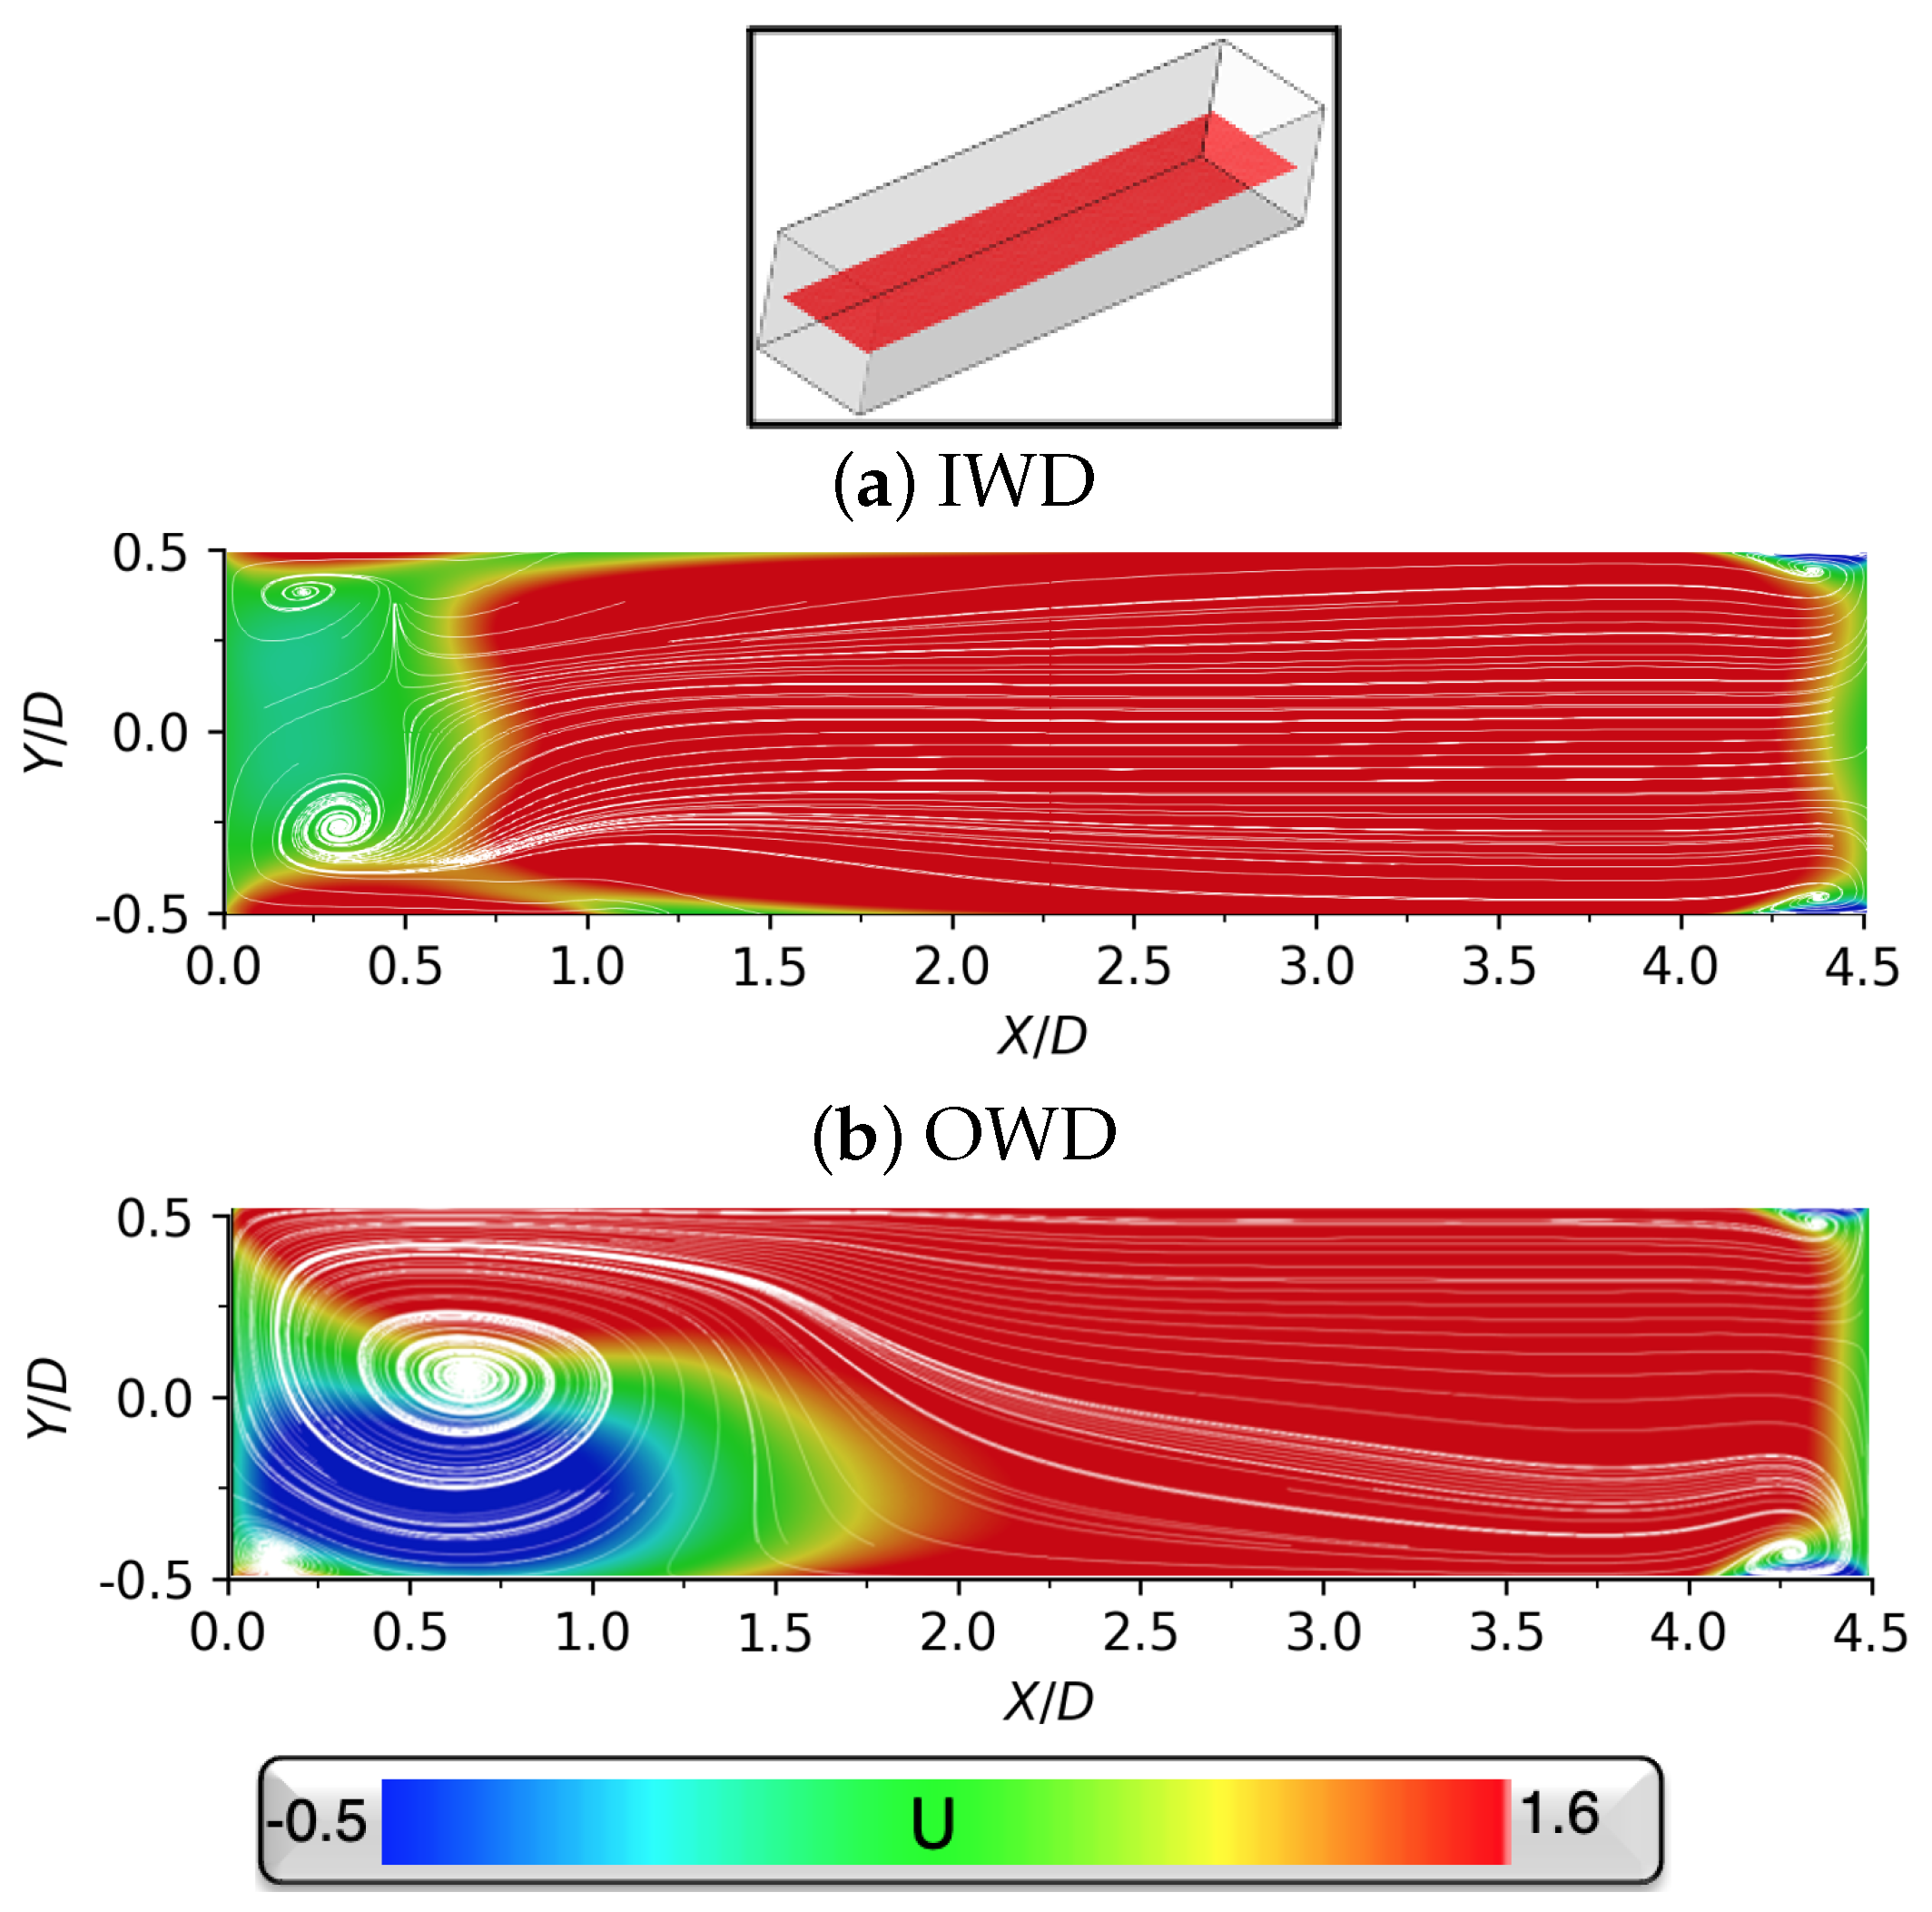
The vortical structure of the flow in the cavity is now discussed by examining the flow near the horizontal mid-plane ( Z / D = 0.45 ) of the cavity, shown schematically in the top portion of Figure 9. For the IWD, Figure 9a indicates that the twin vortices upstream become slightly asymmetric in the vertical direction. However, their cross-sectional size diminishes as the region of forward-moving flow near the upstream corners dissipates and the primary recirculation region starts to dominate. This, in part, may help explain the experimental oil flow. The full-time average captured by the oil flow may experience similar low-frequency motions or intermittent behavior that induces asymmetry. However, as seen in the RANS simulations and experiments, these events are not sufficient to sustain a full tornado vortex system. Furthermore, this large region of forward-moving flow in the upper region of the recirculation region is consistent with the thickening and enhanced entrainment of the shear layer as evident in Figure 7a; this also causes the recirculation region to shorten. In contrast, the OWD at the mid-plane in Figure 9b experience a growth in radius of the tornado vortex as it begins to entrain fluid back into the shear layer along with the development of a small counter-rotating vortex pair near the front wall corners. It is also evident that a system of asymmetric corner vortices forms near the back wall, with the dominant streamlines originating from the larger of the vortex pair. This phenomenon is similar to observations on sliding doors in Ref. [61], where fluid recirculating upstream was dominated by the larger of the vortex pair and traveled diagonally to the opposite corner upstream to feed the tornado vortex.
These conclusions may be confirmed by a 3D visualization of the flow field shown in Figure 10. The white streamlines represent the recirculation region, while red lines represent the tornado vortice(s) or lack thereof. As discussed above, the relatively weak twin tornado vortex pair in the IWD configuration is diminished by an extended recirculation region (seen in Figure 5a in red). A narrowing of the recirculation region is also observed as suggested by the absence of reversed flow near the mid-planes in Figure 9a. The lack of a tornado vortex and increased symmetry with the IWD is most due to stabilization of the shear layer caused by the inward deflected oblique shock waves. In contrast, the OWD in Figure 5b display a much more prominent and symmetric tornado vortex than observed for the baseline no-doors configuration. For the OWD, the streamlines swirling back into the shear layer manifest predominantly at the spanwise center, unlike the baseline configuration. These flow features can be directly related to the bifurcation of the shear layer and merit an investigation of the back wall pressure distributions.
As mentioned previously, the 3D dynamics in the cavity are dependent on the behavior and bifurcation of the shear layer. This behavior is evident in the back wall pressure loading. In the baseline cavity, the shear layer prefers one corner near the trailing edge and oscillates between corners in a quasi-periodic manner. The back wall pressure loadings are presented for the IWD (a) and OWD (b) in Figure 11. In both configurations, the pressure is primarily distributed near the center of the trailing edge. However, in both cases, two regions of preferred shear layer impingement arise due to the bifurcation of the shear layer, as displayed by the black lines in the figures, plotted in Figure 12. The IWD displays two lobes of maximum pressure displaced approximately halfway from the center towards the side walls ( Y / D = 0.25 , 0.25 ). The lower pressure gradient near the back wall corners results in the development of the corner vortices discussed above. Note that the pressure contour levels in Figure 11 are different for the IWD and OWD to qualitatively display the behavior of shear layer bifurcation, due to the increased pressure levels with the IWD. The OWD configuration in Figure 11b, however, displays preferred impingement regions at the center and edge of the back wall of the cavity near the trailing edge. This induces asymmetry in the cavity similar to the baseline, where flow moves upstream from a preferred corner, forming the tornado vortex. Upon closing the IWD and OWD doors, both experienced a similar flow field to the results of this section, until a ‘critical door angle’ was reached.

3.3. Critical Door Angle

As the door angle is reduced, both the IWD and OWD configurations experience an additional lobe of the shear layer impingement, a successive bifurcation that has been referred to as tri-stable [36]. The angle at which this occurs was deemed the critical angle, and differs for the two types of doors; specifically, 67.5 ° and 45 ° for the IWD and OWD, respectively. We first examine the results using the pressure distribution on the back wall, which is a good qualitative indicator of the 3D flow field. Results are presented in Figure 13, with pressure contours on the back wall for the inner, Figure 13a, and outer, Figure 13b wedge doors. Both doors now display three regions of preferred impingement as opposed to two when the doors are fully open. A similar successive bifurcation of a shear layer was observed in Ref. [36], with a three-peak or pitchfork bifurcation, where the shear layer was described as transitioning from a bistable state, to “tristable” state as a result of increasing Reynolds number. In these cases, both door configurations have high-pressure regions near the side walls and the spanwise center. However, for the IWD, this distribution is centered near the trailing edge of the cavity ( X / D = 4.5 , Z / D 0 ) as opposed to the center of the back wall for the OWD ( X / D = 4.5 , Z / D 0.5 ). In both cases, this distribution indicates increased interaction with the doors as they close and interfere with the developing shear layer.
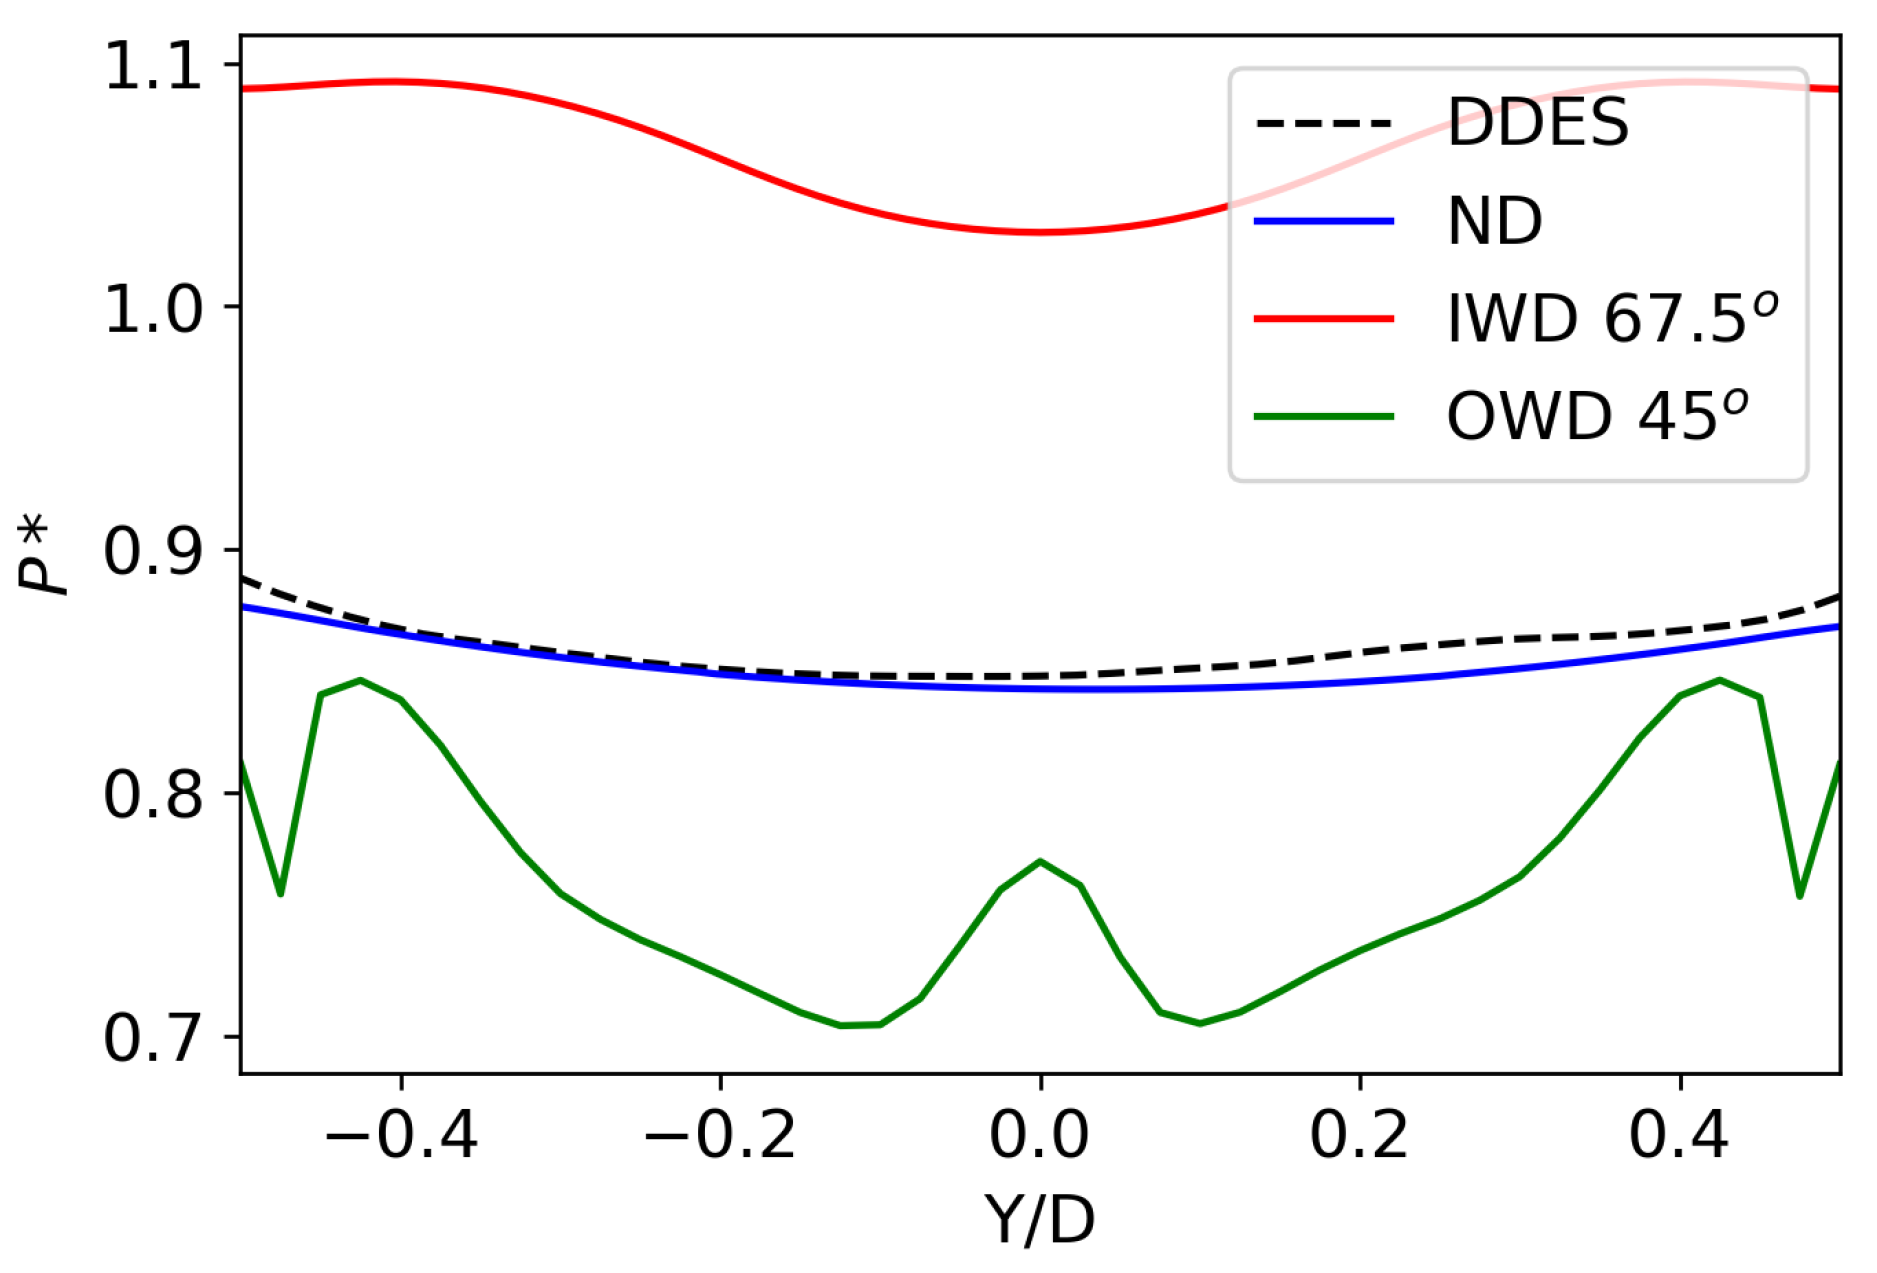
Further detail was extracted from lines near the point of maximum pressure as displayed in Figure 14 ( Z / D = 0.05 for the IWD and Z / D = 0.5 for the OWD). At 67.5 ° , the IWD displays three maxima along the maximum pressure line, where as the OWD displays similar behavior, but near the center height of the back wall. As a result of this second bifurcation and locations of the pressure distributions, both configurations experience a different system of corner vortices than observed earlier, becoming more prominent near the regions of preferred impingement.
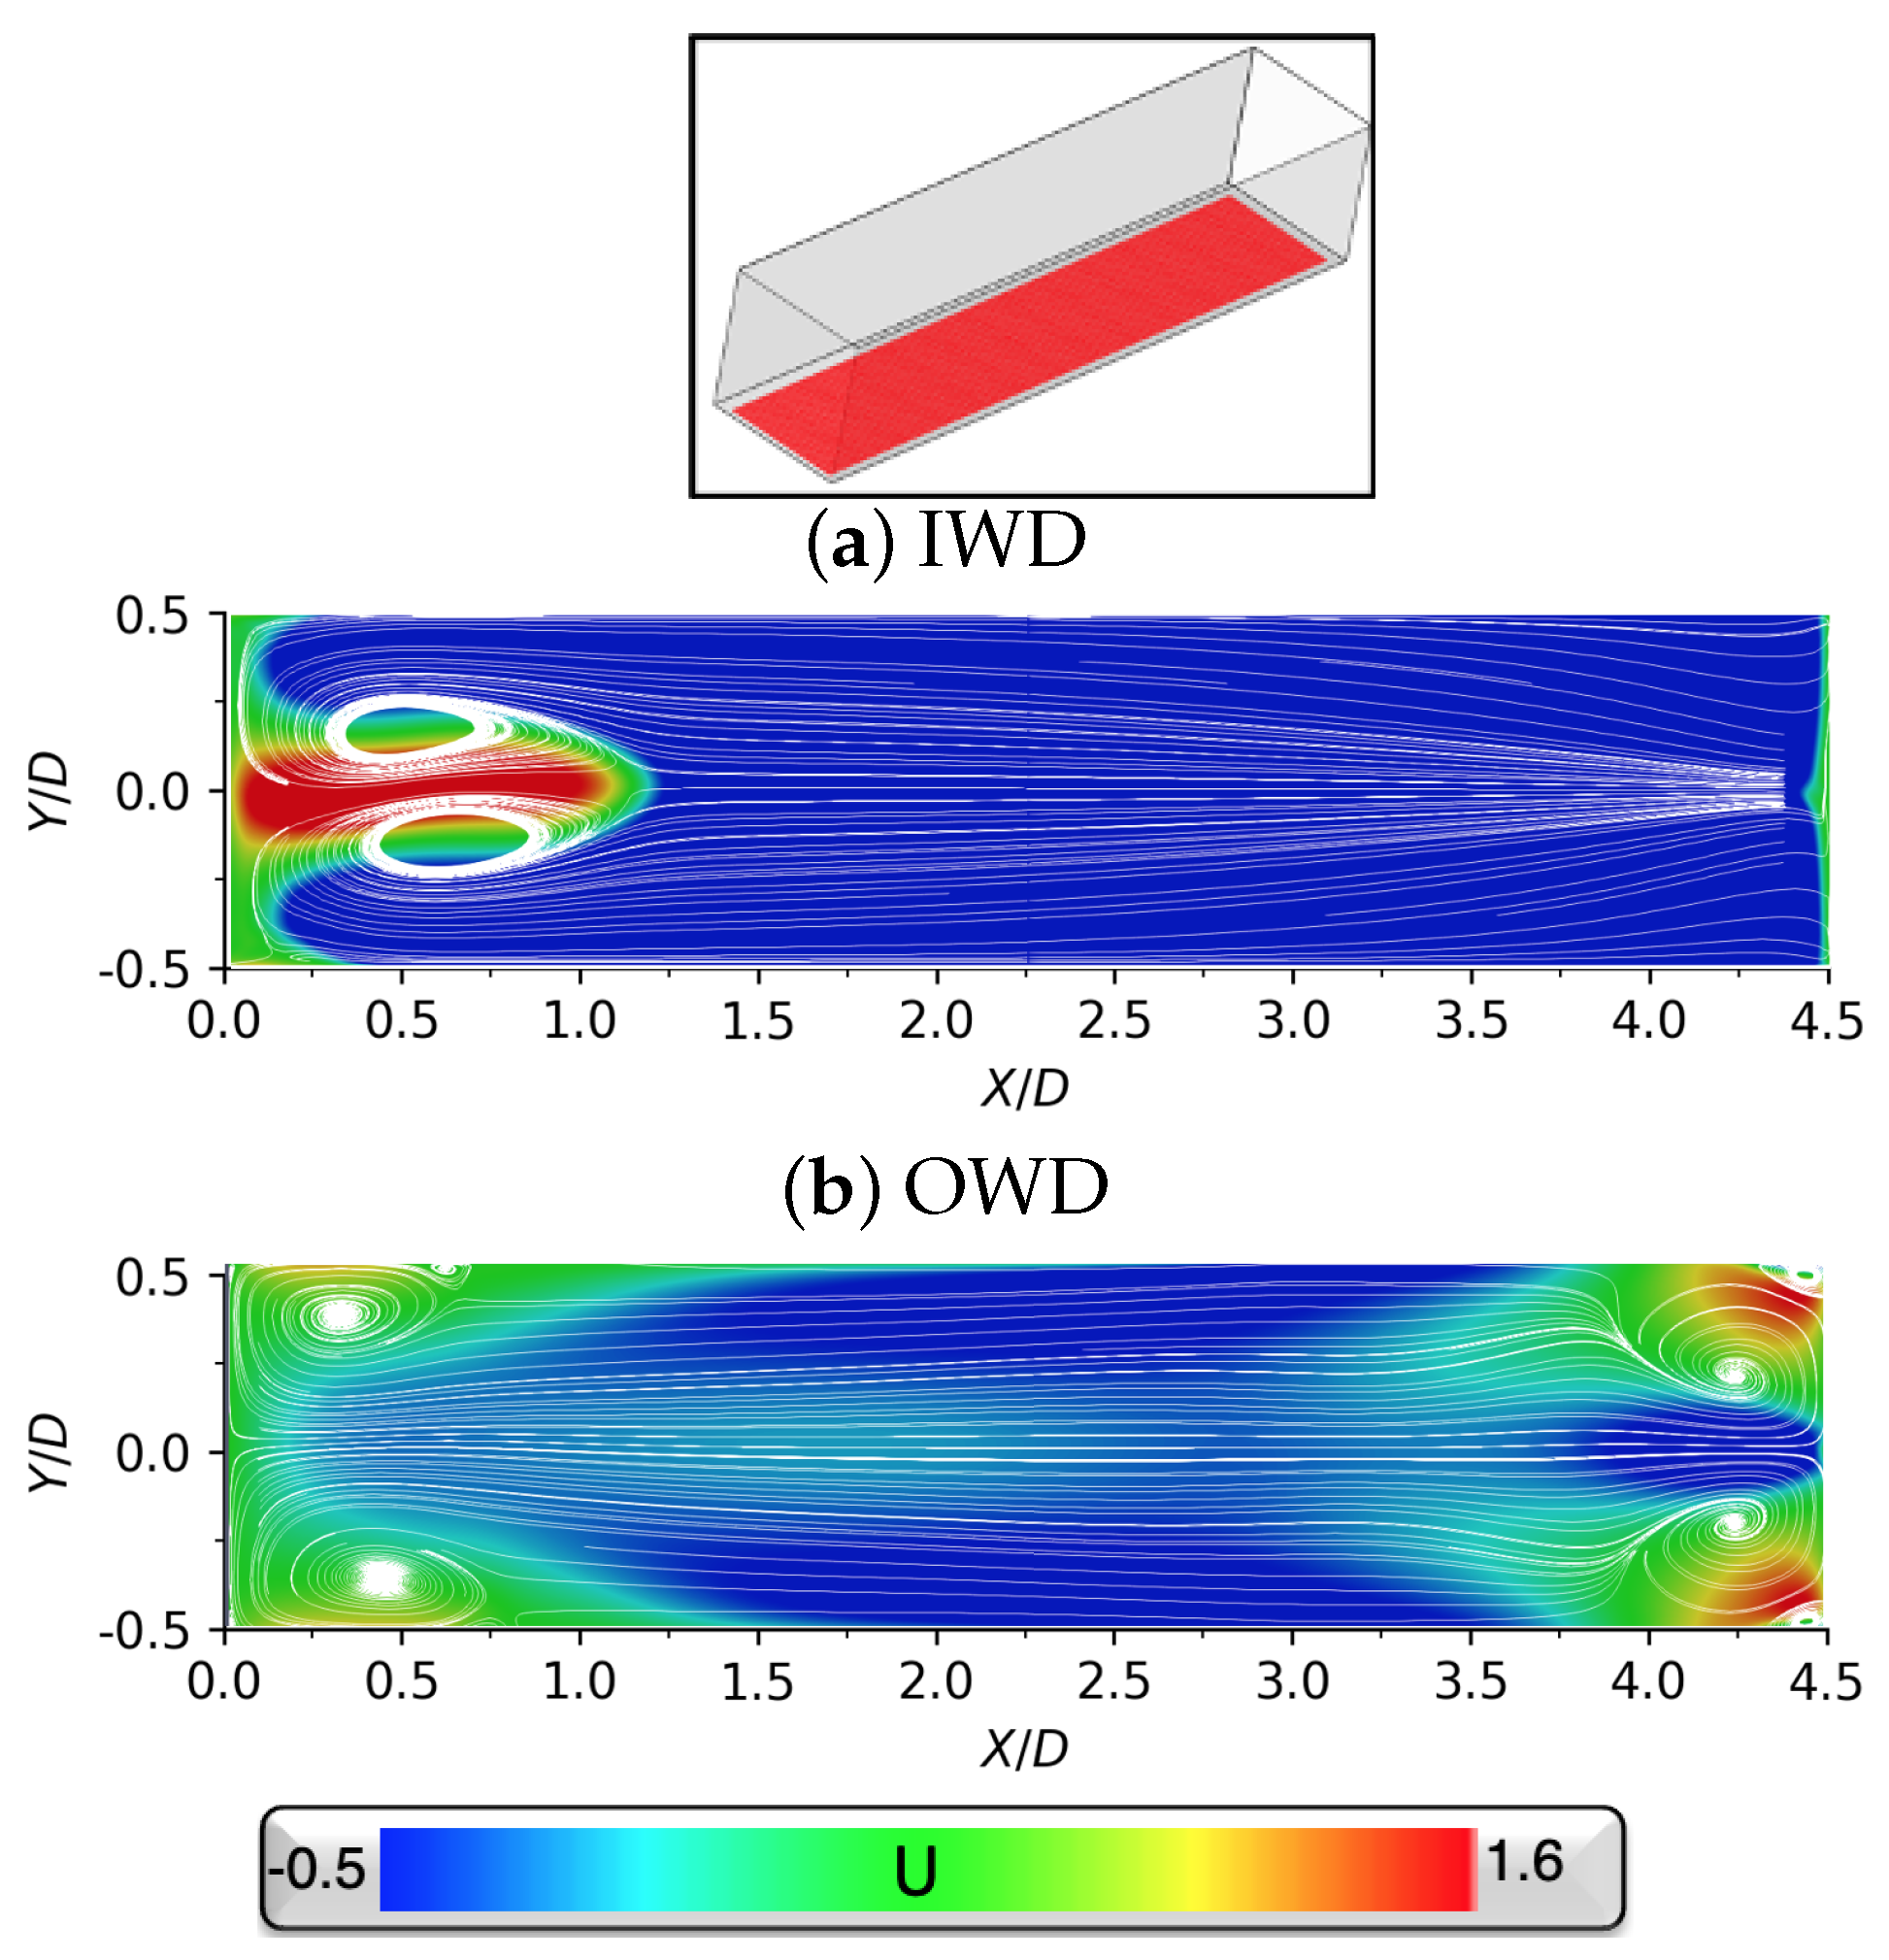
The resulting development of the flow field due to the back wall pressure distributions is evident in 2D restricted streamlines near the cavity floor in Figure 15, performed in the same manner as that of the fully open doors. For the IWD in Figure 15a at 67.5 ° , a clear vortex system is apparent upstream in the cavity near the front wall, with most of the flow being reversed by the large recirculation region, similar to that observed in the fully open doors configurations. However, in contrast to the fully open configuration, a nearly symmetric system of two counter-rotating vortices is observed near the spanwise center of the cavity upstream. Though nearly symmetric, the low-frequency quasi-periodic behavior of the shear layer remains a possibility, which may cause the vortex pair to alternate in size and position. In contrast, the OWD in Figure 15b, which experiences this successive bifurcation at 45 ° , now becomes spanwise symmetric. This system is similar to that of sliding doors discussed in Ref. [61], where the twin tornado vortices form near the front wall corners and are nearly equal in size, unlike the fully open configurations. This similarity is also due to a system of counter-rotating vortices forming near the back wall that push fluid upstream and feed the twin-tornado vortex. The interactions and behavior of these corner vortices become much more complex as the flow evolves vertically in the cavity.
Figure 16 displays the development of the above-discussed structures near the cavity midplane For the IWD in Figure 16a, a dominant region of forward (downstream) moving flow is observed, the reasons for which are similar to the fully open configuration, where the inward shocks deflect the shear layer into the cavity, though to a greater extent at this smaller door angle. This effect is also evident in centerline data, presented for completeness in Figure 17a. Unlike in the fully open configuration or the previous figure, a vortex pair may be observed near the back wall, feeding the tornado vortices upstream; this is consistent with the vertical distributions of pressure gradients observed in Figure 13a. Reversed regions of flow at the upstream corners are also observed along the midplane, unlike the fully open doors configurations, thus resulting in a larger and more coherent twin tornado vortices. In Figure 18a, this centered twin-tornado vortex system injects fluid into the shear layer as designated by the red arrows. In particular, this occurs on the spanwise edges of each vortex, which are near the center, and feeds back into the portion of the shear layer impinging on the back wall corners.
In contrast, the OWD in Figure 16b, display a very different system of interacting vortex pairs. Though counter-rotating vortex pairs still exist both near the front and back walls, a secondary system is introduced further upstream of the back wall. This is attributed to the increased level of shear layer entrainment near the center of the cavity, causing significant forward motion near the center and reversed flow near the sidewalls. In this configuration, the counter-rotating vortex pair near the back wall feeds the secondary vortex pair, which then, in turn, feeds the twin tornado vortices. As a result of multiple vortex pairs, the primary recirculation region becomes significantly distorted compared to the fully open OWD as seen in Figure 10b. Streamlines are clearly evident near the sidewalls that lead back into the preferred shear layer impingement regions in Figure 13b, similar to that of previous observations.

4. Conclusions and Future Work

This paper discusses the effect of doors in different stages of quasi-static opening on the 3D dynamic structures of cavity flows. Particular emphasis is placed on understanding shear layer bifurcation and 3D structures within the cavity. Both door configurations experience a different form of shear layer bifurcation when fully open compared to the baseline. Furthermore, they display an additional bifurcation at a critical door angle. When fully open, the shear layer bifurcation results in a pressure loading on the back wall with two regions of preferential impingement for both door configurations. For the IWD, this distribution was nearly symmetric and resulted in a spanwise symmetric system where a pair of counter-rotating vortices developed upstream. However, due to the deflection of the shear layer into the cavity from the inward shocks, the strengthened recirculation region dominates, resulting in no tornado vortex. In contrast, the OWD displayed preferential impingement on one corner of the back wall leading edge near the water line. This asymmetry manifested in a more centered tornado vortex compared with the baseline no-doors configuration, with streamlines leading back into the shear layer near the spanwise center of cavity, coinciding with the region of maximum pressure on the back wall.
Upon closing, both doors reached a critical angle at which they experienced a successive bifurcation of the shear layer, at 67.5 ° and 45 ° for the IWD and OWD, respectively. This results in the maximum pressure loading on the back wall, changing from two preferential impingement locations to three, referred to as ‘tristable’. The shear layer behavior change caused the flow to become symmetric for the OWD and results in a system of counter-rotating vortex pairs near the upstream (twin-tornado vortex) and downstream walls, with the downstream vortices forming near the location of preferred impingements on the back wall ( Z / D 0.5 ). As the flow evolves vertically from the cavity floor, a secondary pair of vortices is observed directly upstream of the back wall vortex pair, resulting in a complex 3D phenomena that distort the primary recirculation region. A similar observation is made in the 3D stream lines, where the twin-tornado vortices near the front wall corners become entrained by the shear layer and travel near the regions of preferred impingements on the sides of the back wall center. The IWD displayed a similar ‘tristable’ pressure distribution, though it was centered near the cavity leading edge ( Z / D = 0.0 ). This resulted in the development of a back wall vortex pair near the cavity mid-span as opposed to the floor, as seen in the OWD. Furthermore, a similar twin-tornado vortex pair to that of the OWD was observed. However, for the IWD, this pair formed near the spanwise center, resulting in preferential streamlines near the edge of the centered vortices and in the preferred impingement regions.
Several possible directions for future work may be specified. First, since a clear bifurcation occurs as the doors are closed, the question arises about the angle at which the flow reverts during the opening process. Such a study, especially one that uses a scale-resolved approach that first lowers the angle and then increases it, would help assess the possibility and details of hysteresis. Second, the occurrence of an asymmetric solution in the symmetric cavity configuration prompts a study of whether the effect of sideslip would be to promote or demote the asymmetry. A final area of interest is to study the effects of asymmetric door opening on the flow. Specifically, this is the circumstance where one door is opened at a different angle than the others. These analyses would facilitate further investigation into the non-linear dynamics of cavities with and without doors, giving potential insight into resonance mechanisms and behavior beyond that of what is captured with the standard Rossiter model.

Author Contributions

Simulation: S.B.; Data processing, conceptualization, writing: S.B. and D.G.; Validation data and analysis: R.S. and S.S.; experimental results and analysis: B.O. and R.K. All authors have read and agreed to the published version of the manuscript.

Funding

The authors acknowledge the Air Force Office of Scientific Research and the Collaborative Center for Aeronautical Sciences for funding this research.

Data Availability Statement

The presented results are approved for reader viewing and distribution.

Acknowledgments

The authors are grateful for the computational time provided by the DoD High Performance Computing Modernization Office at the AFRL, ARL and Navy DSRCs. This work is declared Distribution A, approved for public release; distribution unlimited (PA Number AFRL-2025-2261). All authors have read and agreed to the published version of the manuscript.

Conflicts of Interest

The authors declare no conflicts of interest.

Abbreviations

The following abbreviations and nomenclature are used in this manuscript:
C p pressure coefficient
C A D Computer Aided Design
D E S Detached Eddy Simulation
D D E S Delayed DES
D N S Direct Numerical Simulation
d B Decibel
ffrequency
I W D Inner Wedge Doors
k c shear layer convective speed
L E S Large Eddy Simulation
L: W c a v :Dcavity length, width, and depth ratio
MMach number
O W D Outer Wedge Doors
ninteger, frequency interval
N D No Doors
Ppressure
rrecovery factor
R A N S Reynolds Averaged Navier–Stokes
R e D Reynolds number based on cavity depth
R e m Reynolds number per meter ρ U inf μ
S i j strain rate tensor
S t L length based Strouhal number
Ttemperature
T V tornado vortex
u , v , w streamwise, spanwise and wall normal velocities
x , y , z streamwise, spanwise and wall normal directions
α phase lag
δ boundary layer thickness
η correction factor
ρ density
γ ratio of specific heats
ω vorticity
ϕ door angle
ϕ c critical door angle
τ i j modeled shear stress tensor
[ ] freestream value
[ ] * non-dimensionalized quantity
[ ] 0 stagnation value
[ ] fluctuating quantity
[ ] vector quantity
[ ] T transposed vector or matrix

References

  1. Rockwell, D. Review—Self-Sustaining Oscillations of Flow Past Cavities. AIAA J. 1978, 100, 152–165. [Google Scholar] [CrossRef]
  2. Lin, J.C.; Rockwell, D. Organized Oscillations of Initially Turbulent Flow past a Cavity. AIAA J. 2001, 39, 1139–1151. [Google Scholar] [CrossRef]
  3. Cattafesta, L.N.; Williams, D.R.; Rowley, C.W.; Alvi, F.S. Review of active control of flow-induced cavity resonance. In Proceedings of the 33rd AIAA Fluid Dynamics Conference and Exhibit, Orlando, FL, USA, 23–26 June 2003. [Google Scholar]
  4. Rossiter, J. Wind Tunnel Experiments on the Flow over Rectangular Cavities at Subsonic and Transonic Speeds. Ministry of Aviation, Aeronautical Research Council, Reports and Memoranda. 1964, Volume 1. Available online: https://reports.aerade.cranfield.ac.uk/handle/1826.2/4020 (accessed on 17 March 2023).
  5. Cattafesta, L.N.; Song, Q.; Williams, D.R.; Rowley, C.W.; Alvi, F.S. Active control of flow-induced cavity oscillations. Prog. Aerosp. Sci. 2008, 44, 479–502. [Google Scholar] [CrossRef]
  6. Saddington, A.; Thangamani, V.; Knowles, K. A comparison of passive control methods for a cavity in transonic flow. J. Aircr. 2016, 53, 1439–1447. [Google Scholar] [CrossRef]
  7. Ukeiley, L.S.; Ponton, M.K.; Seiner, J.M.; Jansen, B. Suppression of Pressure Loads in Cavity Flows. AIAA J. 2004, 42, 70–79. [Google Scholar] [CrossRef]
  8. Vakili, A.D.; Gauthier, C. Control of cavity flow by upstream mass-injection. J. Aircr. 1994, 31, 169–174. [Google Scholar] [CrossRef]
  9. Rizzetta, D.P.; Visbal, M.R. Large-eddy simulation of supersonic cavity flowfields including flow control. In Proceedings of the 32nd AIAA Fluid Dynamics Conference and Exhibit, St. Louis, MI, USA, 24–26 June 2002; Volume 41. [Google Scholar] [CrossRef]
  10. Sun, Y.; Taira, K.; Cattafesta, L.N.; Ukeiley, L.S. Spanwise effects on instabilities of compressible flow over a long rectangular cavity. Theor. Comput. Fluid Dyn. 2017, 31, 555–565. [Google Scholar] [CrossRef]
  11. Lawson, S.J.; Barakos, G.N. Review of numerical simulations for high-speed, turbulent cavity flows. Prog. Aerosp. Sci. 2011, 47, 186–216. [Google Scholar] [CrossRef]
  12. Sun, Y.; Liu, Q.; Cattafesta, L.N.; Ukeiley, L.S.; Taira, K. Effects of side-walls and leading-edge blowing on flows over long rectangular cavities. AIAA J. 2019, 57, 106–119. [Google Scholar] [CrossRef]
  13. Larcheveque, L.; Sagaut, P.; Labbe, O. Large-eddy simulation of a subsonic cavity flow including asymmetric three-dimensional effects. J. Fluid Mech. 2007, 577, 105–126. [Google Scholar] [CrossRef]
  14. Heller, H.; Bliss, D. The physical mechanism of flow-induced pressure fluctuations in cavities and concepts for their suppression. In Proceedings of the 2nd Aeroacoustics Conference, Hampton, VA, USA, 24–26 March 1975; pp. 75–491. [Google Scholar] [CrossRef]
  15. Powell, A. The sound-producing oscillations of round underexpanded jets impinging on normal plates. J. Acoust. Soc. Am. 1988, 83, 515–533. [Google Scholar] [CrossRef]
  16. Wagner, J.L.; Beresh, S.J.; Casper, K.M.; DeMauro, E.P.; Arunajatesan, S. Resonance Dynamics in Compressible Cavity Flows using Time-Resolved Particle Image Velocimetry and Pressure Sensitive Paint. In Proceedings of the 55th AIAA Aerospace Sciences Meeting, Grapevine, TX, USA, 9–13 January 2015. [Google Scholar] [CrossRef]
  17. Basley, J.; Pastur, R.L.; Lusseyran, F.; Soria, J.; Delprat, N. On the modulating effect of three-dimensional instabilities in open cavity flow. J. Fluid Mech. 2014, 759, 546–578. [Google Scholar] [CrossRef]
  18. Knisley, C.; Rockwell, D. Self-sustained low-frequency components in an impinging shear layer. J. Fluid Mech. 1982, 116, 157–186. [Google Scholar] [CrossRef]
  19. Delprat, N. Rossiter’s formula: A simple spectral model for a complex amplitude modulation process? Phys. Fluids 2006, 18, 071703. [Google Scholar] [CrossRef]
  20. Gai, S.L.; Kleine, H.; Andrew, J.N. Supersonic Flow over a Shallow Open Rectangular Cavity. J. Aircr. 2015, 52, 609–616. [Google Scholar] [CrossRef]
  21. Doshi, P.S.; Ranjan, R.; Gaitonde, D.V. 2D and 3D stability of cavity flows in high Mach number regimes. In Proceedings of the ASME 2019 International Mechanical Engineering Congress and Exposition, Salt Lake City, UT, USA, 11–19 November 2019; Volume 7, pp. 1–10. [Google Scholar] [CrossRef]
  22. Bourquard, C.; Faure-Beaulieu, A.; Noiray, N. Whistling of deep cavities subject to turbulent grazing flow: Intermittently unstable aeroacoustic feedback. J. Fluid Mech. 2020, 909, 1–29. [Google Scholar] [CrossRef]
  23. Beresh, S.J.; Wagner, J.L.; Casper, K.M. Supersonic flow over a finite-width rectangular cavity. AIAA J. 2015, 53, 296–310. [Google Scholar] [CrossRef]
  24. Wagner, J.; Beresh, S.; Casper, K.; DeMauro, E.; Lynch, K.; Spillers, R.; Henfling, J.; Spitzer, S. Effects of cavity width on resonance dynamics using planform time-resolved particle image velocimetry. AIAA J. 2018, 2018-0359, 660–675. [Google Scholar]
  25. Bres, G.A.; Colonius, T. Direct numerical simulations of three-dimensionl cavity flows. In Proceedings of the 13th AIAA/CEAS Aeroacoustics Conference (28th AIAA) Aeroacoustics Conference), Southamptonm, UK, 14–17 June 2007; pp. 1–16. [Google Scholar] [CrossRef]
  26. Basley, J.; Pastur, L.R.; Delprat, N.; Lusseyran, F. Space-time aspects of a three-dimensional multi-modulated open cavity flow. Phys. Fluids 2013, 25, 064105. [Google Scholar] [CrossRef]
  27. Casper, K.M.; Wagner, J.L.; Beresh, S.J.; Spillers, R.W.; Henfling, F.J.; Dechant, L.J. Spatial distribution of pressure resonance in compressible cavity flow. J. Fluid Mech. 2018, 848, 660–675. [Google Scholar] [CrossRef]
  28. Chin, D.; Granlund, K.; Maatz, I.; Schmit, R.F.; Reeder, M.F. Stochastic store trajectory of ice models from a cavity into supersonic flow. J. Aircr. 2019, 56, 1313–1319. [Google Scholar] [CrossRef]
  29. Chin, D.; Turpin, A.; Granlund, K. Time-dependent aerodynamic loads on single and tandem stores in a supersonic cavity. J. Aircr. 2020, 57, 702–714. [Google Scholar] [CrossRef]
  30. Wagner, J.L.; Casper, K.M.; Beresh, S.J.; Hunter, P.S.; Spillers, R.W.; Henfling, J.F. Response of a store with tunable natural frequencies in compressible cavity flow. J. Aircr. 2016, 53, 2351–2360. [Google Scholar] [CrossRef]
  31. Crook, D.; Lao, T.C.W.; Kelso, R.M. Three-dimensional flow within shallow, narrow cavities. J. Fluid Mech. 2013, 735, 587–612. [Google Scholar] [CrossRef]
  32. Turpin, A.M.; Speth, R.L.; Sherer, S.E.; Granlund, K.O. Low-frequency, spanwise oscillation in a finite-width cavity at Mach 1.5. Phys. Fluids 2021, 33, 076102. [Google Scholar] [CrossRef]
  33. Williams, O.J.; Smits, A.J. Asymmetries in Nominally Symmetric Flows. Annu. Rev. Fluid Mech. 2025, 57, 35–60. [Google Scholar] [CrossRef]
  34. Mallat, B.; Pastur, L.R. Experimental study and passive control of the bistable dynamics of the three-dimensional air-wake flow of a finite-width double backward-facing step. J. Wind. Eng. Ind. Aerodyn. 2021, 215, 104702. [Google Scholar] [CrossRef]
  35. Herry, B.; Keirsbulck, L.; Labraga, L.; Paquet, J.-B. Flow Bistability Downstream of Three-Dimensional Double Backward Facing Steps at Zero-Degree Sideslip. J. Fluids Eng. 2011, 133, 054501. [Google Scholar] [CrossRef]
  36. He, K.; Minelli, G.; Su, X.; Gao, G.; Krajnović, S. On state instability of the bi-stable flow past a notchback bluff body. J. Fluid Mech. 2022, 931, R6. [Google Scholar] [CrossRef]
  37. Zeng, R.; Li, S. Bistability of turbulent flow in open-channel expansion: Characterization and suppression. Phys. Fluids 2022, 34, 065106. [Google Scholar] [CrossRef]
  38. Pavia, G.; Passmore, M.; Varney, M.; Hodgson, G. Salient three-dimensional features of the turbulent wake of a simplified square-back vehicle. J. Fluid Mech. 2020, 888, A33. [Google Scholar] [CrossRef]
  39. Luo, Y.; Luo, Y.; Tian, H.; Wu, C.; Li, H.; Wang, Y. Open the ORCID record for Yimin Wang [Opens in a new window] and Shuhai Zhang Open the ORCID record for Shuhai Zhang Evolution of tornado-like vortices in three-dimensional compressible rectangular cavity flows. J. Fluid Mech. 2022, 955, A9. [Google Scholar] [CrossRef]
  40. Ashton, R.; Refan, M.; Iungo, G.V.; Hangan, H. Wandering corrections from PIV measurements of tornado-like vortices. J. Wind. Eng. Ind. Aerodyn. 2019, 189, 163–172. [Google Scholar] [CrossRef]
  41. Douay, C.L.; Lusseyran, F.; Pastur, L.R. The onset of centrifugal instability in an open cavity flow. Fluid Dyn. Res. 2016, 48, 061410. [Google Scholar] [CrossRef]
  42. Douay, C.L.; Pastur, L.R.; Lusseyran, F. Centrifugal instabilities in an experimental open cavity flow. J. Fluid Mech. 2016, 788, 670–694. [Google Scholar] [CrossRef]
  43. Picella, F.; Loiseau, J.-C.; Lusseyran, F.; Robinet, J.-C.; Cherubini, S.; Pastur, L. Successive bifurcations in a fully three-dimensional open cavity flow. J. Fluid Mech. 2018, 844, 855–877. [Google Scholar] [CrossRef]
  44. Unalmis, O.; Clemens, N.T.; Dolling, D.S. Cavity oscillation mechanisms in high-speed flows. AIAA J. 2004, 42, 2035–2041. [Google Scholar] [CrossRef]
  45. Turpin, A.M.; Chin, D.; Granlund, K. Supersonic cavity flow subjected to continuous and transient leading-edge blowing. AIAA J. 2020, 58, 4415–4425. [Google Scholar] [CrossRef]
  46. Outten, B.; Sheehan, M.; Mehta, Y.; Kumar, R. Effect of Doors on Cavity Acoustics at Supersonic Speeds. In Proceedings of the AIAA SCITECH 2022 Forum, San Diego, CA, USA, 3–7 January 2022. [Google Scholar] [CrossRef]
  47. Sheta, E.F.; Harris, R.E.; George, B.; Ukeiley, L.; Luke, E. Loads and Acoustics Prediction on Deployed Weapons Bay Doors. J. Vib. Acoust. 2017, 139, 031007. [Google Scholar] [CrossRef]
  48. Casper, K.M.; Wagner, J.L.; Beresh, S.J.; Henfling, J.F.; Spillers, R.W.; Pruett, B.O. Complex geometry effects on cavity resonance. AIAA J. 2016, 54, 320–330. [Google Scholar] [CrossRef]
  49. Barakos, G.; Lawson, S.; Steijl, R. Numerical Simulations of High-Speed Turbulent Cavity Flows. Flow Turbul. Combust. 2009, 83, 569–585. [Google Scholar] [CrossRef]
  50. Baugher, S.K.; Outten, B.; Gaitonde, D.V.; Kumar, R. 3D Effects of Quasi-Static Door Opening on Supersonic Cavity Flows. In Proceedings of the AIAA SCITECH 2024 Forum, Orlando, FL, USA, 8–12 January 2024; pp. 2024–2729. [Google Scholar]
  51. Spalart, P.; Allmaras, S. A one-equation turbulence model for aerodynamic flows. AIAA J. 1994, 439, 5–21. [Google Scholar] [CrossRef]
  52. Outten, B.S.; Sheehan, M.; Kumar, R.; Baugher, S.; Gaitonde, D.V. Effect of Dynamic Door Motion on Cavity Acoustics at Supersonic Speeds. In Proceedings of the AIAA SCITECH 2024 Forum, Orlando, FL, USA, 8–12 January 2024. [Google Scholar]
  53. Jespersen, D.; Pulliam, T.H.; Childs, M. OVERFLOW Turbulence Modeling Resource Validation Results. Technical Report, NAS Technical Report: NAS-2016-01. 2016. Available online: https://turbmodels.larc.nasa.gov/Papers/NAS_Technical_Report_NAS-2016-01.pdf (accessed on 7 July 2019).
  54. NASA. Overflow Resource. Available online: https://overflow.larc.nasa.gov/ (accessed on 12 October 2019).
  55. Anderson, J.D. Computational Fluid Dynamics: An Introduction; Springer: Berlin/Heidelberg, Germany, 2016. [Google Scholar] [CrossRef]
  56. Titarev, V.A.; Toro, E.F. Finite-volume WENO schemes for three-dimensional conservation laws. J. Comput. Phys. 2004, 201, 238–260. [Google Scholar] [CrossRef]
  57. Tramel, R.; Nichols, R.; Buning, P. Addition of Improved Shock-Capturing Schemes to OVERFLOW 2.1. In Proceedings of the 19th AIAA Computational Fluid Dynamics, San Antonio, TX, USA, 22–25 June 2009. [Google Scholar] [CrossRef]
  58. NASA. Chimera Grid Tools Resource. Available online: https://www.nas.nasa.gov/software/chimera.html (accessed on 9 June 2022).
  59. Grace, S.M.; Dewar, W.G.; Wroblewski, D.E. Experimental investigation of the flow characteristics within a shallow wall cavity for both laminar and turbulent upstream boundary layers. Exp. Fluids 2004, 36, 791–804. [Google Scholar] [CrossRef]
  60. Baugher, S.K.; Prasad, C.; Gaitonde, D.V. Large Eddy Simulation and Modal Analysis of Cavity Bays with Different Door Configurations. In Proceedings of the AIAA SCITECH 2022 Forum, San Diego, CA, USA, 3–7 January 2022. [Google Scholar] [CrossRef]
  61. Baugher, S.K.; Speth, R.; Sherer, S.; Gaitonde, D.V. 3D Cavity Bay Dynamics with Effect of Doors. In Proceedings of the AIAA SCITECH 2024 Forum, Orlando, FL, USA, 8–12 January 2024. [Google Scholar] [CrossRef]
Figure 1. Simplified cavity flow schematic depicting the defining features of cavity flow ( L D = 4.5 ).
Aerospace 12 00668 g001
Figure 2. (a) Experimental CAD used for the quasi-static door openings in the Polysonic-Wind Tunnel at Mach 1.6 using IWD and (b) OWD with red lines denoting inward and outward shocks and (c) example of experimental geometries used for quasi-static door angles with the OWD.
Aerospace 12 00668 g002
Figure 3. (a) Schematic of grids defining cavity and refinement regions, totaling 8 blocks and implemented for all grids. (b) Schematic of OVERSET grid construction near the leading edge. Grids resolving the leading edge, wedge shape and grids connecting the door to hinge are displayed using every 2nd grid point.
Aerospace 12 00668 g003
Figure 4. Pressure averages along the back wall as obtained from computation using conditional averaging, while the shear layer prefers one side of impingement (top row) and corresponding vortex impingement (bottom row). (a) displays preferential impingement from a conditionally averaged DDES, while (b) displays the corresponding RANS solutions. Dashed lines are plotted later in the door sections.
Aerospace 12 00668 g004
Figure 5. (a) 3D streamlines calculated from the mean flow when shear layer prefers left side of the back wall, with different regimes separated by color (red: tornado vortex, white: primary recirculation) from DDES. (b) U-velocity contours overlaid with 2D streamlines near the cavity floor on the left, and midway through the cavity on the right, for DDES (c) RANS comparison to DDES data. (d) Experimental oil flow validating the observed streamlines from the mean flows above.
Aerospace 12 00668 g005
Figure 6. Overview of fully open IWD and OWD door flow fields. Left side of symmetry displays density gradient (horizontal plane, black to white) and vorticity magnitude (vertical plane, green to yellow), and right side of symmetry shows streamwise velocity (horizontal plane, blue to red). Features of IWD figure (a), include inward shocks (1), shock intersection (2), expansions (3), reflected shocks (4), wedge vortex (5), door boundary layers (6) and trailing edge vortex shear layer (7). For the OWD (b), notations include the outer shocks (1), expansions (2), wedge vortex (3), door boundary layer (4) and trailing edge vortex shedding (5).
Aerospace 12 00668 g006
Figure 7. (a) Experimental comparison with centerline pressure data using the coefficient of pressure ( C p ) using all configurations, including mesh study. (b) Streamwise velocity contours overlaid by 2D streamlines along the centerline ( Y / D = 0 ) for the IWD and (c) OWD configurations.
Aerospace 12 00668 g007
Figure 8. (a) 2D streamwise velocity contours overlaid with streamlines near the cavity floor at Z / D = 0.95 for the IWD, and (b) OWD. Computational plots are complemented by the black and white experimental oil flows below.
Aerospace 12 00668 g008
Figure 9. (a) 2D streamwise velocity contours overlaid with restricted streamlines near the cavity midplane at Z / D = 0.45 for the IWD and (b) OWD.
Aerospace 12 00668 g009
Figure 10. 3D streamlines with regions separated by color. Red lines in the region of the tornado vortex, if one exists, gray/white lines represent the primary recirculation. (a) The IWD display an extension of the recirculation region and no tornado vortex (b) while the OWD display a prominent tornado vortex.
Aerospace 12 00668 g010
Figure 11. (a) Pressure contours near the back wall of the IWD with pressure levels of min = 0.8, max = 1.2 and (b) OWD with pressure levels of min = 0.8, max = 0.9. Both configurations display a bifurcation of the shear layer with two locations of preferred shear layer impingement on the back wall.
Aerospace 12 00668 g011
Figure 12. Line plot of spanwise non-dimensional pressure along a Z / D = 0.05 line along the back wall. Black lines in the contours show where data were extracted. The baseline RANS configuration without doors (ND) and the validated DDES/experimental data were plotted as well for reference.
Aerospace 12 00668 g012
Figure 13. Pressure contours displaying a second bifurcation of the shear layer at the critical door angle, resulting in three preferred impingement regions with the (a) IWD and (b) OWD. Pressure contours of the IWD contain pressure levels of min = 0.8, max = 1.2 and OWD with pressure levels of min = 0.8, max = 0.9. Planes are located near the back wall of the IWD at (a) 67.5 ° and (b) OWD at 45 ° .
Aerospace 12 00668 g013
Figure 14. Line plot of spanwise non-dimensional pressure along a Z / D = 0.5 line along the back wall for all cases except IWD, where data were extracted along a Z / D = 0.05 line. The baseline RANS case without doors (ND) and the validated DDES/experimental data were plotted as well for reference.
Aerospace 12 00668 g014
Figure 15. 2D streamwise velocity contours overlaid with streamlines near the cavity floor at Z / D = 0.9 for (a) the IWD at 67.5 ° , and (b) OWD 45 ° at critical door angle.
Aerospace 12 00668 g015
Figure 16. 2D streamwise velocity contours overlaid with streamlines taken near the cavity mid span at Z / D = 0.45 for the (a) IWD at 67.5 ° and (b) OWD 45 ° at critical door angle.
Aerospace 12 00668 g016
Figure 17. (a) Experimental comparison with centerline pressure data using the coefficient of pressure using all configurations in. (b) Streamwise velocity contours overlaid by 2D streamlines along the centerline ( Y / D = 0 ) for the IWD (c) and OWD configurations.
Aerospace 12 00668 g017
Figure 18. 3D streamlines calculated from the RANS solution at the door critical angle. Red represents the twin-tornado vortex system near the front wall, while the white region represents the primary recirculation. (a) The IWD display a centered twin tornado vortex system while (b) the OWD twin tornado vortices form near the front wall corners.
Aerospace 12 00668 g018
Table 1. Inflow conditions measured at the FSU Polysonic wind tunnel, used to initiate computations and ensure matching flow characteristics such as boundary layer height at separation ( δ ) of the cavity leading edge.
ParameterPolysonic Wind Tunnel (FSU)
Mach1.6
T 0 292 K
P 0 20.6 kPa
R e m 30 × 10 6
δ 11.1 mm
D50.1 mm
L / D 4.5
Table 2. Grid densities for each level of refinement using the OVERFLOW toolset.
GridBaselineIWD/OWD
Nominal 28 × 10 6 48 × 10 6
Fine 73 × 10 6 138 × 10 6
Disclaimer/Publisher’s Note: The statements, opinions and data contained in all publications are solely those of the individual author(s) and contributor(s) and not of MDPI and/or the editor(s). MDPI and/or the editor(s) disclaim responsibility for any injury to people or property resulting from any ideas, methods, instructions or products referred to in the content.