Abstract
This paper aims to analyze the performance of a tilt-rotor fixed-wing RPAS (Remotely Piloted Aircraft System) using a segmented approach, focusing on a nominal mission for SAR (Search and Rescue) applications. The study employs optimization techniques tailored to each segment to meet power consumption requirements, and the results highlight the accuracy of the physical characterization, which incorporates nonlinear propulsive and aerodynamic models derived from wind tunnel test campaigns. Critical segments for this nominal mission, such as the vertical take off or the transition from vertical to horizontal flight regimes, are addressed to fully understand the performance response of the aircraft. The proposed framework integrates experimental models into trajectory optimization procedures for each segment, enabling a realistic and modular analysis of energy use and aerodynamic performance. This approach provides valuable insights for both flight control design and future sizing iterations of convertible UAVs (Uncrewed Aerial Vehicles).
1. Introduction
The goal of Search and Rescue (SAR) missions is to locate, stabilize and extract individuals in situations of distress. SAR operations are highly time-sensitive, as any delay in locating missing individuals can significantly reduce their chances of survival. Consequently, these missions demand the rapid deployment of personnel and resources—often challenging when such assets are not readily available. In recent years, uncrewed aerial vehicles (UAVs), have demonstrated the potential to accelerate this process, expedite interventions, lower risks for both rescuers and victims, and provide a cost-effective alternative to traditional SAR methods [1,2,3].
The conditions these platforms work under may vary significantly due to the unexpected nature of these endeavors. The main objectives to be addressed within a SAR mission are to minimize the duration of the search itself, to limit the loss of lives and property, to minimize injury and damage to the environment, and to avoid any risk to the team and the equipment when performing the mission.
In SAR missions, Rapid Intervention Vehicles (RIV) generally have space for only one small Remotely Piloted Aircraft System (RPAS), which typically employs either fixed-wing or rotary-wing designs. Fixed-wing aircraft are advantageous for fast deployment and long-range surveillance, yet they cannot hover and require auxiliary infrastructure (runways or catapults) for take off and landing. In return, they provide longer endurance and greater range, as well as the potential to carry heavier payloads or achieve higher speeds. By contrast, rotary-wing platforms (e.g., quadrotors) have much less flight autonomy and range but offer vertical take off and landing (VTOL) and the ability to hover, making them well-suited to operations in confined or hard-to-reach locations and for tasks demanding high maneuverability.
A third, less common option is the convertible fixed-wing aircraft with VTOL capabilities. These systems combine the benefits of both fixed-wing and rotary-wing designs, yet managing their power requirements across the entire flight profile can be challenging. Nevertheless, a single convertible UAV would enable a first-response RIV to carry out multiple missions using one versatile platform. This capability to take off and land vertically is invaluable when limited or no runway infrastructure is available, as is common in wilderness or disaster-stricken areas. By transitioning from VTOL to a fixed-wing flight mode, the aircraft can combine the benefits of hovering in tight spaces with the superior endurance and range offered by wing-borne flight. However, hovering and transitioning between flight modes often incur high power demands. If not carefully managed, these segments of the mission might reduce the platform’s effective range and battery endurance, which are critical factors in SAR missions.
Within this context, the ProVant-EMERGENTIa project (acronym of DevElopment of a unManned convErtible aircraft for rapid and efficient deployment in emerGENcy situaTIons) serves as a solution to increase the functional capabilities in these humanitarian missions. This is a multidisciplinary project composed of researchers of the University of Seville (Spain) in partnership with researchers from the Federal University of Minas Gerais (Brazil), the Federal University of Santa Caterina (Brazil), the Spanish Urgent Medical Assistance Services, and other institutions.
The ProVANT-EMERGENTIa project [4] has then as its final objective the design, manufacture, and development of an aircraft prototype that serves this kind of specific criteria. This prototype is considered an RPAS, with the capability of being fully automated, but it can be monitorized and controlled by an external pilot if required. The advantages of including to the SARs framework a vehicle of these characteristics include a rapid response and deployment of the platform, operational capabilities (large variety of sensors and real time data), efficiency in time and cost, usage of intelligent terrain recognition and search algorithms, and adaptability to hostile environment. The reduction of the platform size that is used for the SAR mission implies a noticeable saving on its operations. Tilt-rotor UAVs pose a unique challenge in performance optimization due to their compound nature, operating across distinct flight regimes with markedly different aerodynamic and propulsive demands. Transitions between vertical and horizontal flight, in particular, involve rapid shifts in control authority, energy consumption, and rotor dynamics. Traditional single-regime modeling approaches fall short in capturing these complex interactions. To address this, a segment-wise optimization strategy becomes essential, enabling tailored modeling and control for each mission phase. This modular approach not only reflects the physical behavior more accurately but also allows for targeted improvements in energy use, range, and maneuverability across the full mission envelope.
Figure 1 and Figure 2 show CAD models of the current design stage of the aircraft and a breakdown of its main subsytems. It is a tilt-rotor aircraft with a straight wing, two electric counter-rotating propellers located at its tips, and a V-tail. The orientation of the propellers with respect to the airframe can be modified by rotating the engine nacelles (see blue arrows in Figure 2). The longitudinal and directional aerodynamic control is achieved using two ruddervators located at the fins of the V-Tail (see Figure 2). These act as both rudder and tail elevators to control the vertical and lateral stability of the aircraft. An important challenge for this convertible configuration is identifying the power requirements to satisfy flying through the entire flight profile. For this purpose, it is necessary to identify the different flight phases of a typical SAR mission: vertical take off from the advanced command post, transition to a fixed-wing aircraft flight mode, climb to the desired cruise altitude (plane-mode climb), conduct a cruise flight, descent back to the vertical landing altitude, transition from plane-mode flight to return to axial flight, and vertical landing.
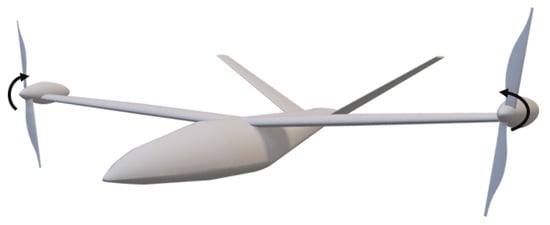
Figure 1.
Aircraft CAD render (CATIA V5) of the tilt-rotor all-electric UAV designed under the ProVANT-EMERGENTIa project. This configuration, including a straight wing and V-tail, is optimized for SAR operations requiring vertical takeoff and long-range cruise capabilities. The model serves as the physical reference for aerodynamic and propulsive analysis.
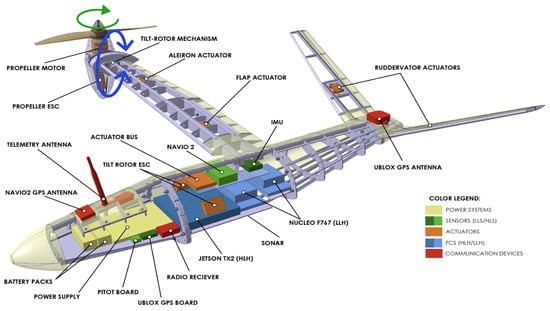
Figure 2.
Aircraft CAD model (CATIA V5) with a breakdown of its main subsystems.
The work presented in this document has as its prior objective to gain insight of the aircraft’s performance capabilities throughout different phases of a single flight profile. This study establishes the flight dynamics framework and constraints for that purpose. A nominal mission is defined (Figure 3), being segmented into phases where clear differences in the system dynamics can be stated, so various optimization strategies can be applied in order to optimize the overall energy consumption. Several projects [5,6,7] have addressed the characterization of the performance from the perspective of a single segment or regime, usually focusing on the take off and transition phases. This study serves as a presentation of preliminary but holistic view of an entire mission to further understand the mixed flight capabilities of this aircraft, also accounting for the added interest of including experimental models in the characterization of the aircraft.
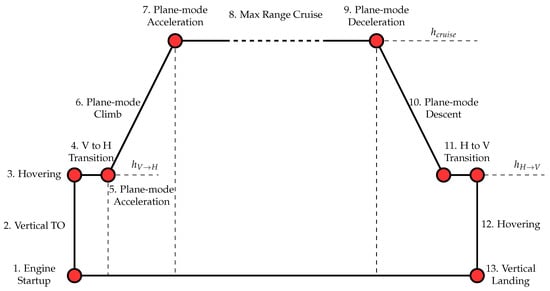
Figure 3.
Schematic of the nominal flight profile, segmented into 13 distinct flight phases ranging from engine start-up to vertical landing. This segmentation provides the structural foundation for the segmented analysis and optimization procedures developed in this study.
The nominal flight profile under investigation (numbering corresponds with Figure 3) commences with an engine startup lasting (1), with thrust being set to 60% of the aircraft’s total weight. This is followed by a vertical take off spanning two altitudes (2), resulting in a total ascent denoted as . Subsequently, a fixed-point hover of duration (3) simulates in-flight setup prior to transition. The axial to plane-mode flight transition (4) is executed through the tilt-rotor capabilities of the aircraft, concluding when the total speed reaches the minimum operative horizontal speed . The vehicle then accelerates at a constant altitude to the climb speed (5), followed by a fixed-speed climb (6) with a prescribed altitude increment of . This phase is succeeded by second acceleration to cruise speed (7) and a straight and level cruise flight at that constant speed (8), optimized to maximize range for a given battery charge . A plane-mode deceleration (9) precedes the descent, reducing the speed to . The aircraft then descends to a lower flight level specified by (10). A transition from plane mode to axial flight (11) is followed by a hover segment lasting (12). Finally, the vehicle descends vertically using the tilt-rotor capabilities (13), covering a vertical distance determined by .
This work presents a unified performance analysis framework for a tilt-rotor all-electric RPAS, specifically developed within the ProVANT-EMERGENTIa project. The novelty of the study lies in the segment-wise optimization of a complete nominal SAR mission, combining analytical formulations with experimental aerodynamic and propulsive models obtained through wind tunnel campaigns. Unlike previous approaches focused on isolated phases such as take-off or cruise, this methodology enables the evaluation and comparison of all flight segments under consistent modeling assumptions. By integrating real-world data into the optimization procedures, the proposed framework enhances predictive accuracy and provides a valuable basis for design iteration, energy management strategy selection, and trajectory planning for convertible UAV configurations.
The remainder of this paper is organized as follows. Section 2 describes the physical models employed for the flight dynamics, the aerodynamics, and the propulsive systems of the aircraft. The description of a characteristic mission to be conducted by the aircraft and how the flight dynamics are particularized to each individual segment is detailed in Section 3. Section 4 discusses the results of the simulations describing each segment’s performance calculations. Finally, Section 5 draws conclusions and presents some future work trends on this research.
2. Aircraft Modeling
This chapter serves as a breakdown of all the models used to characterize the aircraft, each tied to specific variables serving as inputs for the flight dynamics solvers.
2.1. Flight Dynamics Model
Several hypotheses are considered within this work to simplify the complexity of the flight dynamics model. Given preliminary estimations of the range and cruise altitude of this aircraft [8], a flat-earth model with constant gravity (g = 9.81 m/s2) and a steady atmosphere with no wind perturbations is assumed. A reference density is calculated at a characteristic altitude (h = 100 m), and since changes in altitude are small compared to changes in density in the nominal mission to be defined, it can be assumed to be constant ( = 1.2133 kg/m3). Moreover, as this research intends to gain preliminary insight into the point-mass flight dynamic trends that characterize this aircraft, the pitch moment equilibrium and the lateral flight dynamics are not considered within the scope of this work. This is a common practice in the state of the art in performance analysis and trajectory optimization [6,9,10]. Thus, a simplified point-mass model applies, by neglecting terms from the general body axes 6DOF Newton–Euler model approach. The frame of the body axis is located at the vehicle’s center of mass, where the X-axis is aligned with the center fuselage line, the Y-axis along the right wing, and the Z-axis faces downwards, perpendicular to the other set following the right hand rule. These equations assume a symmetric aircraft with respect to the OXZ plane and a rigid-body structure. Equations (1a)–(1e) represent the general set of equations to be addressed throughout the course of this study (that corresponds to the motion for a flight in a vertical plane in [11,12]).
In these equations, x denotes the horizontal position; h the altitude (hence it is ), V the velocity (aerodynamic speed) of the aircraft; is the flight-path (trajectory) angle; T is the total thrust; D and L are the aerodynamic drag and lift forces, respectively; m the mass of the aircraft (assumed constant, since the aircraft’s energy storage system is fully electric); the angle between the engine thrust and the velocity vector; E the energy released by the electrochemical batteries; P the power consumed by the propellers; and is the combined efficiency of all electrical effects (mainly the engine and Electronic Speed Controller or ESC) between the propellers and the battery stacks. The angle can be expressed as the sum of the angle of attack and the engine tilt angle defined as the angle between the thrust vector and the wing-fuselage body reference line. Figure 4 shows a diagram with all forces and angles involved in the performance calculations, where W is the weight ().
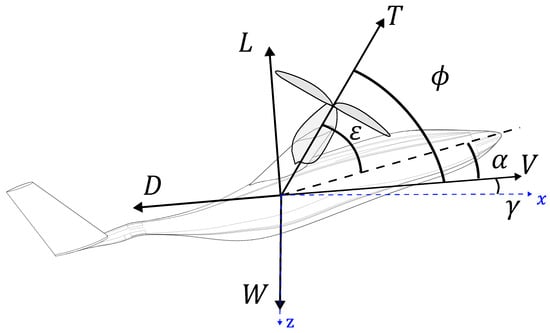
Figure 4.
Schematic of representative forces and angles for the flight physics model.
Note that, unless , the propellers are operating with an in-plane component of the airspeed (what in helicopter rotor aerodynamics is referred to as operation in forward flight). In that situation, there might be not only a force perpendicular to the propeller plane but also an in-plane force. Nevertheless, that in-plane force is usually much smaller than the perpendicular force, so in this research the former will be neglected. Therefore, the resulting propeller aerodynamic force (namely, T) is always perpendicular to the propeller, as depicted in Figure 4.
In this piece of research, a detailed design and modeling of the electrical system is not performed, which would include battery sizing and operating modeling, electric motor sizing and operating modeling, and advanced questions such as energy recovery, thermal management, and battery health monitoring and control, among other things. Instead, a simplified electric model has been considered, where batteries are able to provide a fixed amount of energy and a constant efficiency is assumed. Although this is in line with common practice in the performance analysis of conventional airplanes, where simplifying assumptions (as constant thrust-specific fuel consumption) are usually considered to gain preliminary insights into the aircraft performance, detailed electric modeling would increase the accuracy and validity of the results presented in this paper. Therefore, it will be treated in depth in follow-up research.
Keeping constant, the energy consumption E becomes a decoupled variable, and Equation (1e) can be solved independently once an evolution of the state and control variables is calculated.
2.2. Aerodynamic Model
This work uses an experimental aerodynamic model that computes the lift and drag forces as a function of the angle of attack and aerodynamic speed V. Several wind tunnel campaigns were conducted to properly characterize the aircraft for the whole range of angles of attack (). The results of these experiments and works can be found on [13,14], all within the framework of the Department of Aerospace Engineering and Fluid Mechanics of the University of Seville.
Given the hypotheses addressed within this study, the lateral characterization of the aircraft can be neglected out of the scope of this analysis. Furthermore, it is important to note that it is assumed that there is no effect of on the drag forces caused by the change of orientation of the nacelle. The aerodynamic forces are generally expressed through non-dimensional lift and drag coefficients, expressed as follows:
where is the reference air density, S the reference aerodynamic surface, is the lift coefficient, and the drag coefficient, both a function of the angle of attack . The wind tunnel experiments were conducted at the facilities of the University of Seville, under the following conditions: an open-loop wind tunnel with a closed test chamber of dimensions 5 × 1.4 × 1.8 m capable of reaching a maximum speed of 30 m/s at the test chamber. Figure 5 shows the test rig setup for the aerodynamic characterization. The full aerodynamic model is represented then as a polynomial with respect to the angle of attack as follows:
where are the constant coefficients that multiply each term of the angle of attack. For completeness, these coefficients are presented in Table 1, and and are depicted in Figure 6. Moreover, it is standard practice to define a maximum operative lift coefficient by using a safety factor SF, so that . The angle of attack that corresponds to that lift coefficient is called , and the minimum speed that achieves vertical force equilibrium with this angle of attack and no contribution from thrust is defined as .
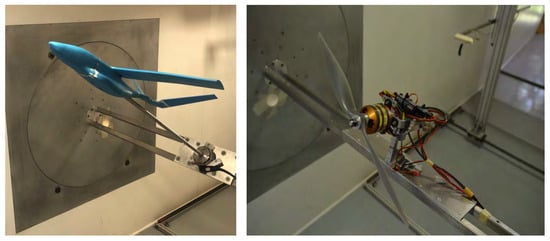
Figure 5.
Experimental setup for the wind tunnel test campaign for the aerodynamic (left) and propulsive (right) characterization. These tests provided nonlinear lift, drag, and thrust models as a function of angle of attack and engine tilt, enabling high-fidelity modeling of real-flight behavior in the optimization framework.

Table 1.
Aerodynamic coefficients for the polynomial approximation of the models (from References [13,14]).
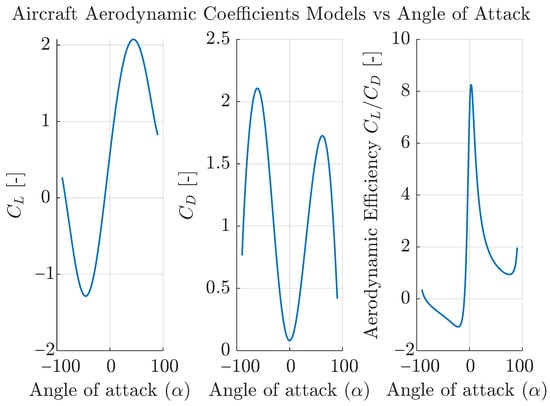
Figure 6.
Aircraft aerodynamic model (from References [13,14]).
2.3. Propulsive Model
Similarly to the aerodynamic wind tunnel experiments, propulsive experiments were conducted in order to obtain non-dimensional coefficients for characterizing the propeller’s propulsive properties [13,15]. The experimental test rig for this characterization is shown in Figure 5. The thrust and power are defined by the following expressions [16]:
where is the thrust coefficient, is the power coefficient, is the propeller’s diameter, the number of engines, and n is the engines’ running speed (in revolutions per second). For propellers, it is common to define the coefficients as a function of reduced parameters, such as the advance ratio . This work also considers the total incidence angle as a model variable. Previous works have used similar approaches to characterize propeller models for eVTOL applications [17,18]; however, it is not usual to see these models integrated within the optimization algorithms on trajectory planning. The definition of the coefficients can be expressed as
where the coefficients , can be found on Table 2, being the rest of the coefficients equal to zero.

Table 2.
Propulsive coefficients for the polynomial approximation of the models (from References [13,15]).
Thrust and power coefficient as functions of the thrust incidence angle and the advance ratio are depicted in Figure 7 as a grayscale heat map. Labeled level curves are also included to ease visualization; the level curve of zero (either zero thrust coefficient or zero power coefficient) is depicted in red. Since the propulsive model is taken as a datum in this paper (and its generation and validation are out of the scope), readers are referred to References [13,15] for a detailed discussion on these results.
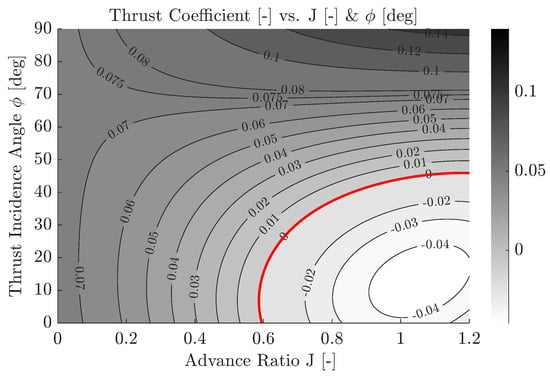
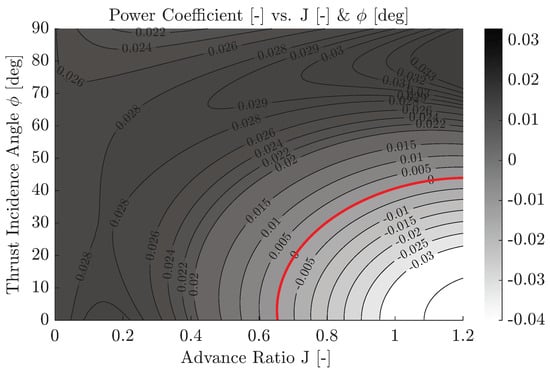
Figure 7.
Propulsive coefficients vs. and J. These maps are critical for modeling the thrust and power behavior of the aircraft across diverse flight segments, especially during transitions and vertical maneuvers.
Although results are only presented for positive values of the thrust incidence angle, the model has been extended to negative values by using instead of . This enforces the thrust coefficient to be symmetric with respect to the thrust incidence angle, i.e., . On the following sections of this work, a restriction on the variables J and is imposed for the model to work on its validated operative region set by , .
2.4. Aircraft Design Parameters
The complete prototype is modeled using CAD tools with a parametric philosophy and includes material properties that provide mass-densities-multipliers for different structures. This allows easier procedures when performing sensitivity analyses on the aircraft configuration. The parameters considered within the scope of this work can be found in Table 3 from References [8,19]. This last reference contains a further breakdown of the subsystems detailed on Figure 2. The values for , and have been extracted from the data sheets of both propellers and the engine mounted on the aircraft [20,21].

Table 3.
UAV parameters used in this study.
3. Flight Segments and Problem Formulation
In this section, the different flight segments will be characterized in terms of the calculation approach and the particularization of the flight dynamic models from Equations (1a)–(1e). The phases are structured in sequential order for a nominal mission (defined as per Figure 3). Each segment is studied independently, to address the main variables involved. An extensive evaluation of the mission profiles for eVTOLs can be found in [22]. This work follows the usual conventions in Control Theory and depicts the state variables as X and the control variables as u.
To solve each phase, the flight dynamics are particularized to the requirements of the segment. The aerodynamic and propulsive models, as well as the rest of the parameters to define the aircraft are fed into the solver, which varies with the type of problem encountered. See Figure 8 for a diagram of the process followed. The state and control variables from the flight dynamics model are then extracted for each phase. Following this procedure for each segment defined on Figure 3 completely determines the desired flight profile.
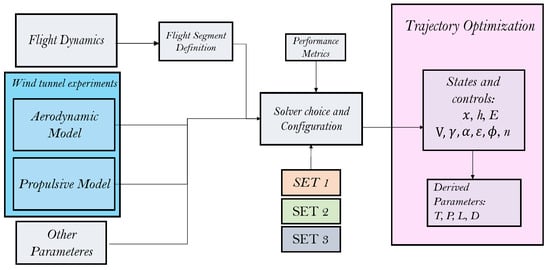
Figure 8.
Flowchart summarizing the segment-wise optimization framework. The process begins with wind tunnel testing and mission segmentation, leading to the development of aerodynamic and propulsive models. Solver configurations and performance metrics are tailored per segment to enable accurate and modular trajectory optimization.
While elaborating the strategies to solve each segment, different set of problems were categorized with respect to the numerical approach applied. Figure 9 provides an illustrative diagram of each procedure to follow. Set 1 comprehends problems that are stationary, with its controls and states constant with respect to time. The control variables function as free parameters, fine-tuned to minimize a cost function. The equations that model the flight dynamics turn into constraints in the objective function, turning this into a Non-Linear Programming (NLP) problem [23]. The Climb (6), Cruise (8), and Descent (10) segments are solved with this procedure. Set 2 implements a single shooting method [24] to solve a set of differential-algebraic Equations (DAEs) with a free parameter. This parameter is set to minimize an objective function with a one-dimensional optimization method (in this case, a golden-section search algorithm [25,26]). The plane-mode Accelerations and Decelerations (5), (7), (9), as well as the initial guess trajectory for Vertical Take Off (2), use this algorithm. Set 3 considers time-dependent problems which have to meet certain requirements in either the control or state variables for different timestamps. This means that the control variables generally will be time dependent, hence a single shooting method cannot be applied. Instead, a collocation method [24] discretizes the time domain in partitions, and it represents the trajectory by a finite set of parameters, corresponding to the coefficients of polynomials or splines in this discretized domain. This transforms the continuous-in-time problem to a finite-dimensional optimization problem. Using an initial guess of the trajectory, standard NLP solvers can extract a feasible trajectory that optimizes a defined functional. The Vertical Take Off phase (2) uses this procedure.
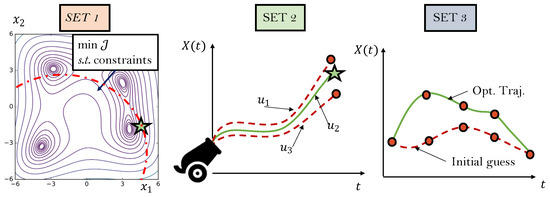
Figure 9.
Diagram of the different sets of problems to be solved numerically. Set 1: black solid lines are isolines of the objective function, the red dash-dotted line represents the constraint, and the star is the optimum. Set 2: red dash lines are trayectories not satisfying the final constraint, the green line is the trajectory satisfying the final constraint (depicted as a star). Set 3: the green line is the optimal trajectory and the red dash line is the initial guess trajectory.
3.1. Vertical Take Off: Segment 2
In this initial phase, the aircraft executes a vertical take off (VTO) maneuver to ascend between two specified altitudes separated by a altitude increment . The thrust is aligned with the airflow () and the angle of attack is assumed to be to capture the airflow from above. Under these conditions, the lift is neglected (). The engine speed n remains a control variable, and its evolution over time corresponds to different functional costs, so an optimal evolution of n results in the minimum of this objective function. In this work, the total energy consumption is to be minimized, so the following optimal control problem [27] is formulated:
This problem is in a Mayer form (there is a terminal cost and no running cost). This problem is also subject to a set of bounds in both the state and control variables, outlined as follows: , m/s, , and , where stands for the maximum energy stored in the batteries. To allow for a wider set of feasible solutions, it is assumed that .
In this problem, the initial conditions are all set to zero, whereas the final conditions are and , as depicted in Figure 10. Furthermore, the final time is unspecified. These boundary conditions on altitude and speed do not allow us to simply implement a single shooting method technique to calculate the state forward on time. The solution of this problem is obtained through a transcription method (see [24]), facilitated by the OptimTraj library developed within a MatLab environment [28]. Convergence of the solver requires an initial trajectory estimate, which is derived through heuristic methods assuming an evolution of the control variable over time. Then this library implements a direct collocation methodology that discretizes the continuous-time problem by dividing the time horizon into discrete intervals or grid points. The control and state variables are approximated at these points, transforming the problem into a Non-Linear Programming (NLP) finite-dimensional optimization problem. Numerical optimization techniques, such as gradient-based methods or direct search methods, are then employed to find the optimal values of the variables in this NLP problem. To satisfy the constraints, these are incorporated into the optimization problem as inequality constraints during the optimization problem. Then, the resulting trajectory is reconstructed via an Hermite–Simpson interpolation on that discrete solution, allowing for a continuous approximation.
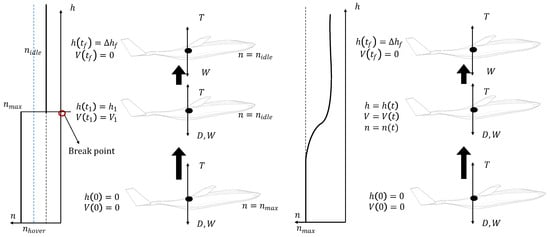
Figure 10.
Schematic for the boundary conditions solution proposal for the initial guess trajectory (left) and optimal trajectory (right) for the Vertical Take Off.
To find an adequate guess trajectory to initialize the problem, an heuristic solution is proposed where it is assumed a variation in the engine speed n.
where , to allow the aerodynamic drag and weight to slowly decelerate the aircraft, and is the altitude at which the control variable needs to switch for the final conditions in both speed and altitude to be satisfied. In this work, a break point corresponds to a change in the control reference (or control with respect to one variable to another), included to satisfy the requirements in a heuristic solution (see Figure 10 left). This value of is calculated through a golden-section search algorithm [26].
3.2. Hovering and Engine Startup: Segments 1 and 3
In this phase, the only equilibrium equation to satisfy stands for the vertical forces, such as . The only free parameter would be then the engine’s running speed, which has to match the thrust to equal the weight, giving the value of . As there are no free parameters in this problem, this section will not undertake any optimization procedure. This segment can be solved with a roots-finding algorithm that implements the thrust propulsive model and equals it to the weight of the aircraft.
3.3. Vertical to Plane-Mode Transition: Segment 4
In this segment, the aircraft performs a horizontal acceleration (), starting with zero velocity. Therefore, the equations of motion result in
where the balance in vertical forces (8d) has become an algebraic equation which enables the computation of the engine speed n during the transition.
Instead of stating an optimal control problem, the approach followed within this study entails a heuristic method based on a prior definition of the time evolution of the control variables, namely, , , and n.
The problem then is reduced to finding an evolution of the engine tilt angle and angle of attack that satisfies the trajectory constraints. Initial conditions on this segment are , , , and for the algebraic equation.
3.4. Acceleration–Deceleration Phase Analysis: Segments 5, 7 and 9
In this phase, the aircraft is engaged in straight-level flight with an initial velocity with the objective of accelerating (or decelerating) the vehicle to reach a velocity (or ). Throughout this phase, the flight path angle remains constant at zero, while the angle of attack is time-dependent. To facilitate the change in airspeed, it is assumed that , aligning the engine reference line with the airflow, as depicted by Figure 11 (note the dash lines are parallel and the dash-dot line represents the engine reference with respect to the wing-body reference). The integrator operates to minimize energy consumption, designated as the objective function () with respect to a constant value of n, and it is nested within a golden-section search algorithm, to determine the optimal engine running speed. These assumptions are integrated into the specific equations derived from (1a)–(1e) as
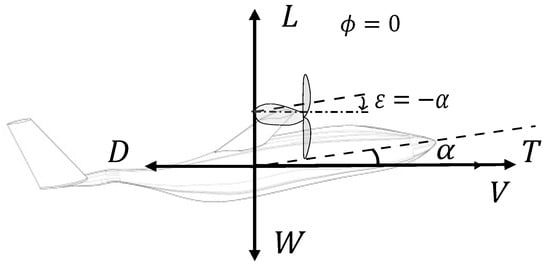
Figure 11.
Schematic for the aircraft configuration for plane-mode acceleration and deceleration.
With initial conditions , , and .
3.5. Plane-Mode Climb Analysis: Segment 6
During the plane-mode climb phase, the aircraft climbs to reach a specified altitude difference , at a constant speed V and flight path angle . The objective is to optimize a weighted function , defined as follows:
where represents energy consumption at the end of the climb, is the horizontal distance traveled, and is an estimated energy consumption cost per kilometer in cruise, as follows:
The second term in Equation (11) can be seen as the energy saving that a climb contributes to the overall flight by shortening the cruise Section [29]. As an usual procedure in conventional aircraft where climbs are conducted at a constant throttle position, the engine running speed n is fixed at a predetermined value. It is hence assumed a value of the engine speed as . As both the speed and flight path angle are constant with respect to time, the expressions (1a), (1b) and (1e) allow integration, and the total energy consumed in the climb segment can be expressed as a function of the power consumption, speed, and flight path angle. Introducing this result on Equation (11) for the objective function, the optimization problem can be formulated as
In addition, there exist inequality constraints on the state and control variables, , , . In this phase the minimum angle of attack is set to . A NLP solver algorithm is employed to solve this optimization problem.
3.6. Cruise Straight and Level Flight Analysis: Segment 8
During this phase the aircraft maintains stable steady-state flight at a specified altitude h. As Equations (1c) and (1d) do not depend with time and there are no changes in altitude involved (hence and its derivatives can be neglected), equilibrium is achieved between weight and lift, as well as thrust and drag, expressed by:
Integrating Equations (1a) and (1e), the range equation for an electric aircraft is formulated as follows:
where is a known energy level in the batteries allocated for the cruise segment. After calculating the energy consumption for all mission segments but the cruise, it adds up to roughly 20 % of the total level . Assuming a safety factor for the energy storage of , the total available energy for this segment is MJ.
Minimization of this expression, subject to constraints (14a) and (14b), is achieved using the fmincon function embedded in MatLab, a reliable solver for constrained optimization with nonlinear objective functions and restrictions. Constraints on decision variables include for the angle of attack and on the engine speed. As a low value of the power consumption is expected to maximize the range, is set to zero to allow for a wider set of feasible solutions. The objective function is the minus range of the aircraft (as optimization is described as a minimization problem), subject to the dynamic constraints of the vertical and horizontal equilibrium. It is formally expressed as
With additional constraints on states and controls as follows: , , .
3.7. Plane-Mode Descent Analysis: Segment 10
In this segment the aircraft descents from the altitude set at cruise as required for vertical landing. The system to be computed remains analogous to Equations (1a)–(1e), where is assumed to be negative within the inequality constraints.
Two cases are compared within this segment to explore the capabilities of the aircraft. One considers the aircraft is gliding with either no thrust generation (); alternatively, it assumes no power consumption (). Each case includes one additional constraint on each problem formulated.
The objective for each case aims to maximize gliding distance . As is known and both and V do not vary with time, Equations (1a) and (1b) can be integrated and combined as and the objective function to be minimized can be written as . This expression holds as is assumed to be negative and the cotangent function has odd symmetry respect to the origin, so that .
A NLP solver algorithm is implemented in MatLab to extract the solution of this problem. Additionally, inequality constraints are imposed on the angle of attack as follows: , , , . As in other segments, is set to . Furthermore, is set to a value low enough ( rps) for the solver to explore feasible solutions on the engine running speed but higher than zero so that the conditions of no thrust or power are not obscured by convergence to rps.
3.8. Horizontal to Vertical Regime Transition Analysis: Segment 11
In this segment, the aircraft performs a horizontal deceleration, reaching by its end the conditions prior to vertical landing. Analogously to the opposite transition (Segment 4), instead of stating an optimal control problem, a heuristic method is proposed on several control variables. This phase assumes a higher angle of attack compared to the axial to plane-mode transition to enhance the effect of the aerodynamic drag. This maneuver is executed without a change in altitude, thus the flight path angle and its derivative are null.
As in the Vertical to Horizontal transition, the set of equations governing the system is
To ensure the thrust is applied to lift the aircraft and not to accelerate it, the engine tilt angle is set to increase by following the given time evolution, with the condition that rotation ceases when , expressed as follows:
Here, and is the Heaviside step function [30] expressed in terms of time, truncated at . The term is derived from the requirement of the angle to reach at an estimated time of seconds. Figure 12 shows these time dependencies. Initial conditions for this segment are , , and . The condition for is taken from solving for n on the algebraic Equation (18d), as the rest of the variables () are known for .
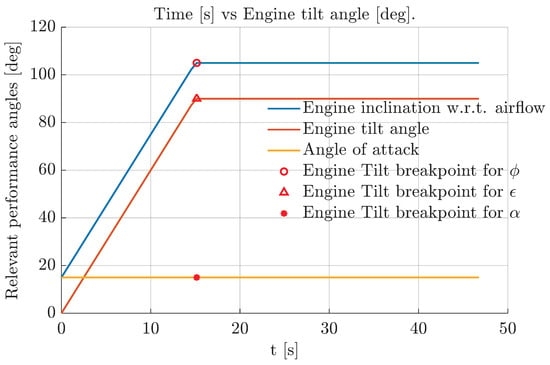
Figure 12.
Variation with respect to time of the representative angles of the engine inclination.
3.9. Vertical Landing: Segment 13
During this phase the aircraft descends from a known altitude to land at . This segment requires a modification in the formulation of the propulsive model. Since the airspeed flows opposite to the propeller’s axial direction (i.e., ), the aircraft operates out of the validated region of the propulsive model. Rotorcraft Theory [16,31,32] states that for ratios of the landing speed over the hover induced speed () such that , the Blade Element Momentum Theory (BEMT) cannot be applied as the propeller disk is in Vortex Ring State (VRS) or Turbulent Wake State (TWS), with the flow showing great recirculation and turbulence.
A simplified stationary dependence on the variables is imposed to solve this segment, leading to the thrust, aerodynamic drag, and weight being in vertical equilibrium. Here, the aerodynamic drag D assists the thrust force T in decelerating the vehicle. The induced speed in the rotor disk for hovering conditions can be calculated as follows:
where A represents the total area of the propellers, . As a propulsive experimental model is required for this region of descent speeds, a conservative solution is proposed where the power consumption for a descending vehicle employing propellers for thrust is estimated as . Given the calculated induced speed at hover m/s, a landing speed of m/s is imposed. Consequently, the mission time can be estimated as , as the altitude difference is known.
4. Results
The following results present a comprehensive performance evaluation of each segment in the nominal SAR mission profile. By solving each phase independently using tailored numerical methods, the study assesses energy consumption, aerodynamic efficiency, engine workload, and propulsive demands. This segment-wise analysis highlights the distinct operational requirements of critical phases such as vertical takeoff, transition, cruise, and descent. Emphasis is placed on quantifying how different control strategies and configurations influence overall energy usage and mission viability, supporting the future optimization and design refinement of the UAV architecture. Numerical results have been obtained using MatLab 2024b and OptimTraj 1.7.
4.1. Vertical Take Off: Segment 2
Figure 13 illustrates that the initial and final vertical altitude and velocity comply to boundary constraints. Analysis of the engine speed indicates a sharp decrease towards mission end, reducing thrust for deceleration to achieve zero velocity at . Moreover, the energy consumption graph reveals a mere 1.5% discharge for a 50 m altitude change.
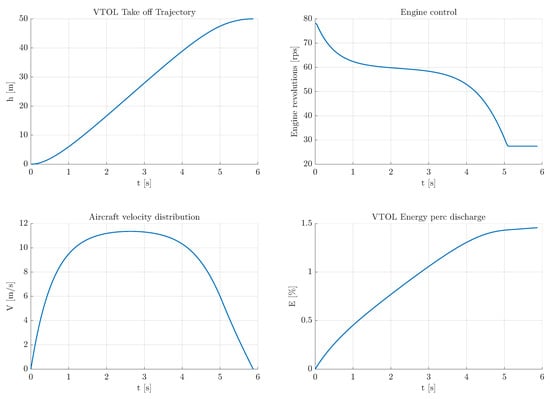
Figure 13.
Results for Vertical Take Off.
4.2. Hovering: Segment 3
In this segment, no initial conditions are applicable as the problem is self-contained, with aircraft speed and all other parameters predetermined. The only variable requiring calculation is the engine running speed, attainable through a root-finding algorithm on the vertical forces equilibrium. Table 4 illustrates the results for a hover time s.

Table 4.
Results for the hovering segment.
4.3. Vertical to Plane-Mode Transition: Segment 4
In Figure 14, it is shown how the change in tilt angle and angle of attack lead to a smooth transition of the aircraft to plane mode. As the engine tilts to a more horizontal position, this allows to greater horizontal accelerations that increase the aircraft speed. This increase in speed allows for a greater dynamic pressure (), which leads to a reduction in the required thrust. It is observed that the maneuver has a great safety margin on the engines’ speed not to reach its maximum allowed value; small variations in n lead to large changes in the power consumed. However, the total energy consumption is below 1.5%, which is small compared with the rest of the segments.
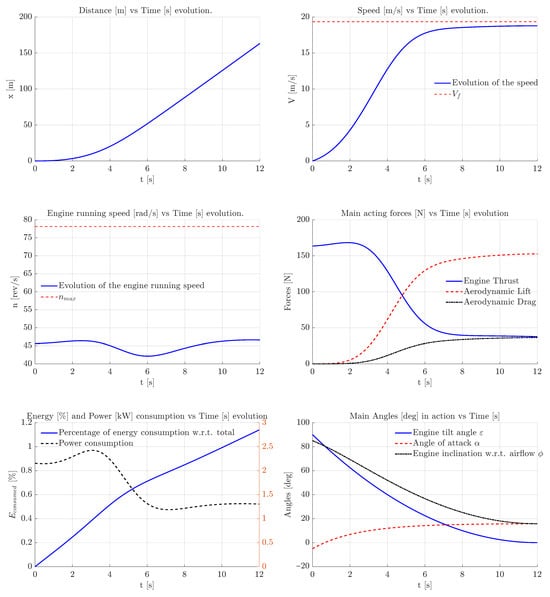
Figure 14.
Evolution of state and control variables for the Vertical to Horizontal Transition.
4.4. Plane-Mode Climb: Segment 6
This phase establishes a steady-state solution for all state and control variables, excluding time-dependent kinematic variables and the energy consumption (). Input parameters for this segment are collected in Table 5. Table 6 reveals the climb rate’s strong dependency with engine thrust. The aircraft’s axial flight capability allows for maneuvers with a high flight path angle and a slightly negative angle of attack to minimize drag.

Table 5.
Phase input parameters for the plane-mode climb.

Table 6.
Phase solutions for the plane-mode climb.
This problem can be formulated as a multi-objective optimization task if the objective function is considered as in two independent terms. On the one side is the energy consumption and in the other is the horizontal distance traveled in the climb segment. The term acts as a weight between both metrics, and Figure 15 represents the convex hull (or convex envelope) of the Pareto front correlating both variables. This set has been calculated solving the climb problem optimizer for a series of values of this coefficient.
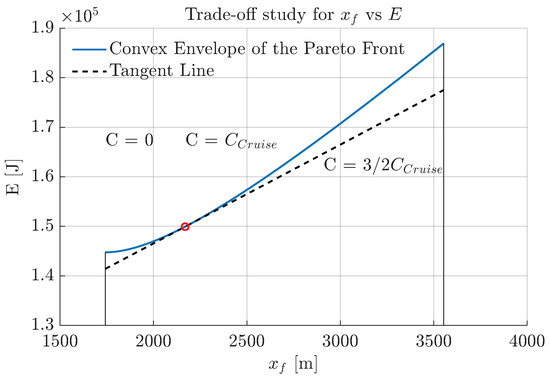
Figure 15.
Horizontal distance vs. energy consumption trade-off in this study.
4.5. Cruise Straight-and-Level Flight: Segment 8
For cruise, the analysis of results from Table 7 reveals that the balance of forces incorporates a significant fraction of thrust on the transversal axis, aiding aerodynamic lift in counteracting weight. Reduced angle of attack leads to decreased aerodynamic drag, allowing thrust to contribute partially as a vertical force without decelerating. Additionally, it is noteworthy to add that the aircraft operates at maximum aerodynamic efficiency as per the model portrayed on Figure 6, ensuring an optimal angle of attack generating maximum lift-to-drag ratio, aligning with findings in the literature [33].

Table 7.
Phase solutions for cruise level flight. vs. TRC (Tilt Rotor Capabilities).
Figure 16, Figure 17, Figure 18 and Figure 19 show level curves of the aircraft’s range with respect to its varying parameters . For representation purposes, this four-variable function is evaluated at section hyperplanes of constant velocity, engine running speed, angle of attack, or engine tilt angle (in pairs of two constant and two varying inputs), at its optimal value, to extract the sensitivity and behavior of this function in the region around its optimal. A feasible solution in these figures is found when the constraints intersect at the same point on the four graphs (its speed value, angle of attack, engine running speed, and engine tilt angle coincide). Every other point would not meet either the vertical or horizontal force equilibrium. From these images we can extract the high non-linearity and non-convexity of the objective function and constrains, which are a result of the complexity of the flight dynamics of the aircraft using a tilt-rotor configuration and experimental models for the propulsive and aerodynamic forces. The superscripted symbol denotes the value of a parameter that optimizes this objective function.
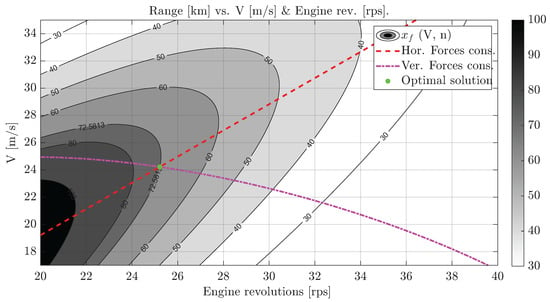
Figure 16.
Level curves for for steady flight cruise conditions.
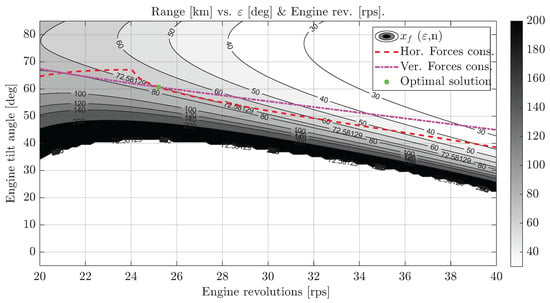
Figure 17.
Level curves for for steady flight cruise conditions.
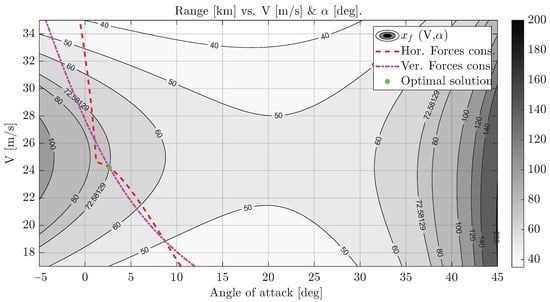
Figure 18.
Level curves for for steady flight cruise conditions.
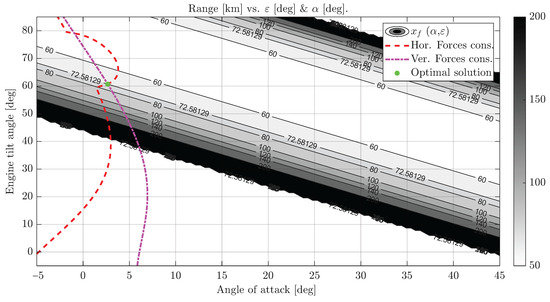
Figure 19.
Level curves for for steady flight cruise conditions.
In Figure 20, results corresponding to a cruise constrained to are presented. Specifically, level curves of the aircraft’s range with respect to the varying parameters are depicted, along with the horizontal force constraint, the constraint on maximum engine turning speed, and the optimal solution. Note that, on the one hand, the vertical forces constraint can be used to compute the value of for given values of and, on the other hand, . Hence, the problem becomes much more simple, at the expense of a very substantial loss in energy efficiency (see Table 7).
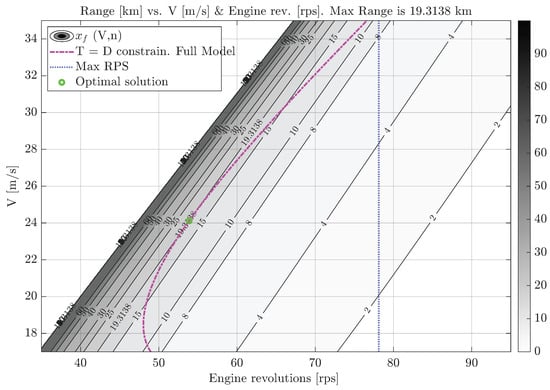
Figure 20.
Level curves for for steady flight plane-mode cruise conditions.
4.6. Plane-Mode Descent: Segment 10
The optimization for this phase provides a steady-state solution for all state and control variables, excluding time-dependent kinematic variables (). Results are shown for both flight conditions (zero thrust and zero power) in Table 8. The total altitude for the aircraft to descent is m.

Table 8.
Phase solutions for plane-mode descent.
This segment works in a region of the propulsive model where the thrust is negative or null, hence the only lifting force to achieve vertical equilibrium is the aerodynamic lift from the wings. It can be seen that the aerodynamic efficiency is far from its optimal value from the constraints on the propulsive model. This would correspond to deciding prior to carrying the mission whether conditions are more suitable for the descent, as if the extra distance traveled could be traded by the energy consumed during the phase. The no-power conditions result in higher descent angles that may not be suitable for the handling conditions of the aircraft.
4.7. Plane-Mode to Axial Flight Transition: Segment 11
The goal of this phase is to reduce the speed of the aircraft while maintaining a stable altitude. This is performed by changing the inclination of the engines while maintaining a constant angle of attack. Figure 21 shows the evolution of the states x and V over time. The break point depicted stands for the instant the engine reference line is perpendicular to the aircraft reference line (), continuing at that state for the rest of the maneuver. It can be seen how the aircraft lowers its speed at a lower rate as time passes, due to the reduction in aerodynamic drag. Figure 21 also depict the two highly differentiated stages, caused by a change in the imposed evolution in the tilt-rotor angle . It can be seen that the thrust grows as the aircraft’s speed decreases, caused by the imposed time evolution of , which increases over time until it reaches a value of . However, it can be seen from the engine running speed graph that the resulting n gets closer to rps as the speed decreases.
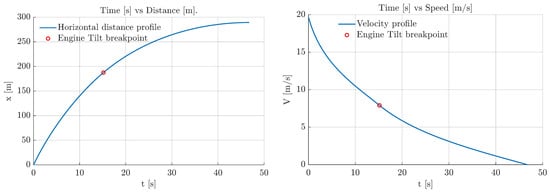
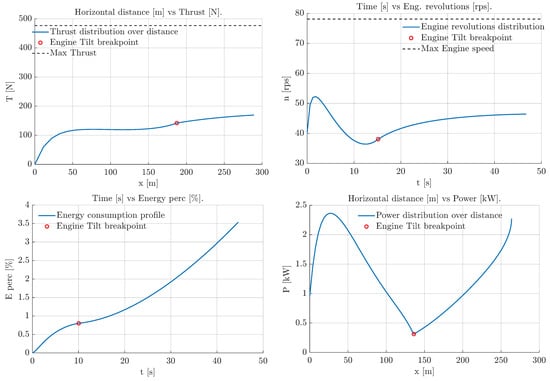
Figure 21.
Plane-mode to axial flight transition results.
4.8. Vertical Landing: Segment 13
For this last segment, the vehicle is set on a steady-state trajectory, where the control variables, the flight path angle , and the velocity state are constant. Input parameters for this segment are collected in Table 9. It can be seen in Table 10 that for the speeds accounted for in this segment, the assumption of neglecting the aerodynamic drag from the balance equations is sensible enough not to lose accuracy in the results.

Table 9.
Phase input parameters for vertical landing.

Table 10.
Results for vertical landing.
These findings provide a valuable reference for the design and optimization of next-generation eVTOL and convertible UAV platforms operating in complex and energy-constrained mission profiles.
5. Conclusions and Future Research Lines
The segment-wise performance evaluation of the ProVANT-EMERGENTIa tilt-rotor RPAS reveals several key findings. The optimization of the cruise segment, when including tilt-rotor capabilities, results in a fourfold increase in achievable range (from approximately 19 km to over 73 km) for the same stored battery energy. The vertical takeoff and vertical-to-horizontal transition phases consume less than 1.5% of total energy each, highlighting the effectiveness of both the vehicle’s aerodynamic configuration and the optimized control strategies. Hovering accounts for about 3% energy consumption over 30 s, while the plane-mode climb segment demonstrates a trade-off between energy and horizontal distance that can be tuned through multi-objective formulations. These findings validate the segment-by-segment modeling approach, informed by experimental aerodynamic and propulsive data, as a powerful tool for performance optimization and design refinement.
One of the key takeaways from this work is the critical role of optimization techniques, particularly in segments with high energy consumption relative to the whole mission, such as steady-state cruise or performance-critical phases like vertical takeoff and flight transitions. In these scenarios, the proposed dynamic and experimental modeling approach enables the identification of non-intuitive but highly effective solutions. A notable example is the cruise phase, where tilting the rotors at low forward speeds—outside typical fixed-wing configurations—leads to a dramatic increase in aerodynamic efficiency. This maneuver alone results in an approximate fourfold increase in range for the same stored energy, underscoring the practical value of segment-wise optimization guided by real-world aerodynamic and propulsive data.
Looking ahead, several promising lines for future research have been identified. Firstly, this work underscores the significance of a holistic approach to performance optimization. By analyzing each segment independently, a clearer view emerges of the limiting constraints and energy distribution per phase, which can inform system sizing and trajectory planning. There is, however, a need to move toward an integrated optimization across multiple segments using a unified solver for an overall trajectory.
Secondly, limitations in the propulsive model, particularly during descent, offer opportunities to improve accuracy. A more complete model accounting for the distribution of induced velocity across the rotor disk would enhance performance predictions, especially for smaller propellers. The current results suggest that smaller propellers may improve cruise efficiency, though they could limit vertical takeoff or transition performance. A next design iteration could explore mounting a larger number of smaller-diameter propellers. The study of a TRC descent, (i.e., a descent with ) with the propellers working in autorrotation state, is appealing but left for future work, since this operating point is outside the envelope of the current propulsive model.
Thirdly, it is crucial to strengthen the mechanical modeling framework. While the current approach makes appropriate simplifying assumptions, adding pitch dynamics—including pitch moment equilibrium and aerodynamic moment modeling—would allow more accurate characterization during transitions and vertical maneuvers. It would also be relevant to include gyroscopic effects and actuator dynamics such as time derivatives of the nacelle tilt.
Fourthly, as discussed in Section 2.1, considering a detailed design and modeling of the electrical system is a future research step. Specifically, preliminary operating models for the battery and brushless DC engines already developed in [34] can be added to the current models. Additional state variables such as the battery Depth of Discharge (DoD), as well as currents and voltages of the battery and the engine would add considerable complexity to the overall aircraft model, but it would be highly beneficial to ensure the accuracy and validity of the results presented in this paper.
Finally, the working limits of the propulsive model should be extended to include negative and larger advance ratios. This would allow the accurate modeling of complex descent regimes such as the Vortex Ring State, autorotation, and negative power conditions. Additionally, battery models that incorporate power-dependent energy availability could penalize high peak demands and improve realism in segments like takeoff and transition.
Altogether, the insights gained through this work contribute to a more comprehensive understanding of energy usage in electric convertible UAVs and lay the foundation for further advances in optimization-driven design.
Author Contributions
Conceptualization, S.E. and A.F.; Data curation, Á.M.-B.; Funding acquisition, S.E.; Investigation, Á.M.-B. and A.F.; Methodology, Á.M.-B., S.E. and A.F.; Project administration, S.E. and A.F.; Resources, S.E.; Software, Á.M.-B. and A.F.; Supervision, S.E. and A.F.; Validation, S.E. and A.F.; Visualization, Á.M.-B.; Writing—original draft, Á.M.-B., S.E. and A.F. All authors have read and agreed to the published version of the manuscript.
Funding
Research funded by Grant RTI2018-101519-A-I00 by the Ministerio de Ciencia, Innovación y Universidades 10.13039/501100011033 and by ERDF, A way of making Europe.
Data Availability Statement
The raw data supporting the conclusions of this article will be made available by the authors upon request.
Conflicts of Interest
The authors declare no conflicts of interest. The funders had no role in the design of the study; in the collection, analyses, or interpretation of data; in the writing of the manuscript; or in the decision to publish the results.
References
- Vincent-Lambert, C.; Pretorius, A.; Van Tonder, B. Use of Unmanned Aerial Vehicles in Wilderness Search and Rescue Operations: A Scoping Review. Wilderness Environ. Med. 2023, 34, 580–588. [Google Scholar] [CrossRef] [PubMed]
- Lyu, M.; Zhao, Y.; Huang, C.; Huang, H. Unmanned Aerial Vehicles for Search and Rescue: A Survey. Remote Sens. 2023, 15, 3266. [Google Scholar] [CrossRef]
- Tong, K.; Hu, Y.; Dikic, B.; Solmaz, S.; Fraundorfer, F.; Watzenig, D. Robots Saving Lives: A Literature Review About Search and Rescue (SAR) in Harsh Environments. In Proceedings of the 2024 IEEE Intelligent Vehicles Symposium (IV), Jeju Island, Republic of Korea, 2–5 June 2024; pp. 953–960. [Google Scholar] [CrossRef]
- Esteban, S. Development of an Unmanned Convertible Aircraft for Rapid and Efficient Deployment in Emergency Situations (Project Provant-EMERGENTIa). Available online: https://aero.us.es/sesteban/pages/RL_VTOL_temp.htm (accessed on 22 May 2025).
- Hong, S.; Jeong, J.; Kim, S.; Suk, J.; Jung, J.I. Longitudinal Flight Dynamics of a Single Tilt-wing Unmanned Aerial Vehicle. Ifac Proc. Vol. 2013, 46, 60–65. [Google Scholar] [CrossRef]
- Gao, J.; Zhang, Q.; Chen, J.; Wang, X. Take Off Trajectory Optimization of Tilt-rotor Aircraft Based on Direct Allocation Method. In IOP Conference Series: Materials Science and Engineering; IOP Publishing: Bristol, UK, 2020; Volume 768. [Google Scholar] [CrossRef]
- Yu, Z.; Zhang, J.; Wang, X. Study of Modeling and Optimal Take Off Scheme for a Novel Tilt-Rotor UAV. Sensors 2022, 22, 9736. [Google Scholar] [CrossRef] [PubMed]
- Martínez-Blanco, A.; Esteban, S. Parameter Sensitivity studies for the Performance of an Electric BiCP-VTOL UAV. In Proceedings of the 77th Annual Forum. The Vertical Flight Society, Virtual, 10–14 May 2021. [Google Scholar] [CrossRef]
- Chauhan, S.S.; Martins, J.R. Tilt-Wing eVTOL Takeoff Trajectory Optimization. J. Aircr. 2019, 57, 93–112. [Google Scholar] [CrossRef]
- Kaneko, S.; Martins, J.R. Simultaneous optimization of design and takeoff trajectory for an eVTOL aircraft. Aerosp. Sci. Technol. 2014, 155, 109617. [Google Scholar] [CrossRef]
- Miele, A. Flight Mechanics. Vol 1: Theory of Flight Paths; Addison-Wesley Publishing Company, Inc.: London, UK, 1962. [Google Scholar] [CrossRef]
- Stengel, F.R. Flight Dynamics, 2nd ed.; Princeton University Press: Princeton, NJ, USA, 2022. [Google Scholar]
- Ortega, F.; Esteban, S.; Núñez, M. Aerodynamics and Propulsive Modeling of a Bi-Rotor Convertible Aircraft for the Identification of Trim Conditions in Longitudinal Flight. In Proceedings of the 77th Annual Forum. The Vertical Flight Society, Virtual, 10–14 May 2021. [Google Scholar] [CrossRef]
- Vázquez, L. Realización de Experimentos Aerodinámicos en Túnel de Viento para la Caracterización Longitudinal de un UAV Convertible para Tareas de Emergencia: Proyecto EMERGENTIa; University of Seville: Seville, Spain, 2020. [Google Scholar]
- Pinazo, D. Ensayos de Planta Propulsora de Motor Eléctrico y Hélice en Túnel de Viento con Ángulo de Incidencia Variable; University of Seville: Seville, Spain, 2016. [Google Scholar]
- Johnson, W. Vertical Flight. In Rotorcraft Aeromechanics; Cambridge University Press: Cambridge, UK, 2013; pp. 92–122. [Google Scholar]
- Simmons, B.M. Efficient Variable-Pitch Propeller Aerodynamic Model Development for Vectored-Thrust eVTOL Aircraft. In Proceedings of the AIAA Aviation 2022 Forum, Chicago, IL, USA, 27 June–1 July 2022. [Google Scholar] [CrossRef]
- Simmons, B.M. System Identification for Propellers at High Incidence Angles. In Proceedings of the AIAA Scitech 2021 Forum, Virtual, 11–15 & 19–21 January 2021. [Google Scholar] [CrossRef]
- Pinazo, D. Design of the General Architecture for the Systems Integration, Functional Tests, and Flight Tests Campaigns for a Tilt-Rotor UAV Prototype: Project EMERGENTIA-ProVant; University of Seville: Seville, Spain, 2021. [Google Scholar]
- G32*11 Prop-2PCS/PAIR. Available online: https://store.tmotor.com/product/g32x11prop-2pcs-1pair-glossy-carbon-fiber.html (accessed on 22 May 2025).
- U13II Power Type Multirotor UAV Motor KV130. Available online: https://store.tmotor.com/product/U13-v2-KV130-Power-Type-UAV-Motor.html (accessed on 22 May 2025).
- Sarkar, M.; Yan, X.; Girma, A.; Homaifar, A. A Comprehensive eVTOL Performance Evaluation Framework in Urban Air Mobility. In Proceedings of the 2022 Intelligent Systems Conference, Amsterdam, The Netherlands, 1–2 September 2022. [Google Scholar] [CrossRef]
- Fletcher, R. Practical Methods of Optimization, Volume 2: Constrained Optimization, 2nd ed.; Wiley-Interscience: Hoboken, NJ, USA, 1987. [Google Scholar]
- Betts, J.T. Practical Methods for Optimal Control and Estimation Using Nonlinear Programming, 2nd ed.; Society for Industrial and Applied Mathematics: Philadelphia, PA, USA, 2010. [Google Scholar] [CrossRef]
- Press, W.H. Numerical Recipes 3rd Edition: The Art of Scientific Computing, 3rd ed.; Cambridge University Press: Cambridge, UK, 2007. [Google Scholar]
- Forsythe, G.E.; Malcolm, M.A.; Moler, C.B. Computer Methods for Mathematical Computations; Prentice Hall: Englewood Cliffs, NJ, USA, 1977. [Google Scholar]
- Bryson, E.A. Applied Optimal Control: Optimization, Estimation and Control; Taylor & Francis Group: Abingdon, UK, 1975. [Google Scholar]
- Kelly, M.P. OptimTraj: Trajectory Optimization for Matlab, Version 1.7; Zenodo: Geneva, Switzerland, 2022. [Google Scholar] [CrossRef]
- Neuman, F.; Kreindler, E. Minimum-fuel, three-dimensional flight paths for jet transports. J. Guid. Control. Dyn. 1985, 8, 650–657. [Google Scholar] [CrossRef]
- Duff, G.F.D.; Naylor, D.; Weiss, G. Heaviside unit function. In Differential Equations of Applied Mathematics; John Wiley & Sons: New York, NY, USA, 1966; p. 42. [Google Scholar]
- Seddon, J. Basic Helicopter Aerodynamics: An Account of First Principles in the Fluid Mechanics and Flight Dynamics of the Single Rotor Helicopter Dynamics of the Single Rotor Helicopter, 3rd ed.; American Institute of Aeronautics & Astronautics: Reston, VA, USA, 2011. [Google Scholar]
- Leishman, G.J. Principles of Helicopter Aerodynamics, 2nd ed.; Cambridge University Press: Cambridge, UK, 2006. [Google Scholar]
- Anderson, D.J. Fundamentals of Aerodynamics, 6th ed.; McGrawHill Education: New York, NY, USA, 2017. [Google Scholar]
- San Millán, R. Modeling and Optimization of Flight Trajectories for Electric Propulsion Aircraft. Master’s Thesis, University of Seville, Seville, Spain, 2024. Available online: https://biblus.us.es/bibing/proyectos/abreproy/75872/ (accessed on 22 May 2025).
Disclaimer/Publisher’s Note: The statements, opinions and data contained in all publications are solely those of the individual author(s) and contributor(s) and not of MDPI and/or the editor(s). MDPI and/or the editor(s) disclaim responsibility for any injury to people or property resulting from any ideas, methods, instructions or products referred to in the content. |
© 2025 by the authors. Licensee MDPI, Basel, Switzerland. This article is an open access article distributed under the terms and conditions of the Creative Commons Attribution (CC BY) license (https://creativecommons.org/licenses/by/4.0/).