Abstract
This study examines the performance of two diffuser configurations—a trumpet-shaped and a semi-diagonal design—for application in micro gas turbine engines, aiming to assess their suitability in terms of efficiency and operational flexibility. Both diffusers were initially evaluated using steady-state CFD simulations with the k-omega SST turbulence model, followed by experimental testing on an actual engine across the start-up sequence from idle to 70% of nominal speed. Performance was mapped over four constant-speed lines for each configuration. Results showed that the trumpet-shaped diffuser offered a greater choke margin but suffered from increased aerodynamic losses, whereas the semi-diagonal diffuser demonstrated higher efficiency but required closer alignment with the target operating point. The k-omega SST model showed strong predictive accuracy, with 5.13% agreement across all instrumented parameters for all investigated speed lines. These findings suggest that while the trumpet diffuser provides better stability, the semi-diagonal design is more efficient when properly targeted. Future work will focus on extending the analysis to higher speed ranges and transient regimes using harmonic balance CFD methods and enhanced data acquisition techniques.
1. Introduction
Micro gas turbine (MGT) engines have gained importance in aerospace applications, particularly for UAVs, rotorcraft, and light aircraft, due to their adaptability, high-speed operation, and low maintenance [1,2,3]. Recent performance analysis of micro turbojet engines for UAVs highlighted areas for improvement, particularly in combustion efficiency and engine start-up reliability [4,5,6]. Research on enhancing MGT components is ongoing. Among these components, the compressor section plays a critical role in overall engine performance, whose operating margin directly affects the adaptability and reliability of the MGT. Current studies primarily focus on minimizing performance losses and mitigating instability to support the design and optimization of more efficient compressor systems [7].
However, conventional compressor designs—especially those employing wedge-type radial vanes, vaneless bends, and de-swirler vanes—often encounter efficiency losses and flow separation, particularly in the vaneless bend region. Dixon and Hall [8] noted that selecting the number of diffuser vanes requires balancing proper diffusion with frictional losses, while also considering resonance effects. The crossover diffuser, introduced by Kock [9], addresses these issues by reducing flow irregularities in the vaneless bend and axially redirecting the exit velocity vector, thereby improving efficiency in micro gas turbines. In MGT engines, mixed-flow compressors benefit from crossover diffusers, which improve choke margin but tend to have narrower operating ranges. To further enhance choke margin, modifications such as low-solidity, first-vane rows, splitter vane configurations, and tandem vane diffusers are utilized, with tandem vanes offering up to a 7.8% improvement when combined with a reduced first-vane row [10]. However, the long flow passages in crossover diffusers can lead to boundary layer growth, which negatively impacts off-design performance due to secondary flow and separation [11]. Tandem vanes help mitigate this issue by controlling boundary layer growth and improving overall performance [12]. Studies on modified crossover diffuser configurations have shown that tandem vaned diffusers, particularly with a reduced first-vane row, significantly increase the choke margin—by as much as 155%. This modification improves efficiency by 7.18% and pressure ratio by 6.27% for the CAT250TJ MGT engine [13]. Furthermore, multi-row vaned diffusers outperform single-row designs, enhancing isentropic efficiency and pressure ratio through better flow management [14]. Additional research on tandem vane configurations revealed that a 75% tangential shift in the second-vane row provides the best performance, further improving efficiency, pressure ratio, and operating range [15].
CFD is essential for future designs, particularly in predicting unsteady flows, entropy generation, and loss generation. However, challenges in validation, model accuracy, and computational time persist, with parallel computing offering potential improvements [16]. Optimization methods, such as bounded Kriging, have successfully enhanced compressor efficiency, achieving a 2.59% improvement in radial compressors [17]. The use of crossover diffusers in mixed-flow compressors improved isentropic efficiency by 8.75%, pressure ratio by 7.7%, and static pressure recovery by 28.33%, broadening the compressor’s operating range [9]. Reinforcement learning has been applied to optimize transonic rotor designs, resulting in a 1.01% increase in pressure ratio and demonstrating RL’s versatility in aerodynamic design [18]. Additionally, hybrid optimization methods like PSO-GA and DNN have improved centrifugal compressor stability and performance, increasing stall margin by 13.36% [19].
Crossover diffusers (CCDs) have led to significant performance gains in compressor designs. In an MGT, replacing a radial diffuser with a CCD resulted in an 82.3% increase in thrust and an 80% improvement in total-to-static pressure recovery after engine retrofit with a new impeller [20]. For the CAT250TJ MGT engine (Cape Aerospace Technologies, Cape Town, South Africa), a single-vaned CCD increased efficiency by 8.3% and the pressure ratio by 12.1%, although it had a narrower operating range. Tandem and splitter vane configurations improved the operating range, boosting static thrust by 10.74%. Further CFD and mean line evaluations confirmed these improvements [21]. This paper examines various optimization and performance enhancement methods for compressor designs. A combined approach using class–shape transformation, surface flow solver, and whale optimization significantly reduced total pressure loss in compressor cascades, improving flow characteristics under high-altitude and low-Reynolds-number conditions [22].
Optimization of NASA Rotor 67 with GERSM improved blade geometry, increasing adiabatic efficiency, total pressure ratio, and choke mass flow rates while maintaining stall margin [23]. Similarly, turbine stator blade optimization using a convolutional neural network (SCNN) achieved a 4.43% increase in power and a 1.39% increase in efficiency [24]. Scaling up a centrifugal compressor for a micro gas turbine from 100 kW to 250 kW showed a 1.4% efficiency increase, highlighting the impact of tip gap variation on performance [25]. CFD simulations of pipe diffusers in a 100 kW MGT compressor revealed that a more compact airfoil diffuser improved efficiency, but redesign was needed to prevent flow separation [26]. Surge phenomena in centrifugal compressors were linked to flow separation at diffuser blades, requiring design modifications to improve performance [27]. Off-design performance evaluations of centrifugal compressors for small gas turbines showed good agreement with experimental data, although surge flow was not addressed [28]. A MATLAB R2019b -based program for radial and mixed-flow compressors in MGT engines improved choke prediction accuracy by 13.39% with empirical corrections [29].
This paper presents the development of a vaned diffuser integrated into a 40 daN microjet engine, highlighting the challenges encountered during the process along with the numerical and experimental campaigns conducted to address these issues.
2. Materials and Methods
2.1. Compressor Base Design Characterization
The process of designing and testing a microjet engine can be broken down into a series of sequential stages, as illustrated in Figure 1. It begins with a literature review and conceptual design, which provides the foundation for the research and defines the performance objectives. Next, the thermodynamic cycle selection and preliminary design phase focuses on defining key components. The detailed design and simulation phase follows, where optimization is achieved through thermodynamic analysis, CFD, and structural simulations.
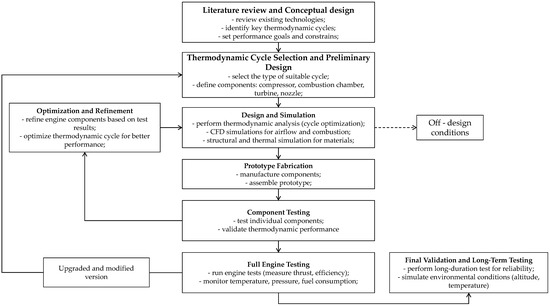
Figure 1.
Design process of a microjet engine development.
Afterward, prototype fabrication involves manufacturing and assembling the engine’s components. This is followed by component testing, which ensures each part functions correctly, and full engine testing, which evaluates the performance of the entire engine. Based on test outcomes, the optimization and refinement phase adjusts the design for improved efficiency. Finally, final validation and long-term testing ensures the engine’s reliability. If successful, the engine progresses to production/scale-up, where it undergoes mass production and final compliance checks.
The centrifugal compressor analyzed in this study is a critical component of a 40 daN microjet engine, designed with the goal of being both affordable and suitable for UAV-sized powerplants. For this research, the rotor geometry was fixed, while the vaned diffuser design relied on statistical databooks and correlations for its development [30,31,32]. Two different vaned diffuser configurations were analyzed, a trumpet-shaped and a semi-diagonal design (hereafter referred to as the C111 type), focusing on compact size, sufficient stall/choke margins, deswirl to ~30°, flow deceleration to <100 m/s, and best possible efficiency. The primary difference between the diffusers is that the C111 diffuser uses purely axial vanes with splitters, and its cross-sectional aspect ratio is closer to the ideal 1:1, compared to the 2:1 ratio found in the trumpet diffuser.
Table 1 and Table 2 present the compressor characteristics and design parameters of the two vaned diffusers. Figure 2 displays the manufactured diffusers.

Table 1.
Characteristics of the centrifugal compressor.
Table 2.
Vaned diffuser design parameters.
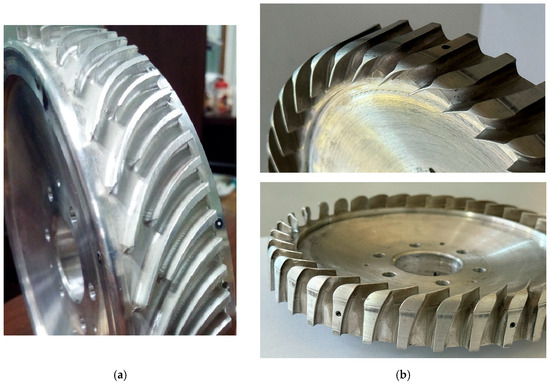
Figure 2.
Vaned diffuser configuration: (a) C111 diffuser; (b) trumpet diffuser.
2.2. Case Setup—CFD Approach
A preliminary performance prediction of the compressor was made using CFD (Computational Fluid Dynamics) analysis. The models used to evaluate and predict the flow behavior characteristics, boundary conditions, and other solutions are presented in the following sections. The numerical analysis of the centrifugal compressor was conducted using Ansys CFX 2021 R2 [33], which employs a finite volume method. ANSYS CFX uses a pressure-based coupled solver, solving the continuity and momentum equations simultaneously to enhance convergence stability for compressible flows.
All simulations were performed under steady-state conditions using the Reynolds-Averaged Navier–Stokes (RANS) framework. Turbulence effects were modeled using the Shear Stress Transport (SST) model with the curvature and rotation corrections [34]. The SST model was selected for its robustness in capturing flow separation and accurately predicting turbulent shear layers under adverse pressure gradients [35].
For spatial discretization, high-resolution schemes were used for both the advection terms and the turbulence equations, providing second-order accuracy where possible while maintaining numerical stability. Convergence was assessed based on several criteria—residuals of all governing equations falling below 10−5, stabilization of mass flow and pressure ratio residuals, and satisfaction of the mass imbalance criterion.
2.2.1. Mesh Independence Study
The grid was generated for both diffusers under the same conditions to ensure the mesh dimensions were as similar as possible, while also providing proper discretization of the domain. A mesh independence study was conducted for the C111 diffuser, with the overall dimensions of both diffusers being similar.
The mesh for the impeller remained consistent across all studies, consisting of 2,397,900 nodes per channel. Five different mesh resolutions were used for the mesh independence study: 0.83 million, 1.04 million, 1.32 million, 1.48 million, and 1.65 million nodes. The design point selected for this simulation corresponded to a mass flow rate of 0.7 kg/s and an angular velocity of 80,000 rpm, an inlet total pressure of 100,000 Pa, and an inlet temperature of 288 K.
To verify mesh convergence, the total pressure ratio and isentropic efficiency were monitored as key performance indicators. The results are summarized in Table 3, and a graphical representation is shown in Figure 3. Based on the observed trends, Mesh 4 (1.48 million nodes) was selected as the optimal mesh, offering a good balance between accuracy and computational cost. The relative error in pressure ratio between Mesh 4 and the finest mesh (1.65 million) was only 0.0524%, indicating negligible improvement with further refinement and confirming mesh independence.
Table 3.
Mesh independence characteristics.
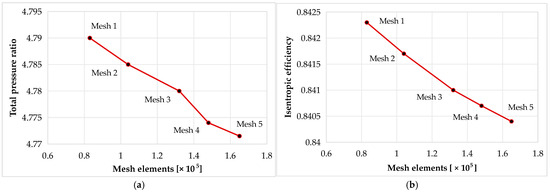
Figure 3.
Results of variables used to verify the convergence: (a) total pressure ratio to number of elements; (b) efficiency to number of elements.
Figure 4 shows the y⁺ distribution for both diffuser configurations. In each case, efforts were made to achieve a y⁺ value as close to 1 as possible in order to accurately capture the flow structures within the diffuser channels. To resolve the near-wall region, 10 inflation layers were applied, starting with a first layer height of 10−3 mm and a growth rate of 1.2. However, the mesh types used for the two geometries differ; the semi-diagonal diffuser (C111) was meshed exclusively with hexahedral elements, while the more complex geometry of the trumpet diffuser required a hybrid mesh consisting of tetrahedral, hexahedral, and wedge elements.
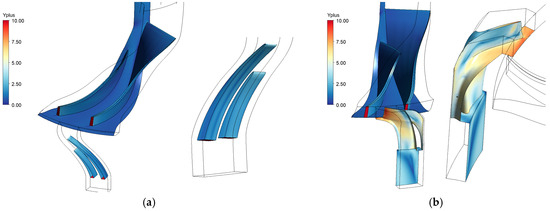
Figure 4.
y+ distribution: (a) C111 diffuser; (b) trumpet diffuser.
2.2.2. Boundary Conditions
For this study, the compressor characteristics of both diffusers were determined. Therefore, the outlet conditions and the angular velocity varied based on the operating line and working point.
For the inlet, the total pressure was set at 101,325 Pa, and the total temperature was specified as 288 K. The flow direction was assumed to be normal to the inlet boundary condition. Wall-type boundary conditions were applied to the blade, hub, and shroud in both the impeller and diffuser regions. These surfaces were considered adiabatical, with no slip condition, with an ideal air-compressible fluid. For temperature increase due to the compression process, the viscous terms were factored in.
The interface between the impeller and diffuser was modeled using a Stage (Mixing-Plane) approach. In high-speed centrifugal compressor simulations, the Mixing-Plane (Stage) interface is often preferred over Frozen Rotor for steady-state analysis because it circumferentially averages flow variables at the rotor–stator boundary [36], yielding a more realistic prediction of time-averaged performance parameters (pressure ratio, efficiency) and avoiding the sensitivity to arbitrary rotor–stator phase-angle alignment that the Frozen Rotor exhibits [37,38]. Moreover, Xu et al. [39] demonstrated in a centrifugal compressor study that while both models approximated experimental performance acceptably, the Frozen Rotor required the tuning of rotor–stator alignment to match data, unlike the Mixing-Plane, which yielded consistent results directly.
Figure 5 illustrated the computational domain and highlighted the characteristic boundary conditions applied in this study.
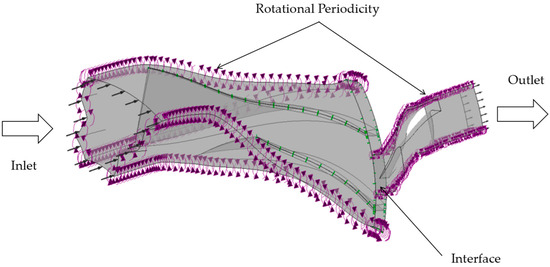
Figure 5.
Centrifugal compressor domain and boundary conditions (trumpet diffuser).
2.3. Test Bench Description
A custom-designed test rig [40,41] was developed to investigate the dynamic behavior and aerodynamic performance of a microjet engine prototype, with particular focus on the centrifugal compressor stage. The test bench architecture features a Data Acquisition and Control System (DACS) based on National Instruments hardware and software, complemented by comprehensive instrumentation for both the test stand and engine. Key monitored parameters include static and total pressures, static and total temperatures, fuel flow rates, vibrations, thrust, rotor speed, electrical currents, and voltages of various types. Additionally, the control system, operated via LabVIEW 2021 software, manages the automatic operation of auxiliary systems and engine management.
In this context, the compressor section was instrumented with pressure transducers and thermocouples positioned at both the inlet and outlet, allowing for the capture of pressure and temperature variations during different engine phases: starting, idle, working (transient), and stopping. A special case is the cold start regime, in which only air is used, while fuel is supplied solely for lubrication purposes. During this regime, the compressor operates at approximately 17% of the total design speed.
The experimental campaign was conducted following defined operating procedures. During the starting regime, a three-level algorithm was implemented, involving an initial air start, followed by a gas start, and finally a kerosene start. Each stage was controlled by rotor speed until idle speed was reached. The idle regime involved maintaining a constant rotor speed using proportional control methodology over a specified time interval. The working regime represents the transition between idle and maximum operating conditions, functioning as a dynamic phase between two steady-state regimes. Each working regime is referenced from the maximum operating condition and includes detailed dynamic measurements. The stopping regime involves a controlled reduction in rotor speed from idle to 0 RPM, marking the complete shutdown of engine operation.
Throughout all operating regimes, the DACS and control system function in real time to ensure both the engine and the test bench operate safely and properly. The overall instrumentation strategy enables a detailed analysis of flow phenomena within the compressor stage and its interaction with downstream components. This approach is critical not only for performance characterization but also for the validation of CFD models and the iterative refinement of micro-scale turbomachinery designs. Figure 6 presents the engine positioned on the test bench together with associated test cell instrumentation.
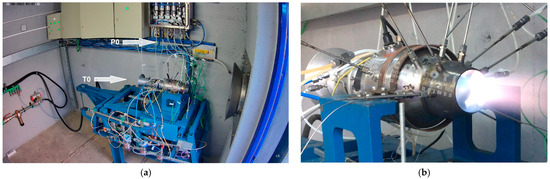
Figure 6.
Test cell instrumentation [40]: (a) general view; (b) flame front in starting regime.
The compressor, being a critical component influencing the overall thermodynamic efficiency and stability of the engine, was instrumented with both static and dynamic sensors. Pressure and temperature sensors were mounted at the inlet and outlet of the compressor to capture variations in total pressure and thermal loading under steady-state and transient conditions. The acquired data enabled the estimation of the pressure ratio and the identification of potential flow separation or performance degradation at various operating speeds. This integrated instrumentation strategy allowed for the detailed characterization of the compressor’s aerodynamic performance within the microjet engine test environment, supporting both component-level and system-level analyses. The insights gained from these measurements were instrumental in validating simulation models and guiding further design iterations of the compressor and intake system.
To ensure data consistency, the experimental setups were kept uniform across both campaigns. This included using the same microgas turbine configuration, with identical automatic start-up sequences and idle speed ramp-up procedures. Additionally, the compressor tip clearances and axial clearances were maintained uniformly between experiments. The pressure and temperature measurement locations, angles, and depths were also kept consistent across all tests. The automatic start-up sequence was carefully designed to ensure that both diffusers enabled the engine to reach the target idle speed without inducing compressor surge or choke, which could cause damage due to aerodynamic instability and high vibrations.
3. Results
3.1. Trumpet Diffuser Experimental Campaign
Figure 7a compares the inlet mass flow between experimental measurements and CFD predictions. The experimental data are presented as a point cloud, reflecting measurements across different operating conditions, while the CFD results are shown as a continuous line that generally follows the trend of the measured data. Although Figure 7a shows a fifth CFD point at around 70% RPM, this point was never achieved experimentally (due to mechanical issues [42]) and so it is not part of the overall analysis. It is more of an indicator of what the original theoretical work line of the engine was supposed to be and how it fits to the experimental trend-line. In Figure 7b, good agreement is observed between the predicted and measured aerodynamic power within the 55–65% rpm range. This correlation is primarily attributed to the uniformity of the total temperature field, which ensures that the local values measured by the probe closely match the section-averaged values. Figure 7c shows the pressure ratio between the static pressure after the impeller and the total pressure at the intake, while Figure 7d presents the same ratio but for the diffuser. In the CFD simulations, the static pressure after the impeller is mass-averaged and determined at the impeller–diffuser interface. At the point of greatest discrepancy, the static-to-static pressure ratio predicted by CFD is 2.8% lower than the experimental value, while the static-to-total pressure ratio is 4.37% lower than the corresponding experimental measurement.
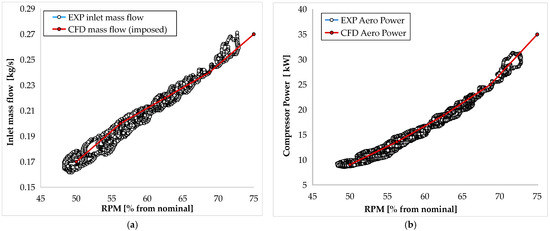
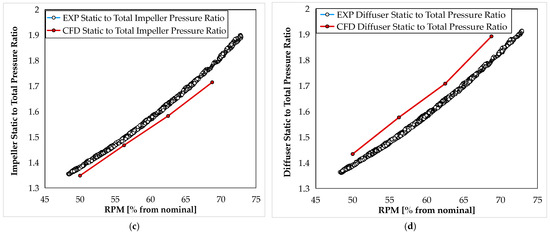
Figure 7.
Main comparison parameters between CFD and experimental results: (a) Inlet mass flow; (b) compressor power; (c) impeller static-to-total-pressure ratio; (d) diffuser static-to-total-pressure ratio.
Figure 8a presents the CFD plot of absolute pressure within the trumpet diffuser, while Figure 8b shows the pressure distribution on the diffuser shroud. The proximity to the rotor significantly influences the pressure distribution, with the stator playing a key role in the homogeneity of the pressure field. The absolute pressure in the diffuser varies between 1.7 and 1.8 bar, with the majority of the diffuser region falling between 1.7 and 1.76 bar, closely matching the experimental value of 1.75 bar. These results indicate that the CFD model accurately captures the pressure distribution within the diffuser.
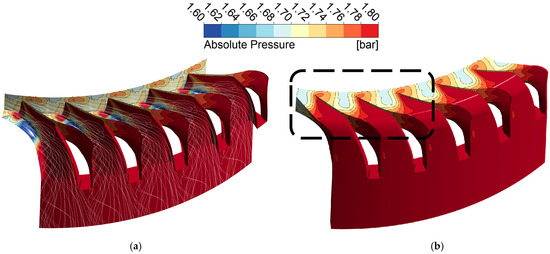
Figure 8.
Absolute pressure differences between mass flow averaged and pin point in the diffuser (68.75% of nominal): (a) hub and blades; (b) shroud.
The mass flow-averaged pressure at the interface is considered the more pertinent thermodynamic parameter, as it provides a more stable and representative measure of the overall flow characteristics, accounting for local pressure variations and offering a more reliable assessment of the diffuser’s performance.
Figure 9 compares the total pressure ratio from CFD simulations with experimental data. Figure 9b illustrates the total pressure distribution within the trumpet diffuser based on CFD analysis. The contour plot reveals pressure variations at different streamwise positions, starting from the blade trailing edge, and highlights the influence of secondary flows and flow separation within the diffuser. The CFD results show an overestimation of total pressure when mass-averaged values are compared to the experimental measurements (Figure 9a).
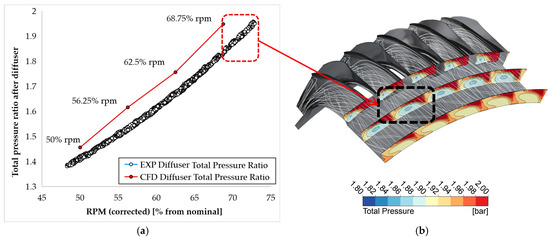
Figure 9.
Comparison of CFD and experimental results for the trumpet diffuser: (a) working line showing the total pressure ratio trend; (b) total pressure distribution along the streamwise direction for a selected operating point.
At approximately 12 mm from the trailing edge of the diffuser blades, the CFD results show total pressure dominated by regions at 1.875 bar, which is close to the experimental value of 1.848 bar. This discrepancy is primarily attributed to the large swirl induced by the diffuser’s topology, which could be corrected by diffusion further downstream from the trailing edge. It is important to note that the thermodynamic values used in the analysis are mass-averaged, making it more challenging to directly compare the measured total pressure and temperature values. The maximum discrepancy observed for the mass-averaged values in this study is 5.13%. However, for a more accurate comparison, the relative position, dimensions, and orientation of the total pressure probe must also be considered.
Figure 10 shows the absolute pressure distribution at 50% of the blade height span, highlighting regions of flow detachment on the pressure side of the blade. These detachment zones, which begin near the blade and progressively extend toward the diffuser outlet, cause pressure losses within the diffuser, ultimately reducing its overall efficiency. To ensure that the flow has sufficient time to stabilize before reaching the outlet, the computational model for the diffuser outlet was intentionally positioned farther from the blade’s trailing edge. This approach allows for a more accurate representation of the effects of flow separation and pressure recovery, providing a clearer depiction of the diffuser’s performance under real operating conditions.
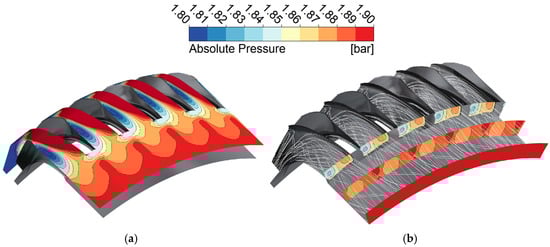
Figure 10.
Absolute pressure distribution on the trumpet diffuser (operating conditions: 68.75% of nominal speed and 0.28 kg/s mass flow): (a) diffuser shroud; (b) streamwise direction.
The static pressure distribution along the axial sections of the fluid flow appears relatively homogeneous. Depending on the placement of the instrumentation probe, pointwise CFD values can be obtained for a more precise comparison. The maximum discrepancy between CFD and experimental measurements is 4.9%.
The temperature distribution (Figure 11) further supports the findings from the pressure plots, revealing consistent trends that align with the observed pressure variations. In the case of total temperature at discharge, there is improved uniformity across each cross-sectional plane, with temperature differences between the minimum and maximum values typically ranging from 1 to 2 K. These variations are below the fluctuations observed experimentally, indicating good agreement between the CFD and experimental data. However, at higher RPMs, near 68%, there is a tendency for the CFD results to approach the upper limit of the experimental data range (Figure 12).
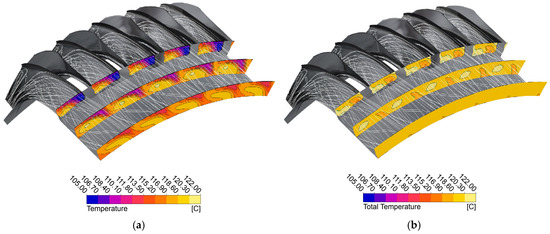
Figure 11.
Temperature distribution streamwise direction at the trumpet diffuser discharge (operating conditions: 68.75% of nominal speed and 0.28 kg/s mass flow): (a) static temperature; (b) total temperature.
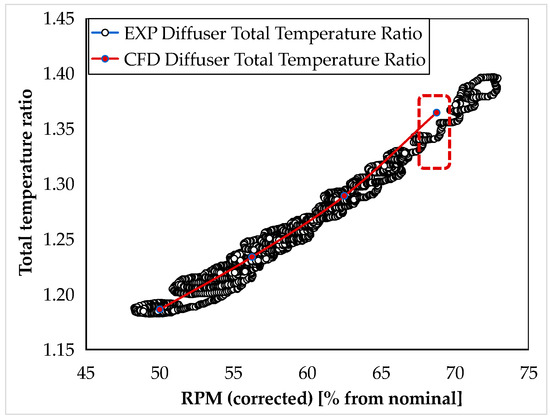
Figure 12.
Total temperature ratio (diffuser discharge to intake) CFD vs. experimental data.
The CFD values presented in Figure 13 are mass-averaged at the discharge boundary of a representative diffuser channel. This average is primarily relevant from a thermodynamic perspective, specifically in relation to the engine’s thermodynamic cycle and its operating line. The experimental values, on the other hand, are measured pointwise, obtained from the flow field (total values) or on the shroud (static values). Due to the pronounced swirl generated by the diffuser blades, the pointwise measurements can vary significantly. Therefore, the localization, topology (angularity), and orientation of the pressure probes are crucial. A more accurate comparison can be made by area-averaging the thermodynamic values, although such an approach should be viewed mainly from the perspective of validating the CFD data against experimental results. Figure 13 presents the differences between the experimental data and the CFD-calculated values, with the error bars representing the minimum and maximum experimental readings as percentages. The histogram bars refer to the following equation:
and the error bars accompanying each histogram bar represent the percentile values of the min/max values of the experimental band.
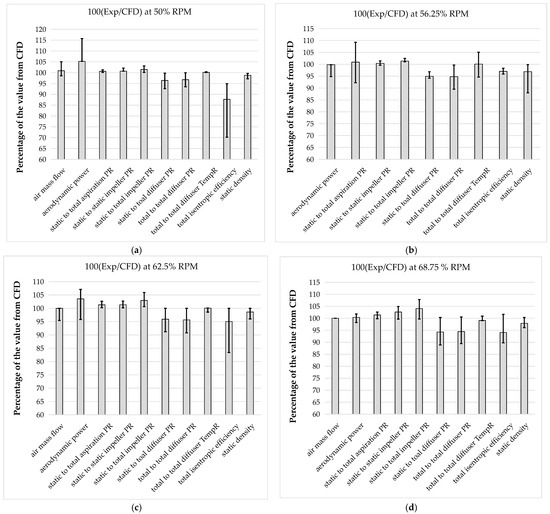
Figure 13.
Diffuser total pressure ratio CFD vs. EXP (mass averaged), the error bars representing the experimental campaign fluctuations: (a) 50% RPM; (b) 56.25% RPM; (c) 62.5%; (d) 68.75%.
The compared parameters fall within industry-accepted error margins, typically below 5% or around that value. The effect of tip clearance is not evident at the lower operating lines (near 60% of nominal speed). The axial swirl angle in the cases studied (at the lower flow rates) is relatively small, with most of the tangential circulation occurring around the axis of each vortex. However, this behavior may not be maintained at mid-range flow rates or at nominal operating conditions.
3.2. Trumpet Diffuser vs. Type C111 Diffuser at Design Point
Figure 14 shows a comparison of the absolute pressure distribution between the two types of diffusers. The pressure on the diffuser blades is more uniform and gradual in the C111 type diffuser, as opposed to the trumpet diffuser, which exhibits noticeable flow detachment on the suction side of the blades. This detachment results in a less consistent pressure distribution. The C111 type diffuser demonstrates a significant improvement in static pressure recovery. The smooth and gradual pressure recovery observed in the C111 type diffuser contributes to a more stable flow, reducing the likelihood of flow separation and enhancing overall performance compared to the trumpet diffuser.
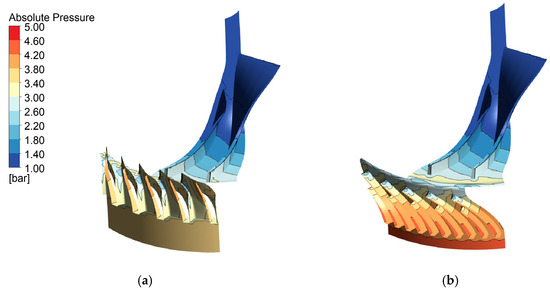
Figure 14.
Absolute pressure variation on the compressor blades (operating conditions: 100% of nominal speed and 0.7 kg/s mass flow): (a) trumpet diffuser; (b) C111 diffuser.
The results presented in Figure 15 and the development of streamlines within the diffuser both emphasize the same key differences between the two cases. Notably, flow separation occurs in the trumpet diffuser (as shown in Figure 15a), leading to less efficient flow dynamics. In contrast, the C111 diffuser maintains a more stable flow with significantly improved performance. The static temperature distribution is notably more uniform in the C111 configuration, reflecting its ability to promote a smoother, more controlled airflow. The C111 diffuser is designed to manage the flow effectively by preventing flow separation, rather than relying on the generation and redirection of a full-passage vortex as seen in the trumpet diffuser. This distinction highlights a different approach to managing the flow dynamics, where the focus is on maintaining smooth flow conditions rather than inducing vortex structures like in other configurations. This proactive flow control results in enhanced aerodynamic stability and greater overall efficiency.
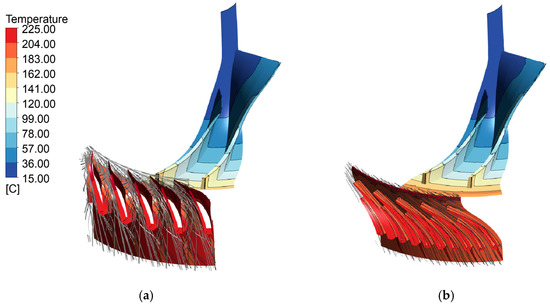
Figure 15.
Diffuser static temperature distribution and streamlines (operating conditions: 100% of nominal speed and 0.7 kg/s mass flow): (a) trumpet diffuser; (b) C111 diffuser.
Figure 16 presents the CFD compressor characteristics for the two diffusers, where the numbers in the legend correspond to the percentage of the nominal RPM of the engine. The pressure ratio achieved with the C111 diffuser is higher across all operating lines, although the range is narrower compared to the trumpet diffuser. Specifically, at the highest operating speed of 80,000 RPM, the total pressure ratio difference between the two points highlighted in the red box is approximately 19%. This indicates a significant performance difference between the two diffusers at this condition. The C111 diffuser configuration, while providing improved efficiency, may also present a potentially lower stall margin and choke margin compared to the trumpet diffuser. Despite these trade-offs, the C111 diffuser shows superior efficiency, making it an attractive choice for applications where performance is prioritized, even if it comes with a reduced operational range.
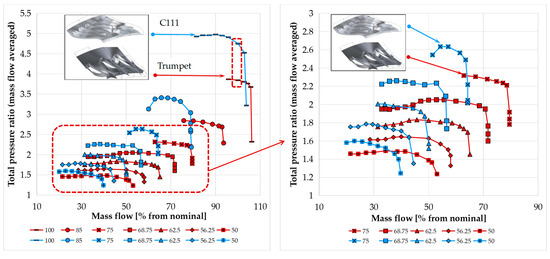
Figure 16.
Compressor performance map for the trumpet and C111 diffusers (numerical data).
The previously noted differences—specifically the narrower range observed for the C111 diffuser and its superior performance—are also evident in Figure 17. This figure compares several parameters measured during the experimental campaign and their progression for the two diffusers. It can be seen that the differences in total pressure ratio (Figure 17a) and mass flow become (Figure 17b) more pronounced as the rpm increases. The turbine inlet temperature plot from Figure 17c represents the temperature needed to obtain a stable operation of the microjet engine at the respective speed (RPM). The reference value here is the cycle’s nominal temperature. This is an indicator that both designs required high values of TIT, particularly due to mechanical losses that needed to be compensated. However, the C111 variant required slightly lower TIT (less fuel) and therefore was a bit more efficient [43].
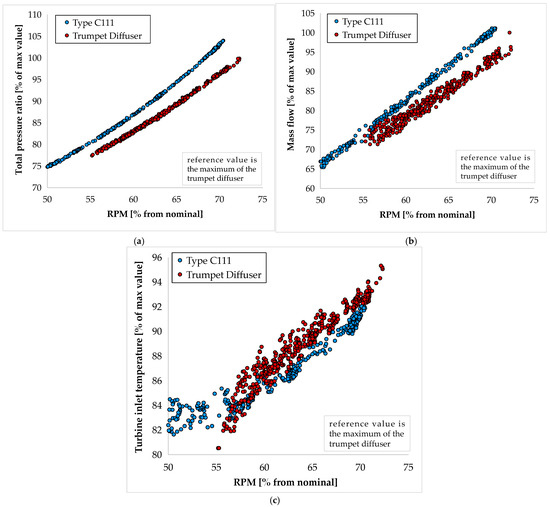
Figure 17.
Performance impact on the workline; comparison between the two diffusers: (a) total pressure ratio; (b) mass flow; (c) turbine inlet temperature.
Figure 18 depicts the experimental and CFD-computed isentropic efficiency of the two configurations discussed. The trumpet diffuser presents much more spread when it comes to this parameter—primarily because the flow is less organized than in the C111 type. Also, the values of efficiency are consistently higher in the C111 type—which was to be expected, given the CFD results. However, it needs to be said that, because the temperature and pressure probing was performed without the mapping of the outlet section—due to the size of the compressor—there are very large discrepancies between CFD and experiments. As shown in Figure 9, the temperature distribution is quite heterogeneous, making it very difficult to probe at a representative value. Future work will use a dedicated compressor test-bench equipped with a torquemeter to determine the shaft power across the compressor map.
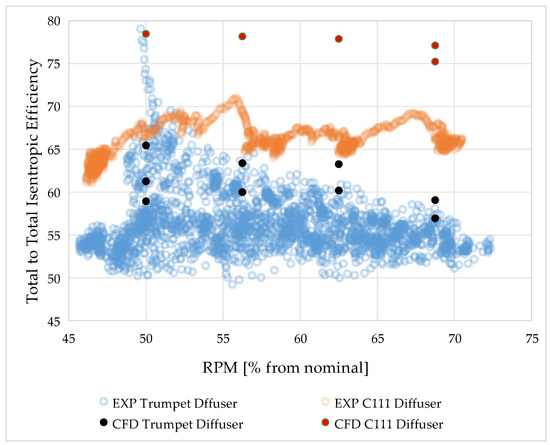
Figure 18.
Total-to-total isentropic efficiency CFD vs. experimental data.
As previously mentioned, CFD provided a virtual environment for simulating a variety of design configurations with greater precision than traditional methods would allow. This enabled us to target the operating line more accurately, ensuring that the design would perform as expected under real-world conditions.
The pressure distribution and flow characteristics observed in the two diffusers highlight several key differences in their aerodynamic performance. Figure 14 shows that the C111 diffuser achieves a more uniform pressure distribution and smoother pressure recovery compared to the trumpet diffuser, which experiences flow detachment. This detachment results in more turbulent, less efficient flow dynamics, ultimately reducing its performance. Additionally, the C111 diffuser’s more uniform static temperature distribution demonstrates its ability to better manage flow, minimizing temperature gradients and enhancing energy conversion efficiency. The CFD results further confirm that the C111 diffuser prevents flow separation—an important factor in maintaining aerodynamic stability and avoiding efficiency losses.
Moreover, the observed differences in pressure ratio, particularly at higher operating speeds, underscore the C111 diffuser’s performance advantages. While it offers superior efficiency, it also comes with trade-offs, notably in reduced stall and choke margins. These limitations should be considered in applications where performance is prioritized, although they may constrain the engine’s operational flexibility.
In summary, our findings show that the C111 diffuser provides more stable and efficient flow. However, its narrower operational range must be weighed against system-level design constraints and specific use cases. This deeper understanding of the flow phenomena will inform future design iterations, optimizing performance while considering operational limits.
4. Conclusions
This study investigated the performance of two diffuser designs—a trumpet-shaped and a semi-diagonal (C111) diffuser—intended for micro gas turbine engines, focusing on efficiency and operational flexibility. Initial steady-state CFD simulations using the k-omega SST turbulence model, validated by experimental testing during engine start-up from idle to 70% nominal speed, provided comprehensive insights into diffuser behavior.
The trumpet-shaped diffuser demonstrated a wider choke margin, indicating better operational stability across varying flow conditions. However, this design experienced increased aerodynamic losses and flow separation, as evidenced by both CFD streamlines and experimental measurements. In contrast, the semi-diagonal diffuser achieved higher overall efficiency and more uniform static temperature distribution by effectively preventing flow separation and promoting smoother, more controlled airflow. This design, however, required more precise alignment with the target operating point to maximize performance.
The k-omega SST model proved robust in predicting diffuser performance, with an average deviation of 5.13% across all instrumented parameters and speedlines, validating the use of CFD for thermodynamic and aerodynamic assessments. Differences between CFD and experimental results remained within industry-accepted error margins, underscoring the reliability of the combined approach. Notably, the impact of tip clearance and axial swirl angles was minimal at lower operating speeds but may become significant at higher flow rates and nominal conditions.
Analysis of flow structures revealed that both designs generate axial vortex patterns at the diffuser exit, with the trumpet diffuser relying on vortex redirection and the semi-diagonal diffuser focusing on flow stability and separation control. The mass-averaged thermodynamic values from CFD, combined with pointwise experimental data, highlighted the importance of measurement topology and probe orientation in capturing accurate flow dynamics.
Overall, while the trumpet diffuser offers greater stability and operational margin, the semi-diagonal design is superior in aerodynamic efficiency when operated near its optimal point. Future work will extend the investigation to higher speed ranges and transient engine regimes, employing harmonic balance CFD methods and advanced data acquisition to further refine diffuser design and performance predictions.
Author Contributions
Conceptualization, V.D. and B.G.; methodology, V.D. and B.G.; software, V.D., B.G. and O.D.; validation, V.D., B.G., C.O. and O.D.; formal analysis, V.D.; investigation, V.D., C.O. and C.M.T.; resources, V.D. and C.O.; data curation, V.D. and O.D.; writing—original draft preparation, O.D. and C.M.T.; writing—review and editing, B.G., V.D. and C.O.; visualization, V.D. and C.M.T.; supervision, B.G.; project administration, C.O. All authors have read and agreed to the published version of the manuscript.
Funding
This work was carried out through “Nucleu” Program, part of the National Plan for Research, Development and Innovation 2022–2027, supported by the Romanian Ministry of Research, Innovation and Digitalization, Grant No. PN 23.12.01.02.
Institutional Review Board Statement
Not applicable.
Informed Consent Statement
Not applicable.
Data Availability Statement
The original contributions presented in this study are included in the article material. Further inquiries can be directed to the corresponding author.
Conflicts of Interest
The authors declare no conflicts of interest. The funders had no role in the design of the study; in the collection, analyses, or interpretation of data; in the writing of the manuscript; or in the decision to publish the results.
Abbreviations
The following abbreviations are used in this manuscript:
| CCD | Crossover diffusers |
| CFD | Computational Fluid Dynamics |
| MGT | Micro Gas Turbine |
| RANS | Reynolds-Averaged Navier–Stokes |
| SST | Shear Stress Transport |
| UAV | Unmanned aerial vehicle |
| TIT | Turbine Inlet Temperature |
References
- do Nascimento, M.A.R.; de, L.; dos Santos, E.C.; BatistaGomes, E.E.; Goulart, F.L.; Gutirrez Velsques, E.I. Micro Gas Turbine Engine: A Review. In Progress in Gas Turbine Performance; IntechOpen: London, UK, 2013. [Google Scholar]
- Rendón, M.A.; Sánchez, R.C.D.; Gallo, M.J.; Anzai, A.H. Aircraft hybrid-electric propulsion: Development trends, challenges and opportunities. J. Control Autom. Electr. Syst. 2021, 32, 1244–1268. [Google Scholar] [CrossRef]
- Costa, F.; Whitacker, L.; Bringhenti, C.; Tomita, J.; Campos, G.; Almeida, L.; Cavalca, D. An overview of small gas turbine engines. In Proceedings of the 24th ISABE Conference, ISABE-2019-24387, Canberra, Australia, 22 November 2019; pp. 22–27. [Google Scholar]
- Montazeri-Gh, M.; Fashandi, S.A.M.; Jafari, S. Theoretical and Experimental Study of a Micro Jet Engine Start-Up Behaviour. Teh. Vjesn. 2018, 25, 839–845. [Google Scholar] [CrossRef]
- Wu, X.; Hu, X.; Xiang, X.; Lin, S.; You, J.; Tian, F. An analysis approach for micro gas turbine engine’s performance by experiment and numerical simulation. Case Stud. Therm. Eng. 2023, 49, 103305. [Google Scholar] [CrossRef]
- Balli, Ö. General Aviation and Thermodynamic Performance Analyses of a Micro Turbojet Engine Used on Drones and Unmanned Aerial Vehicles (UAV). J. Aviat. Res. 2020, 2, 115–141. [Google Scholar]
- Li, J.; Li, Y. Micro gas turbine: Developments, applications, and key technologies on components. Propuls. Power Res. 2023, 12, 1–43. [Google Scholar] [CrossRef]
- Dixon, S.L.; Hall, C.A. Fluid Mechanics and Thermodynamics of Turbomachinery, 7th ed.; Butterworth-Heinemann: Oxford, UK, 2014. [Google Scholar]
- Kock, M.P. Design of a Cross-over Diffuser for a Mixed Flow Compressor Impeller. Master’s Thesis, Stellenbosch University, Cape Town, South Africa, 2017. [Google Scholar]
- van Eck, H.; van der Spuy, S.J.; Gannon, A.J. Expanding the choke margin of a mixed flow compressor stage for a micro gas turbine engine. Int. J. Turbo Jet-Engines 2024, 41, 91–101. [Google Scholar] [CrossRef]
- Sinha, K.P.; Biswas, A.K.; Mullick, A.; Majumdar, B. Flow Development through a Duct and a Diffuser Using CFD. Int. J. Eng. Res. Appl. 2017, 7, 46–54. [Google Scholar] [CrossRef]
- Schlaps, R.; Shahpar, S. Automatic three-dimensional optimisation of a modern tandem compressor vane. In Turbo Expo: Power for Land, Sea, and Air; American Society of Mechanical Engineers: New York, NY, USA, 2014. [Google Scholar] [CrossRef]
- van Eck, H. The Effect of a Crossover Diffuser Configuration on the Performance of a Mixed Flow Compressor Stage for a Micro Gas Turbine Engine. Ph.D. Thesis, Faculty of Engineering at Stellenbosch University, Cape Town, South Africa, 2023. [Google Scholar]
- Zhao, Y.; Li, J. Study of the flow characteristics in multi-row vaned diffusers of a centrifugal compressor stage. Adv. Mech. Eng. 2018, 10, 168781401879960. [Google Scholar] [CrossRef]
- van Eck, H.; van der Spuy, S. The Effect of a Tandem Vane Crossover Diffuser Configuration on the Performance of a MGT Mixed Flow Compressor. Proc. Inst. Mech. Eng. Part G J. Aerosp. Eng. 2024, 238, 617–628. [Google Scholar] [CrossRef]
- Pinto, R.N.; Afzal, A.; D’Souza, L.V. Computational Fluid Dynamics in Turbomachinery: A Review of State of the Art. Arch. Computat. Methods Eng. 2017, 24, 467–479. [Google Scholar] [CrossRef]
- Aissa, M.H.; Verstraete, T. Metamodel-Assisted Multidisciplinary Design Optimization of a Radial Compressor. Int. J. Turbomach. Propuls. Power 2019, 4, 35. [Google Scholar] [CrossRef]
- Xu, X.; Huang, X.; Bi, D.; Zhou, M. An Intellectual Aerodynamic Design Method for Compressors Based on Deep Reinforcement Learning. Aerospace 2023, 10, 171. [Google Scholar] [CrossRef]
- Ma, S.B.; Roh, M.S.; Kim, K.Y. Optimization of Discrete Cavities with Guide Vanes in A Centrifugal Compressor based on A Comparative Analysis of Optimization Techniques. Int. J. Aeronaut. Space Sci. 2021, 22, 514–530. [Google Scholar] [CrossRef]
- Burger, C.J.; van der Spuy, S.J.; von Backström, T.W. Design of a Compact Crossover Diffuser for Micro Gas Turbines Using a Mean-Line Code. Int. J. Turbo Jet-Engines 2019, 36, 347–357. [Google Scholar] [CrossRef]
- van Eck, H.; van der Spuy, S.J. Upgrading the Compressor Stage of the CAT250TJ Micro Gas Turbine Engine. Aerotec. Missili Spaz. 2024, 104, 91–104. [Google Scholar] [CrossRef]
- Huang, S.; Yang, C.; Han, G.; Zhao, S.; Lu, X. Multipoint design optimization for a controlled diffusion airfoil compressor cascade. Proc. Inst. Mech. Eng. Part C J. Mech. Eng. Sci. 2020, 234, 2143–2159. [Google Scholar] [CrossRef]
- Tang, X.; Luo, J.; Liu, F. Aerodynamic shape optimization of a transonic fan by an adjoint-response surface method. Aerosp. Sci. Technol. 2017, 68, 26–36. [Google Scholar] [CrossRef]
- Du, Q.; Yang, L.; Li, L.; Liu, T.; Zhang, D.; Xie, Y. Aerodynamic design and optimization of blade end wall profile of turbomachinery based on series convolutional neural network. Energy 2022, 244, 122617. [Google Scholar] [CrossRef]
- Barsi, D.; Bottino, A.; Perrone, A.; Ratto, L.; Zunino, P. Design of a Centrifugal Compressor for Micro Gas Turbine: Investigation of Scaling and Tip Clearance Effects. Open J. Fluid Dyn. 2019, 9, 49–62. [Google Scholar] [CrossRef]
- Bhavsar, S.; De, S. Aerodynamic design and performance evaluation of pipe diffuser for centrifugalcompressor of micro gas turbine. In Proceedings of the ASME 2019 Gas Turbine India GT India, Chennai, India, 5–6 December 2019. [Google Scholar]
- Blanco-Patiño, D.F.; Niño-Navia, J.; Garcia-Sepulveda, J.I.; Nieto-Londoño, C. Performance prediction of a centrifugal compressor for a cogeneration microturbine. Int. J. Thermofluids 2023, 17, 100272. [Google Scholar] [CrossRef]
- Dhinne, G.K. Off-Design Performance Analysis of Centrifugal Compressor of a Small Gas Turbine Engine. In Proceedings of the ASME Turbo Expo 2024: Turbomachinery Technical Conference and Exposition, V009T18A012, London, UK, 24–28 June 2024. [Google Scholar] [CrossRef]
- van Eck, H.; van der Spuy, S.J.; von Backström, T.W. Development of a one-dimensional code for the initial design of a micro gas turbine mixed flow compressor stage. Int. J. Turbo Jet-Engines 2023, 40, s207–s218. [Google Scholar] [CrossRef]
- Japikse, D. Centrifugal Compressor Design and Performance; Concepts ETI: Hartford, UK, 1996; ISBN 0-933283-03-2. [Google Scholar]
- Lieblein, S. Loss and stall analysis of compressor cascades. J. Basic Eng. 1959, 81, 387–400. [Google Scholar] [CrossRef]
- Lieblein, S. Incidence and deviation-angle correlations for compressor cascades. J. Basic Eng. 1960, 82, 575–587. [Google Scholar] [CrossRef]
- Available online: https://www.ansys.com/products/fluids/ansys-cfx (accessed on 5 December 2024).
- Available online: https://ansyshelp.ansys.com (accessed on 21 May 2025).
- Menter, F.R. Two-equation eddy-viscosity turbulence models for engineering applications. AIAA J. 1994, 32, 1598–1605. [Google Scholar] [CrossRef]
- Ansys CFX-Solver Theory Guide, Release 2021 R2. Available online: https://dl.cfdexperts.net/cfd_resources/Ansys_Documentation/CFX/Ansys_CFX-Solver_Theory_Guide.pdf (accessed on 21 May 2025).
- Available online: https://ansyshelp.ansys.com/public/account/secured?returnurl=/Views/Secured/corp/v242/en/cfx_ref/i1310775.html (accessed on 1 July 2025).
- Belamri, T.; Galpin, P.; Braune, A.; Cornelius, C. CFD Analysis of a 15 Stage Axial Compressor: Part I—Methods. In Turbo Expo: Power for Land, Sea, and Air; American Society of Mechanical Engineers: New York, NY, USA, 2005. [Google Scholar] [CrossRef]
- Xu, C.; Amano, R.S. Meridional Considerations of the Centrifugal Compressor Development. Int. J. Rotating Mach. 2012, 518381, 11. [Google Scholar] [CrossRef]
- Tărăbîc, C.M.; Cican, G.; Olariu, C.; Dediu, G.; Catană, R.M. Test Stand for Microjet Engine Prototypes. Machines 2024, 12, 688. [Google Scholar] [CrossRef]
- Tărăbîc, C.M.; Olariu, C.; Cican, G.; Dediu, G.; Secăreanu, R.A.; Suciu, C.P.; Hank, A. Instrumentation and data acquisition system for microjet engines—Prototypes. Turbo 2023, 10, 1. [Google Scholar]
- Vladuca, I.; Prisăcariu, E.G.; Suciu, C.P.; Dobromirescu, C.; Nicoară, R.E. Study on nitrogen barrier protection of an airend oil-free compressor bearings in H2 compression. In MATEC Web of Conferences 354; EDP Sciences: Paris, France, 2021. [Google Scholar] [CrossRef]
- Popescu, J.A.; Porumbel, I.; Vilag, V.A.; Cuciumita, C.F. Thermodynamic Cycle Analysis for Overall Efficiency Improvement and Temperature Reduction in Gas Turbines. World Acad. Sci. Eng. Technol. Int. J. Energy Power Eng. 2015, 9. [Google Scholar]
Disclaimer/Publisher’s Note: The statements, opinions and data contained in all publications are solely those of the individual author(s) and contributor(s) and not of MDPI and/or the editor(s). MDPI and/or the editor(s) disclaim responsibility for any injury to people or property resulting from any ideas, methods, instructions or products referred to in the content. |
© 2025 by the authors. Licensee MDPI, Basel, Switzerland. This article is an open access article distributed under the terms and conditions of the Creative Commons Attribution (CC BY) license (https://creativecommons.org/licenses/by/4.0/).