Article

W-Band Transverse Slotted Frequency Scanning Antenna for 6G Wireless Communication and Space Applications

by
Hurrem Ozpinar
1,2,*,
Sinan Aksimsek
3 and
Nurhan Türker Tokan
2
1
Baykar Defense Techologies, Esenyurt, Istanbul 34000, Türkiye
2
Department of Electronics and Communication Engineering, Yildiz Technical University, Istanbul 34220, Türkiye
3
ASELSAN Inc., Ankara 06200, Türkiye
*
Author to whom correspondence should be addressed.
Aerospace 2025, 12(6), 493; https://doi.org/10.3390/aerospace12060493
Submission received: 28 April 2025 / Revised: 27 May 2025 / Accepted: 27 May 2025 / Published: 30 May 2025
(This article belongs to the Section Astronautics & Space Science)

Abstract

Terahertz (THz) antennas are among the critical components required for enabling the transition to sixth-generation (6G) wireless networks. Although research on THz antennas for 6G communication systems has garnered significant attention, a standardized antenna design has yet to be established. This study introduces the modeling of a full-metal transverse slotted waveguide antenna (TSWA) for 6G and beyond. The proposed antenna operates across the upper regions of the V-band and the entire W-band. Designed and simulated using widely adopted full-wave analysis tools, the antenna achieves a peak gain of 17 dBi and a total efficiency exceeding 90% within the band. Additionally, it exhibits pattern-reconfigurable capabilities, enabling main lobe beam steering between 5° and 68° with low side lobe levels. Simulations are conducted to assess the power handling capability (PHC) of the antenna, including both the peak (PPHC) and average (APHC) values. The results indicate that the antenna can handle 17 W of APHC within the W-band and 3.4 W across the 60–160 GHz range. Furthermore, corona discharge and multipaction analyses are performed to evaluate the antenna’s power handling performance under extreme operating conditions. These features make the proposed TSWA a strong candidate for high-performance space applications, 6G communication systems, and beyond.

1. Introduction

The advancement of technology and the changing demands have led to the expectation that 6G wireless communication technologies will facilitate worldwide communication without limitations of time or location. Hence, it is anticipated that the forthcoming 6G communication system would incorporate the integration of space networks and terrestrial networks, although 5G mobile and wireless systems mostly operate on the ground [1,2]. The utilization of THz technology is being evaluated as a means to fulfill the quality requirements anticipated for 6G, owing to its attributes encompassing security, high resolution, and broadband capabilities [3]. In this context, understanding the fundamentals and limitations of terahertz (THz) technology becomes crucial. The origin of the term terahertz can be traced back to 1970, when it was used to describe the frequency range of a HeNe laser [4]. Due to the advantages such as low photon energy, wide spectral range, and strong penetrability, terahertz technology has attracted attention since this date in medical imaging systems [5], security detection applications, and defect detection of materials [6]. However, THz waves within the THz gap region are significantly absorbed by water vapor and oxygen molecules in the atmosphere. Thus, the transmission distance is limited due to atmospheric attenuation in wireless communication applications. To address the critical challenge of the significant path loss caused by the vast distances between communication systems, transceivers with high output power, high sensitivity, and a low noise figure are required [1].
Equally important is the design of high-gain THz antennas capable of handling high power, making this an essential focus in the field. Numerous studies in the literature are dedicated to advancing THz antenna technology. THz antennas made of metal [7,8,9,10], dielectric [11,12], and new materials such as carbon nanotube and graphene [13,14,15,16] have been proposed in the literature. Specifically, Fuscaldo et al. showed that using non-plasmonic leaky-wave modes in graphene-based Fabry–Perot cavity antennas can increase radiation efficiency to over 60%, compared to around 20% in plasmonic designs, making them suitable for efficient and tunable THz leaky-wave antennas and sensors [14]. Hwu et al. investigated the potential applications of terahertz wireless communication to transfer data within spacecraft and between orbits [17]. It has been reported that data rates exceeding 10 Gbps per 1 GHz of channel bandwidth can be achieved at THz frequencies. Han et al. proposed a terahertz space application system to be used in intersatellite links, which helps to reduce the path loss effect in the atmosphere [18]. Additionally, the application difficulties of the terahertz antenna are highlighted. It is believed that a static communication system based on one or more fixed antennas will not meet the evolving needs of communication technology. Therefore, it is suggested that reconfigurable antennas operating at terahertz frequencies are advantageous. In [19], Tamagnone et al. discovered that the hybrid graphene–metal bowtie antenna demonstrates the capability to achieve dynamic frequency reconstruction through the utilization of the graphene field effect. By implementing the suggested configuration, it becomes possible to manipulate the resonance frequency of the antenna within the range of 0.6 to 1.2 THz. In their study, Xu et al. [20] conducted an analysis on the radiation patterns exhibited by a nano-patch antenna. This particular antenna was constructed using an array of graphene patches, offering the advantage of convenient control through the manipulation of electrostatic bias voltages applied to individual elements. The proposed construction has a maximum dynamic range of 80° in the primary beam direction. Wang et al. successfully reconstructed the resonance frequency of a graphene-based material within the range of 3 to 3.66 THz [21]. Additionally, the researchers proposed a novel concept for a leaky-wave antenna that can be configured as desired. Furthermore, it has been indicated that the antenna beam possesses the capacity to be reconfigured, allowing for beam scanning capabilities of up to 68° inside the terahertz range.
While advancements in terahertz antenna technology focus on reconfigurable beams and innovative designs, high-power handling capacity emerges as another critical consideration. To the best of the authors’ knowledge, a comprehensive analysis of high-power handling capabilities in the proposed terahertz antenna designs remains unexplored in the literature. Moreover, the radio communication community has yet to offer a systematic antenna design that possesses high gain, broadband capability, compactness, and reconfigurability, which are essential requirements for fields such as 6G and space communications.
In this work, a transverse slotted waveguide antenna (TSWA), which possesses the advantageous characteristics of compact design, the ability to handle high power, high gain, and the capability to steer the beam in a unique manner, is proposed. The TSWA operates at sub-THz frequencies and emerges as a viable solution to address the requirements of 6G and space communication. The antenna is developed and simulated using widely adopted full-wave analysis tools. It achieves a simulated peak gain of 17 dBi and total efficiency exceeding 90% within the specified frequency range. Furthermore, the proposed antenna features pattern-reconfigurable properties, enabling the steering of the main lobe beam direction within a range of more than 60° while maintaining low side lobe levels. The proposed TSWA demonstrates an average power handling capability of 17 W within the W band and 3.4 W across the 60–160 GHz frequency range. The peak power handling capability is calculated as 1.69 kW at 75 GHz and 385.8 kW at 60 GHz. Corona discharge is observed at power levels above 83.2 W in the 60–160 GHz range and 517.5 W in the 75–110 GHz range. Regarding multipaction, the component achieves a power handling capability of up to 24.3 kW at 60 GHz.
Section 2 describes the design specifications for the individual unit element of the transverse slotted antenna. Section 3 focuses on the design of the TSWA and incorporates simulation studies of the proposed antenna. Section 4 presents the measurement results of the fabricated antenna, along with a comparison between simulation results and experimental data. Section 5 examines the power handling capability of the proposed TSWA, including an analysis of the corona discharge, multipaction effect, and the estimated power levels at which the antenna can operate effectively. Finally, Section 6 summarizes the key conclusions of this study.

2. Transverse Slotted Unit Element Design

The development of beam-scanning high-gain antennas is of the greatest significance in order to address the challenges caused by path loss. Transverse slotted antennas are called leaky-wave antennas since the waves that travel through them slowly leak into space through the gaps. This section focuses on the design and analysis of the unit element of TSWA.

2.1. Antenna Unit Element Design

Leaky-wave antennas are typically created in the form of an array. Prior to commencing the array antenna design, it is important to undertake the design of the unit cell that forms the array antenna. The unit element of the TSWA is shown in Figure 1. Its waveguide aperture is compatible with the WR10 rectangular waveguide standard (width of 2.54 mm × height of 1.27 mm). The slot length is chosen to be nearly half of the wavelength by evaluating the lowest-order mode frequency of the WR10 waveguide. The width of the slot is determined to be much smaller than the length of the slot. In particular, the optimization of the transverse slot parameters—such as slot length, offset, and width—was performed by following the analytical and simulation-based methodologies proposed in [22,23,24]. The dimensions of the slot apertures on the waveguide are tuned via simulation studies. Optimized parameters of the transverse slotted unit cell are given in Table 1.

2.2. Dispersion Analysis

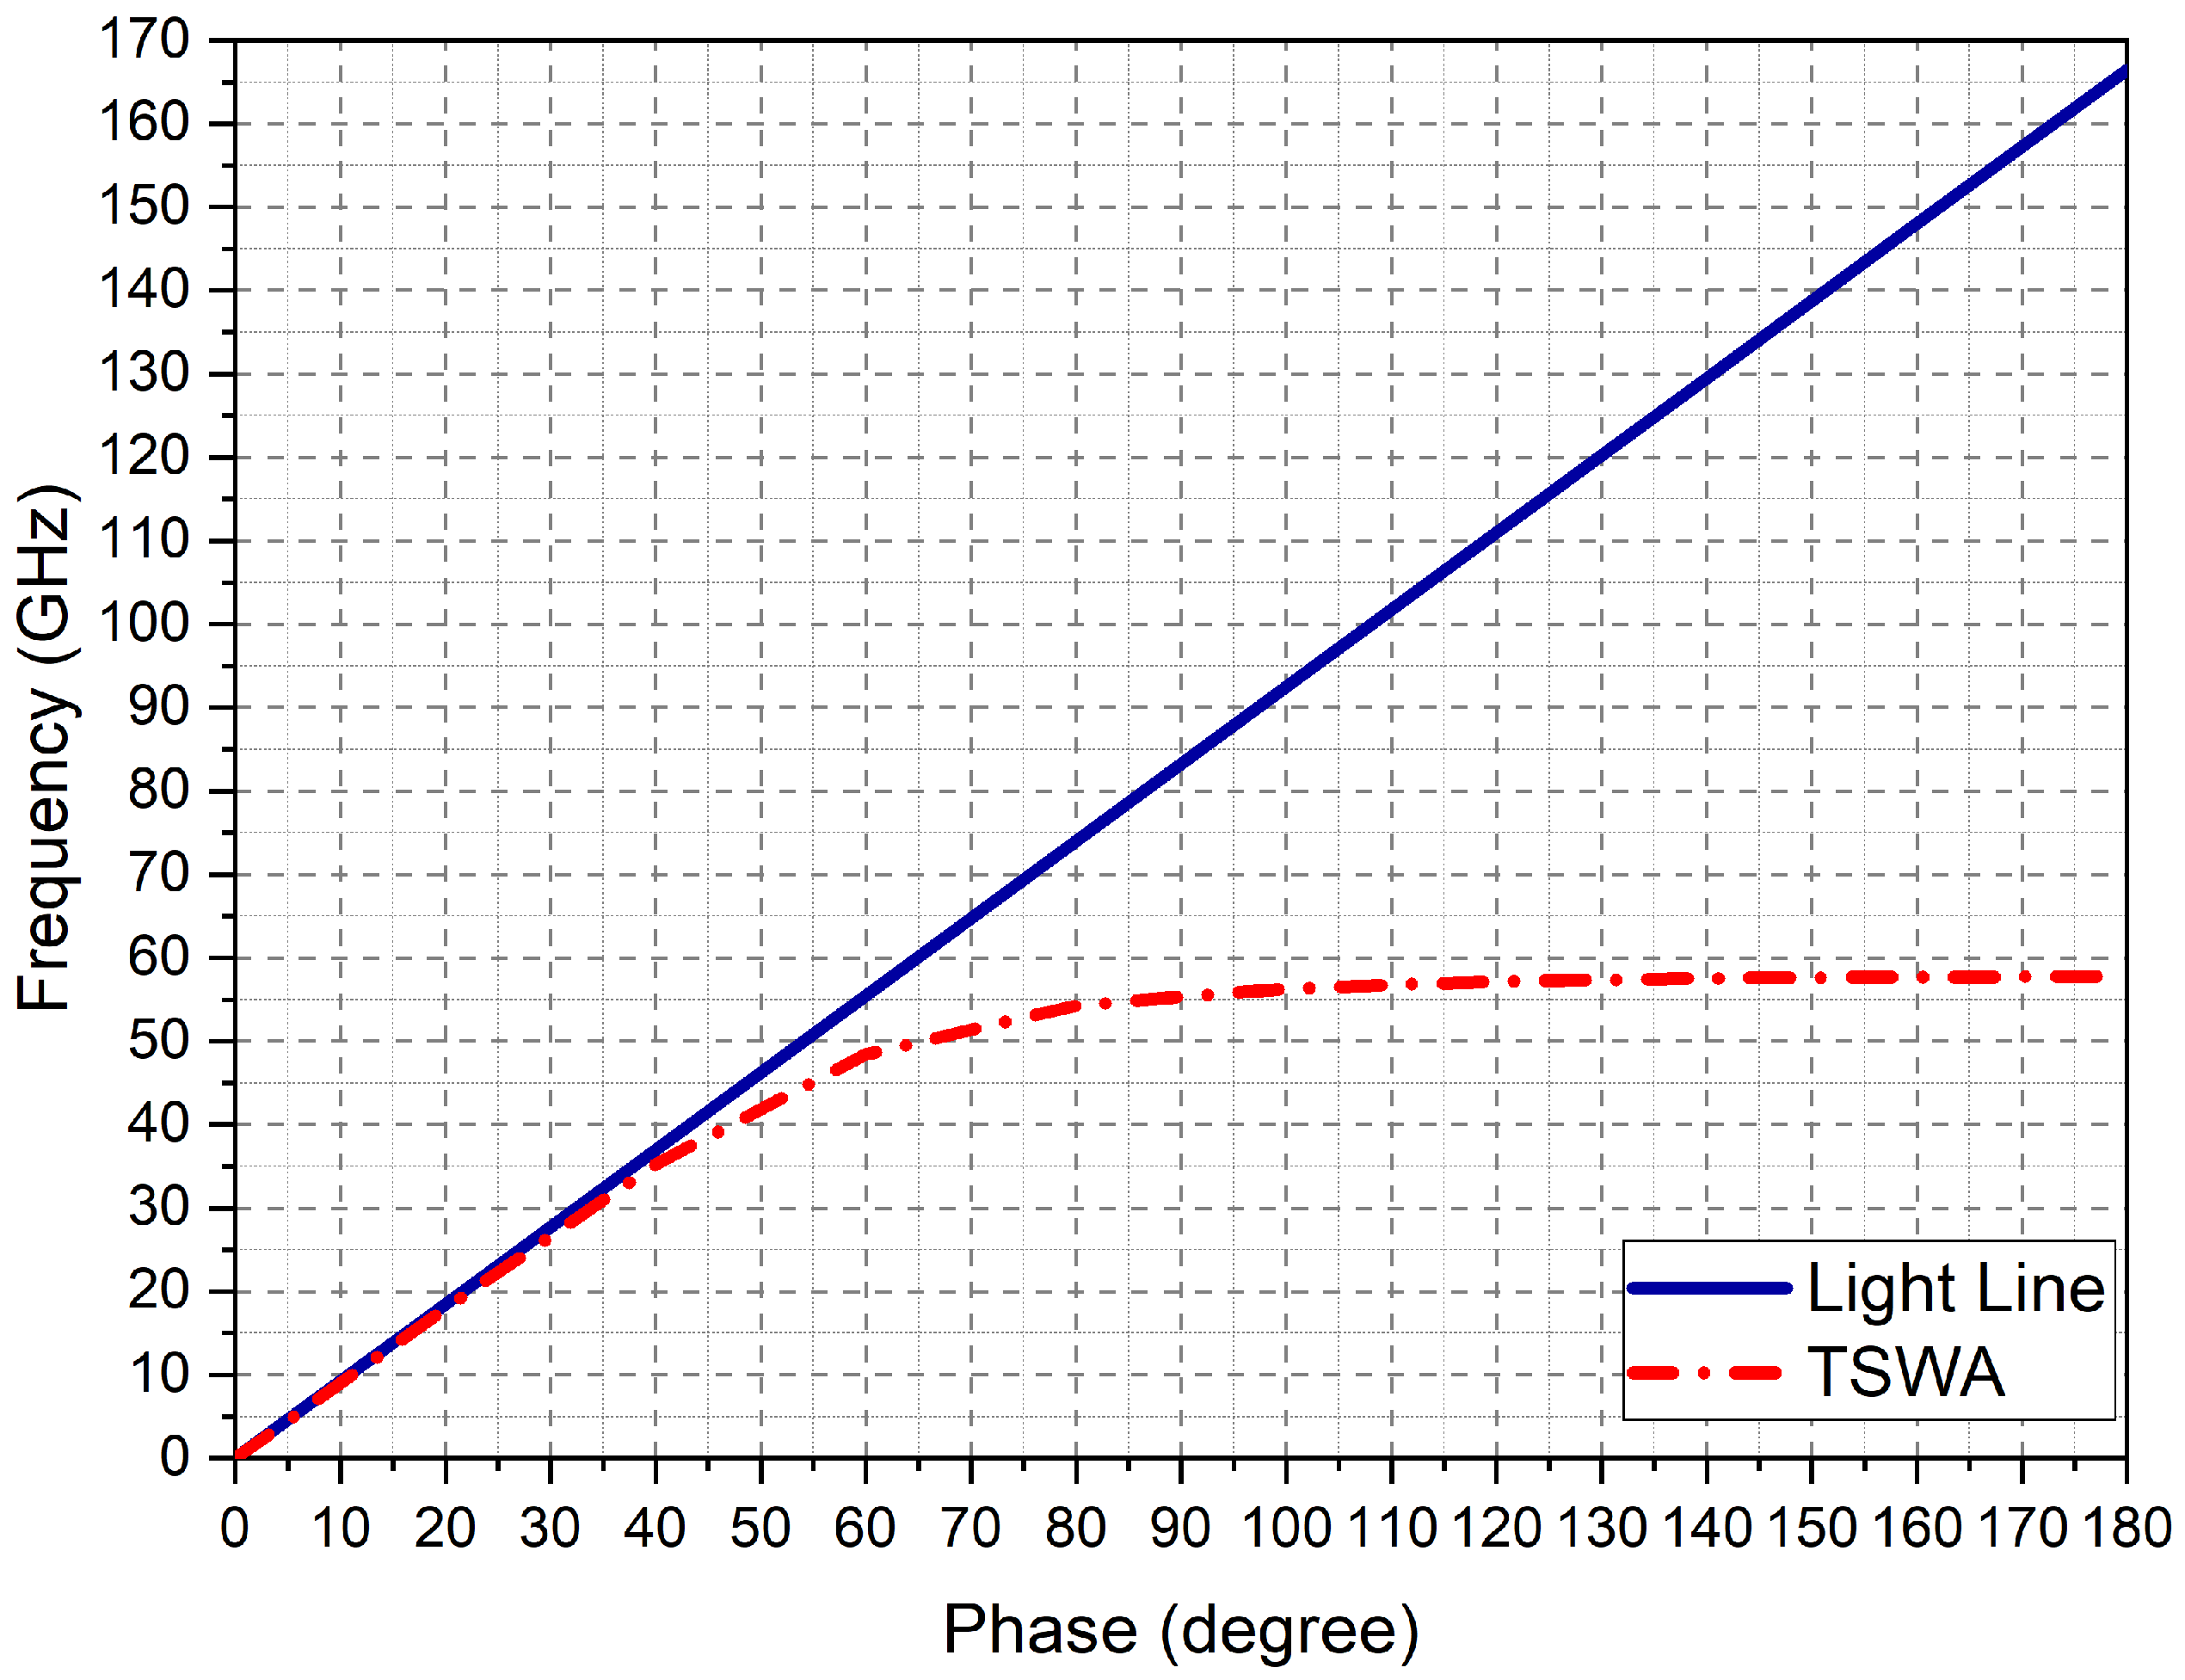
The analysis of the unit element is conducted using the Eigenmode solver in CST Microwave Studio [25]. The dispersion analysis results are presented in Figure 2. The solid line represents the relationship between phase and frequency when the wave propagates in free space. The phase and frequency variation of the transverse slotted unit cell is given by the red dashed/dotted line. Upon analyzing the response of the unit cell, it becomes clear that it exhibits slow wave characteristics beyond the cutoff frequency of 59 GHz. In other words, when the frequency reaches 59 GHz and above, the wave travels across the slotted surface of the antenna and emits radiation. Thus, with the proper selection of the parameters, a narrow-beam antenna that scans the beam over a wide frequency band with a superior beam-steering capability can be obtained [26].

3. Design of W-Band Transverse Slotted Array Antenna

3.1. Slotted Array Design

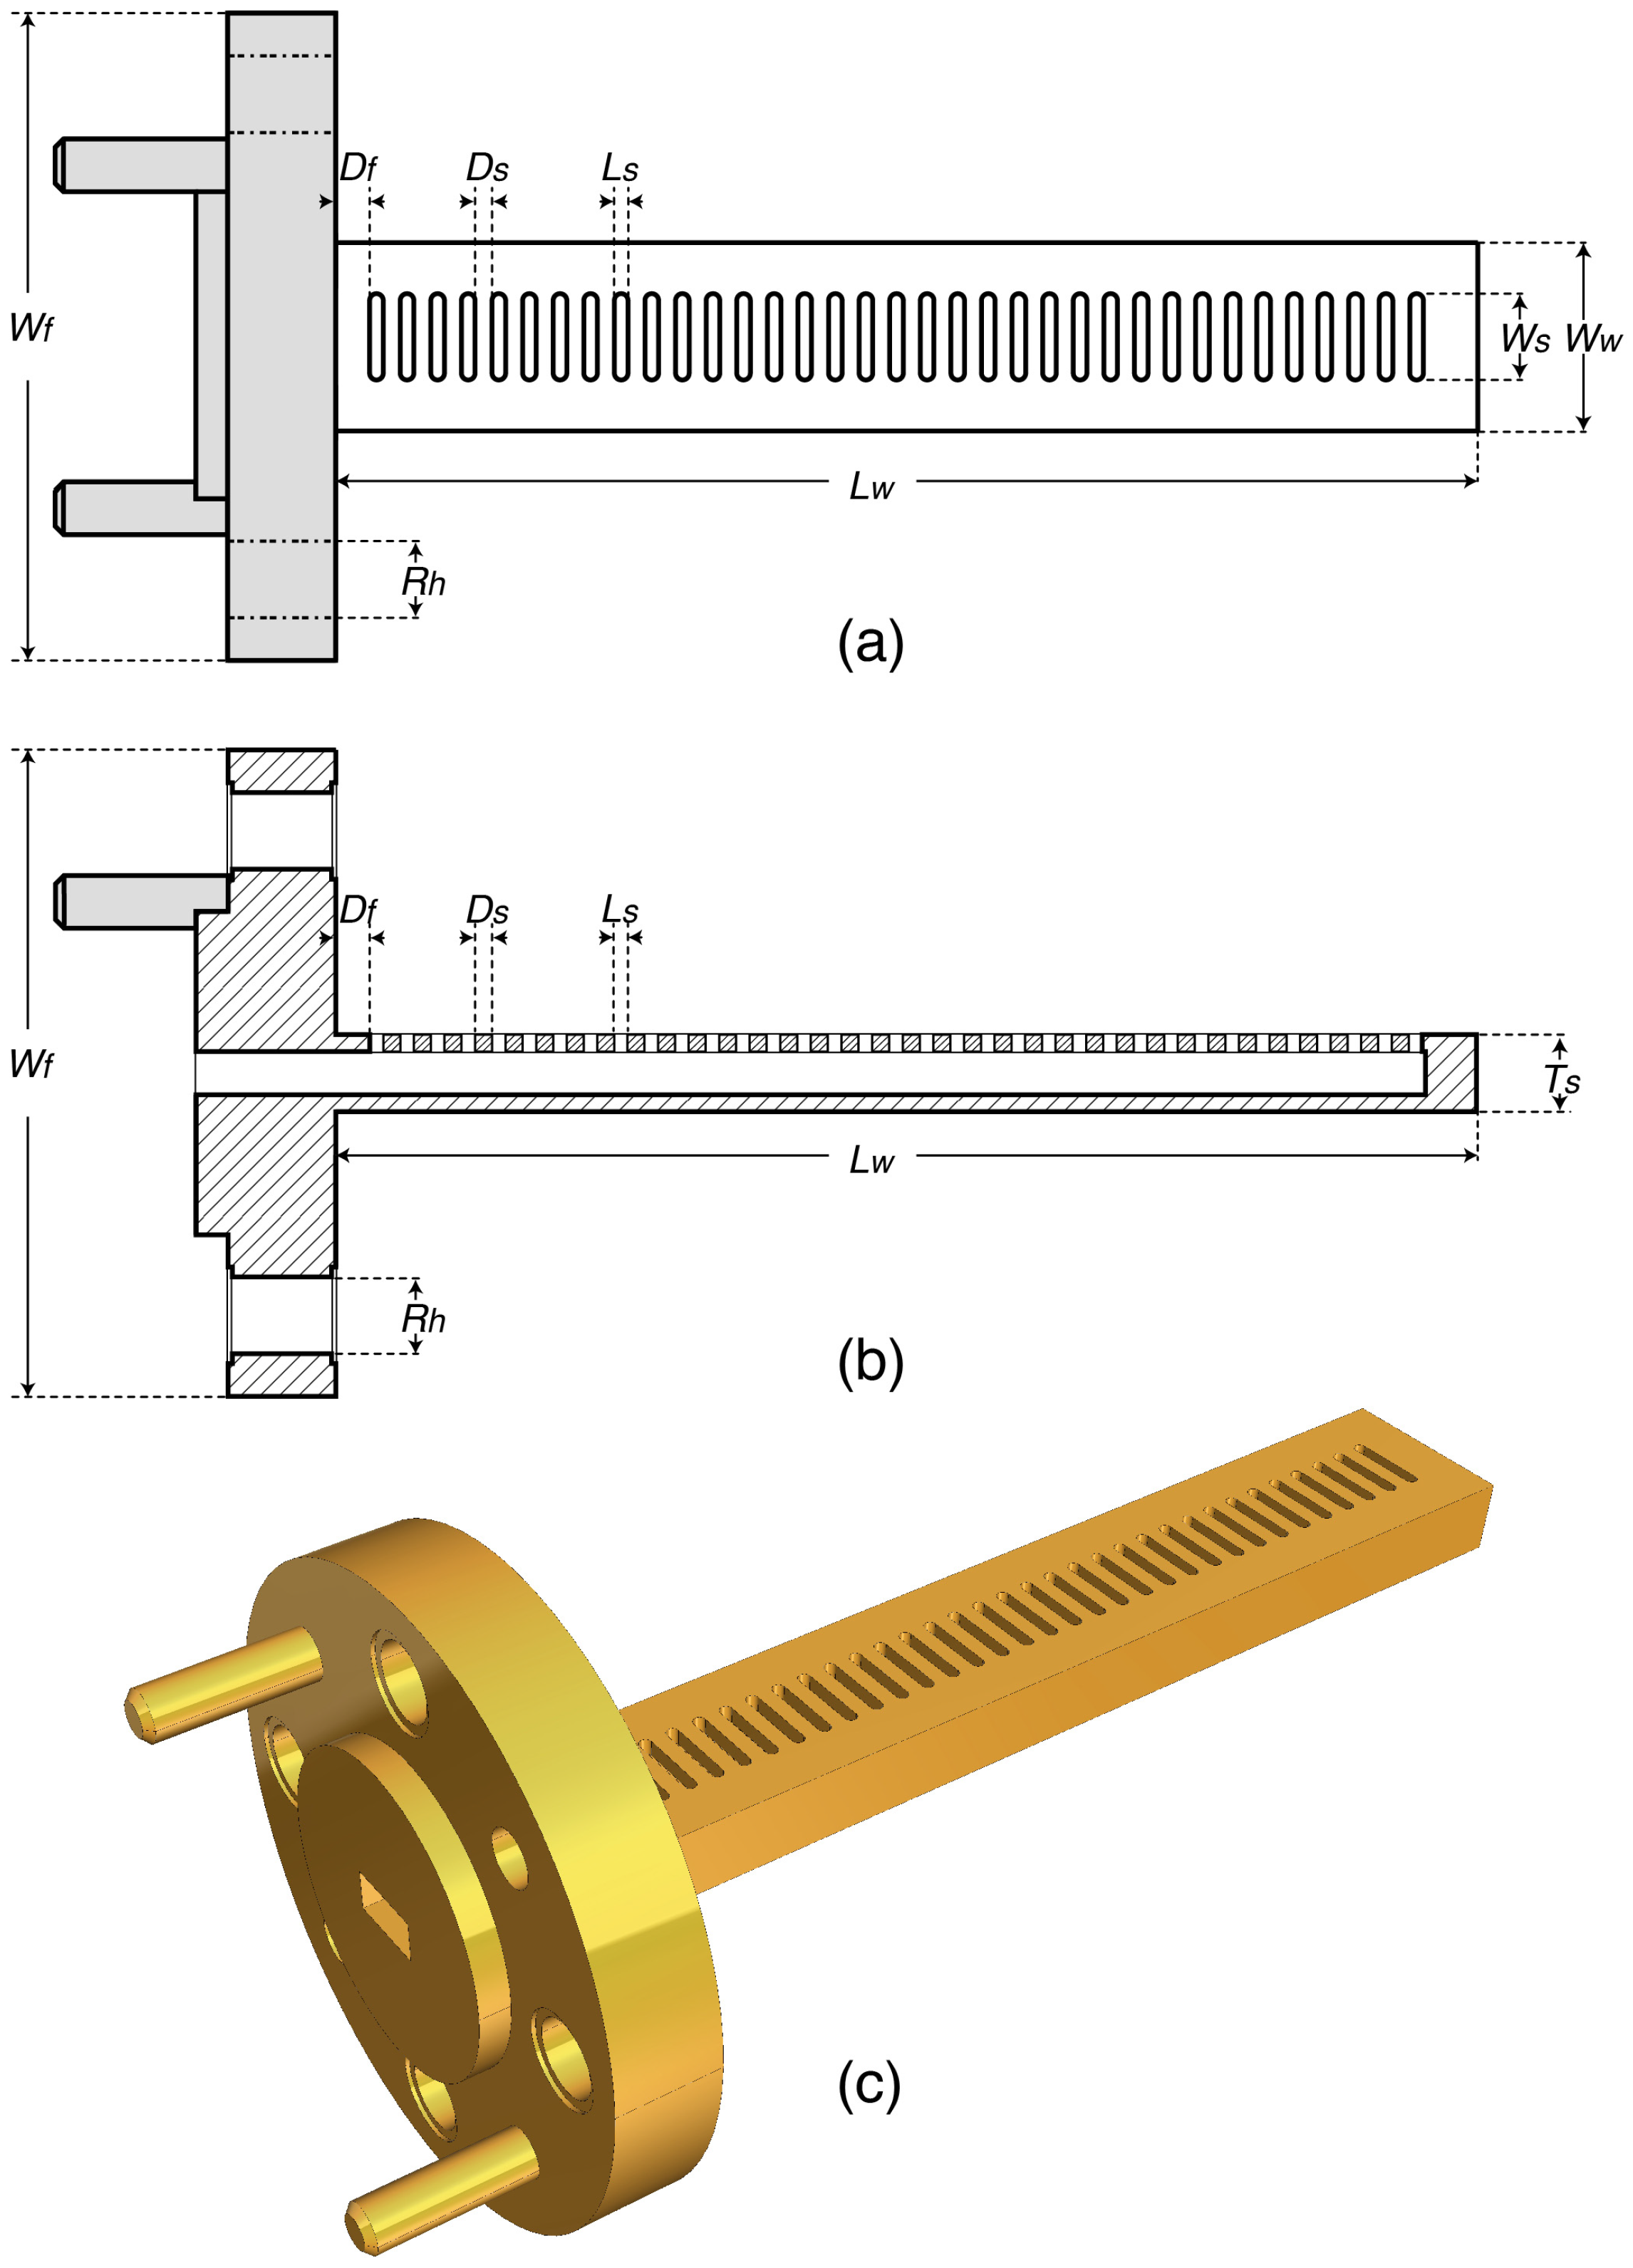
The structure of the TSWA is shown in Figure 3 with its parameters. The gray section in the figure represents a standard UG-387/UM circular flange, while the slotted section corresponds to the radiating element of the antenna. The antenna is placed on the x-y plane with its transverse slotted periodic elements being oriented along the y-axis. It consists of 34-element slots on the upper wall of the WR10 waveguide. The end of the TSWA is terminated with a short circuit. It has broadside radiation characteristics. Since the periodic slots are oriented along the y-axis, the TSWA steers the beam on ϕ = 90 ° plane as a function of frequency. The number of transverse slots has a significant impact on the antenna’s radiation characteristics, including beamwidth, gain, and side lobe levels. Increasing the number of slots enables higher directivity and finer control over the aperture distribution, which is essential for side lobe suppression. In this study, a simulation-based optimization was carried out within the 60–160 GHz frequency range to achieve acceptable side lobe levels and high gain across the band [27]. The optimal antenna parameters are summarized in Table 2.

3.2. Performance Analysis

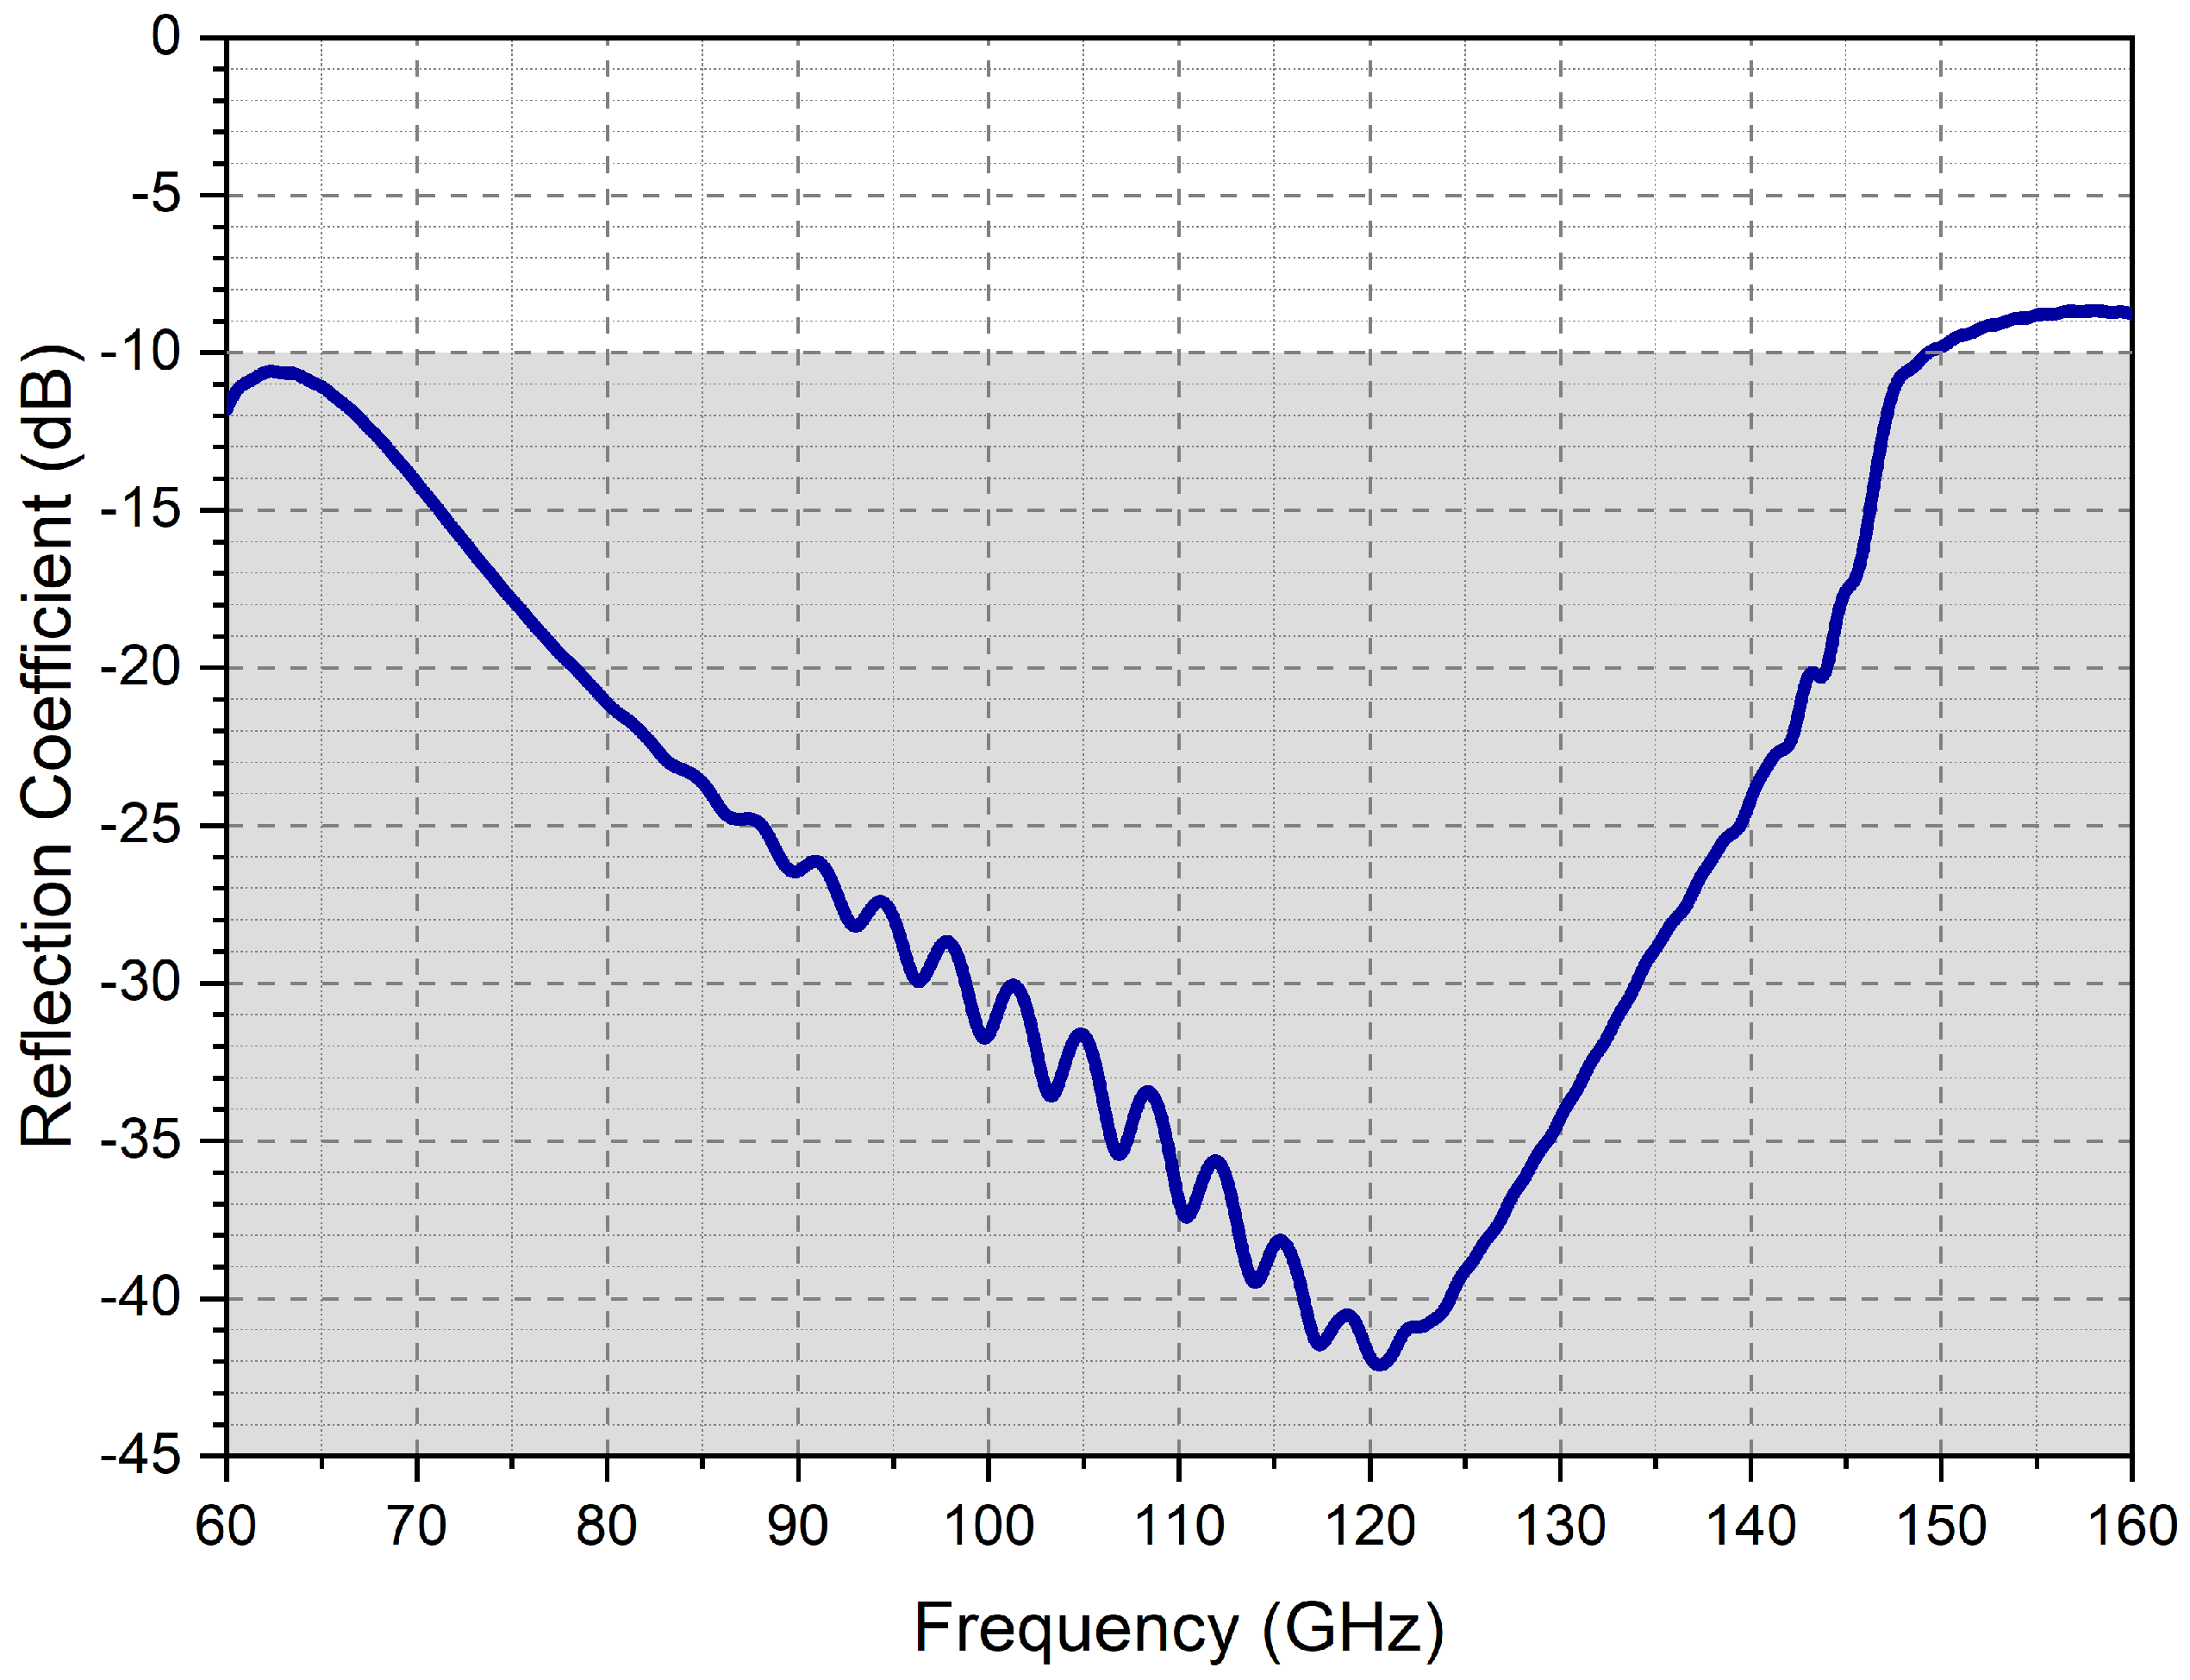
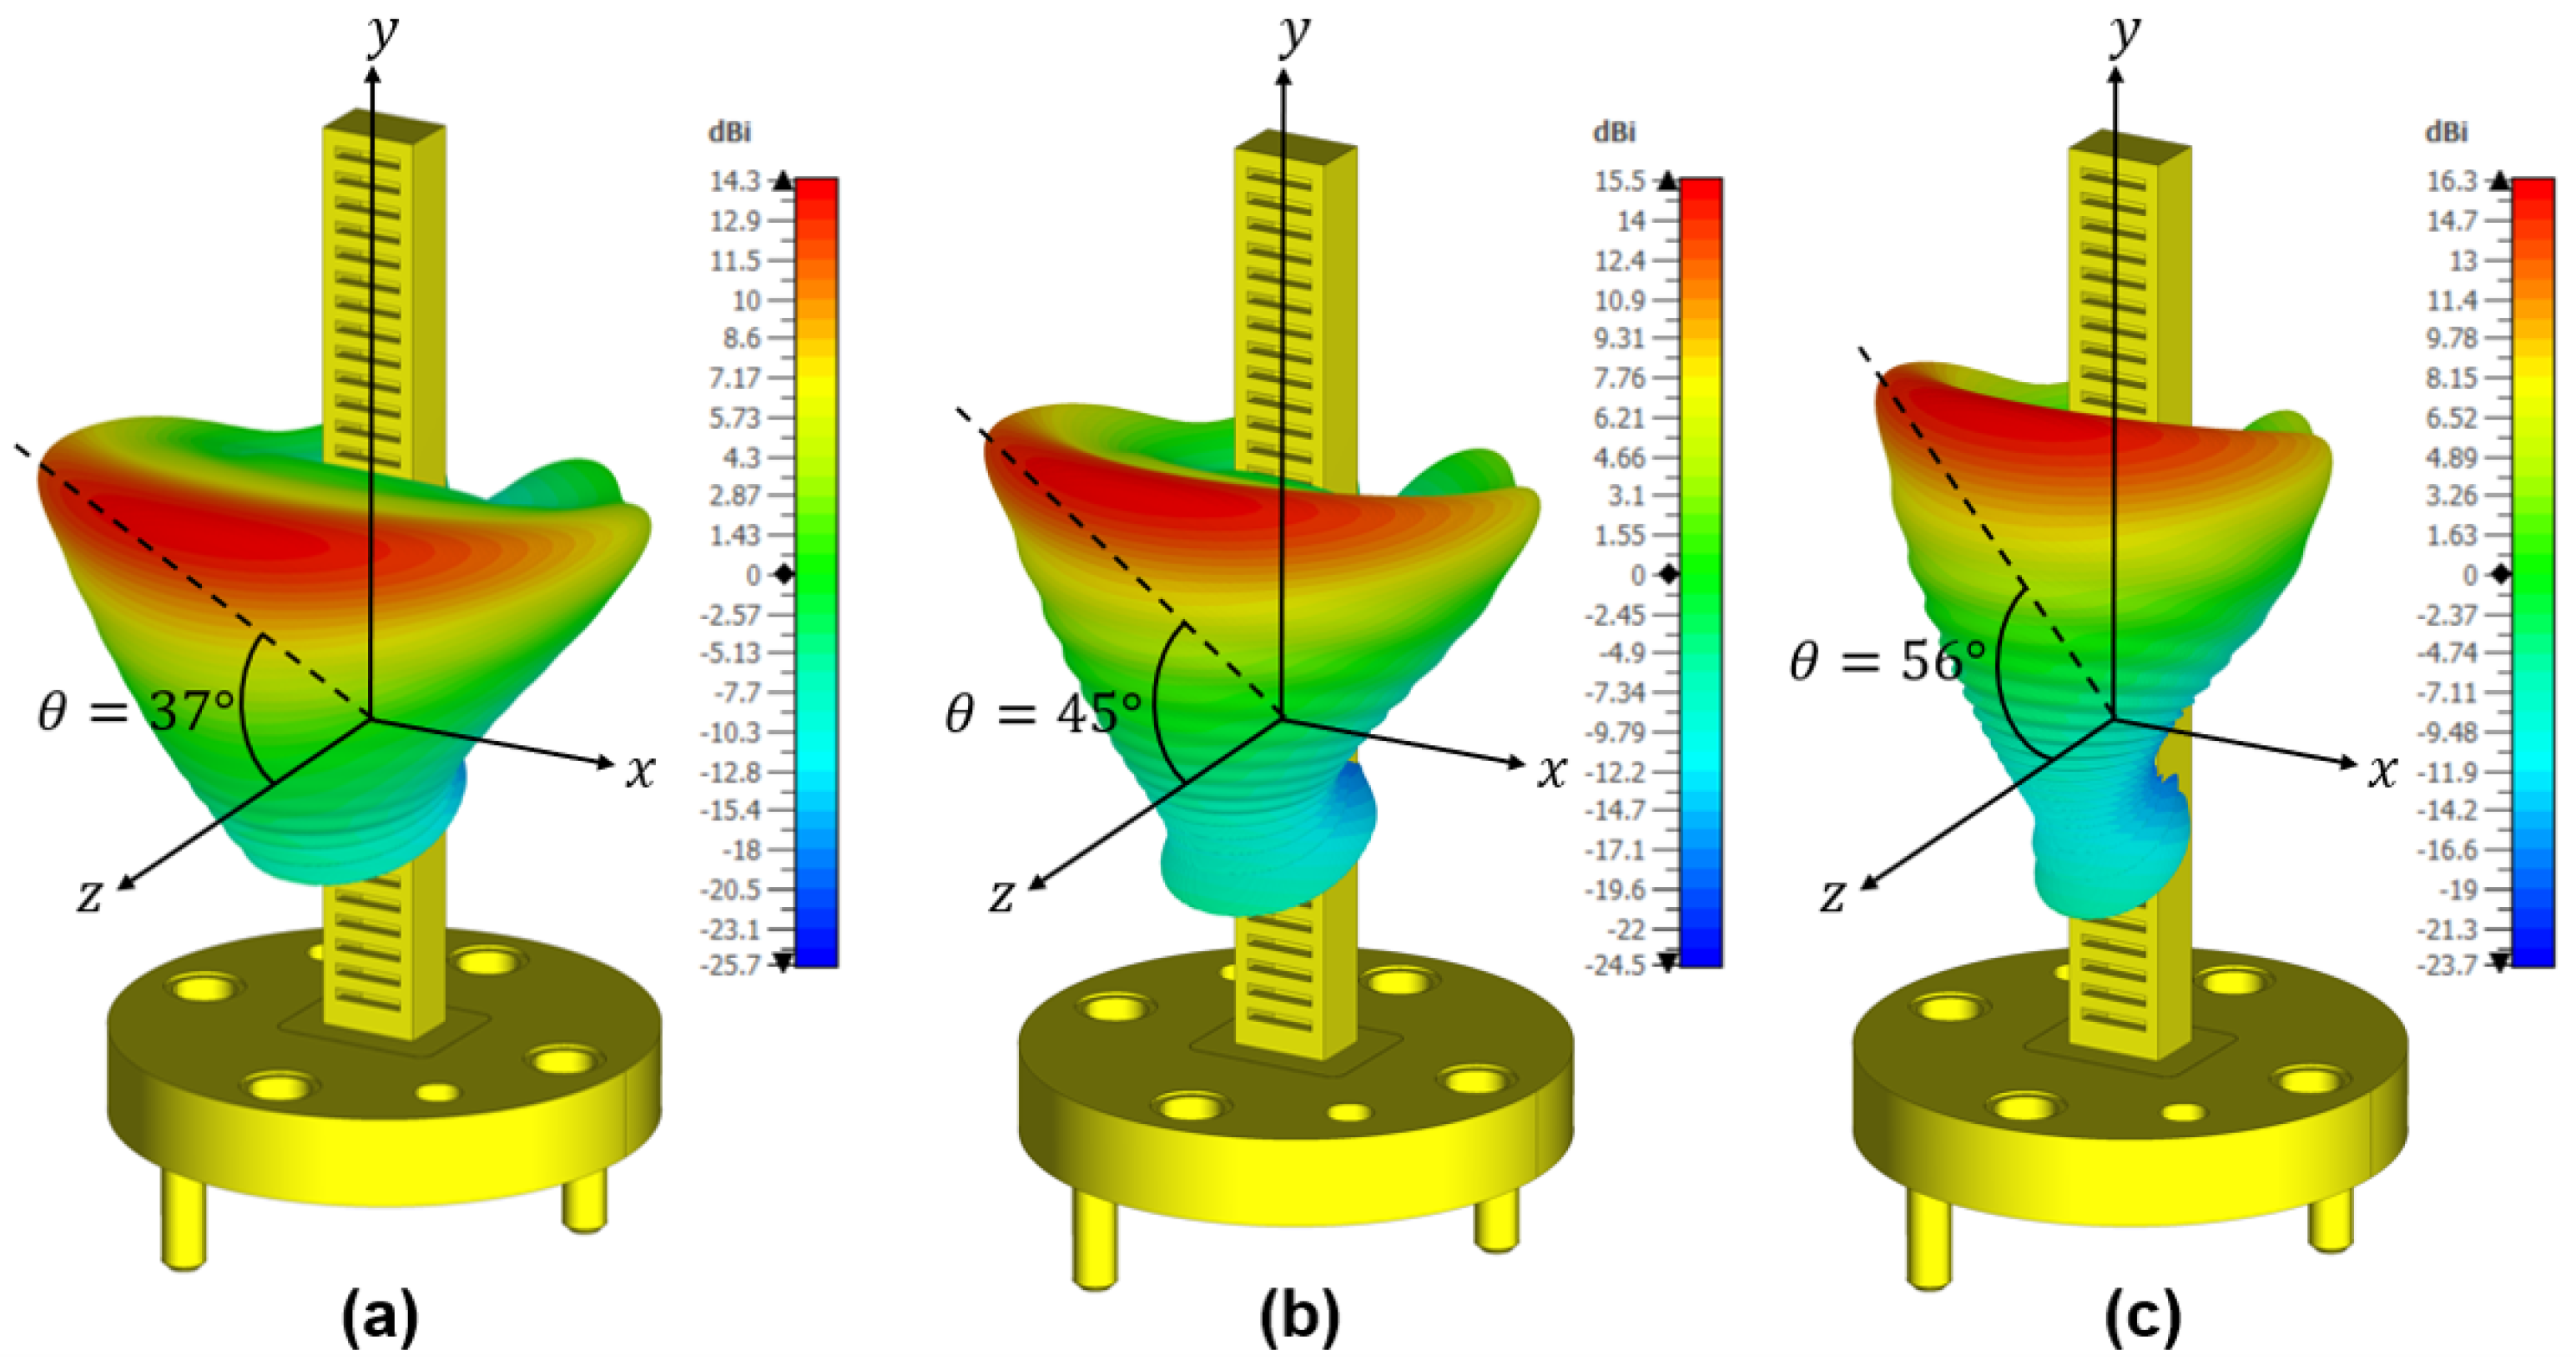
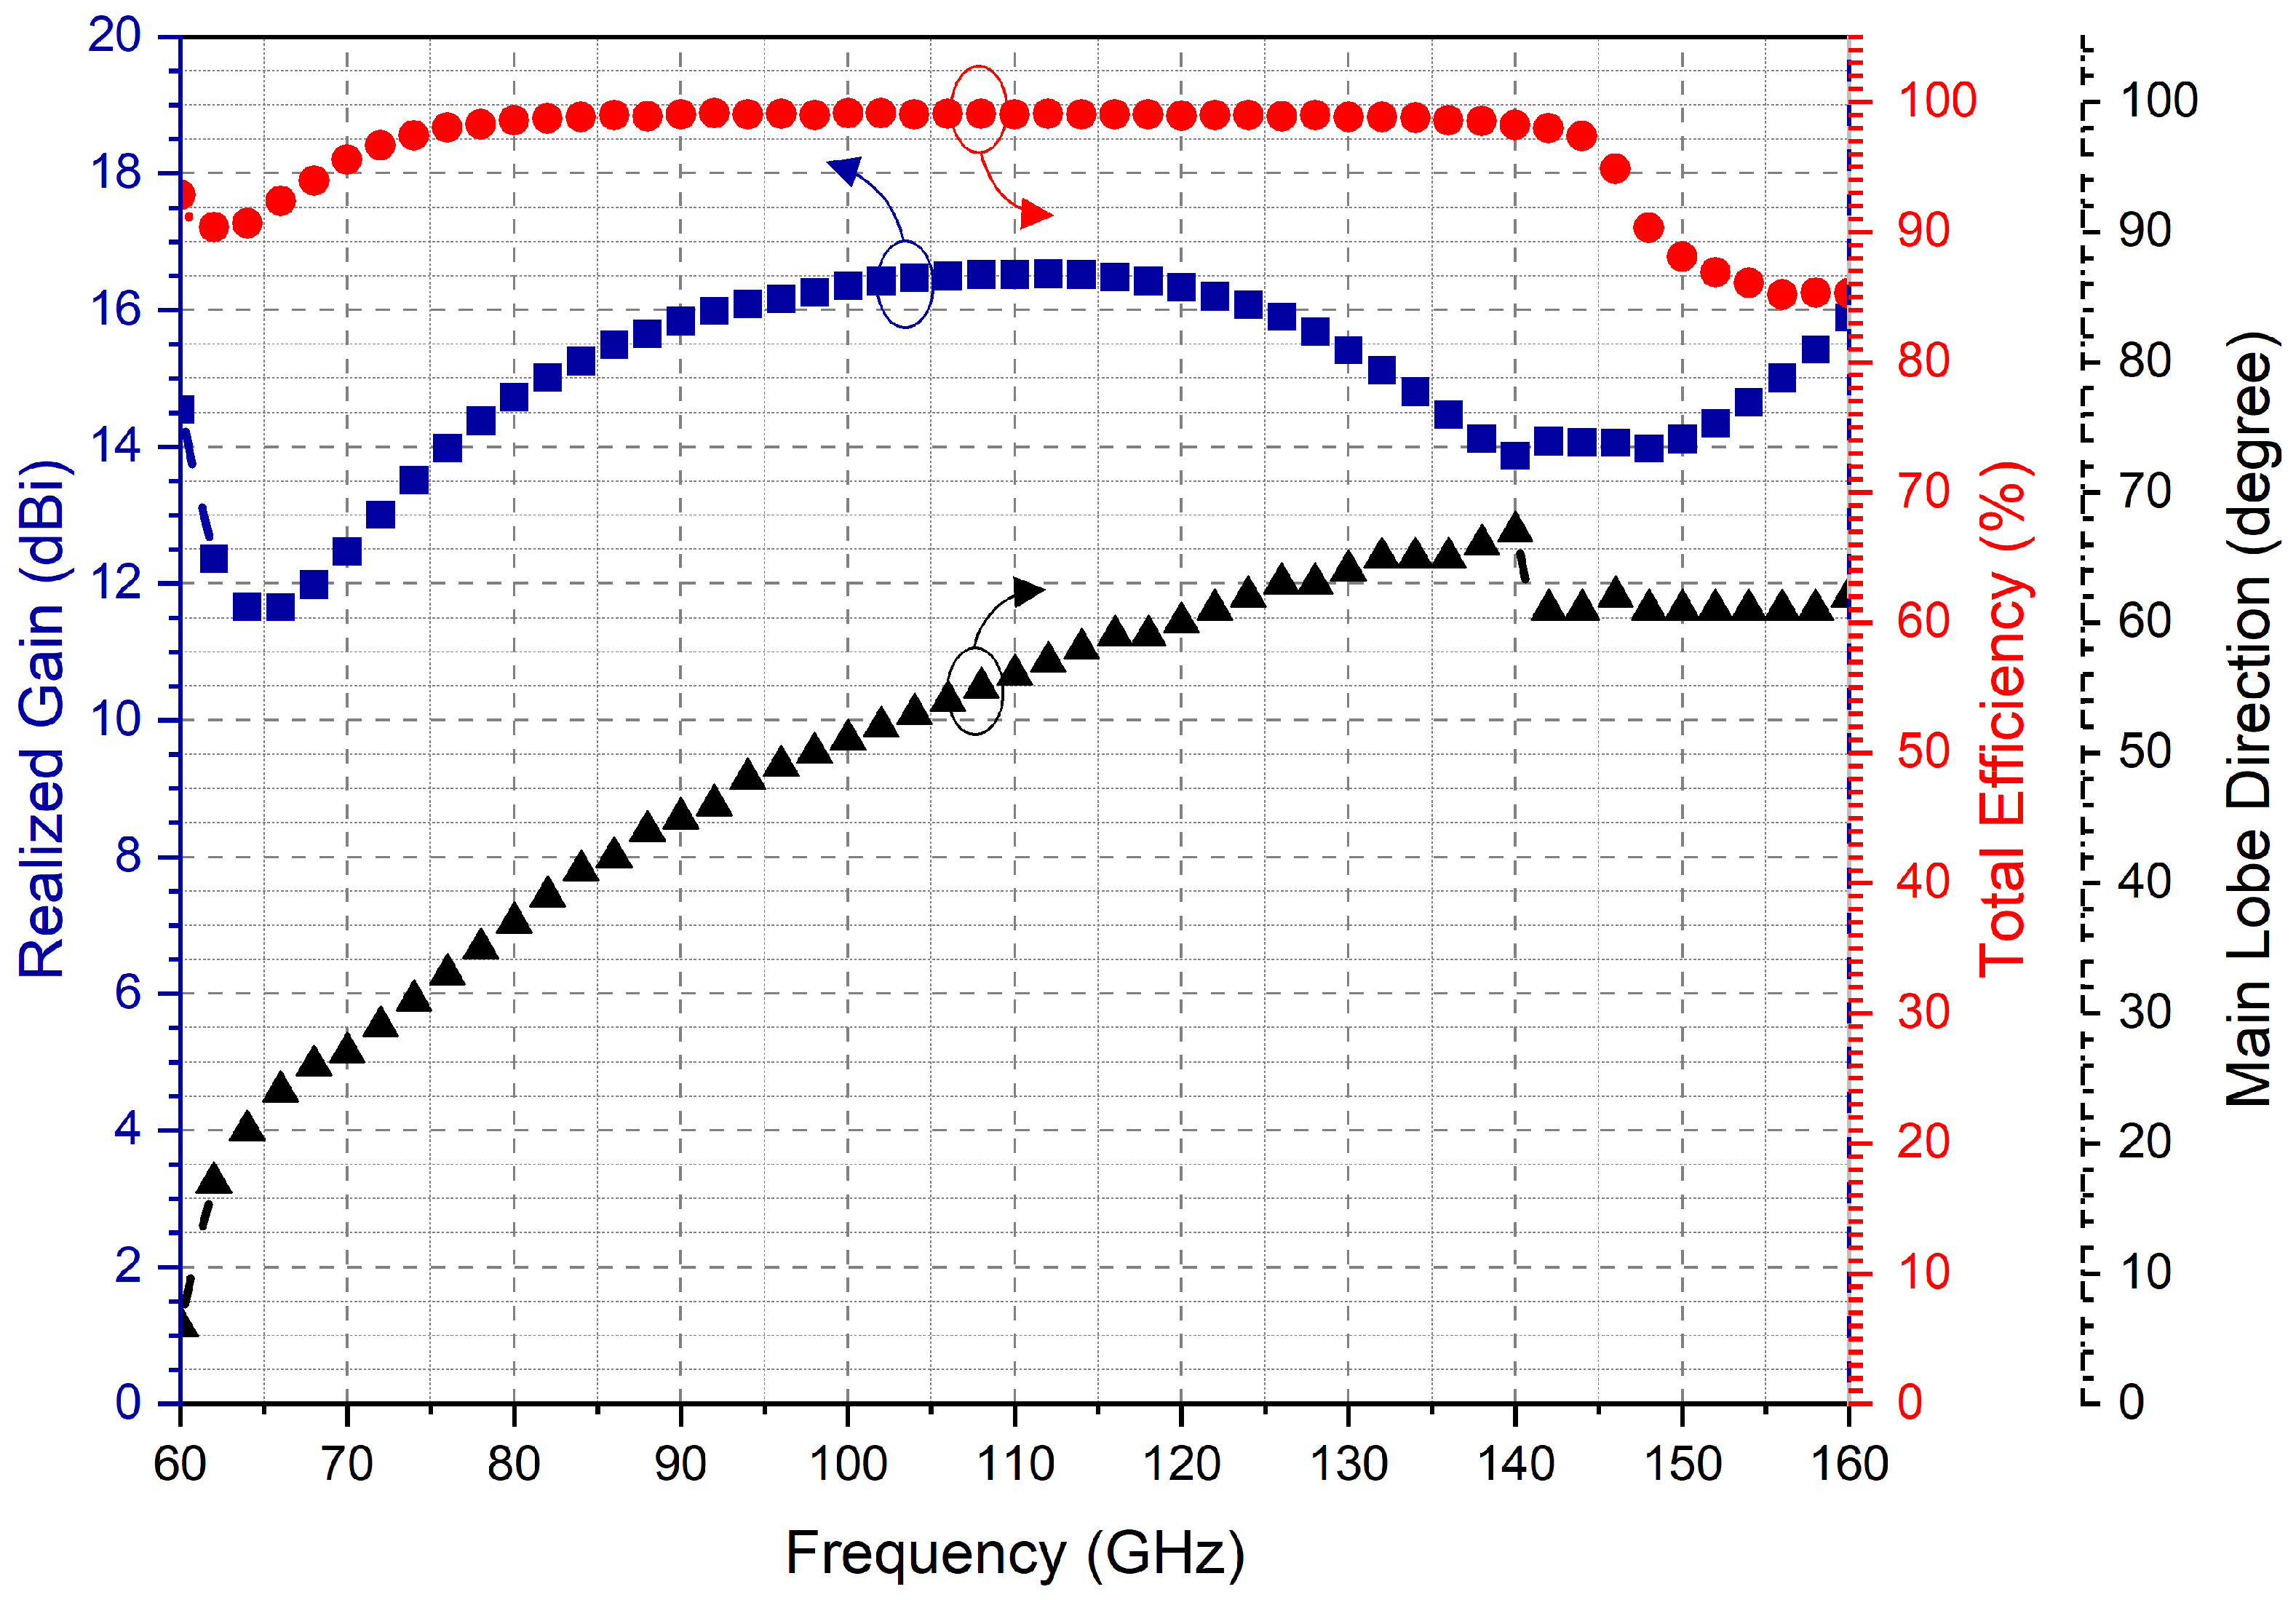
The 3D full-wave electromagnetic solver is used to solve the 34-element slot array antenna. S 11 parameter variation of the TSWA is given in Figure 4 as the function of frequency. Upon closer examination of the graph, it is observed that the reflection coefficient remains below −10 dB within the frequency range of 60–150 GHz. Furthermore, the TSWA bandwidth can be identified as 100 GHz, considering that a reflection coefficient between 8 and 9 dB is acceptable in the range of 150 and 160 GHz. The simulated 3D far-field radiation patterns of TSWA at 79 GHz, 89 GHz, and 109 GHz, shown in Figure 5, illustrate the frequency-dependent beam shaping and realized gain variations. Antenna performance parameters, including gain, total efficiency, main lobe direction, and side lobe level, are analyzed. Gain, total efficiency, and main lobe direction parameters are given in Figure 6 as the function of frequency. The black line, which demonstrates the direction of the main beam, shows a linear characteristic within the frequency range of 60–140 GHz in the ϕ = 90 ° plane. The total efficiency upholds values close to 100% within the 60–140 GHz frequency band while ranging between 85% and 100% in the 140–160 GHz band. The realized gain of the antenna is above 11.5 dBi in the whole band, whereas it reaches 17 dBi at the center frequency of the band.
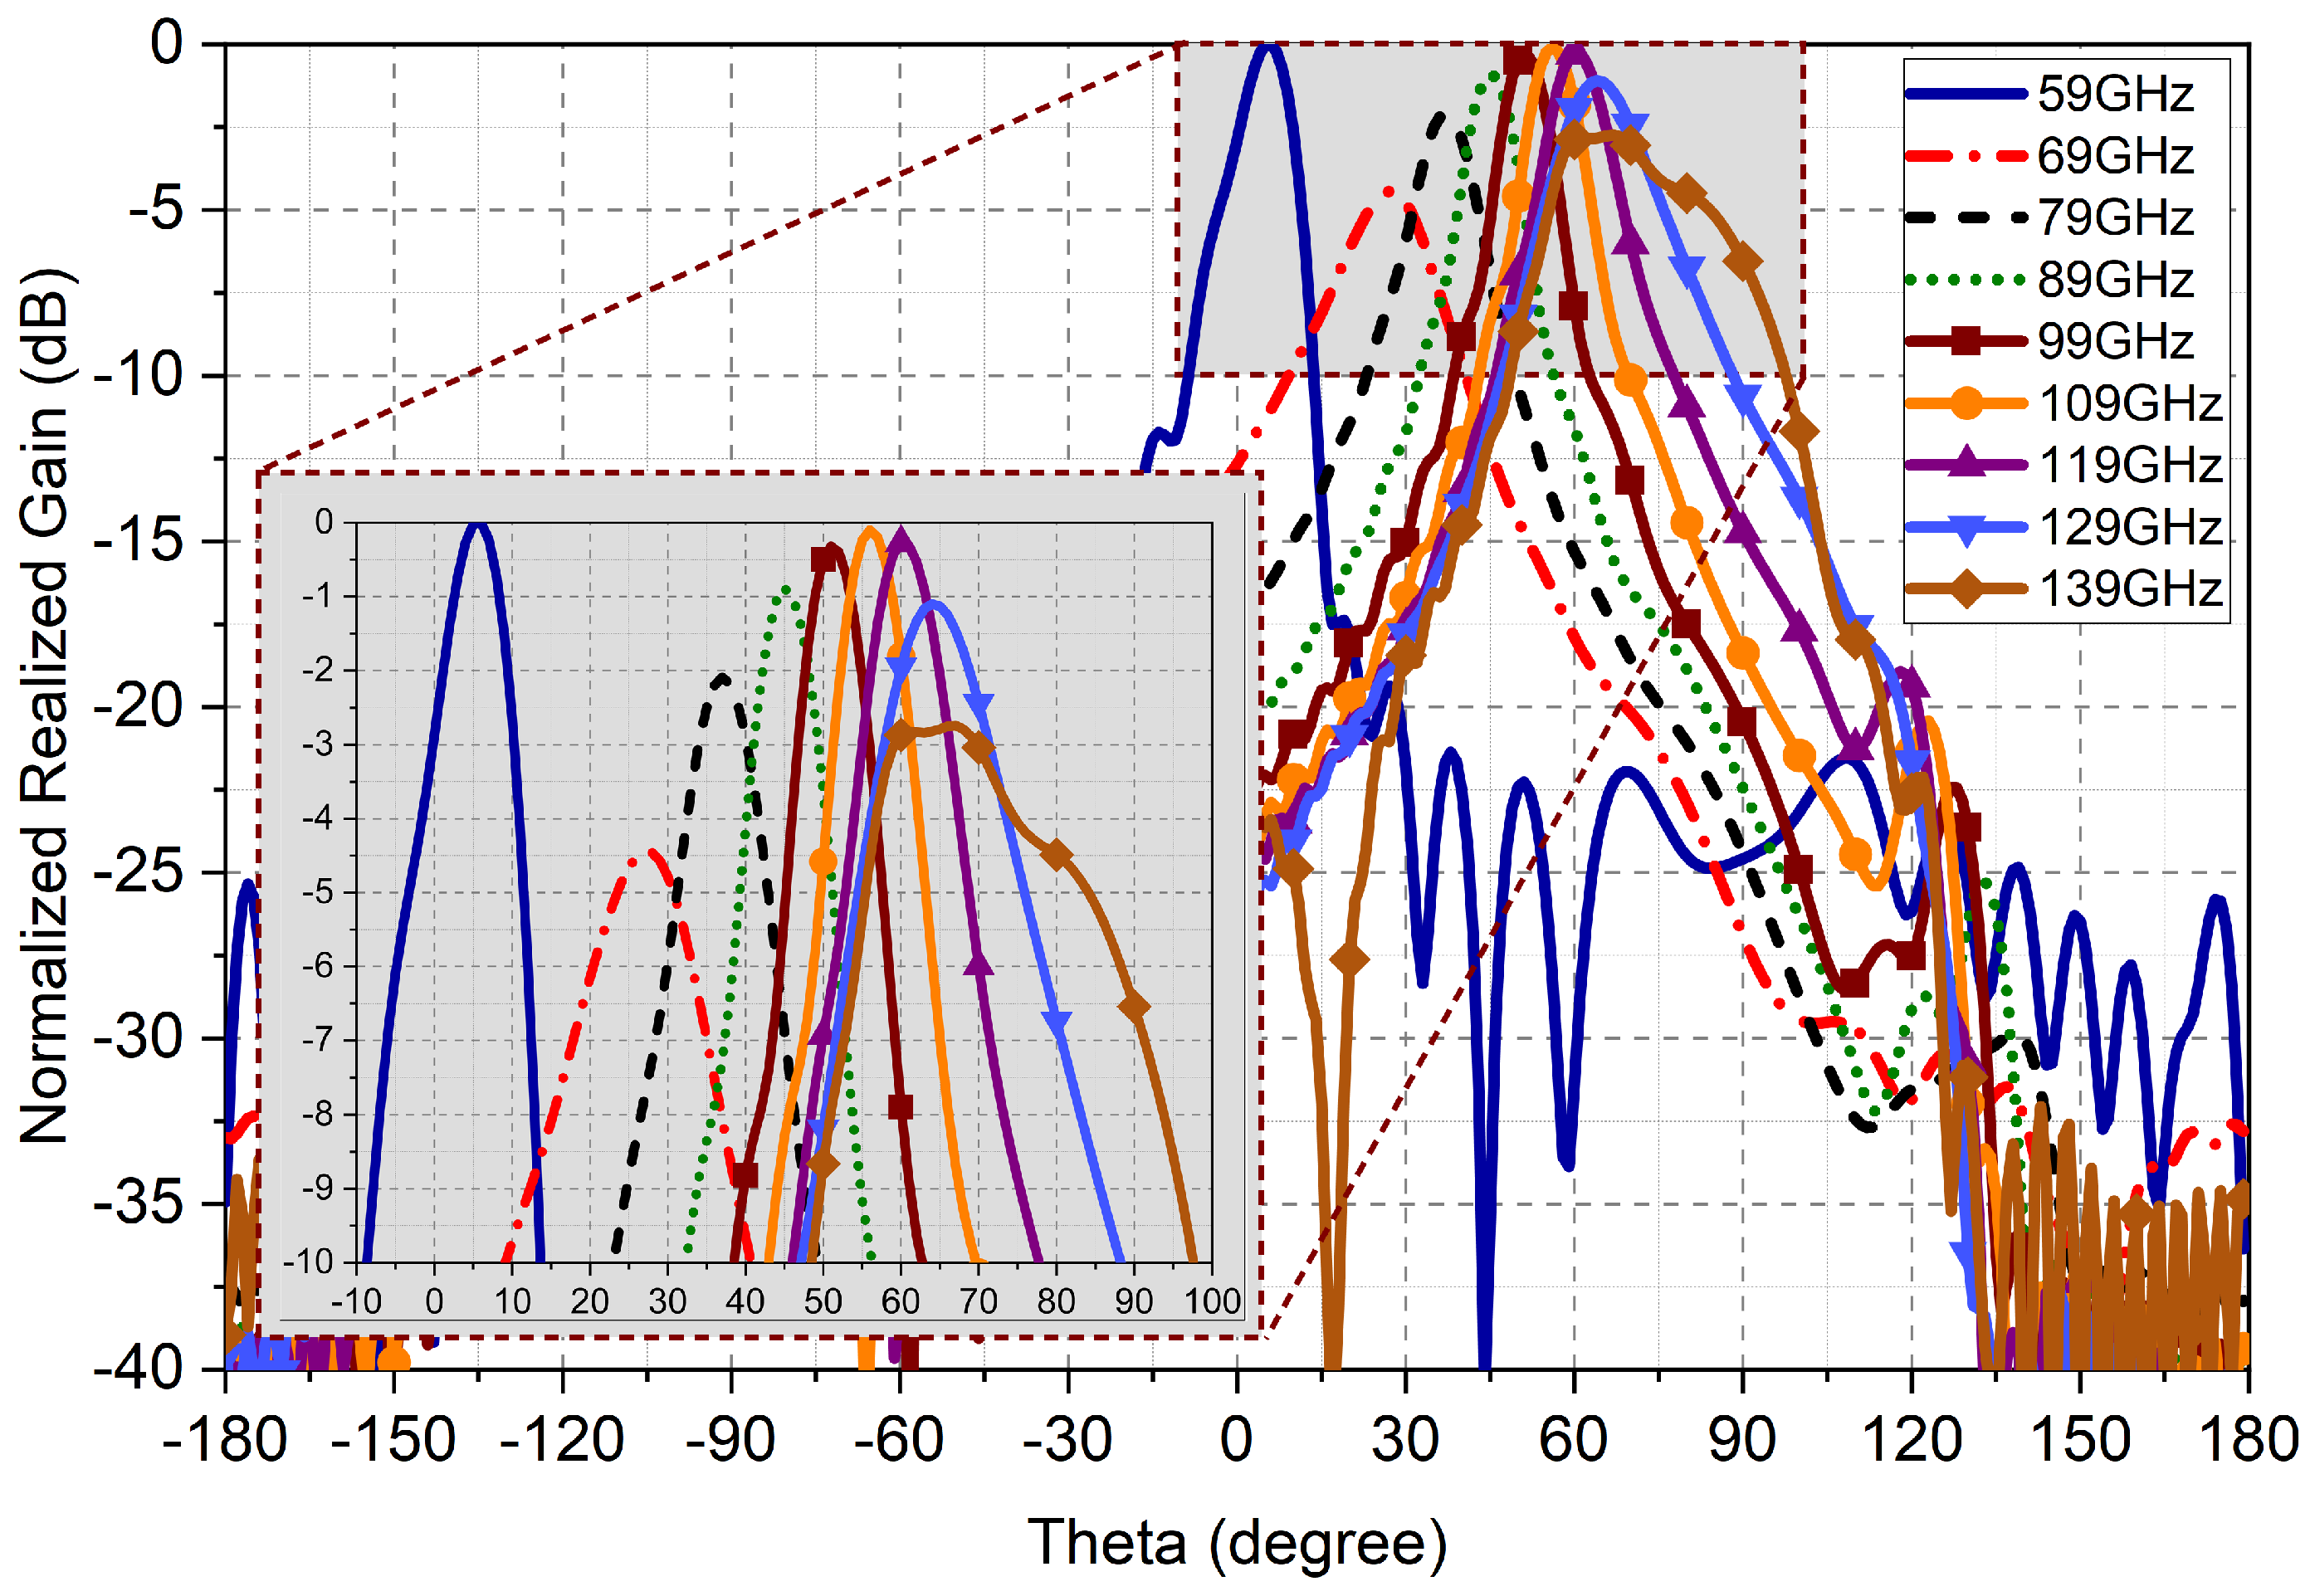
The normalized co-polarized gain patterns of the TSWA at different frequencies within the band are given in Figure 7. Since the TSWA steers the beam as a function of frequency on the ϕ = 90 ° plane, the patterns observed in the y-z plane are given. All patterns are normalized with respect to the maximum gain value of the antenna. As observed from the figure, the main beam direction of the pattern is towards approximately θ = 5 ° at 59 GHz. As the frequency increases, the main beam of the antenna steers towards higher angles of θ . Specifically, the beam is directed towards θ = 68 ° at 139 GHz. An undesirable 4.2 dB gain loss is observed at the 69 GHz frequency. However, except for this frequency, the main beam shows a loss of no more than 3 dB up to 140 GHz. After conducting an analysis of all the quality characteristics of the antenna, it was determined that the antenna operates stably within the frequency range of 60−140 GHz.
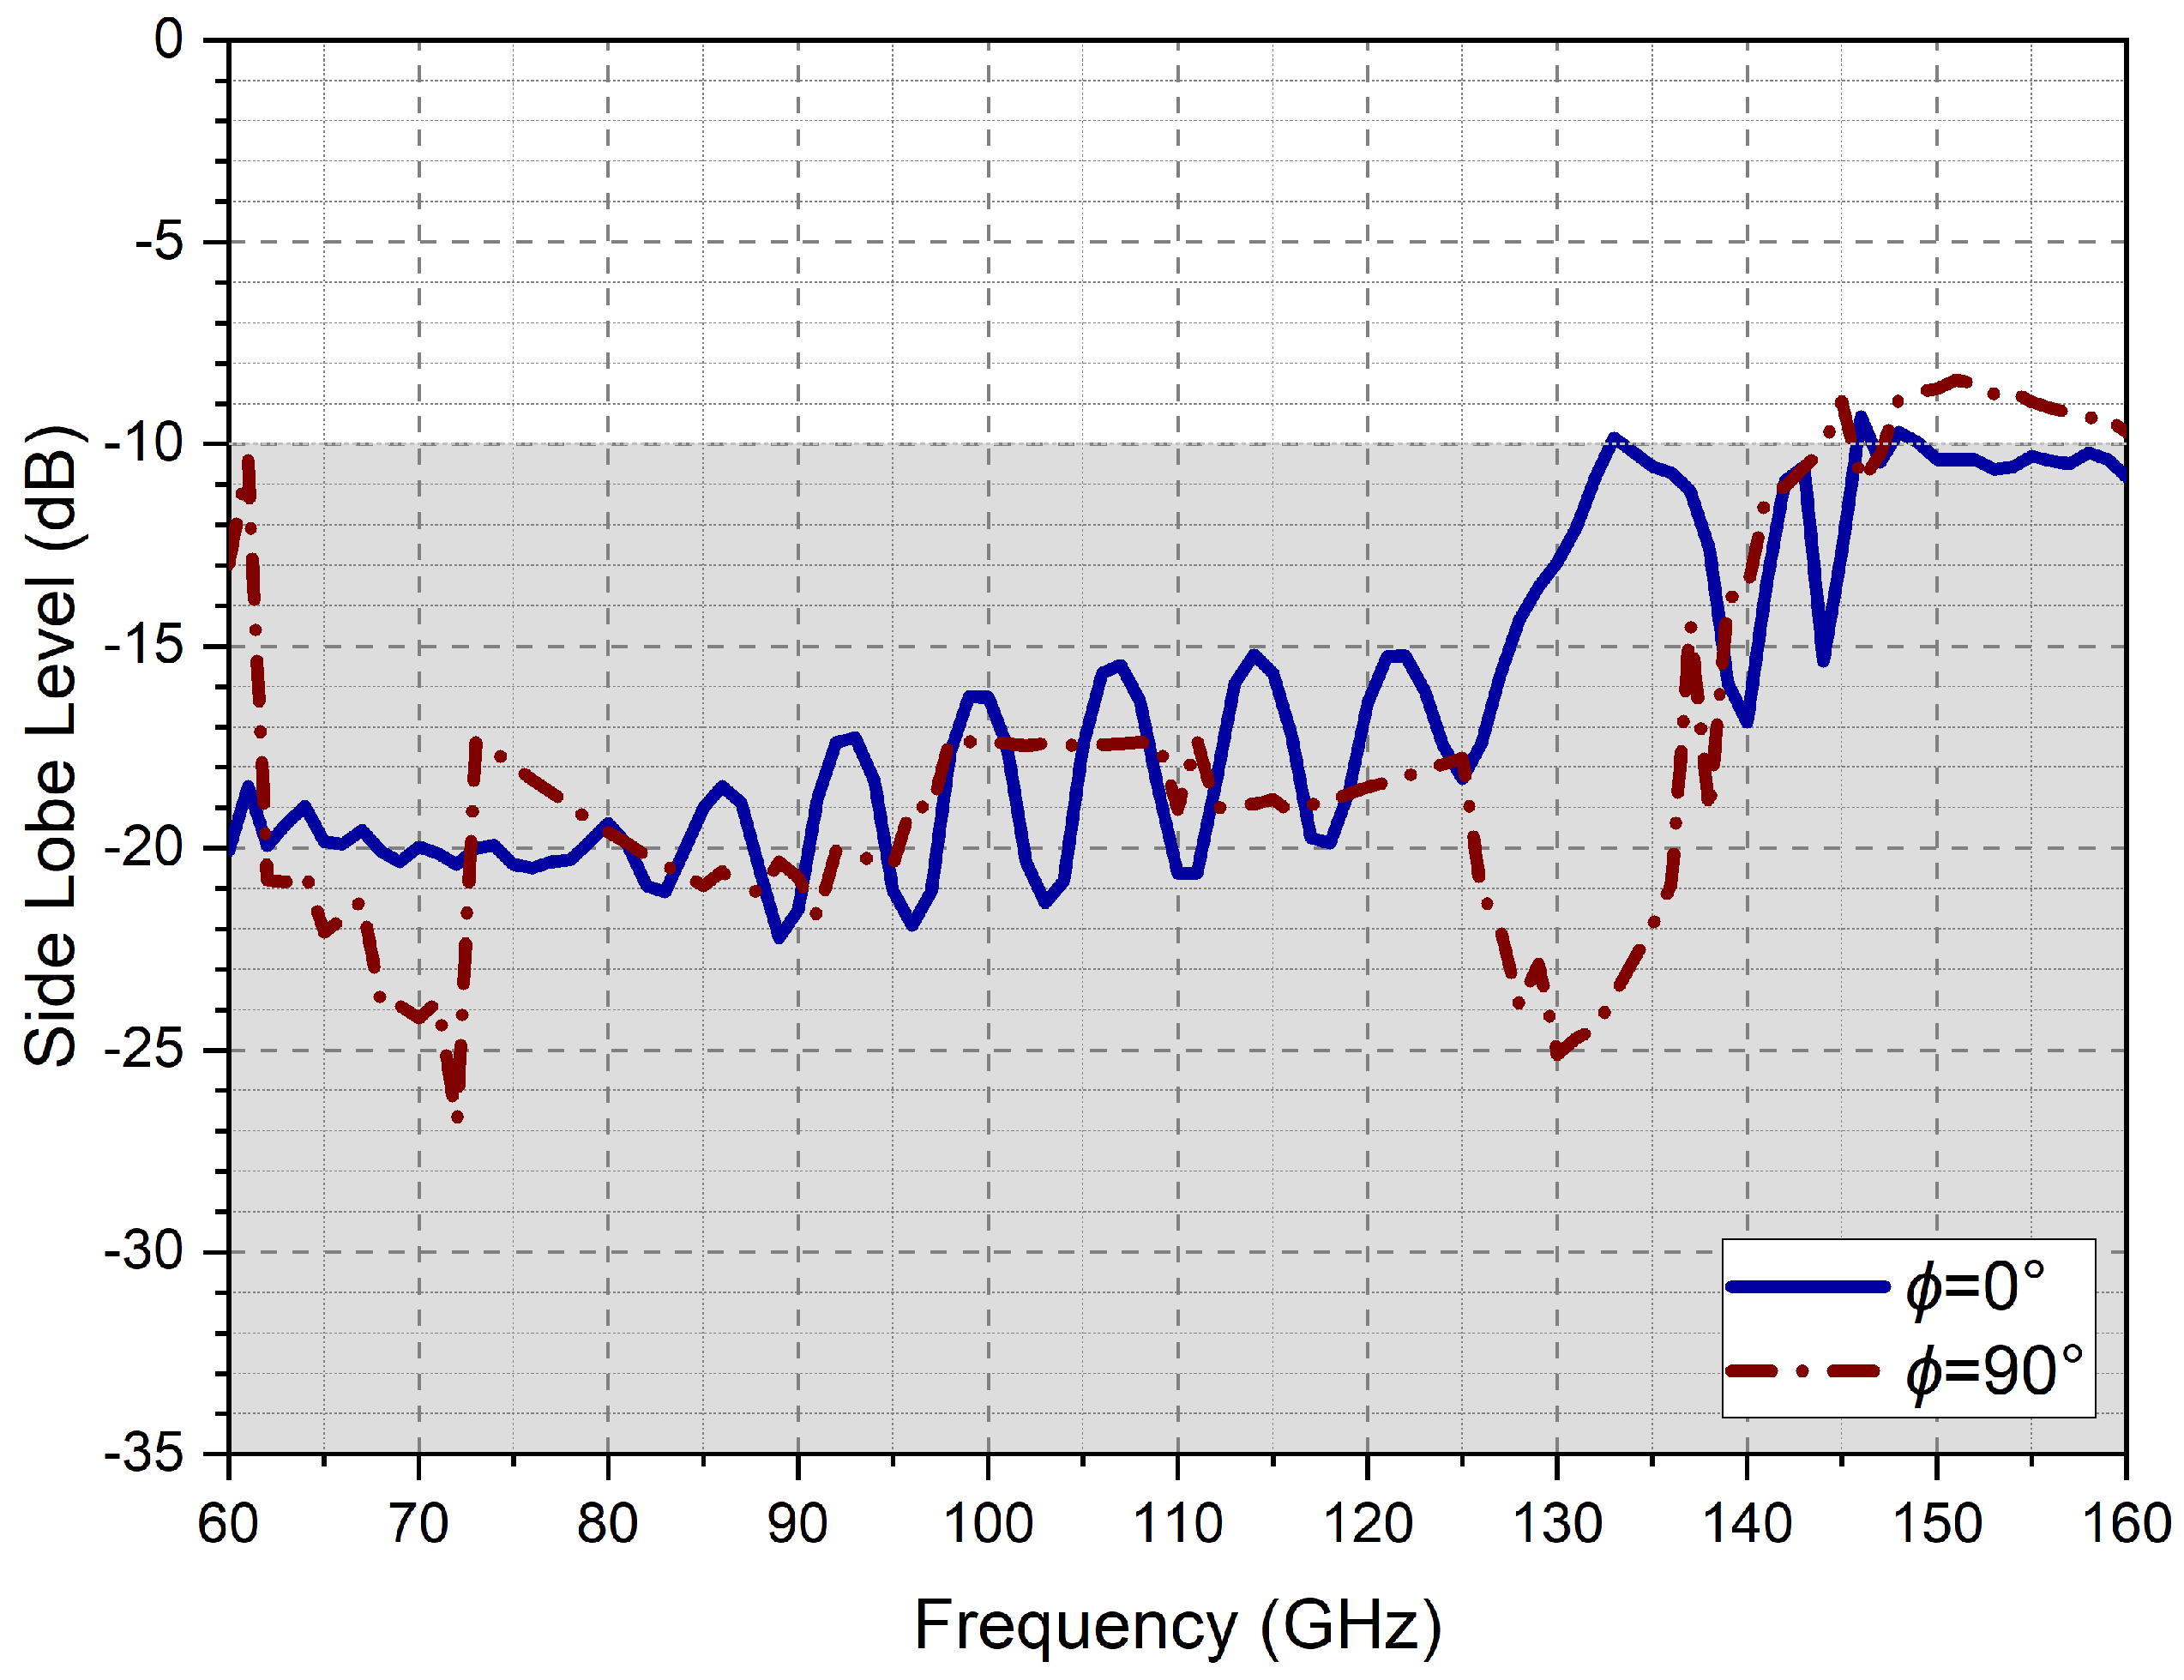
The side lobe levels of the TSWA radiation pattern for the ϕ = 0 ° and ϕ = 90 ° planes are presented in Figure 8. Upon examining the figure, it is observed that there is a similarity between the side lobe levels of the TSWA radiation pattern in the two principal planes. In both planes, the side lobe level is lower than −10 dB up to 145 GHz. When the frequency range between 145 and 160 GHz was observed, it was discovered that the side lobe level in the ϕ = 90 ° plane increased up to −8.5 dB.

4. Manufacturing and Experimental Verification

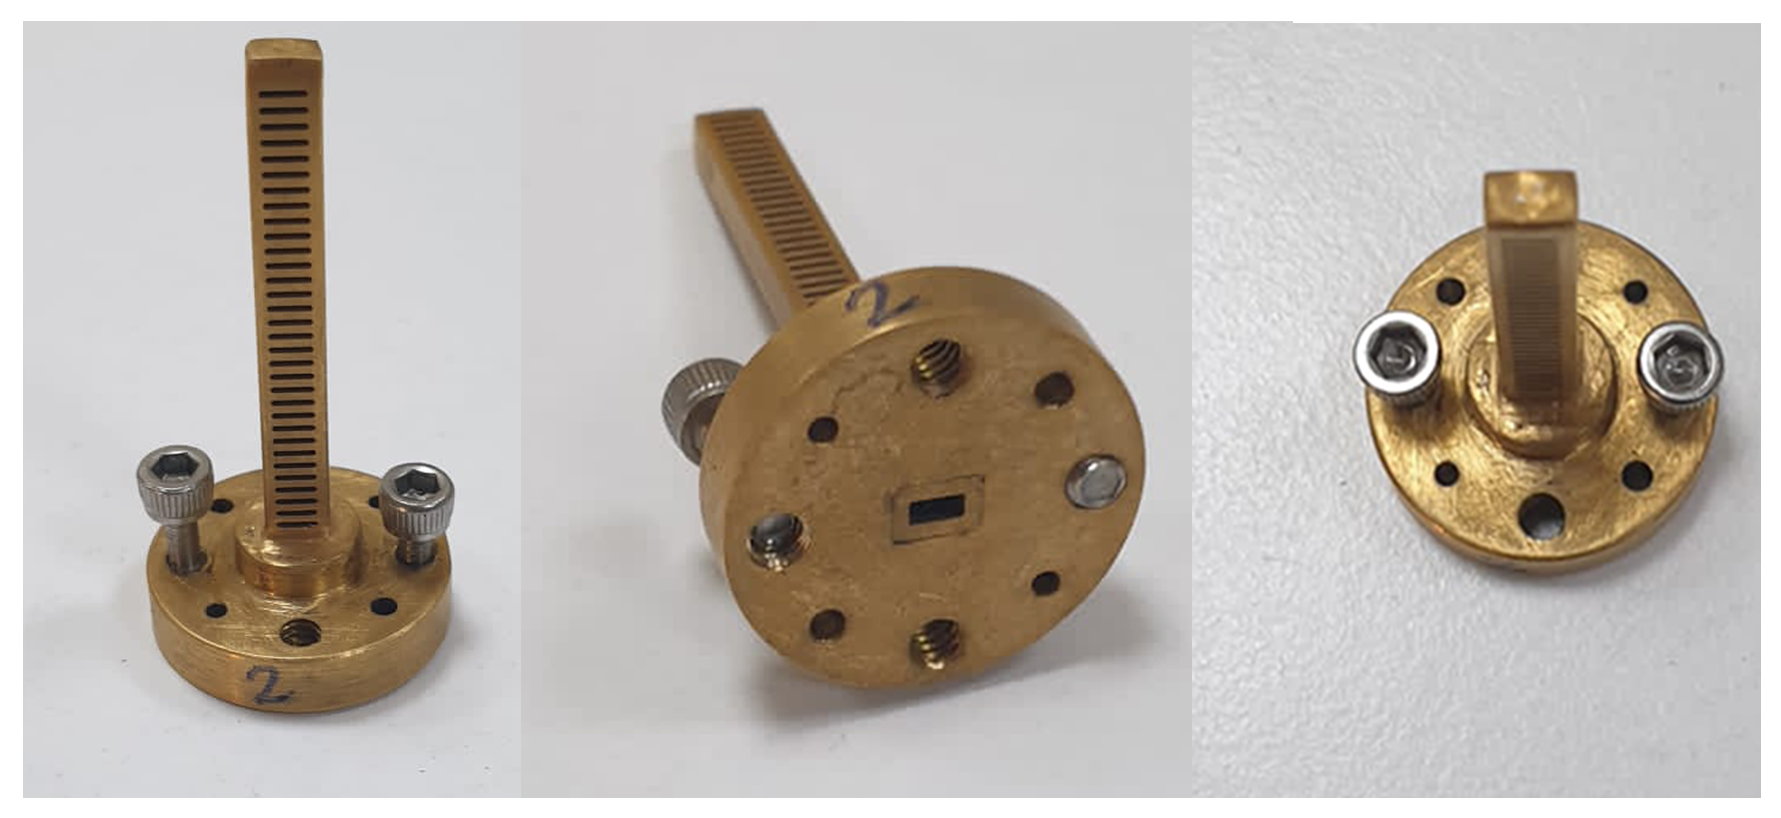
The TSWA includes a circular UG-387/UM flange and radiating parts. The flange side is fabricated with brass, whilst the radiating section is made of copper. TSWA, which consists of 34 slots, is manufactured using CNC technology. The production tolerance was established at ±3.5 μ m. To enhance the corrosion resistance of the antenna and thereby extend its operational lifespan, a gold plating process is employed. Following the completion of production, the structure is electroplated with a specialized gold solution, achieving a precise and uniform coating thickness of 3 μ m. Gold-plated copper is chosen in the TSWA design due to its superior surface stability and oxidation resistance in harsh space environments. Among the evaluated surface treatments, Alodine offers advantages in terms of being lightweight and exhibiting corrosion resistance but suffers from low surface conductivity. Silver plating provides excellent conductivity; however, its mechanical reliability under thermal cycling is limited, especially for long-duration space missions. In terms of power handling, silver also presents lower safety margins compared to Alodine. Gold-plated copper TSWA offers a balanced solution, ensuring both environmental durability and electromagnetic integrity in demanding space conditions [28]. The surface roughness of the manufactured antenna is measured using a surface profilometer. The antenna surface demonstrated a roughness of around 3.2 μ m (Ra). Images of the manufactured antenna from various perspectives are presented in Figure 9.
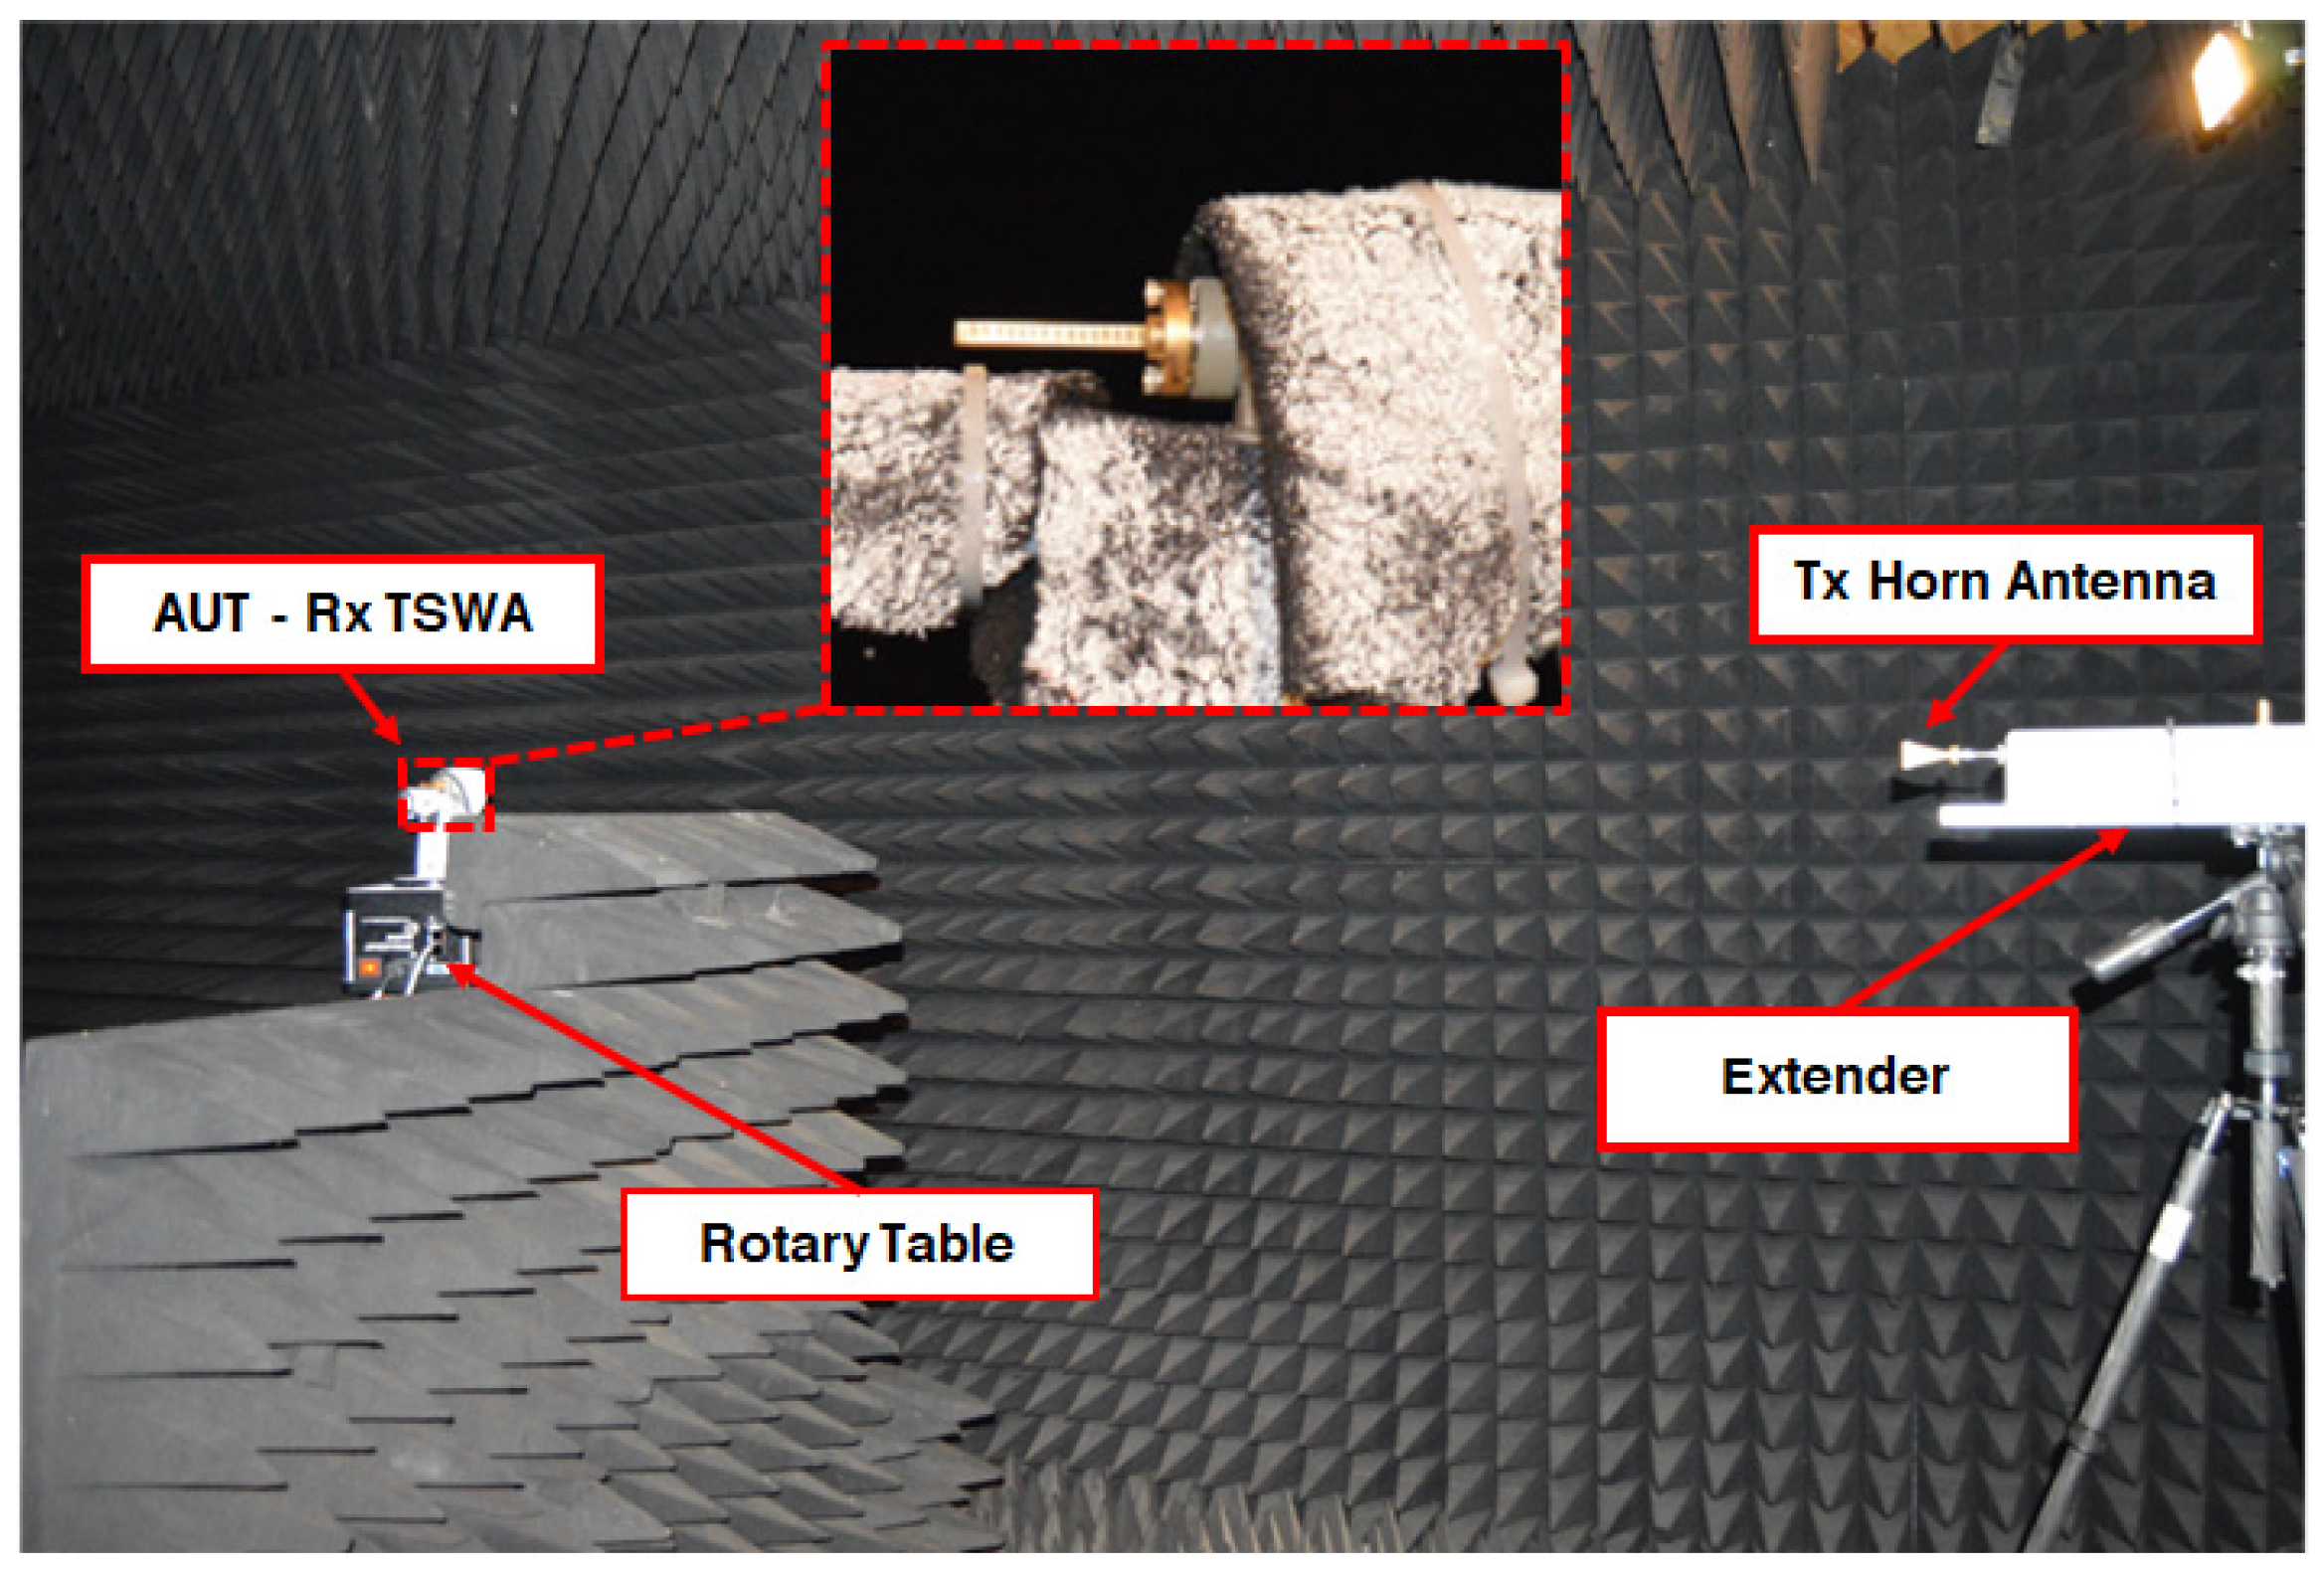
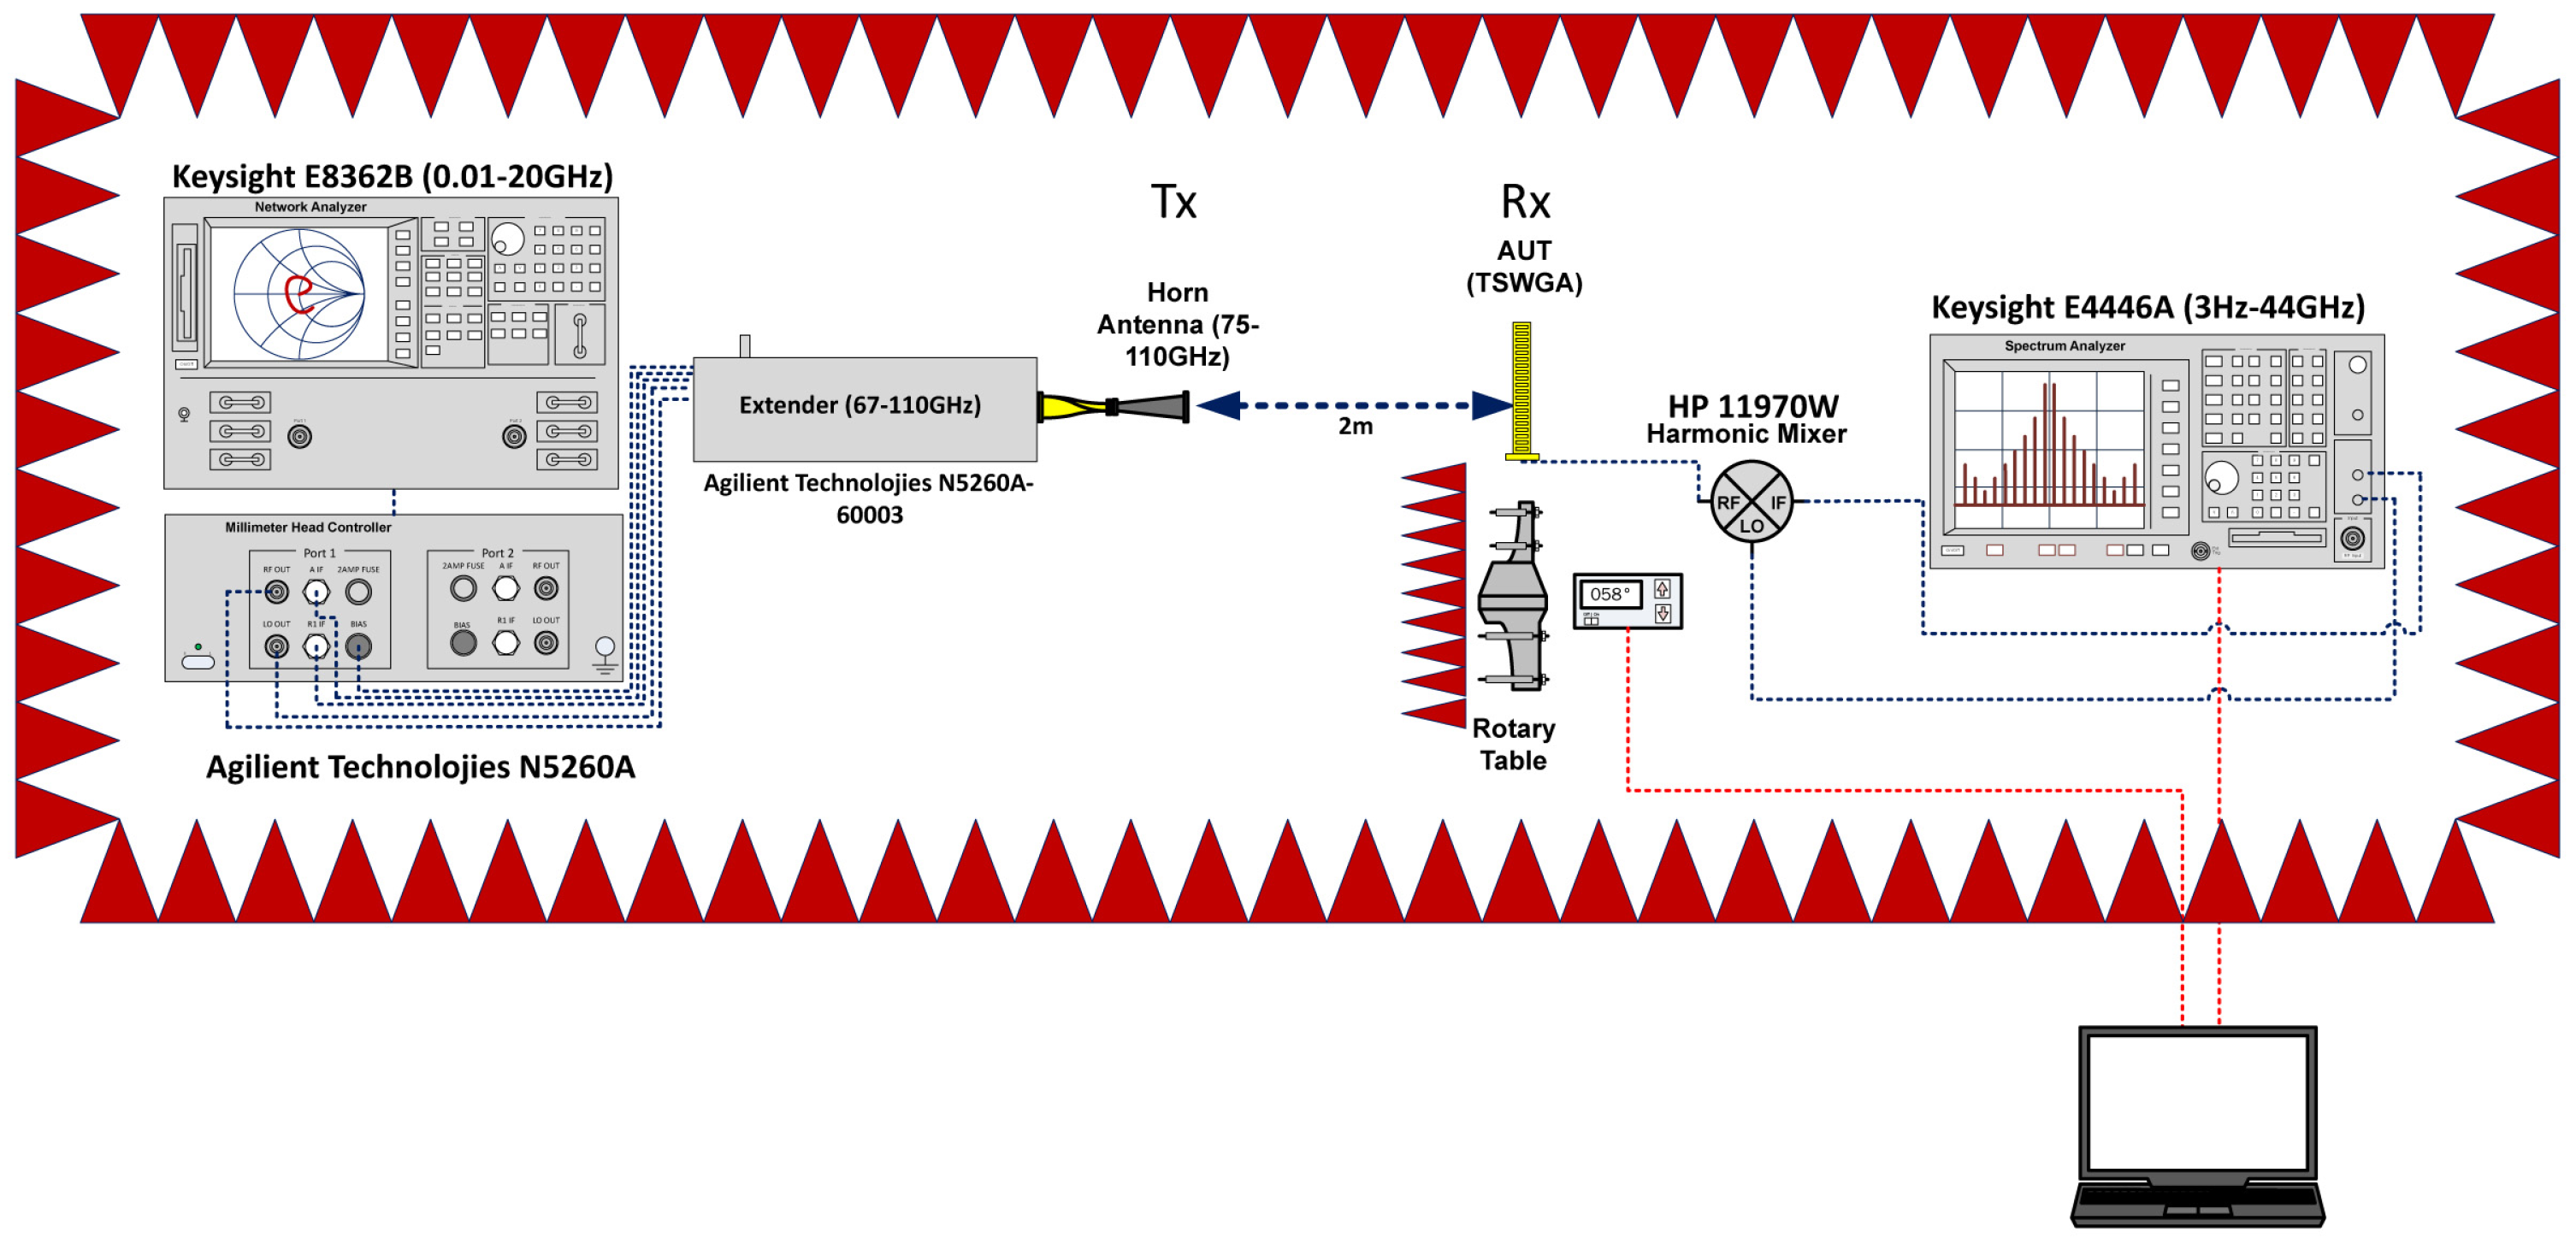
The reflection coefficient and pattern measurements of the proposed antenna were performed in an anechoic chamber with dimensions of 7 m × 3 m × 4 m (length × width × height). Figure 10 provides an expanded view of the antenna and its measurement setup, while Figure 11 illustrates a block diagram of the setup. The measurement system consists of five main components: an Agilent Vector Network Analyzer (E8361A VNA), an Agilent Technologies N5260A-6003 mm wave extender module, an N5260A extender controller, an HP 11970W harmonic mixer, and a Keysight Performance Spectrum Analyzer (PSA) E4446A, Agilent Technologies, Inc., Santa Clara, CA, USA. Since the VNA has an upper-frequency limit of 20 GHz, 67–110 GHz extender modules are integrated with the VNA via the extender controller to enable measurements in the sub-THz frequency range.
In this setup, signals can be generated within the 67–110 GHz frequency range. The signal power is increased using a W-band standard gain horn antenna. The separation distance between the two antennas is set to 2 m, exceeding the far-field criterion of 0.773 m for 109 GHz. The received signal power is further enhanced by the antenna under test (AUT), TSWA, which is mounted on a rotating table, before being directed to the harmonic mixer. The harmonic mixer down-converts the amplified signal, operating in the 75–110 GHz range, into the spectrum analyzer’s frequency range of 3 Hz–44 GHz on the receiving side, enabling precise antenna gain calculations.
The measured reflection coefficient of the TSWA is given in Figure 12, being compared to the simulation results. The reflection coefficient graph indicates that the measurement and simulation results demonstrate a consistent trend. However, beyond 110 GHz, discrepancies arise due to measurement setup and room capacity limitations, leading to deviations between simulation and measurement data in the 110–140 GHz range. Due to the absorbing feature of the absorber in the anechoic chamber given in Figure 10, antenna pattern measurements can be realized up to the 110 GHz frequency. In this context, the gain patterns of the antenna are measured at frequencies of 79, 89, and 109 GHz. Before measuring the radiation pattern of the TSWA antenna, a reference measurement is performed using a standard gain horn antenna. Afterwards, the transmitter horn antenna is replaced with the TSWA during the measurement of its radiation pattern. Radiation patterns are obtained by rotating the antenna 180 degrees with an increment of 0.5 degrees. All data related to measurement are provided in Table 3.
The normalized E-plane gain patterns of the antenna at 79, 89, and 109 GHz, obtained from both simulations and measurements, are presented in Figure 13. A detailed comparison reveals excellent agreement in main lobe directions between the simulation and measurement results across all frequencies. Notably, the only discernible discrepancy is at 109 GHz, where the measured and simulated patterns exhibit a minor angular shift of 1 degree. The beam orientation varies with frequency: at 79 GHz, the beam is steered at 37° at 89 GHz, it aligns at 45° and at 109 GHz, it directs to 56°. The peak gain comparison between the simulation and measurement shows differences of 2.3 dB, 1.8 dB, and 0.7 dB at 79 GHz, 89 GHz, and 109 GHz, respectively. At 109 GHz, the measured power is at the noise level because it remains below the noise floor for angles less than θ = 30 ° and greater than θ = 70 ° . The measurement results are observed to be consistent with the simulation data, confirming the antenna’s performance characteristics over the analyzed frequency range.

5. Discussion on Power Handling

Compensating for the significant losses at terahertz frequencies necessitates the use of antennas with high-power handling capability. In this context, the power handling capacity of the TSWA is analyzed in detail. This section discusses the power handling capability (PHC) of the TSWA, encompassing both the peak-power handling capability (PPHC) and the average-power handling capability (APHC). Additionally, the effects of multipaction and corona discharge are analyzed separately.
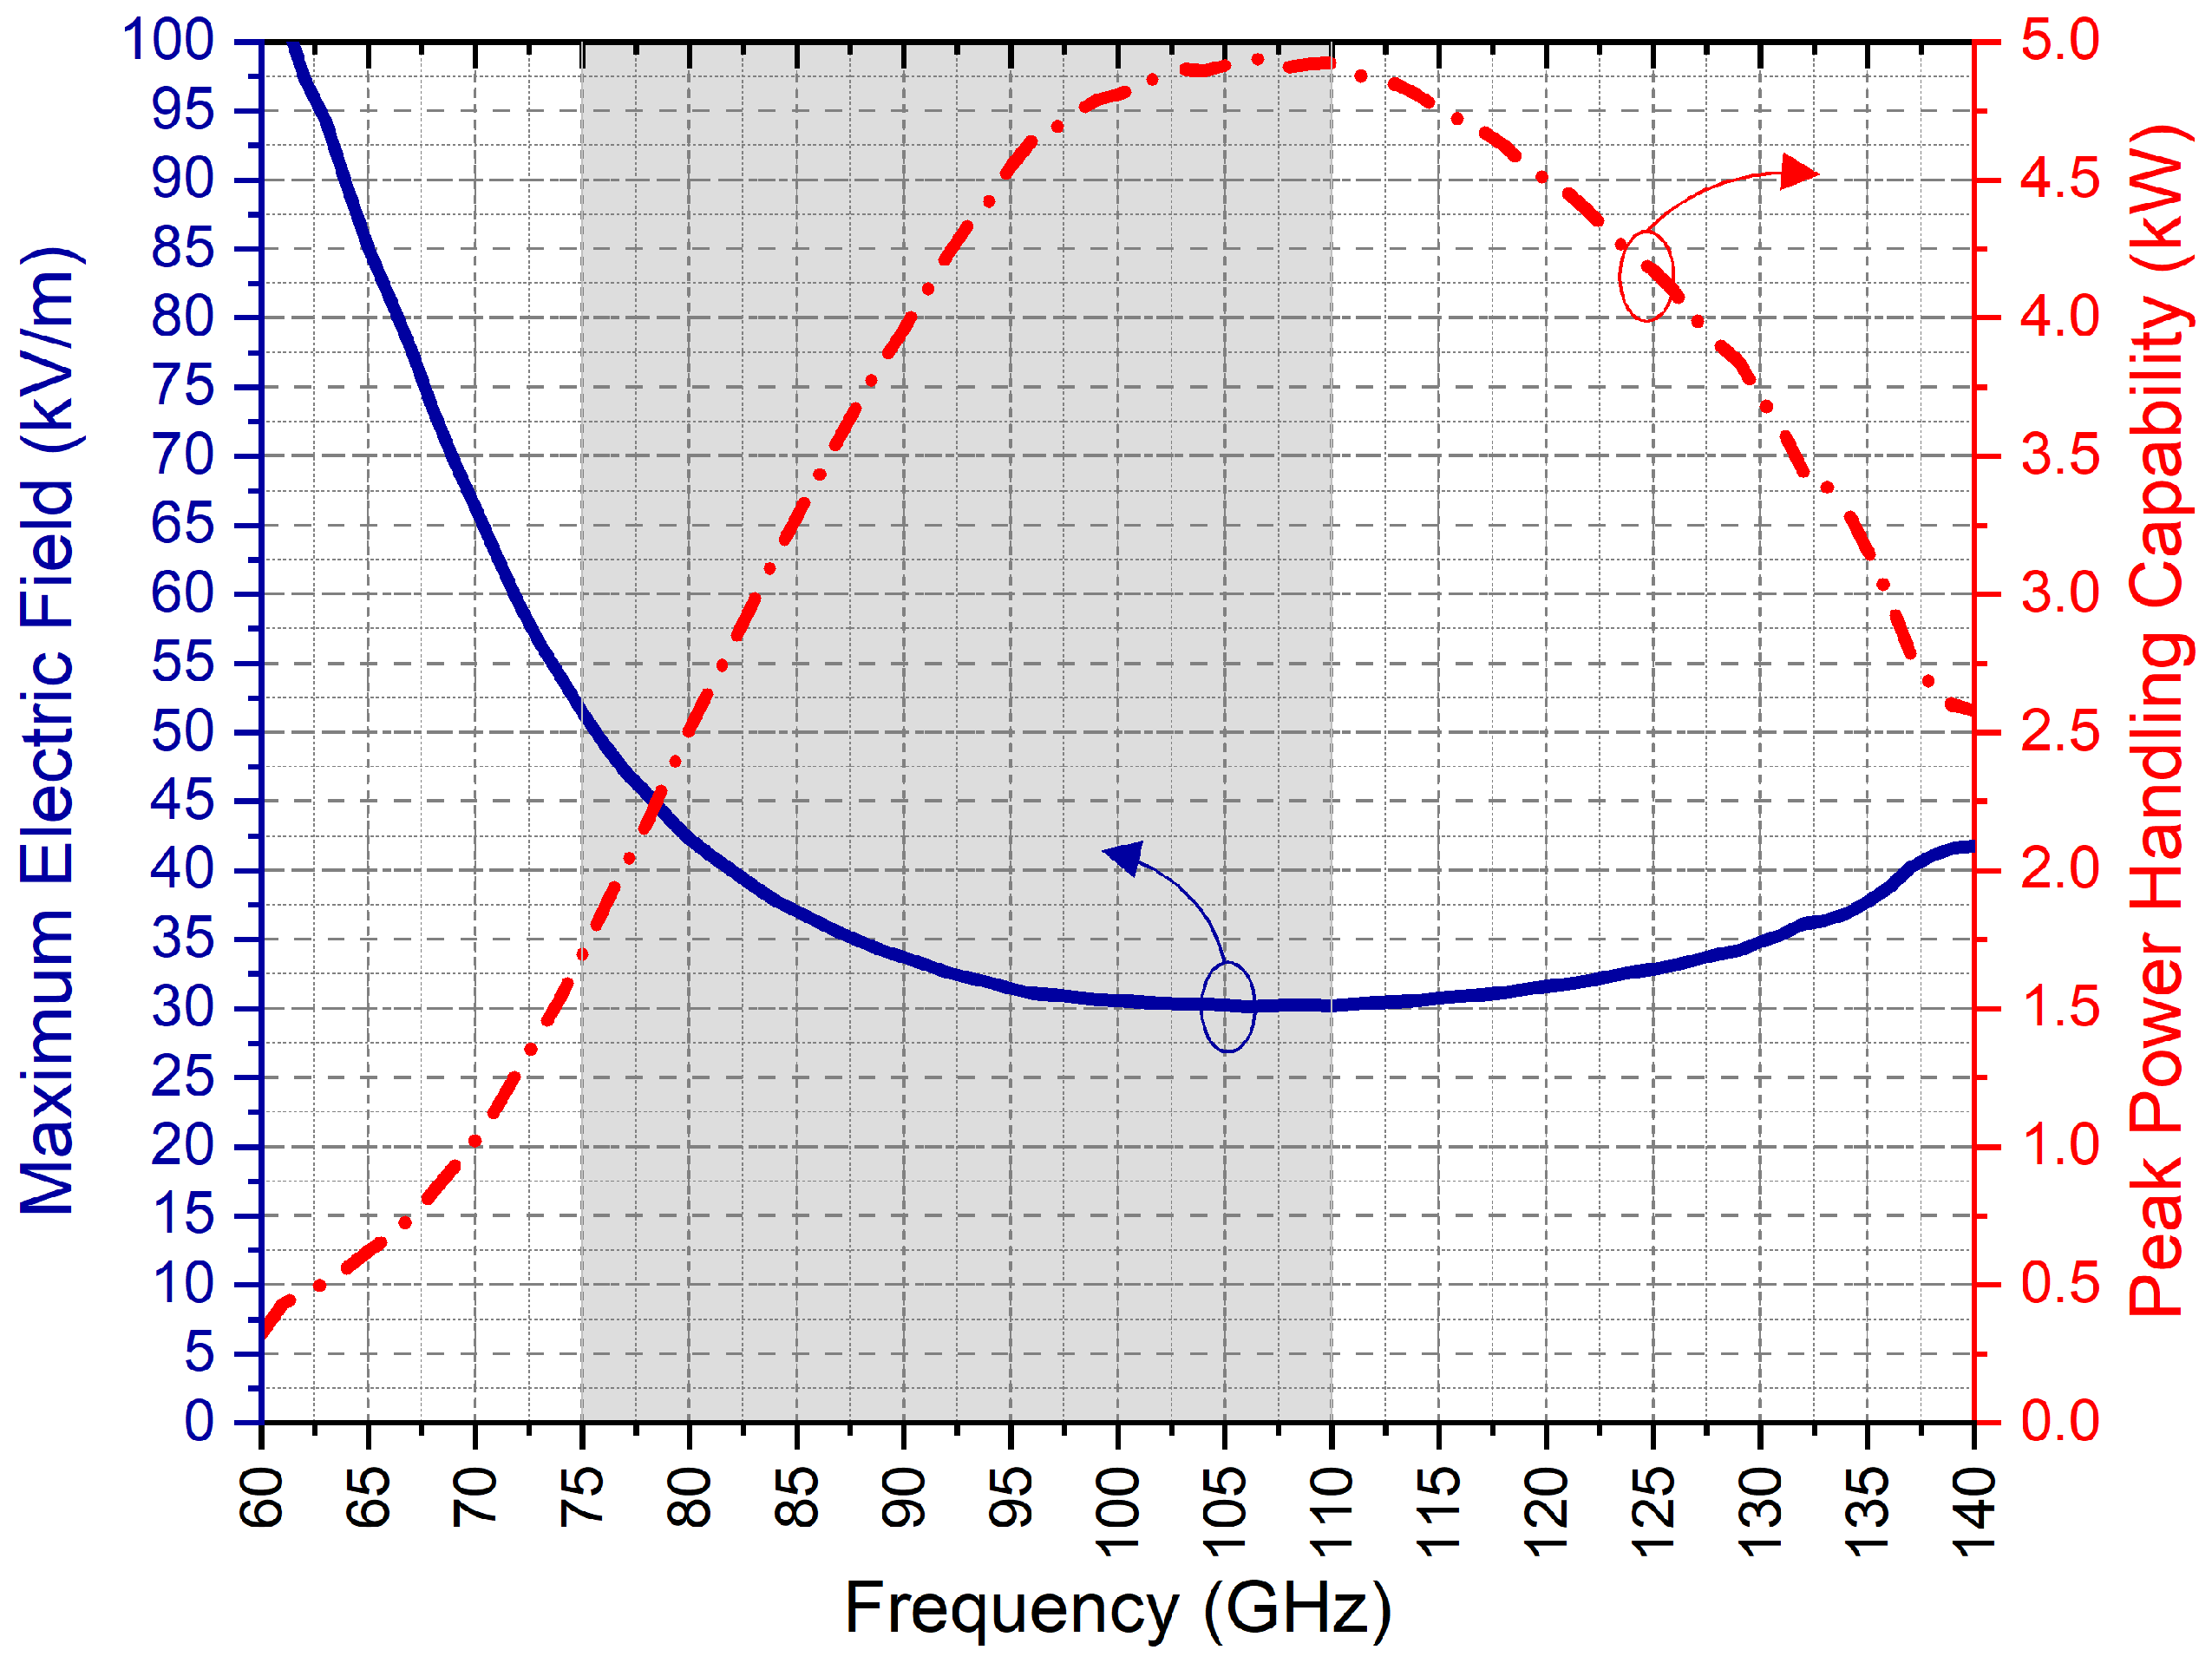
The TSWA’s PPHC is constrained by the electric field intensity threshold for air breakdown, which is 3 kV/mm. The peak PHC can be determined by employing the following equation, as the input power is set to a default value of 0.5 W [29]:
P PPHC = E br E max 2 · 0.5   W .
A simulation study was conducted by incorporating an E-field monitor in 1 GHz steps within the 60–140 GHz frequency range for a 0.5 W input power. The PPHC value was calculated using Equation (1), and Emax was determined as a consequence of the simulation. Figure 14 illustrates the variation in the PPHC value as a function of frequency within the 60–140 GHz range. PPHC is calculated to be 1.69 kW at 75 GHz and 4.92 kW at 110 GHz when the W-band frequency range is taken into account. However, focusing on the operating range of the antenna, the PPHC was determined to be 385.8 W at 60 GHz and 1.54 kW at 160 GHz.
The frequency of 75 GHz, identified as the point with the lowest PPHC within the W-band range, was selected as a reference for calculating the APHC. To estimate the APHC, the temperature distribution on the antenna was carefully analyzed as a function of variations in the antenna’s input power. These analyses were performed using EM-Thermal coupling within the CST simulation environment, employing the Thermal Steady-State Solver to carry out detailed thermal evaluations. For the simulations, the ambient temperature was fixed at 293 K, and a stability criterion was established, assuming the component could safely reach a maximum operating temperature of 71 °C without compromising system performance [30]. The results of this analysis demonstrated that the APHC at 75 GHz reached a value of approximately 17 W. Furthermore, considering the antenna’s operational frequency range of 60–160 GHz, it was deemed essential to evaluate the APHC at the lowest frequency in this range, namely 60 GHz. Under the same stability criterion of 71 °C, thermal analysis at 60 GHz revealed that the antenna’s APHC was approximately 3.4 W.
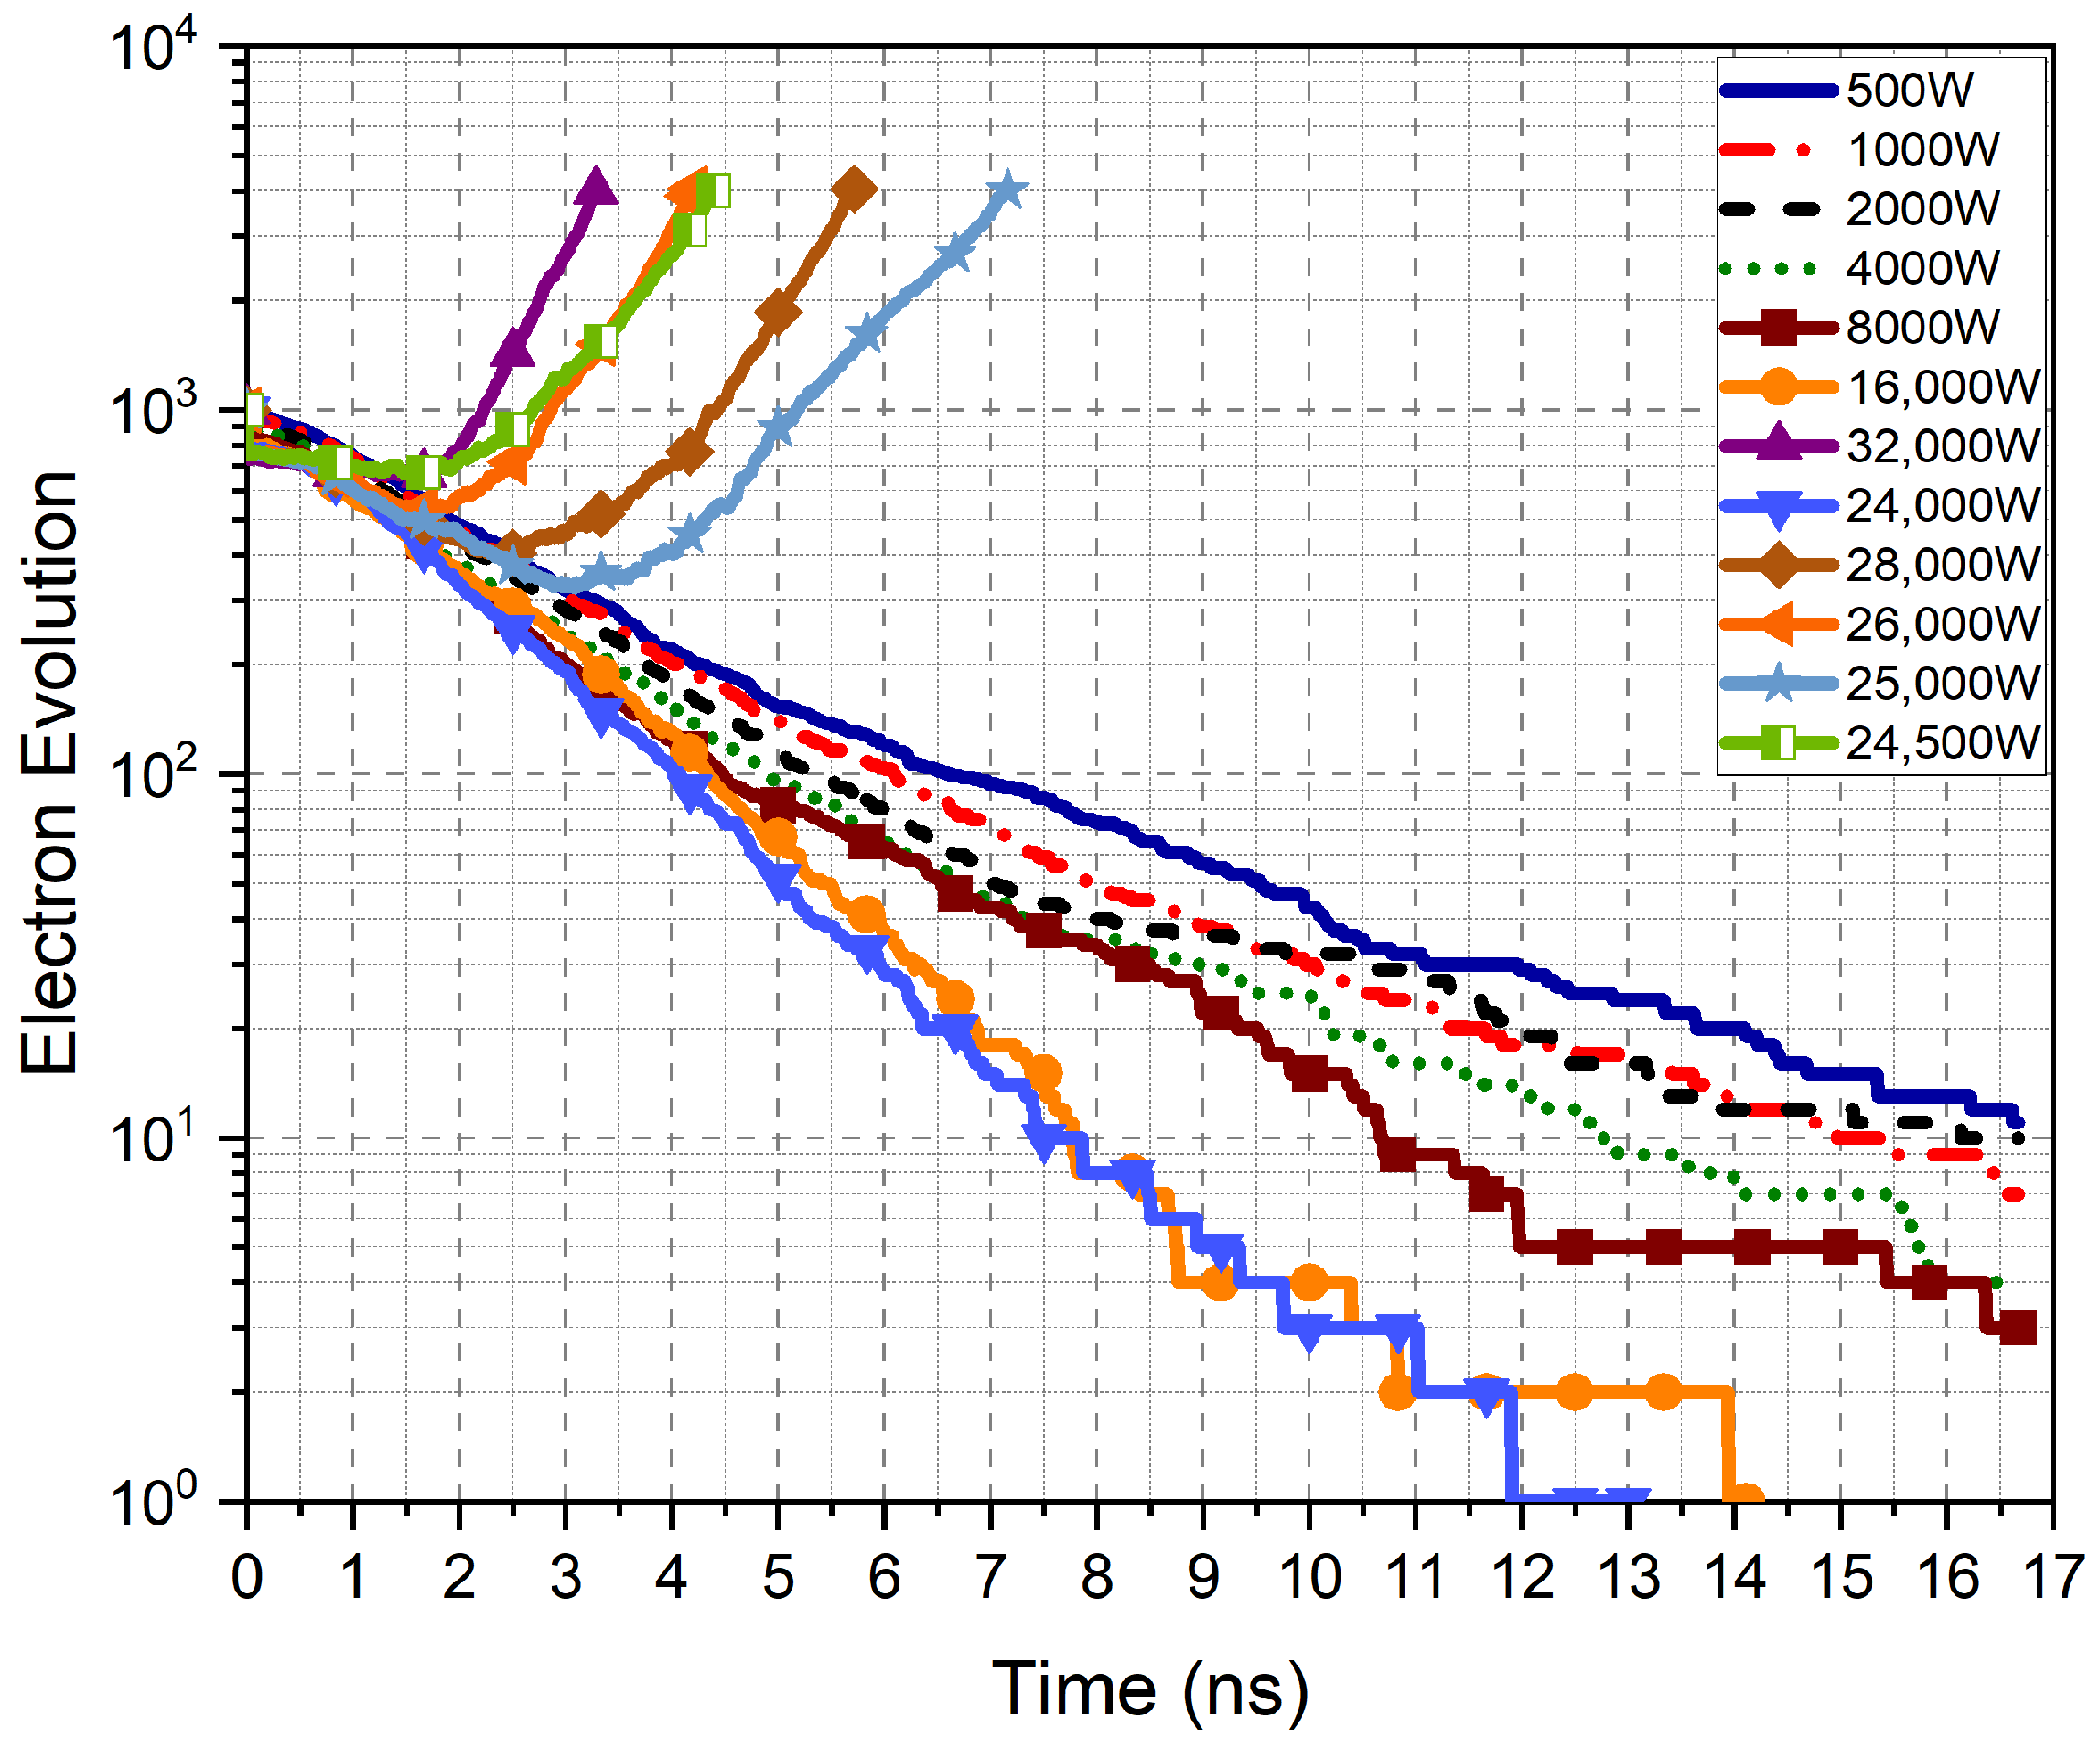
The high-power simulations were conducted using SPARK3D to analyze the multipaction and corona discharge in TSWA, with electromagnetic fields obtained from CST simulations. Multipaction analysis is conducted for the 60–160 GHz operating band of the antenna, focusing on 60 GHz and the W-band. Although the highest electric field density is observed near the antenna’s feeding section, the analysis encompasses the entire structure for a comprehensive evaluation. The antenna, constructed with a gold-plated copper design, is modeled using gold as the material in the simulations. The maximum secondary electron emission yield (SEY) of gold is set to 2, following the ECSS criteria [31]. The simulation parameters include an initial power of 500 W, a stopping power of 1 MW, and 1000 initial electrons.
The results show that the multipaction effect occurs at a power level of 110.9 kW at 75 GHz. On the other hand, no breakdown is observed at 110 GHz, demonstrating that the component can handle up to 1 MW without multipaction at this frequency. Figure 15 presents the time-dependent electron density at 60 GHz, illustrating the observed multipaction behavior. As shown in the graph, multipaction is observed at a power level of 24.3 kW at 60 GHz.
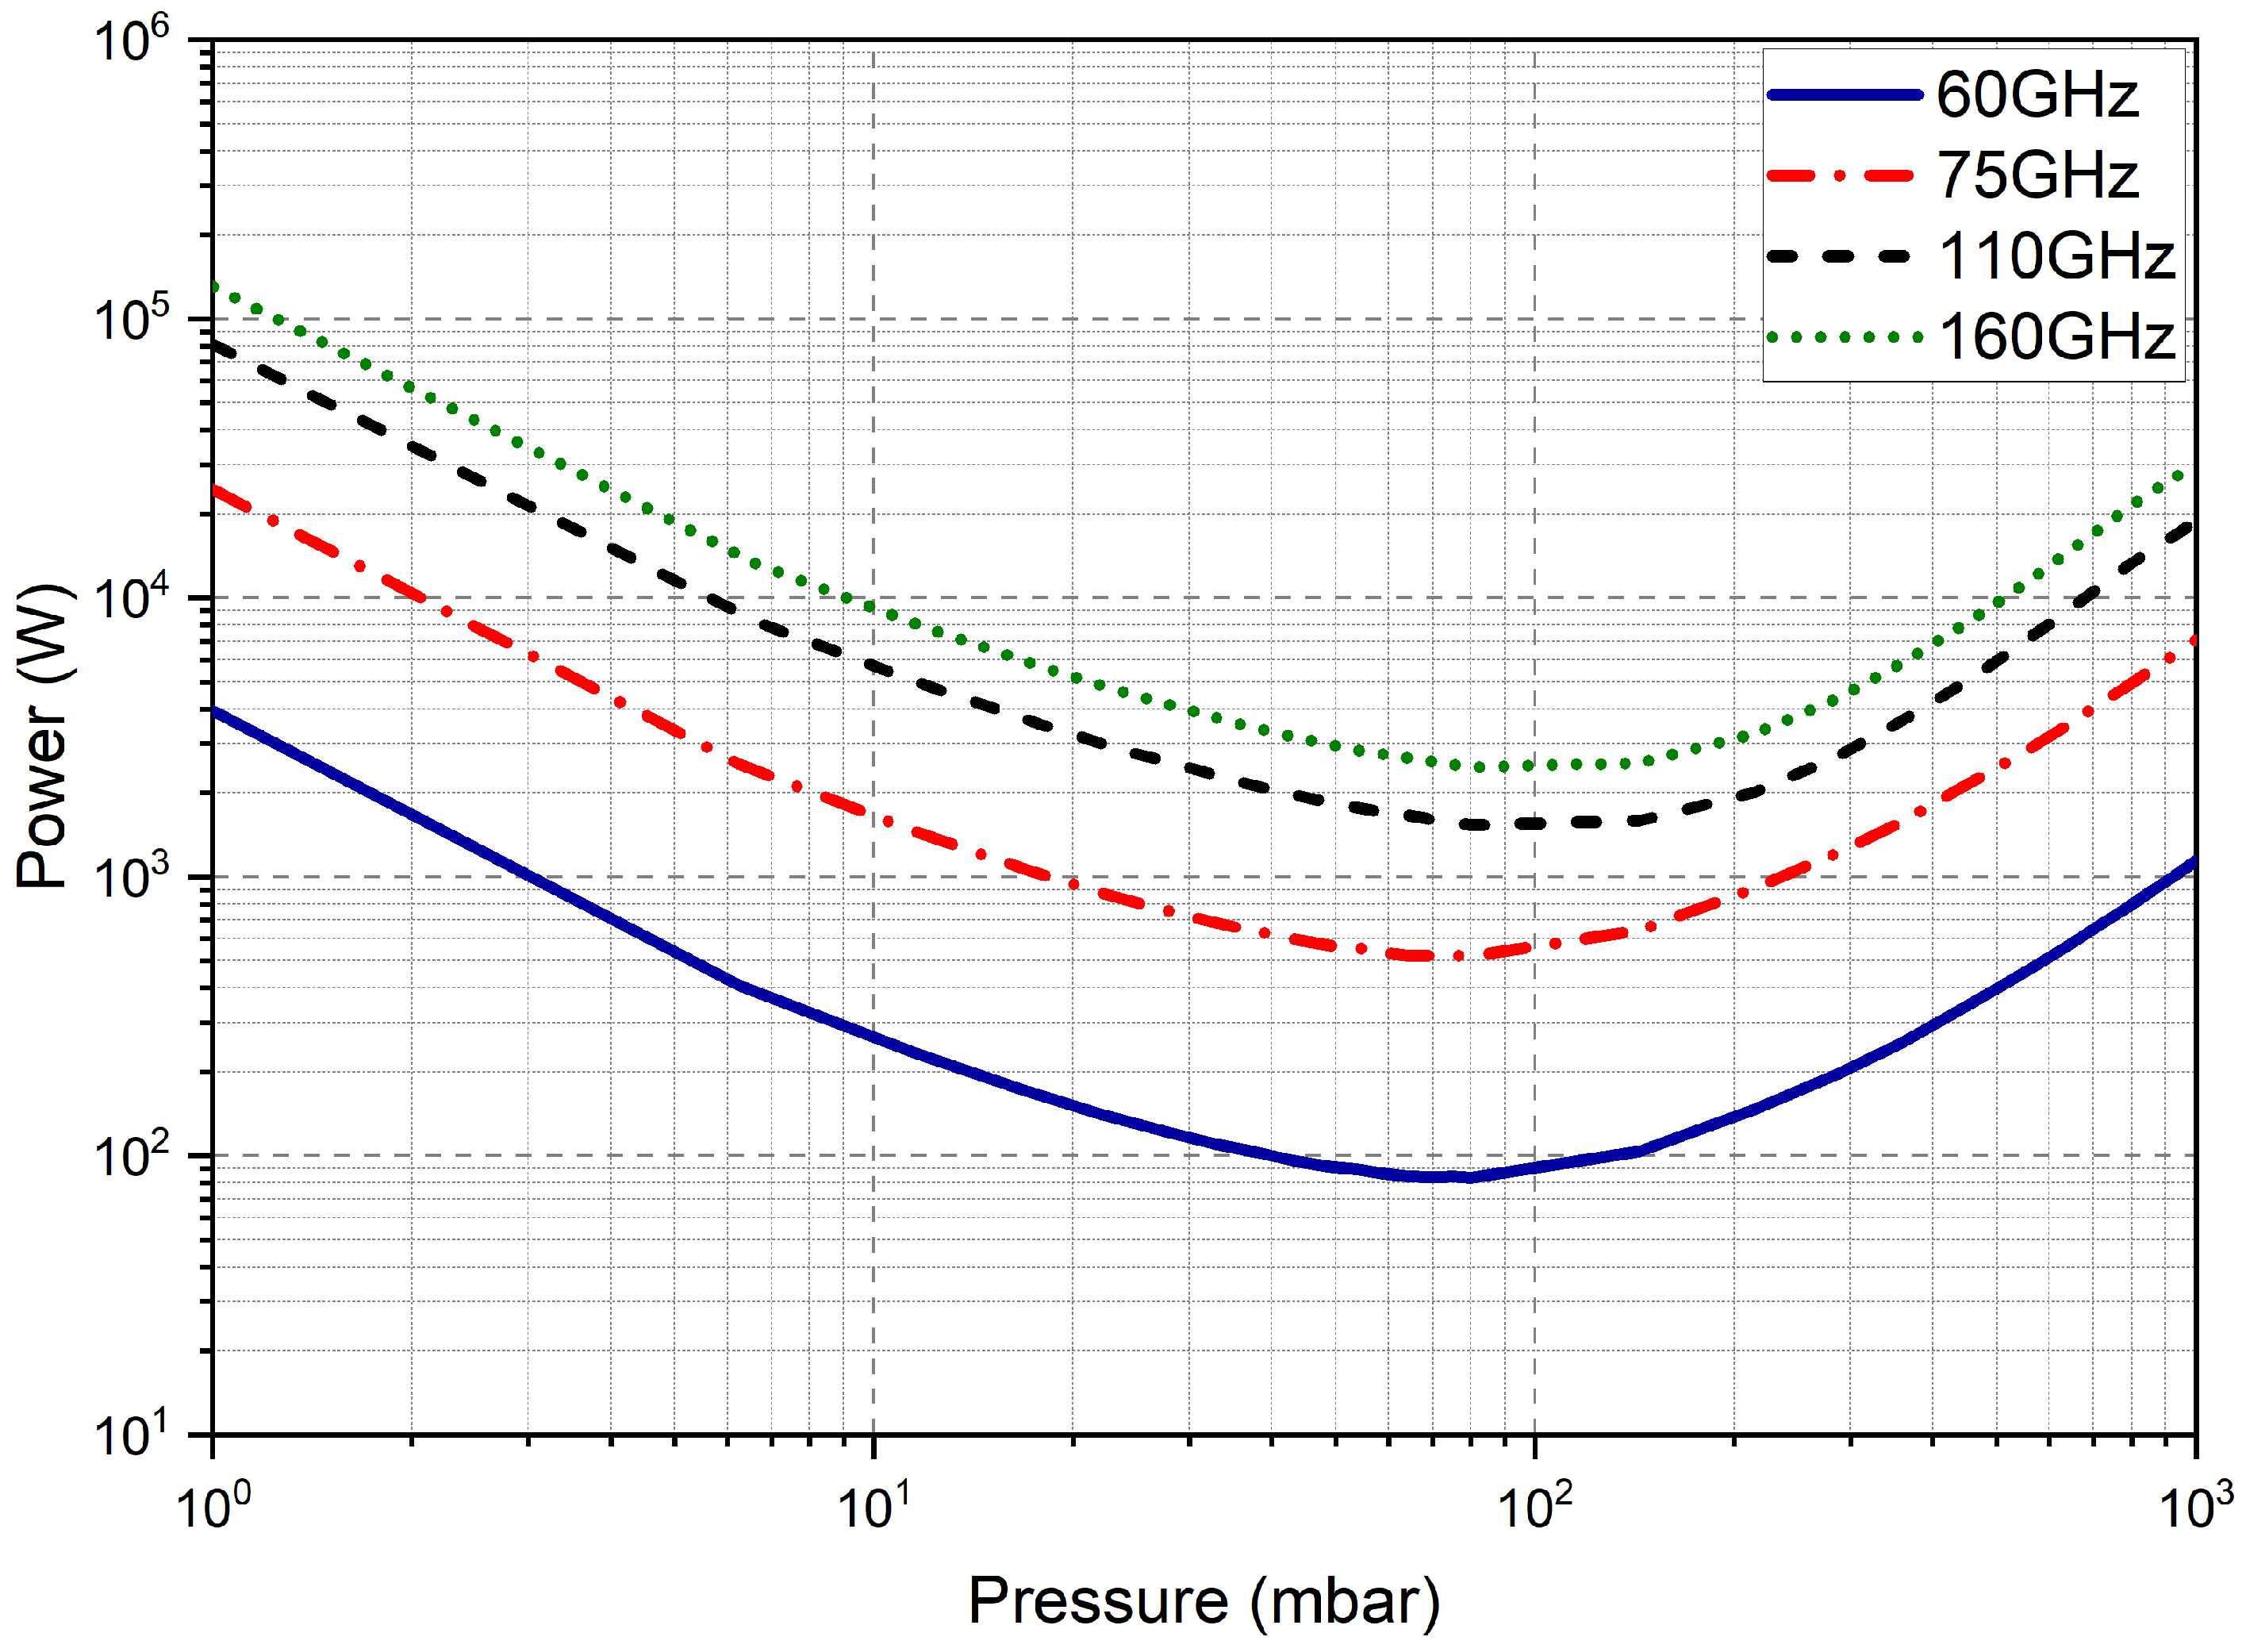
In addition to the multipaction analysis, this study focuses on the corona discharge phenomenon to further assess the power handling performance and operational limits of the TSWA. In this study, dry air was chosen as the gas type, ambient temperature was set as 293 K, the signal applied to the antenna was chosen as a continuous wave, and a precision of 0.1 dB was set to ensure accurate results.
Figure 16 illustrates the pressure (in mbar) and power thresholds (in W) derived from the simulations. Analyzing the Parchen curves depicted in the graph indicates that the power handling capacity of the TSWA increases with frequency. The structure is capable of withstanding up to 83.2 W of power at 80 mbar pressure within the 60–160 GHz frequency range due to the corona effect. However, when focusing on the W-band range, it is observed that the structure can endure a power level of up to 517.5 W. Consequently, the maximum power levels at which the system can operate without experiencing corona discharge were determined to be 83.2 W for the 60–160 GHz range and 517.5 W for the 75–110 GHz range.
An analysis of corona discharge, multipaction effects, and the PPHC and APHC values for the TSWA indicates that the primary factor limiting maximum power handling, apart from the APHC value associated with long-term nominal usage, is the corona discharge effect. Considering the pressure variations across atmospheric layers, the antenna exhibits its lowest power handling capability against corona discharge in the stratosphere. For spacecraft applications, when the antenna remains inactive until the spacecraft exits the atmosphere, the corona discharge effect does not occur, and there is no limitation in terms of the power handling capability due to the corona discharge effect. However, if the antenna is actively used from the time of launch, the power handling capability against corona discharge is limited to 83.2 W. This limitation is not significant, as high-power space payloads are typically activated only after the spacecraft reaches a vacuum environment. Nonetheless, if high-power operations are required during the transition phase between Earth and space, enclosing the TSWA within a pressurized radome ensures reliable functionality [32].

6. Conclusions

The TSWA with a simulated peak gain of 17 dBi and total efficiency exceeding 90% is presented within the 60–160 GHz frequency band. Additionally, the proposed antenna features pattern-reconfigurable characteristics, enabling main lobe beam steering between 5 and 68 degrees while maintaining low side lobe levels. The experimental validation of the TSWA component was performed by measuring the fabricated antenna, which was constructed with a gold-plated copper design. Simulations were also carried out to evaluate the power handling capability of the TSWA, encompassing both the PPHC and the APHC. The results confirm that the TSWA can handle 17 W of APHC within the W-band and 3.4 W across the 60–160 GHz frequency range. Beyond APHC and PPHC analyses, the effects of corona discharge and multipaction were also examined. These factors are critical for determining the suitability of the antenna for space applications, 6G communication systems, and other specific operational environments. Given the significant atmospheric losses in sub-THz and terahertz frequency ranges, achieving high antenna gain remains essential. The antenna’s ability to withstand high power levels is rigorously analyzed to ensure reliable performance in high-power applications.

Author Contributions

Conceptualization, H.O. and N.T.T.; methodology, H.O., N.T.T. and S.A.; software, H.O.; validation, H.O., N.T.T. and S.A.; formal analysis, H.O.; investigation, H.O., N.T.T. and S.A.; resources, H.O., N.T.T. and S.A.; data curation, H.O.; writing—original draft preparation, H.O.; writing—review and editing, H.O., N.T.T. and S.A.; visualization, H.O. and N.T.T.; supervision, S.A. and N.T.T.; project administration, N.T.T.; funding acquisition, N.T.T. All authors have read and agreed to the published version of the manuscript.

Funding

This work was supported by the Yildiz Technical University Scientific Research Projects Coordination Unit under project number FBA-2023-6034.

Institutional Review Board Statement

Not applicable.

Informed Consent Statement

Not applicable.

Data Availability Statement

The original data presented in this study are included in the article. Further inquiries can be directed to the corresponding author.

Acknowledgments

The authors would like to thank the staff of TÜBİTAK MİLTAL for their help during the antenna measurements.

Conflicts of Interest

Author Sinan Aksimsek was employed by the company ASELSAN Inc. The remaining authors declare that the research was conducted in the absence of any commercial or financial relationships that could be construed as a potential conflict of interest.

References

  1. Saad, W.; Bennis, M.; Chen, M. A Vision of 6G Wireless Systems: Applications, Trends, Technologies, and Open Research Problems. arXiv 2019, arXiv:1902.10265. [Google Scholar]
  2. Ozpinar, H.; Aksimsek, S.; Tokan, N.T. A Novel Compact, Broadband, High Gain Millimeter-Wave Antenna for 5G Beam Steering Applications. IEEE Trans. Veh. Technol. 2020, 9545, 2389–2397. [Google Scholar] [CrossRef]
  3. Akyildiz, I.F.; Jornet, J.M.; Han, C. Terahertz band: Next frontier for wireless communications. Phys. Commun. 2014, 12, 16–32. [Google Scholar] [CrossRef]
  4. Siegel, P. Terahertz technology. IEEE Trans. Microw. Theory Tech. 2002, 50, 910–928. [Google Scholar] [CrossRef]
  5. Ozpinar, H.; Aksimsek, S. Fractal interwoven resonator based penta-band metamaterial absorbers for THz sensing and imaging. Sci. Rep. 2022, 12, 19758. [Google Scholar] [CrossRef]
  6. Zhang, Z.; Zhou, H.; Yang, L.; Xiao, Y.; Chen, X.; Ma, Y.; Li, R. Terahertz perfect absorber of narrowband and broadband based on a U-shaped metal patch. Appl. Opt. 2024, 63, 9110–9117. [Google Scholar] [CrossRef]
  7. Zhou, M.M.; Cheng, Y.J. D-band high-gain circular-polarized plate array antenna. IEEE Trans. Antennas Propag. 2018, 66, 1280–1287. [Google Scholar] [CrossRef]
  8. Gearhart, S.; Ling, C.; Rebeiz, G. Integrated millimeter-wave corner-cube antennas. IEEE Trans. Antennas Propag. 1991, 39, 1000–1006. [Google Scholar] [CrossRef]
  9. Gearhart, S.; Ling, C.; Rebeiz, G.; Davee, H.; Chin, G. Integrated 119- mu m linear corner-cube array. IEEE Microw. Guid. Wave Lett. 1991, 1, 155–157. [Google Scholar] [CrossRef]
  10. Markish, O.; Leviatan, Y. Analysis and Optimization of Terahertz Bolometer Antennas. IEEE Trans. Antennas Propag. 2016, 64, 3302–3309. [Google Scholar] [CrossRef]
  11. Rebeiz, G.M. Millimeter-Wave and Terahertz Integrated Circuit Antennas. Proc. IEEE 1992, 80, 1748–1770. [Google Scholar] [CrossRef]
  12. Bray, J.; Roy, L. Physical optics simulation of electrically small substrate lens antennas. In Proceedings of the IEEE Canadian Conference on Electrical and Computer Engineering (Cat. No.98TH8341), Waterloo, ON, Canada, 25–28 May 1998; Volume 2, pp. 814–817. [Google Scholar] [CrossRef]
  13. Mahmoud, S.F.; AlAjmi, A.R. Characteristics of a new carbon nanotube antenna structure with enhanced radiation in the sub-terahertz range. IEEE Trans. Nanotechnol. 2012, 11, 640–646. [Google Scholar] [CrossRef]
  14. Fuscaldo, W.; Burghignoli, P.; Baccarelli, P.; Galli, A. Graphene fabry-perot cavity leaky-wave antennas: Plasmonic versus nonplasmonic solutions. IEEE Trans. Antennas Propag. 2017, 65, 1651–1660. [Google Scholar] [CrossRef]
  15. Han, C.; Akyildiz, I.F. Three-Dimensional End-to-End Modeling and Analysis for Graphene-Enabled Terahertz Band Communications. IEEE Trans. Veh. Technol. 2017, 66, 5626–5634. [Google Scholar] [CrossRef]
  16. Oliveri, G.; Werner, D.H.; Massa, A. Reconfigurable electromagnetics through metamaterials—A review. Proc. IEEE 2015, 103, 1034–1056. [Google Scholar] [CrossRef]
  17. Hwu, S.U.; deSilva, K.B.; Jih, C.T. Terahertz (THz) wireless systems for space applications. In Proceedings of the 2013 IEEE Sensors Applications Symposium Proceedings, Galveston, TX, USA, 19–21 February 2013; pp. 171–175. [Google Scholar] [CrossRef]
  18. Han, H.; Yuan, J.; Tong, J. Design of THz Space Application System. J. Comput. Commun. 2015, 03, 61–65. [Google Scholar] [CrossRef]
  19. Tamagnone, M.; Diaz, J.S.G.; Mosig, J.; Perruisseau-Carrier, J. Hybrid graphene-metal reconfigurable terahertz antenna. In Proceedings of the 2013 IEEE MTT-S International Microwave Symposium Digest (MTT), Seattle, WA, USA, 2–7 June 2013; pp. 1–3. [Google Scholar] [CrossRef]
  20. Xu, Z.; Dong, X.; Bornemann, J. Design of a Reconfigurable MIMO System for THz Communications Based on Graphene Antennas. IEEE Trans. Terahertz Sci. Technol. 2014, 4, 609–617. [Google Scholar] [CrossRef]
  21. Wang, X.C.; Zhao, W.S.; Hu, J.; Yin, W.Y. Reconfigurable Terahertz Leaky-Wave Antenna Using Graphene-Based High-Impedance Surface. IEEE Trans. Nanotechnol. 2015, 14, 62–69. [Google Scholar] [CrossRef]
  22. Sharawi, M.S.; Zai, D.; Alibakhshikenari, M.; See, C.H.; Abd-Alhameed, R.A.; Falcone, F.; Althuwayb, A.A. Design of Modern Leaky-Wave Antennas Using Artificial Intelligence Techniques. IEEE Access 2021, 9, 90874–90890. [Google Scholar] [CrossRef]
  23. Tawk, Y.; Christodoulou, C.G. A New Reconfigurable Leaky Wave Antenna Design. Proc. IEEE 2012, 100, 2250–2257. [Google Scholar] [CrossRef]
  24. Jackson, D.R.; Caloz, C.; Itoh, T. Leaky-Wave Antennas. Proc. IEEE 2015, 103, 452–476. [Google Scholar] [CrossRef]
  25. CST Microwave Studio. Darmstadt, Germany. Available online: http://www.cst.com (accessed on 1 February 2025).
  26. Yue, J.; Zhou, C.; Xiao, K.; Ding, L.; Chai, S. W-Band Low-Sidelobe Series-Fed Slot Array Antenna Based on Groove Gap Waveguide. IEEE Antennas Wirel. Propag. Lett. 2023, 22, 908–912. [Google Scholar] [CrossRef]
  27. Javanbakht, N.; Majedi, M.S.; Attari, A.R. Thinned Array Inspired Quasi-Uniform Leaky-Wave Antenna with Low Side-Lobe Level. IEEE Antennas Wirel. Propag. Lett. 2017, 16, 2992–2995. [Google Scholar] [CrossRef]
  28. Imbriale, W.A.; Gao, S.S.; Boccia, L. (Eds.) Space Antenna Handbook; John Wiley & Sons: Hoboken, NJ, USA, 2012. [Google Scholar] [CrossRef]
  29. Guo, C.; Li, J.; Yu, Y.; Zhang, F.; Zhu, Y.; Yang, Q.; Zhu, W.; Zhu, S.; Shang, X.; Gao, Y.; et al. A 3-D Printed E-Plane Waveguide Magic-T Using Air-Filled Coax-to-Waveguide Transitions. IEEE Trans. Microw. Theory Tech. 2019, 67, 4984–4994. [Google Scholar] [CrossRef]
  30. He, Y.J.; Mo, D.Y.; Wu, Q.S.; Chu, Q.X. A Ka-Band Waveguide Magic-T with Coplanar Arms Using Ridge-Waveguide Transition. IEEE Microw. Wirel. Components Lett. 2017, 27, 965–967. [Google Scholar] [CrossRef]
  31. ESA Requirements and Standards Division. ECSS-E-20-01A Rev.1—Multipaction Design and Test; ECSS Secretariat, ESA-ESTEC: Noordwijk, The Netherlands, 1 March 2013; Available online: https://ecss.nl/standard/ecss-e-20-01a-rev-1-mulitipaction-design-and-test-1-march-2013/ (accessed on 10 February 2025).
  32. Melgarejo, J.C.; Ossorio, J.; Cogollos, S.; Guglielmi, M.; San-Blas, A.A.; Valencia-Sullca, J.F.; Vidal, A.; Tronser, T.; Boria, V.E. A New Family of Reconfigurable Waveguide Filters and Diplexers for High-Power Applications. IEEE Access 2023, 11, 25102–25119. [Google Scholar] [CrossRef]
Figure 1. Unit element of the proposed antenna: (a) perspective view; (b) side view; (c) top view.
Aerospace 12 00493 g001
Figure 2. The dispersion analysis results. The phase and frequency variation of the free space is given by a blue solid line, whereas that of the transverse slotted unit cell is given by the red dashed/dotted line.
Aerospace 12 00493 g002
Figure 3. Representations of the reconfigurable TSWA with parametric dimensions: (a) top view (2D); (b) side view with a sectional cut (2D); and (c) 3D perspective view. The shaded region in (a) indicates the standard UG-387/UM circular flange.
Aerospace 12 00493 g003
Figure 4. Simulated reflection coefficient variation with respect to frequency. (The shaded background area indicates the region where the reflection coefficient remains below −10 dB).
Aerospace 12 00493 g004
Figure 5. Simulated three-dimensional far-field radiation patterns of the TSWA at (a) 79 GHz, (b) 89 GHz, and (c) 109 GHz. The results illustrate the frequency-dependent beam characteristics, including realized gain variation, main lobe direction, and side lobe levels.
Aerospace 12 00493 g005
Figure 6. The simulated realized gain, total efficiency, and main lobe direction results as a function of frequency. (The right vertical axis includes two separate scales: total efficiency, shown with red circular markers, and main lobe direction, represented by black triangular markers. The left vertical axis indicates the realized gain, which is represented by blue square markers).
Aerospace 12 00493 g006
Figure 7. Beam steering capability of TSWA. Normalized co-polarized radiation patterns of the TSWA in the ϕ = 90 ° plane. The TSWA steers the beam from θ = 5 ° to 68 ° in the 59–139 GHz frequency range.
Aerospace 12 00493 g007
Figure 8. Side lobe levels of the simulated TSWA radiation pattern in the ϕ = 0 ° and ϕ = 90 ° planes. (The shaded region represents side lobe levels above −10 dB).
Aerospace 12 00493 g008
Figure 9. Manufactured TSWA, shown from various perspectives.
Aerospace 12 00493 g009
Figure 10. Measurement setup of the TSWA for experimental verification.
Aerospace 12 00493 g010
Figure 11. Block diagram of the antenna measurement setup.
Aerospace 12 00493 g011
Figure 12. Measured reflection coefficient as the function of frequency of the TSWA. Impedance matching is achieved between 60 and 160 GHz.
Aerospace 12 00493 g012
Figure 13. Measured and simulated E−plane normalized gain patterns at 79, 89, and 109 GHz in the ϕ = 90 ° plane.
Aerospace 12 00493 g013
Figure 14. TSWA peak-power handling capability and maximum electric field. The solid blue line represents the maximum electric field (in kV/m), while the dashed red line indicates the peak-power handling capability (in kW). (The blue and red arrows indicate the corresponding vertical axes for each curve. The shaded background region highlights the operating frequency range of interest for the TSWA).
Aerospace 12 00493 g014
Figure 15. Multipactor simulation with discharges for TSWA at 60 GHz.
Aerospace 12 00493 g015
Figure 16. Simulated corona discharge thresholds for the TSWA at 60 GHz, 75 GHz, 110 GHz, and 160 GHz.
Aerospace 12 00493 g016
Table 1. The parameters of the transverse slotted unit cell.
ParameterValue (mm)
L s 0.4
L u 0.9
T w 0.5
W a 2.54
W b 1.27
W s 2.54
Table 2. Parameters of the proposed antenna.
ParameterValue (mm)
D f 1
D s 0.5
L s 0.4
L w 32.6
R h 2.26
T s 2.27
W f 19.05
W s 2.54
W w 3.54
Table 3. Antenna measurement parameters.
Frequency (GHz)7989109
Transmit Power (dBm)−2.75−2.492.90
Conversion Loss (dB)40.54043
Receiver Power by Reference Horn Antenna (dBm)−75−78−89.5
Reference Horn Max. Antenna Gain (dBi)23.923.5523.7
Receiver Power by TSWA Antenna (dBm)−82−84−96
TSWA Max. Antenna Gain (dBi)16.917.517.2
Noise Level (dBm)−104−104−104
Disclaimer/Publisher’s Note: The statements, opinions and data contained in all publications are solely those of the individual author(s) and contributor(s) and not of MDPI and/or the editor(s). MDPI and/or the editor(s) disclaim responsibility for any injury to people or property resulting from any ideas, methods, instructions or products referred to in the content.